Article

Aging Behavior of 10CrNi2Mo3Cu2V Maraging Alloy: Clustering, Precipitation, and Strengthening

1
Special Steel Research Institute, Central Iron and Steel Research Institute, Beijing 100081, China
2
School of Materials Science and Engineering, Inner Mongolia University of Science and Technology, Baotou 014010, China
*
Authors to whom correspondence should be addressed.
These authors contributed equally to this work.
Metals 2025, 15(4), 389; https://doi.org/10.3390/met15040389
Submission received: 5 March 2025 / Revised: 26 March 2025 / Accepted: 27 March 2025 / Published: 30 March 2025
(This article belongs to the Special Issue Advances in Metal Materials: Structure, Properties and Heat Treatment)

Abstract

The high-temperature performance of 10CrNi2Mo3Cu2V steel is critically governed by the distribution of Cu-rich phases. This study systematically investigated the evolution of solute redistribution, Cu-rich phase precipitation, microstructural transformations, and mechanical properties in 10CrNi2Mo3Cu2V alloy under varying aging temperatures. Advanced characterization techniques, including atom probe tomography (APT) and transmission electron microscopy (TEM), were employed to analyze microstructural features and phase formation in both as-built and heat-treated specimens. The key findings reveal that copper atom segregation initiates at a tempering temperature of 350 °C. Upon increasing the temperature to 450 °C, extensive precipitation of nanoscale copper clusters is observed. Temperatures exceeding 450 °C trigger the formation of ε-Cu phases, which undergo subsequent coarsening. Notably, these copper clusters and Cu-rich precipitates act as dislocation pinning sites, promoting crack nucleation and propagation, thereby markedly degrading the alloy’s impact energy absorption capacity. The critical diameter for Orowan mechanism-governed strengthening by Cu-rich phases is determined to be ~6 nm, while the average diameter of matrix-penetrating Cu-rich particles is approximately 1.46 nm. Quantitative analysis demonstrated that the combined contributions of the Orowan bypass mechanism and particle-cutting mechanism yield a strength enhancement of ~219 MPa, which exhibits excellent agreement with experimentally measured strength increments. These results provide critical insights into the interplay between microstructural evolution and mechanical degradation in precipitation-strengthened steels under thermal exposure.

1. Introduction

The escalating power requirements in next-generation engines drive continuous increases in thrust-to-weight ratios and operational temperatures, prompting evolution in aviation gear steels. These alloys, including AISI9310, AMS6308, M50NiL, CSS42L, and Ferrium C series, have transitioned from singular strength/hardness optimization to integrated ultra-high hardness with thermal/corrosion resistance [1,2,3]. AISI9310 steel achieves strengthening through martensitic transformation and carbide precipitation, but its ambient-temperature limitation stems from rapid ε-carbide coarsening at elevated temperatures that diminishes strengthening efficacy [4]. M50NiL demonstrates superior thermal stability through elevated Cr/Mo concentrations (with 1.5% V addition), developing nanoscale Fe2Mo and Mo2C precipitates during tempering. These coherent phases induce secondary hardening via substantial lattice strain effects, significantly enhancing tempering resistance [5]. Comparative studies reveal distinct precipitation mechanisms: CSS-42L steel derives strength from M6C carbides and nano-dispersed M2C phases, while its retained austenite content synergistically improves fracture toughness [6,7].
10CrNi2Mo3Cu2V steel represents a high-performance, heat-resistant aviation gear steel. Its resistance to tempering softening has been notably enhanced compared to the initial generation gear steel, AISI 9310, through the augmentation of the molybdenum content, the incorporation of the precipitation-strengthening element copper, and the addition of the potent carbide-forming element vanadium. Consequently, the operational temperature of 10CrNi2Mo3Cu2V exceeds that of 9310 by a substantial 100 °C [8].
Extensive research has confirmed the sequence of Cu segregation in steel, which follows the following pattern: G.P. zone → BCC structure grain → 9R structure grain → FCC structure grain (ε-Cu). It is widely accepted that the precipitation of the ε-Cu phase contributes to the strengthening of the material [9]. Goodman et al. [10] suggested that the precipitate responsible for strengthening at the aging peak is one with 50 at% copper content, which exhibits a significantly greater precipitation-strengthening effect compared to the ε-Cu phase. Maruyama et al. [8] found that the primary strengthening phase during the precipitation process is not ε-Cu, but rather the Cu-rich segregation zone with a body-centered cubic (bcc) structure that is incompatible with the Fe matrix [11]. Mao et al. proposed that during the precipitation process of the Fe-Cu binary alloy, not only are there bcc structure segregation zones and FCC structure ε-Cu phases, but also 9R pure copper phases and intermediate B2 structures [12]. As aging time increases, the B2 structure precipitate phase gradually transitions from a spherical to an ellipsoidal shape and remains stable over an extended aging period [13].
Characterizing the precipitation behavior of the copper-rich phase is challenging due to its extremely fine size as a nano-precipitating phase. The existing literature does not clearly describe the strengthening mechanism under various aging conditions. To further study the evolution of copper strengthening in 10CrNi2Mo3Cu2V steel during the aging process, this article systematically investigates the precipitation behavior of the Cu-rich phase in 10CrNi2Mo3Cu2V steel, from nucleation to growth and coarsening, throughout the entire process using 3D atom probe technology and high-resolution transmission electron microscopy. It also discusses in detail the mechanism of secondary strengthening caused by the Cu-rich phase and carbides in the steel, employing empirical strengthening equations.

2. Experimental Procedure

The test steel was produced using Vacuum Induction Melting (VIM) (Consarc Corporation, Rancocas, NJ, USA) and Vacuum Arc Remelting (VAR) techniques (Consarc Corporation, Rancocas, NJ, USA). The ingot was then forged into a bar with a diameter of Φ180 mm after being maintained at 1180 °C for 20–30 h, within a forging temperature range of 1150–900 °C. The samples were quenched at 915 °C (using oil cooling) and subsequently underwent cold treatment at (−73 °C), followed by tempering at temperatures of 205, 350, 450, 550, and 600 °C. The composition is showed in Table 1.
The transmission electron microscopy (TEM) analysis was conducted using the TECNAI G20 transmission electron microscope (FEI, Hillsboro, OR, USA). A 0.3 mm thick film sample was extracted from the impact fracture specimen, ground into a 0.05 mm thin slice sample, and subjected to double spraying through electrolysis with a 6% (volume fraction) perchloric acid alcohol solution. Atom probe tomography (APT) was employed to observe the segregation and nucleation of the Cu-rich phase during the early stages of dissolution and precipitation in steel, which was performed on the CAMECA LEAP 4000X HR instrument (AMETEK, Berwyn, IL, USA). The samples were prepared using a two-step electrolysis method. The 0.5 × 0.5 × 15 mm sample underwent electrolytic polishing in a coarse polishing solution consisting of 25% HClO4 + 75% CH3COOH (volume fraction), followed by fine polishing of the coarsely polished needle-shaped sample in an electrolyte containing 2% HClO4 + 98% C8H18O3 under an optical microscope. Finally, a tip sample with a curvature radius less than 100 nm was obtained. The 3DAP results are mechanical single measurements; the average values of three samples were used for the mechanical properties testing (AMETEK, Berwyn, IL, USA).

3. Results and Discussion

3.1. Precipitation Behavior of Rich Cu Phase

Following quenching at 915 °C and subsequent cold treatment at (−73 °C), the experimental steel undergoes tempering at temperatures of 205, 350, 450, 550, and 600 °C. The phase composition of steel following quenching and cold working processes consists of a martensitic matrix, M6C carbides, and a copper-rich phase. The M6C phase precipitates significantly only at 700 °C. Typically, we control the quantity and distribution of the M6C phase by adjusting the annealing process prior to quenching. During the subsequent quenching and tempering stages, the M6C phase remains stable.
The morphology observed via TEM subsequent to tempering is depicted in Figure 1. Post tempering at 205 °C, a high density of dislocations and M6C phase with an approximate grain size of 100 nm are observed in the martensitic laths, with no additional precipitated phases detected. Upon tempering at 350 °C, no distinct secondary phases are observed within the laths. However, tempering at 450 °C reveals a small amount of nanoscale precipitated phases, with sizes ranging from 6 to 12 nm. X-ray energy dispersive spectroscopy indicates that these phases contain roughly 21% Cu, identifying them as nano-Cu-rich phases precipitated within the steel. At 550 °C, a substantial number of Cu-rich phases precipitate from the steel, and their size begins to increase, with the larger particles reaching approximately 20 nm. By 600 °C, particle coarsening is evident, their number diminishes, and a few “rod” formations are noted, suggesting that the coarsening of the Cu-rich phase in the steel follows the Ostwald ripening mechanism, the smaller copper-rich particles merge and grow, resulting in the formation of large granular or rod-like structures [14]. As larger particles coarsen, smaller ones dissolve, leading to a reduction in the number of precipitated copper-rich phase particles and an increase in the spacing between them. The mass fraction of Cu in the Cu-rich phase particles at 450 °C, 550 °C, and 600 °C is 21%, 49%, and 60%, respectively. This indicates that as the Cu-rich phase precipitates and grows, an increasing amount of Cu elements becomes concentrated in the coarser Cu-rich phases.
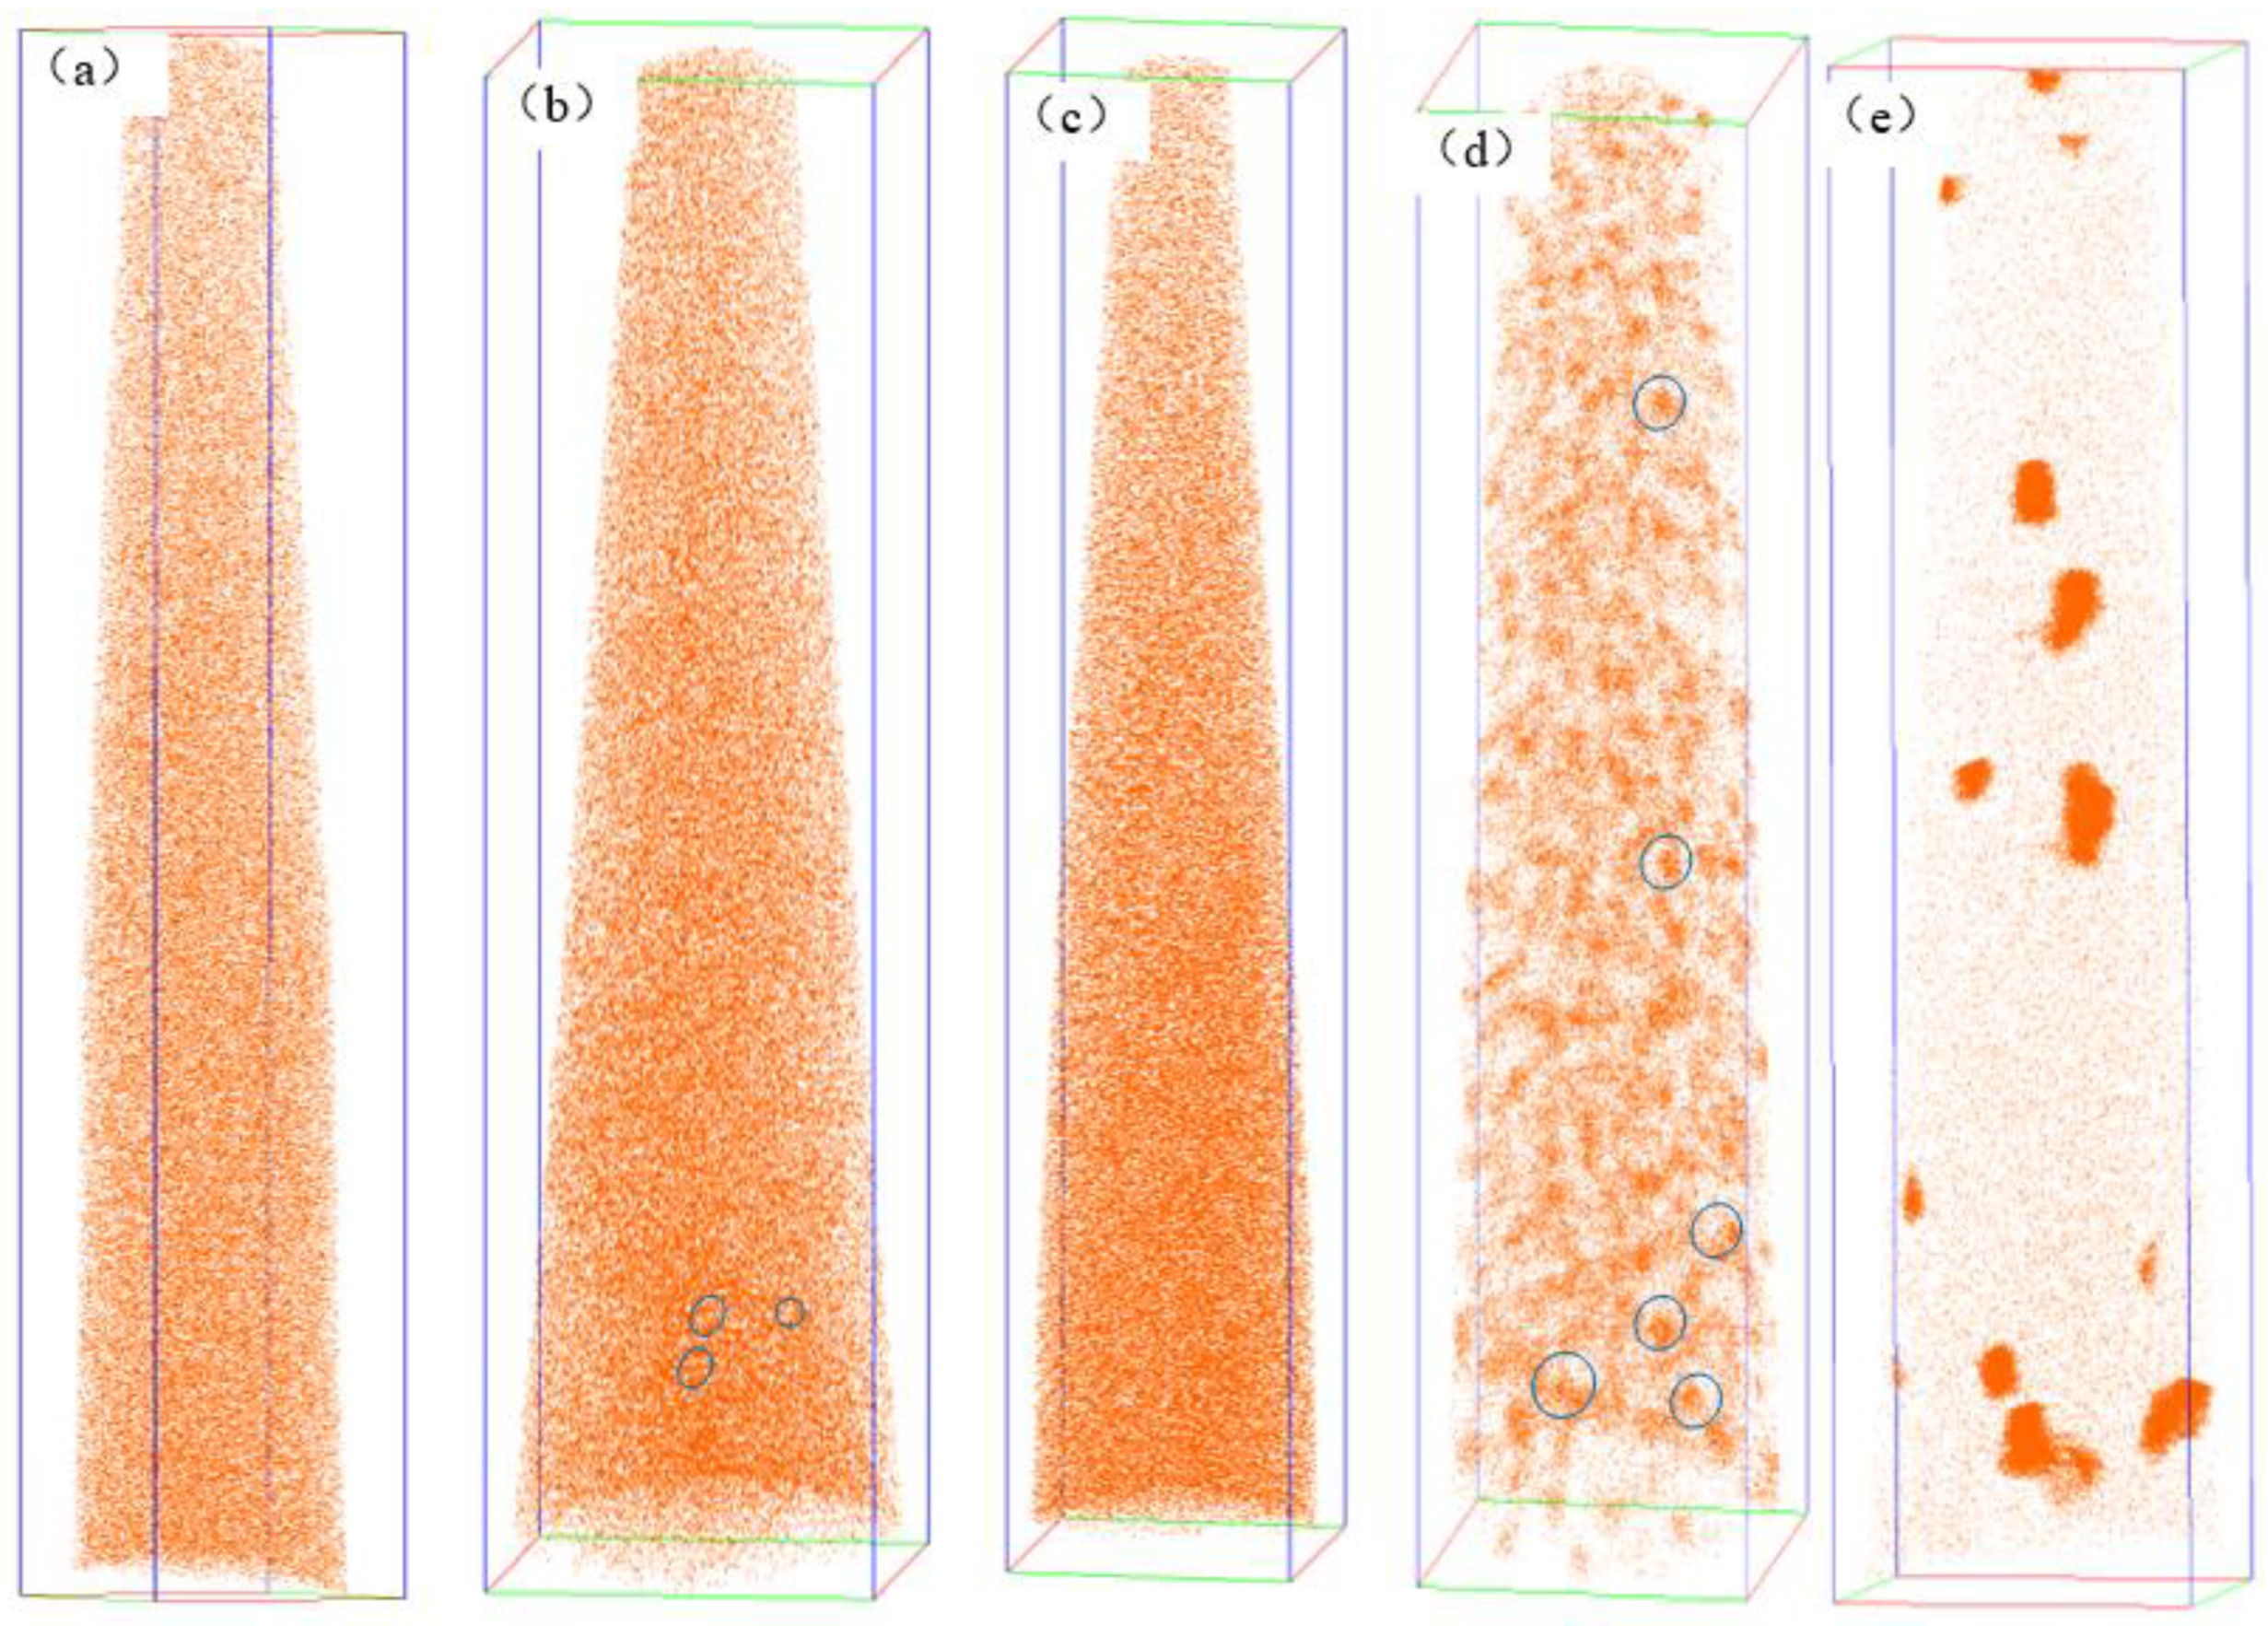
To elucidate the precipitation kinetics of copper-rich phases in steel systems, atom probe tomography (APT) was systematically employed to investigate the nucleation behavior and growth mechanisms of these precipitates under different tempering temperature conditions. The three-dimensional atomic-scale resolution obtained through APT analysis revealed distinct precipitation characteristics for each thermal treatment regime, with the comprehensive results graphically summarized in Figure 2.
Figure 2 illustrates the dispersion of Cu atoms within a nanoscale range, with each point corresponding to a single atom. It is evident that following tempering at 205 °C, the Cu atoms are evenly distributed, and no agglomeration or clustering is detected across the entire volume of analysis. However, when the tempering temperature is increased to 350 °C, a slight agglomeration of Cu atoms within a few atomic layers becomes apparent, suggesting the incipient formation of G.P. zones at this temperature. Upon tempering at 400 °C, the extent of Cu atom agglomeration remains similar to that at 350 °C, with no significant enlargement of cluster size, indicating that the nucleation of Cu atom agglomeration is just commencing at this temperature. Tempering at 450 °C reveals distinct clusters of Cu atom enrichment, with smaller clusters measuring approximately 2~3 nm and larger clusters measuring around 8~10 nm. The spacing between clusters notably expands to the nanoscale, no longer restricted to the atomic scale, suggesting that the growth of Cu-rich phase clusters is a result of the diffusion and aggregation of the surrounding atoms. After tempering at 600 °C, further diffusion and aggregation of Cu atoms near the Cu-rich phase clusters occurs, with the size of the precipitated phase increasing and the spacing between the second phase particles further widening. At this juncture, the observed Cu-rich phase particles have a larger size exceeding 15 nm, a smaller size of about 5 nm, and the spacing between two adjacent precipitated phase particles exceeds 50 nm.
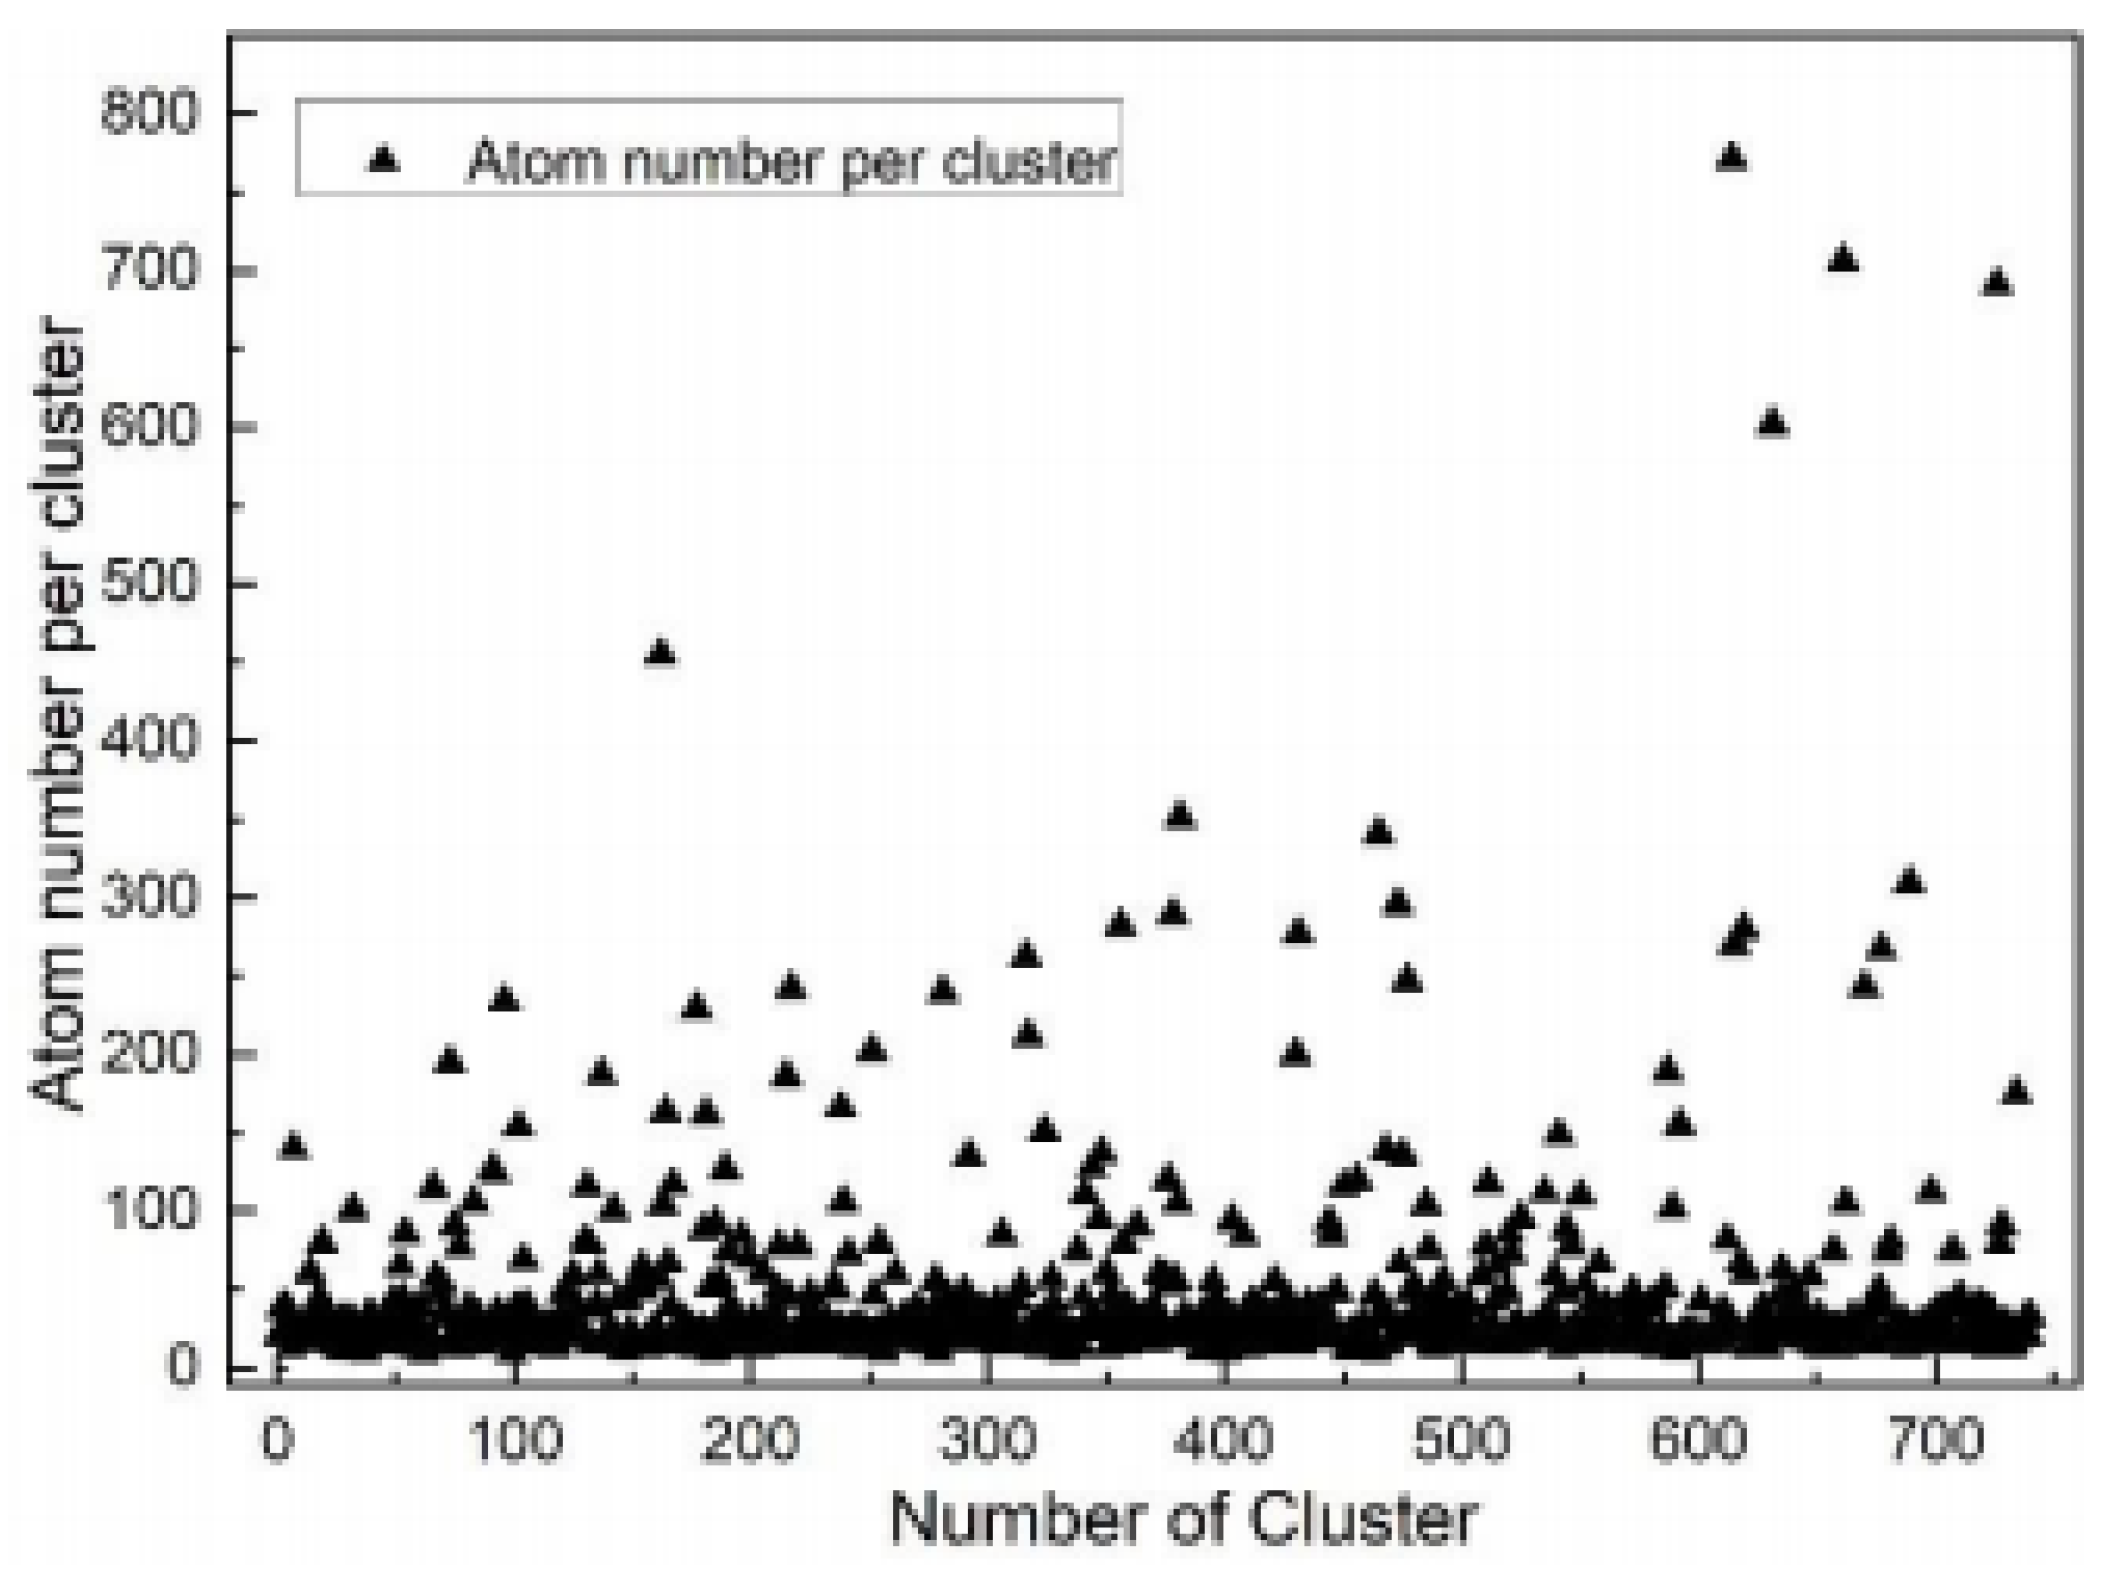
At a tempering temperature of 450 °C, APT quantified the presence of 740 Cu-rich atomic clusters within a 63 × 63 × 228 nm3 volume, along with the atomic count of each cluster, as depicted in Figure 3. The Cu-rich atomic clusters with a small atomic count, approximately 10 atoms, are indicative of the early stages of Cu-rich phase precipitation. Conversely, the larger Cu-rich atomic clusters, containing hundreds of atoms, have evolved into distinct nanoscale Cu-rich phases. This observation suggests that the precipitation of the Cu-rich phase in 10CrNi2Mo3Cu2V steel initiates with the segregation of Cu atoms at the atomic level, forming minute clusters.
The precipitation kinetics of the copper-rich phases in 10CrNi2Mo3Cu2V steel were quantitatively characterized using atom probe tomography (APT). When the tempering temperature increases to 450 °C, a pronounced enhancement in solute segregation density is observed. This intensified segregation drives the accelerated diffusivity of adjacent Cu atoms, facilitating the nucleation of sub-nanometer-scale Cu-rich clusters. Concurrently, the intercluster spacing expands to several nanometers, resulting in a homogeneous dispersion of high-density nano-Cu-rich precipitates (2–8 nm in diameter) with near-optimal spatial distribution. These nanoscale features represent the dominant precipitation mode during tempering aging, achieving maximum precipitation density at this thermal treatment stage. Notably, coarser Cu-rich precipitates exceeding 10 nm in diameter are intermittently observed via transmission electron microscopy (TEM), consistent with the precipitation saturation regime illustrated in Figure 2.
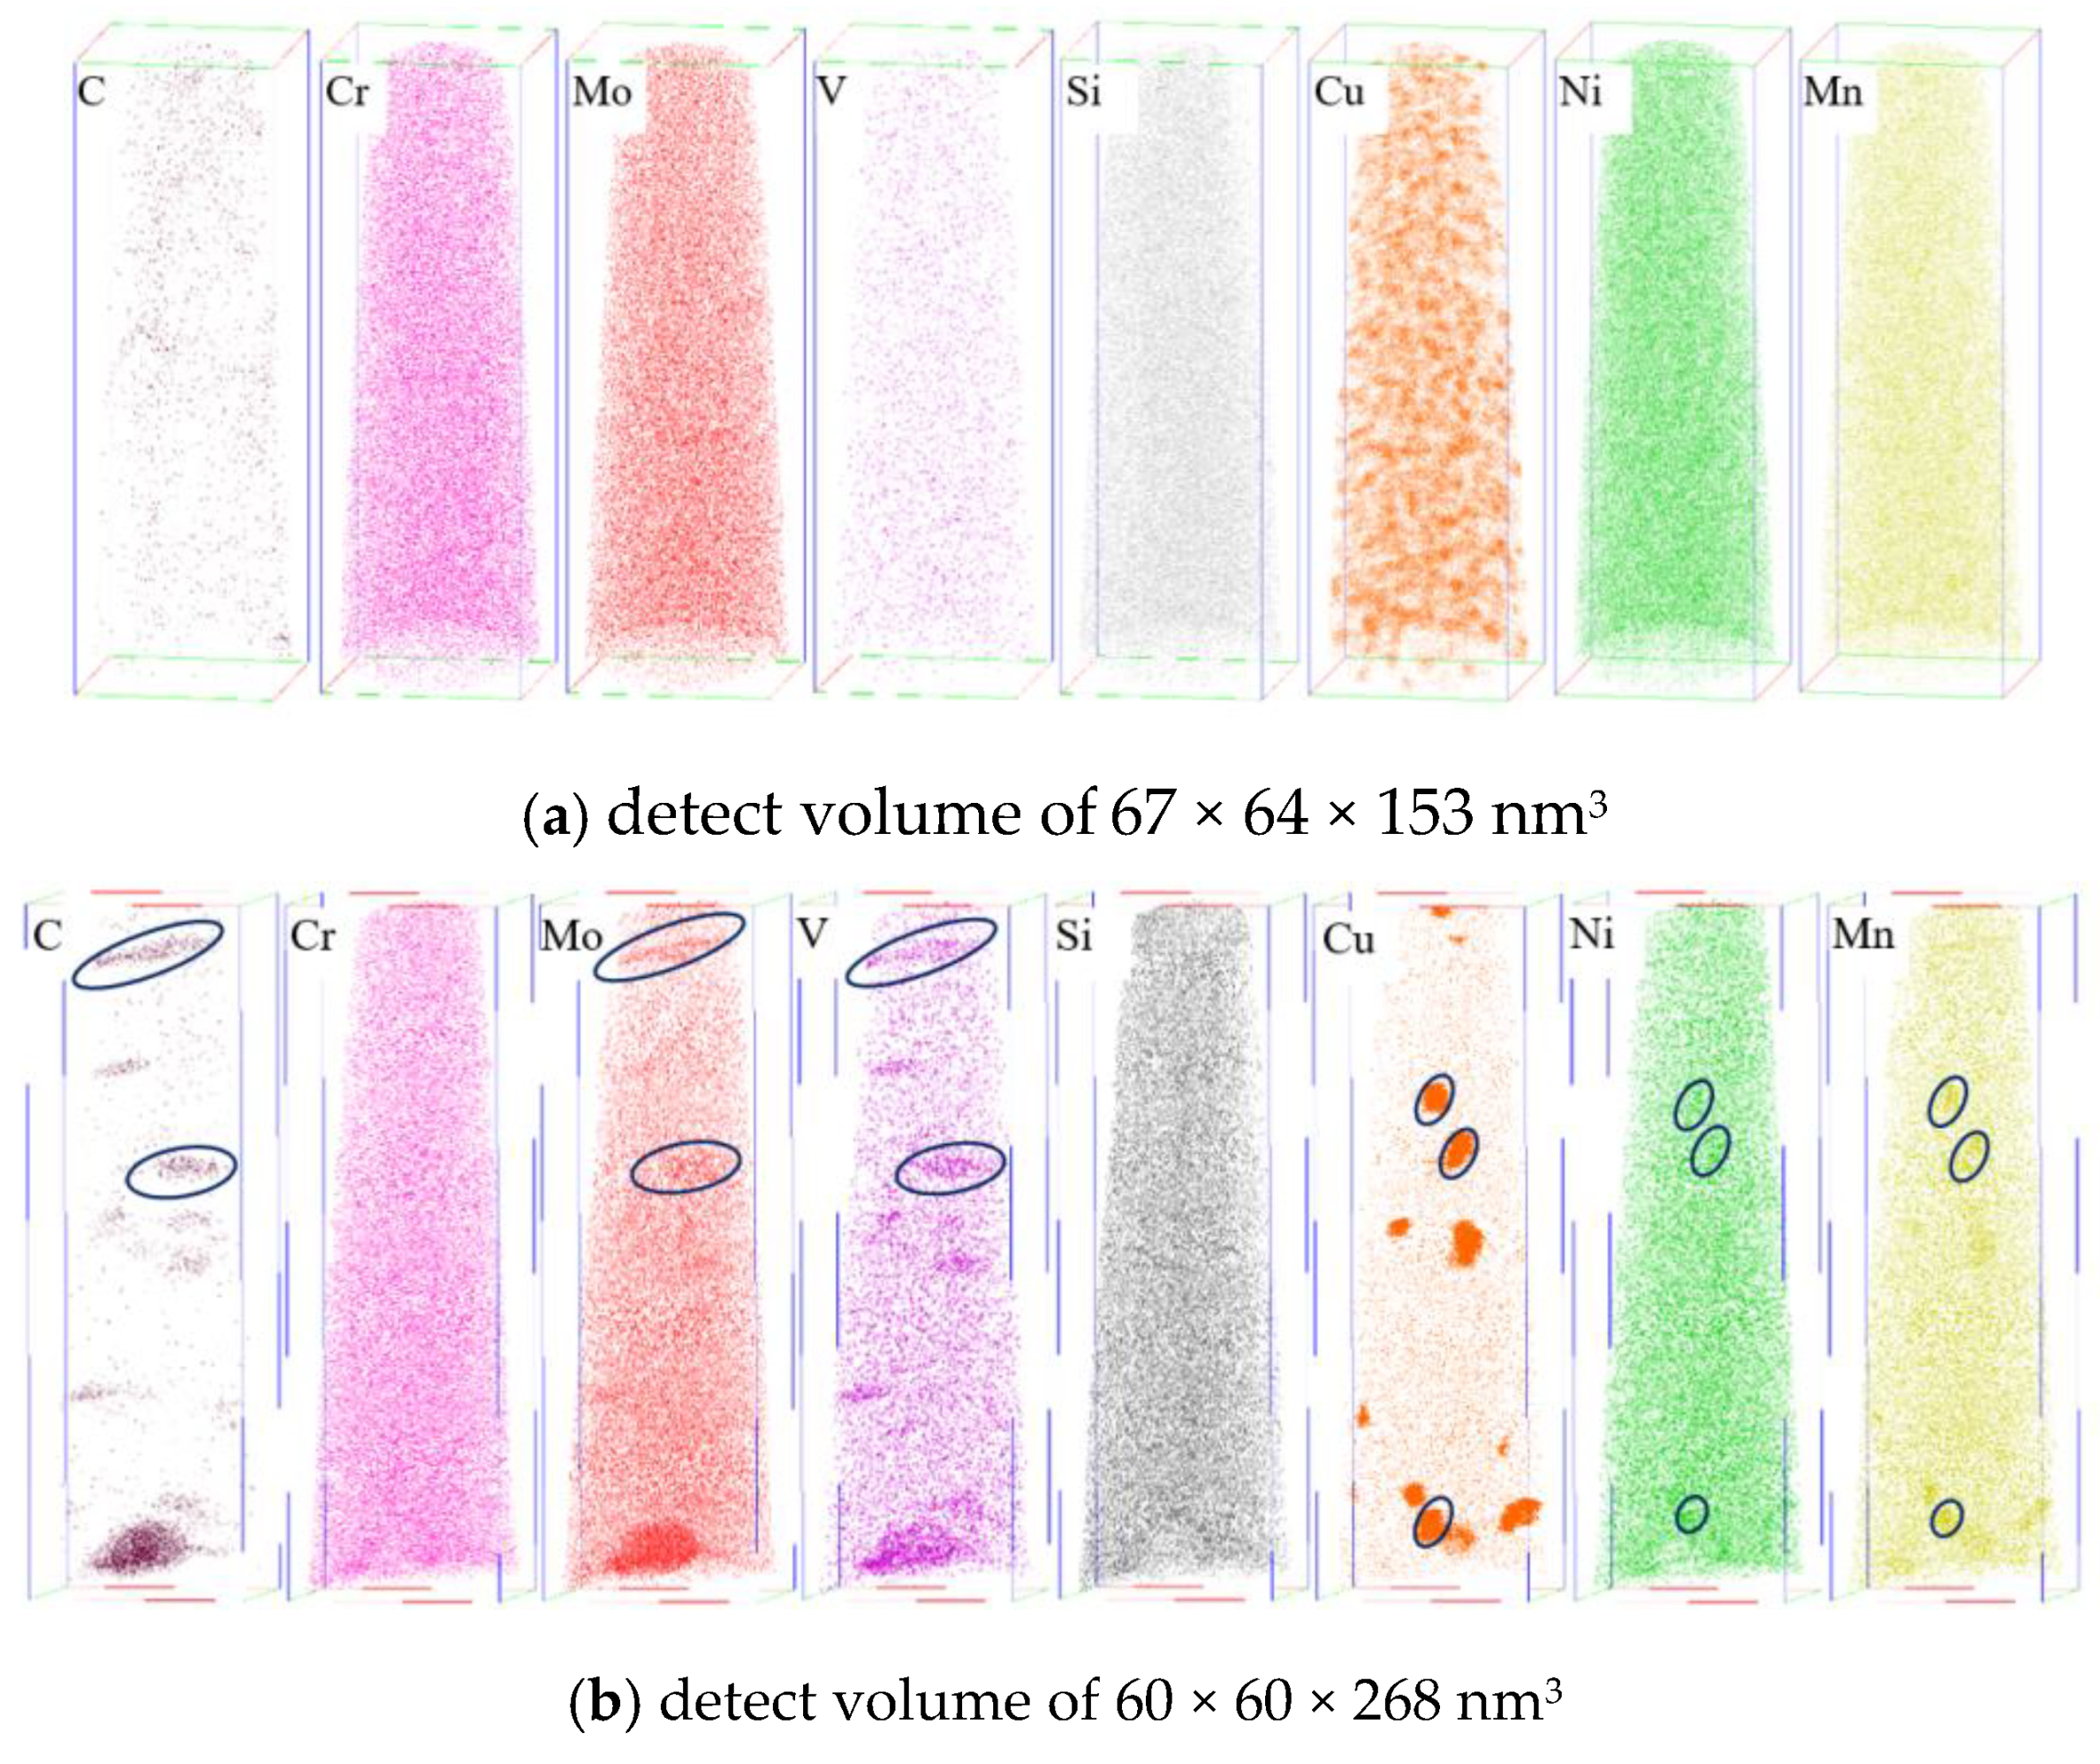
Apart from copper (Cu), steel also contains other alloying elements, such as carbon (C), chromium (Cr), nickel (Ni), molybdenum (Mo), vanadium (V), and silicon (Si). Figure 4 reveals the atomic distribution of these alloying elements within the steel at tempering temperatures of 450 °C and 600 °C.
From the figure, it is evident that the precipitation of the Cu-rich phase is not influenced by the formation of other carbides. During the aggregation and growth of Cu atomic clusters, elements such as C, Cr, Mo, V, and Si remain uniformly distributed. In the sample tempered at 600 °C, it is noted that C, V, and a minor quantity of Mo coalesce to form needle-like regions of atomic enrichment, with lengths ranging from 10 to 40 nm and widths from 2 to 5 nm. These structures represent the VC phase precipitated during high-temperature tempering. The thermal stability of MX-type carbides is substantial, and the quenching and tempering process at 915 °C effectively prevents grain coarsening. Additionally, undissolved VC from the quenching process contributes to strengthening. Upon tempering at 400 °C, the formation of Cu-rich atomic clusters is accompanied by a slight aggregation of Ni and Mn elements in the steel, suggesting their involvement in the growth of the Cu-rich phase. After tempering at 600 °C, as the nano-Cu-rich phase coarsens, there is an increased enrichment of Ni and Mn atoms within the Cu-rich particles.

3.2. Crystallographic Relationship Between Cu-Rich Phase and Matrix

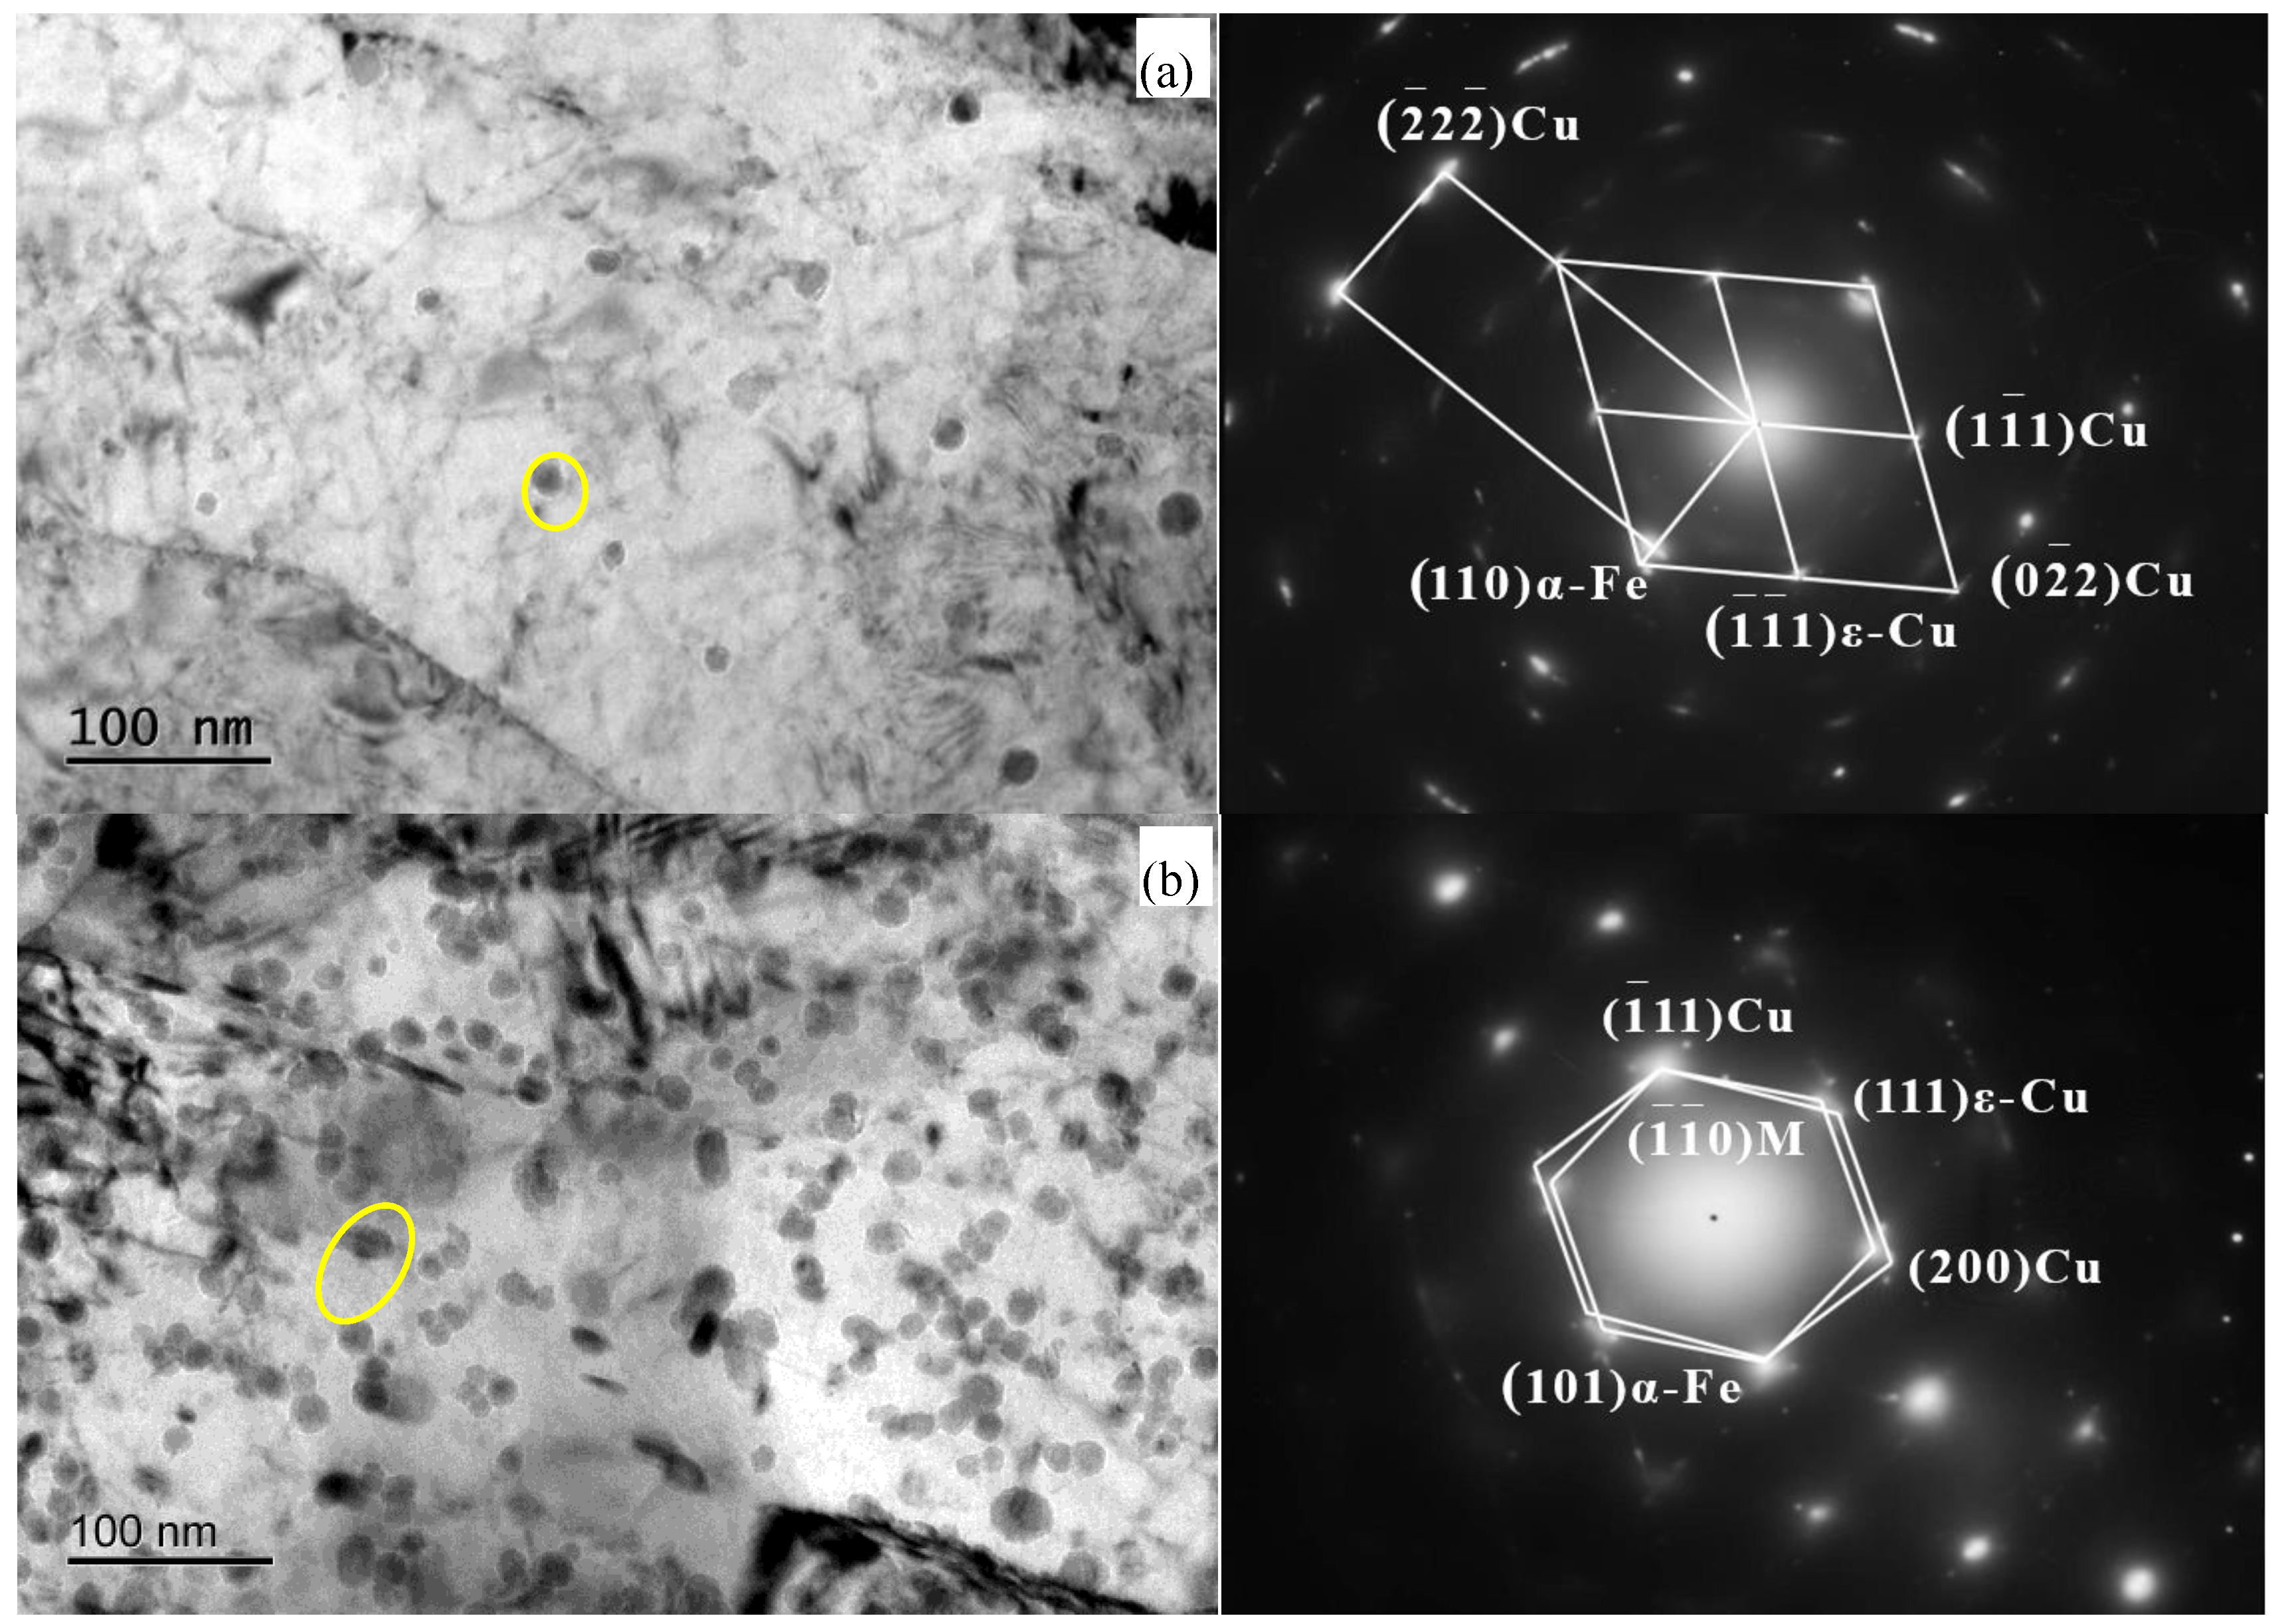
It is widely accepted that supersaturated copper within ferrite originates from a coherent bcc structure and matrix [15]. As the copper-rich phase grows and coarsens, it transitions from the metastable bcc structure to the more stable fcc structure. The particles rich in copper, observed during tempering at 450 °C, have been identified as ε-Cu precipitates with a face-centered cubic (fcc) structure. The orientation relationship between these precipitates and the martensitic matrix, as depicted in Figure 5, which has a body-centered cubic (bcc) structure, is as follows: ( 2 ¯ 00)ε-Cu//(110)α-Fe, [001]ε-Cu//[ 1 ¯ 1 2 ¯ ]α-Fe. Upon tempering at 600 °C, the coarsened, short rod-shaped Cu-rich phase is confirmed to be the ε-Cu precipitate phase with a face-centered cubic (fcc) structure, exhibiting a specific orientation relationship with the matrix: (111)ε-Cu//(101)α-Fe, (01 1 ¯ )ε-Cu//( 1 ¯ 11)α-Fe. Currently, the crystallographic orientation of the Cu-rich phase aligns with the matrix in accordance with the K-S relationship [16].
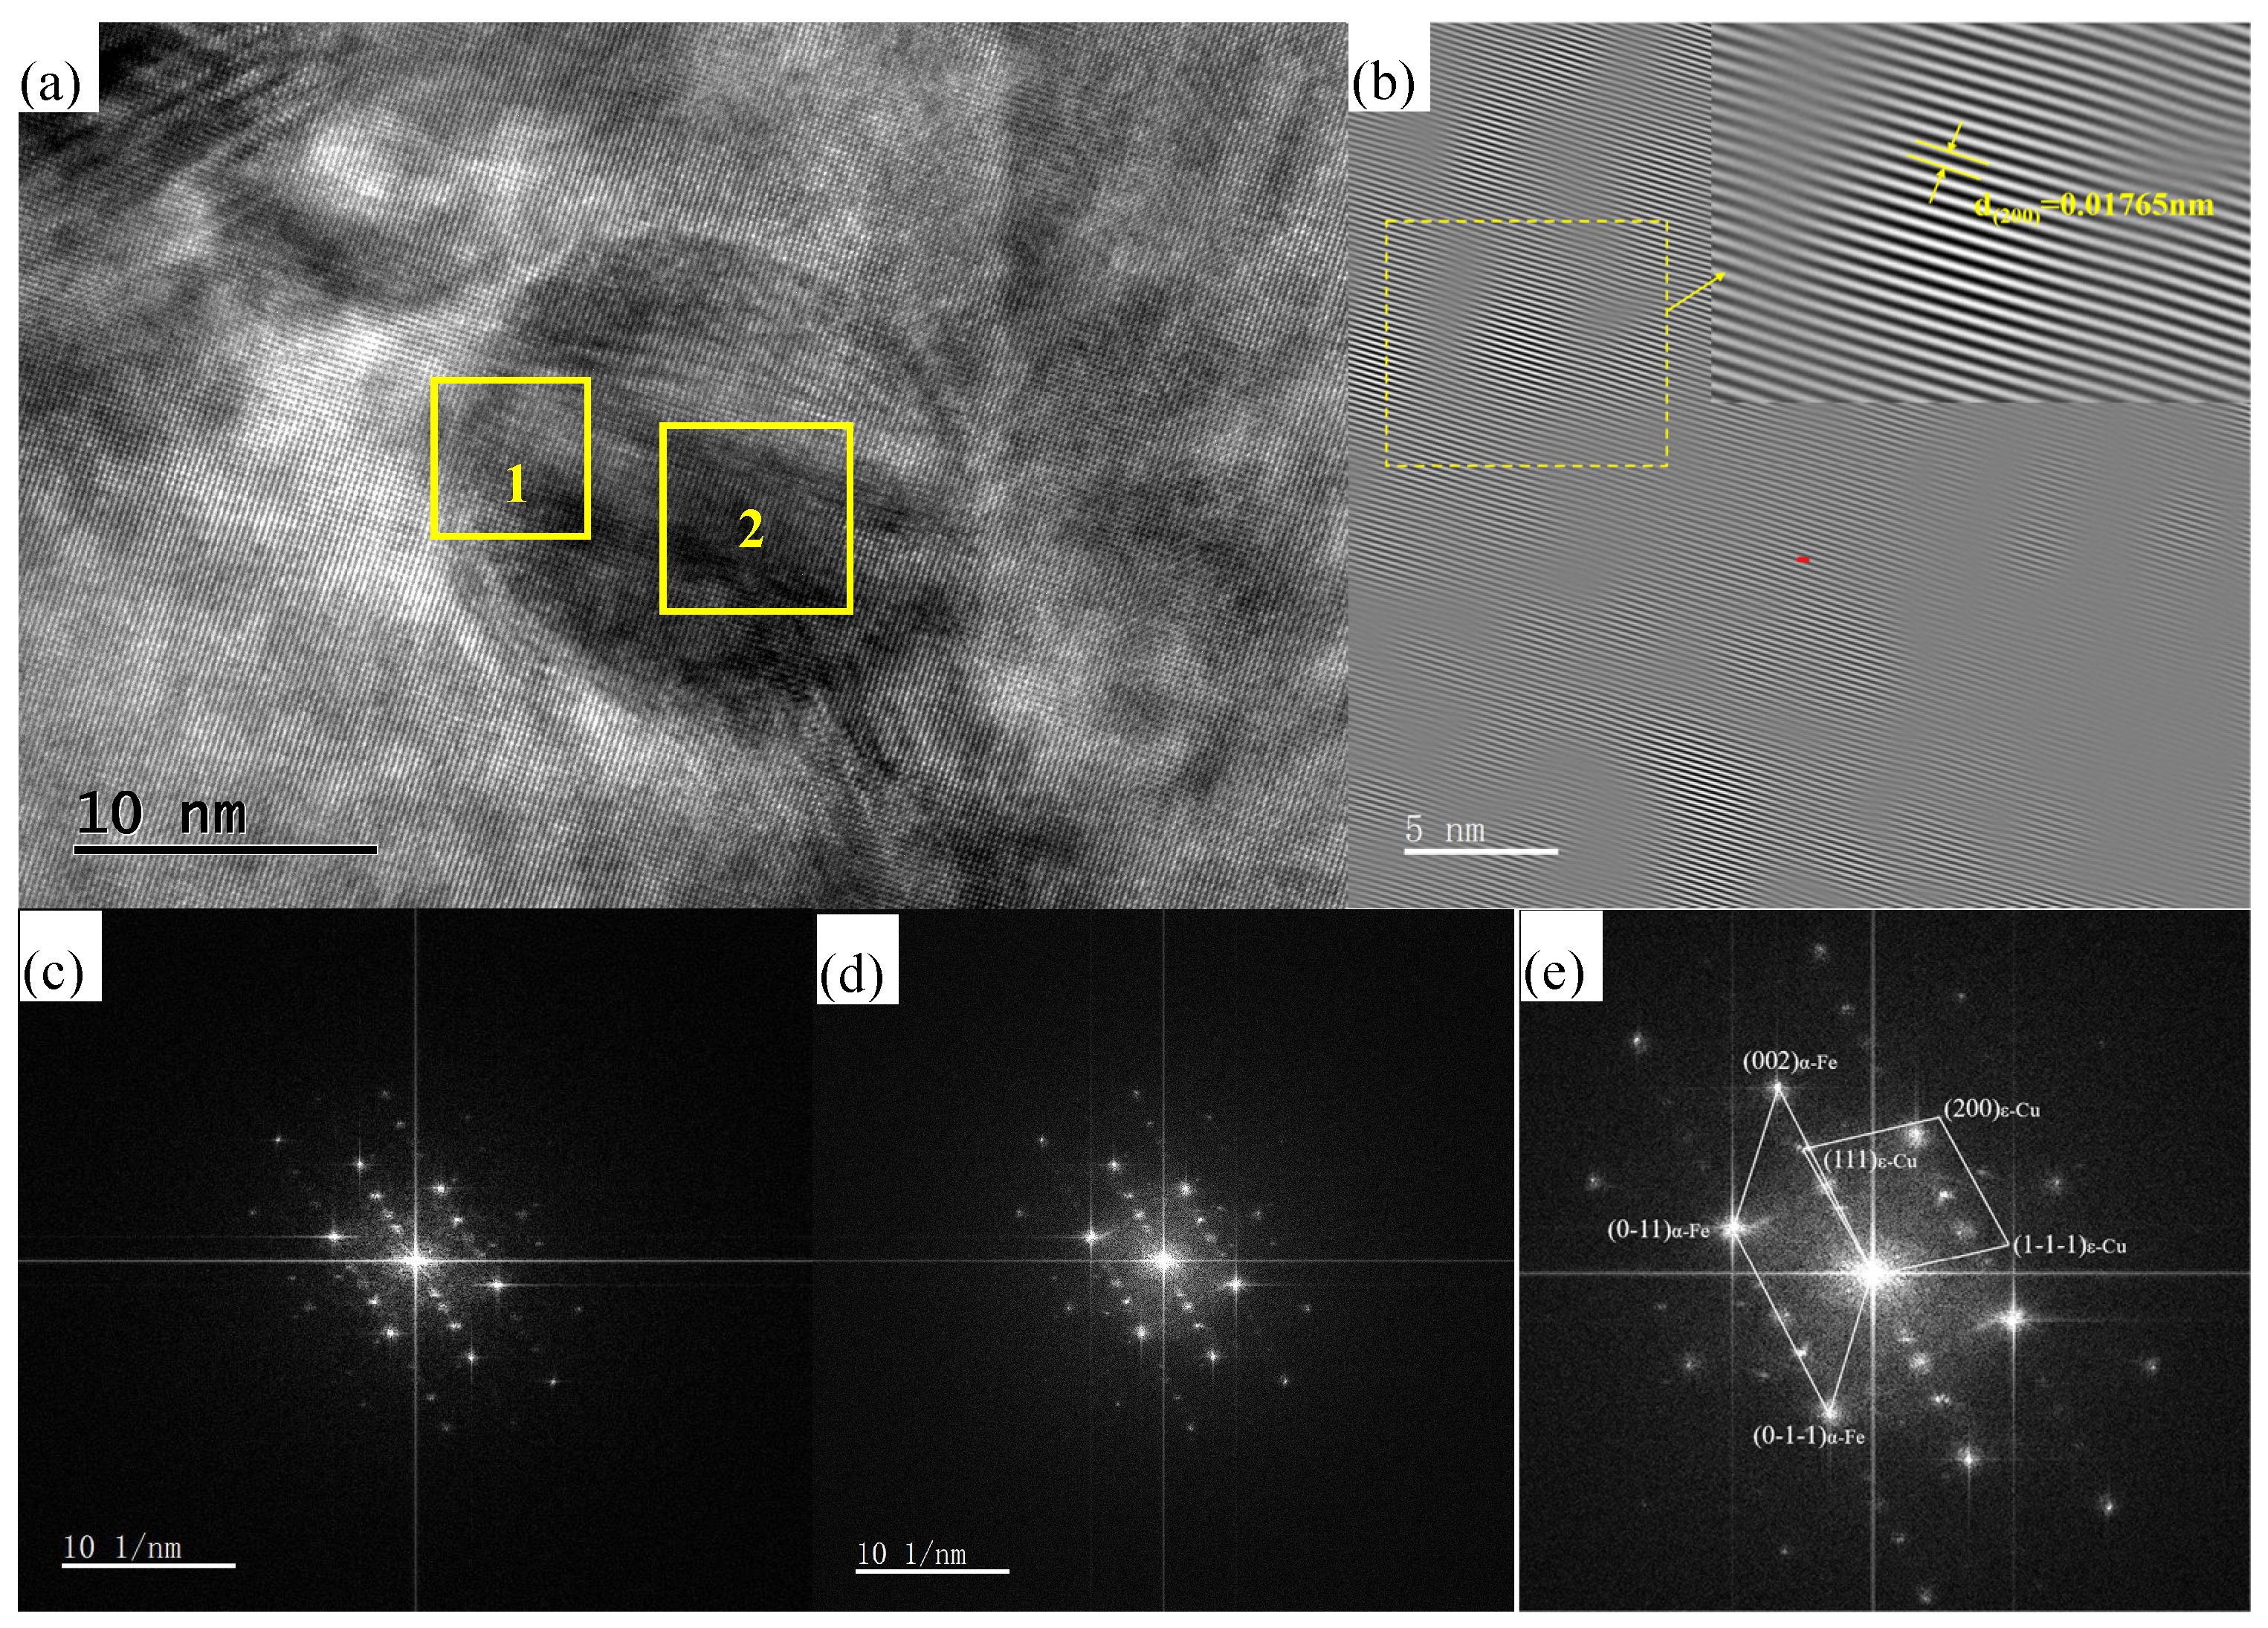
Figure 6 displays high-resolution transmission electron microscopy (HRTEM) lattice fringe images of the matrix and copper-rich phase precipitates (10–15 nm in diameter) in steel tempered at 600 °C. A comparative Fourier transform (FFT) analysis was performed at two distinct regions: the precipitate–matrix interface (Position 1) and the precipitate core (Position 2). Both regions exhibit diffraction patterns consistent with ε-Cu precipitates possessing a face-centered cubic (fcc) structure. Quantitative analysis of the (200) crystallographic planes via inverse Fourier transform (IFFT) refinement yielded an interplanar spacing of 0.1765 ± 0.002 nm, aligning with theoretical fcc-Cu lattice parameters (a = 0.3615 nm). These results confirm that precipitates within the 10–15 nm size range undergo a complete structural transition from a coherent body-centered cubic (bcc) matrix alignment to a decohered fcc configuration. The loss of coherency is attributed to critical size-dependent strain accommodation limits during precipitate coarsening, as evidenced by the absence of lattice continuity at precipitate-matrix interfaces.

3.3. Mechanism of Secondary Strengthening in Copper

3.3.1. Influence of Copper-Rich Phases on Mechanical Properties

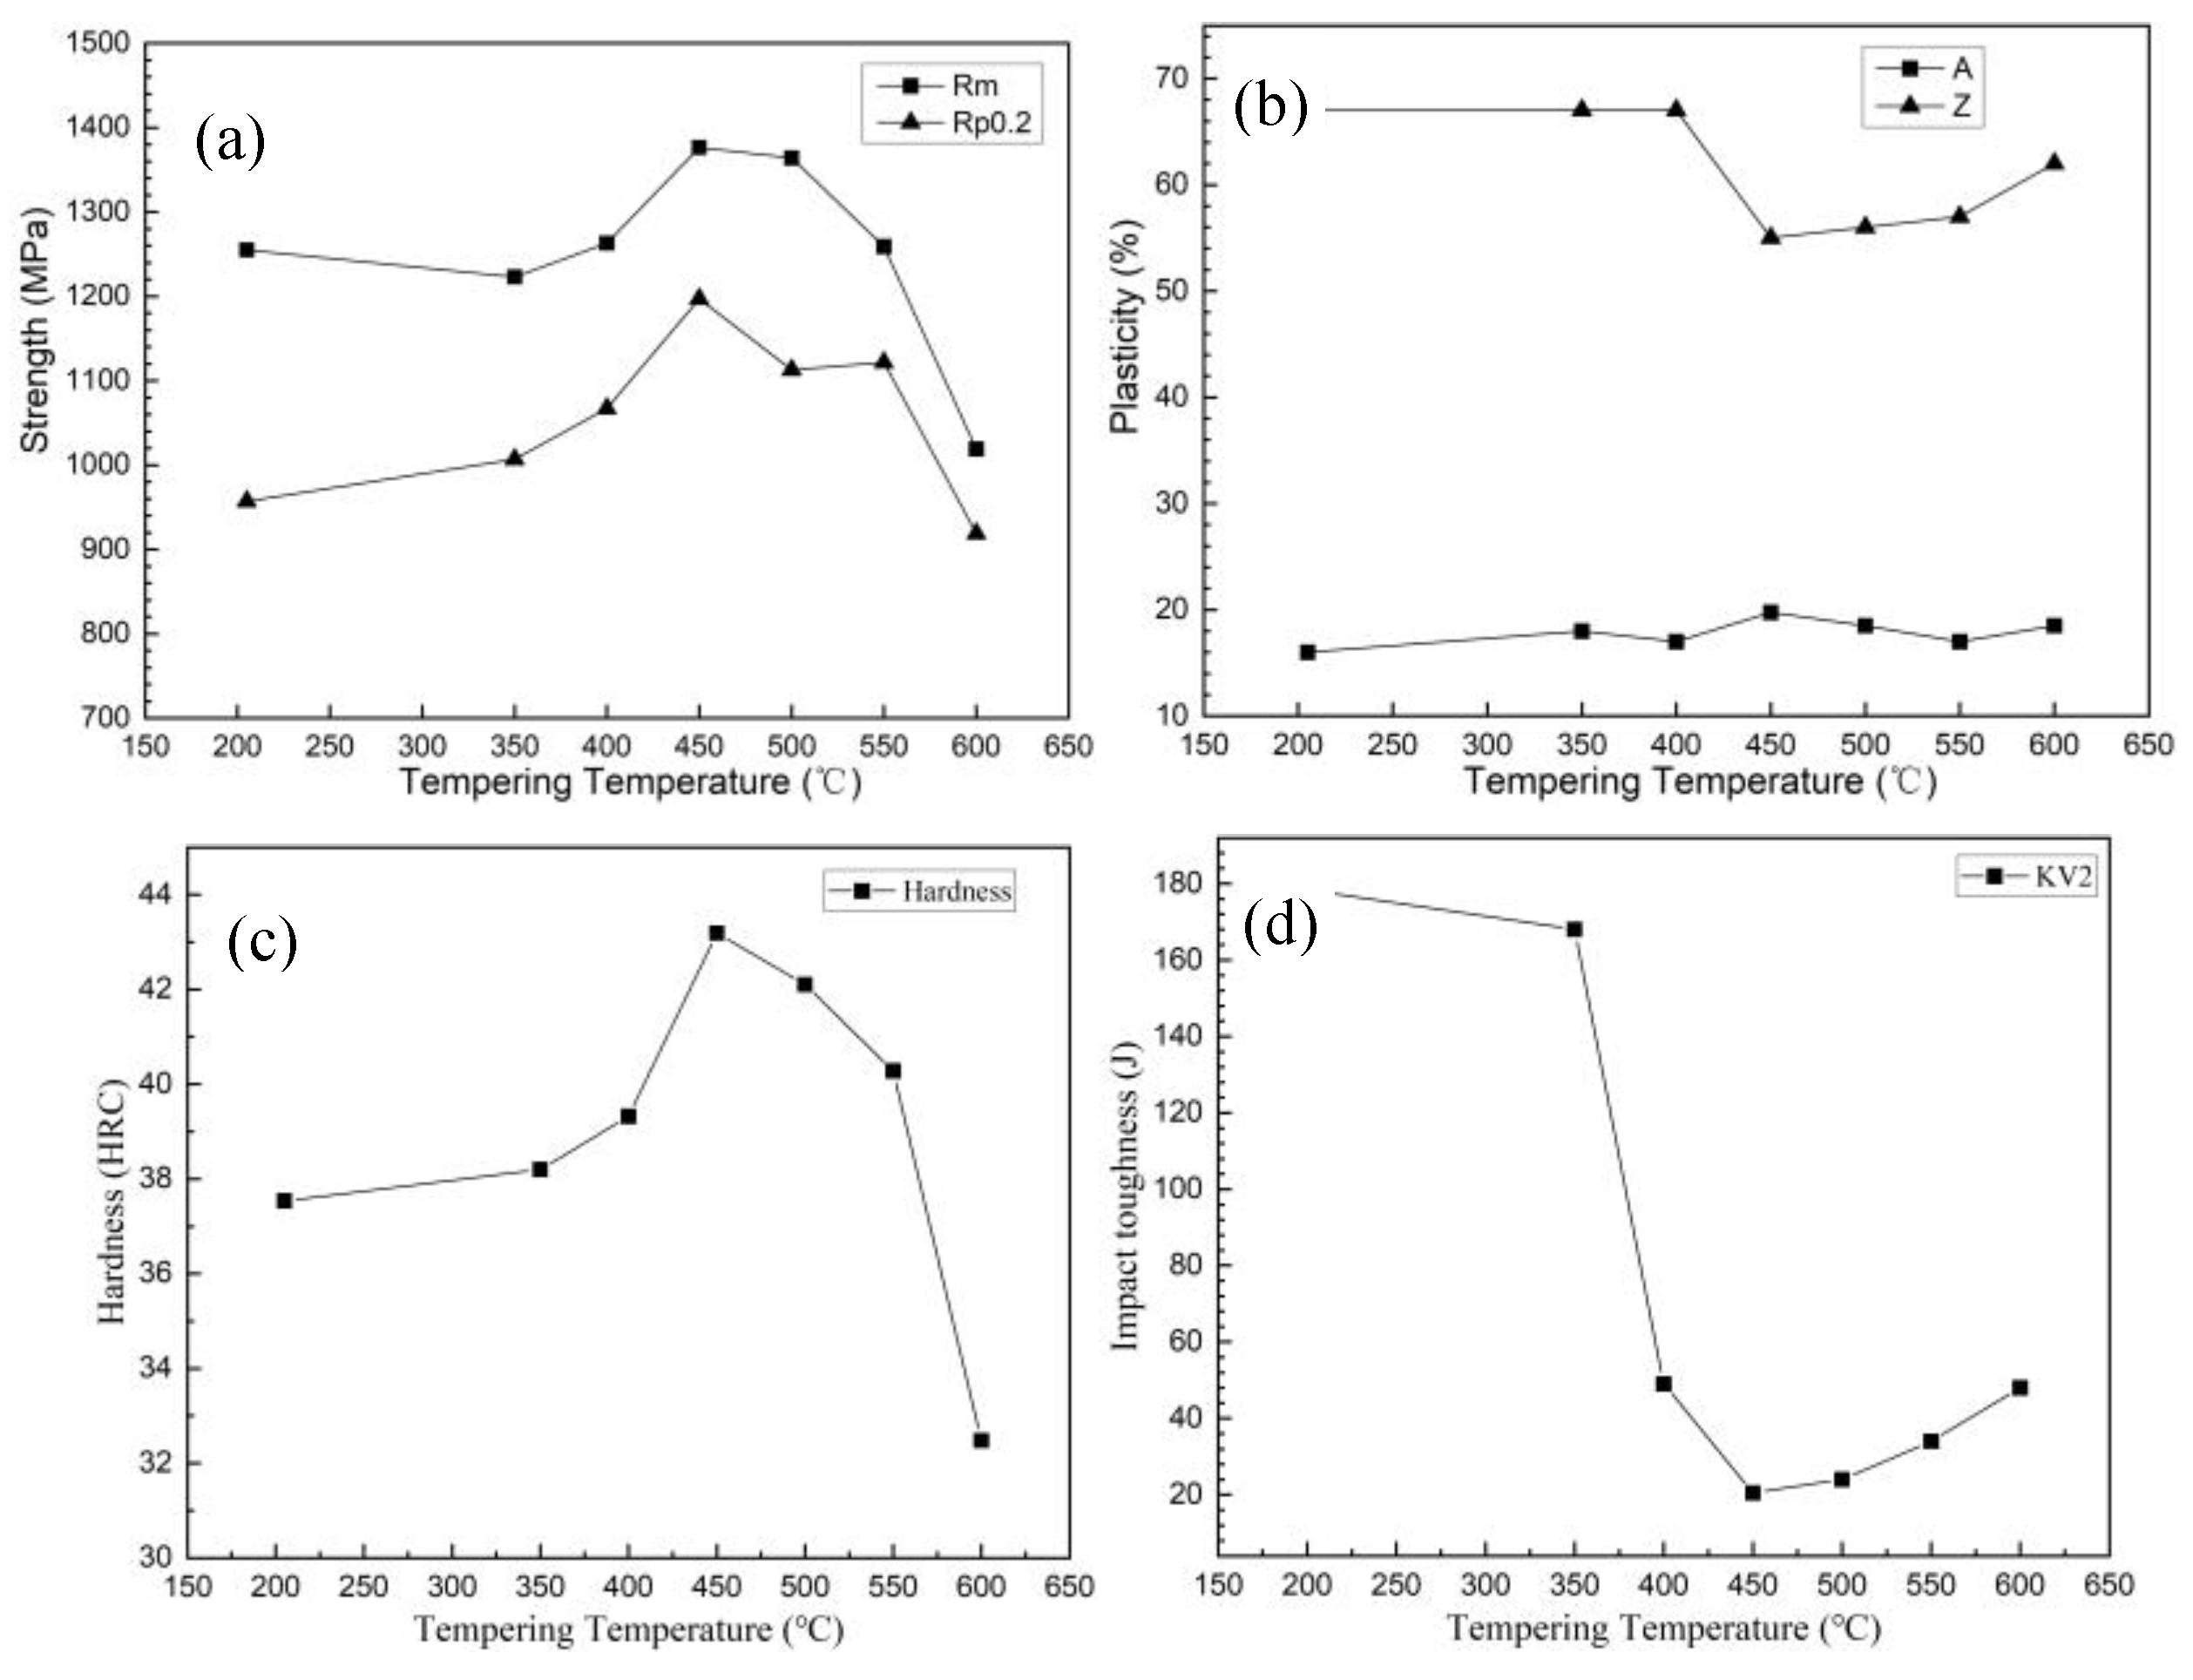
The mechanical response of 10CrNi2Mo3Cu2V steel subjected to austenitization at 915 °C followed by cryogenic treatment (−73 °C) was quantitatively evaluated through tensile testing and hardness measurements across a tempering temperature gradient (200–600 °C), as systematically presented in Figure 7. The mechanical properties of the steel exhibit temperature-dependent variations during the tempering process. As shown in the illustration, both strength and hardness demonstrate an initial ascending trend with increasing tempering temperatures, achieving maximum values at 450 °C. Beyond this critical temperature, a gradual deterioration in these properties is observed. In contrast, the material’s toughness maintains superior levels when tempered below 350 °C. Notably, when the tempering temperature exceeds this threshold temperature of 350 °C, a distinct trade-off relationship emerges: while the strength enhancement accelerates dramatically, the impact energy absorption capacity undergoes rapid degradation. This embrittlement phenomenon reaches its most pronounced state at 450 °C, followed by a progressive recovery of impact toughness at higher tempering temperatures.
Figure 8 presents the fractographic analysis of impact fracture behavior under varying tempering conditions. Specimens tempered within the 205–350 °C range exhibit fracture surfaces dominated by ductile dimple features, indicative of a dimple rupture mechanism. Conversely, tempering at 450 °C induces a significant morphological transition to a quasi-cleavage fracture, with the fracture surface displaying minimal dimple formation and a predominantly brittle failure mode. This abrupt shift in fracture mechanism correlates with extensive precipitation of Cu-rich phases, which act as stress concentrators and promote crack propagation. The resultant embrittlement mechanism effectively transforms the fracture behavior from ductile energy absorption to catastrophic brittle failure.
The results of the APT analysis indicate that upon tempering at 350 °C, the Cu-rich phase is in its nascent stage of precipitation, with most of the precipitates existing in an atomic-scale segregation state or as atomic clusters. At this juncture, it is reasonable to assume that the Cu-rich atomic clusters and the matrix are in a state of complete coherency. Owing to the “soft” nature of these Cu-rich atomic clusters [17], they do not markedly alter the crack propagation mechanism, thereby enhancing strength without compromising high toughness. Progressive coarsening of the Cu-rich phase induces gradual loss of interfacial coherency with the matrix. This structural evolution promotes the development of misfit dislocation networks at phase boundaries, where accumulated dislocations become pinned at the incoherent interfaces, creating localized stress concentrations. When the triaxial stress state reaches a critical threshold, microvoid nucleation occurs preferentially at these dislocation clusters. Subsequent dislocation climb mechanisms facilitate microvoid coalescence, establishing preferential crack initiation sites. The resultant cracks propagate through a low-energy fracture path characterized by limited plastic deformation accommodation, enabling rapid crack advancement with minimal energy dissipation [18,19].

3.3.2. Analysis of the Mechanism Behind Secondary Strengthening in Copper

In Fe-based alloys, when the second phase particles are small and exhibit a coherent relationship with the matrix, dislocations can penetrate these particles via a cutting mechanism. Conversely, if the matrix lacks coherence or is only partially coherent, dislocations must bypass the particles, resulting in the formation of a dislocation loop, known as the Orowan bypass mechanism [20].
The primary mechanisms of coherent strengthening include chemical strengthening, coherent strain strengthening, and modulus strengthening. Research into the strengthening mechanism of nano-precipitation reveals that the morphology and size of the nano-precipitates significantly impact the strengthening effect, with fine and dispersed precipitates offering more effective strengthening. Furthermore, the interaction between the precipitates and the matrix, such as the interface strengthening effect, is also a crucial source of the strengthening effect. The subsequent text calculates the three strengthening effects of copper in 10CrNi2Mo3Cu2V steel.
(1)
Chemical strengthening
Upon the dislocation’s transition into the second phase, employing the cutting mechanism results in the creation of a new interface with a width equivalent to a single Burgers vector [21,22]. This action elevates the interface energy and initiates the chemical strengthening effect. The chemical strengthening effect of the Cu-rich bcc phase can be quantified using the Friedel-Browm-Ham equation: refs. [23,24],
σ c h e m = 2 M b λ Γ 1 / 2 × ( γ b ) 3 / 2
In the formula, M represents the Taylor coefficient, typically 2.75, which indicates the line tension of the dislocation and is commonly utilized. G denotes the shear elastic modulus, with a value of approximately 80 GPa for iron and steel materials. γ is the interface energy between the second phase and the matrix, usually ranging from 0.22 to 0.36 J/m2. The Boehler vector is denoted by a magnitude of 0.248 nm, and λ represents the average atomic distance; the value can be determined through the subsequent calculation:
In the formula, M signifies the Taylor coefficient, typically 2.75, while Γ represents the line tension of the dislocation, commonly expressed as 1/2 Gb2. Here, G refers to the shear elastic modulus, which is approximately 80 GPa for materials such as iron and steel. γ denotes the interface energy between the second phase and the matrix, usually ranging from 0.22 to 0.36 J/m2. The magnitude of the Boehler vector is denoted as 0.248 nm, and λ signifies the average atomic distance, which can be determined through subsequent calculations as follows [25]:
λ = 0.866 × ( r N ) 1 / 2
where r denotes the mean radius of the second phase particles and N represents the number density of the second phase.
(2)
Coherent strain strengthening
Upon precipitation of the Cu-rich phase with a body-centered cubic (bcc) structure, a specific range of elastic coherent strain fields is produced. The interaction between these dislocations and the strain fields results in a coherent strain strengthening effect, denoted as “σcoh ” [24]. The coherent strain-strengthening effect induced by the Cu-rich bcc phase can be quantified using the relation equation formulated by Brown and Ham [24]:
σ c o h = 8.4 M G × ( ε ) 3 / 2 × ( N b ) 1 / 2 × r 2
In the formula, the physical significance of M, G, N, b, and r remains consistent with previous explanations. Here, ε represents the mismatch response variable, with its value set to 0.0057 [26].
(3)
Modulus strengthening
When a dislocation interacts with a spherical precipitated particle that has a lower shear modulus than the matrix, the strengthening effect that arises from the disparity in dislocation line energy between the second phase and the matrix is referred to as the modulus strengthening effect, denoted as “σmod”. The modulus strengthening effect of bcc Cu-rich phase can be described using the relationship proposed by Russell and Brown [24]:
σ m o d = M G b λ 1 ( U P U m ) 2 3 / 4
In the formula, the physical meanings of M, G, b, and λ remain consistent with previous definitions. UP represents the line energy of the dislocation within the Cu-rich phase, while Um denotes the line energy of the dislocation in the iron matrix.
U P U m = U P U m × l g r r i l g r 0 r i + l g r 0 r l g r 0 r i
In the formula, ri represents the inner diameter of the dislocation stress field, with ri = 2.5 b. Meanwhile, r0 denotes the outer diameter of the dislocation stress field, where r0 = 1000 ri. The ratio U P U m is associated with the line energy per unit length, and in most existing studies, this value is typically 0.62 [27].
Referencing the research findings detailed in the literature [28,29], it is challenging to preserve the bcc coherent relationship with the matrix when the Cu-rich particles in the steel exceed 5 nm in size. If we assume that the critical dimension “d” for the bcc structure transformation in this test steel is 5 nm, then the secondary strengthening effect of the bcc Cu-rich phase in steel can be theoretically calculated.
The distribution of Cu-rich phase clusters in the experimental steel after aging at 450 °C was statistically analyzed using a three-dimensional atomic probe (APT). The distribution of specific elements, the number density, and size of nano-phases in the sample were obtained using the LEAP 3000 HR local atomic probe. The test conditions were −223 °C and a high-pressure pulse (4.5 × 10⁻¹¹ Torr, 20% pulse fraction, 200 kHz repetition frequency). The APT data reconstruction was performed using IVASTM 3.6.2 software. The test area volume of APT was 63 × 67 × 153 (nm3), and 1270 Cu-rich atomic clusters with diameters less than 5 nm were statistically obtained, with an average diameter of approximately 1.5 nm. The distribution of copper-rich atomic clusters following aging at 450 °C was statistically analyzed using atom probe tomography (APT). The test volume measured 63 × 67 × 153 nm3. A total of 1270 Cu-rich atomic clusters were detected, each with a diameter under 5 nm, and an average equivalent diameter of 1.4576 nm.
The theoretical values for various reinforcement effects were computed and are presented in Table 2. Analysis of these computed values reveals that at 450 °C, the increase in chemical strengthening due to the precipitation of the Cu-rich phase in steel with bcc structure is less than 15 MPa. The increase in coherent strain strengthening is approximately 37.6 MPa, while the increase in modulus strengthening is about 115.8 MPa. Consequently, at the peak aging temperature, for 10CrNi2Mo3Cu2V steel, the precipitation-strengthening effect of the bcc Cu-rich phase, which is less than 5 nm in size, is predominantly governed by the modulus-strengthening effect, followed by the uniform strain-strengthening effect, with the chemical-strengthening effect being relatively minor.
(4)
Orowan reinforcement effect
The phase in steel that is rich in copper and has a size exceeding 5 nm can be regarded as having lost its coherent relationship with the matrix [30]. Consequently, its strengthening mechanism shifts from a cut-through mechanism to an Orowan bypass mechanism. The resulting increase in strength can be calculated using the following formula [31]:
σ O r o w a n = C M G b λ l n ( r 0 r i )
where C is a constant and 0.127 is adopted; ri and r0 respectively denote the inner and outer radius of the dislocation stress field, r0 = 2 × 0.816 × r, and ri = 2.5 b; λ represents the average distance between the Cu-rich phases, which is derived from Equation (2).
The average diameter, quantity, and volume fraction of Cu-rich phases exceeding 5 nm in diameter within the steel were determined through TEM statistical analysis.
The statistical analysis of the TEM data reveals that the mean diameter (d) is approximately 6.18 nanometers, the number density is roughly 4.11 × 10²² per cubic meter, and the wavelength (λ) is about 54.3 nanometers. When the values of r and λ, derived from the statistical computations, are inserted into Equation (6), the resulting strength increase attributed to the Orowan bypass mechanism is approximately 97.2 MPa.
The aforementioned analysis indicates that at the peak aging temperature of 450 ° C, the theoretical yield strength enhancement due to Cu-rich phase precipitation is approximately 121.8 MPa, while the theoretical strength increase attributed to the Orowan bypass mechanism is around 97.2 MPa. Consequently, the combined theoretical strengthening effect of both mechanisms is roughly 219 MPa. Upon tempering at 450 °C, the yield strength of the test steel increased by 240 MPa compared to tempering at 205 ° C, a figure that aligns closely with the theoretical predictions. However, when the tempering temperature surpasses 550 °C, the average diameter of the Cu-rich phase exceeds 15 nm, exceeding the critical diameter range determined by theoretical calculations. At this juncture, the primary strengthening mechanism shifts to bypassing, and the secondary strengthening effect begins to diminish considerably, leading to a significant decrease in strength.

4. Conclusions

In the present work, systematic experimental characterization combined with theoretical calculations were conducted to investigate the precipitation behavior and strengthening mechanism of Cu-rich phases in 10CrNi2Mo3Cu2V maraging steel. Our study provides a detailed understanding of the microstructural evolution of Cu precipitates during tempering and their impact on mechanical properties. The key findings and their implications are summarized and discussed below:
(1)
Tempering between 350 °C and 450 °C promotes the formation of nanoscale Cu-rich phases, leading to peak strength and hardness at 450 °C. Specifically, the steel reaches a yield strength approximately 240 MPa greater than that at 205 °C after tempering at 450 °C. However, subsequent coarsening of these precipitates at higher temperatures diminishes strength and significantly reduces impact toughness, which reaches its lowest point at 450 °C. This is attributed to the loss of coherency and the facilitation of micro-crack formation at incoherent interfaces. This highlights the critical role of tempering temperature in controlling the Cu-rich phase morphology and, consequently, the mechanical properties.
(2)
Analysis of Cu-rich phase size and theoretical calculations indicate that the dislocation cutting mechanism is the primary contributor to strengthening, rather than Orowan bypassing. The APT-measured average particle diameter of 1.46 nm is significantly smaller than the calculated Orowan critical diameter of 6.18 nm. Further, calculations reveal that the modulus-strengthening effect contributes the most to the increase in strength, followed by the coherent strain-strengthening effect, and then the chemical-strengthening effect. This suggests that optimizing the size, distribution, and coherency of Cu-rich precipitates is crucial for maximizing strength.
(3)
Theoretical calculations of strength enhancement due to both the cutting mechanism (approximately 121.8 MPa) and Orowan bypassing mechanism (approximately 97.2 MPa) total a predicted yield strength increase of 219 MPa, closely matching the experimentally observed yield strength increase of approximately 240 MPa at 450 °C compared to 205 °C. This agreement validates the accuracy of the models used and supports using these insights to guide future alloy design strategies, such as optimizing composition and heat treatment to tailor precipitate characteristics and achieve desired strength-toughness balance in high-strength steels. Future work should focus on achieving this refined control over Cu-rich phase morphology to improve overall mechanical performance.

Author Contributions

Conceptualization, J.Z. and G.Y.; methodology, G.Y. and Z.G.; software, J.Z.; validation, J.Z., G.Y., and Z.G.; formal analysis, J.Z.; investigation, J.Z., G.Y., and Z.G.; resources, J.Z.; data curation, J.Z.; writing—original draft, J.Z.; writing—review and editing, J.Z., G.Y., and Z.G.; visualization, J.Z.; supervision, G.Y.; project administration, G.Y.; funding acquisition, J.Z. All authors have read and agreed to the published version of the manuscript.

Funding

This research was funded by [the National New Materials Production and Application Demonstration Platform Project] grant number [22T60130] and [Program for Young Talents of Science and Technology in Universities of Inner Mongolia Autonomous Region] grant number [NJYT23115] and [the Inner Mongolia Natural Science Foundation] grant number [2022MS05039].

Data Availability Statement

The original contributions presented in this study are included in the article. Further inquiries can be directed to the corresponding author(s).

Conflicts of Interest

Jiqing Zhao was employed by the company Central Iron and Steel Research Institute Co.Ltd., Gang Yang was employed by the company Central Iron and Steel Research Institute Co.Ltd.. The remaining authors declare that the research was conducted in the absence of any commercial or financial relationships that could be construed as a potential conflict of interest.

References

  1. Rejith, R.; Kesavan, D.; Chakravarthy, P.; Murty, S.N. Bearings for aerospace applications. Tribol. Int. 2023, 181, 108312. [Google Scholar] [CrossRef]
  2. Hu, X.; Yang, L.; Wei, X.; Wang, H.; Fu, G. Molecular Dynamics Simulation on Nanoindentation of M50 Bearing Steel. Materials 2023, 16, 2386. [Google Scholar] [CrossRef] [PubMed]
  3. Wang, J.; Ma, J.; Dong, N.; Tan, H.; Wang, J.; Han, P. Effect of quenching and tempering on microstructure and corrosion resistance of aerospace-bearing steel. Mater. Today Commun. 2024, 39, 108791. [Google Scholar] [CrossRef]
  4. Zu, H.; He, Z.; He, B.; Tang, Z.; Fang, X.; Cai, Z.; Cao, Z.; An, L. Effect of Metallic Coatings on the Wear Performance and Mechanism of 30CrMnSiNi2A Steel. Materials 2023, 16, 6191. [Google Scholar] [CrossRef] [PubMed]
  5. Iżowski, B.; Wojtyczka, A.; Motyka, M. Numerical Simulation of Low-Pressure Carburizing and Gas Quenching for Pyrowear 53 Steel. Metals 2023, 13, 371. [Google Scholar] [CrossRef]
  6. Wei, P.; Bai, P.; Yue, L.; Zhou, X.; Wen, X.; Zhao, H.; Meng, Y.; Tian, Y. Comparing friction behavior and mechanism of three generation bearing steel (GCr15, M50, CSS-42L) paired silicon nitride under ester oil lubrication from room temperature to 350 °C. J. Mater. Res. Technol. 2024, 30, 1354–1367. [Google Scholar] [CrossRef]
  7. He, Y.; Zeng, X.J.; Li, L.Q.; Li, N.; Niu, J.B.; Ma, X.X. Phase composition and numerical model of low-pressure pulse carburized layer in 15Cr14Co12Mo5Ni2W steel. Surf. Coat. Technol. 2024, 484, 130868. [Google Scholar] [CrossRef]
  8. Liu, B.F.; Yang, G.; Hua, J.S.; Yang, M.X. Effect of quenching temperature on structure and mechanical properties of AMS 6308 steel. Spec. Steel Technol. 2012, 18, 15. (In Chinese) [Google Scholar]
  9. Stepanova, N.V.; Mikhalev, R.I.; Tarasova, T.D. Peculiarities of Copper Precipitation in Hypereutectoid Steels. Metallurgist 2023, 66, 1388–1400. [Google Scholar] [CrossRef]
  10. Goodman, S.R.; Brenner, S.S.; Low, J.R. An FIM-atom probe study of the precipitation of copper from lron-1.4 at. pct copper. Part I: Field-ion microscopy. Metall. Trans. 1973, 4, 2363–2369. [Google Scholar] [CrossRef]
  11. Maruyama, N.; Sugiyama, M.; Hara, T.; Tamehiro, H. Precipitation and phase transformation of copper particles in low alloy ferritic and martensitic steels. Mater. Trans. 1999, 40, 268–277. [Google Scholar] [CrossRef]
  12. Li, C.; Chen, Y.; Zhang, X.; Liu, T.; Peng, Y.; Wang, K. Effect of heat treatment on microstructure and mechanical properties of 17-4PH stainless steel manufactured by laser-powder bed fusion. J. Mater. Res. Technol. 2023, 26, 5707–5715. [Google Scholar] [CrossRef]
  13. Sato, K.; Ihara, T.; Sakurai, H.; Yoshiie, T.; Xu, Q. Comparison of interaction between Cu precipitate and vacancy in Fe using first-principle calculations and empirical N-body potential calculations. Comput. Mater. Sci. 2009, 47, 521–525. [Google Scholar] [CrossRef]
  14. Wu, Z.; Wu, R. Research progress on coarsening of second phase particles in two-phase systems. Mater. Rev. 2010, 24, 113–115. [Google Scholar]
  15. Liu, W. Study on the Precipitation and Crystal Structure Evolution of Cu-Rich Phase in Reactor Pressure Vessel Simulated Steel. Ph.D. Thesis, Shanghai University, Shanghai, China, 2011. (In Chinese). [Google Scholar]
  16. Kajiwara, S. Stacking disorder in martensite with 3R close-packed structure. J. Appl. Crystallogr. 1971, 4, 329–330. [Google Scholar] [CrossRef]
  17. Zhu, L. Molecular Dynamics Simulation of Early Precipitation Behavior of Rich Cu Clusters in Fe-Cu-Ni Alloys. Master’s Thesis, Shanghai University, Shanghai, China, 2014. (In Chinese). [Google Scholar]
  18. Holzer, I.; Kozeschnik, E. Computer simulation of the yield strength evolution in Cu- precipitation strengthened ferritic steel. Mater. Sci. Eng. A 2010, 527, 3546–3551. [Google Scholar] [CrossRef]
  19. Goodman, S.R.; Brenner, S.S.; Low, J.R. An FIM-atom probe study of the precipitation of copper from lron-1.4 at. pct copper. Part II: Atom probe analyses. Metall. Trans. 1973, 4, 2371–2378. [Google Scholar] [CrossRef]
  20. Ferguson, B.L.; Freborg, A.M.; Li, Z. Residual stress and heat treatment-Process design for bending fatigue strength improvement of carburized aerospace gears. HTM Haerterei-Tech. Mitteilungen 2007, 62, 279–284. [Google Scholar] [CrossRef]
  21. Ferguson, B.L.; Freborg, A.M.; Li, Z. Improving Gear Performance by Intensive Quench. In Proceedings of the 24th ASM Heat Treating Society Conference, Detroit, MI, USA, 17–19 September 2007. [Google Scholar]
  22. Ferguson, B.L. Residual Stress and Bending Fatigue Strength in Carburized and Quench Hardened Pyrowear 53 Steel Gears. In Proceedings of the International Federation of Heat Treatment and Surface Engineering 2016, Savannah: Proceedings of the 23rd IFHTSE Congress, Savannah, GE, USA, 18–21 April 2016. [Google Scholar]
  23. Hornbogen, E.; Glenn, R.C. A metallographic study of precipitation of copper from alpha iron. Trans. Metall. Soc. AIME 1960, 218, 1064–1070. [Google Scholar]
  24. Brown, L.M.; Ham, R.K. Dislocation–particle interactions. In Strengthening Methods in Crystals; Kelly, A., Nicholson, R.B., Eds.; Applied Science Publishers: London, UK, 1965; pp. 9–135. [Google Scholar]
  25. Russell, K.C.; Brown, L.M. Dispersion strengthening model based on differing elastic-moduli applied to IronCopper system. Acta Metall. Mater. 1972, 20, 969–974. [Google Scholar] [CrossRef]
  26. Kolli, R.P.; Seidman, D.N. The temporal evolution of the decomposition of a concentrated multicomponent Fe–Cu-based steel. Acta Mater. 2008, 56, 2073–2088. [Google Scholar] [CrossRef]
  27. Deschamps, A.; Militzer, M.; Poole, W.J. Precipitation kinetics and strengthening of a Fe-0.8 wt% Cu alloy. ISIJ Int. 2001, 41, 196–205. [Google Scholar] [CrossRef]
  28. Monzen, R.; Jenkins, M.L.; Sutton, A.P. The bcc-to-9R martensitic transformation of Cu precipitates and the relaxation process of elastic strains in an Fe-Cu alloy. Philos. Mag. A 2000, 80, 711–723. [Google Scholar] [CrossRef]
  29. Benz, R.; Elliott, J.F.; Chipman, J. Thermodynamics of the carbides in the system Fe- Cr-C. Metall. Trans. 1974, 5, 2235–2240. [Google Scholar] [CrossRef]
  30. Zhao, J.; Yang, G.; Peng, T. Effect of Cu Element on Tempering Resistance of AMS 6308 Steel. Iron Steel 2021, 56, 76–82. (In Chinese) [Google Scholar]
  31. Ashby, M. The theory of the critical shear stress and work hardening of dispersion-hardened crystals. In Metallurgical Society Conference; Ansell, G.S., Cooper, T.D., Lenel, F.V., Eds.; Gordon and Breach: New York, NY, USA, 1968; Volume 47, pp. 143–205. [Google Scholar]
Figure 1. TEM morphologies at different tempering temperatures. (a) 205 °C; (b) 350 °C; (c) 450 °C; (d) energy spectrum at the position indicated by the arrows in (c); (e) 550 °C; (f) 600 °C.
Metals 15 00389 g001
Figure 2. 3-D atom mapping of copper atom distribution after different tempering temperatures. (a) 205 °C; (b) 350 °C; (c) 400 °C; (d) 450 °C; (e) 600 °C; and the measured volumes are 55 × 55 × 417 nm3, 59 × 56 × 222 nm3, 70 × 66 × 353 nm3, 67 × 64 × 153 nm3 and 60 × 60 × 268 nm3, respectively.
Metals 15 00389 g002
Figure 3. The number of Cu-rich atomic clusters and the number of atoms in each cluster.
Metals 15 00389 g003
Figure 4. 3-D atom mapping of copper atom distribution tempered at different temperatures. (a) 450 °C; (b) 600 °C.
Metals 15 00389 g004
Figure 5. FCC structure and Cu-rich phase TEM diffraction spot calibration results. (a) 450 °C; (b) 600 °C.
Metals 15 00389 g005
Figure 6. High-resolution transmission electron microscopy lattice fringe image with a high concentration of copper (Cu-rich). (a) lattice fringe image; (b) IFFT image; (c) position “1”; (d) position “2”; (e) diffraction calibration.
Metals 15 00389 g006
Figure 7. Mechanical properties of 10CrNi2Mo3Cu2V steel at various tempering temperatures. (a) Strength; (b) plastic; (c) hardness; (d) impact absorbing energy.
Metals 15 00389 g007
Figure 8. Impact fracture morphology at various tempering temperatures (SEM images). (a) 205 °C; (b) 350 °C; (c) 450 °C.
Metals 15 00389 g008
Table 1. Chemical composition of 10CrNi2Mo3Cu2 (wt. %).
ElementCSiMnSPCrNiMoVCuFe
Content0.100.900.350.0010.0051.002.183.260.091.90balance
Table 2. Theoretical calculation of the strengthening effect of the bcc Cu-rich phase at 450 °C.
Chemical strengtheningG (MPa)Mb (nm)λ (nm)γ (J/m2) Γ σchem (MPa)
80,0002.750.24822.880.22–0.3624607.9–14.3
Coherent strain strengtheningG (MPa)Mb (nm)λ (nm)r (nm)εσcoh (MPa)
80,0002.750.2481.967 × 10241.45760.005737.6
Modulus strengtheningG (MPa)Mb (nm)λ (nm)Up/Um--σmod (MPa)
80,0002.750.24822.880.9823--115.8
Disclaimer/Publisher’s Note: The statements, opinions and data contained in all publications are solely those of the individual author(s) and contributor(s) and not of MDPI and/or the editor(s). MDPI and/or the editor(s) disclaim responsibility for any injury to people or property resulting from any ideas, methods, instructions or products referred to in the content.