

Hot Deformation Behavior and Optimization of Processing Parameters for 4Cr16MoCu Martensitic Stainless Steel

Abstract
1. Introduction
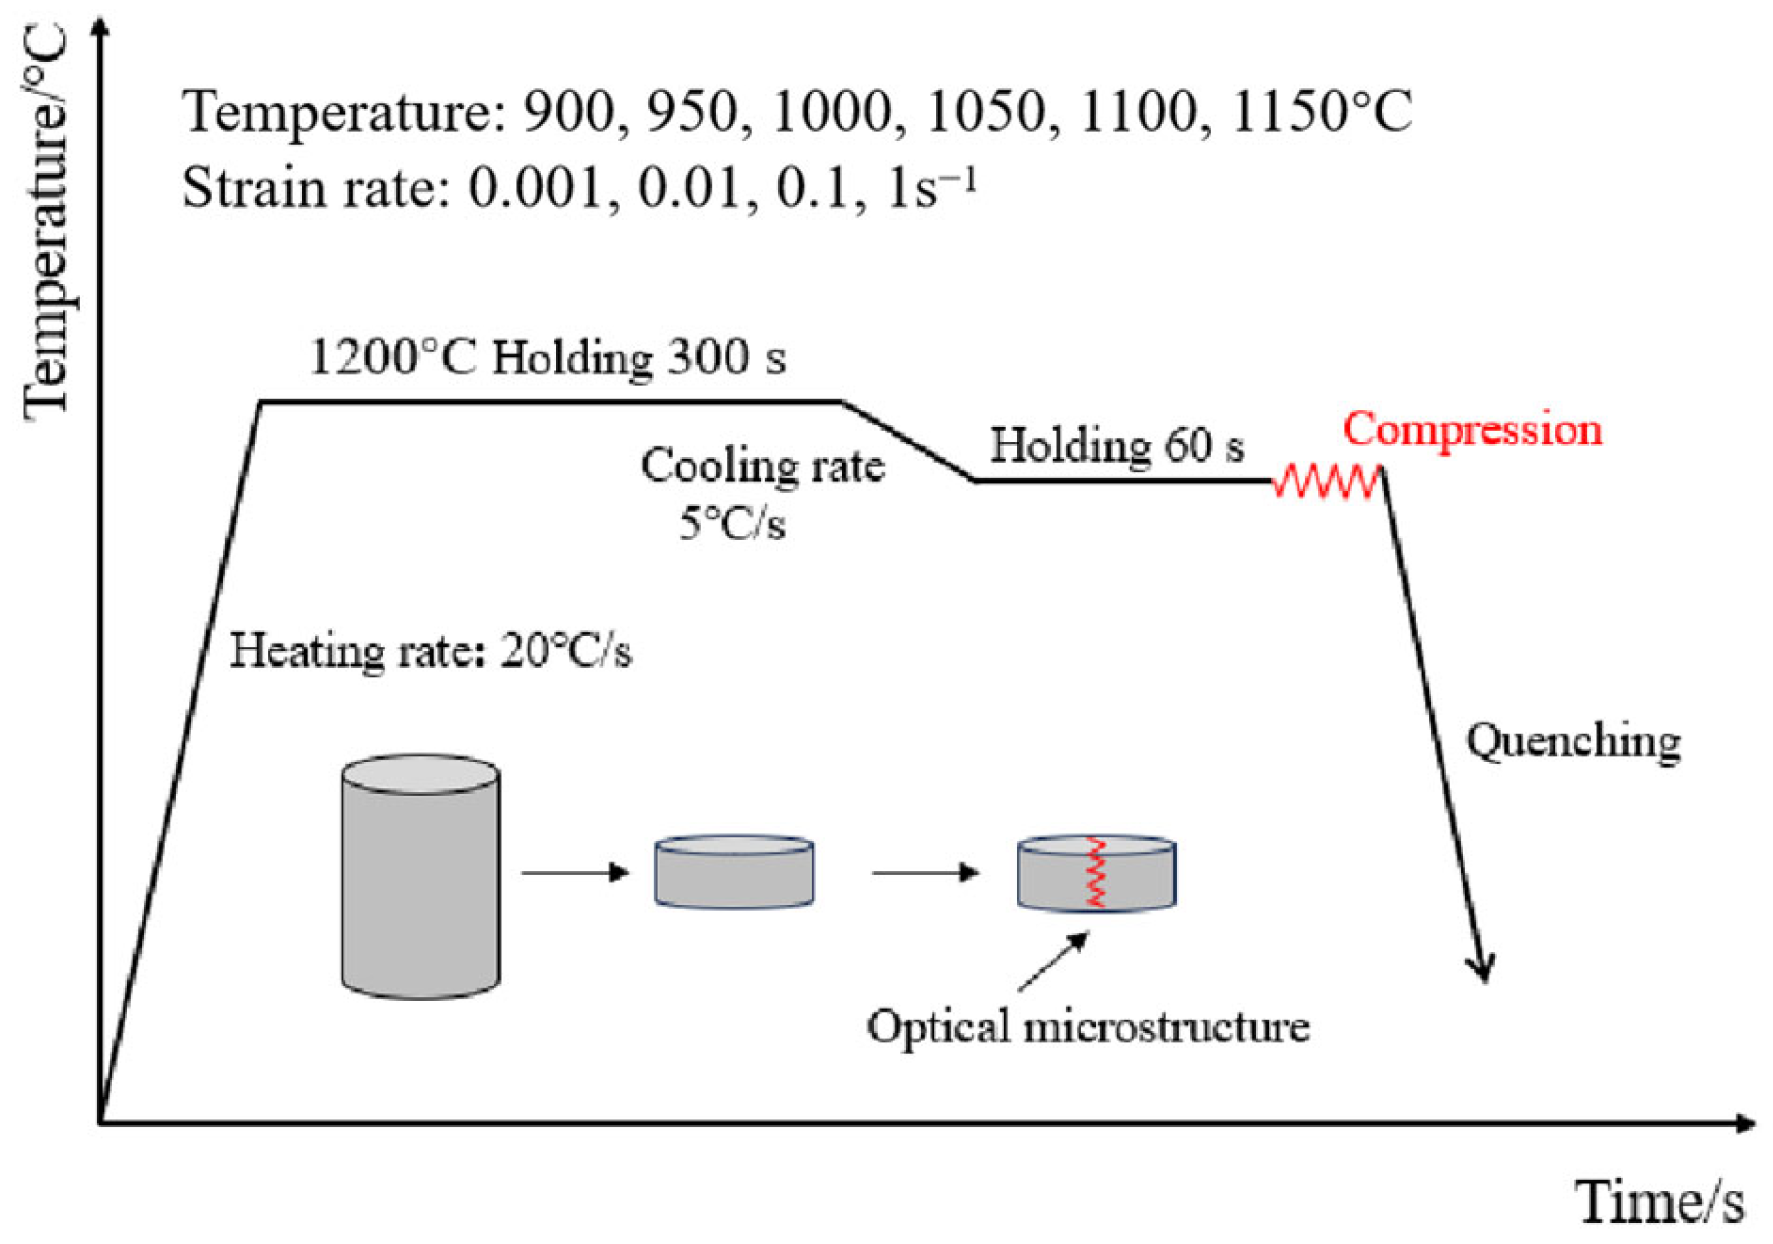
2. Experimental
Material and Experimental Procedures
3. Results and Discussion
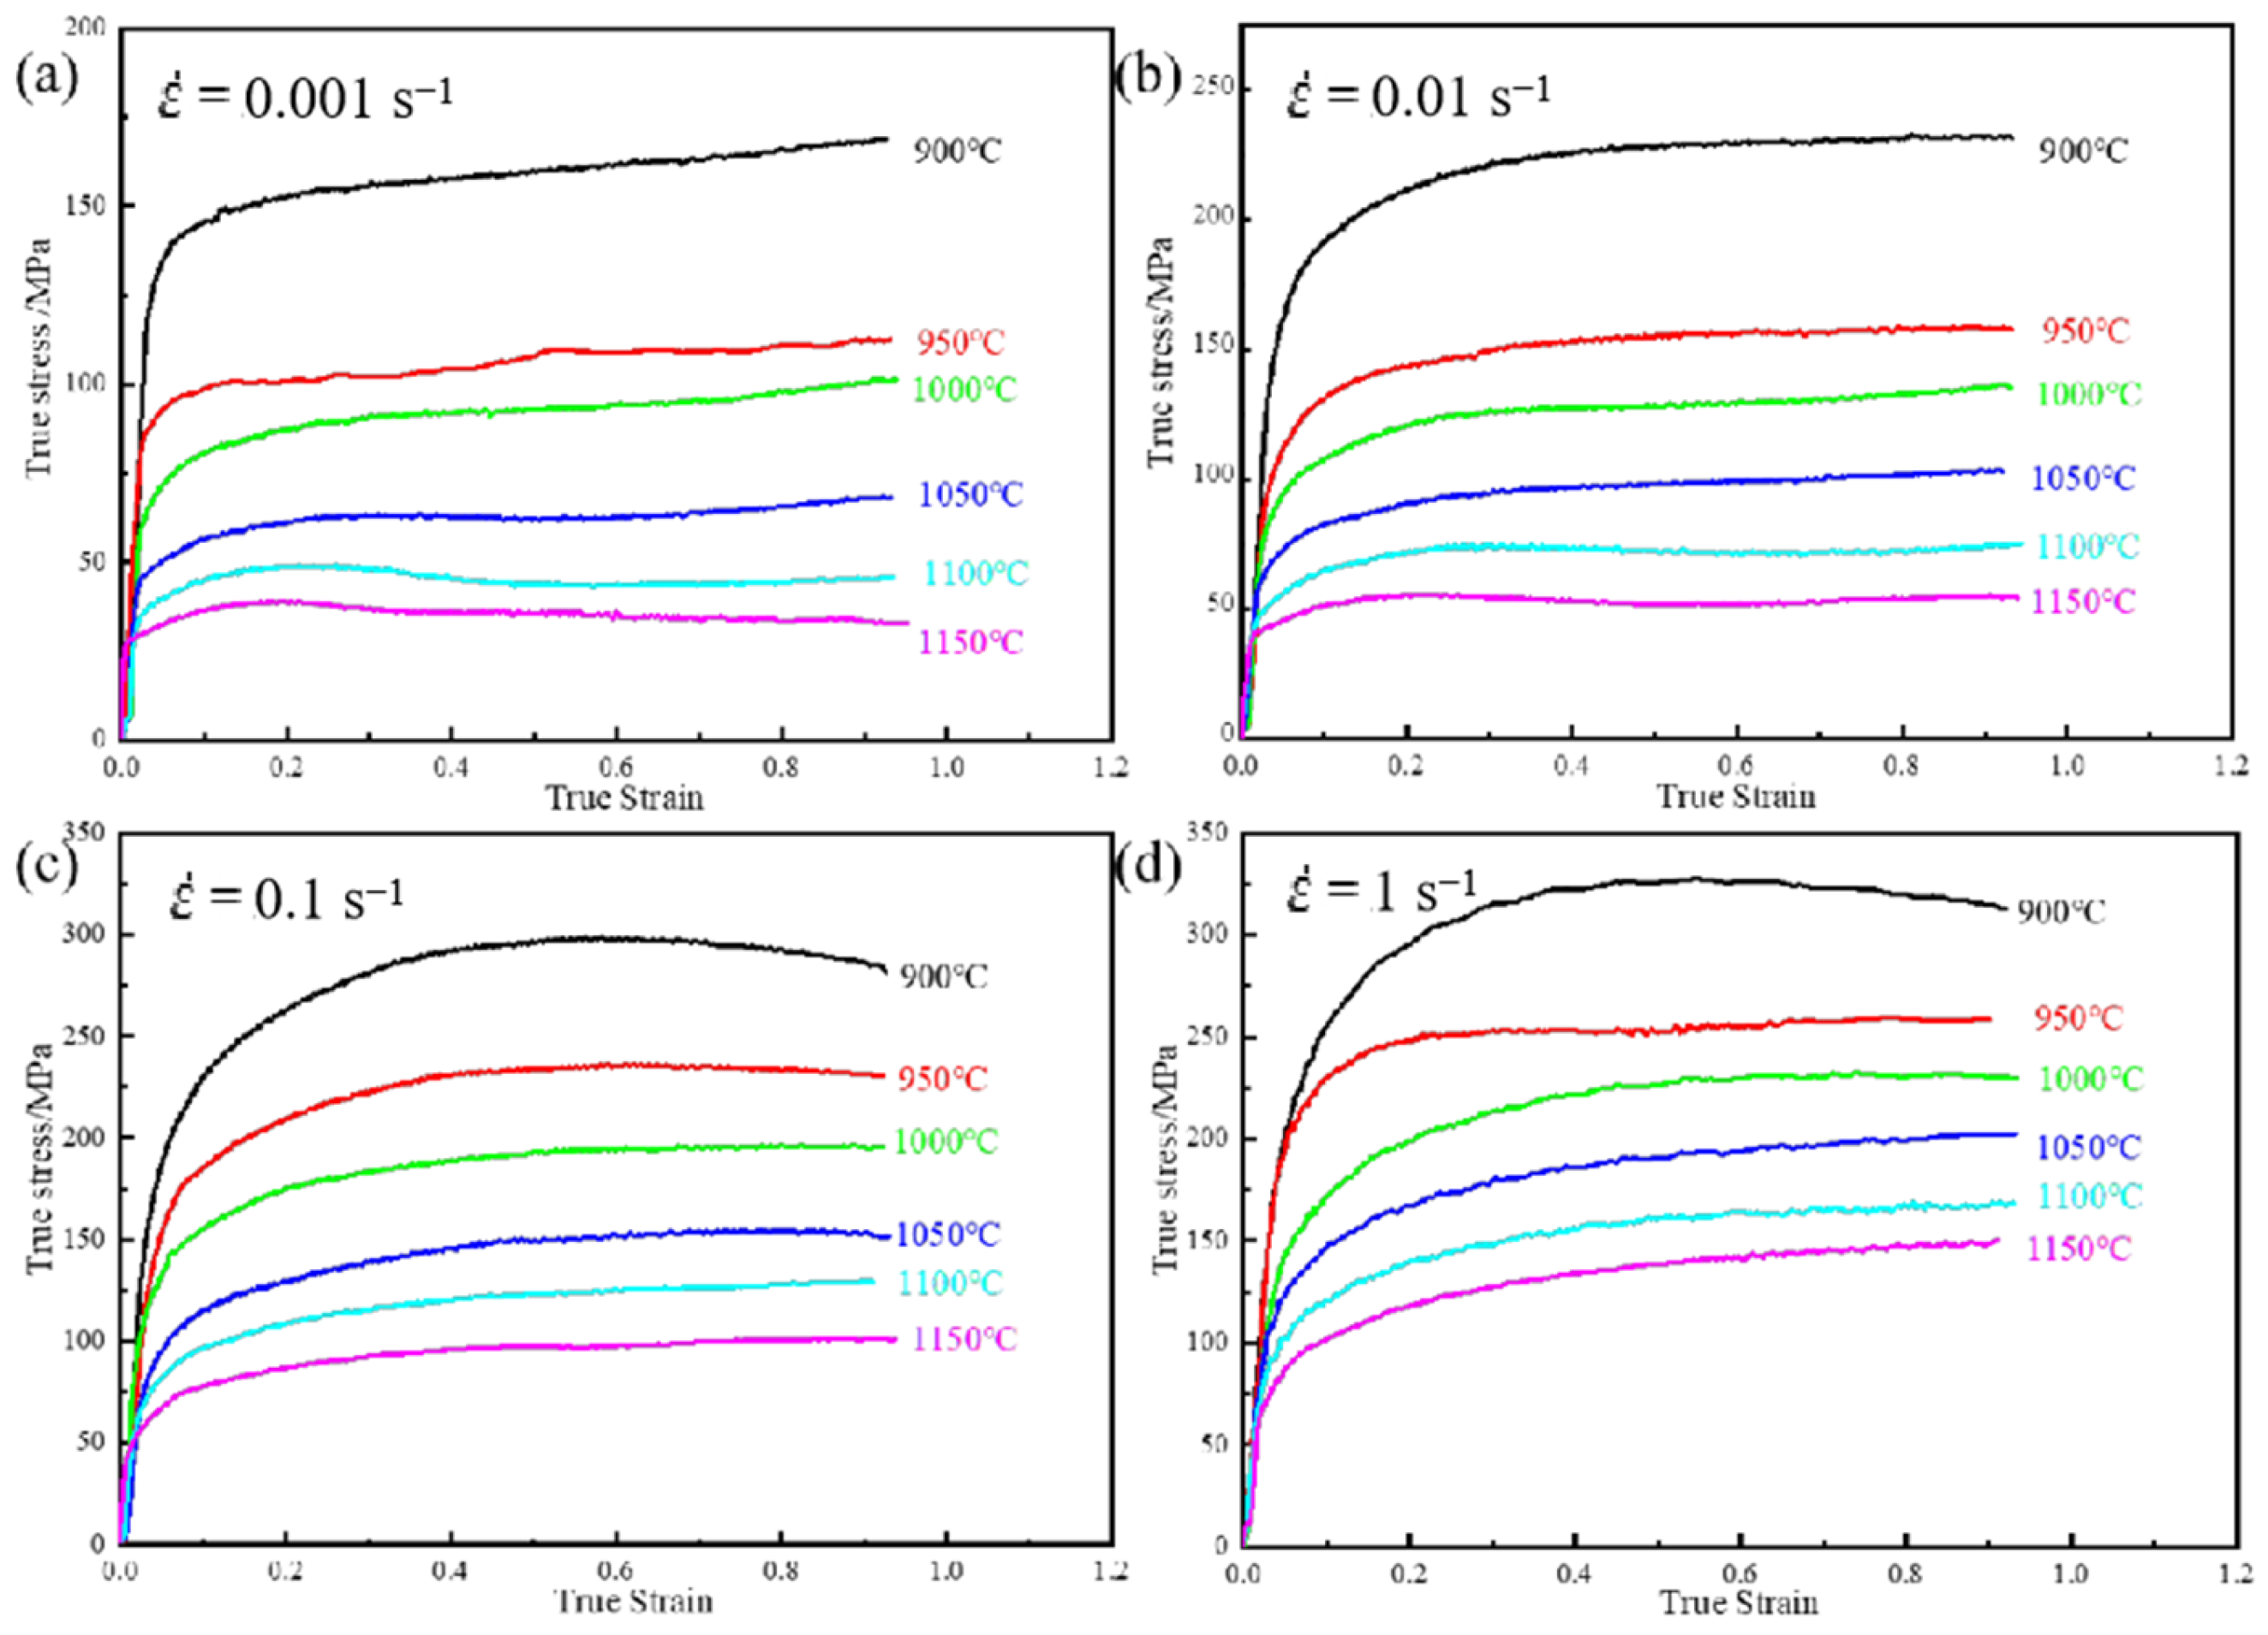
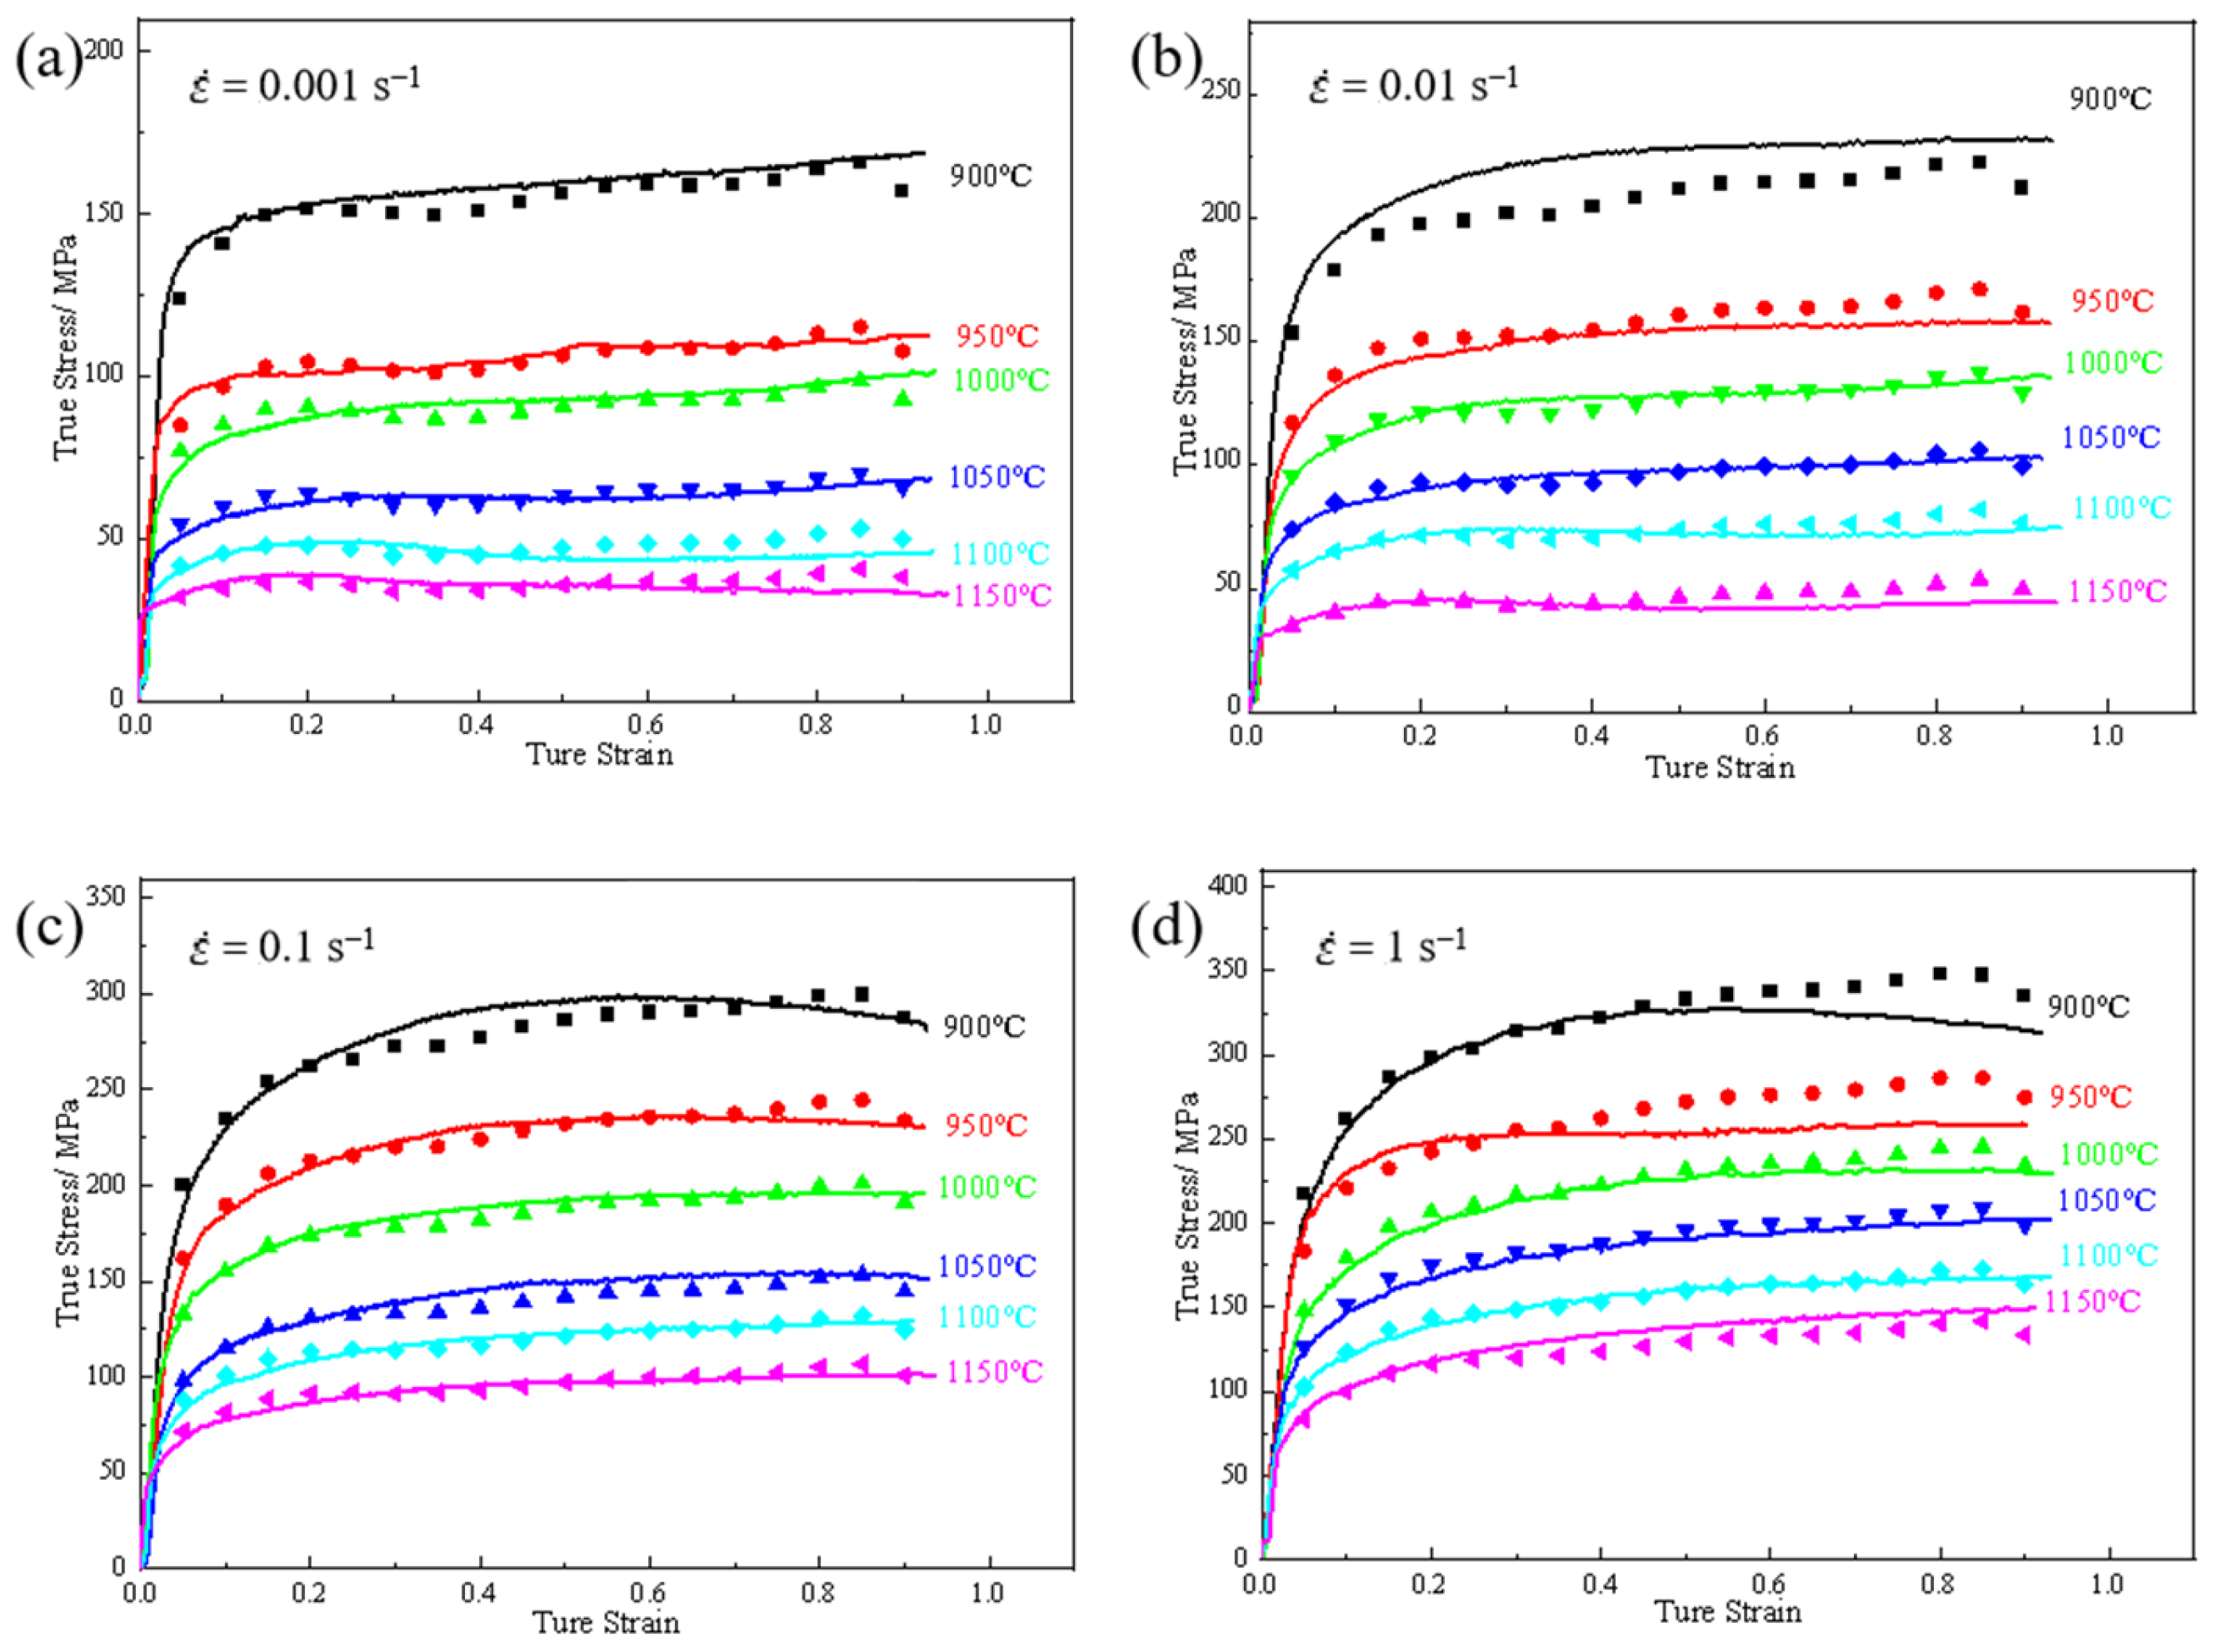
3.1. Hot Deformation Flow Curve
3.2. Constitutive Equation and Hot Deformation Activation Energy
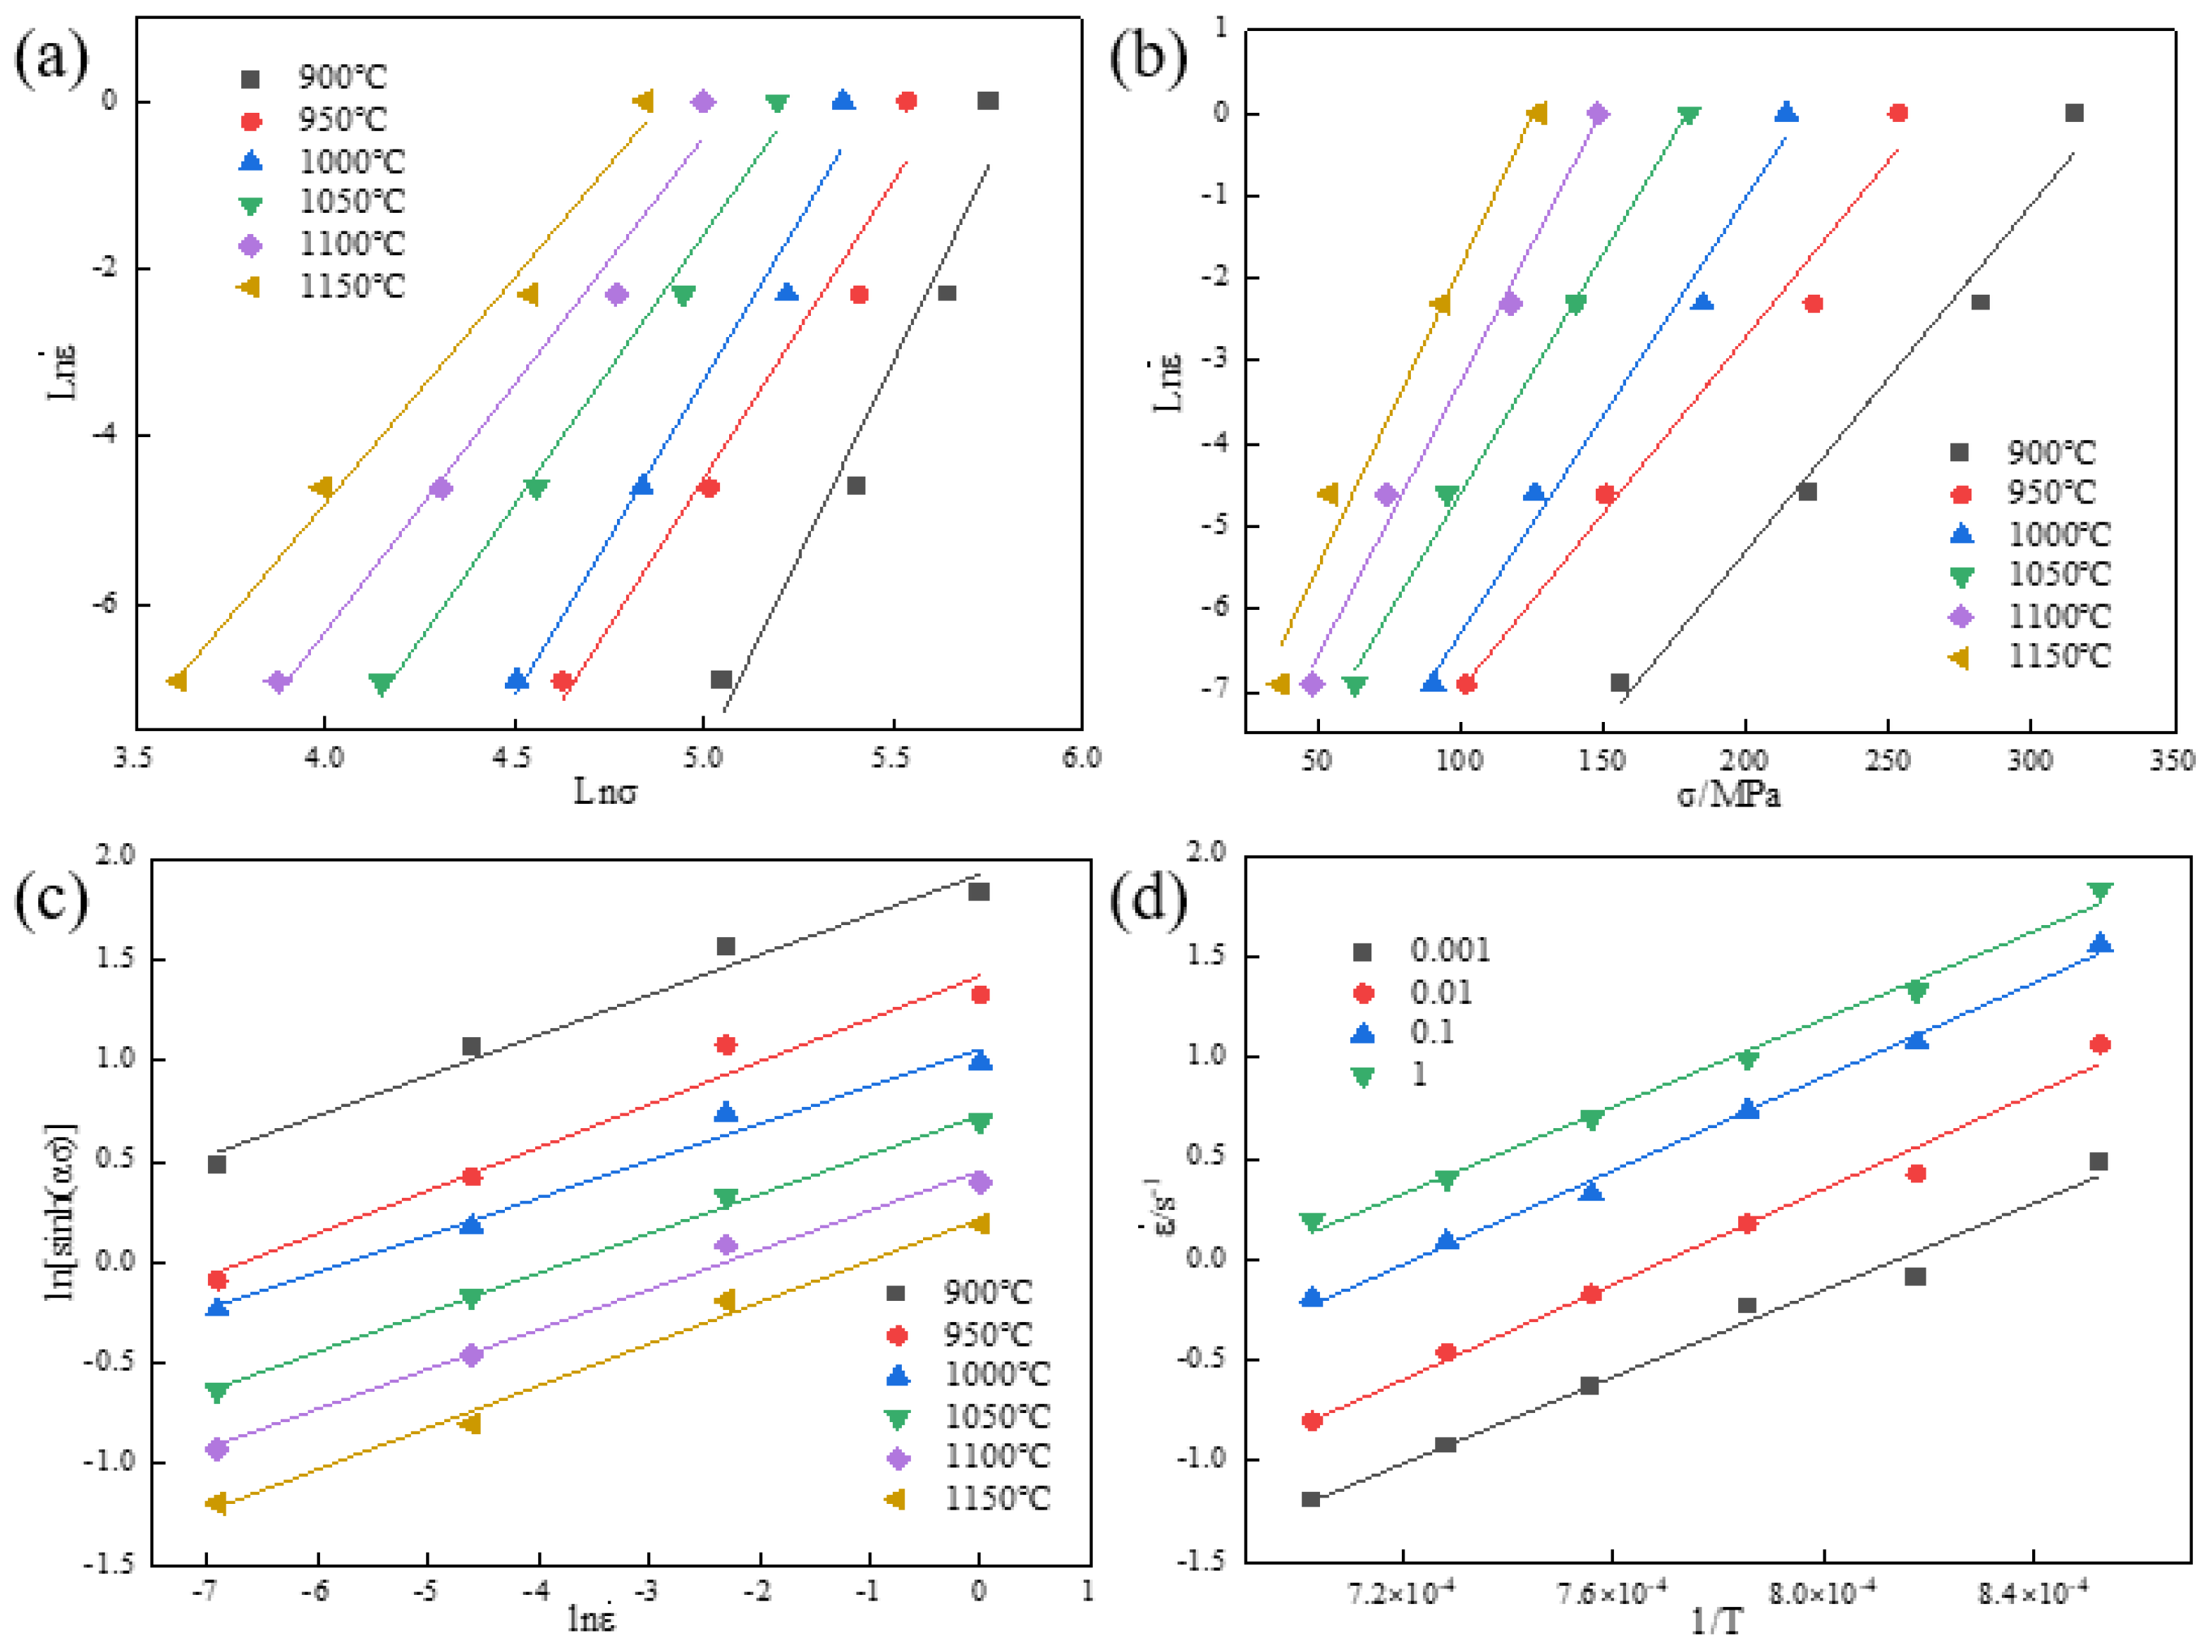
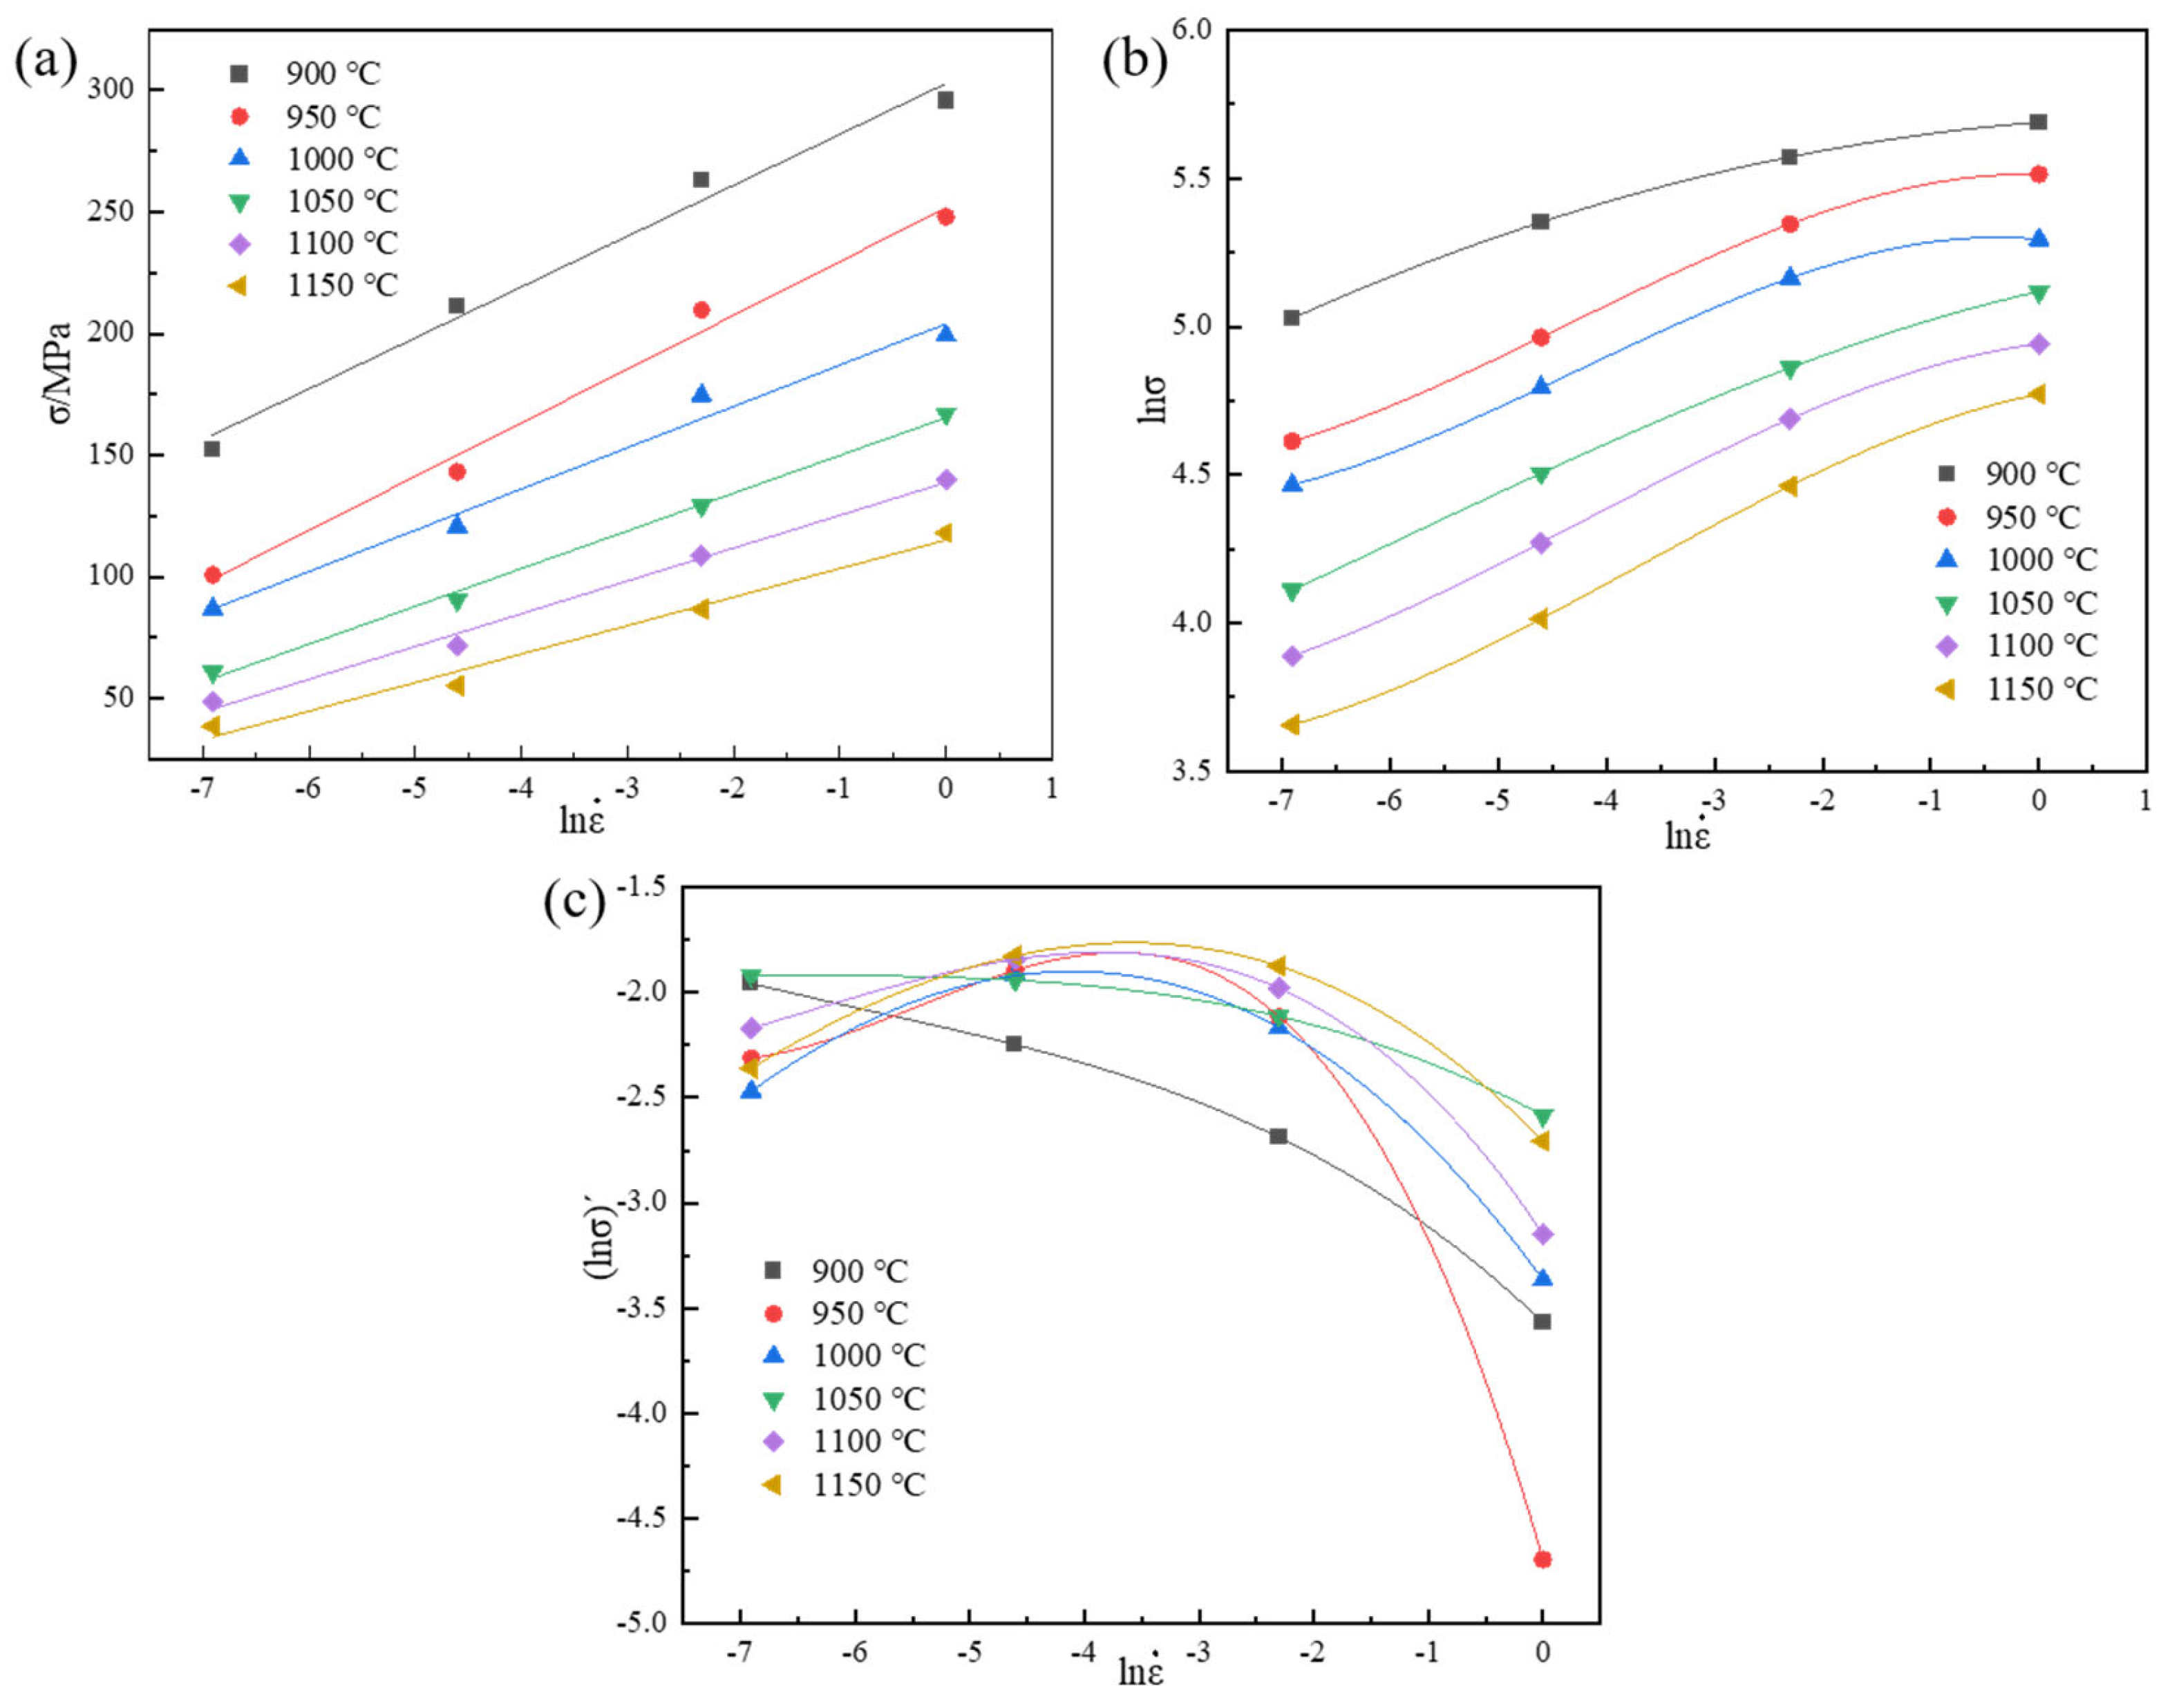
3.2.1. Establishment of Constitutive Equation
- (1)
- Form for low stress levels (ασ < 0.8):
- (2)
- Form for high stress levels (ασ > 1.2):
- (3)
- The fully stress-level form after Sellars’ modification and optimization of the coefficients in the Arrhenius equation based on the hyperbolic sine function:
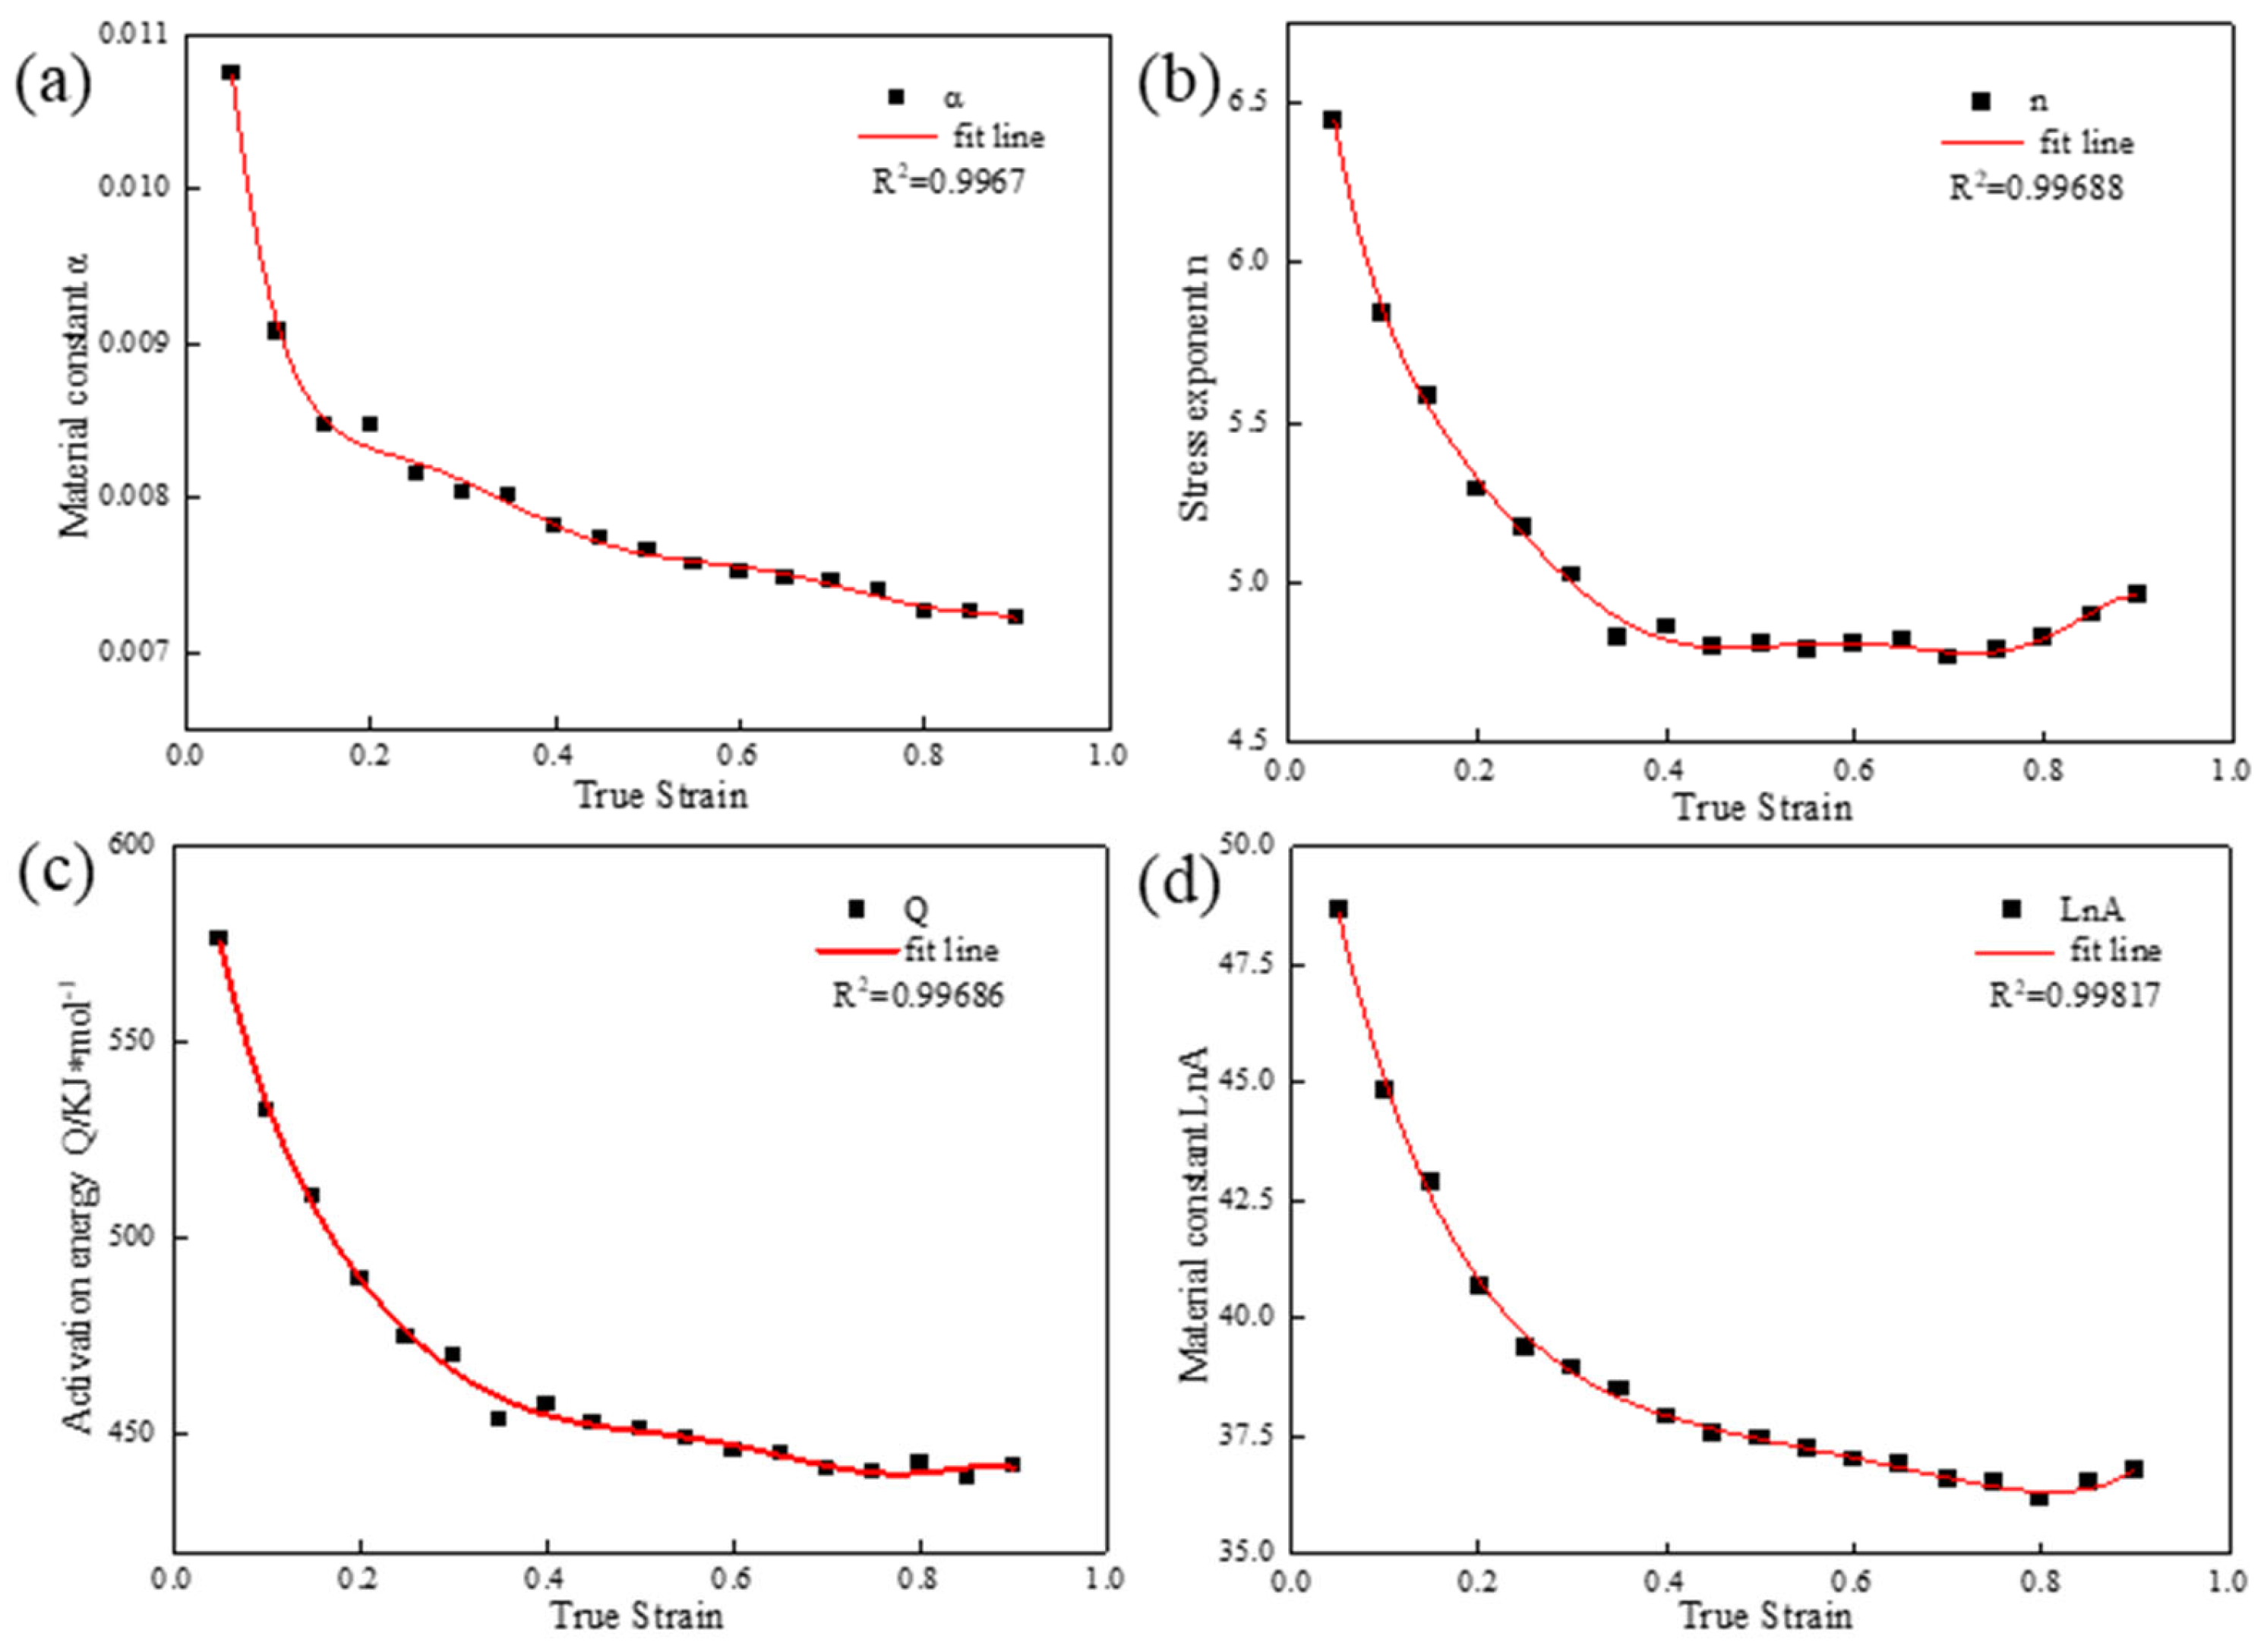
3.2.2. Establishment of Strain-Compensated Model
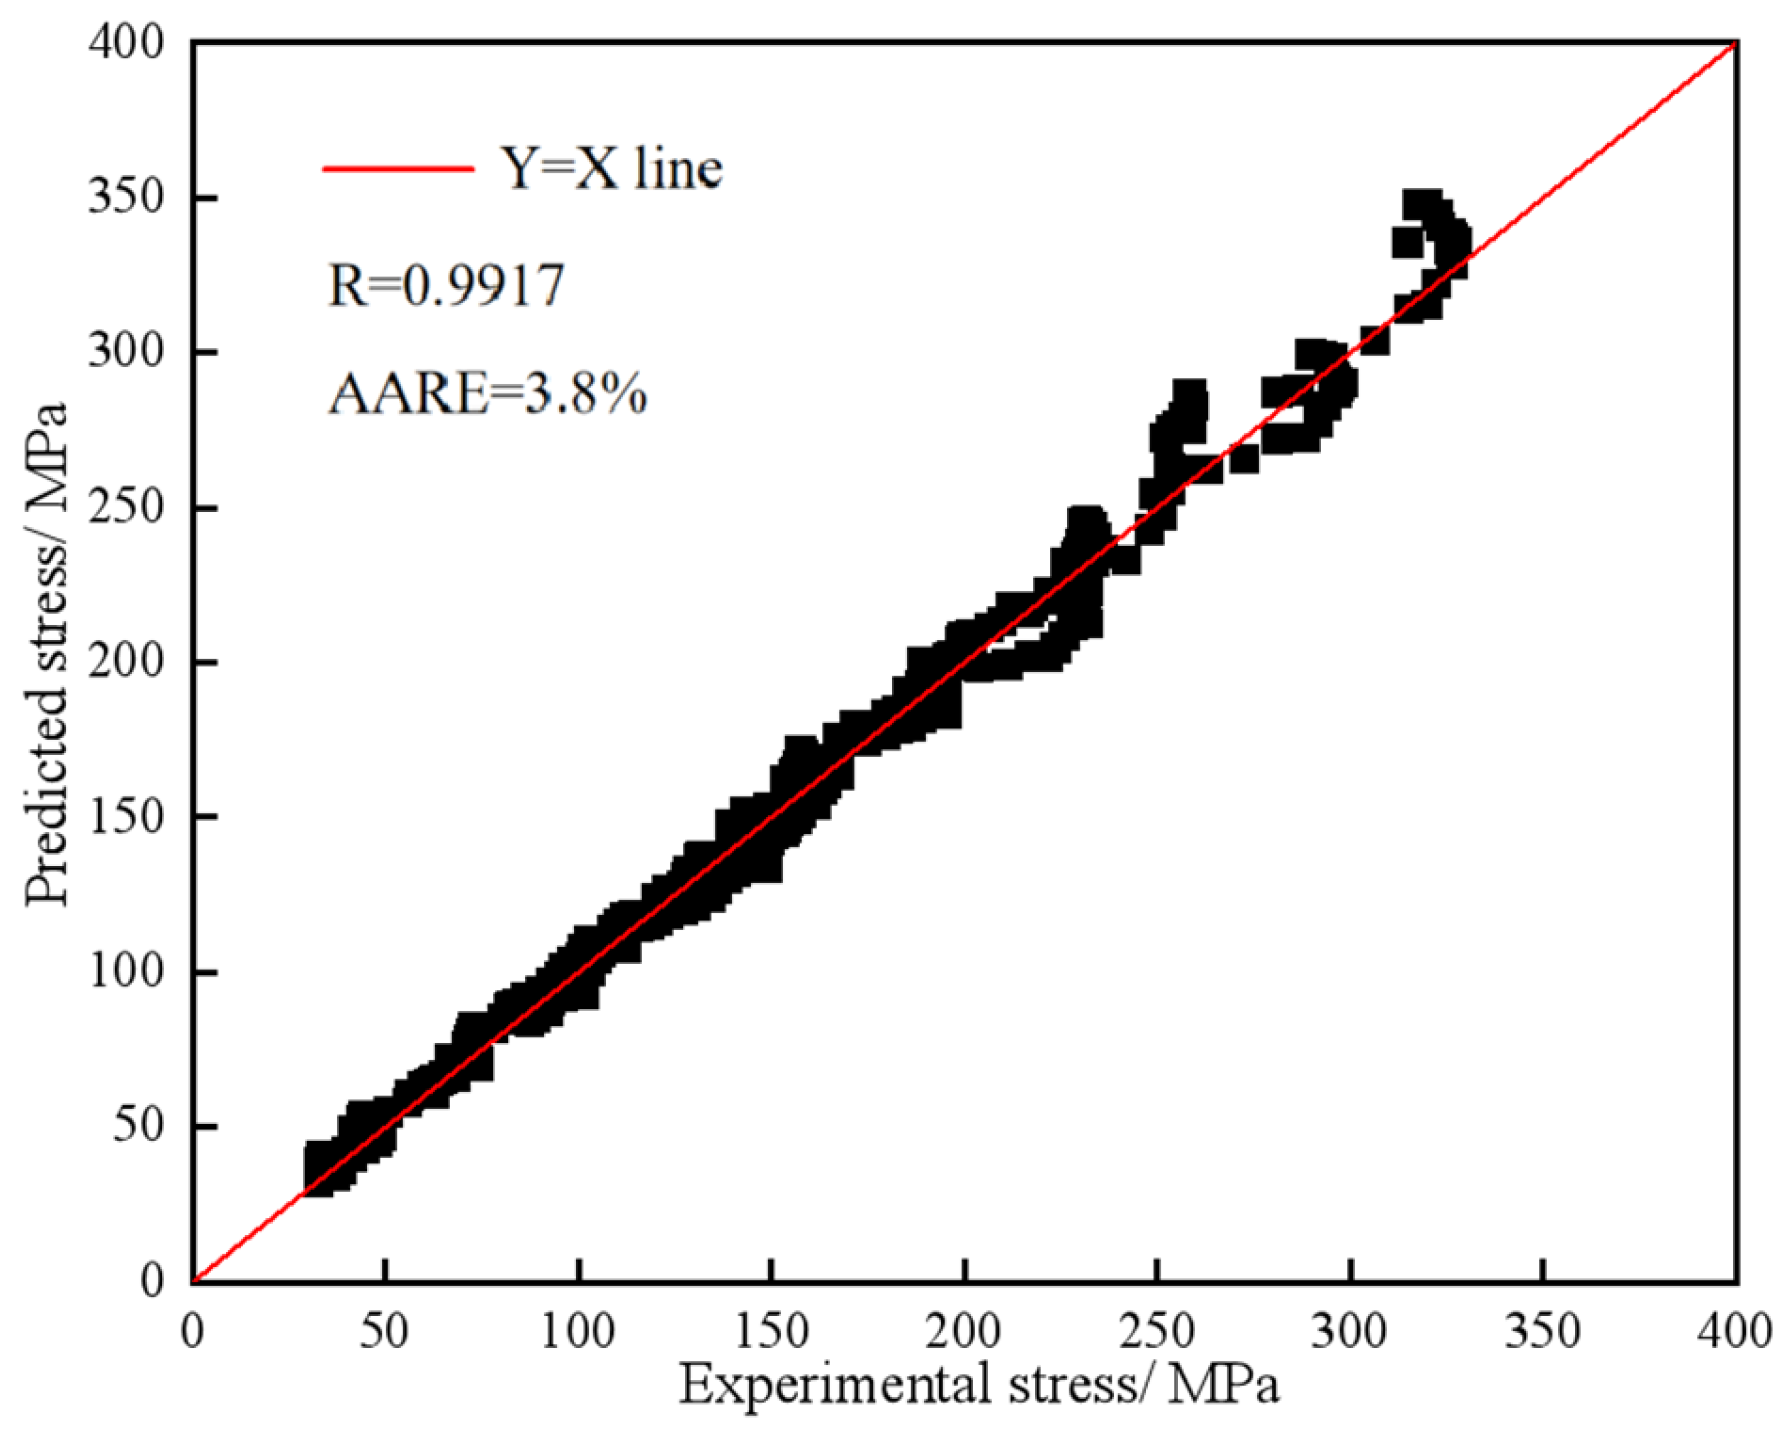
3.2.3. Verification of the Developed Constitutive Model
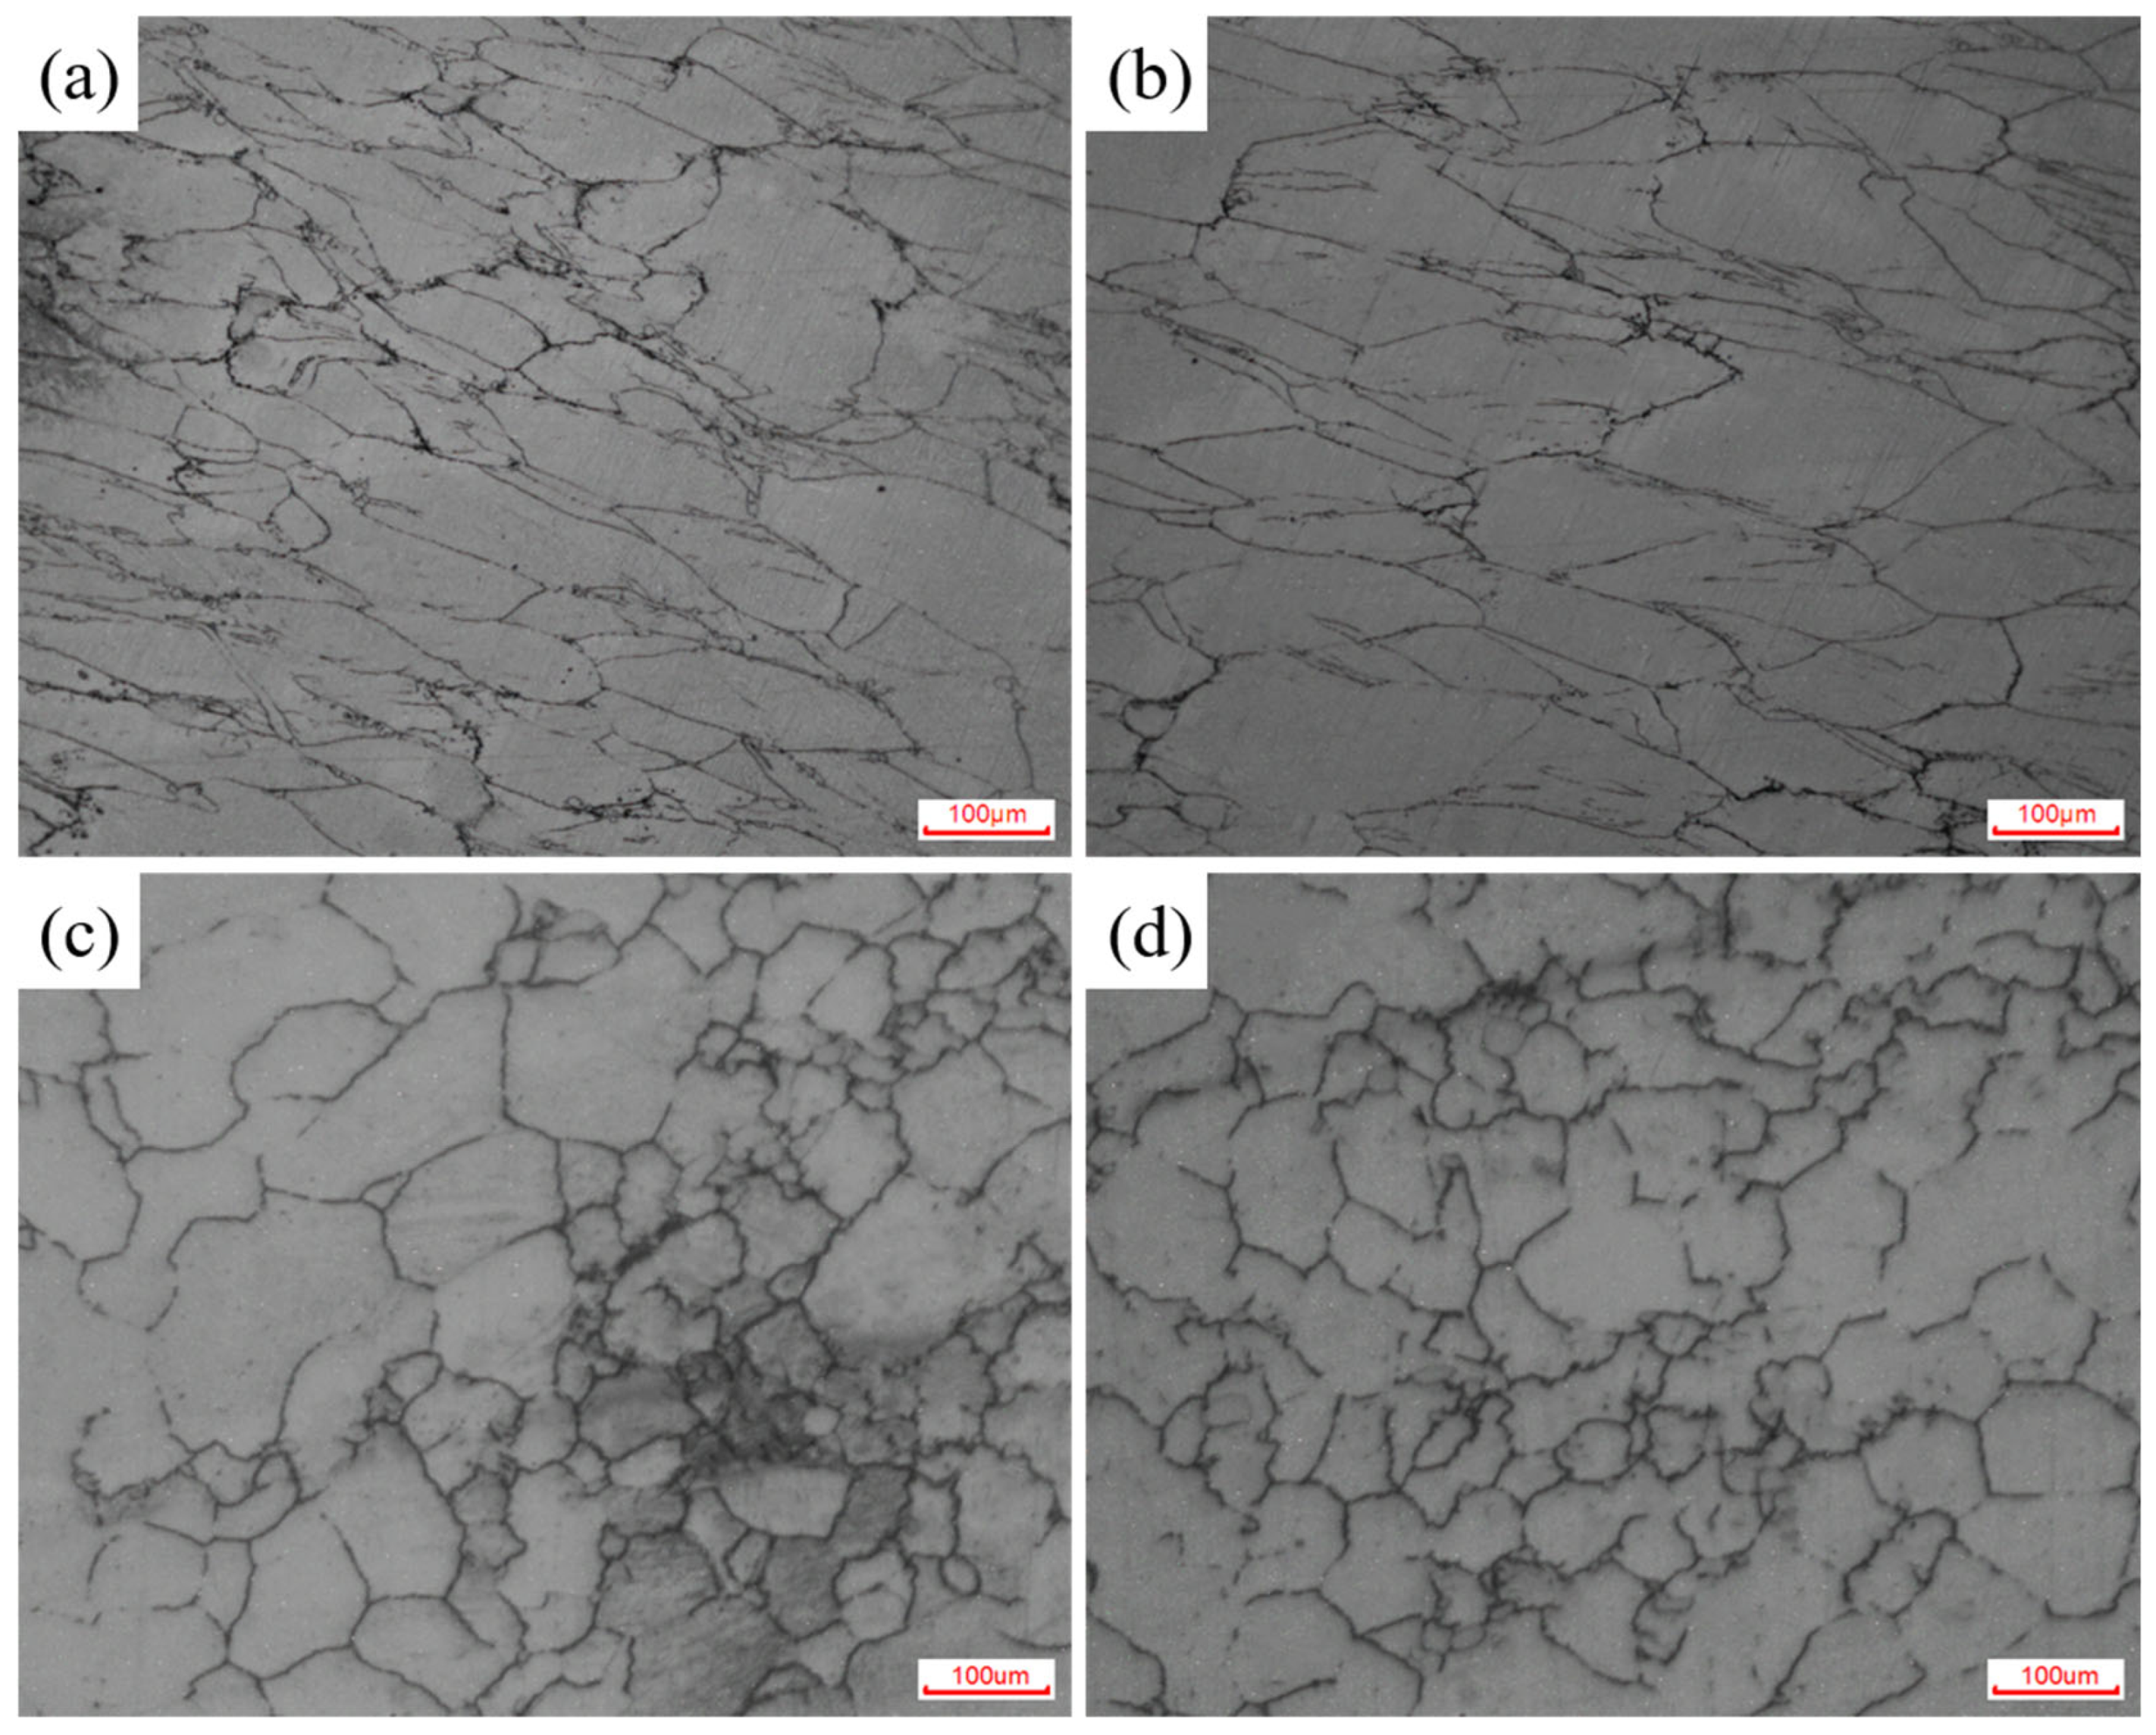
3.3. Effects of Strain on Processing Maps and Microstructural Evolution
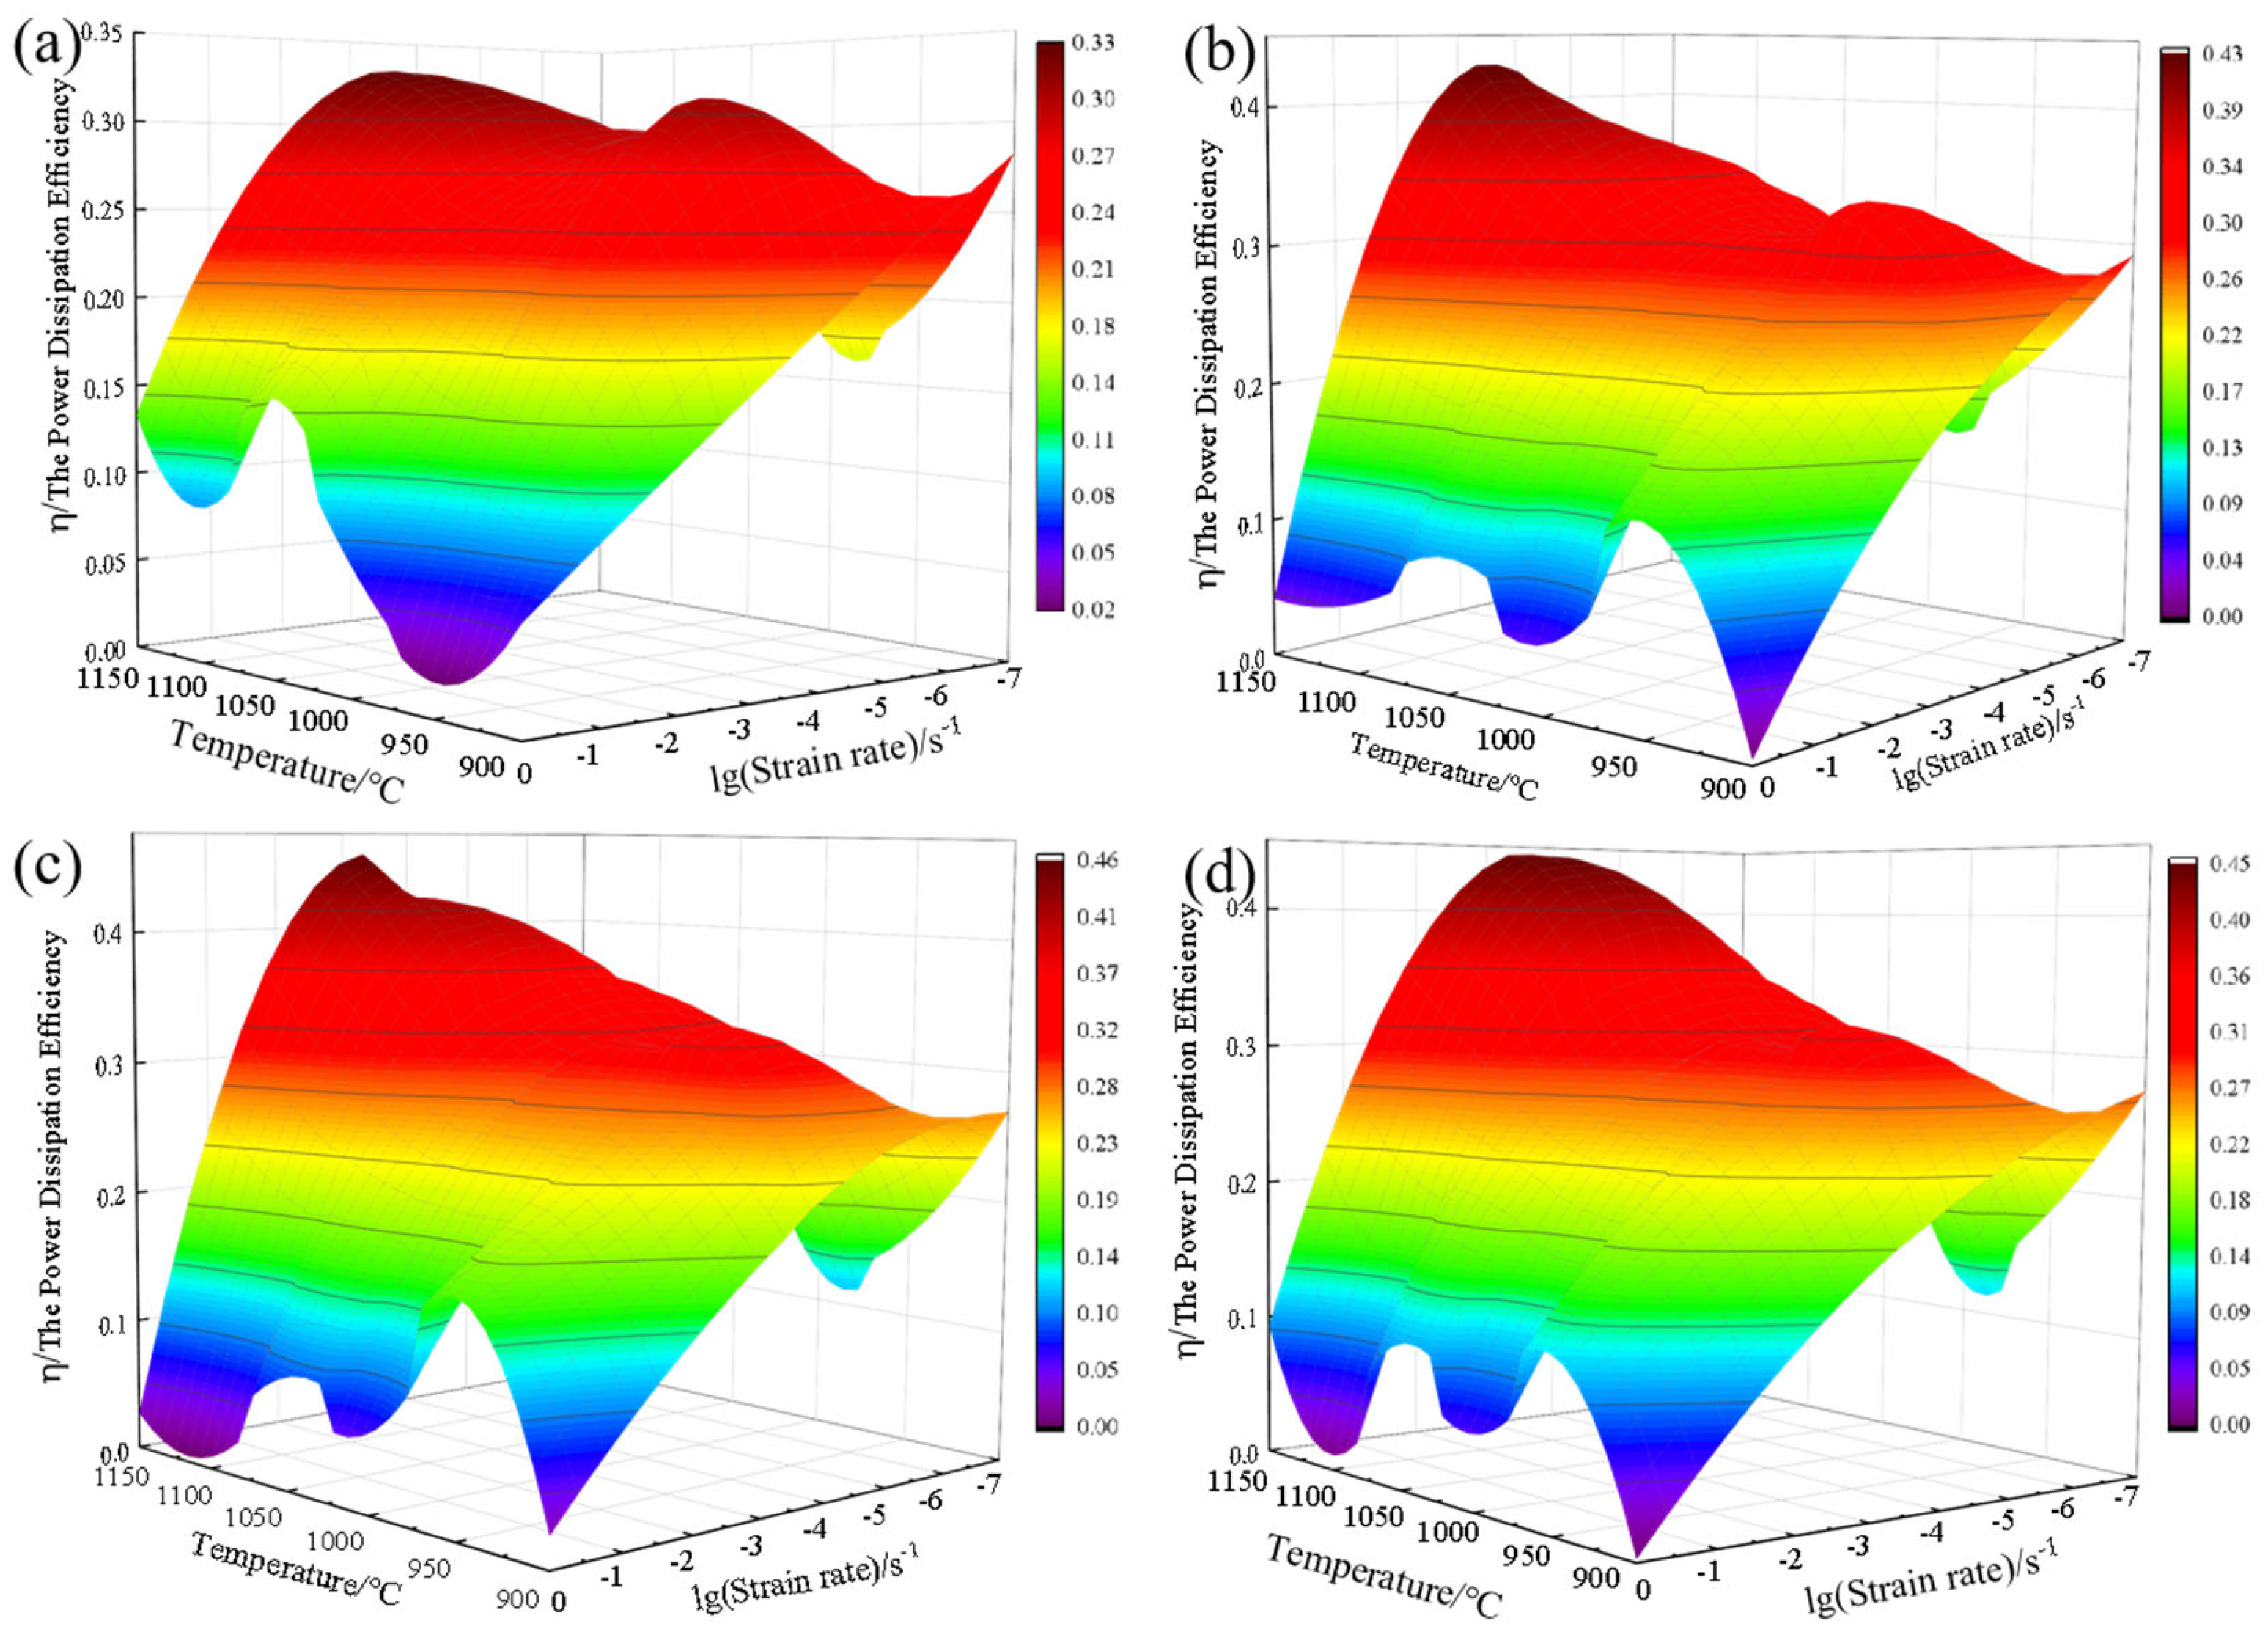
3.3.1. Establishment of Power Dissipation Maps
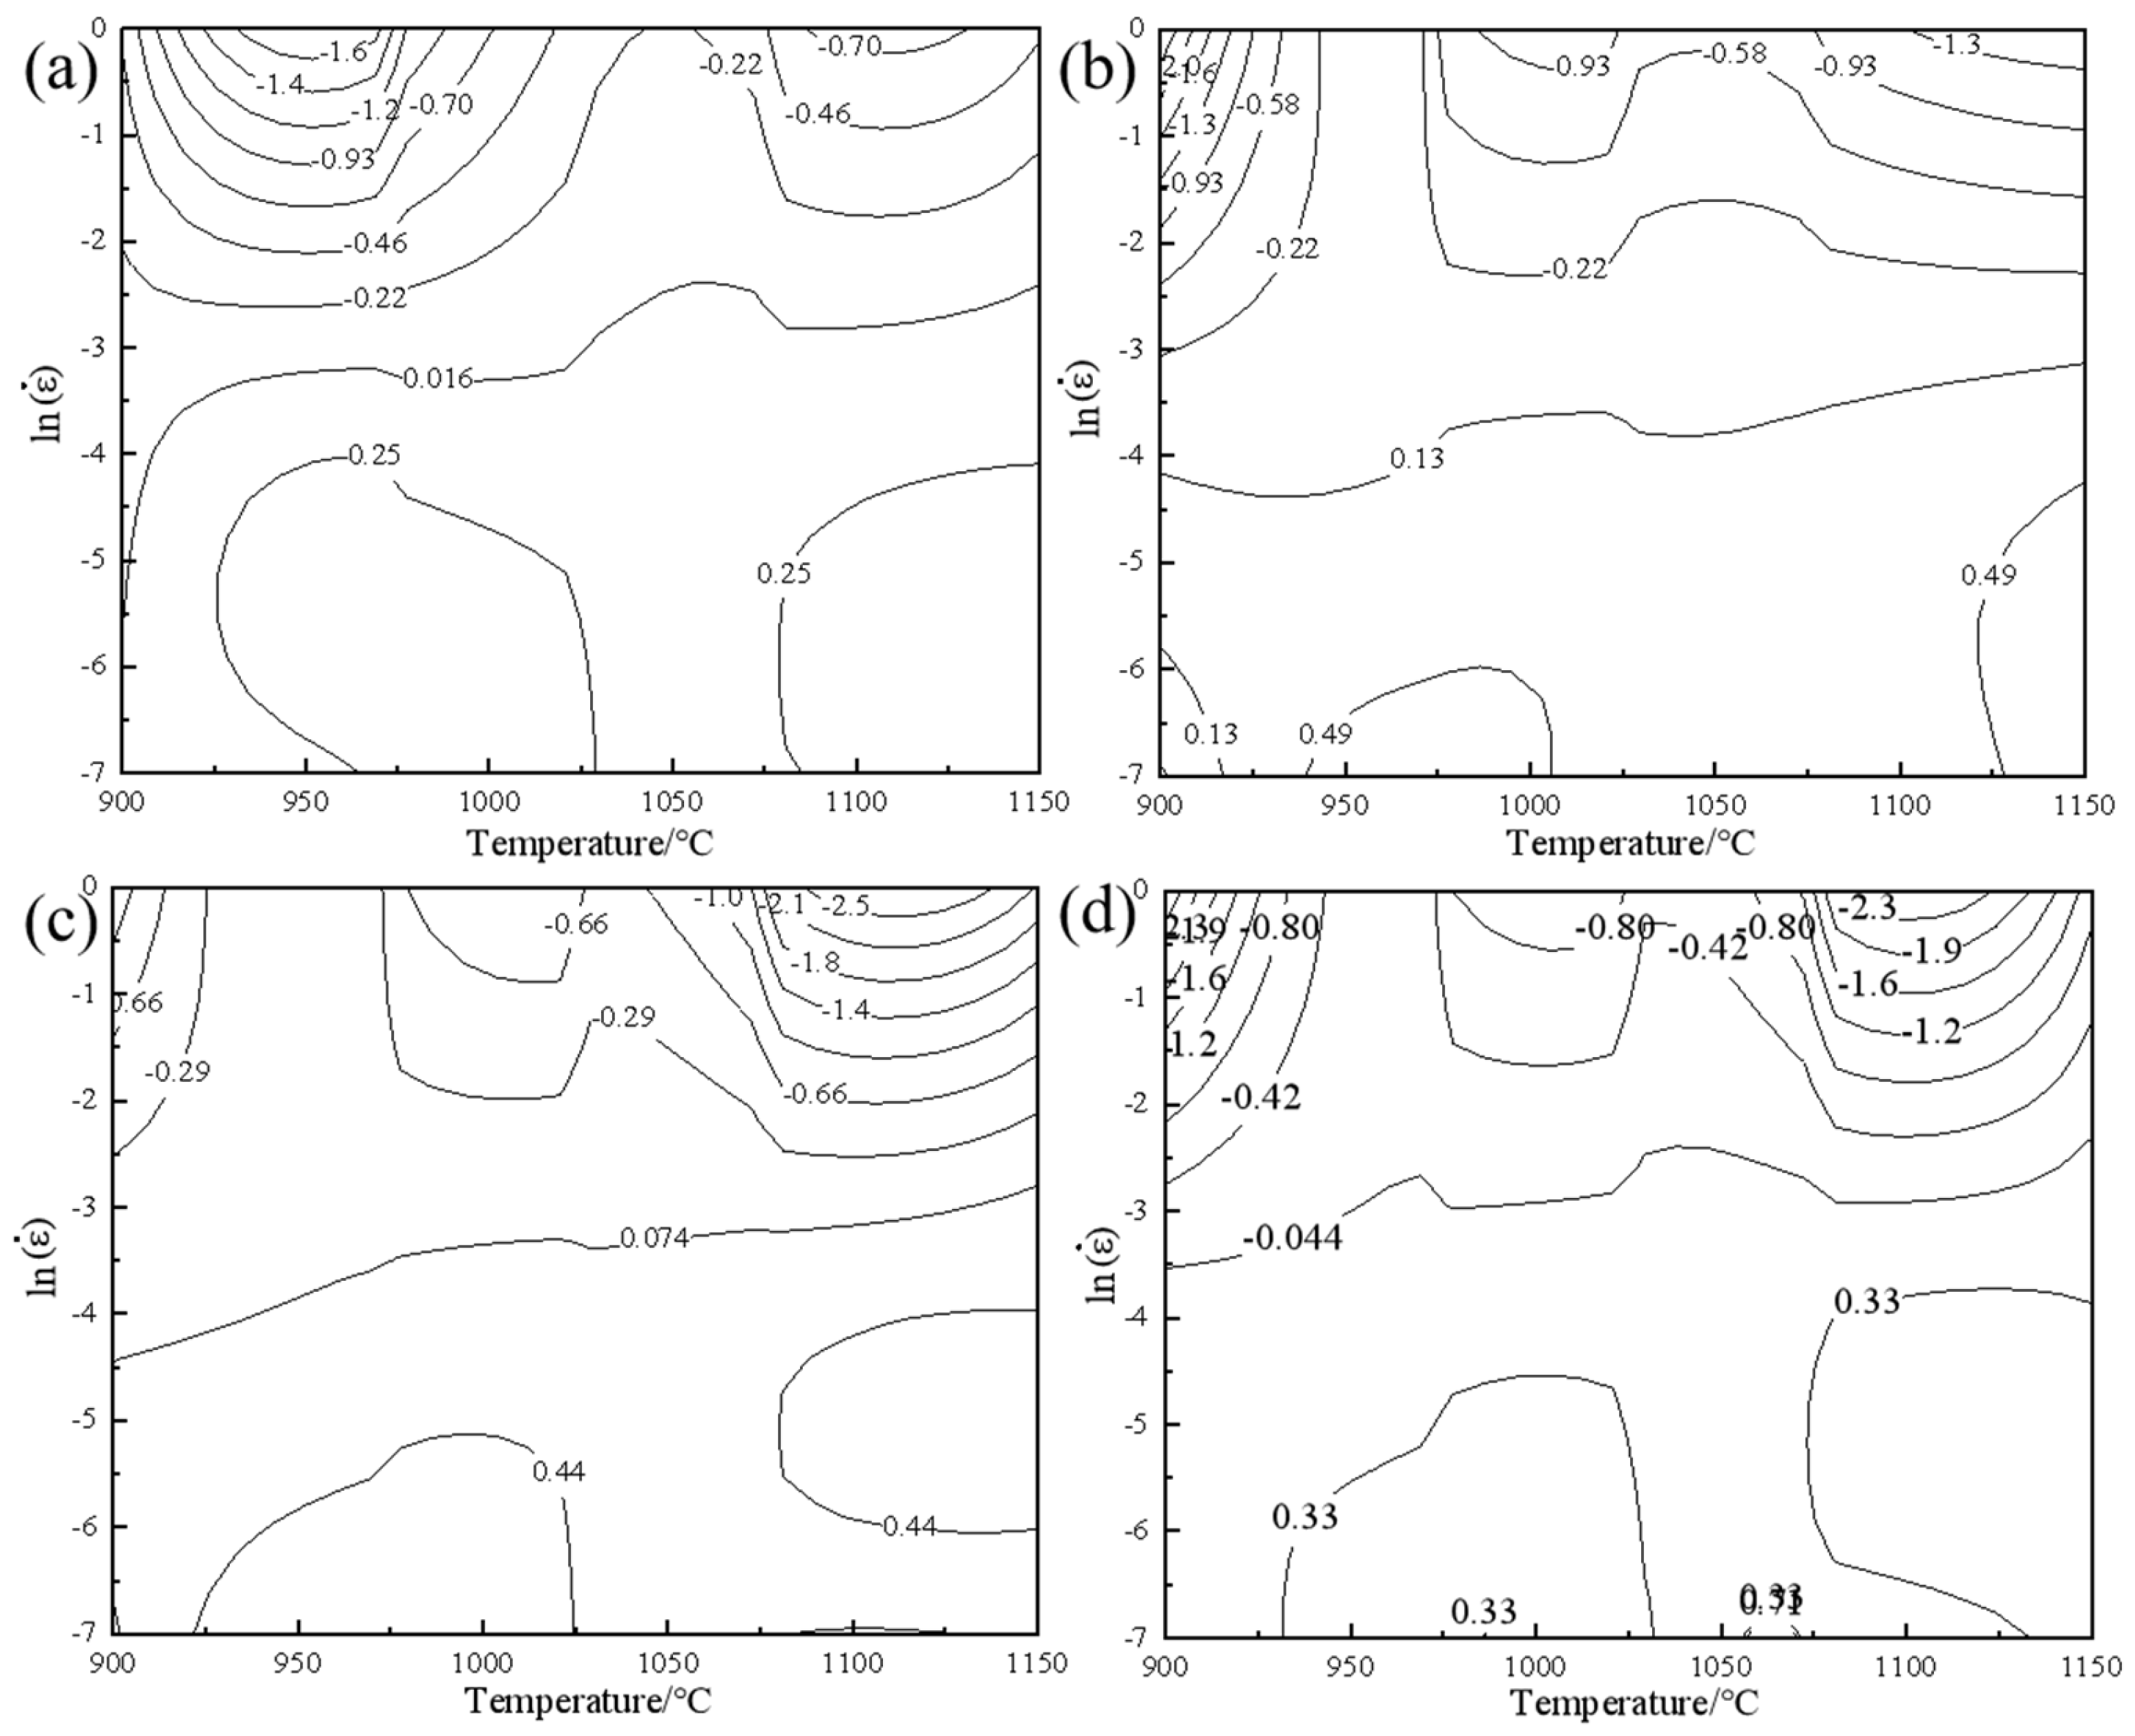
3.3.2. Construction of Instability Maps
4. Conclusions
- The forging temperature range of 4Cr16MoCu stainless steel is relatively narrow. During the forging process, its deformation resistance increases significantly with the rise in deformation rate, exhibiting a pronounced sensitivity to strain rate.
- The Arrhenius model constitutive equation was established using corrected flow stress. The dependence of flow stress on strain rate and temperature during hot difformation can be expressed asThis demonstrates the reliability of the model for practical applications. The findings provide valuable insights into the hot deformation behavior of 4Cr16MoCu steel, and the established equation can serve as a theoretical foundation for optimizing processing parameters in industrial applications.
- Based on the dynamic materials model, a hot processing map for 4Cr16MoCu steel was established, and the optimal hot working process window for 4Cr16MoCu steel was determined in conjunction with microstructural evolution. The optimal conditions include an initial forging temperature of 1125 °C, a final forging temperature of 980 °C, and a strain rate of 0.1 s−1, which result in a fine and uniform grain structure. To avoid uneven deformation, high strain rate areas of 0.18 s−1 and above should be avoided during hot processing.
Author Contributions
Funding
Data Availability Statement
Conflicts of Interest
References
- Bonagani, S.K.; Bathula, V.; Kain, V. Influence of tempering treatment on microstructure and pitting corrosion of 13 wt.% Cr martensitic stainless steel. Corros. Sci. 2018, 131, 340–354. [Google Scholar]
- Anjos, A.D.; Scheuer, C.J.; Brunatto, S.F.; Cardoso, R.P. Low-temperature plasma nitrocarburizing of the AISI 420 martensitic stainless steel: Microstructure and process kinetics. Surf. Coat. Technol. 2015, 275, 51–57. [Google Scholar]
- Zhao, Y.; Liu, W.; Fan, Y.; Zhang, T.; Dong, B.; Chen, L.; Wang, Y. Influence of Microstructure on the Corrosion Behavior of Super 13Cr Martensitic Stainless Steel under Heat Treatment. Mater. Charact. 2021, 175, 111066. [Google Scholar]
- Islam, R.; Islam, J.; Hasan, R.; Hasan, M. Effect of Alloying Element Content, Temperature, and Strain Rate on the Mechanical Behavior of NbTiZrMoV High Entropy Alloy: A Molecular Dynamics Study. Mater. Today Commun. 2024, 40, 110071. [Google Scholar]
- Liu, W.; Liu, W.M.; Ji, H.; Tang, X.; Wang, M.; Song, C.; Yang, X. Hot Deformation Behavior and Hot Working Map of Mn–Cr–Ni–Co Steel for Ball Mill Liner Forging Process. J. Mater. Res. Technol. 2024, 30, 5685–5700. [Google Scholar]
- Li, X.; Duan, L.; Li, J.; Wu, X. Experimental Study and Numerical Simulation of Dynamic Recrystallization Behavior of a Micro-Alloyed Plastic Mold Steel. Mater. Des. 2015, 66, 309–320. [Google Scholar]
- Yang, Y.; Yan, Q.Z.; Ge, C.C. Hot Deformation Behavior of Modified CNS-II F/M Steel. J. Iron Steel Res. Int. 2012, 19, 60–65. [Google Scholar]
- Aghajani Derazkola, H.; Garcia, E.; Murillo-Marrodán, A.; Fernandez, A.C. Review on Modeling and Simulation of Dynamic Recrystallization of Martensitic Stainless Steels during Bulk Hot Deformation. J. Mater. Res. Technol. 2022, 18, 2993–3025. [Google Scholar]
- Momeni, A.; Dehghani, K.; Heidari, M. Modeling the Flow Curve of AISI 410 Martensitic Stainless Steel. J. Mater. Eng. Perform. 2012, 21, 2238–2243. [Google Scholar]
- Dehghan, H.; Abbasi, S.M.; Momeni, A.; Karimi Taheri, A. On the Constitutive Modeling and Microstructural Evolution of Hot Compressed A286 Iron-Base Superalloy. J. Alloys Compd. 2013, 564, 13–19. [Google Scholar]
- Xu, Y.; Liu, J.S.; Jiao, Y.X. Hot Deformation Behavior and Dynamic Recrystallization Characteristics of 12Cr Ultra-Super-Critical Rotor Steel. Metals Mater. Int. 2019, 25, 823–837. [Google Scholar] [CrossRef]
- Jantepa, N.; Siripath, N.; Suranuntchai, S. Predictive Modeling and Optimization of Hot Forging Parameters for AISI 1045 Ball Joints Using Taguchi Methodology and Finite Element Analysis. Metals 2024, 14, 1198. [Google Scholar] [CrossRef]
- Fang, X.R.; Liu, L.; Lu, J.; Gao, Y. Optimization of Forging Process Parameters and Prediction Model of Residual Stress of Ti-6Al-4V Alloy. Adv. Mater. Sci. Eng. 2021, 1, 3105470. [Google Scholar] [CrossRef]
- Kitayama, S. Technical Review on Design Optimization in Forging. Int. J. Adv. Manuf. Technol. 2024, 132, 4161–4189. [Google Scholar] [CrossRef]
- Sellars, C.M.; McTegart, W.J. On the Mechanism of Hot Deformation. Acta Metall. 1966, 14, 1136–1143. [Google Scholar] [CrossRef]
- Jonas, J.J.; Sellars, C.M.; Tegart, W.J.M. Strength and Structure under Hot-Working Conditions. Metall. Rev. 1969, 14, 1–24. [Google Scholar] [CrossRef]
- Wang, Y.; Peng, J.; Zhong, L.; Pan, F. Modeling and Application of Constitutive Model Considering the Compensation of Strain During Hot Deformation. J. Alloys Compd. 2016, 681, 455–470. [Google Scholar] [CrossRef]
- Wu, H.; Wen, S.P.; Huang, H.; Wu, X.L.; Gao, K.Y.; Wang, W.; Nie, Z.R. Hot Deformation Behavior and Constitutive Equation of a New Type Al–Zn–Mg–Er–Zr Alloy during Isothermal Compression. Mater. Sci. Eng. A 2016, 651, 415–424. [Google Scholar] [CrossRef]
- Babu, K.A.; Mandal, S.; Athreya, C.N.; Shakthipriya, B.; Sarma, V.S. Hot Deformation Characteristics and Processing Map of a Phosphorous Modified Super Austenitic Stainless Steel. Mater. Des. 2017, 115, 262–275. [Google Scholar] [CrossRef]
- Park, S.Y.; Kim, W.J. Difference in the Hot Compressive Behavior and Processing Maps between the As-Cast and Homogenized Al-Zn-Mg-Cu (7075) Alloys. J. Mater. Sci. Technol. 2016, 32, 660–670. [Google Scholar] [CrossRef]
- Mukherjee, T.; Gao, M.; Palmer, T.A.; DebRoy, T. Keyhole Mode Wobble Laser Welding of a Nickel Base Superalloy—Modeling, Experiments, and Process Maps. J. Manuf. Process. 2023, 106, 465–479. [Google Scholar]
- Fuh, Y.-K.; Shih, J.-K.; Saputro, I.E.; Chen, C.-P.; Huang, C.-F.; Ku, H.-Y.; Chan, C.-W. Preform Design with Increased Materials Utilization and Processing Map Analysis for Aluminum Hot Forging Process. J. Manuf. Process. 2023, 90, 14–27. [Google Scholar]
- Younas, M.; Jaffery, S.H.I.; Khan, A.; Khan, M. Development and Analysis of Tool Wear and Energy Consumption Maps for Turning of Titanium Alloy (Ti6Al4V). J. Manuf. Process. 2021, 62, 613–622. [Google Scholar]
- Momeni, A.; Dehghani, K. Characterization of Hot Deformation Behavior of 410 Martensitic Stainless Steel Using Constitutive Equations and Processing Maps. Mater. Sci. Eng. A 2010, 527, 5467–5473. [Google Scholar]
- Derazkola, H.A.; García Gil, E.; Murillo-Marrodán, A.; Méresse, D. Review on Dynamic Recrystallization of Martensitic Stainless Steels during Hot Deformation: Part I—Experimental Study. Metals 2021, 11, 572. [Google Scholar] [CrossRef]
- Kondo, Y. Behaviour of Copper during High-Temperature Oxidation of Steel Containing Copper. ISIJ Int. 2004, 44, 1576–1580. [Google Scholar]
- Yin, L.; Balaji, S.; Sridhar, S. Effects of Nickel on the Oxide/Metal Interface Morphology and Oxidation Rate During High-Temperature Oxidation of Fe–Cu–Ni Alloys. Metall. Mater. Trans. B 2010, 41, 598–611. [Google Scholar]
- Zhou, X.; Wang, M.; Fu, Y.; Wang, Z.; Li, Y.; Yang, S.; Zhao, H.; Li, H. Effect of Borides on Hot Deformation Behavior and Microstructure Evolution of Powder Metallurgy High Borated Stainless Steel. Mater. Charact. 2017, 124, 182–191. [Google Scholar]
- Wang, R.; Zhang, W.; Li, Y.; Li, D.; Kang, Y.; Yang, X.; Eckert, J.; Yan, Z. Stress-Strain Behavior and Microstructural Evolution of Ultra-High Carbon Fe-C-Cr-V-Mo Steel Subjected to Hot Deformation. Mater. Charact. 2021, 171, 110746. [Google Scholar]
- Lin, Y.C.; Li, L.T.; Xia, Y.C.; Jiang, Y.Q. Hot Deformation and Processing Map of a Typical Al–Zn–Mg–Cu Alloy. J. Alloys Compd. 2013, 550, 438–445. [Google Scholar]
- Mirzadeh, H.; Najafizadeh, A.; Moazeny, M. Flow Curve Analysis of 17-4 PH Stainless Steel under Hot Compression Test. Metall. Mater. Trans. A 2009, 40, 2950–2958. [Google Scholar]
- Wang, M.; Wang, R.; Wang, G.; Meng, L. Hot Behavior of Supercritical Martensitic Stainless Steel at Elevated Temperature. J. Cent. South Univ. 2017, 48, 1448–1457. [Google Scholar]
- Chegini, M.; Aboutalebi, M.R.; Seyedein, S.H.; Ebrahimi, G.R.; Jahazi, M. Study on Hot Deformation Behavior of AISI 414 Martensitic Stainless Steel Using 3D Processing Map. J. Manuf. Process. 2020, 56, 916–927. [Google Scholar]
- Ding, S.; Khan, S.A.; Yanagimoto, J. Constitutive Descriptions and Microstructure Evolution of Extruded A5083 Aluminum Alloy during Hot Compression. Mater. Sci. Eng. A 2018, 728, 133–143. [Google Scholar]
- Lin, Y.C.; Dong, W.Y.; Zhou, M.; Wen, D.X.; Chen, D.D. A Unified Constitutive Model Based on Dislocation Density for an Al-Zn-Mg-Cu Alloy at Time-Variant Hot Deformation Conditions. Mater. Sci. Eng. A 2018, 718, 165–172. [Google Scholar] [CrossRef]
- Prasad, Y.V.; Gegel, H.L.; Doraivelu, S.M.; Malas, J.C.; Morgan, J.T.; Lark, K.A.; Barker, D.R. Modeling of Dynamic Material Behavior in Hot Deformation: Forging of Ti-6242. Metall. Trans. A 1984, 15, 1883–1892. [Google Scholar] [CrossRef]
- Wu, R.; Liu, Y.; Geng, C.; Lin, Q.; Xiao, Y.; Xu, J.; Kang, W. Study on Hot Deformation Behavior and Intrinsic Workability of 6063 Aluminum Alloys Using 3D Processing Map. J. Alloys Compd. 2017, 713, 212–221. [Google Scholar] [CrossRef]
- Xu, L.; Chen, L.; Chen, G.; Wang, M. Hot Deformation Behavior and Microstructure Analysis of 25Cr3Mo3NiNb Steel during Hot Compression Tests. Vacuum 2018, 147, 8–17. [Google Scholar]
- Ziegler, H. An Introduction to Thermomechanics; Zürich, Switzerland, 1983. Available online: https://api.pageplace.de/preview/DT0400.9780444598936_A23553189/preview-9780444598936_A23553189.pdf (accessed on 21 March 2025).
- de Moura, A.N.; de Alcântara, C.M.; Vieira, E.A.; da Silva Labiapari, W.; da Cunha, M.A.; de Oliveira, T.R.; Orlando, M.T. Microstructure, Crystallographic Aspects, and Mechanical Properties of AISI 420 Martensitic Stainless Steel after Different Thermomechanical Process Routes. Mater. Chem. Phys. 2023, 305, 127723. [Google Scholar]
- Zhang, B.; Huang, D.; Zhang, Y.; Wang, X.; Wang, T. Hot Deformation Behavior and Hot Working Map of 23Cr-8Ni Stainless Steel. Met. Form. (Hot Work.) 2023, 8, 44–48. [Google Scholar] [CrossRef]


| True Strain | α | n | Q (KJ/mol) | lnA |
|---|---|---|---|---|
| 0.05 | 0.0107 | 6.4472 | 576.2463 | 48.6392 |
| 0.1 | 0.0091 | 5.8427 | 532.3549 | 44.8246 |
| 0.15 | 0.0085 | 5.5857 | 510.5521 | 42.8791 |
| 0.2 | 0.0085 | 5.2924 | 489.6513 | 40.6982 |
| 0.25 | 0.0082 | 5.1712 | 474.6575 | 39.3945 |
| 0.3 | 0.0081 | 5.0255 | 469.7088 | 38.9510 |
| 0.35 | 0.0080 | 4.8268 | 453.8576 | 38.5051 |
| 0.4 | 0.0078 | 4.8616 | 457.3048 | 37.9121 |
| 0.45 | 0.0077 | 4.8040 | 453.0186 | 37.5417 |
| 0.5 | 0.0077 | 4.8075 | 451.5751 | 37.4570 |
| 0.55 | 0.0076 | 4.7907 | 448.8429 | 37.2464 |
| 0.6 | 0.0075 | 4.8067 | 446.1386 | 37.0091 |
| 0.65 | 0.0075 | 4.8188 | 445.0589 | 36.9167 |
| 0.7 | 0.0075 | 4.7665 | 441.1404 | 36.5856 |
| 0.75 | 0.0074 | 4.7937 | 440.0870 | 36.5127 |
| 0.8 | 0.0073 | 4.8315 | 442.5761 | 36.1681 |
| 0.85 | 0.0073 | 4.9002 | 439.2116 | 36.5026 |
| 0.9 | 0.0073 | 4.9644 | 441.8771 | 36.7634 |
| Stress Level Parameter (α) | Stress Exponent (n) | Strain Activation Energy (Q) | lnA |
|---|---|---|---|
| B0 = 0.0146 | C0 = 7.6244 | D0 = 644.7489 | E0 = 53.6681 |
| B1 = −0.1091 | C1 = −33.1578 | D1 = −1790.6077 | E1 = −119.4691 |
| B2 = 0.7925 | C2 = 235.8938 | D2 = 9861.2017 | E2 = 399.5431 |
| B3 = −3.0455 | C3 = −1028.2501 | D3 = −37,700 | E3 = −779.8986 |
| B4 = 6.5608 | C4 = 2576.0709 | D4 = 91,000 | E4 = 933.1345 |
| B5 = −7.9708 | C5 = −3594.5561 | D5 = −127000 | E5 = −648.6062 |
| B6 = 5.0996 | C6 = 2593.1982 | D6 = 93,344.5432 | E6 = 190.1419 |
| B7 = −1.3358 | C7 = −752.7588 | D7 = −27,634.6160 | E7 = 11.0290 |
| Strain | Strain Rate (s−1) | Energy Dissipation Efficiency Factor Values (η) | |||||
|---|---|---|---|---|---|---|---|
| 900 °C | 950 °C | 1000 °C | 1050 °C | 1100 °C | 1150 °C | ||
| 0.2 | 0.001 | 0.2827 | 0.1981 | 0.1692 | 0.2929 | 0.2283 | 0.1888 |
| 0.01 | 0.2112 | 0.3005 | 0.2933 | 0.2867 | 0.3165 | 0.3221 | |
| 0.1 | 0.1359 | 0.2411 | 0.2287 | 0.2415 | 0.2759 | 0.3066 | |
| 1 | 0.0565 | 0.0183 | 0.0691 | 0.1508 | 0.0858 | 0.1335 | |
| 0.4 | 0.001 | 0.2763 | 0.1837 | 0.1196 | 0.2931 | 0.2433 | 0.2080 |
| 0.01 | 0.2242 | 0.3114 | 0.2955 | 0.3291 | 0.4097 | 0.4263 | |
| 0.1 | 0.1364 | 0.2299 | 0.2505 | 0.2723 | 0.3467 | 0.3982 | |
| 1 | 0.0022 | 0.1174 | 0.0526 | 0.1019 | 0.0104 | 0.0936 | |
| 0.6 | 0.001 | 0.2698 | 0.1642 | 0.1234 | 0.3127 | 0.2614 | 0.2341 |
| 0.01 | 0.2448 | 0.3263 | 0.3080 | 0.3372 | 0.4043 | 0.4009 | |
| 0.1 | 0.1543 | 0.2369 | 0.2609 | 0.2695 | 0.3398 | 0.4156 | |
| 1 | 0.0233 | 0.1689 | 0.0586 | 0.0844 | 0.0085 | 0.0269 | |
| 0.8 | 0.001 | 0.2922 | 0.2022 | 0.1478 | 0.2979 | 0.2916 | 0.1014 |
| 0.01 | 0.2415 | 0.3288 | 0.3023 | 0.3240 | 0.3736 | 0.3955 | |
| 0.1 | 0.1497 | 0.2355 | 0.2504 | 0.2635 | 0.3073 | 0.3815 | |
| 1 | 0.0039 | 0.1438 | 0.0491 | 0.0960 | 0.0509 | 0.0412 | |
| Strain | Strain Rate (s−1) | ξ Value | |||||
|---|---|---|---|---|---|---|---|
| 900 °C | 950 °C | 1000 °C | 1050 °C | 1100 °C | 1150 °C | ||
| 0.2 | 0.001 | 0.0291 | 0.1804 | 0.4833 | 0.1730 | 0.2901 | 0.4347 |
| 0.01 | −0.0202 | 0.3442 | 0.2482 | 0.1361 | 0.2703 | 0.3118 | |
| 0.1 | −0.1928 | −0.3459 | −0.1740 | 0.0086 | −0.0823 | 0.0042 | |
| 1 | −0.4888 | −1.8713 | −0.7117 | −0.2097 | −0.7677 | −0.4883 | |
| 0.4 | 0.001 | −0.2678 | 0.5979 | 0.5095 | 0.2009 | 0.2071 | 0.8331 |
| 0.01 | 0.2020 | 0.1821 | 0.3315 | 0.2041 | 0.3250 | 0.5915 | |
| 0.1 | −0.6080 | −0.0939 | −0.2128 | −0.0752 | −0.1673 | −0.1980 | |
| 1 | −2.6978 | −0.0754 | −1.0734 | −0.6370 | −1.2697 | −1.5352 | |
| 0.6 | 0.001 | 0.0389 | 0.7488 | 0.6622 | 0.1904 | 0.0514 | 0.1461 |
| 0.01 | 0.0951 | 0.2028 | 0.3627 | 0.2163 | 0.5210 | 0.5398 | |
| 0.1 | −0.3503 | −0.0802 | −0.1923 | −0.0990 | −0.4243 | −0.1603 | |
| 1 | −1.2738 | 0.0845 | −0.9424 | −0.7557 | −2.7846 | −2.1076 | |
| 0.8 | 0.001 | −0.3490 | 0.5778 | 0.6415 | 0.2171 | 0.1301 | 0.5128 |
| 0.01 | 0.2139 | 0.1997 | 0.3574 | 0.2161 | 0.5265 | 0.4551 | |
| 0.1 | −0.6865 | −0.1153 | −0.2081 | −0.0617 | −0.3963 | −0.0376 | |
| 1 | −3.0502 | −0.2427 | −1.0012 | −0.6163 | −2.6278 | −0.9651 | |
Disclaimer/Publisher’s Note: The statements, opinions and data contained in all publications are solely those of the individual author(s) and contributor(s) and not of MDPI and/or the editor(s). MDPI and/or the editor(s) disclaim responsibility for any injury to people or property resulting from any ideas, methods, instructions or products referred to in the content. |
© 2025 by the authors. Licensee MDPI, Basel, Switzerland. This article is an open access article distributed under the terms and conditions of the Creative Commons Attribution (CC BY) license (https://creativecommons.org/licenses/by/4.0/).
Share and Cite
Li, J.; Li, L.; Wu, Z.; Zeng, T.; Wu, X. Hot Deformation Behavior and Optimization of Processing Parameters for 4Cr16MoCu Martensitic Stainless Steel. Metals 2025, 15, 373. https://doi.org/10.3390/met15040373
Li J, Li L, Wu Z, Zeng T, Wu X. Hot Deformation Behavior and Optimization of Processing Parameters for 4Cr16MoCu Martensitic Stainless Steel. Metals. 2025; 15(4):373. https://doi.org/10.3390/met15040373
Chicago/Turabian StyleLi, Jiayuan, Ling Li, Zhongchao Wu, Tianhao Zeng, and Xiaochun Wu. 2025. "Hot Deformation Behavior and Optimization of Processing Parameters for 4Cr16MoCu Martensitic Stainless Steel" Metals 15, no. 4: 373. https://doi.org/10.3390/met15040373
APA StyleLi, J., Li, L., Wu, Z., Zeng, T., & Wu, X. (2025). Hot Deformation Behavior and Optimization of Processing Parameters for 4Cr16MoCu Martensitic Stainless Steel. Metals, 15(4), 373. https://doi.org/10.3390/met15040373