Article

Combined Effect of the Sc/Zr Ratio and Mg Concentration on the Intergranular Corrosion Resistance of Al–Mg–Sc–Zr Alloys: A Case of Cast Alloys and Ultrafine-Grained Alloys

Materials Science Department, Lobachevsky University, Gagarina ave., 23, 603022 Nizhny Novgorod, Russia
*
Author to whom correspondence should be addressed.
Metals 2025, 15(4), 372; https://doi.org/10.3390/met15040372
Submission received: 7 February 2025 / Revised: 11 March 2025 / Accepted: 21 March 2025 / Published: 27 March 2025
(This article belongs to the Section Corrosion and Protection)

Abstract

The aim of this study was to investigate the effect of the Sc/Zr ratio (Sc/Zr = 0.45–2.2) on the intergranular corrosion (IGC) resistance of Al–Mg alloys with different Mg content (2.5, 4, and 6%) and with a Sc + Zr = 0.32%. A change in the Mg concentration led to a change in the number of β-phase particles. A change in the Sc/Zr ratio led to a change in the composition of Al3(Sc,Zr) particles. The IGC resistance of Al–Mg–Sc–Zr alloys was investigated by Tafel electrochemical tests and stationary tests. It has been demonstrated for the first time that two types of IGC defects appear during electrochemical tests. Large Type I defects were associated with the destruction of primary β-phase particles located along the dendrite boundaries. Fine Type II defects were associated with the grain boundaries (GBs). It has been demonstrated that during the stationary tests, Type I defects are formed. ECAP and subsequent annealing affect the ratio of the number of Type I and II defects. Increasing the Sc/Zr ratio reduced the depth of Type I defects, increased the fraction of Type II defects, and reduced the corrosion current density icorr. It has been shown for the first time that the dependence of icorr(T) had a three-stage character with a maximum at 450 °C in alloys with 2.5% and 4% Mg. A two-stage dependence of icorr(T) is observed in alloys with 6% Mg. Increasing icorr at T < 450 °C is due to the precipitation of the secondary β-phase particles on Al3(Sc,Zr) particles and due to the effect of solid-phase wetting of the GBs by β-phase, which leads to an increase in the proportion of GBs containing thin layers of β-phase. Decreasing icorr at T > 450 °C is associated with the dissolution of β-phase particles.

1. Introduction

The Al–Mg–Sc phase diagram is the basis for developing high-strength industrial alloys with increased strength and ductility, fatigue life, and satisfactory corrosion resistance [1,2]. Industrial aluminum alloys Al–Mg–Sc and Al–Mg–Sc–Zr (grades 1570, 1571, 1575, etc.) are widely used in various fields of mechanical engineering, including automotive, maritime, and aviation transport systems. Modern transport systems impose greater demands on Al–Mg–(Sc,Zr) alloys in terms of strength and corrosion resistance.
High strength of Al–Mg–Sc alloys is ensured by the formation of ultrafine-grained (UFG) microstructure by methods of Severe Plastic Deformation (SPD). The UFG Al–Mg–Sc alloys have a unique combination of high ultimate tensile strength and ductility [3,4], fatigue strength, cyclic life [5], and remarkable superplasticity characteristics [6,7]. Providing high strength is important for reducing the weight of modern transport systems, reducing fuel consumption, and increasing payload. It is important to emphasize that, although the corrosion resistance of UFG Al–Mg and Al-Mg-(Sc,Zr) alloys has been the subject of numerous studies, the intergranular corrosion (IGC) resistance of these alloys remains largely unexplored. It should also be noted that the low IGC resistance of industrial Al–Mg alloys is one of the primary challenges that stands in the way of their more active use. IGC results in the formation of crack-like defects on the surface of aluminum alloys, which can cause the nucleation and rapid growth of stress corrosion cracking or corrosion fatigue cracks. Consequently, the development of UFG alloys with high IGC resistance is an urgent task.
Next, a brief review of the primary research concerning the issue of corrosion resistance of fine-grained Al–Mg–(Sc,Zr) alloys will be presented. The focus will primarily be on the issue of IGC in UFG Al–Mg–(Sc,Zr) alloys.

1.1. Brief Review

The reduction in grain size contributes to a decrease in the overall corrosion rate of Al alloys [8,9]. Consequently, the formation of UFG structure is often considered one of the most effective methods for fabricating high-strength, corrosion-resistant Al alloys. However, the significant presence of high-angle grain boundaries (HAGBs) in UFG alloys enhances the contribution of intergranular corrosion (IGC) to the overall corrosion rate of Al alloys. The reason for this is the high energy of HAGBs compared to low-angle boundaries that predominate in industrial Al alloys. The high density of defects trapped in HAGBs during SPD contributes to an additional increase in their free energy and/or free (excess) volume of grain boundaries (GBs) [10]. Consequently, this leads to a decrease in the corrosion resistance of Al alloys [9,11]. Such GBs are preferential sites for the release of secondary particles and have a high dissolution rate [12,13,14,15].
An additional factor that adversely affects the corrosion resistance of UFG Al–Mg alloys is the formation of Mg segregations in HAGBs after SPD [16,17,18]. For example, grain boundary (GB) segregations of Mg (concentration in the range of 10–20 at.%), with a thickness of 5–10 nm, have been observed in UFG Al–Mg alloys; however, the Al3Mg2 phase does not nucleate [17]. The presence of these segregations is difficult to explain within the conventional framework of interactions between horophile impurities and equilibrium GBs. The formation of GB segregations influences the free energy and nonequilibrium state of GBs in UFG Al–Mg alloys and, most importantly, can impact their IGC resistance.
Al–Mg supersaturated solid solutions usually decompose very slowly because of the high nucleation energy of the β- or β′-phases. During heating of alloys containing more than 3 wt.% of Mg, stable β-phase or intermediate β′-phase particles are formed [19,20], according to the following two primary mechanisms: (i) solid solution α-Al + Mg ⟶ GP zones ⟶ β′-phase ⟶ β-phase and (ii) α-Al + Mg ⟶ β-phase. At low temperatures, β-phase particles are released at HAGBs, and at elevated temperatures, in the grain volumes [21].
At severe plastic deformation of Al–Mg alloys, partial decomposition of the Al–Mg solid solution can occur [22], and the release of particles during heating differs significantly from that observed in coarse-grained alloys. For example, it has been demonstrated in [23] that during heating of UFG Al–(3, 5, and 10%) Mg alloys, the release of Al–Mg intermetallic phases follows the following sequence: GP zones → β → ε → β → γ → β. After heating to 400 °C, the GBs of highly deformed Al–Mg alloys become enriched with magnesium and contain thin layers of Al–Mg intermetallics [23]. This sequence of phase transformations in nonequilibrium Al–Mg alloys cannot be described using the equilibrium Al–Mg diagram.
Currently, the impact of magnesium and β-phase contents on the IGC resistance of coarse-grained Al alloys is the most studied. β-phase Mg2Al3 serves as the anode relative to the Al matrix [24,25]. Consequently, the primary reason for the increase in the IGC rate in Al–Mg alloys is the formation of β-Mg2Al3 particles along HAGBs [25,26,27]. However, widely spaced β-particles do not significantly decrease the IGC resistance of the Al alloys [28,29]. Although β-phase particles can also nucleate at low-angle grain boundaries, or GBs, with special misorientation angles [30,31], their negative effect on the corrosion resistance of Al alloys is significantly smaller.
The formation of a finer-grained structure allows for an increase in the area of GBs and, thereby, can lead to a decrease in the concentration of alloying elements (AEs) in the GBs, an increase in the distance between β-Mg2Al3 particles that positively affect the IGC resistance of Al alloys [32]. Therefore, grain growth often leads to an acceleration of IGC in fine-grained Al–Mg alloys [13,14,33].
The following is a general overview of the existing data on the influence of key structural factors on the IGC resistance of aluminum alloys.
The influence of Mg on the corrosion resistance of Al has been well studied. For example, reference [25] shows that an increase in the Mg content by more than 4% leads to a monotonic increase in the mass loss of Al–Mg–Mn alloys and a sharp decrease in their IGC resistance. At the same time, a change in the Mg concentration did not have a noticeable effect on the electrochemical properties of Al alloys. However, the IGC resistance of such UFG alloys with a high Mg content remains unexplored.
It is generally assumed that Sc has a positive effect on the corrosion resistance of coarse-grained Al alloys. It has been demonstrated in [34,35] that Al3(Sc,Zr) particles dissolve in a neutral aqueous medium (3% NaCl), resulting in the formation of a passivating layer that contains Sc and Sc2O3. It is well established that the stability of an Al2O3 film can be enhanced by increasing the concentration of Sc in Al–Mg–Sc–Zr alloys [36,37]. However, the literature analysis shows that Sc and Zr can have an ambiguous impact on the IGC resistance of Al alloys. The primary challenge in analyzing the results is related to the fact that Sc and Zr significantly affect the grain size of Al–Mg alloys. Consequently, this affects the area of GBs occupied by β-phase particles and the corrosion resistance of Al–Mg alloys [38,39,40]. However, the maximum IGC resistance was observed in the case of the formation of a subgrain structure. The same conclusion was reached by the authors of [39], which studied the impact of small additives of Mn, Sc, and Zr on the corrosion resistance of Al–5% Mg alloys with different grain sizes.
The second challenge is related to the structural features of Al3(Sc,Zr) particles, which have the structure of Al3Sc core—Al3Zr shell [41,42,43,44]. The accurate structure of Al3Sc@Al3Zr particles depends on the ratio of the diffusion rates of Sc and Zr in the Al crystal lattice at a given temperature, the Sc/Zr ratio, etc. [45,46,47]. Consequently, the electrochemical properties and corrosion behavior of Al3(Sc,Zr) particles can vary significantly during the annealing process. In addition, a change in the Sc/Zr ratio affects not only the thermal stability of the UFG structure and mechanical properties of Al alloys [48,49,50] but also the composition and nature of the release of Al3(Sc,Zr) particles [51]. It has been noted in [52,53] that the release mechanism of Al3(Sc,Zr) particles depends on the heat treatment regime. Depending on the heat treatment regime of Al–Mg–(Sc,Zr) alloys, both discontinuous and continuous precipitation of Al3(Sc,Zr) particles can occur [51,52,53].
The complexity of analyzing the results of studies on industrial Al–Mg–Mn alloys is related to the necessity to consider the impact of intermetallic inclusion particles on the corrosion resistance of aluminum alloys. For example, the Al6Mn particles provide the stability of the fine-grained structure of Al–Mg alloys and lead to an increase in their strength [54]. In industrial Mn-containing Al–Mg alloys, Al6Mn particles are among the most corrosion-aggressive particles [55]. Other non-metallic inclusions typically have less corrosive-aggressive electrochemical characteristics [56,57]. The addition of Sc and Zr promotes the refinement of Al6Mn particles and positively influences their corrosion resistance [58]. This is important because β-phase particles can also precipitate on Al6Mn particles and L12-type particles [59,60,61,62,63], thereby enhancing their negative effect on the corrosion resistance of Al alloys.
The possible precipitation of β- and β′-phase particles on Al3(Sc,Zr) particles was discussed in [64]. The precipitation of β-phase particles on Al3(Er,Zr) nanoparticles, which also have the structure of Al3Er core—Al3Zr shell [65], was found in [60,63]. This suggests that the precipitation of β-particles on the Al3Zr shell is energetically favorable. However, it is important to note that excessive refinement of large inclusions will lead to a decrease in the distance between them and to an increase in their number and, as a consequence, to a decrease in the corrosion resistance of Al alloys (see, e.g., [66]). Consequently, it is a difficult methodological task to separate the effects of Sc, Zr, Mg, and heat treatment on the corrosion resistance of industrial Al-Mg-(Sc,Zr) alloys.
The negative impact of Al3(Sc,Zr) particles on the corrosion resistance of industrial Al-Mg-Mn-(Sc,Zr) alloys is usually neglected, as the scale of influence of other factors, particularly the particles of β-phase and Al6Mn, is significantly greater. It is important to note that Al3(Sc,Zr) particles are distributed discretely and do not form continuous layers at GBs. Therefore, Al3(Sc,Zr) particles most often have a negative effect on the pitting corrosion resistance of Al alloys [67]. In addition, Al3(Sc,Zr) particles are formed during the preliminary heat treatment stage, and their size and volume fraction remain relatively unchanged during subsequent operations, in contrast to β-phase particles. However, when selecting the optimal regimes for heat and deformation treatment of new, low-cost Al-Mg alloys with reduced Sc content, the influence of this factor must be considered.
There are several studies that report the absence of a noticeable effect of Sc or Zr on the corrosion resistance of Al alloys [68] or their negative effect [66,69]. The negative effect of Sc and Zr on the corrosion resistance of coarse-grained Al-Mg alloys is due to two factors. First, Al3(Sc,Zr) particles act as cathodes in relation to the Al crystal lattice [55,56], forming a micro-galvanic pair with it. The potential difference between the Al3(Sc,Zr) particle and the Al crystal lattice will depend on the structure of the Al3(Sc,Zr) particle and the Mg concentration in the Al crystal lattice. The negative impact of Al3(Sc,Zr) particles on the electrochemical behavior of Al–Mg alloys partially offsets the positive influence of these particles on grain refinement and the parameters of β-phase particles at GBs. As a result, the electrochemical study results of Al–Mg–(Sc,Zr) alloys often do not align well with the conventional results of the IGC resistance tests [25]. It is noteworthy to mention the article [69], which demonstrates that the addition of 0.25% Sc does not enhance the corrosion resistance of the Al-7010 alloy. However, it is accompanied by the appearance of an additional (second) breakdown potential on the anodic polarization curve and a shift of the corrosion potential to the active region. This decreased the resistance of the Al-7010 alloy to IGC and pitting corrosion.
Second, it is necessary to consider the concentration factor. The negative effect of Al3(Sc,Zr) particles on the corrosion resistance of coarse-grained Al–Mg–(Sc,Zr) alloys is most pronounced at high concentrations of Sc. It has been reported in [34,35] that the dependence of the corrosion rate of Al–(2.5–3)%Mg–Sc–(0.14–0.15)%Zr alloy on the concentration of Sc has a non-monotonic character with a minimum corresponding to 0.3% Sc. A decrease in the corrosion resistance of Al–(2.5–3)%Mg–Sc–(0.14–0.15)%Zr alloy is observed with a further increase in the Sc concentration to 0.9%. A non-monotonic dependence of the corrosion rate in a 3% aqueous NaCl solution on the Sc concentration in an industrial Al–6%Mg–0.56%Mn alloy was also observed in [64]. However, the authors of [64] noted that the nature of the dependence of the corrosion rate on the Sc concentration significantly depends on the regime of preliminary heat treatment of Al–6%Mg–0.56%Mn alloy.
A brief analysis of the research results indicates that the question of the impact of the Sc/Zr ratio on the resistance of Al–Mg–Sc–Zr alloys to IGC remains unexplored. In our previous study [70], the effect of the Sc/Zr ratio on the corrosion resistance of cast coarse-grained Al–Mg alloys has been studied. Among the most unexpected results described in [70] is a non-monotonic nature of the dependence of the corrosion current density on the annealing temperature icorr(T) of cast the Al–Mg–Sc–Zr alloys.

1.2. Aims and Objectives of This Study

The aim of the present study was to investigate the effect of the Sc/Zr ratio on the IGC resistance of UFG Al–Mg alloys with different Mg content. The basic hypothesis underlying this research is that a change in the Sc/Zr ratio influences the composition of Al3(Sc,Zr) particles [51,70] and the electrochemical behavior of Al-Mg-Sc-Zr alloys. A change in the Sc/Zr ratio will lead to a change in the size and volume fraction of Al3(Sc,Zr) particles and, in accordance with the Zener equation, to a change in the average grain size. This will lead to a change in the distribution of β-phase particles, which affect the IGC rate in Al–Mg–Sc–Zr alloys. To separate the combined effects of Sc/Zr and Mg on the corrosion resistance of Al-Mg-Sc-Zr alloys, the following alloys are studied: (i) alloys with different Sc/Zr ratios (at a given Mg content) and (ii) alloys with different Mg contents (at a given Sc/Zr ratio). The primary focus of this study was the IGC resistance of UFG alloys, along with clarifying a non-monotonic icorr(T) dependence. The results obtained are compared with previously published results of studies of cast alloys of similar composition [70], as well as with new results of studies of cast and UFG Al–Mg–Sc–Zr alloys.

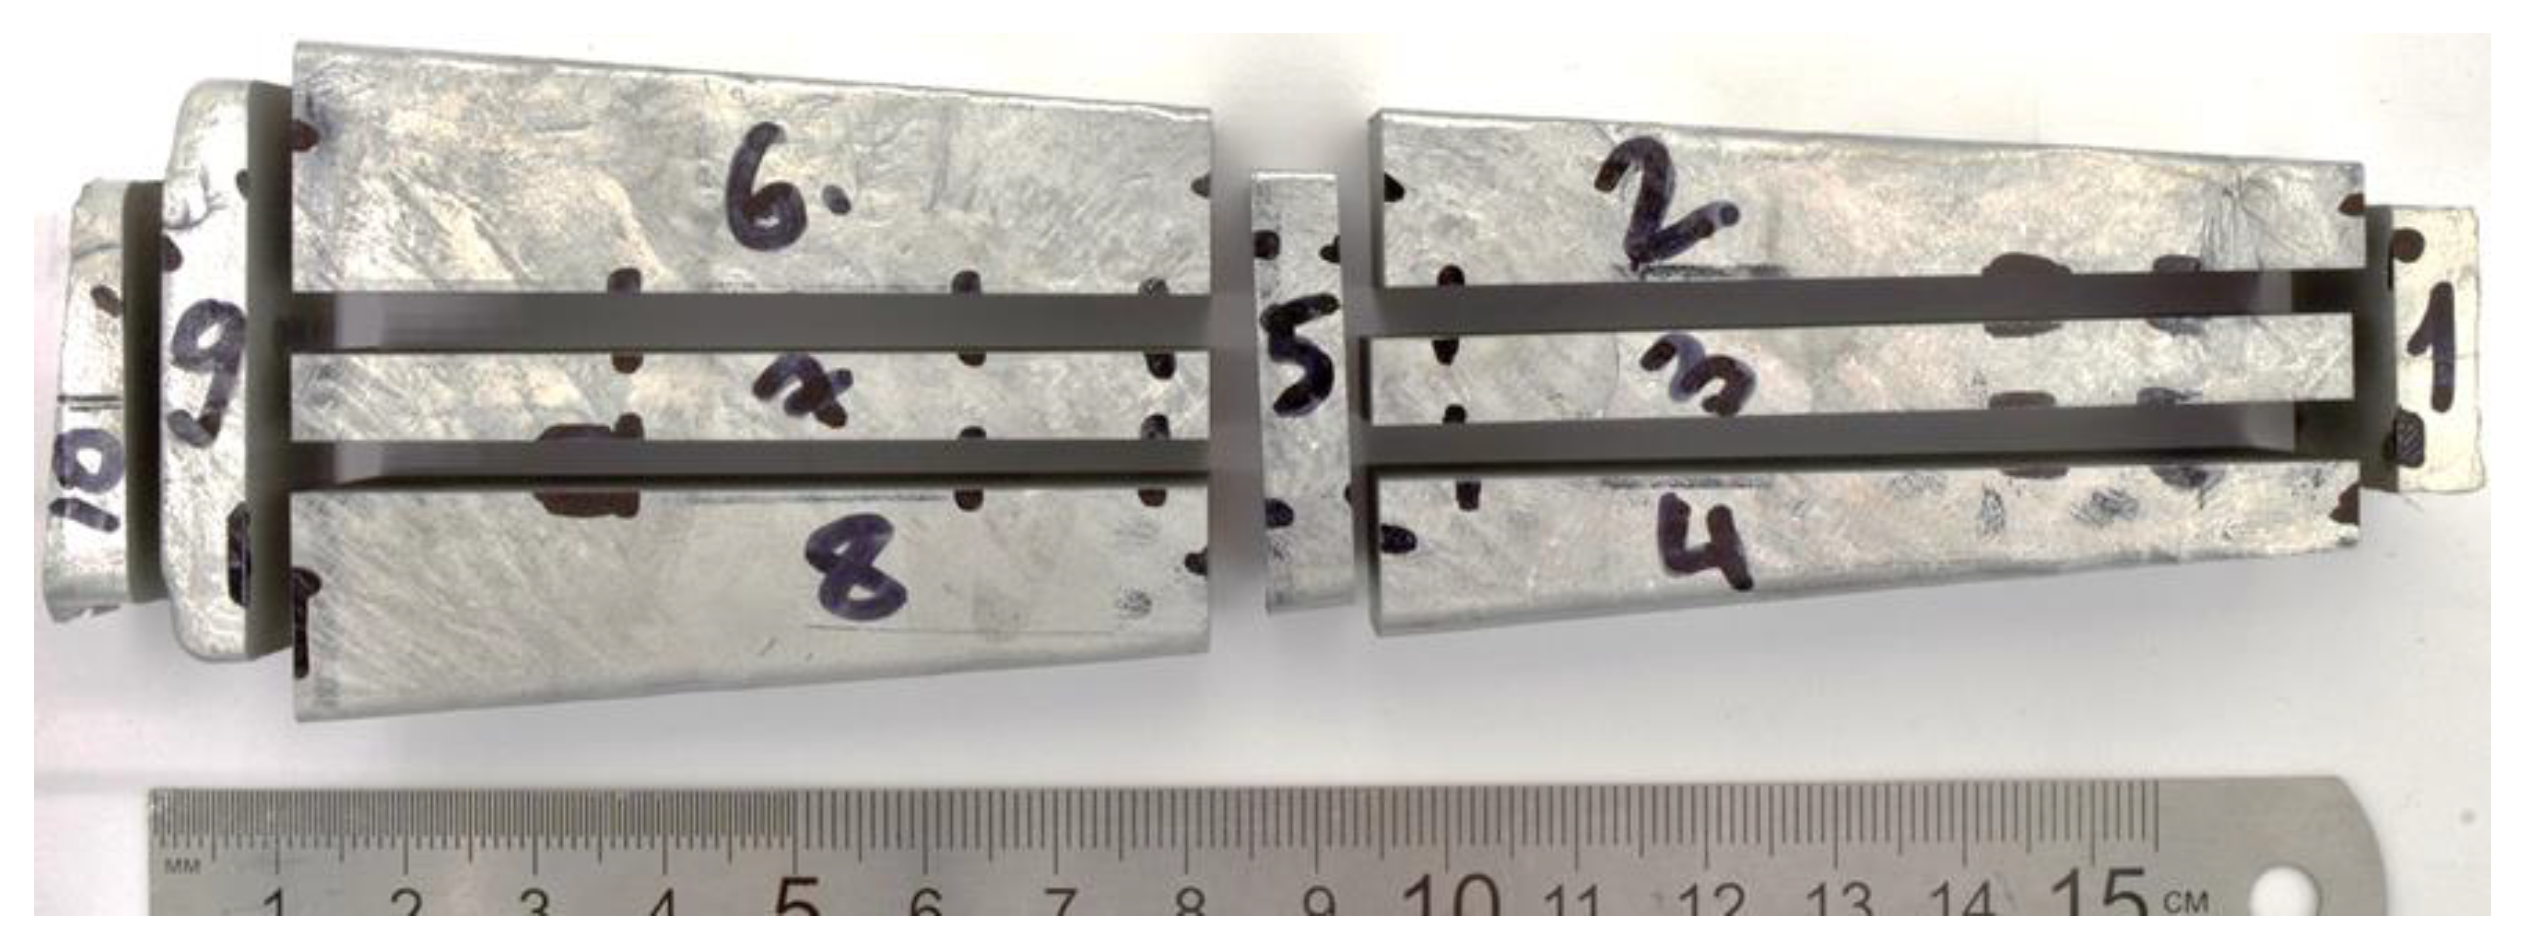
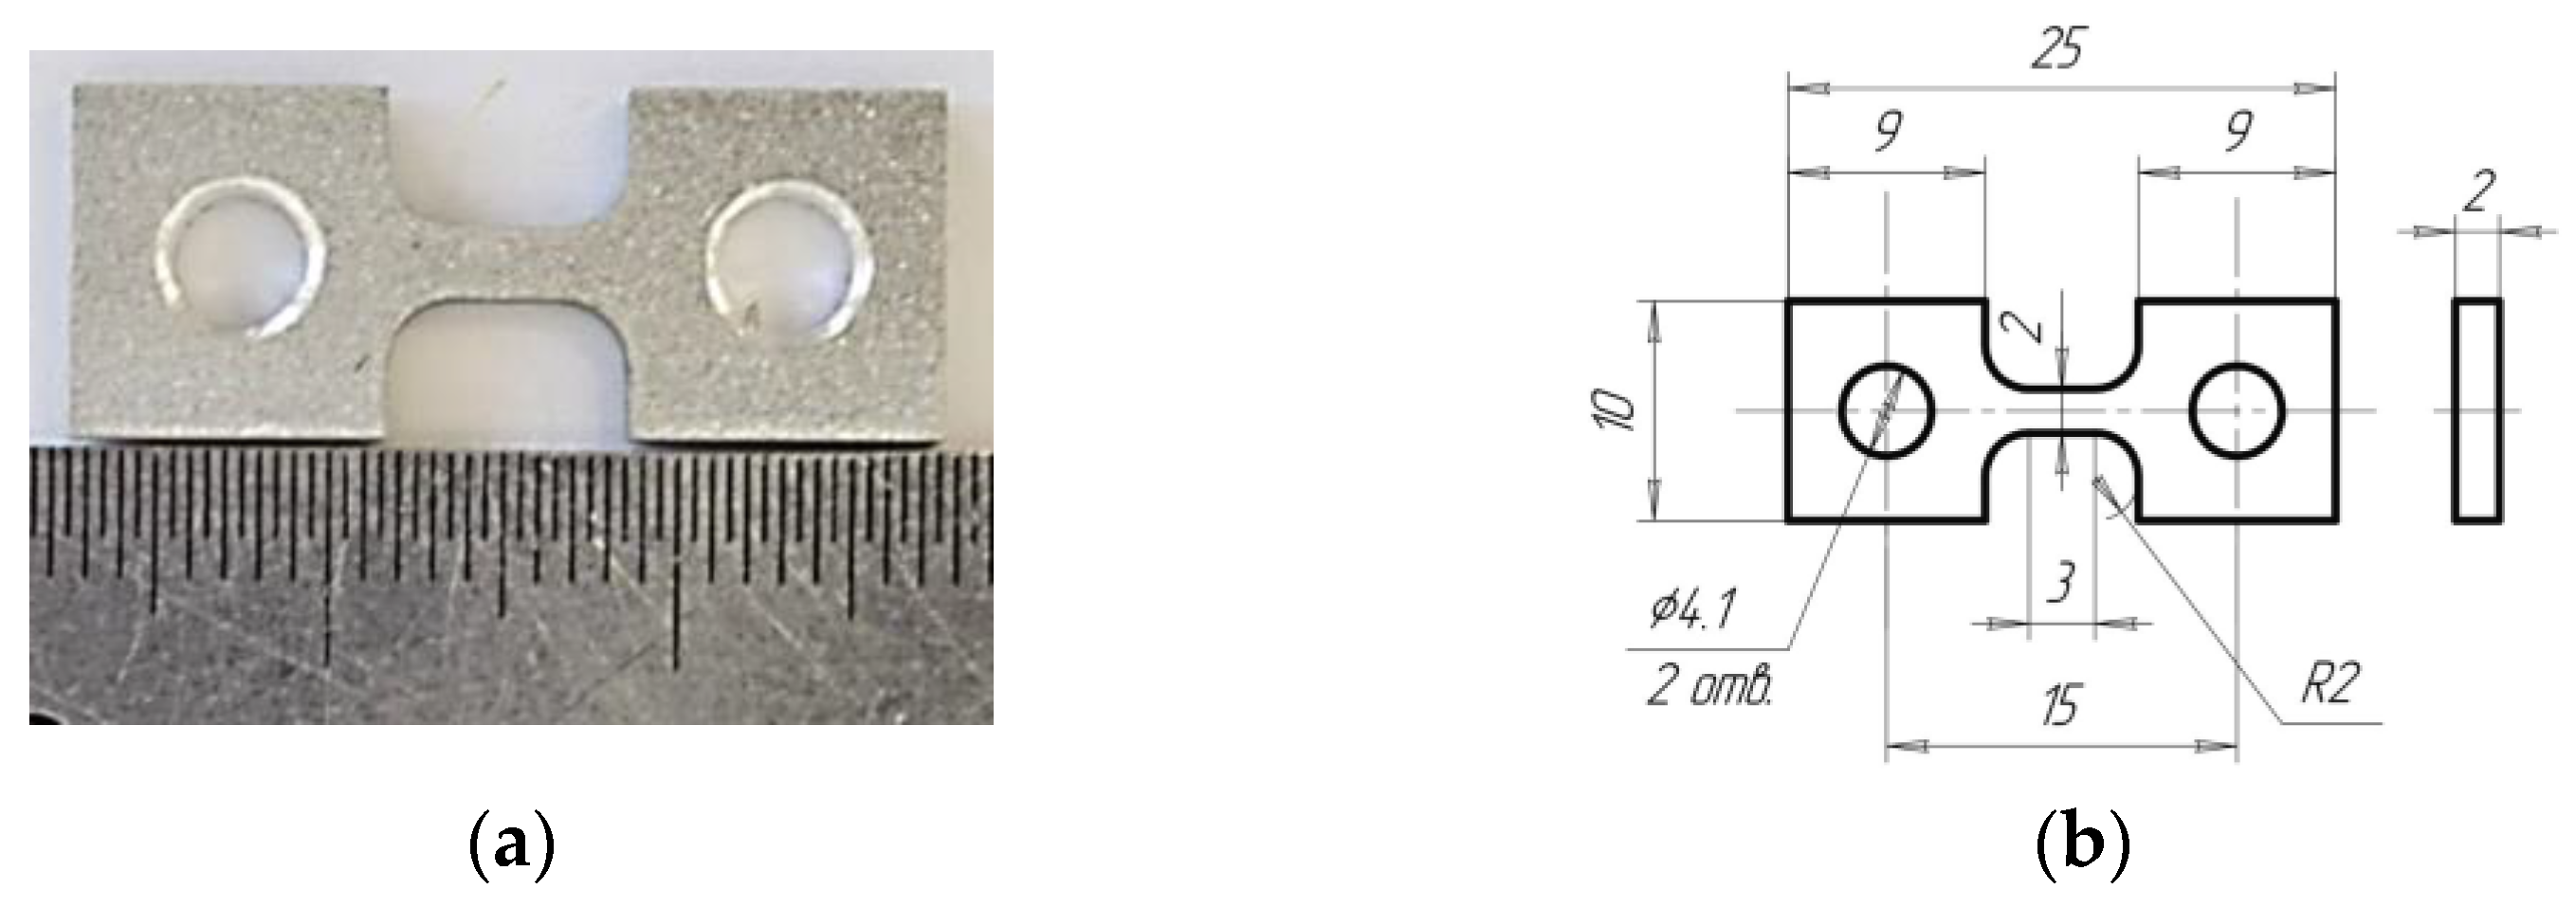
2. Materials and Methods

This study focuses on Al–Mg–Sc–Zr alloys with a total Sc + Zr content of 0.32%. The composition of the Al alloys is presented in Table 1. The Mg concentrations in the alloys were 2.5, 4.0, and 6.0%. The ingot samples were cut into ten parts, and the compositions in these parts were analyzed (Figure 1). The deviation in the Mg concentration from the calculated value for all the samples did not exceed ± 0.2%. This deviation does not exceed the permissible range of the Mg concentration (1 wt.%) for Russian Al–Mg alloy grades (AMg6, 1570, 1575, etc.) according to the Russian National Standard GOST 4784-2019 [71]. To determine the concentrations of key AEs and impurities, a Varian 720-ES ICP spectrometer (Varian Inc., Palo Alto, USA) was used. The error in determining the concentration of impurities using the ICP method was 0.001%. The actual Sc and Zr concentrations determined by the ICP method were 0.005–0.015% lower than the calculated value (Table 1). The concentrations of impurities (Si, Fe, Cu) in the Al–Mg–Sc–Zr alloys were 0.014–0.035% Si, 0.004–0.005% Fe, and 0.002–0.009% Cu, respectively. The concentrations of impurities did not exceed the maximum allowable Si, Fe, and Cu concentrations in the Al alloys, according to GOST 4784-2019 [71] (not more than 0.3%).
The Al alloy workpieces were obtained by vacuum induction casting on an Indutherm VTC 200V casting machine. The production regimes of the Al–Mg–Sc–Zr alloy ingots are described in detail in [51,70]. The UFG microstructure was developed using Equal-Channel Angular Pressing (ECAP). ECAP was performed on a Ficep HF400L hydraulic press (Ficep® S.P.A., Varese, Italy) with square-section tooling and 90° channel intersection angle. The 22 mm × 22 mm × 160 mm workpieces were machined to remove the inhomogeneous surface layer before ECAP (see the findings on the cast alloy studies below). The production regimes of the UFG Al–Mg–Sc–Zr alloys are described in detail in [51]. The cast alloys were not subjected to additional heat treatment before ECAP. The ingots and UFG blanks were kept at room temperature (RT) (18–25 °C) for two years before the research.
To modify the grain size, volume fraction, and size of secondary particles, the cast and UFG Al alloy samples were annealed in an EKPS-10 air furnace (JSC Smolensk SKTB SPU, Smolensk, Russia) at 100–500 °C for 30 min, with a temperature control accuracy of ±10 °C. The annealing regimes were chosen based on the analysis of previous studies [51,70].
The alloy microstructures were studied using a Leica DM IRM optical microscope (OM) (Leica Microsystems GmbH, Wetzlar, Germany), a JEOL JSM-6490 scanning electron microscope (SEM) (Jeol Ltd., Tokyo, Japan) with an Oxford Instruments INCA-350 EDS detector (Oxford Instruments, Abingdon, UK), and a JEOL JEM-2100F transmission electron microscope (TEM) with a JEOL JED-2300 EDS detector (Jeol Ltd., Tokyo, Japan). The average grain size (d) and particle sizes (R) were determined using the chord method with GoodGrains 2.0 software (Lobachevsky University, Nizhny Novgorod, Russia). The error in determining d and R was 5% of the average value. X-ray phase analysis was conducted using an XRD-7000 diffractometer (Shimadzu Europa GmbH, Korneuburg, Austria) following the Bragg-Brentano method (CuKα emission, scanning step = 0.04°, scanning angle range 2θ = 30–85°, slit system: DS = 1°, SS = 1°, RS = 0 mm). The exposure time was set to 2 s for the overview XRD pattern and 10 s for the refined XRD pattern in the specified ranges of diffraction angles. Qualitative phase analysis was performed using the ICDD PDF-2 (2012) and ICSD (2016) databases.
The microhardness (HV) and specific electrical resistivity (SER, ρ) measurements were used to study the precipitation of secondary particles and the recrystallization process. Microhardness was measured using a Qness A50+ hardness tester (QATM & Verder Scientific Headquarters, Haan, Germany). The average uncertainty in HV determination was ±15 MPa. The SER was measured using the eddy current method with a SIGMATEST 2.069 instrument (FOERSTER Int., Pittsburgh, USA) with a sensor of 8 mm in diameter. The average uncertainty in SER determination was ±0.03 µΩ·cm. For HV and SER measurements, samples of 5 mm × 20 mm × 20 mm in size were used.
For mechanical tensile tests, flat samples of 2 mm × 10 mm × 25 mm in size, dogbone shape, were used (Figure 2). The length of the working part was 3 mm. Tests were conducted using a Tinius Olsen H25K-S machine (Tinius Olsen Ltd., Surrey, UK) at RT, with a strain rate of 3.3 × 10⁻³ s−1 (a tensile rate of 10−2 mm/s). The stress–strain curves σ(ε) were used to determine the value of the alloy ultimate tensile strength (UTS, σUTS). The error in determining the UTS was 10 MPa.
Corrosion studies were carried out at RT in a 3% NaCl + 0.3% HCl aqueous solution (1.18 pH). The tests were performed using R-20X and R-30S potentiostats-galvanostats (Electrochemical Instruments JSC, Chernogolovlka, Russia) in a 60 mL three-electrode glass cell. A silver-chloride reference electrode (EVL-1M4) and a platinum electrode, which served as the auxiliary electrode, were used in the testing. The 2 mm × 10 mm × 15 mm samples were polished using diamond pastes to achieve a surface roughness level of 3–5 μm and then coated with acid-resistant lacquer, except for an open area of ~1 cm2. Before electrochemical tests, the samples were preliminarily exposed in the test cell in the corrosion solution for 1 h until a stable open circuit potential was reached while simultaneously monitoring the potential-time dependence E(t) (Figure 3). Within 1 h, the potential of the Al alloy reached its stationary value. This study was carried out in the potential range from −1.0 to 0.4 V with a potential scanning rate of 0.5 mV/s and a recording rate of 10 points/s.
The corrosion current density icorr (µA·cm−2) and the corrosion potential Ecorr (mV vs. Ag/AgCl) were calculated based on the analysis of the slope in the Tafel curves (the ration of potential E to current density i on the semi-logarithmic axes lg(i)–E). The ES8 software developed by Elin Co. (Moscow, Russia) was used for the result analysis. The mean uncertainty in the Ecorr determination was 5 mV and was limited by the reproducibility of the results. The mean uncertainty in the icorr determination was close to 0.1–0.15 mA.
The IGC stationary tests were carried out in an aqueous solution containing 3% NaCl + 0.3% HCl in accordance with the requirements of the Russian National Standard GOST 9.021–74 [72]. The stationary testing time was 24 h. Prior to the testing, the sample surfaces were mechanically polished to a roughness level of 3–5 μm. Samples of 2 mm × 10 mm × 15 mm in size were placed in the test corrosion cell in a suspended state. The geometric dimensions of the samples were measured to an accuracy of 0.1 mm.
All corrosion tests were conducted at RT. The sample surfaces after corrosion tests were examined using a Leica IM DRM microscope (Leica Microsystems GmbH, Wetzlar, Germany). The classification of the corrosion defect types was performed according to the Russian National Standard GOST 9.908-85 [73].

3. Results

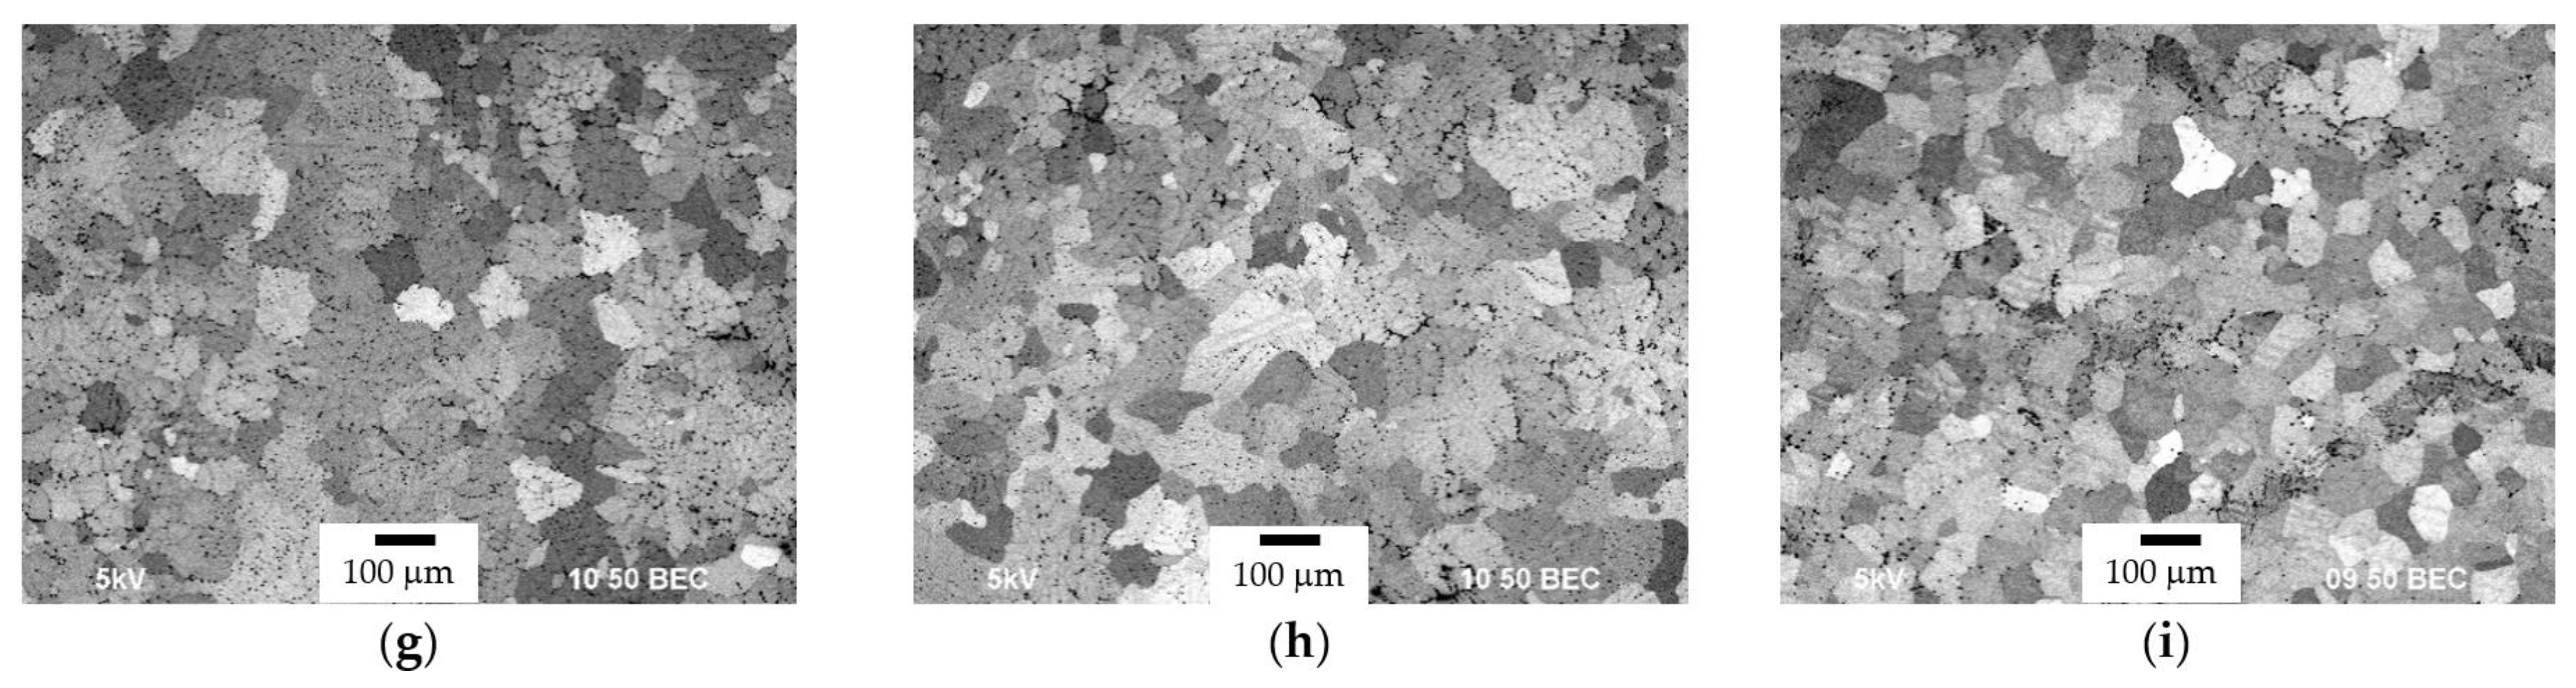
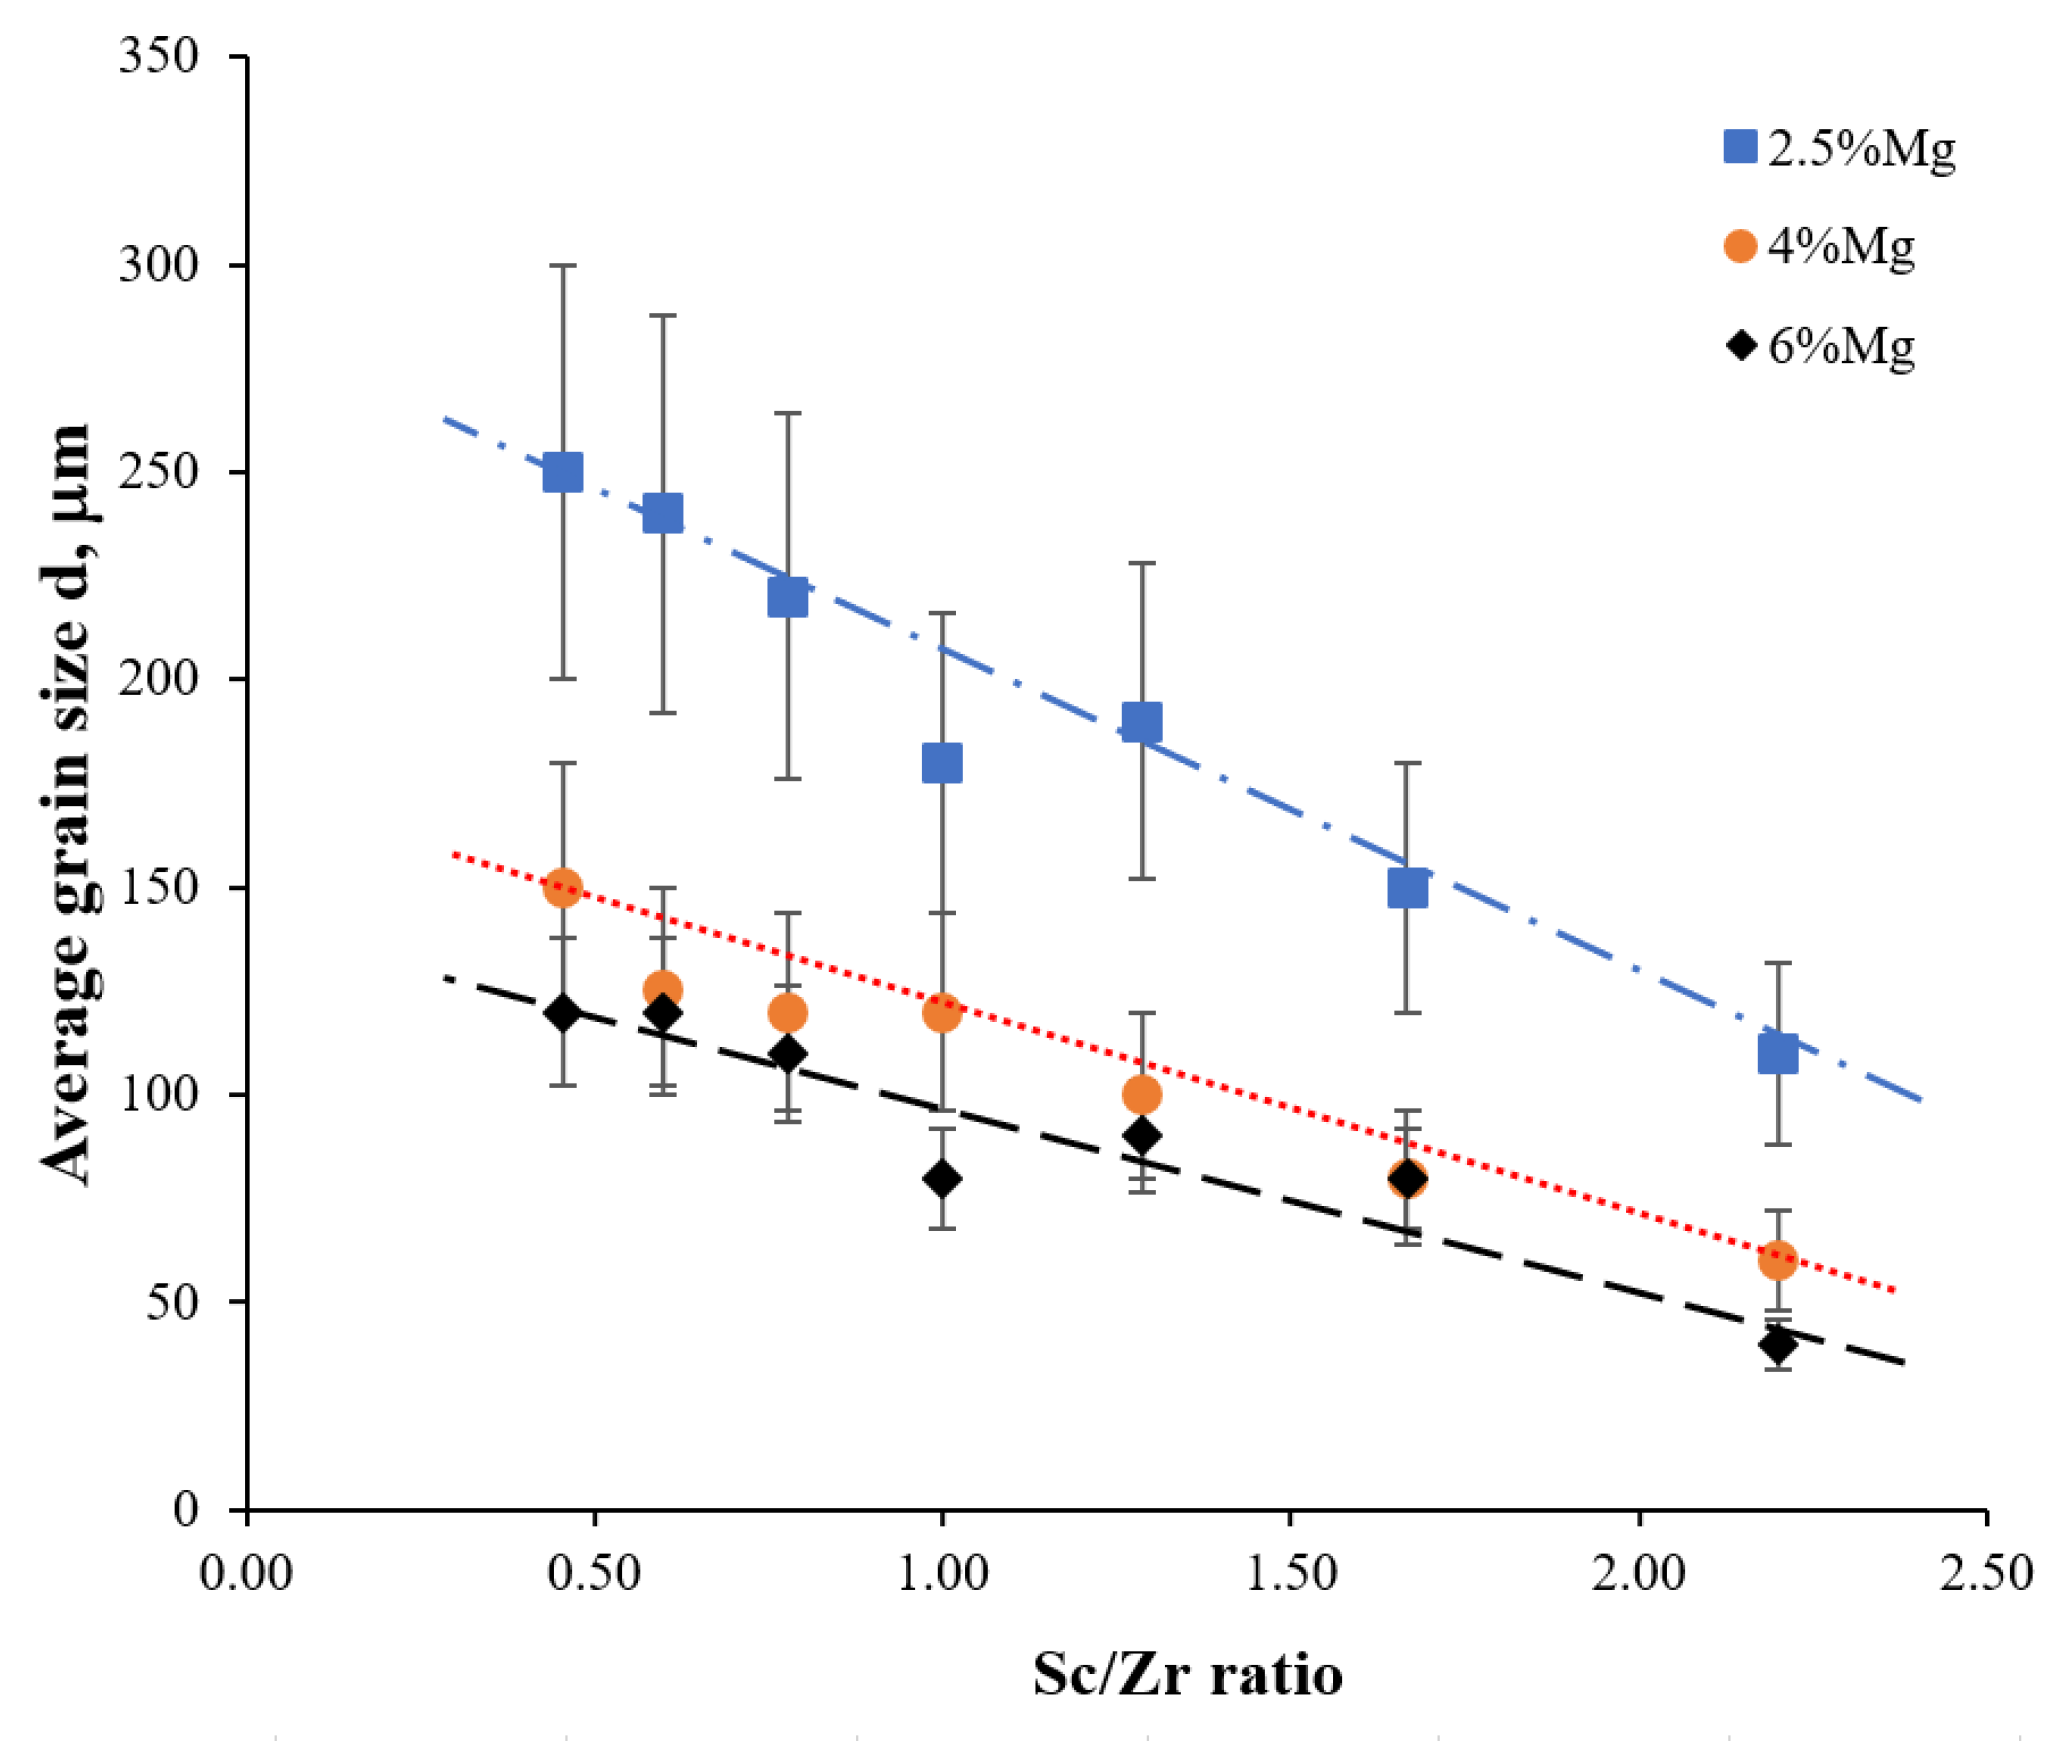
3.1. Microstructure of Alloys

The cast alloys exhibited a homogeneous macrostructure with a thin layer of columnar crystals at the edges of the ingot cross-sections (Figure 4). An increase in the Mg content leads to the nearly complete disappearance of the columnar crystals and a reduction in the average grain size in the central parts of the ingots. In alloys with 6% Mg, the average grain size in the central parts of the ingots was close to 30–50 μm (Figure 5 and Figure 6).
The primary Al3(Sc,Zr) particles, formed during the crystallization, were uniformly distributed on the surfaces of the cast alloy cross-sections. In the Al–Mg–Sc–Zr alloys with elevated zirconium content (0.20, 0.22% Zr), large rectangular particles were observed inside small equiaxed grains (Figure 7a,b). The EDS microanalysis has shown the composition of such particles to be close to Al3Zr. The isolated primary Al3(Sc,Zr) particles were uniformly distributed throughout the cast alloy volume with increasing Sc content (Figure 7c,d).
An increase in the Mg content leads to an increase in the volume fraction of the primary Al3(Sc,Zr) particles. The fine grains in the central parts of the ingots contained an increased number of β-phase particles, which were intensively destroyed during electrochemical polishing (Figure 7d,e). On the surfaces of strongly etched samples, an increase in the content of β-phase particles or an increase in the Mg content at the GBs led to a change in the contrast of the grains (Figure 7b,d). An increase in the magnesium concentration in the Al-Mg alloys resulted in an increase in the volume fraction of β-phase particles.
The presence of large primary particles of β-phase and particles of Al3(Sc,Zr) is confirmed by the results of X-ray phase analysis. As an example, Figure 8a illustrates the XRD pattern of the cast, unannealed alloy Al–6%Mg–0.22%Sc–0.10%Zr in its initial state. The XRD pattern of the cast alloy shows low-intensity peaks corresponding to the phases β-Mg2Al3 (PDF #00-029-0048) and Al3(Sc,Zr) (PDF #04-001-2004). The intensities of these peaks are significantly smaller than those of the Al peaks (PDF #00-004-0787). Additionally, the XRD patterns include peaks that characterize the reflections of the most intense aluminum peaks from the CuKβ line, which are marked with light triangular markers.
The UFG alloys with 2.5% Mg after ECAP had a homogeneous microstructure with an average grain size of 0.6–0.8 μm. Increasing the Mg concentration from 2.5 to 6% led to a slight decrease in the average grain size to 0.3–0.5 μm (Figure 9). Changing the Sc/Zr ratio has no significant effect on the microstructure of the UFG alloys. Analysis of the results of electron microscopy indicates that the UFG alloys contain a substantial proportion of HAGBs. The grains have an increased density of lattice dislocations (Figure 9c). In some grains, high dislocation density was observable (Figure 9d), but their number is small. All the alloys contain single Al3(Sc,Zr) nanoparticles (Figure 9e,f), which were obviously formed at warm ECAP (TECAP = 250–275 °C). The Al3(Sc,Zr) nanoparticles are uniformly distributed and present both in the bulk of the grains and at GBs (Figure 9e).
The results of X-ray studies indicate that the Al and β-phase peaks are clearly visible on the XRD patterns of UFG alloys (Figure 8b). The intensity of the peaks corresponding to the Al3(Sc,Zr) phase is close to the background intensity, which makes them practically invisible on the XRD pattern. A comparison of Figure 8a,b reveals that ECAP results in an increase in the half-width and a decrease in the intensity of the X-ray maxima of aluminum. This is a common result for highly deformed UFG metals characterized by increased internal stresses.
Studies of the microstructure of annealed cast alloys reveal that the secondary nanoparticles are formed when these alloys are heated (Figure 10). The average particle size formed at the GBs is several times larger than the average particle size formed in the bulk of the grains (Figure 10a). The composition of the nanoparticles depends on the Sc/Zr ratio. The EDS analysis results indicate that nanoparticles with a size of 10–15 nm are formed in alloys with a high scandium content (Figure 10b), which consist only of Al and Sc. This observation suggests that secondary particles are the phase of Al3Sc.
Particles of a size of 20–30 nm are formed in alloys with a high zirconium content after annealing at 500 °C for 30 min (Figure 10c,d). The EDS analysis results show that three types of particles are formed in cast alloys with a low Sc/Zr ratio as follows: (i) particles containing only Sc (Figure 10e), (ii) particles with the Sc concentration that exceeds the Zr concentration (Figure 10f), and (iii) particles that contain equal amounts of Sc and Zr (Figure 10g). The results indicate that during the annealing of cast alloys with a high zirconium content, Al3Sc particles and Al3(Sc,Zr) particles with a core–shell structure (Al3Sc-Al3Zr) are formed. All the particles are formed by a continuous precipitation mechanism, and no evidence of discontinuous precipitation has been found.
Heating the UFG Al–Mg–Sc–Zr alloys results in the formation of Al3(Sc,Zr) particles (Figure 11). In the alloys with high Sc contents, the formation of Al3Sc and Al3(Sc0.5Zr0.5) nanoparticles was observed. In addition, the submicron-sized Al3Zr fan-shaped particles are released near the GBs by the discontinuous precipitation mechanism (Figure 11). It should be noted that the discontinuous precipitation of Al3Zr particles during the annealing of fine-grained Al alloys was described earlier [51,52,53]. Although it should also be noted that most often the authors observed homogeneous formation of spherical Al3Zr nanoparticles during annealing the UFG Al–Zr alloys [74]. During annealing the Al–6%Mg–0.16%Sc–0.16%Zr alloys, the formation of fan-shaped Al3Zr particles by the discontinuous precipitation was also observed. However, the number of these particles in the alloy with Sc/Zr = 1 was significantly smaller than that in the case of Sc/Zr = 0.45. A decrease in the Mg concentration led to an increase in the fraction of the Al3(Sc,Zr) particles but did not affect the nature of their formation.
Figure 12 shows the microstructure study results of annealed alloys with different Mg, Sc, and Zr contents. The released Al3(Sc,Zr) particles provide the nonequilibrium UFG microstructure stabilization of the Al–Mg–Sc–Zr alloys. The onset temperature of the grain growth is weakly dependent on the Mg concentration and the Sc/Zr ratio. Large recrystallized grains were observed in the alloys with a high Zr content and a low Mg content (2.5, 4%) (Figure 12b,d). The recrystallized microstructure in the annealed alloys with 6% Mg had a high degree of homogeneity after heating to 500 °C (Figure 12e,f).
Traces of the β-phase etching were observed along the GBs in the recrystallized alloys (Figure 13). Larger etching pits of β-phase particles, uniformly distributed over the sections, were observed in the alloys with large grains. In the fine-grained alloys with small grain sizes, a large number of small etch pits located along the GBs were observed (Figure 13a). An increase in the Mg concentration leads to an increase in the number of etch pits and a decrease in their sizes (due to a decrease in the grain size in the alloys with high Mg content).
Prior to discussing the study results of the Al alloy properties, it should be noted that the cast alloy blanks were characterized by a slight heterogeneity in the microhardness distribution and resistivity in the longitudinal and transverse sections. This spread of properties is primarily due to the heterogeneous distribution of AEs and the heterogeneity of the macrostructure of the alloys. The greatest spread was observed for the alloys with 6% Mg. As an example, Table 2 presents the results of measuring the SER distribution in the cross-sections of the alloy ingots with different Sc/Zr ratios.
Table 2 shows that the SER at the edges of the samples is greater than in the central parts of the ingots of all alloys. The SER of the upper parts of the ingots was 0.1–0.15 μΩ·cm higher than the resistivity of the lower parts of the ingots (Table 2). This is primarily due to the different concentrations of Mg in different sections of the ingots. The EDS results revealed the differences in the Mg concentrations in different sections of the ingots to be 0.1–0.2% wt. that is acceptable in accordance with the GOST 4784-2019 [71]. Taking into account the contribution of Mg to the Al resistivity (~0.49 μΩ·cm/% at. [75]), it can be concluded that the EDS results explain well the spread in SER observed in different sections of the ingots. The studies of the UFG blanks have shown ECAP not to significantly affect the nature of the heterogeneity in the SER distribution.
To minimize the heterogeneity effect on the results obtained, the samples cut out from the central parts of the blanks were used for further investigations.
Figure 14 and Table 3 present the results of HV (Figure 14) and SER (Table 3) studies of Al–Mg alloys in the initial state. An increase in the Mg concentration leads to an increase in HV and SER of Al alloys at all Sc/Zr ratios. No significant effect of the Sc/Zr ratio on the microhardness of unannealed cast and UFG alloys was found (Figure 14). In all cases, the UFG alloys had higher microhardness and higher SER that was associated with an increase in the defect density in the alloys after ECAP. The difference between the SER values for the cast and UFG alloys was independent of the Mg concentration and did not exceed 0.16–0.19 μΩ·cm (Table 3).
Table 3 shows that increasing the Sc concentration and decreasing the Zr one lead to a slight increase in SER in the alloys with 4 and 6% Mg. In the alloys with 2.5% Mg, changing the Sc/Zr ratio had no significant effect on the SER. It should be noted that for all alloys, the SER values (ρ0) measured experimentally were less than their theoretical value ρth, calculated assuming the additivity of the SER contributions to the SER of pure aluminum (see [19,75]). This result indicates that during the crystallization process, some AEs were segregated from the solid solution or metal melt, leading to the formation of primary particles. An increase in the difference ρ = ρthρ0 in Al–6%Mg–Sc–Zr alloys is associated with the formation of β-phase particles during the crystallization process and a decrease in the Mg concentration in the aluminum crystal lattice.
Figure 15 shows the dependencies of change in the SER (∆ρ(t,T) = ρ0ρ(t,T)) and microhardness HV/HV0 on temperature of the 30 min annealing of the Al–Mg–Sc–Zr cast alloys with different Mg contents. To simplify the result analysis, the microhardness and SER values of the annealed alloys were normalized in Figure 15 to the values for the unannealed alloys (Figure 14 and Table 3). It can be seen from Figure 15a that in the Al–2.5%Mg–Sc–Zr cast alloys, the SER decrease begins at 300 °C and is independent of the Sc/Zr ratio. The precipitation onset of the secondary Al3(Sc,Zr) particles leads to an increase in the microhardness of the cast aluminum alloys. The maximum microhardness values were achieved after annealing at 350 °C. Further increase in the annealing temperature leads to a decrease in the microhardness, which, according to Orowan’s equation, is due to the rapid growth of the secondary Al3(Sc,Zr) particles.
At temperatures above 450 °C, a slight increase in the SER (decrease in ∆ρ) was observed. This effect is probably due to the partial dissolution of the β-phase particles and an increase in the Mg concentration in the Al crystal lattice. In favor of this assumption, a consistent increase in the SER at temperatures above 450 °C was observed, independent of the Sc and Zr concentrations in the alloy, within the measurement uncertainty of the SER.
The precipitation intensity of the secondary Al3(Sc,Zr) particles during heating the Al–Mg–Sc–Zr cast alloys can be characterized by an increase in hardness (∆HVmax) and a decrease in SER (∆ρmax = ρ0ρmin) during the heating process. Figure 15 and Table 3 show that ∆HVmax and ∆ρmax increase with increasing Sc content (increasing Sc/Zr ratio). The results indicate the alloys with higher Sc content to exhibit more intense precipitation of the secondary Al3(Sc,Zr) particles. An increase in the Mg concentration leads to a decrease in Δρmax and a slight increase in ∆HVmax. In the Al–6%Mg–0.10%Zr–0.22%Sc alloy (alloy #7-6.0), the hardness during annealing reaches 440 MPa, whereas in alloys #7-4.0 and #7-2.5, it amounts to 390 MPa and 370 MPa, respectively (Figure 15). A decrease in ∆ρmax indicates an increase in the Mg concentration, which leads to a reduction in the volume fraction of the secondary Al3(Sc,Zr) particles.
The nature of the dependence of the SER on the annealing temperature of the UFG alloys (Figure 16) was similar to the dependence ∆ρ(T) for the cast alloys. The scale of change in the SER in the annealed UFG alloys (∆ρmax) was similar to that during annealing of the cast alloys (Table 3 and Figure 16). Just as during the annealing of the cast alloys, an increase in the Sc/Zr ratio leads to an increase in the change rate in SER and an increase in ∆ρmax. The HV(T) dependence had a three-stage character as follows: (i) a low-temperature stage, when a slight decrease in HV was observed at (Stage I); (ii) a stage of increasing HV due to the precipitation of the secondary Al3(Sc,Zr) particles (Stage II); and a stage of intense softening of the UFG alloys at elevated annealing temperatures (Stage III). The scale of the increase in HV during annealing of the UFG alloys is noticeably smaller than during annealing of the cast alloys. The maximum HV values were achieved after annealing of the UFG alloys at 325–350 °C. Note that at these temperatures, recrystallization begins in the UFG alloys (Figure 12). The intense grain growth prevents the achievement of high hardness during annealing of the UFG alloys.
Figure 17 presents diagrams that illustrate the dependence of the ultimate tensile strength on the annealing temperature of cast (Figure 17a) and UFG alloys (Figure 17b). To facilitate the analysis of the results, the maximum UTS value is indicated for each alloy. A comparison of Figure 17a and Figure 17b reveals that ECAP leads to a slight increase in the UTS of aluminum alloys Al–Mg–Sc–Zr. The most significant increase in UTS is observed for unannealed cast alloys containing 2.5%Mg. The highest UTS values are achieved in alloys with a high Mg content and a high Sc/Zr ratio (Figure 16).
There is a close to linear relationship between the UTS and microhardness of cast and UFG alloys (Figure 18). The reliability coefficient of the linear correlation is relatively low (R2 ~ 0.7). This is probably due to a slight change in UTS during the precipitation of particles and ECAP. The proportionality coefficient between UTS and HV is close to 3.

3.2. Corrosion Tests

3.2.1. Effect of Mg Concentration and Sc/Zr Ratio: Unannealed Alloys

The stationary corrosion tests of the cast Al–2.5Mg–Sc–Zr alloy samples in an aqueous solution of 3% NaCl + 0.3% HCl led to the appearance of large through-wall defects with a depth of more than 2 mm. An increase in the Mg concentration leads to a decrease in the depth of the IGC defects to ~235 μm. The maximum depth of the IGC defects in the alloy with 6% Mg did not exceed 435 μm (Figure 19a). An increase in the Sc/Zr ratio led to a decrease in the depth of the IGC defects, but the scale of this effect was smaller than the one of Mg on the IGC depth.
ECAP had different effects on the IGC resistance of the alloys with 2.5 and 6% Mg. Single corrosion defects of small depth were observed in the UFG alloys with 2.5% Mg (Figure 19b). ECAP leads to a slight decrease in the number and depth of the IGC defects in the alloys with 4% Mg and had no noticeable effect on the nature of corrosion defects in the alloys with 6% Mg (Figure 19c,d). Thus, the nature of the ECAP effect depends on the Mg concentration in the alloy. The Sc/Zr ratio had no appreciable influence on the nature of corrosion damage of the UFG alloys (during 24 h tests in an aqueous solution of 3% NaCl + 0.3% HCl) noticeably.
It is also important to note that the characteristic sizes of the IGC defect areas in the UFG alloys were close to those for the cast alloys (Figure 19). This indicates that large IGC defects in the UFG alloys are also formed along the boundaries of dendritic cells formed during casting. It can be assumed that the temperature–deformation regimes of ECAP form a uniform UFG microstructure in the cast Al alloys but do not allow for the complete destruction of the initial dendritic boundaries.
Figure 20 shows the Tafel lg(i)–E curves for the Al–Mg–Sc–Zr cast and UFG unannealed alloys with different Sc/Zr ratios. There is no passive region on the lg(i)–E curves. The lg(i)–E curves had a conventional appearance, which allows reliable determination of the corrosion potential Ecorr and the corrosion current density icorr. The analysis of the presented curves shows that increasing the magnesium concentration from 2.5 to 6% at a constant Sc/Zr ratio leads to a decrease in Ecorr and an increase in the corrosion current density icorr.
Figure 21a presents the dependence of the corrosion current density icorr for the alloys in the initial unannealed state on the Sc/Zr ratio. It can be seen from Figure 21a that increasing the Sc concentration and decreasing the Zr concentration leads to a decrease in the corrosion current density icorr in the cast alloys with 6% Mg. In the alloys with 2.5% Mg and 4% Mg, the change in the Sc/Zr ratio had no appreciable effect on the corrosion current density icorr. An increase in the Mg concentration from 2.5 to 6% led to a decrease in the corrosion potential Ecorr by 30–50 mV for the cast alloys and by 50–70 mV for the UFG alloys (Figure 21b). Changing the Sc/Zr ratio did not affect the corrosion potential noticeably as follows: the spread of properties for the three samples of the series was comparable to the effect of the Sc/Zr ratio.
Analysis of the data presented in Figure 21a shows that ECAP leads to an increase in the corrosion current density icorr for all the alloys studied. The largest scale of the corrosion rate increase Vcorr ~ icorr after ECAP was observed for the alloys with 6% Mg. The scale dependence of the corrosion rate increase ∆icorr = iUFGicast on the Mg concentration indirectly indicates the effect of ECAP on the parameters of Mg-containing β-phase particles to be the main origin for the increase in icorr.
The following two types of corrosion defects were found on the sample surfaces after electrochemical testing: large IGC defects formed in the places of predominant release of primary β-phase particles (Figure 22a) and fine etch pits at the GBs apparently associated with the corrosion destruction of new GBs formed during ECAP (Figure 22b). Hereinafter, the large IGC defects will be referred to as Type I defects and the fine etch pits at the GBs—as Type II defects. The sizes of the large Type I defects in the UFG alloys were comparable to those of similar defects in the cast alloys, whereas the sizes of Type II defects were comparable to the grain sizes in the unannealed UFG alloys.

3.2.2. Effect of Annealing

To study the annealing effect on the IGC resistance of the cast and UFG alloys, 24 h stationary tests were conducted in an aqueous solution of 3% NaCl + 0.3% HCl. The samples were annealed at 350, 400, 450, and 500 °C (30 min).
The study results show that annealing of the cast alloys leads to a decrease in the depth of the IGC defects (Figure 23a). A similar behavior was observed for the dependence of the maximum depth of the IGC defects on the annealing temperature (Figure 23b). The largest scale of the decrease in the depth of the IGC defects during annealing was observed for the cast alloys with 4% Mg and 6% Mg (Figure 23). After annealing at 500 °C, only a few IGC defects of a depth of <5 μm were observed on the cast alloy surfaces with 6% Mg.
A similar character of the depth dependencies of the IGC defects on the annealing temperature was observed for the UFG alloys (Figure 23). However, it should be noted that at all annealing temperatures, the average sizes of the IGC defects in the annealed UFG alloys were smaller than in the annealed cast alloys. An increase in the Mg concentration leads to a slight increase in the depth of the IGC defects in the annealed UFG alloys. The change in the Sc/Zr ratio had no significant effect on the nature and parameters of the IGC defects in the annealed UFG alloys.
Next, the effect of annealing temperature on the electrochemical study results of the cast and UFG Al–Mg–Sc–Zr alloys with different Sc/Zr ratios will be analyzed.
A summary of the research results is presented in Figure 24. Figure 24a shows that in the Al–2.5%Mg–Sc–Zr cast alloys, an increase in the corrosion current density begins at 350 °C. The maximum values of the icorr were achieved after annealing at 450 °C. A decrease in icorr was observed with a further increase in the annealing temperature up to 500 °C (Figure 24a). It is important to note that the maximum corrosion current density depends on the Sc/Zr ratio and increases with increasing Sc content. Further increase in the annealing temperature leads to a decrease in the icorr. Similar trends of the corrosion current density dependencies on the annealing temperature were observed for the cast alloys with 4%Mg (Figure 24c). It should be noted that an increase in the Mg concentration leads to a decrease in the increase scale in the icorr. In the cast alloys with 6% Mg, the effect of increasing the corrosion current density icorr during annealing was absent (Figure 24e). For alloys with 6%Mg, the icorr(T) dependence had a two-stage character as follows: annealing at temperatures above 300–350 °C leads to a decrease in icorr to values that are weakly dependent on the Sc/Zr ratio (Figure 24e).
The dependence of the corrosion potential on the annealing temperature of cast alloys (Figure 24b,d,f) has a two-stage character. An increase in annealing temperature to 400–450 °C results in an increase in corrosion potential by 30–50 mV. Annealing at 500 °C causes a decrease in Ecorr by 40–100 mV, likely due to the dissolution of the β-phase particles and an increase in the Mg concentration in the Al crystal lattice.
The nature of the icorr(T) dependencies for the UFG alloys was similar to that for the cast alloys. This suggests that the electrochemical properties in the cast and UFG alloys are controlled by the same factors, but these ones are more pronounced in the UFG alloys. This leads to a significant increase in icorr in partially annealed UFG alloys compared to the cast alloys. The corrosion current density values in fully annealed UFG alloys were comparable to those of the cast alloys annealed at 500 °C.
Figure 25 shows metallographic images of the annealed sample surfaces after electrochemical testing. As noted above, the corrosion failure of the cast Al–Mg–Sc–Zr alloys is characterized by the presence of the following two types of IGC defects: large defects of Type I and fine defects of Type II (Figure 22). Analysis of the results presented shows that annealing at 300–450 °C does not significantly affect the size and distribution pattern of the large IGC defects of Type I. Annealing in the temperature range of 350–450 °C leads to a significant increase in both the size and the area covered by Type II IGC defects. As illustrated in Figure 25, after electrochemical testing, intensive formation of fine Type II IGC defects was observed on the surfaces of the samples annealed at 400 °C.
The decrease in the corrosion current density at elevated annealing temperatures for the cast alloys is associated with the onset of the diffusion-controlled dissolution of the β-phase particles formed during crystallization. The metallographic study results show a decrease in the area of Type I (Figure 26) and Type II (Figure 25) IGC defects on the surfaces of the cast samples after annealing at 500 °C. A sharp decrease in the number and the area of Type II IGC defects was observed on the surfaces of the samples annealed at 500 °C (Figure 26b). This confirms the assumption that the β-phase particles dissolve during annealing of the cast alloys. It is also indirectly evidenced by a slight increase in SER at the annealing temperatures of 450–500 °C (Figure 15).

4. Discussion

4.1. Features of Structure and Corrosion Behavior of Cast and UFG Alloys

First, the experimental results are summarized, and the key effects are highlighted. The focus is on the microstructure features and the corrosion resistance study results of the Al–Mg–Sc–Zr alloys.
(i)
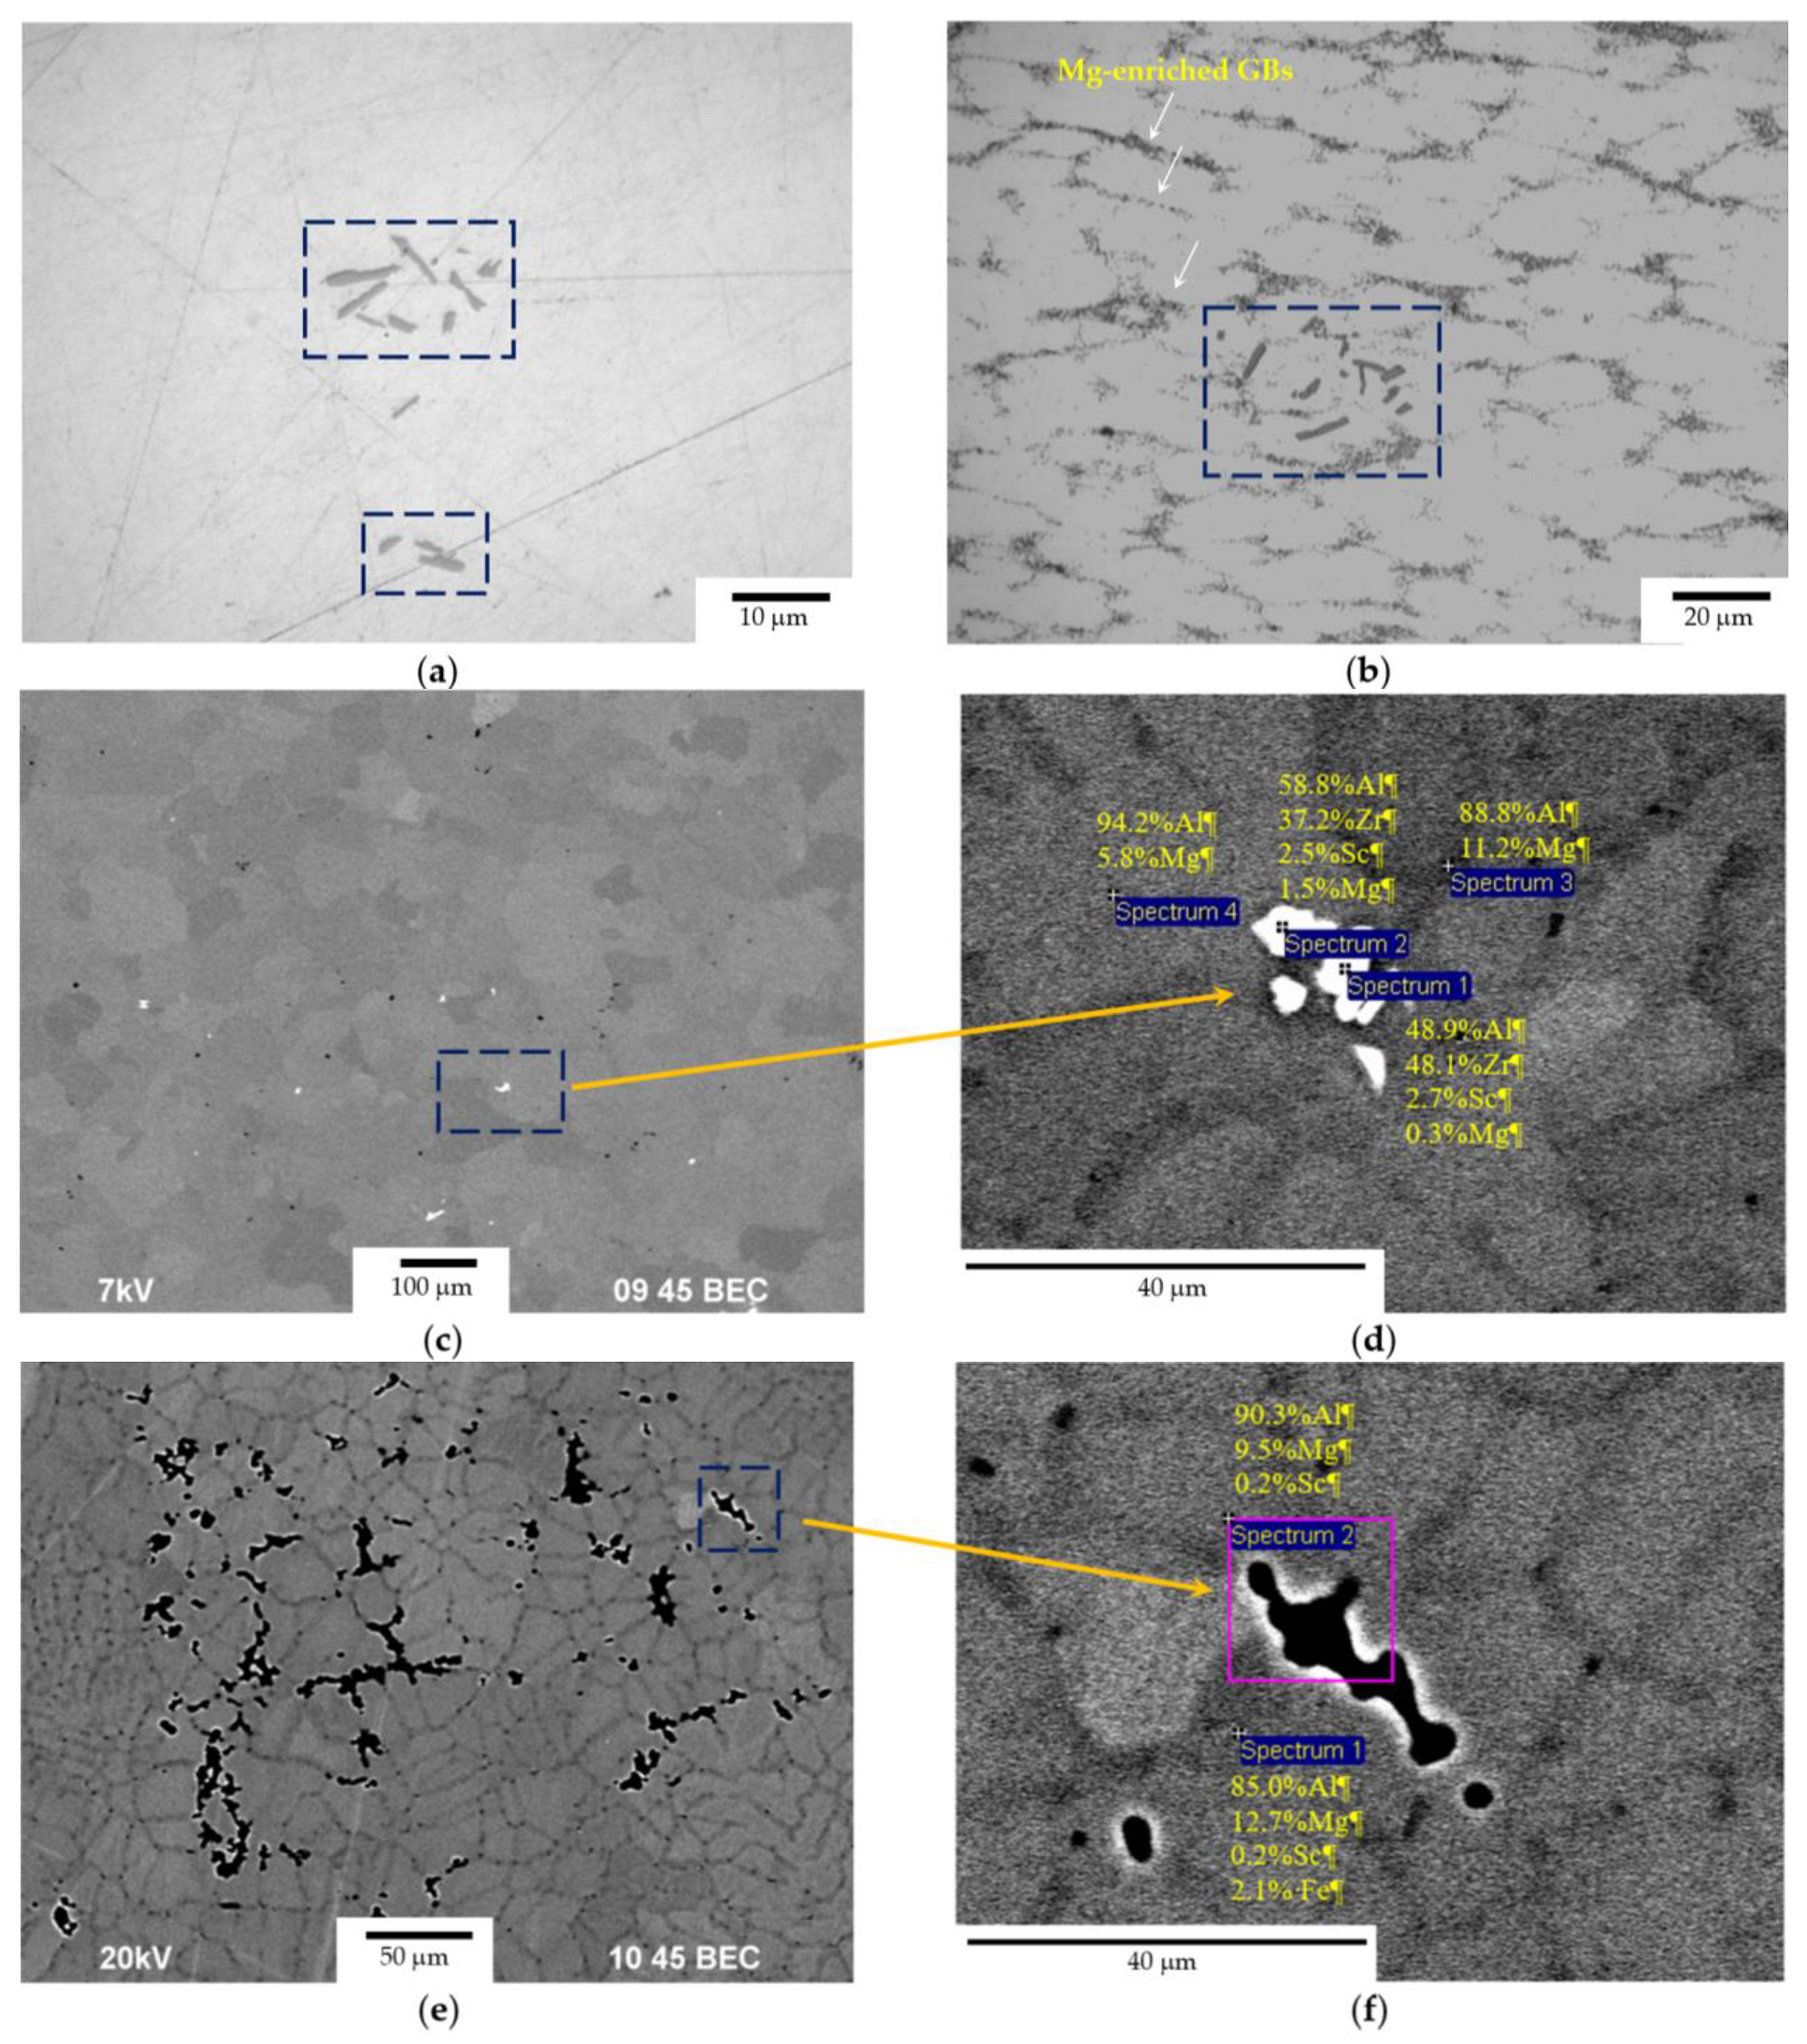
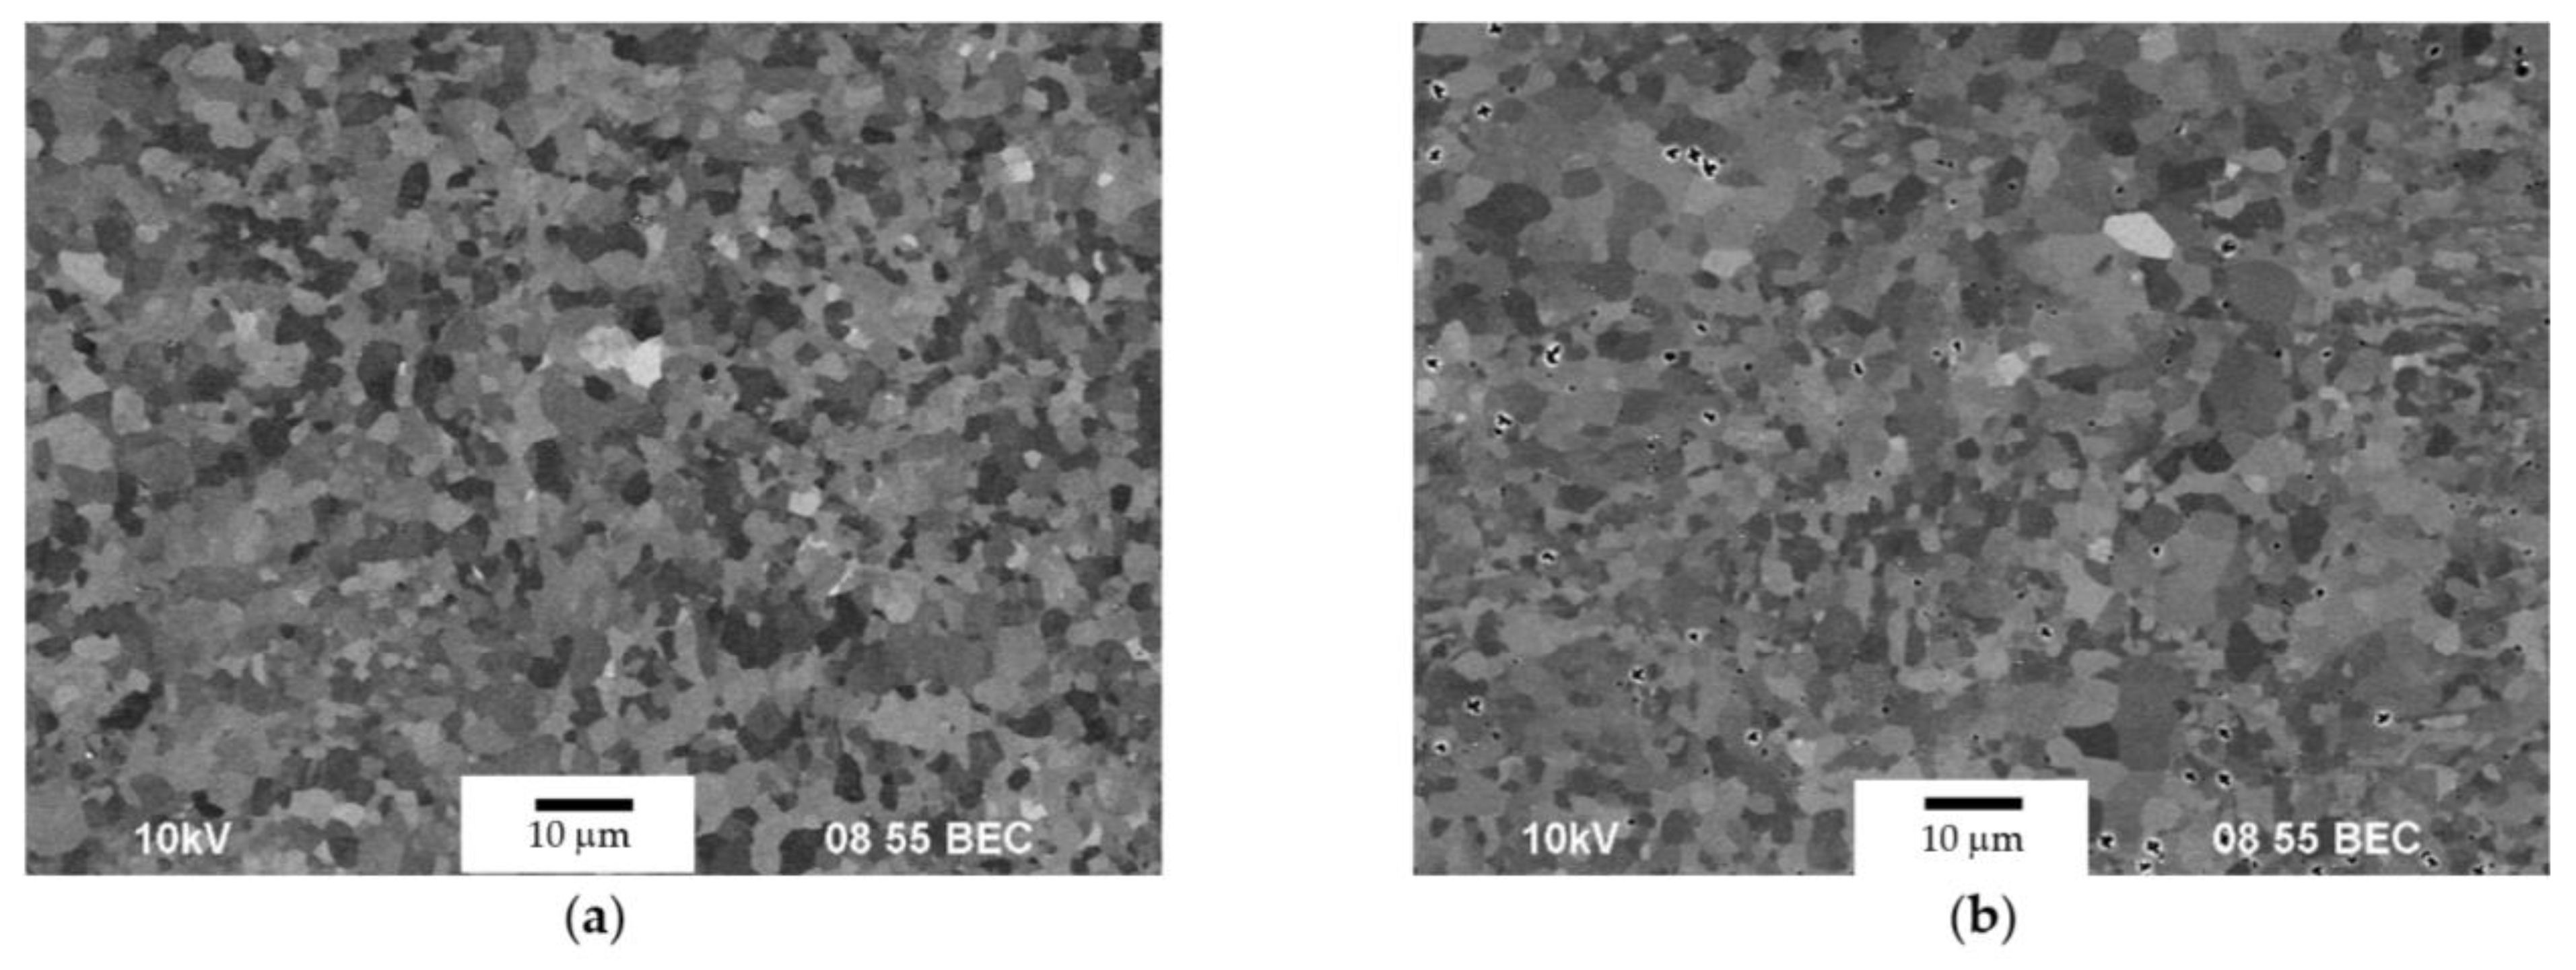
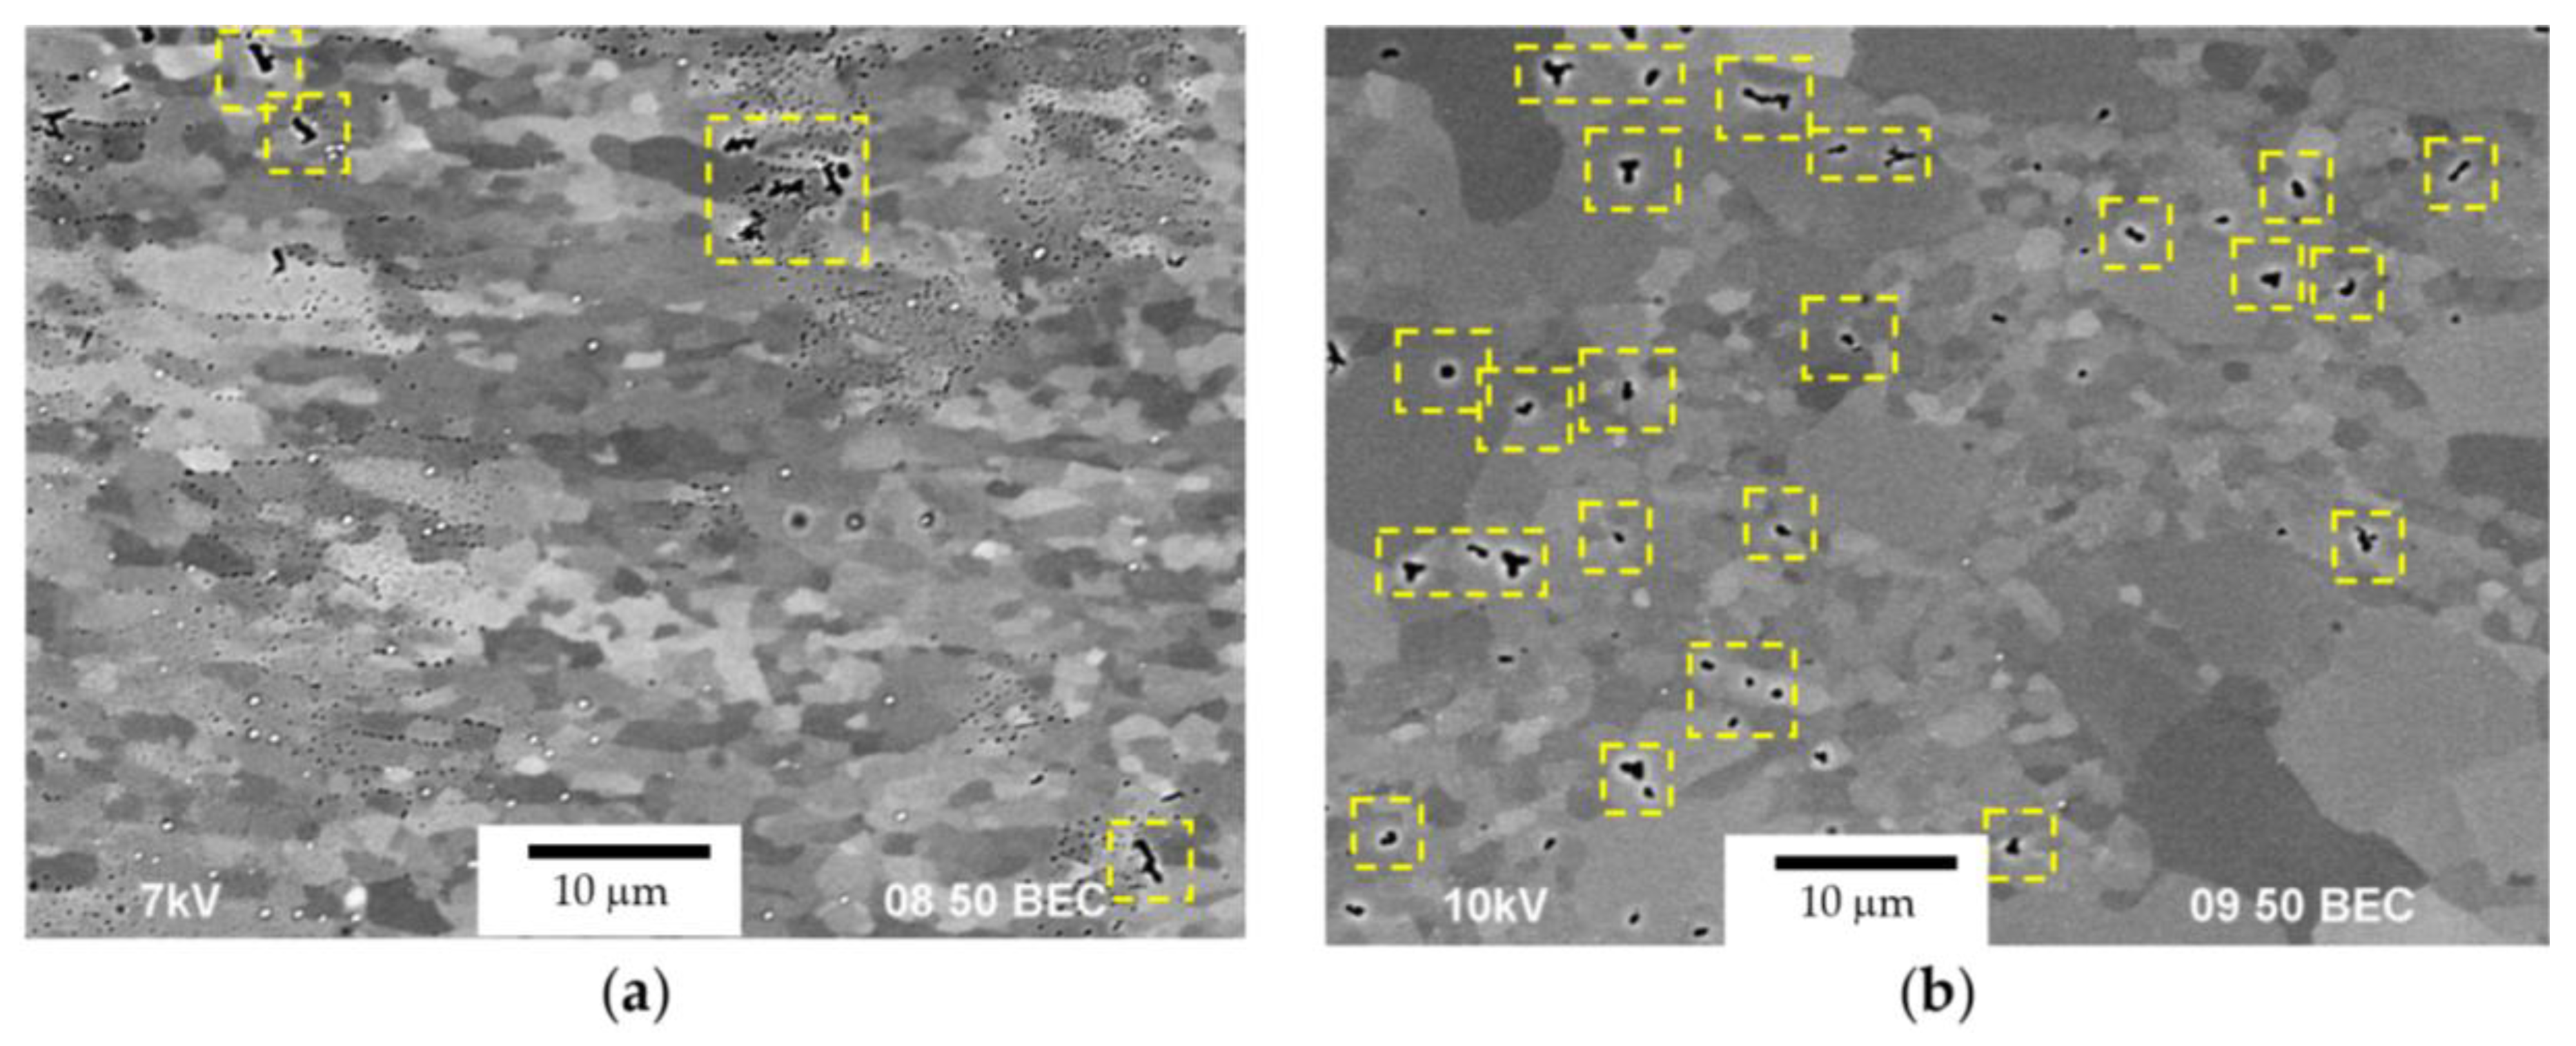
The cast alloys have a non-uniform macrostructure. There are large dendrites, several millimeters long, located along the sample edges. There are small equiaxial grains in the central sample parts. An increase in the Mg concentration leads to an increase in the fraction of small equiaxial grains and a decrease in the average grain size. Primary Al3(Sc,Zr) particles act as the structure modifiers of Al alloys. Thus, an increase in the Sc/Zr ratio leads to a decrease in the average grain size. Large primary β-phase particles are observed along the GBs and in dendrites formed during cooling the ingots. Increasing the Mg concentration leads to an increase in the area of the GBs occupied by the primary β-phase particles.
(ii)
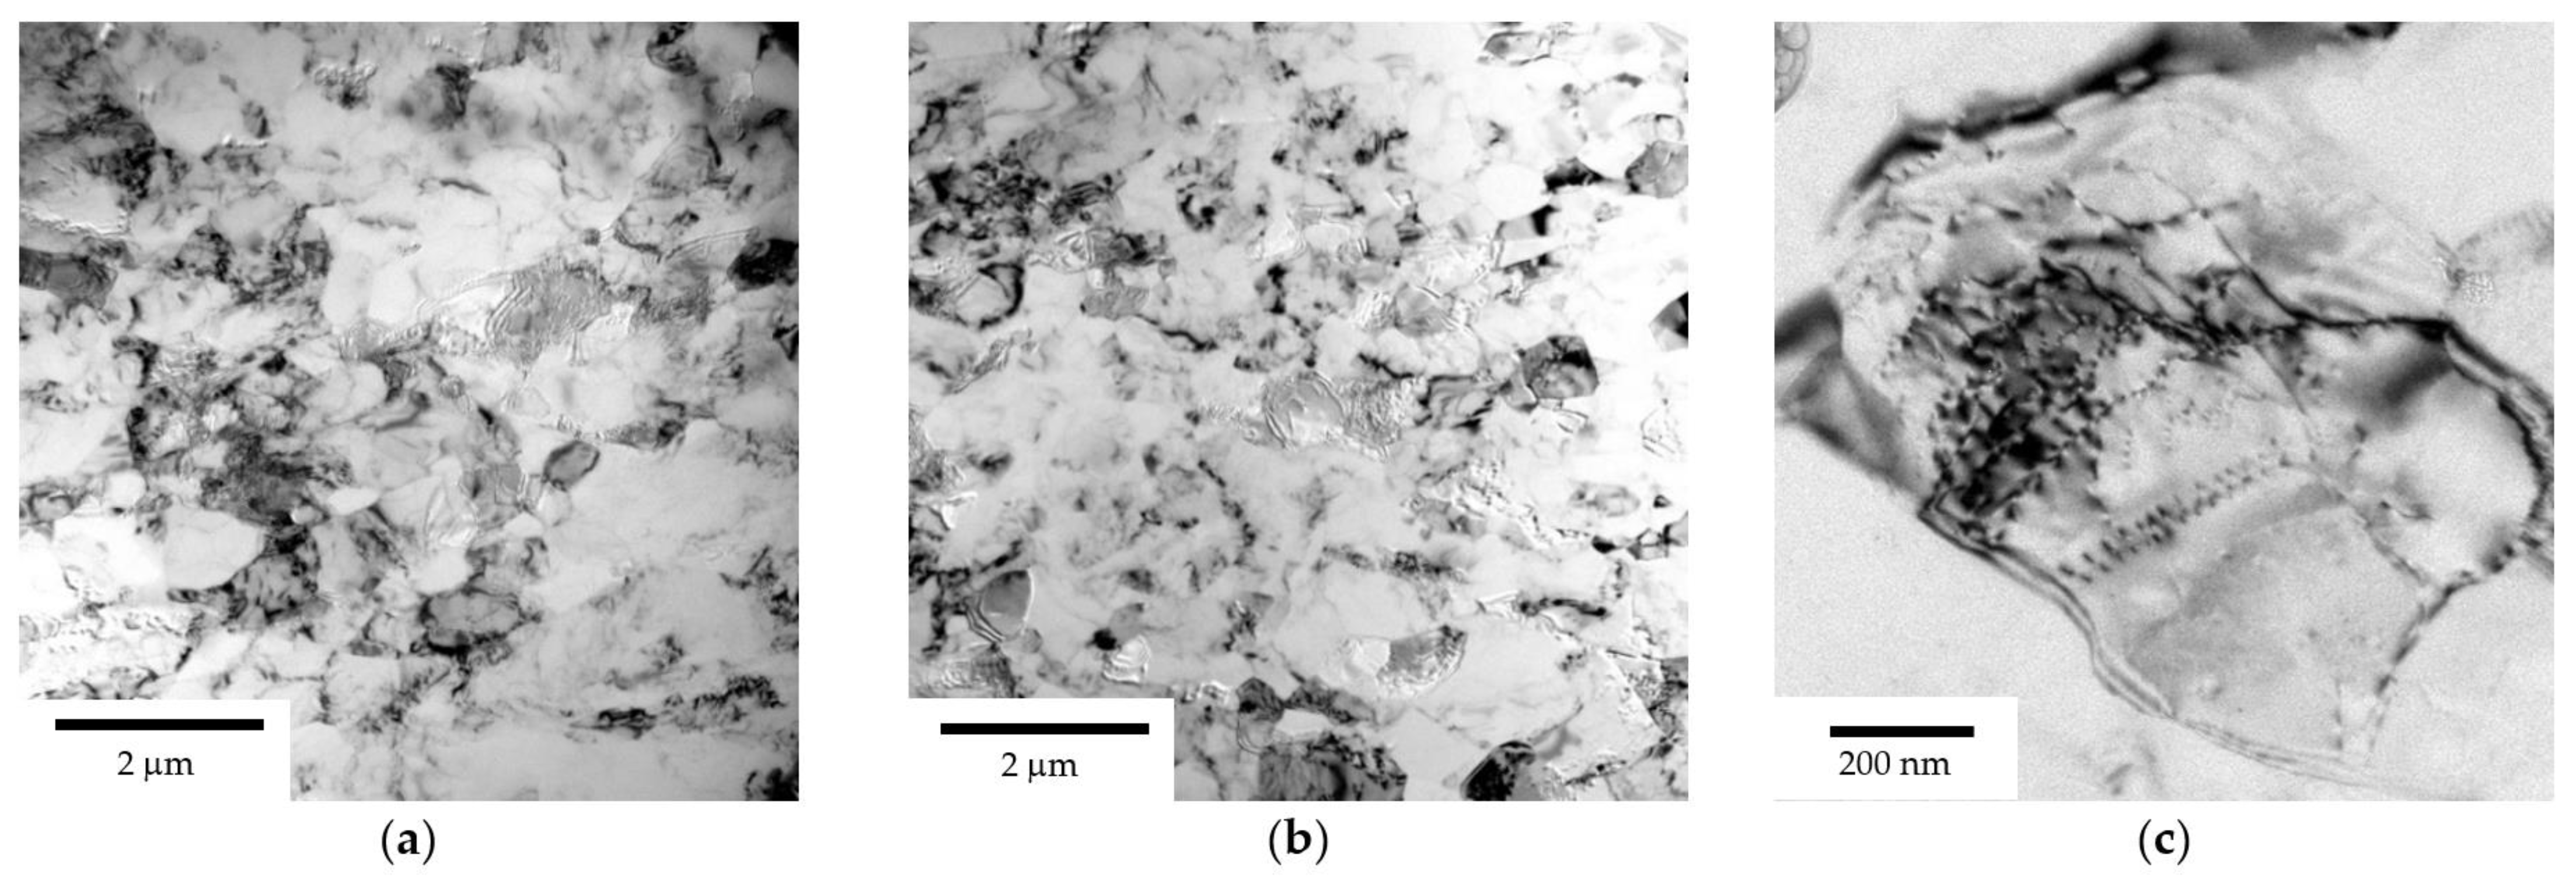
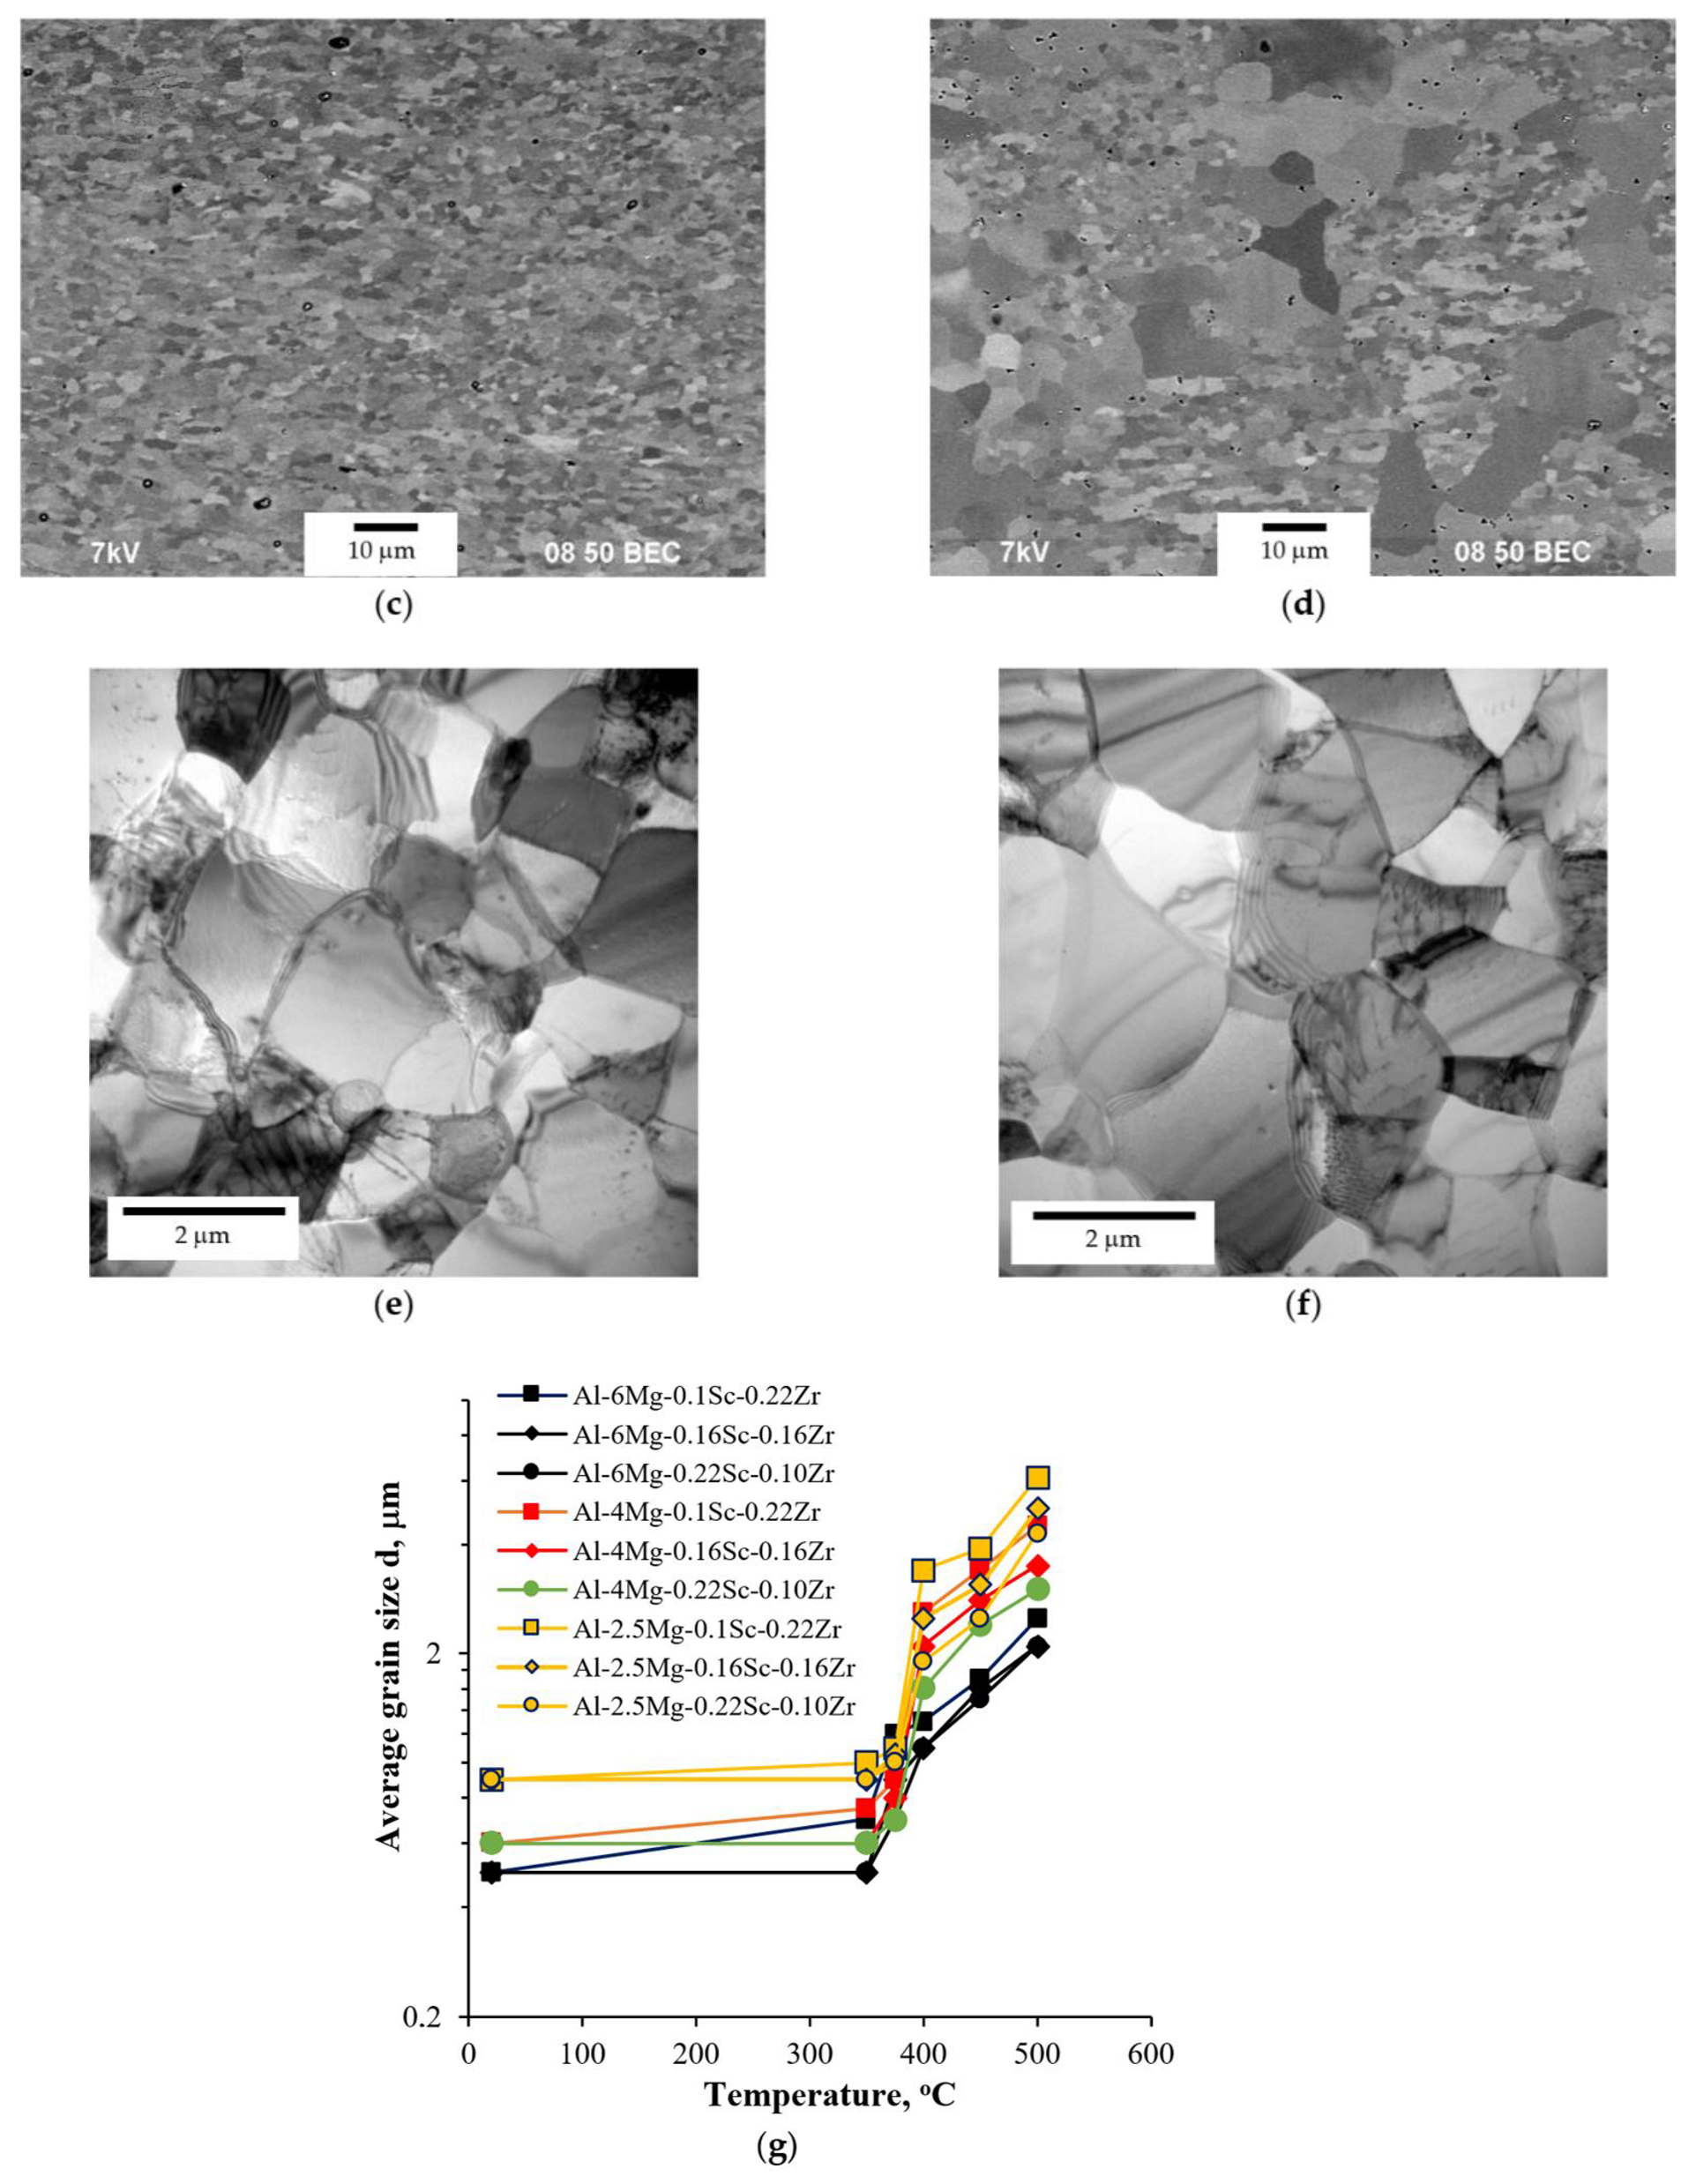
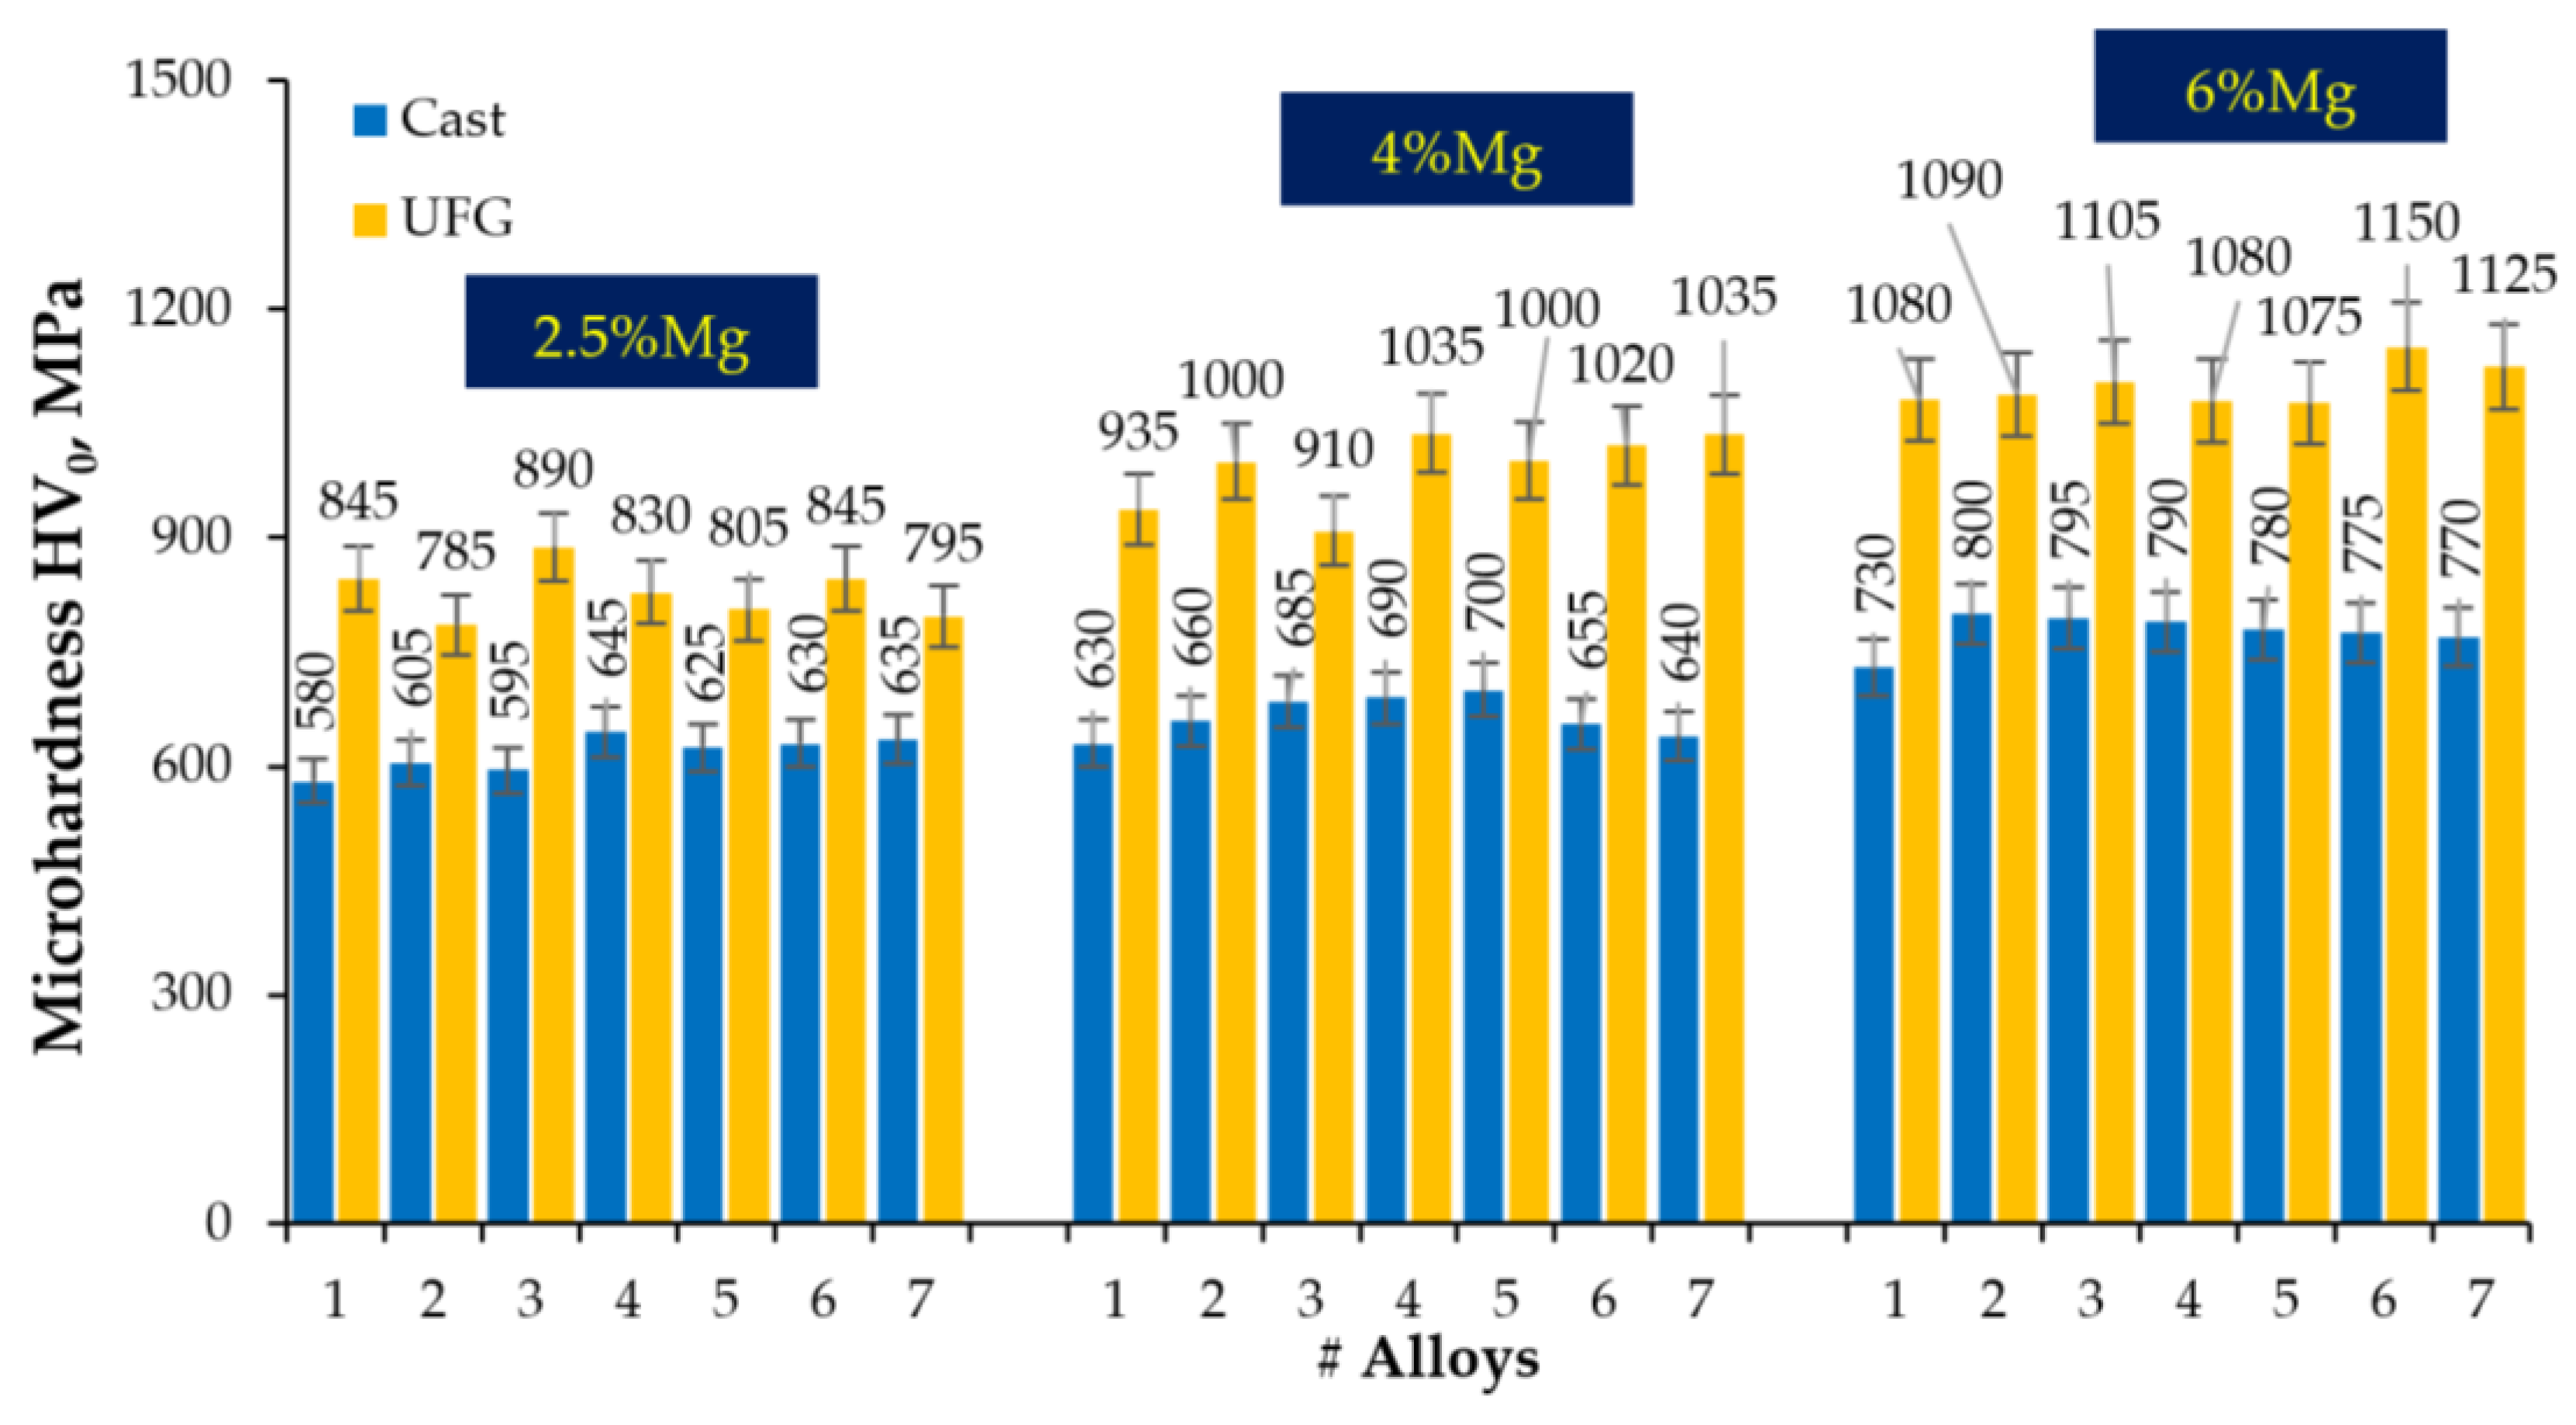
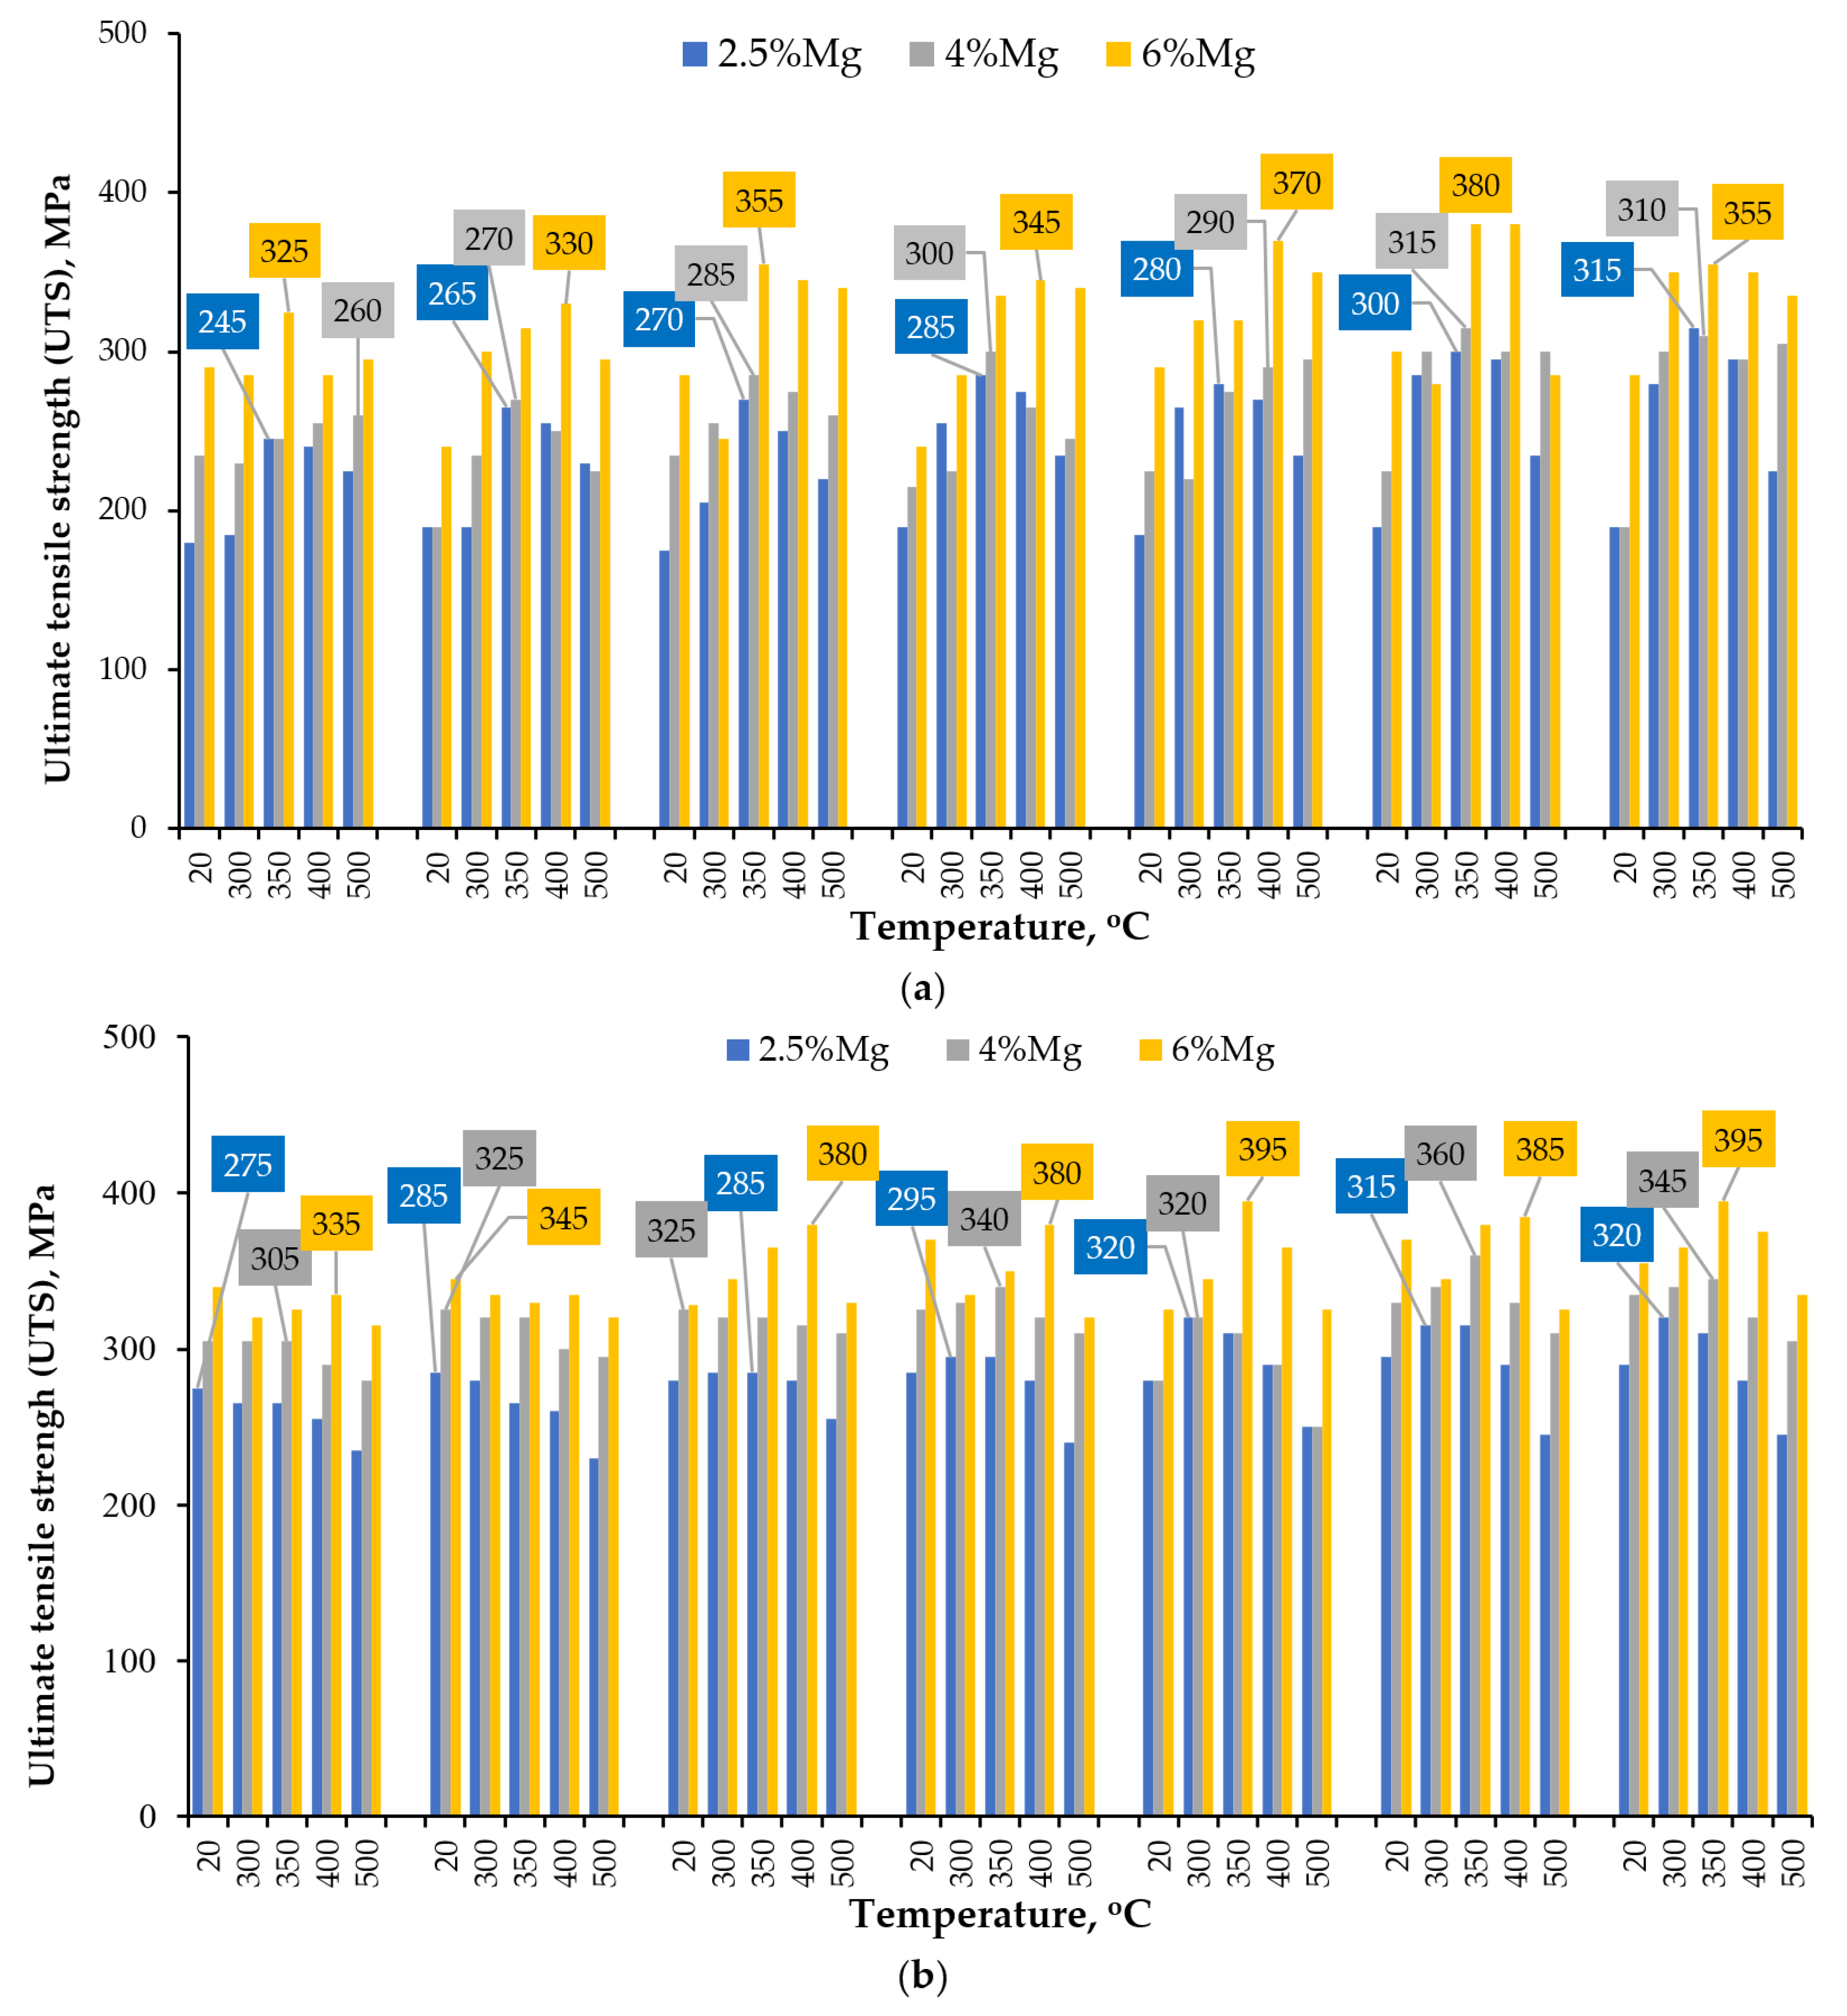
Warm (250–275 °C) severe plastic deformation under ECAP leads to the formation of a homogeneous UFG microstructure. An increase in the Mg concentration from 2.5 to 6% leads to a slight decrease in the grain size from 0.6–0.8 μm to 0.3–0.5 μm, as well as to an increase in the microhardness and SER of the alloys.
(iii)
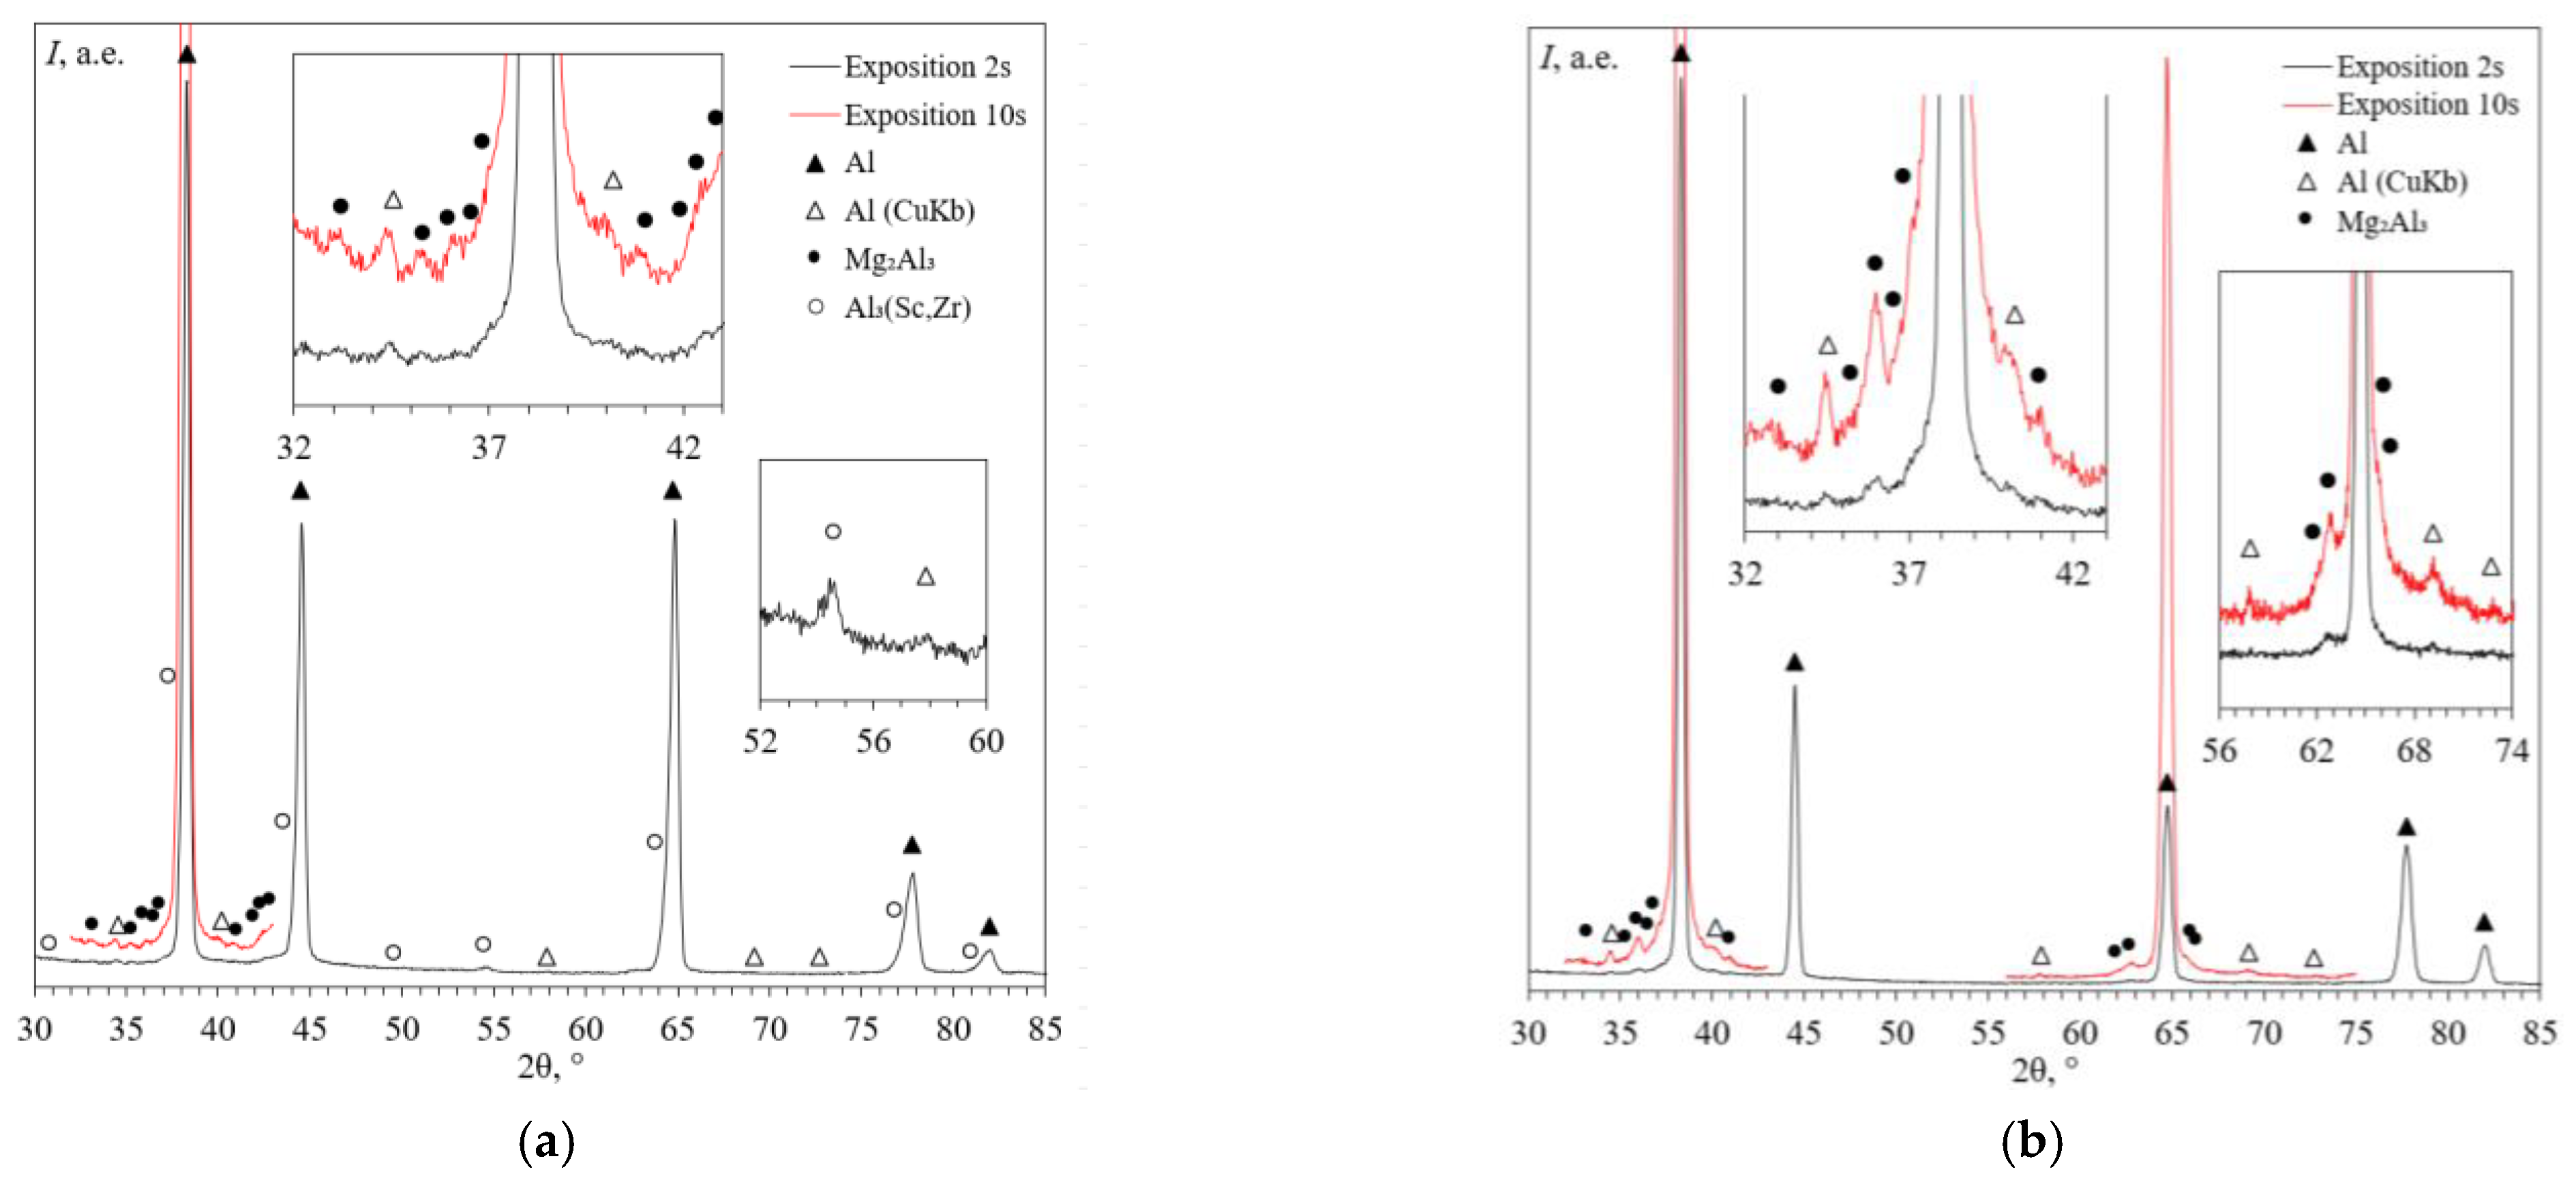
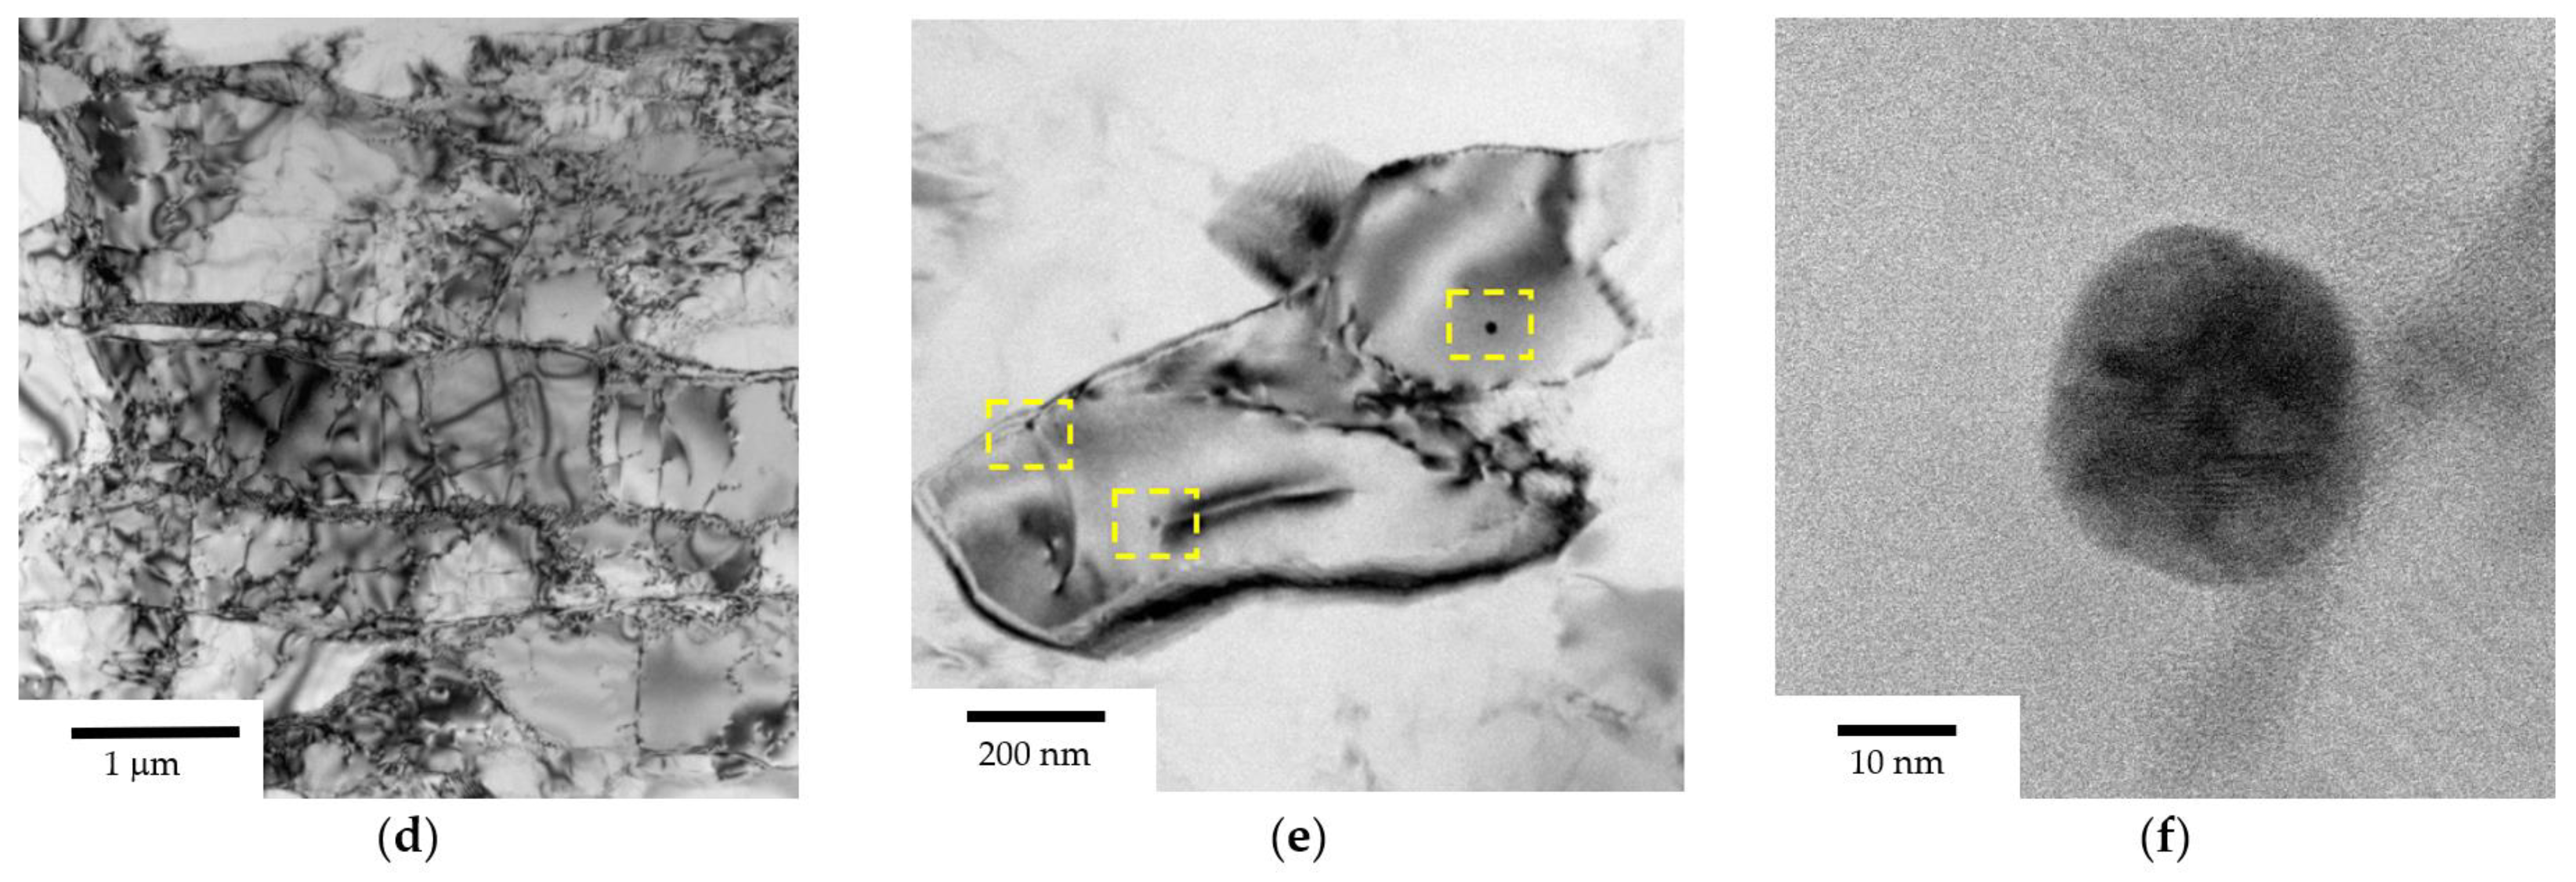
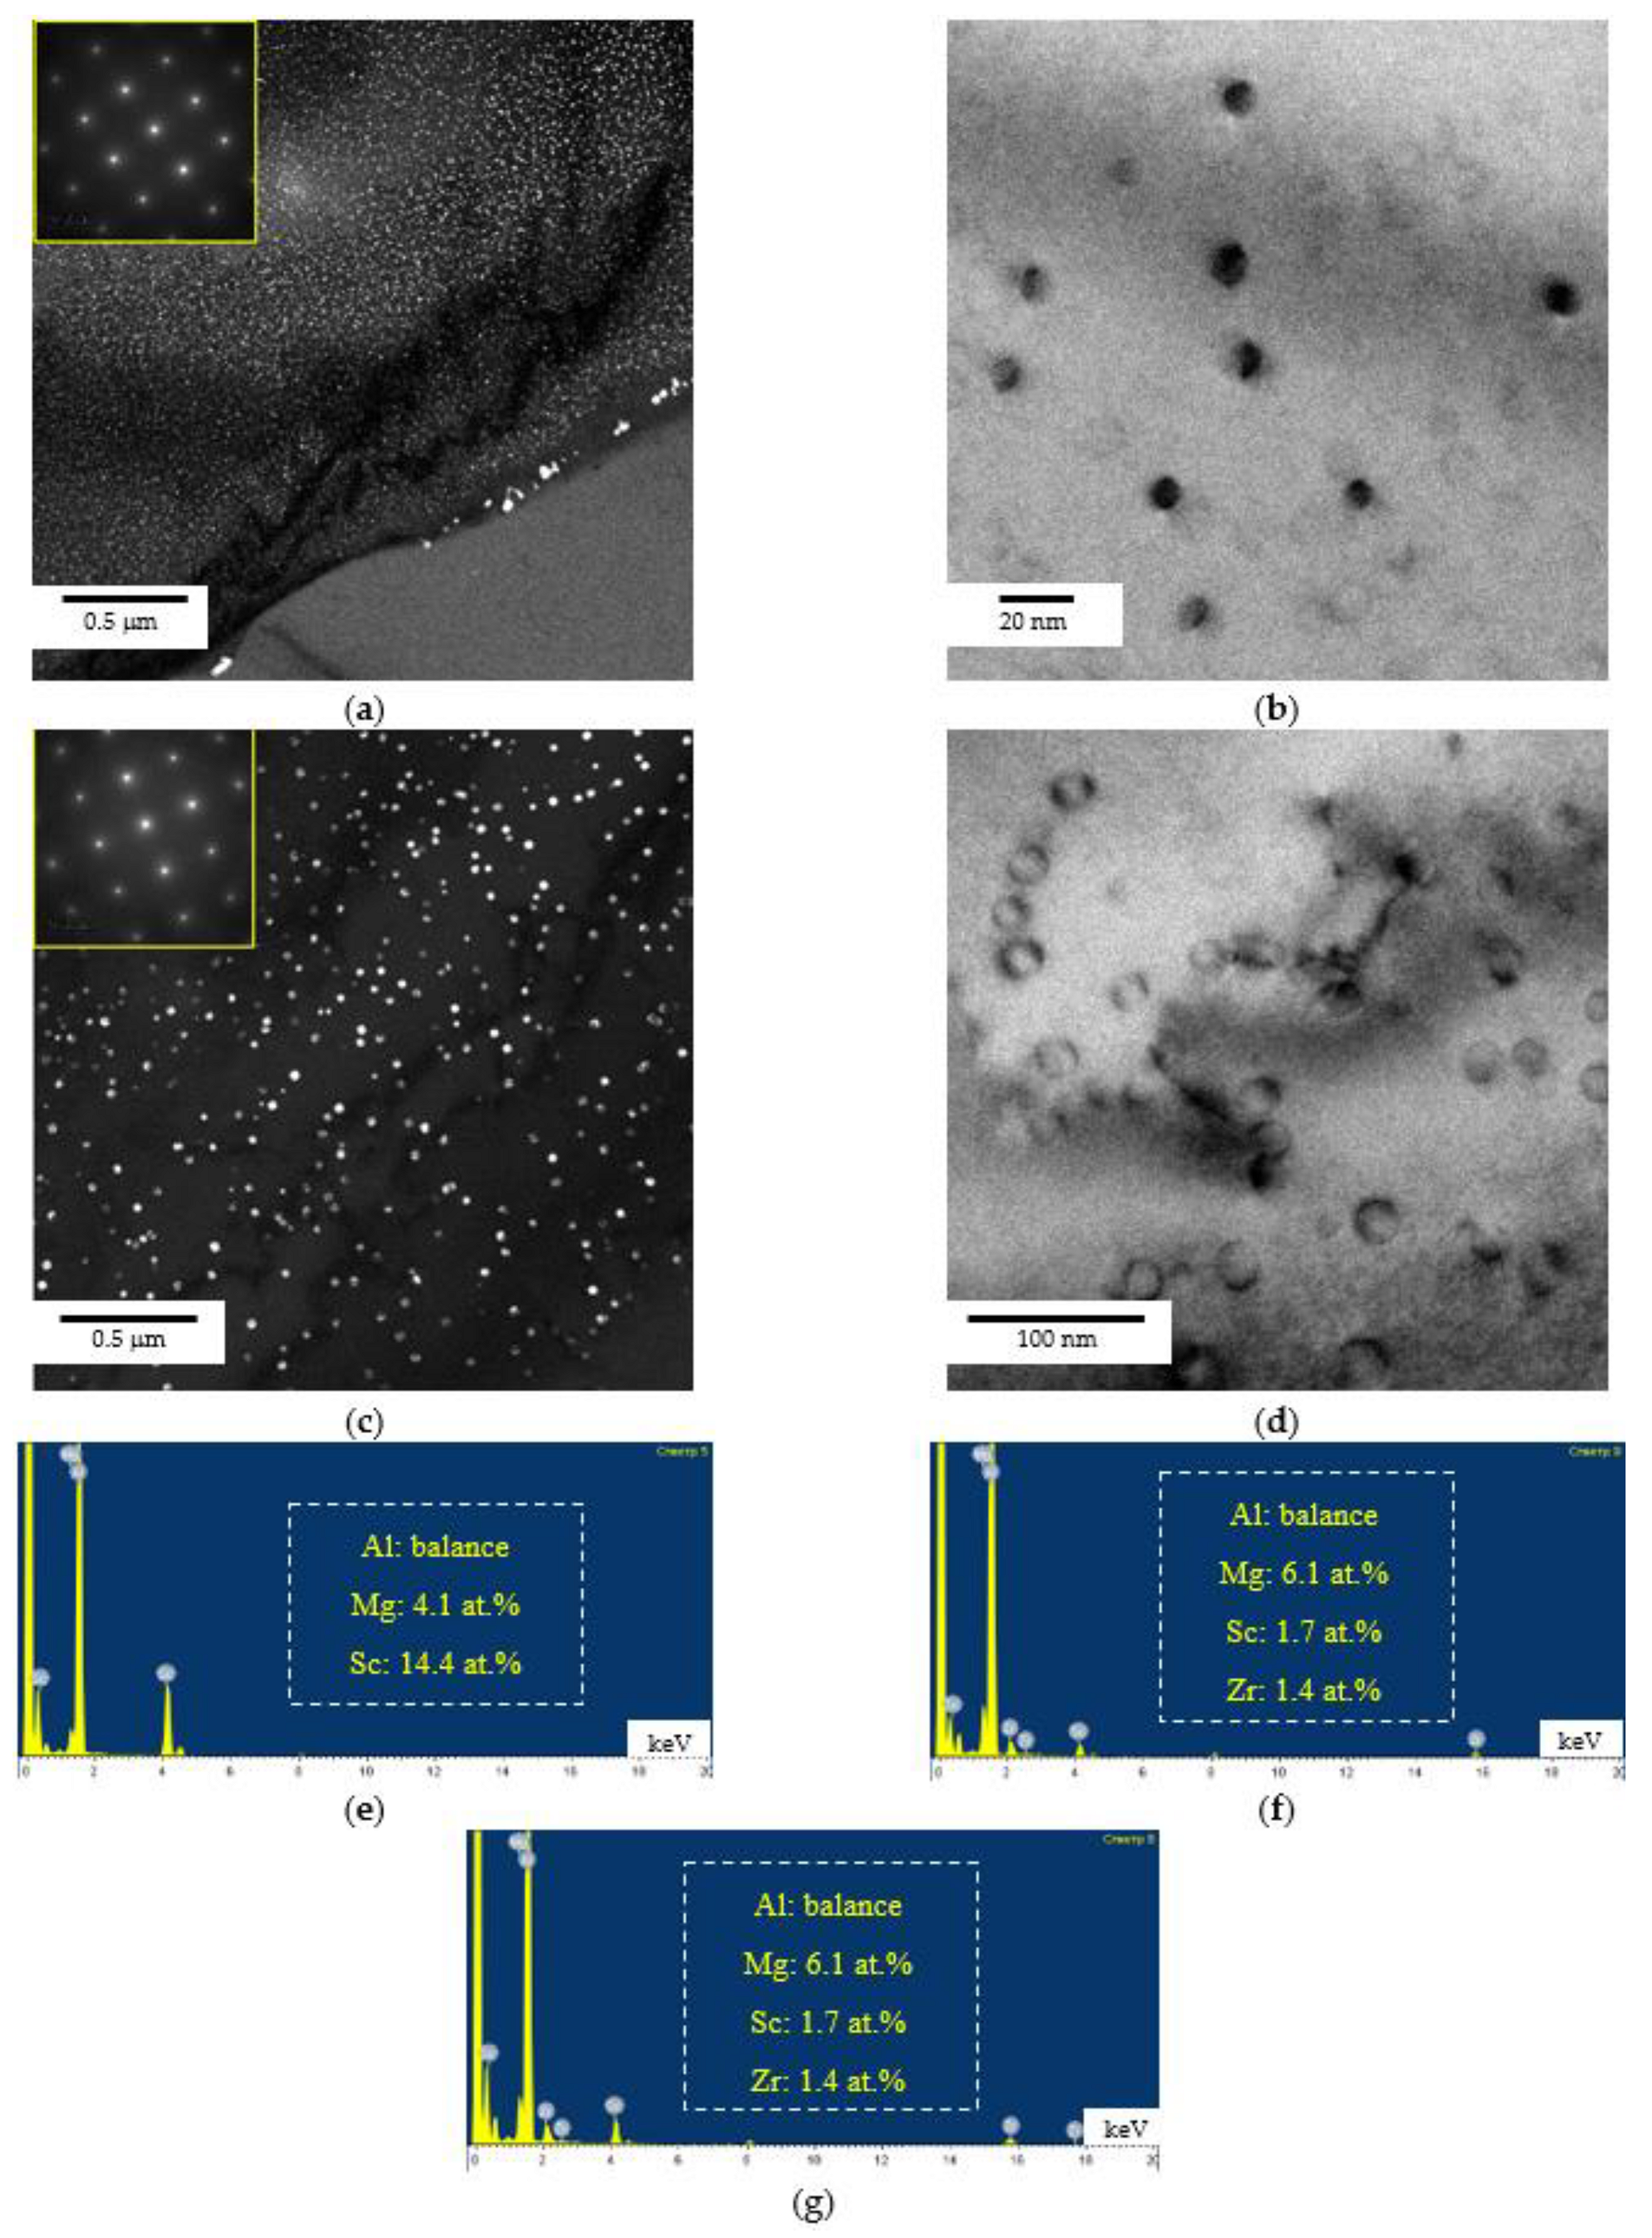
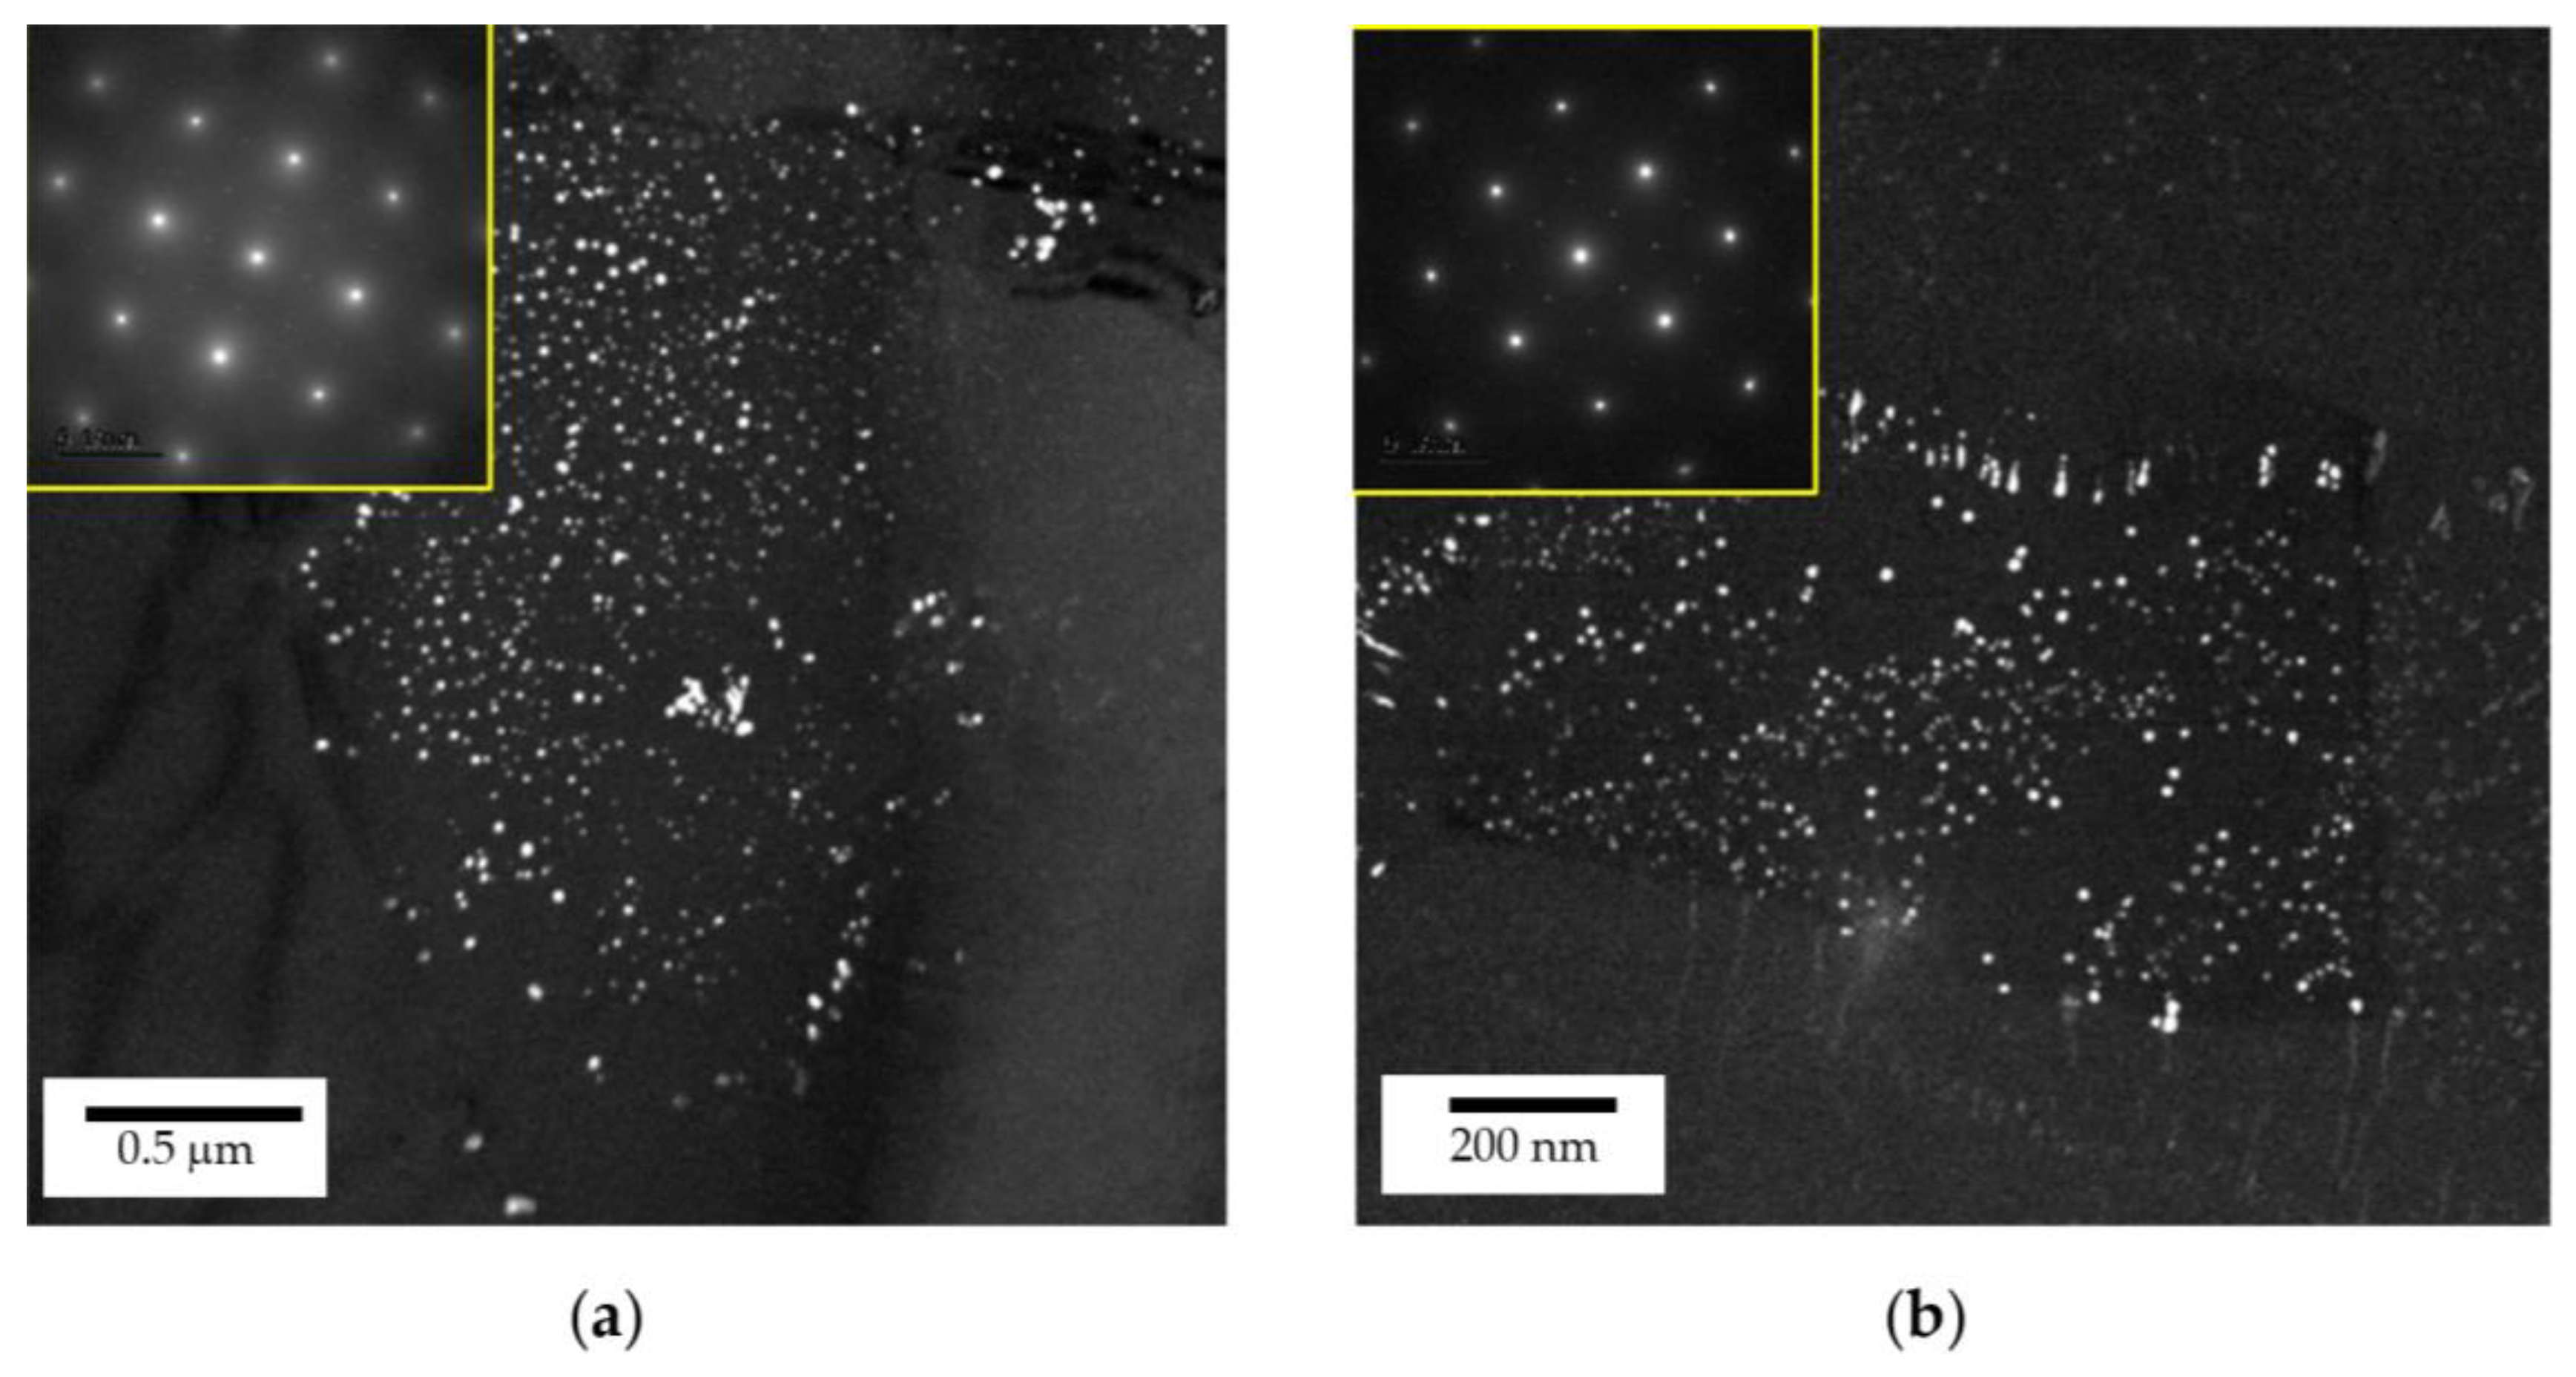
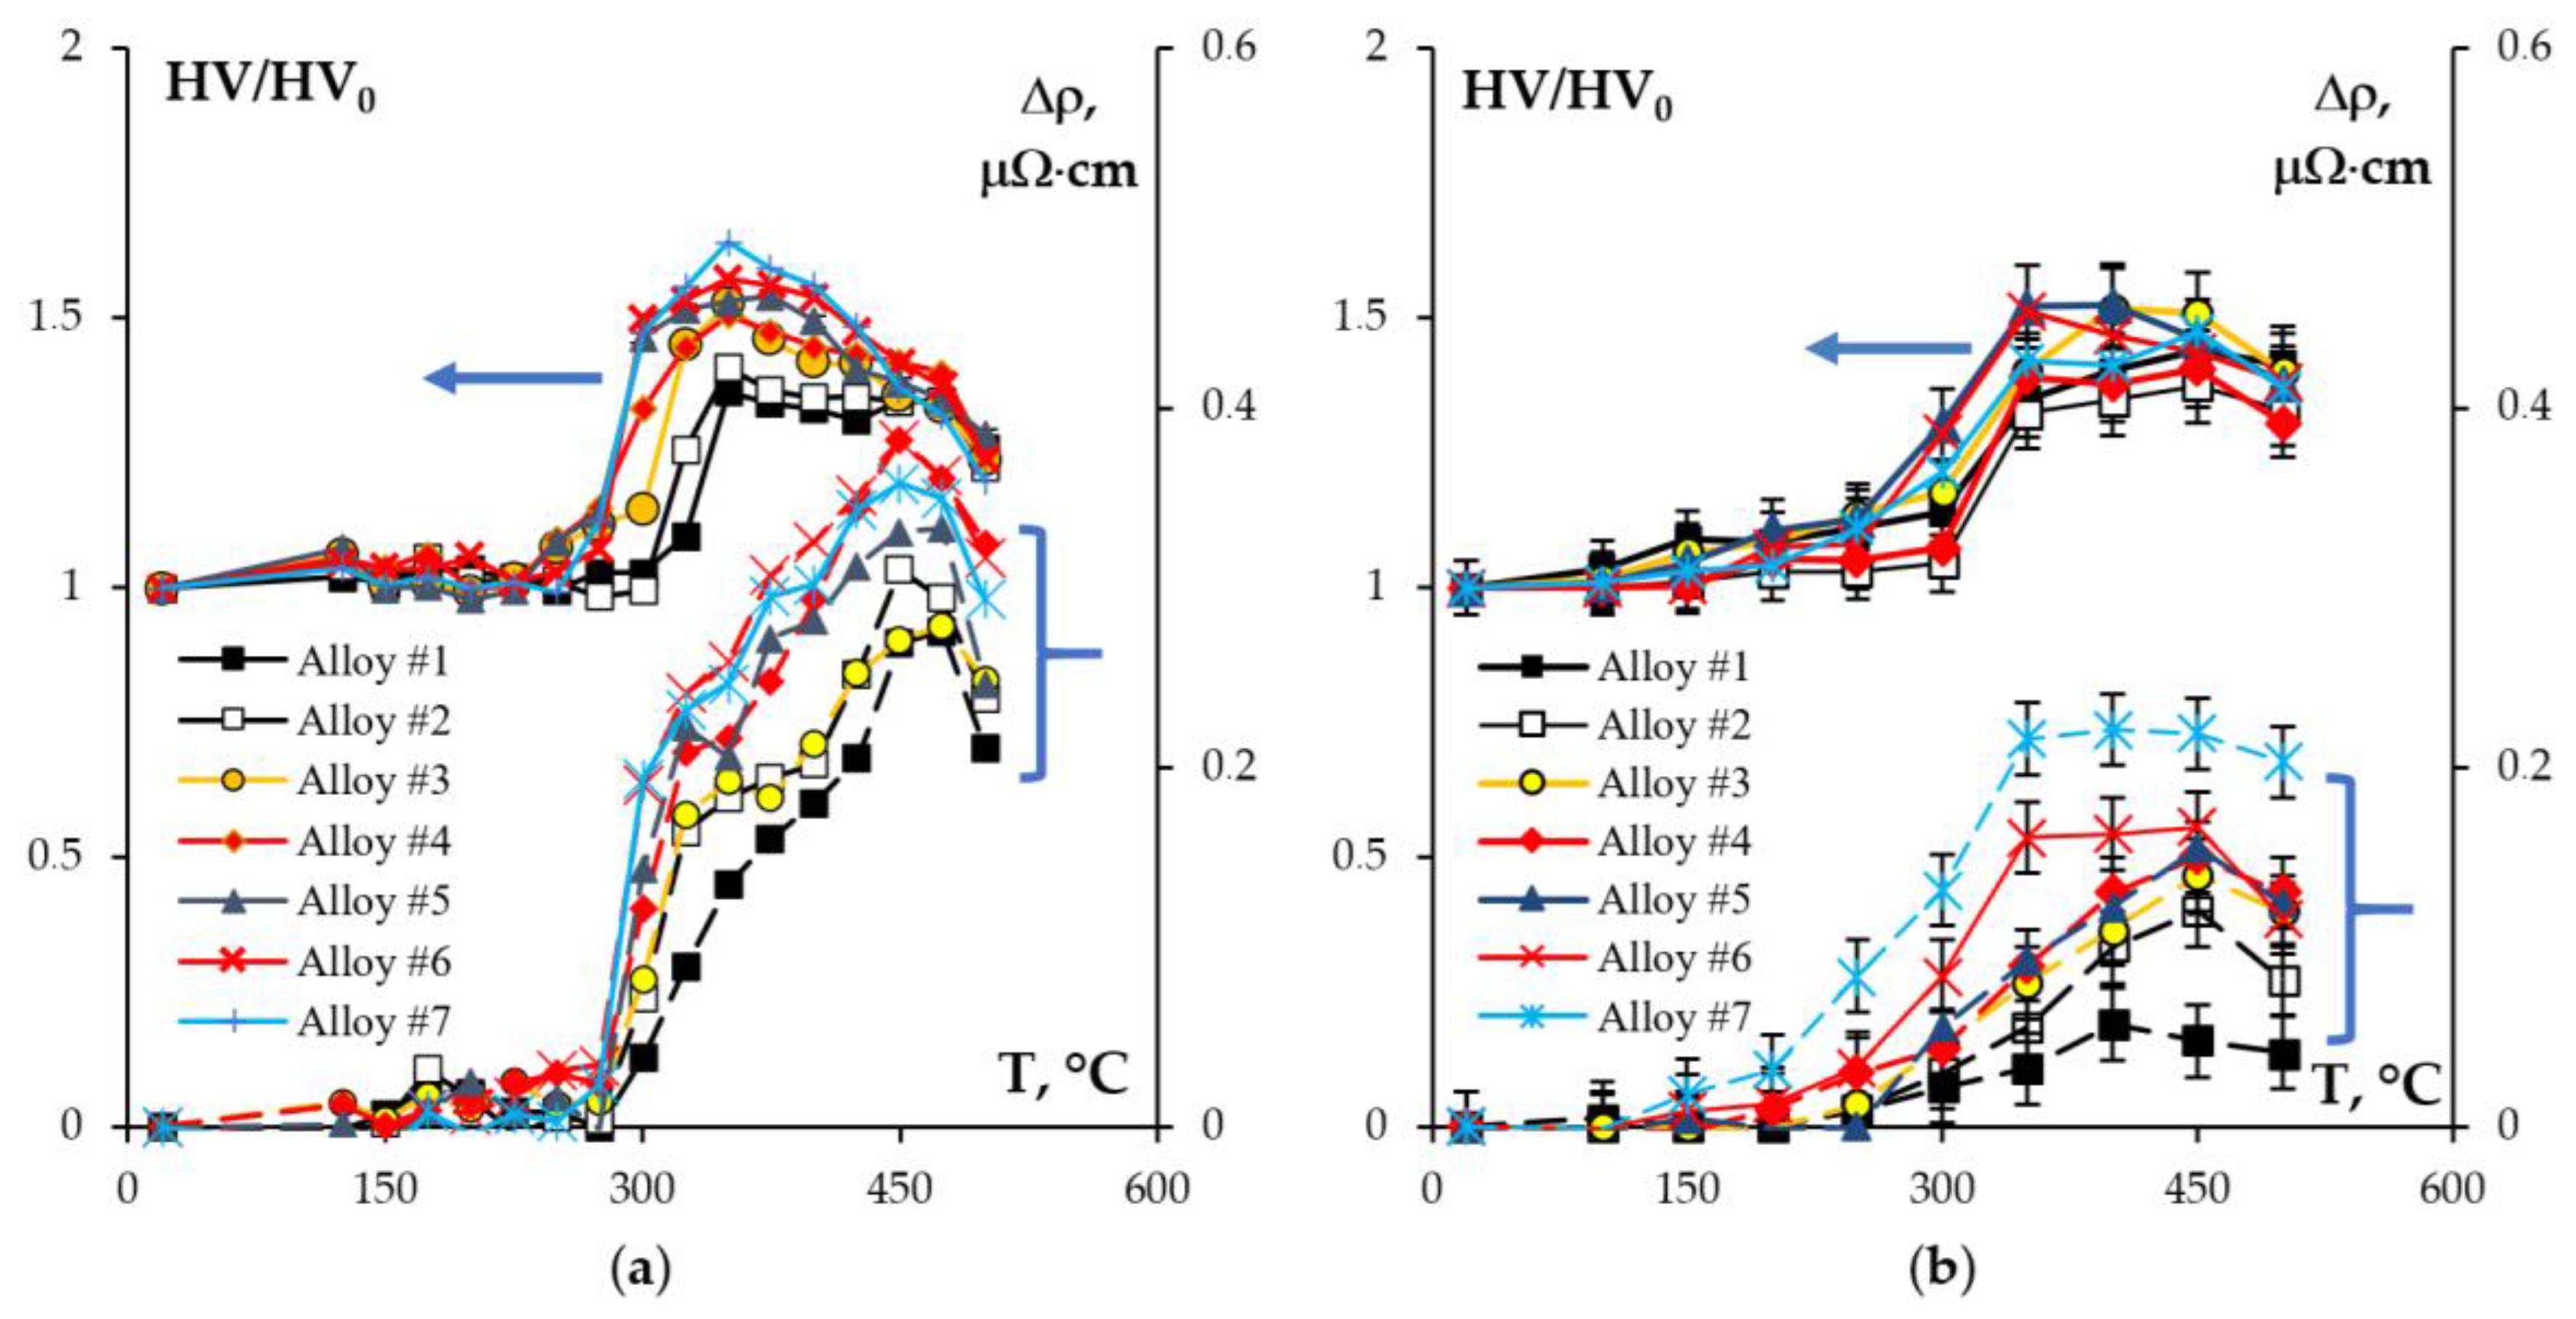
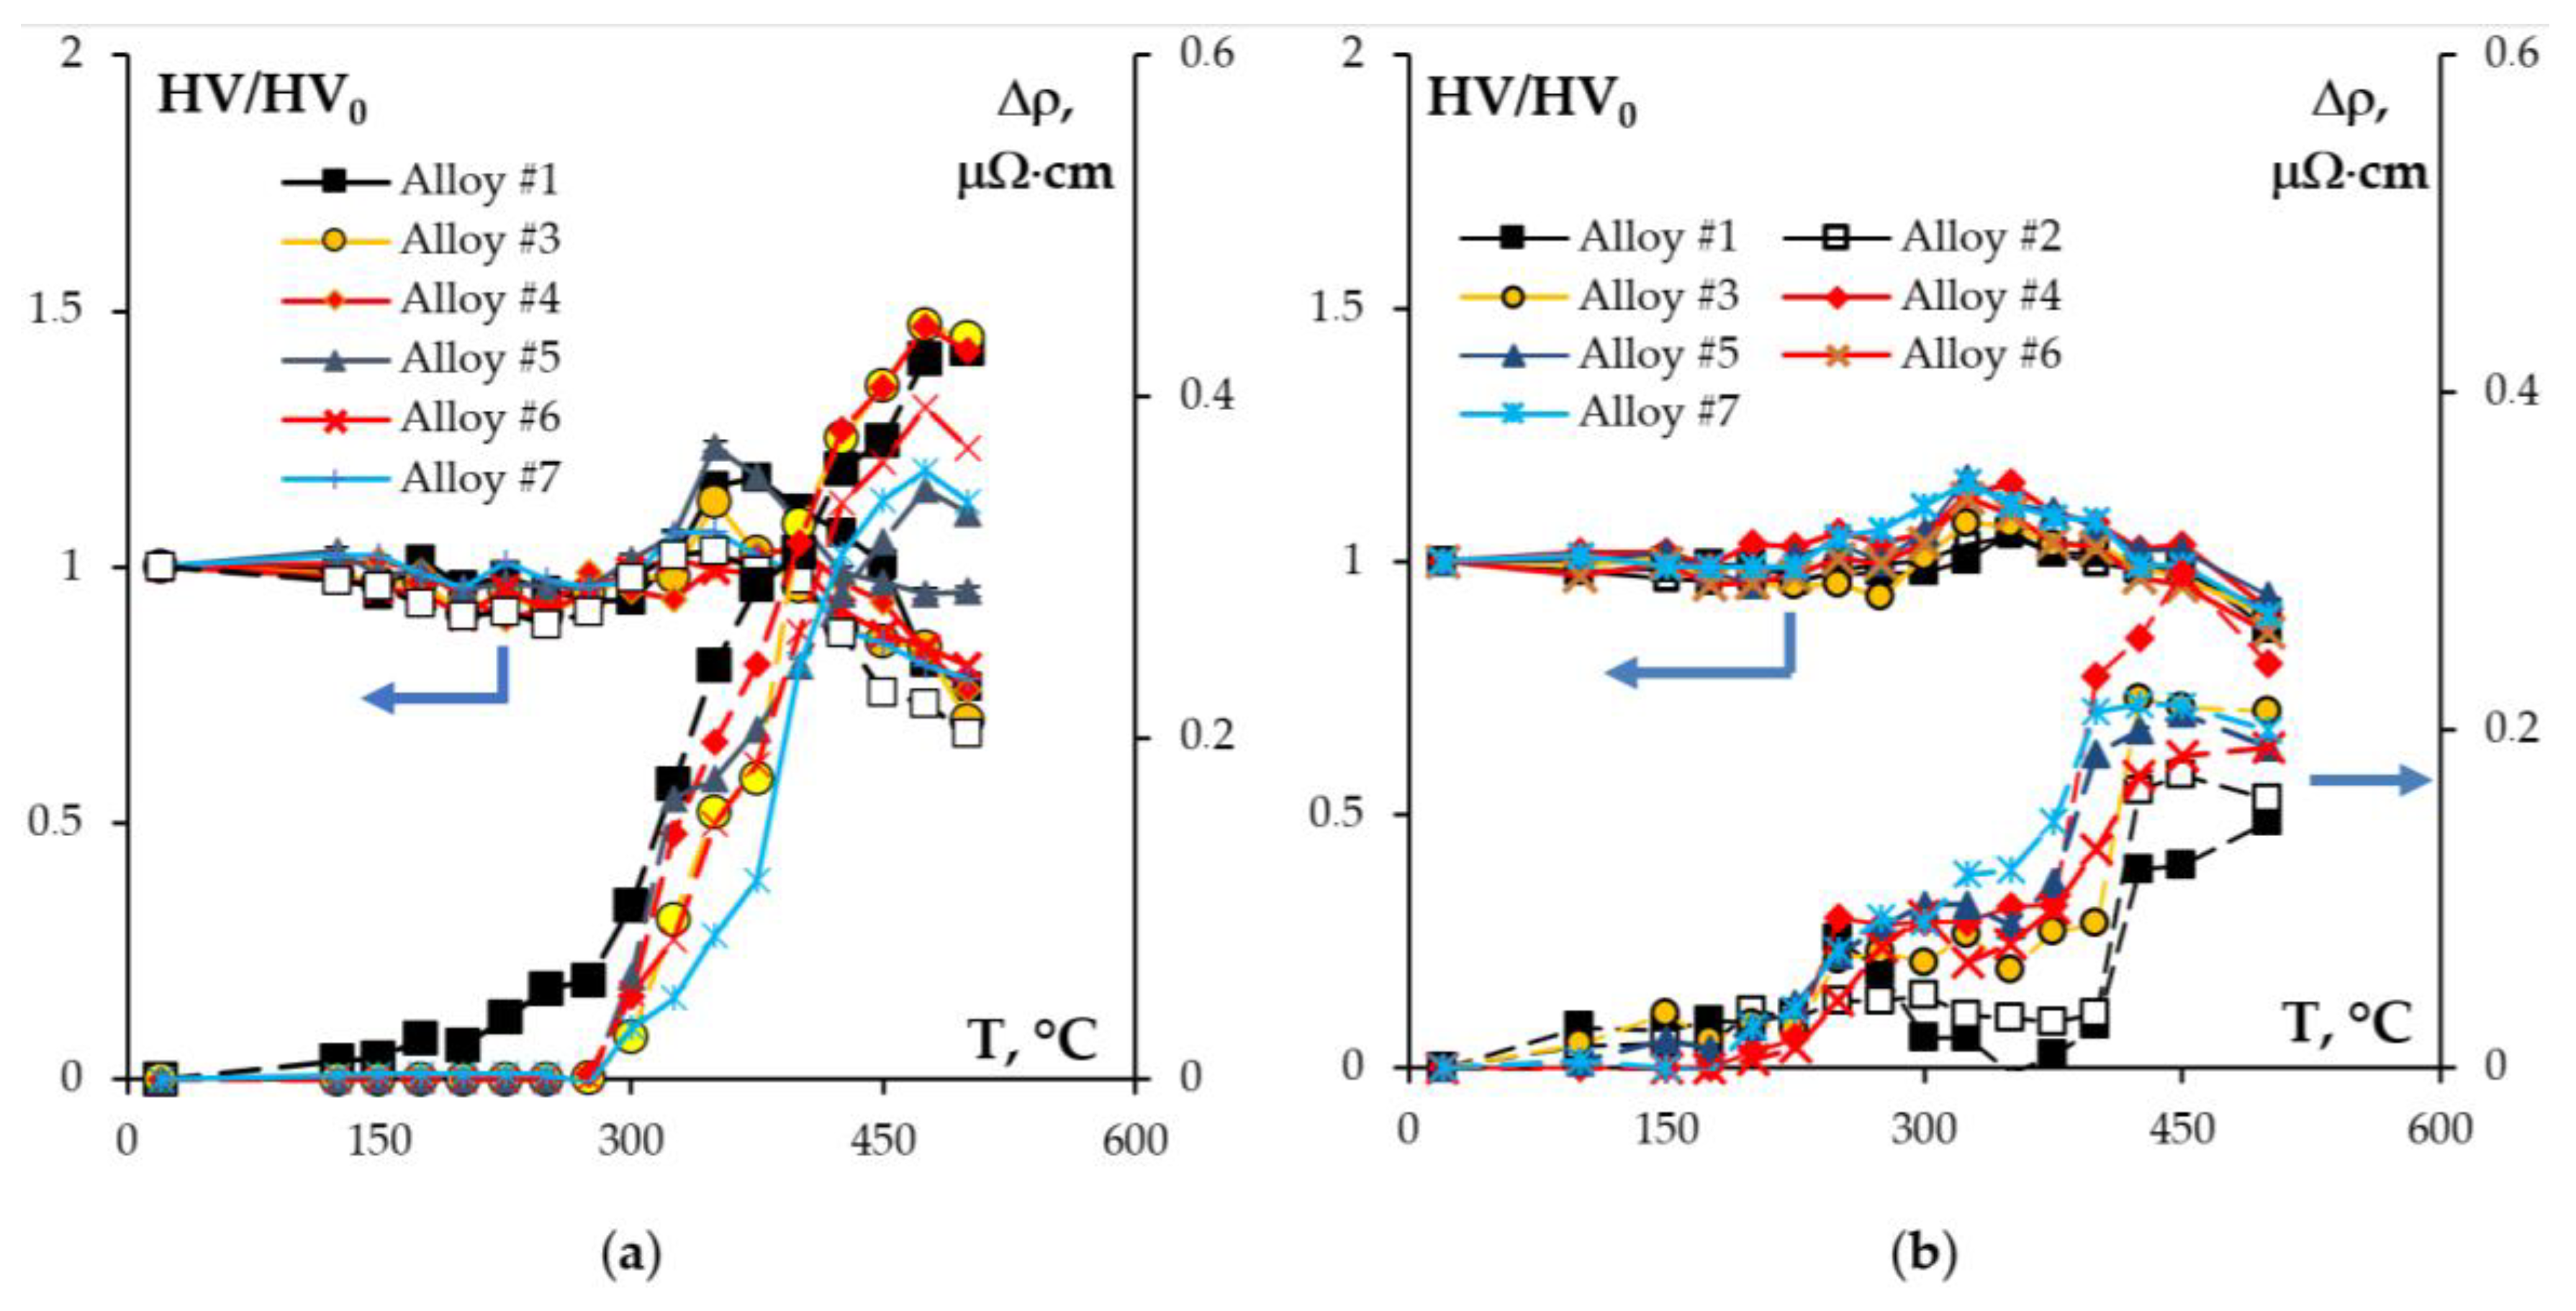
Heating the cast alloys up to 300–350 °C leads to the precipitation beginning of the secondary particles, particularly, Al3Sc particles, in the alloys with high Sc content. In the alloys with increased Zr content, the formation of the following three types of particles was observed: Al3Sc, Al3(Sc0.5Zr0.5), and submicron Al3Zr fan-shaped particles released near the GBs by the discontinuous precipitation mechanism. The formation of the UFG microstructure leads to a 50–100 °C decrease in the onset temperature of the secondary particle release depending on the Sc/Zr ratio. The secondary Al3(Sc,Zr) particles can be the formation centers of the secondary β-phase particles. A decrease in the Mg concentration leads to an increase in the volume fraction of the secondary Al3(Sc,Zr) particles but does not affect their formation nature. At annealing temperatures above 450 °C, partial diffusion-controlled dissolution of the β-phase particles was observed.
(iv)
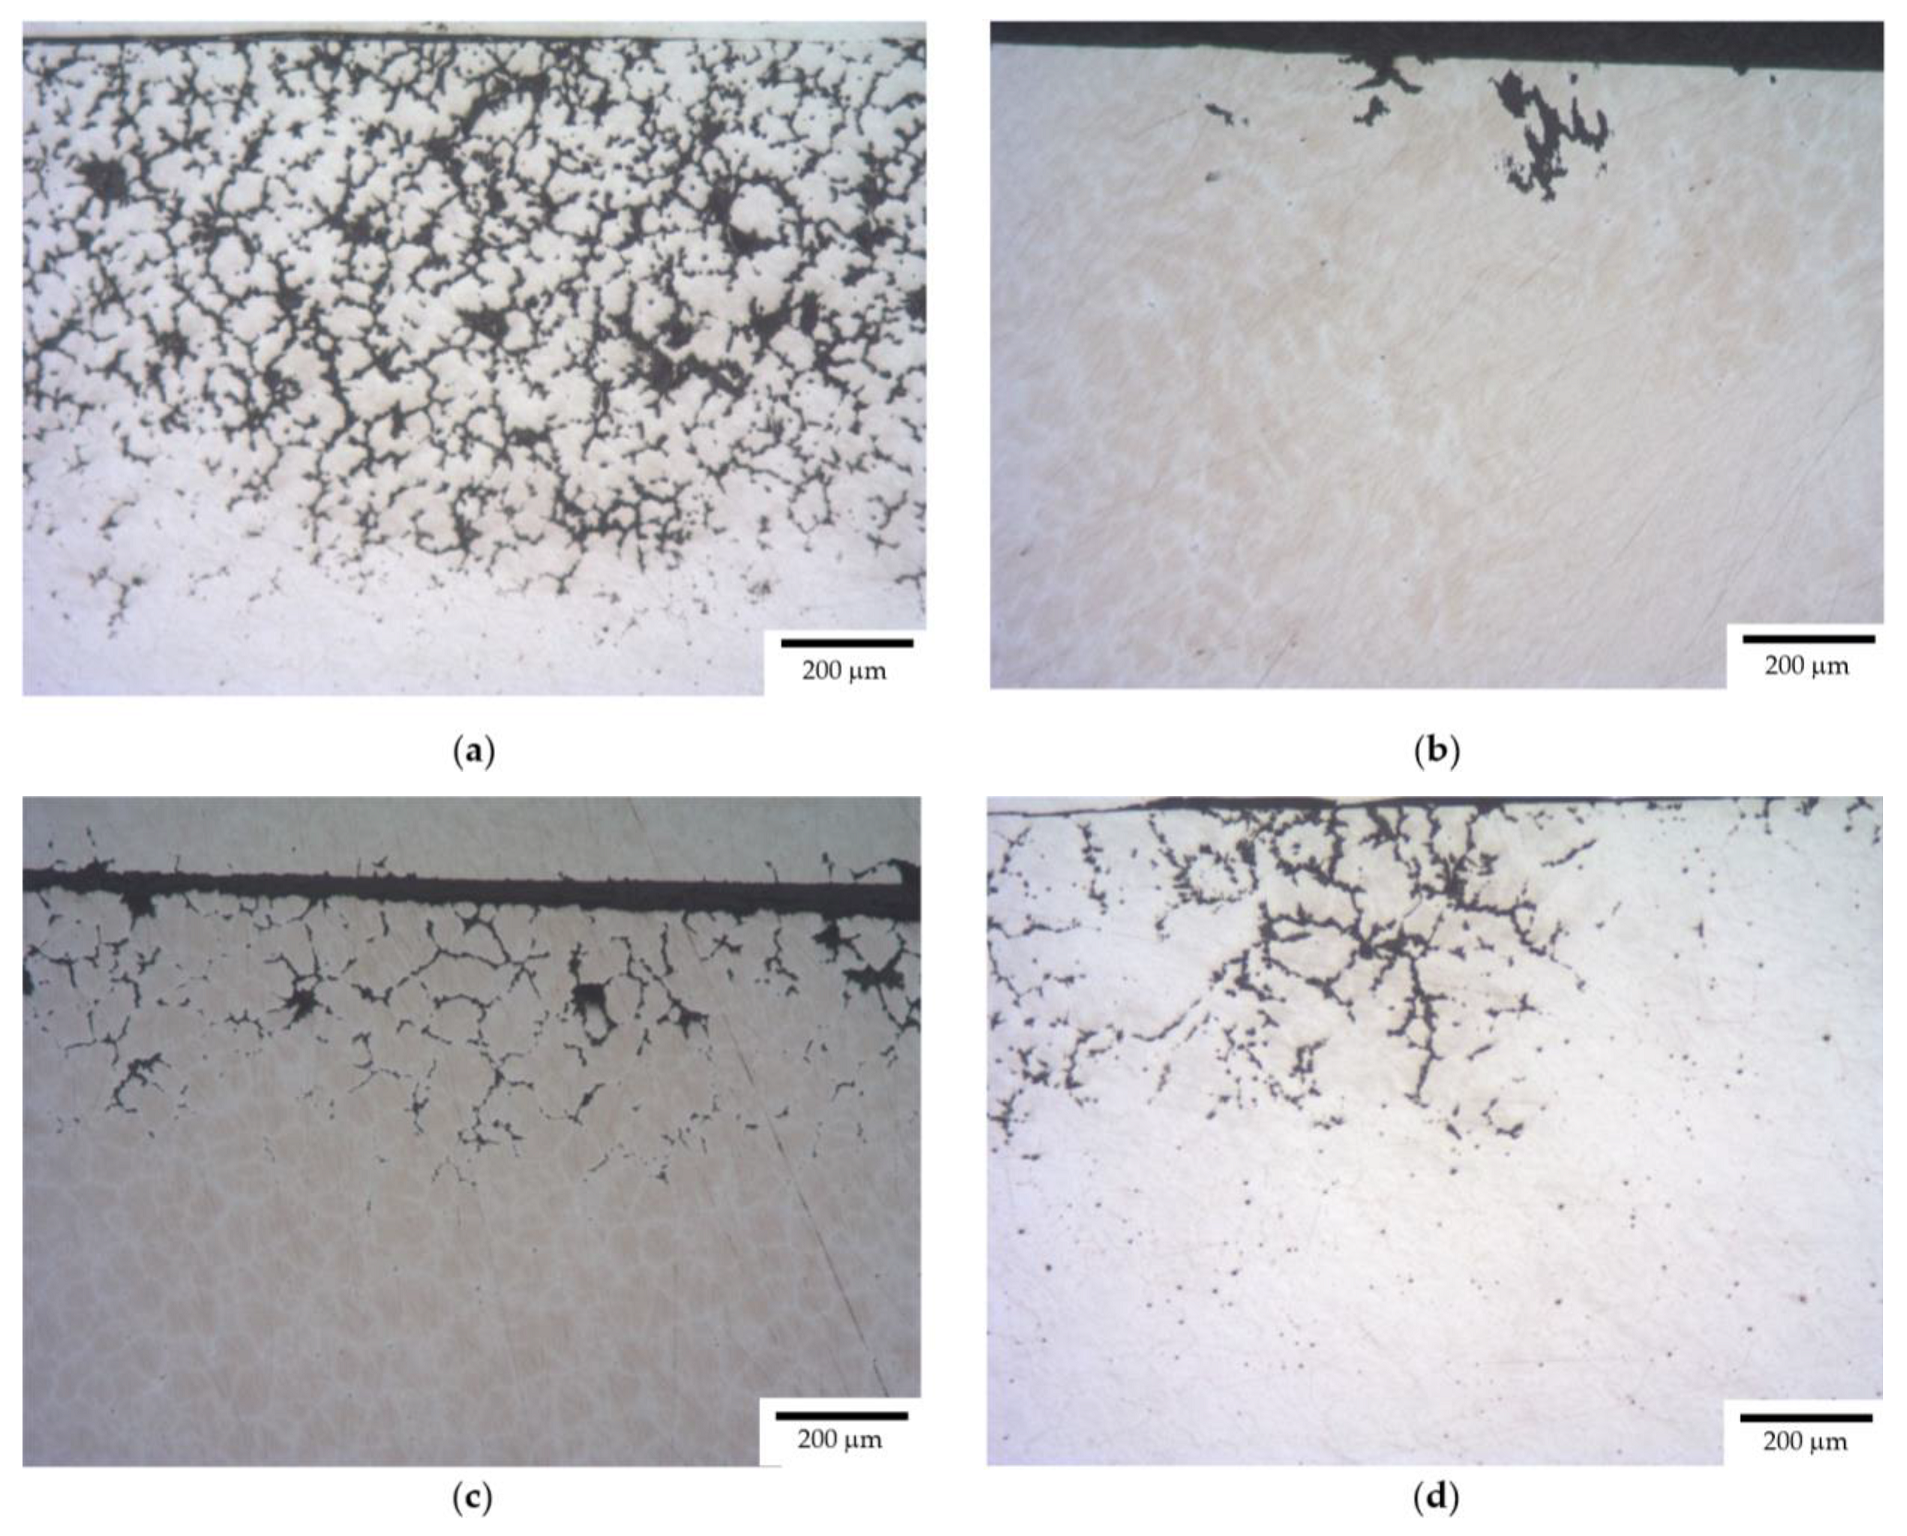
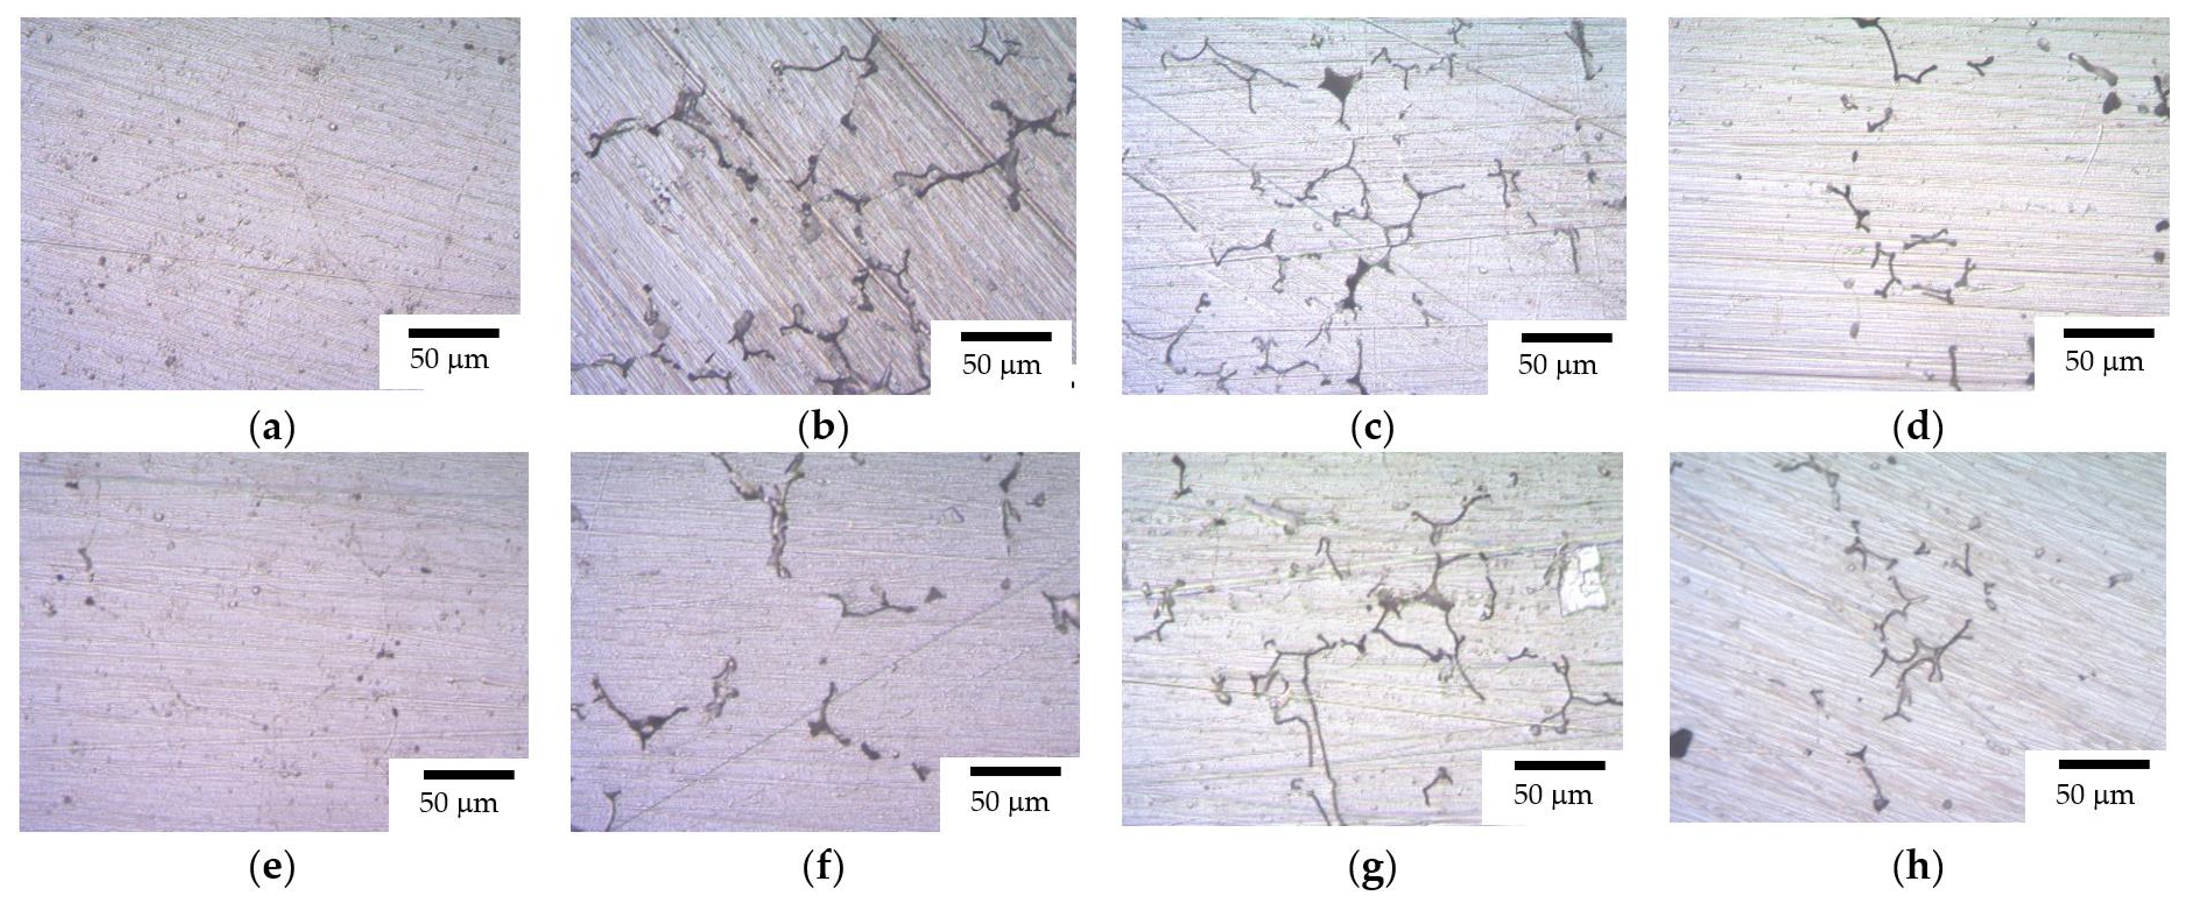
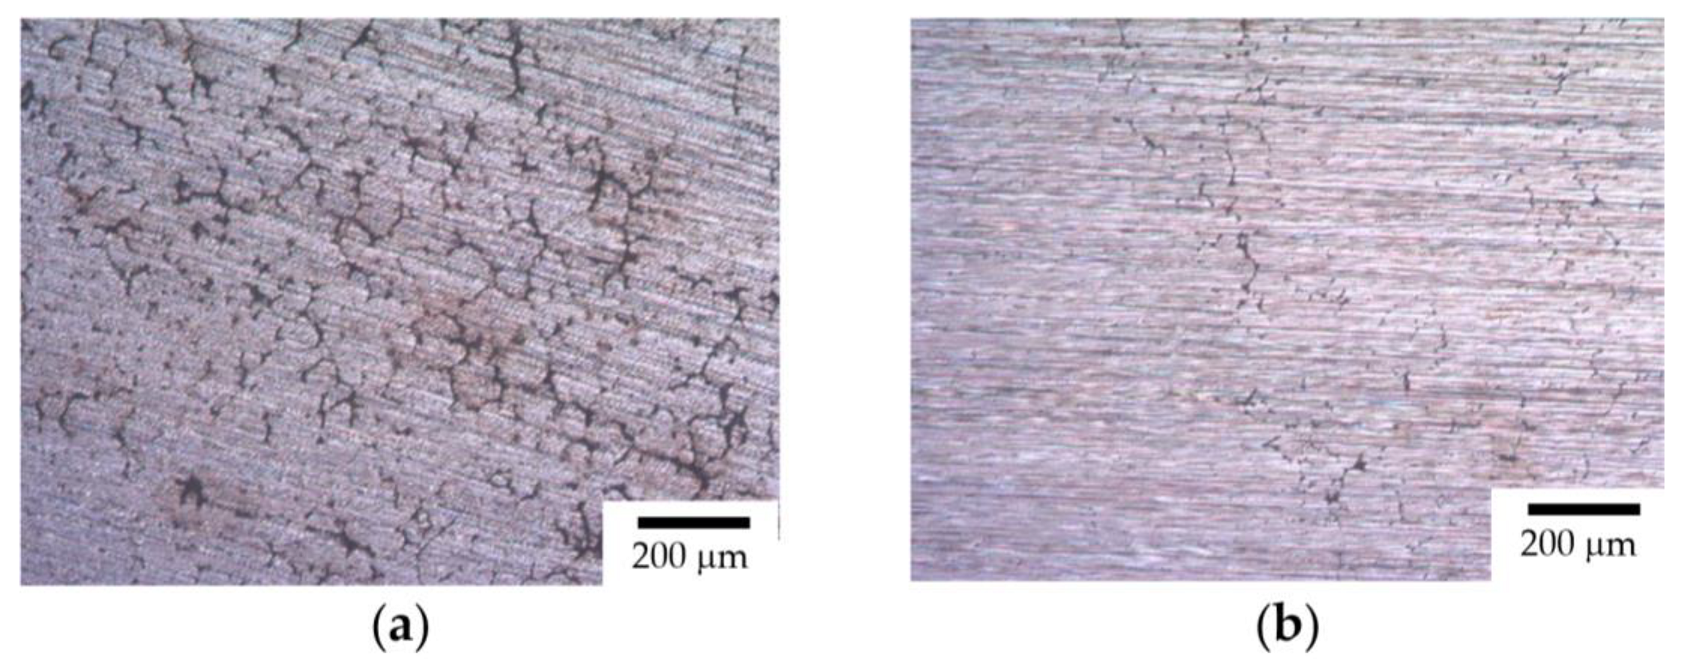
After the corrosion testing, two types of corrosion defects were observed on the surfaces of the cast alloy samples. Type I—large, wide IGC defects associated with the destruction of primary β-phase particles located along the boundaries of dendrites formed at the stage of crystallization of the Al alloy, and Type II—fine IGC defects associated with the GBs formed at the last stage of crystallization (the central parts of the ingots). The most probable reason for the formation of Type II defects is the effect of solid-phase wetting of aluminum GBs by β-phase particles [76,77,78]. A discussion of the nature of this effect can be found in a series of articles [79,80].
In the cast alloys, Type I defects predominate, while the fraction of Type II defects is significantly lower. After the electrochemical testing, defects of Type I and Type II were found on the surfaces of the cast and UFG alloy samples. After the conventional stationary testing, according to GOST 9.021-74 [70], mainly large Type I defects were found on the sample surface of Al alloys; the fraction of fine Type II defects was small.
(v)
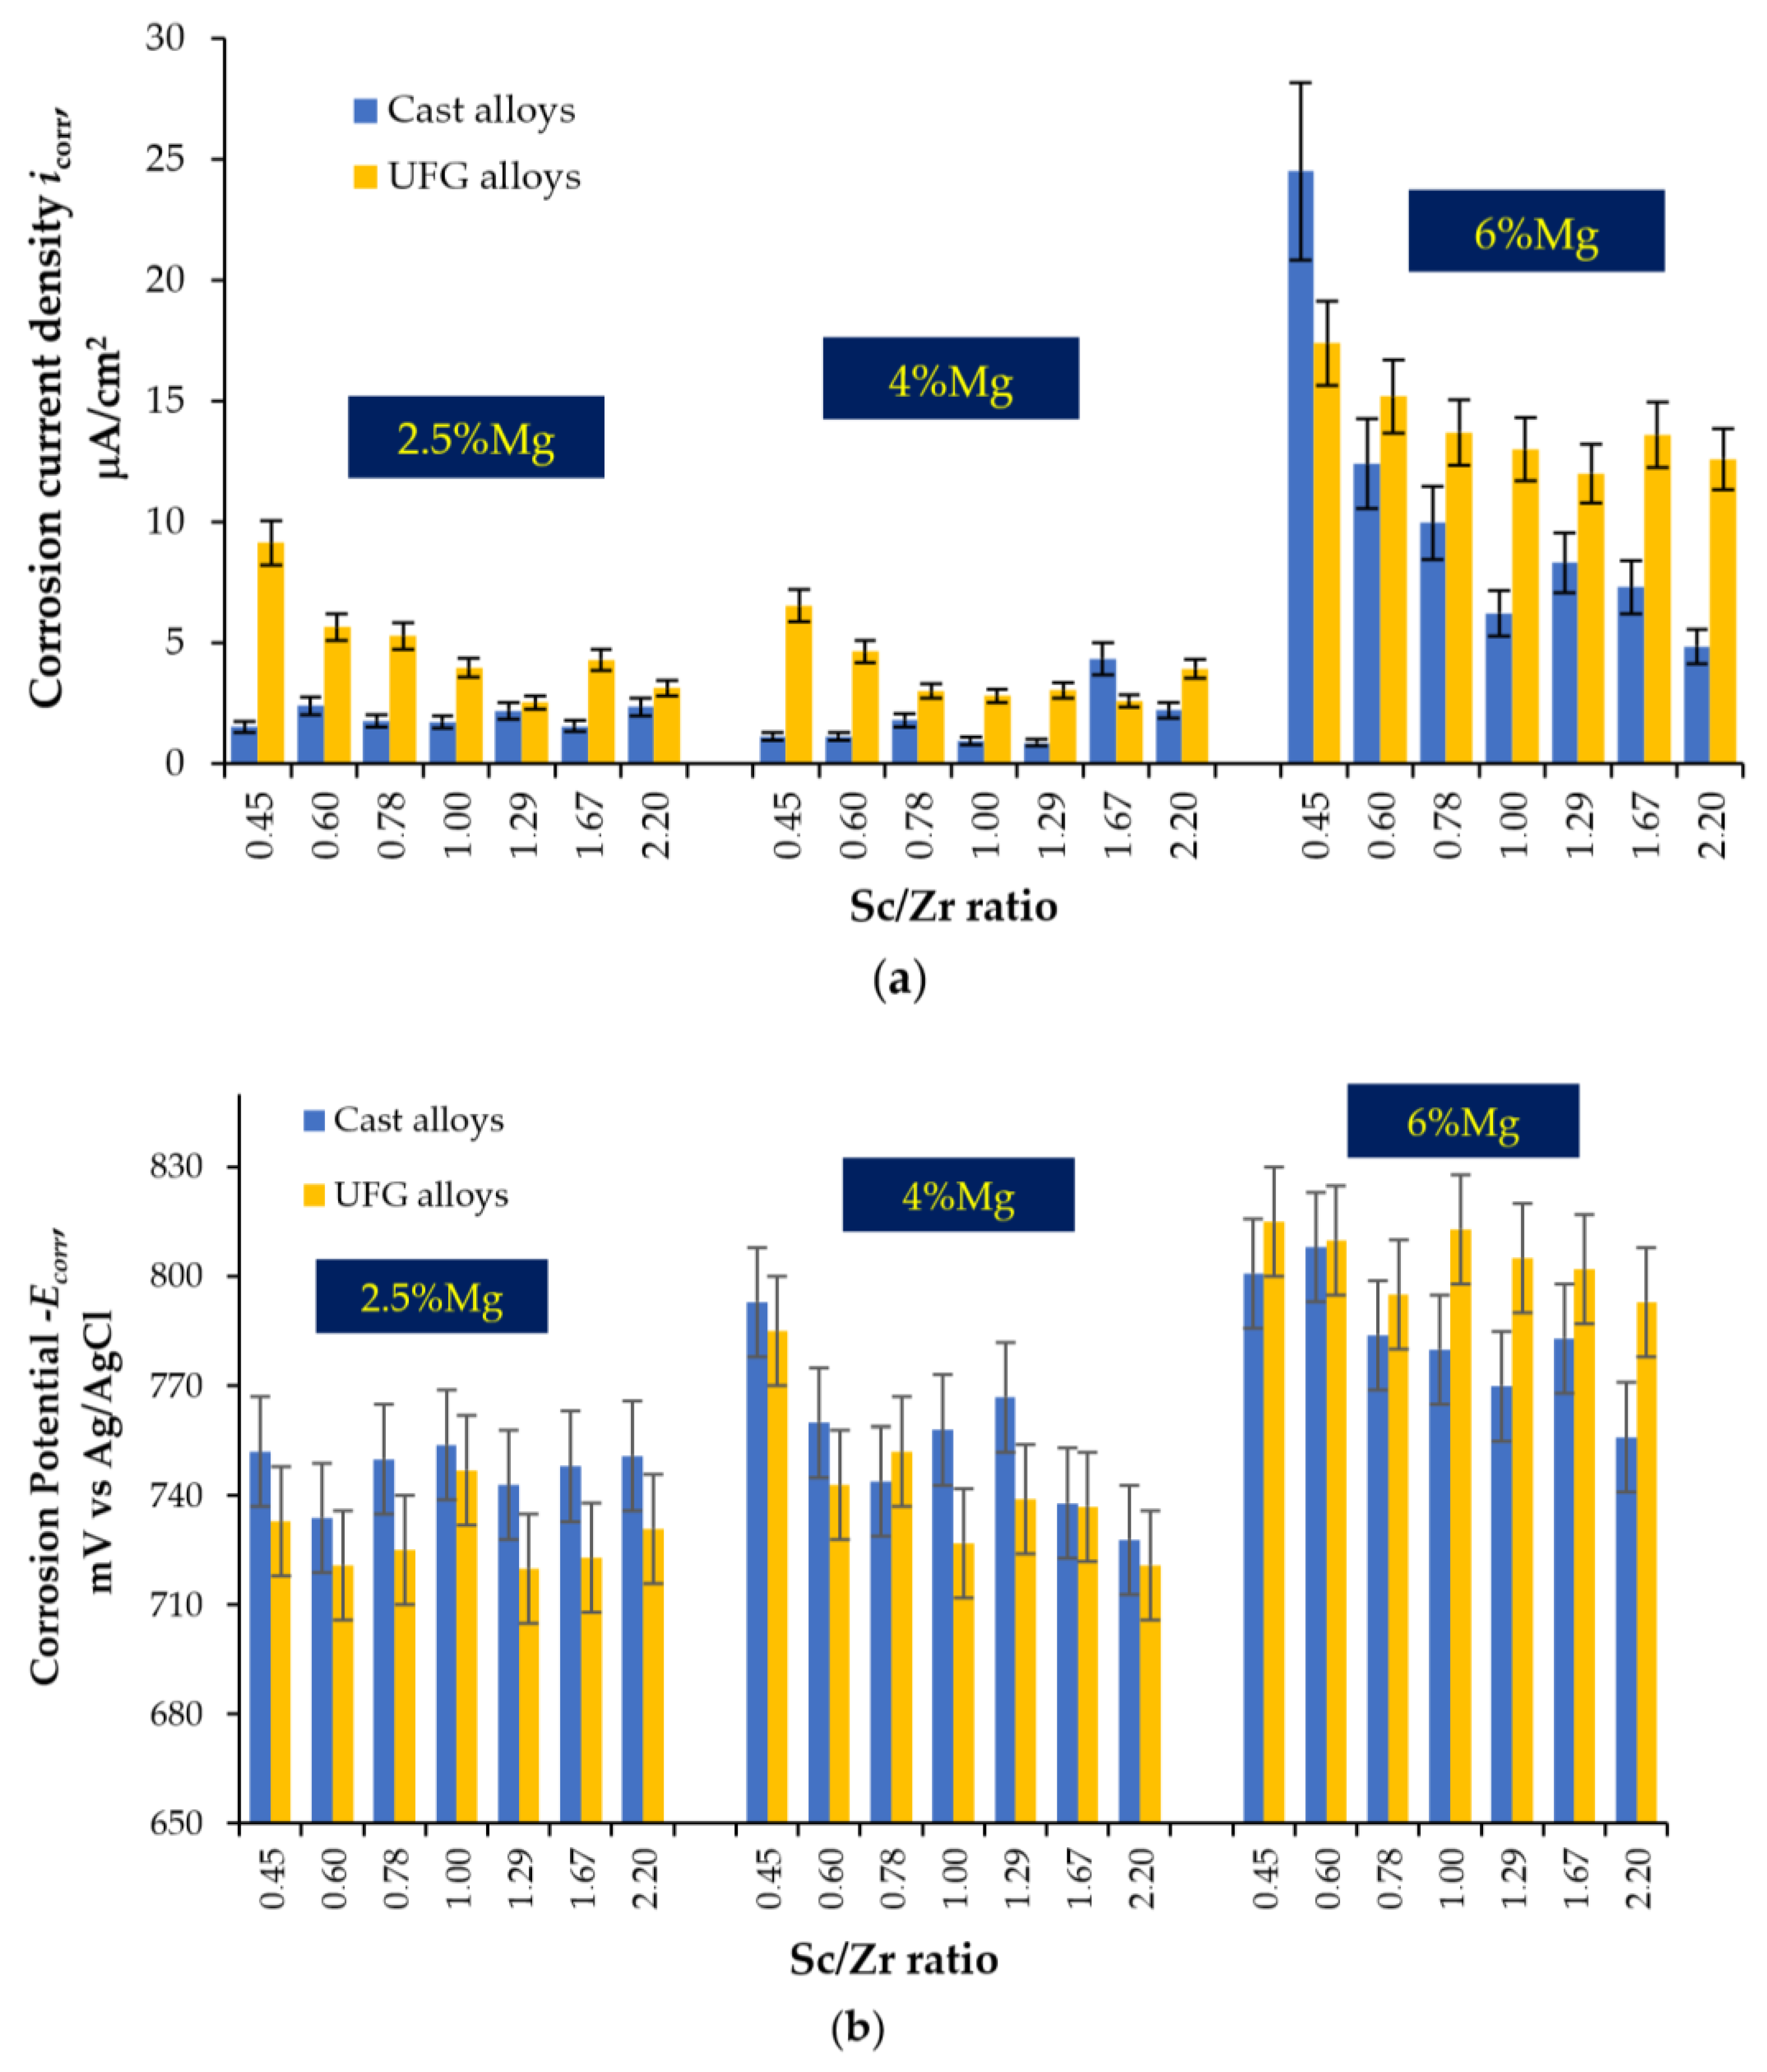
The cast Al–Mg–Sc–Zr alloys tested in an aqueous solution of 3% NaCl + 0.3% HCl show an increased tendency to IGC. The main cause of the IGC of the cast Al–Mg–Sc–Zr alloys is the formation of primary β-phase particles during cooling the ingots. An increase in the Mg concentration leads to a decrease in the depth of the IGC defects and an increase in the corrosion rate during the electrochemical studies (an increase in the corrosion current density icorr). An increase in the Sc/Zr ratio leads to a decrease in the depth of the IGC defects, but the scale of this effect is smaller than the one of Mg on the IGC depth. An increase in the Sc/Zr ratio leads to a decrease in icorr in the electrochemical studies.
(vi)
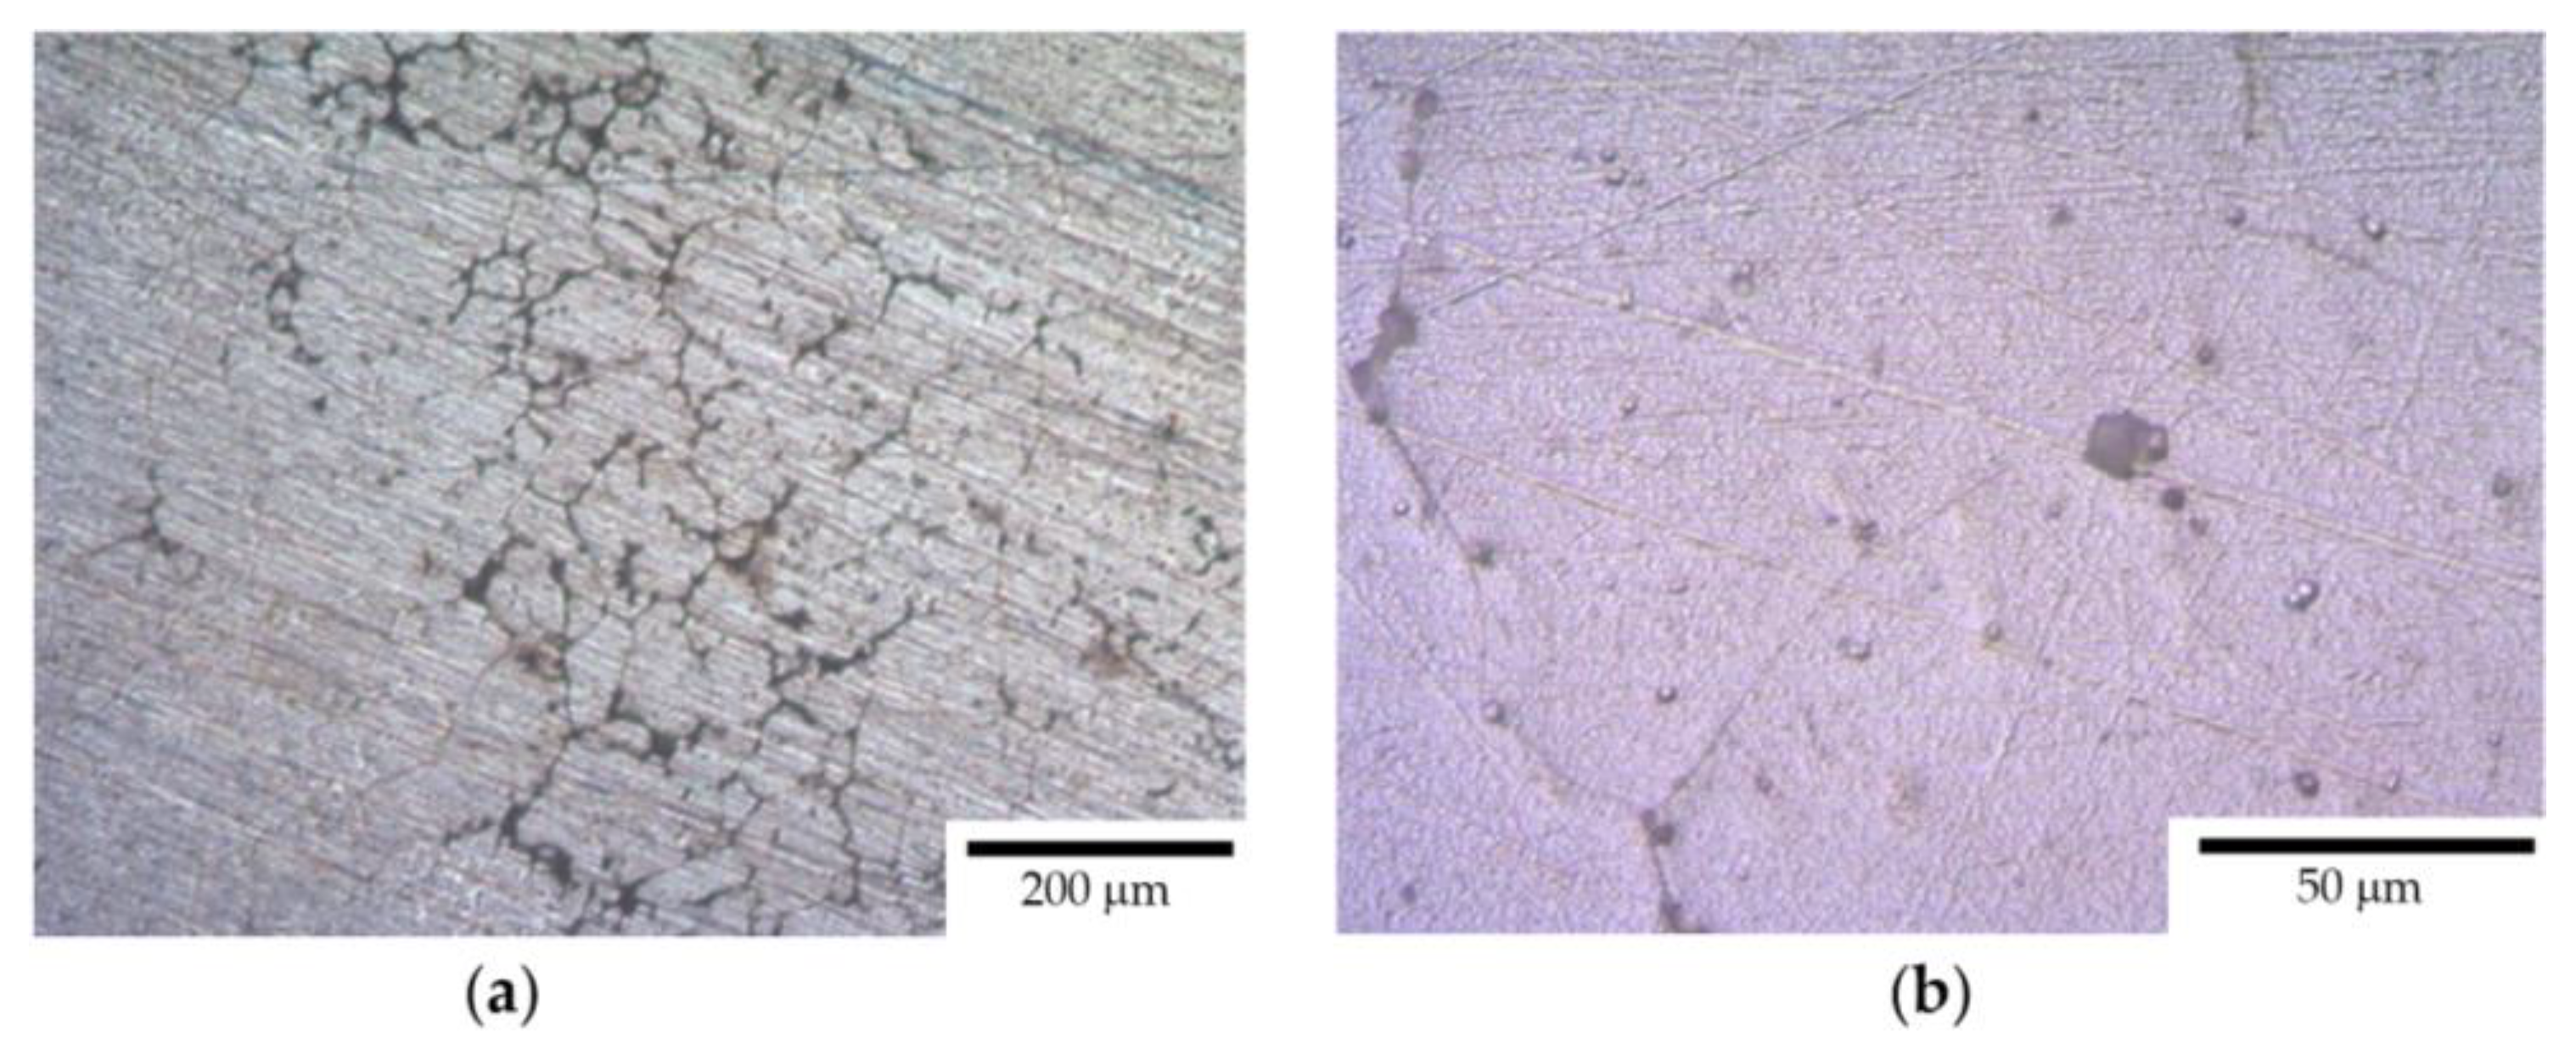
ECAP results in a slight decrease in the depth of the IGC defects and a significant increase in the corrosion current density icorr. Metallographic studies show that ECAP does not affect the size and fraction of large Type I defects (at Mg = const, Sc/Zr = const), but leads to an increase in the fraction of fine Type II defects. The effect of the nature of the Mg concentration and the Sc/Zr ratio on the corrosion resistance of the UFG Al alloys was similar to the effect of these factors on the corrosion behavior of the cast alloys.
(vii)
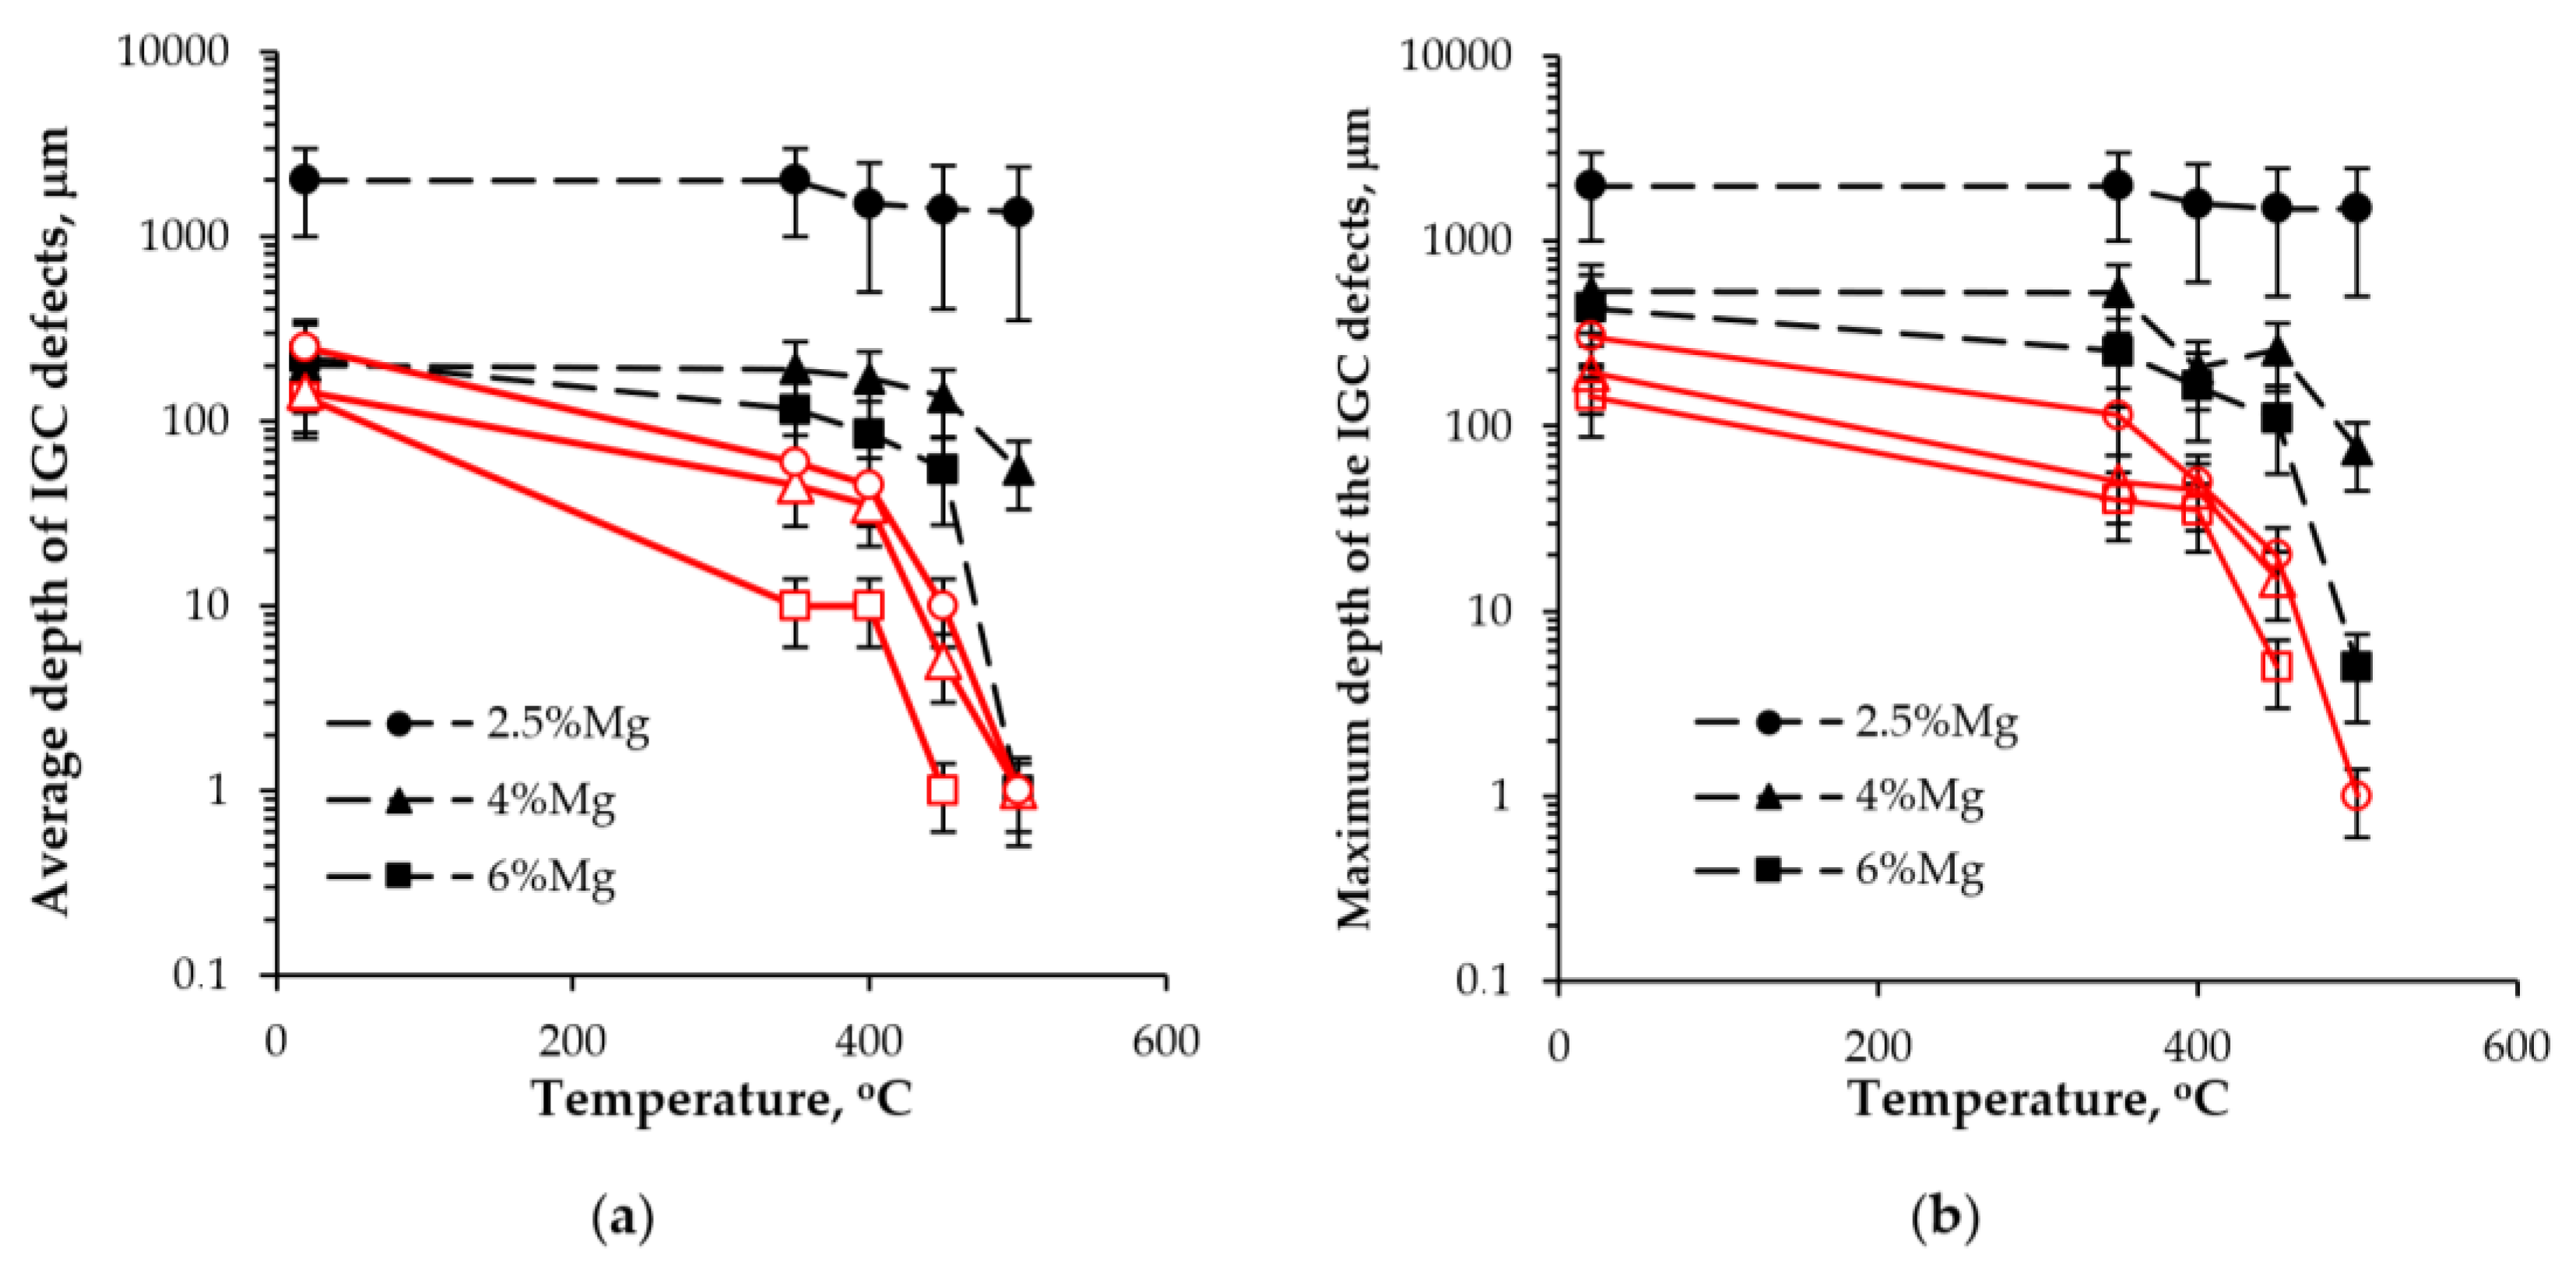
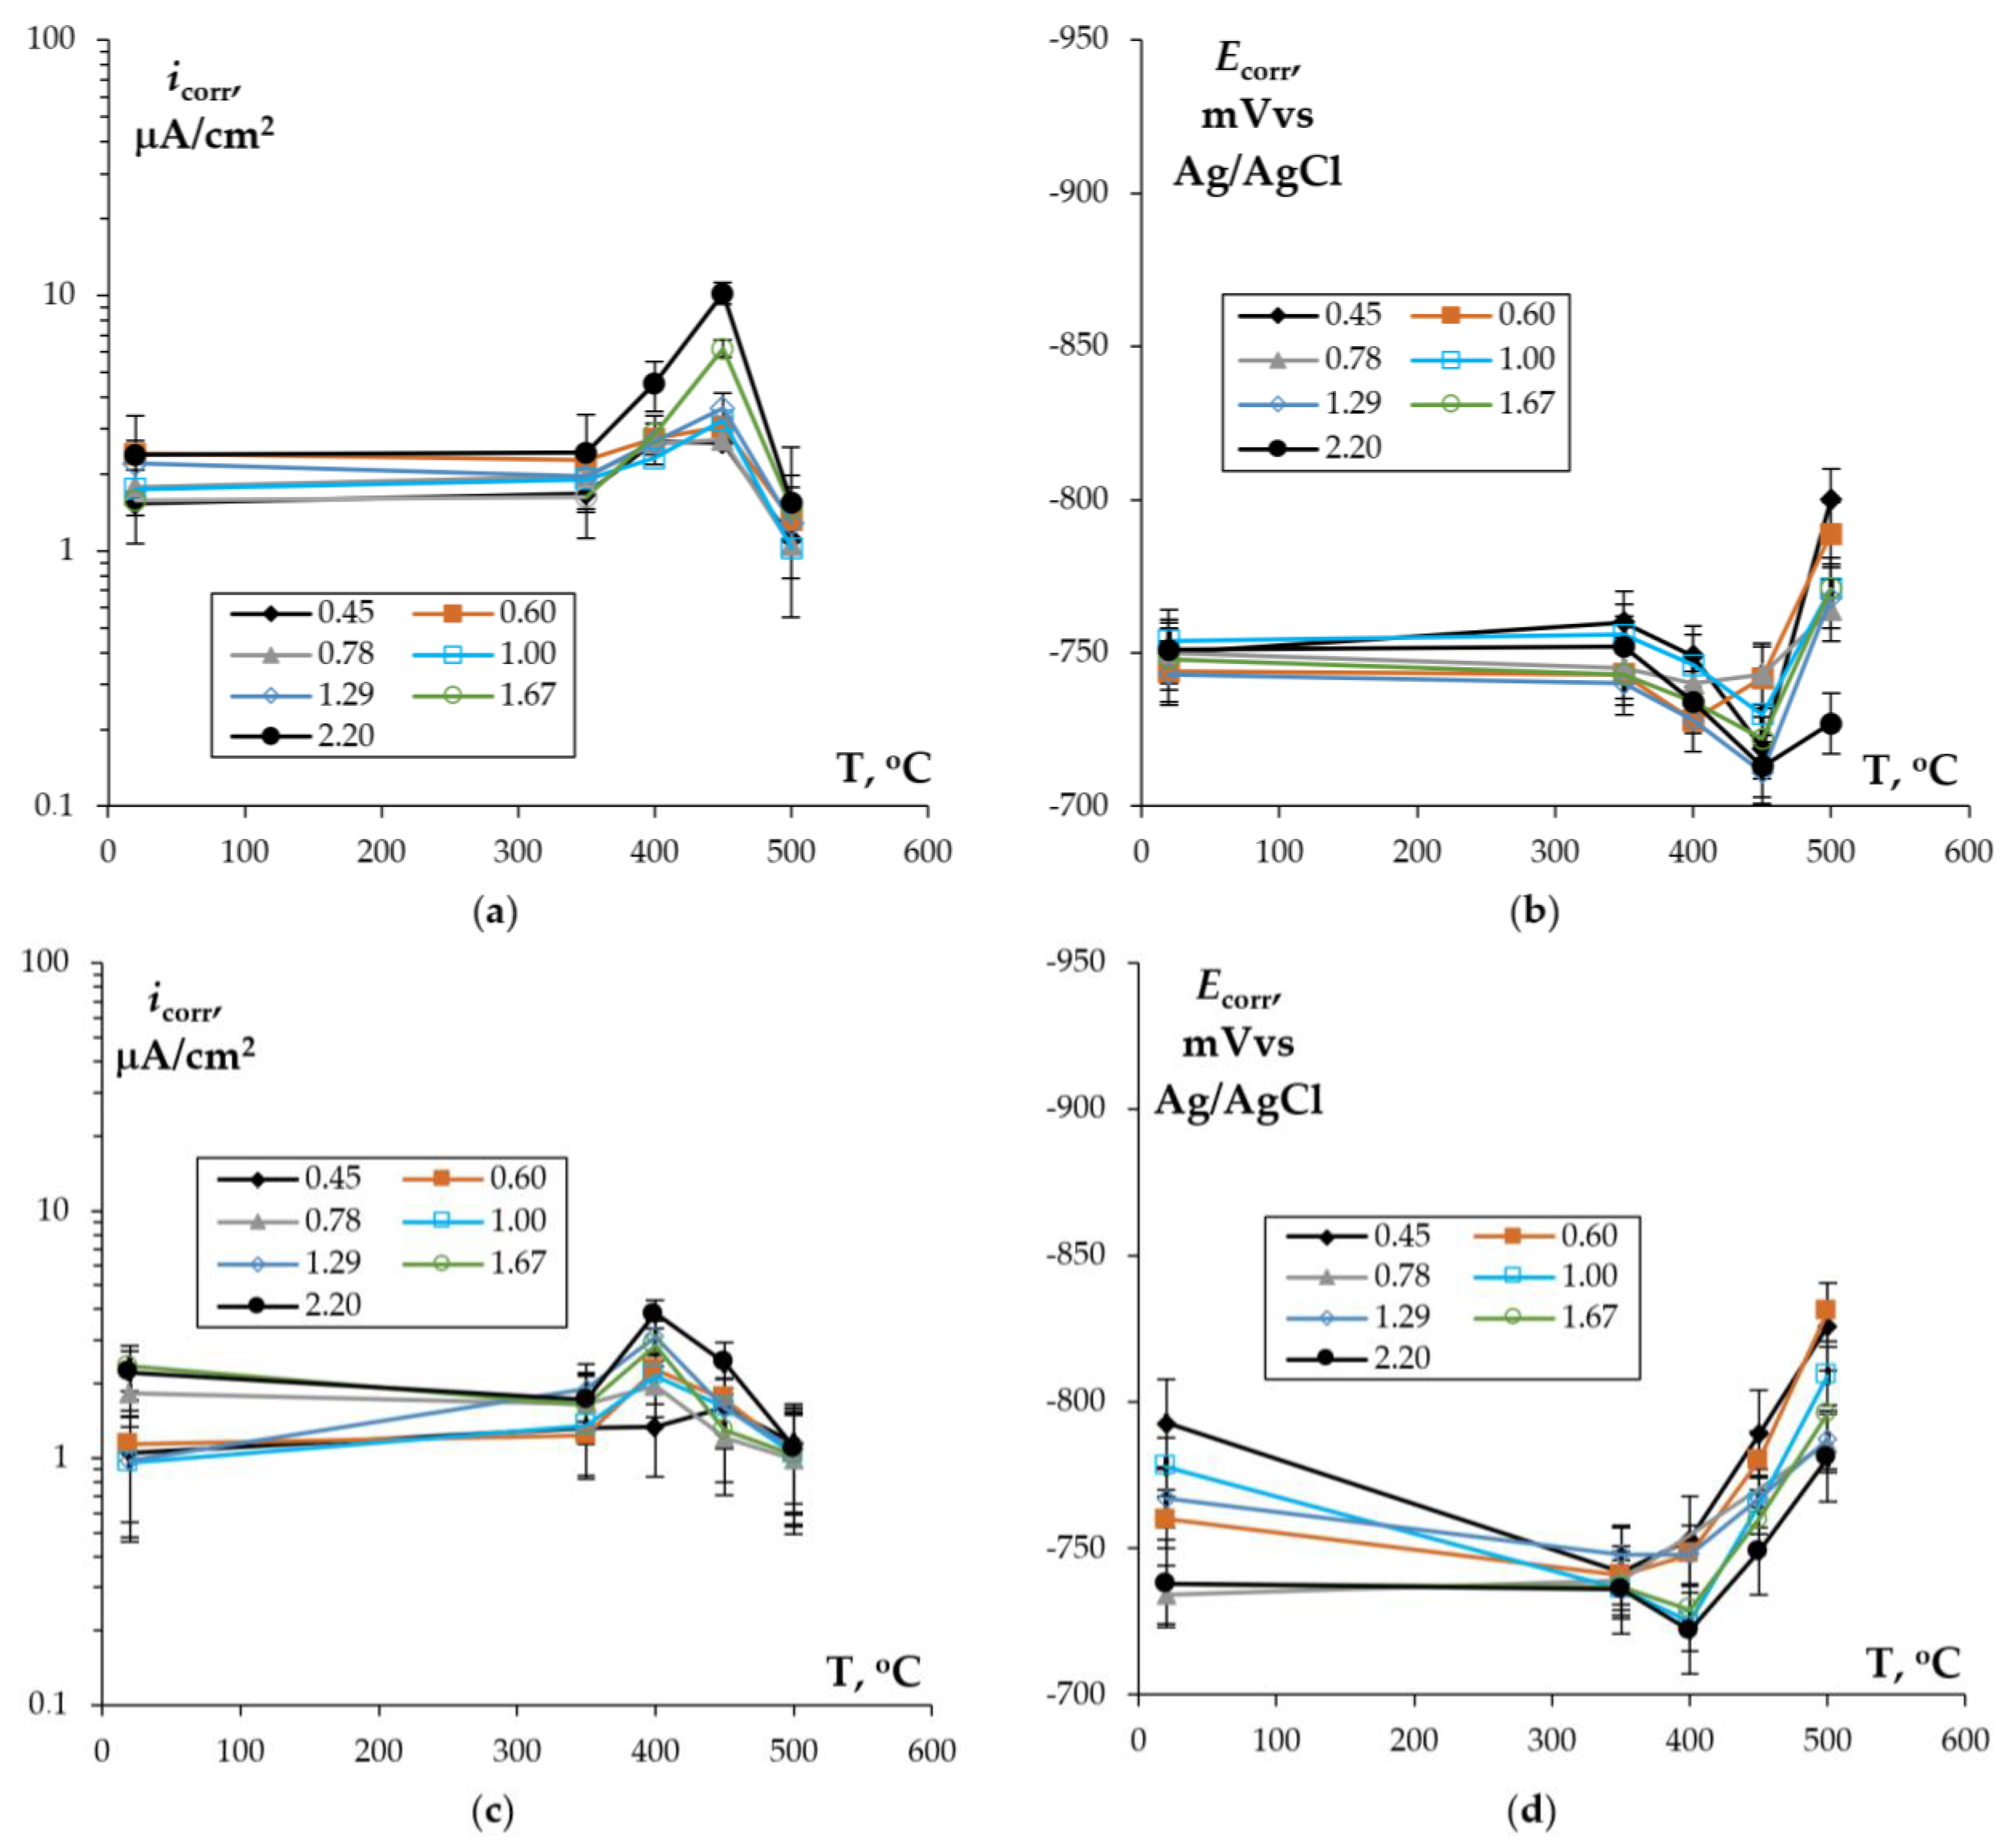
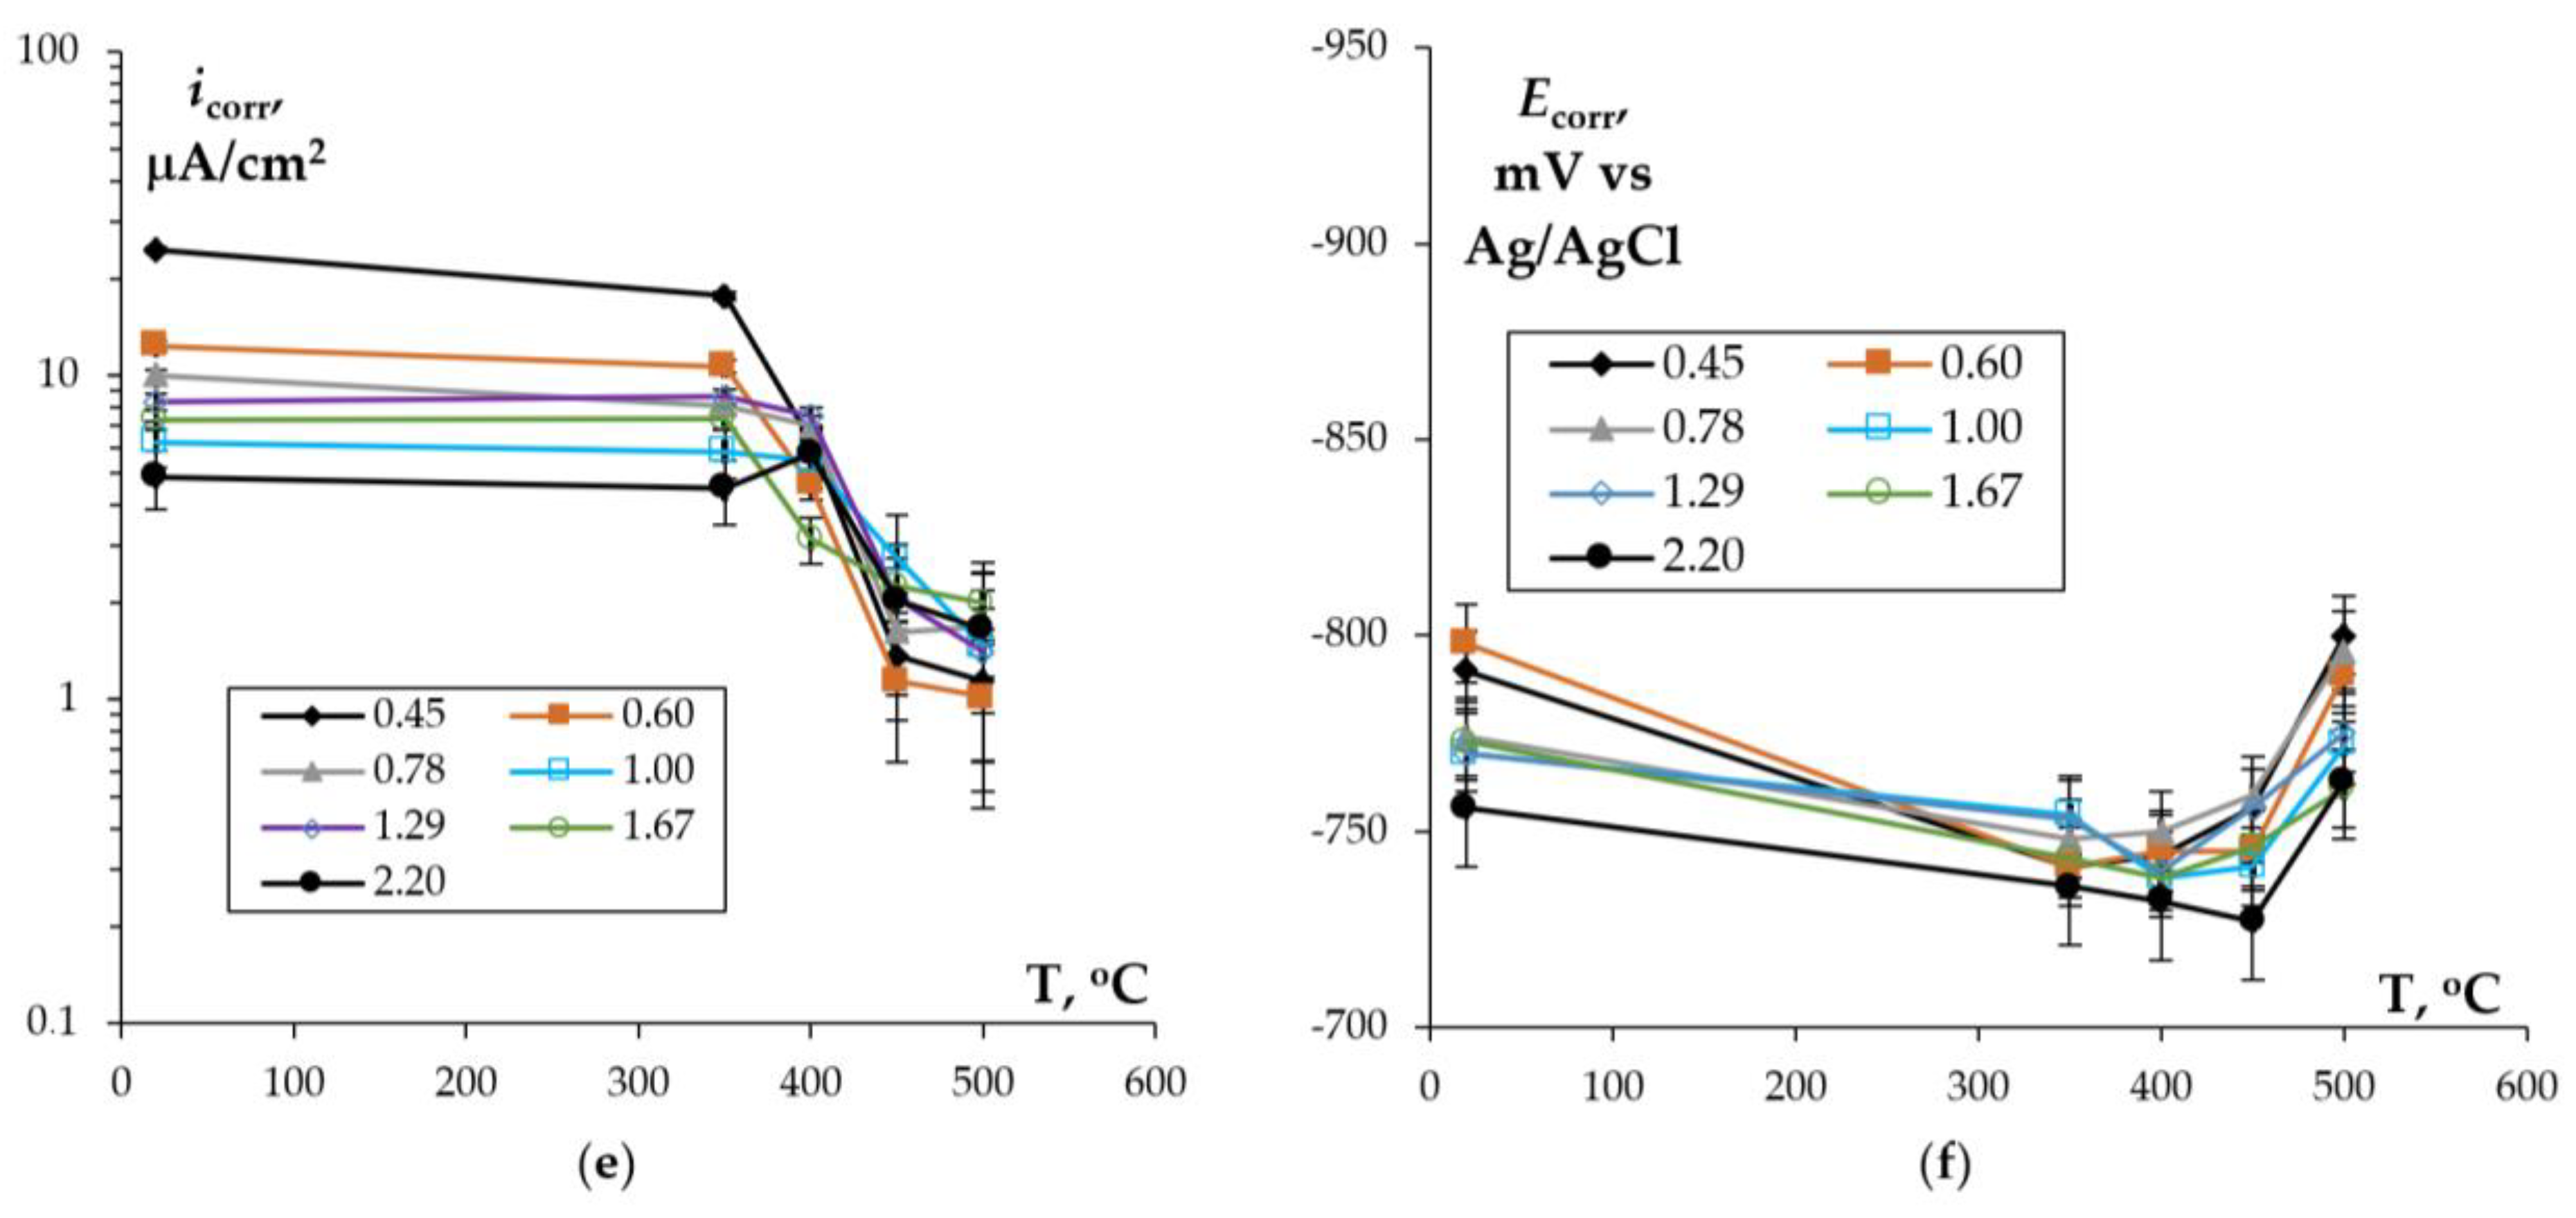
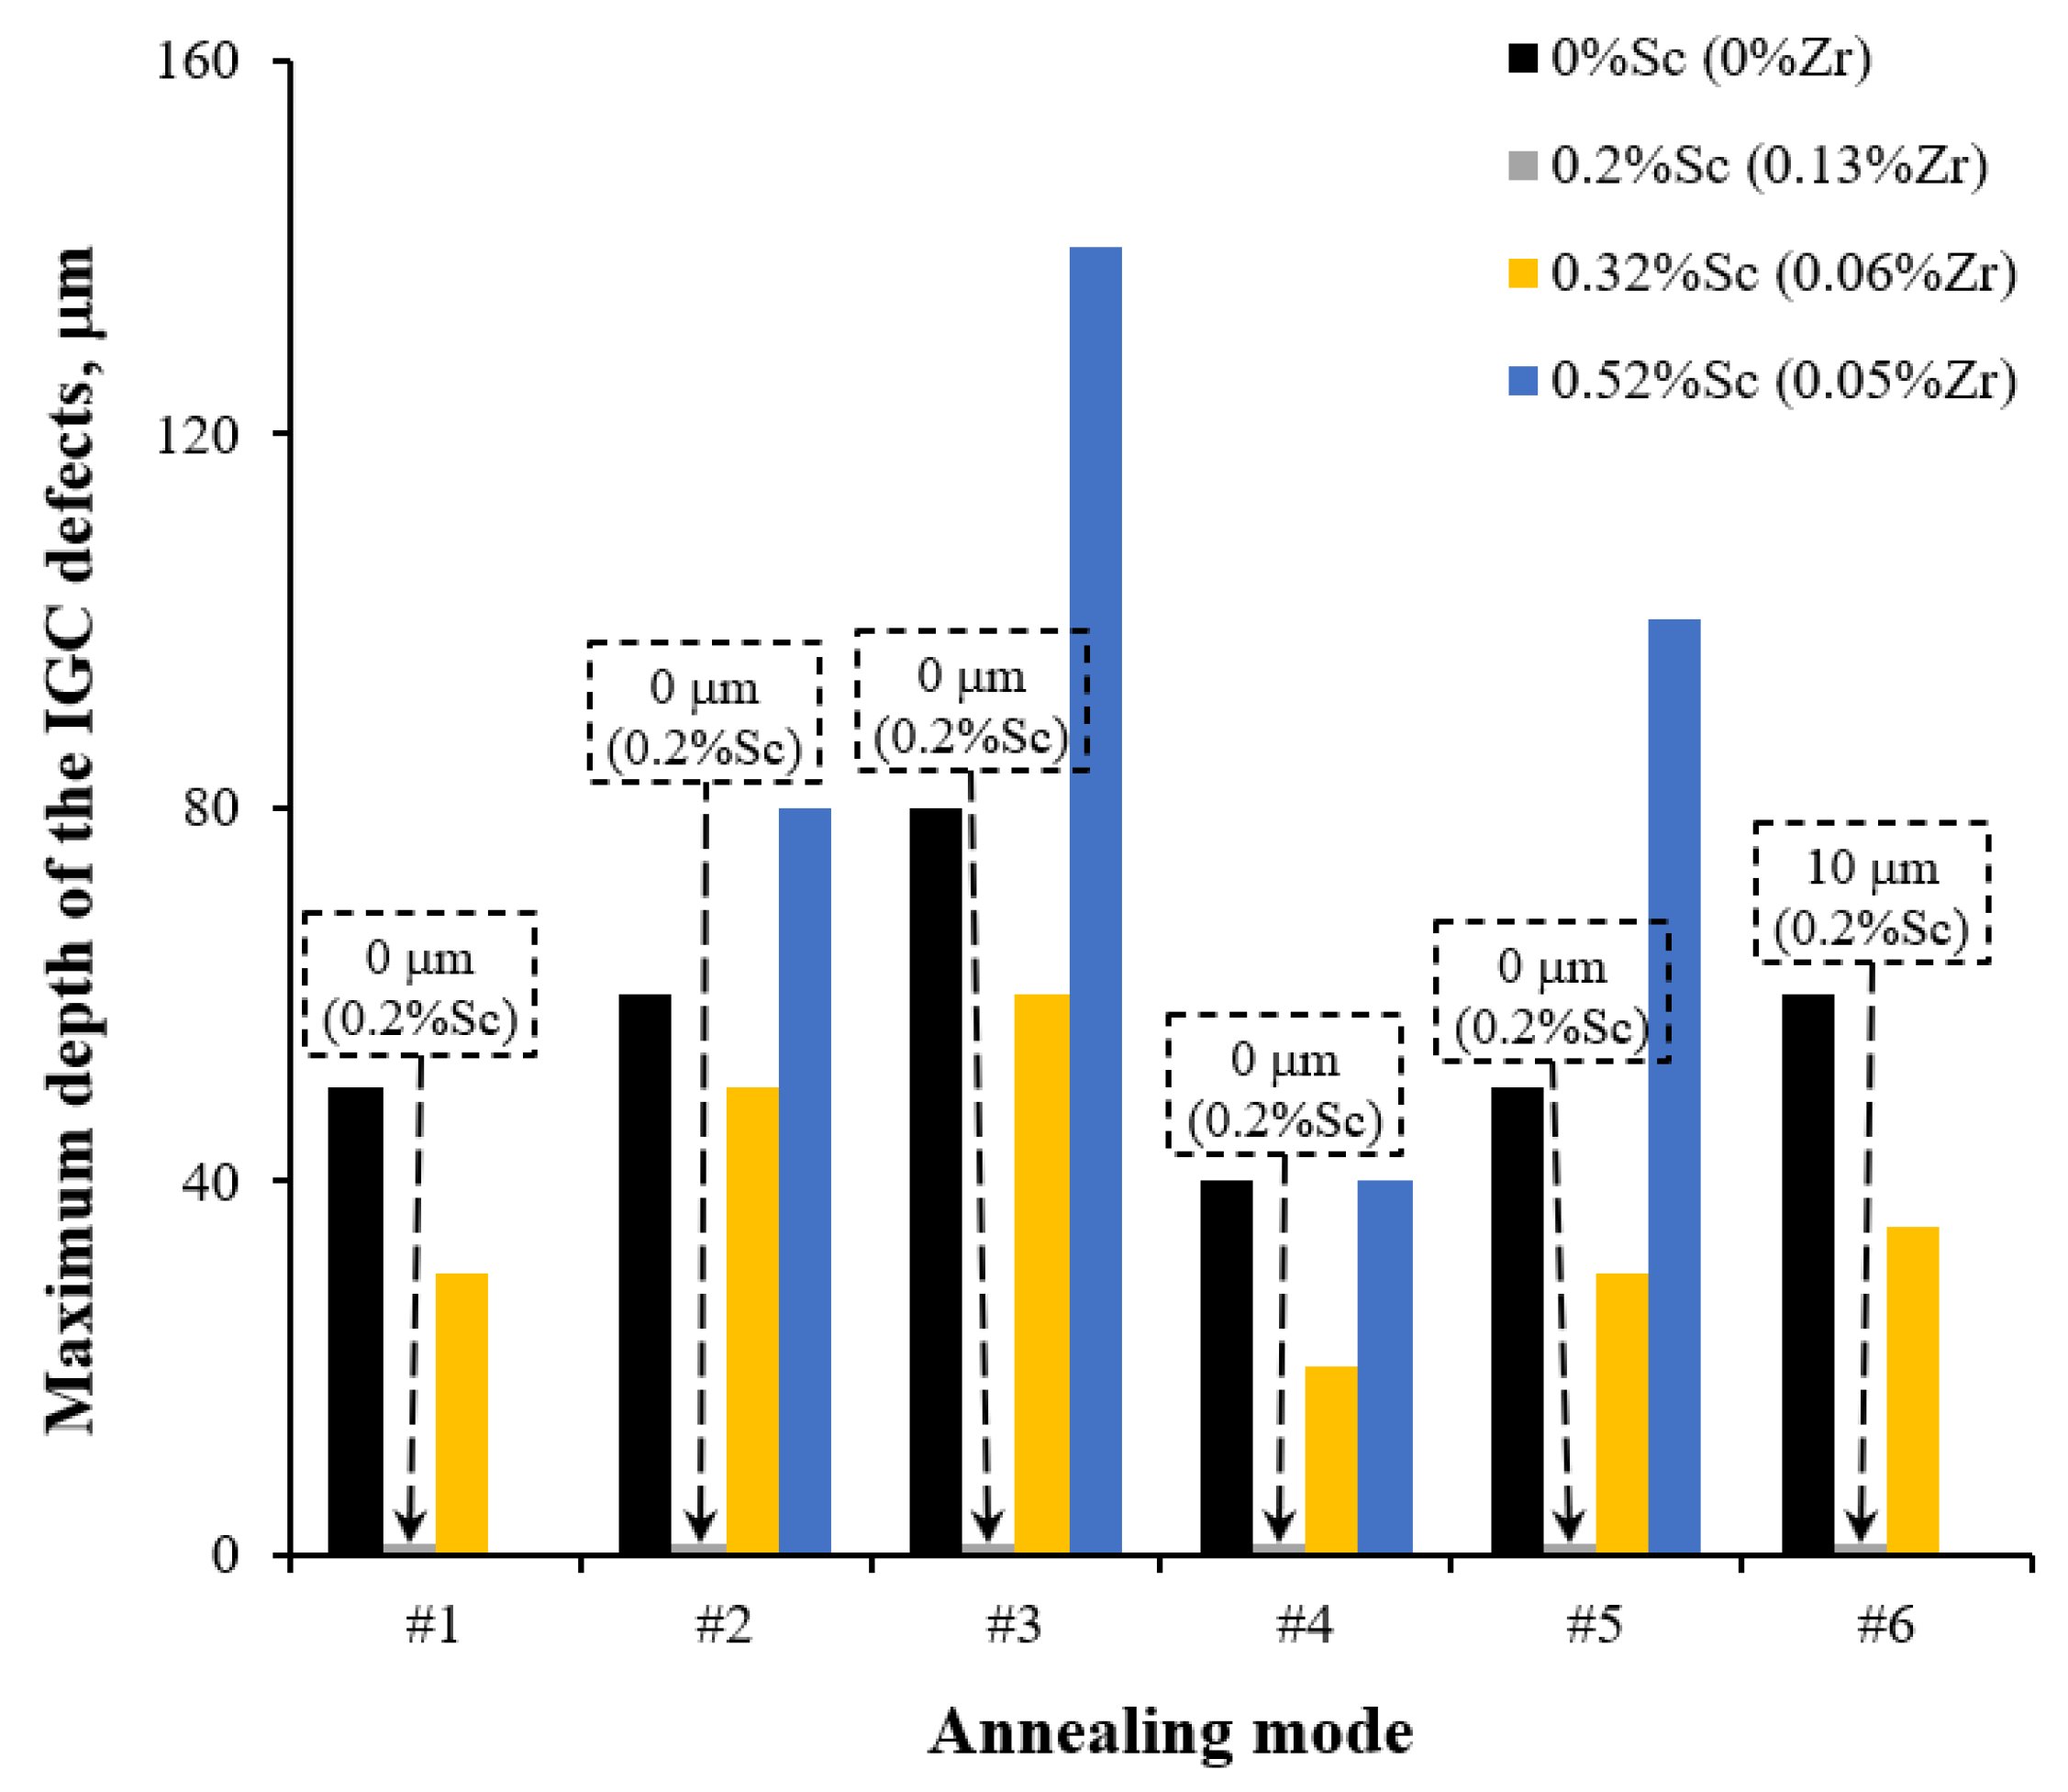
Annealing leads to a decrease in the depth of IGC defects in the cast and UFG alloys. The dependence of icorr(T) of the cast and UFG alloys with 2.5% Mg has a three-stage character with a maximum. The maximum values of icorr were observed after annealing at 450 °C. An increase in the Mg concentration leads to a decrease in the increase scale in icorr. Metallographic studies of the annealed sample surfaces show that in the temperature range from 300 to 450 °C, an increase in the volume and size of fine Type II defects is observed. Annealing at above 450 °C leads to a decrease in the size of both large Type I defects and fine Type II ones. The nature of the annealing effect on the corrosion resistance of UFG alloys is similar to that of the cast alloys.
In conclusion, it should be noted that (i) ECAP, (ii) Mg concentration, (iii) Sc/Zr ratio, and (iv) annealing temperature have different effects on the stationary IGC test results and the value of icorr determined by electrochemical tests. In our opinion, the main contribution to icorr is made by the comparable contributions of Type I and Type II defects during electrochemical tests. In the stationary corrosion tests, only large Type I IGC defects make the main contribution. Thus, comparing the results of electrochemical tests and conventional stationary tests, it is possible to analyze separately the influence of various microstructure parameters of the Al alloys on their susceptibility to IGC. It should be noted that scratches of 3–5 μm in depth from the mechanical polishing were preserved on the sample surfaces (Figure 22, Figure 25 and Figure 26). This allows concluding that intensive general corrosion of Al alloys does not occur during the tests.

4.2. Effect of Microstructure on Corrosion Resistance of Al–Mg–Sc–Zr Alloys

Further, the effect of the Mg concentration and the Sc/Zr ratio on the corrosion rate of the Al–Mg–Sc–Zr alloys is analyzed. It is important to note that the environment where the corrosion tests of the aluminum alloys were carried out was designed for the IGC resistance study.

4.2.1. Effect of Mg

When analyzing the effect of Mg, the presence of two types of IGC defects should be taken into account. Large IGC defects of Type I are associated with the presence of primary β-phase particles at dendrite boundaries. Fine IGC defects of Type II are associated with the presence of a grid of fine β-phase particles at GBs. As previously mentioned, the reason for the appearance of small β-phase particles at GBs is the effect of solid-phase wetting of GBs (see [75,76,77]). Additionally, it is important to note that Mg is a horophile alloying element in aluminum [81] and tends to form GB segregations. This feature, in particular, results in grain refinement in Al–Mg alloys being accompanied by a slight increase in the concentration of Mg at the GBs (see [17]).
Next, the effect of Mg on the corrosion resistance of Al–Mg–Sc–Zr alloys will be analyzed.
As shown in Figure 21, an increase in the Mg concentration leads to an increase in the corrosion current density icorr. In the alloys with 6% Mg, the corrosion current density is an order of magnitude higher than in the alloys with 2.5%Mg. It is important to note that in the UFG alloys at Sc/Zr = const, the corrosion current density difference between the alloys with 2.5 and 6% Mg was significantly greater than in the cast alloys. At the same time, an increase in the Mg concentration leads to a decrease in the depth of large Type I IGC defects (Figure 22).
It is generally assumed that an increase in the Mg concentration leads to an increase in the number of the β-phase particles and, as a consequence, to an increase in the depth and density of the IGC defects. In our opinion, the decrease in the corrosion resistance of the Al–Mg alloys is associated with an increase in the number of β-phase particles located along the GBs. As shown in Figure 7, the β-phase particles exhibit low corrosion resistance and are easily dissolved during the electrochemical polishing of the ground surface. Additionally, the β-phase particles form micro-galvanic couples with the Al crystal lattice. Accelerated corrosion damage may occur along the interphase boundaries of these couples. Therefore, a decrease in the depth of the large IGC defects of Type I in the alloys with increased Mg content is an unexpected result.
With increasing Mg concentration, a significant decrease in the average grain and dendrite sizes is observed in the cast Al–Mg–Sc–Zr alloys (Figure 4). This leads to an increase in the area of the dendritic boundaries. A decrease in the grain size will lead to an increase in the distance between the large β-phase particles, specifically leading to a greater extent of GBs among these particles. Studies [28,29,32] have demonstrated that an increase in the distance between β-phase particles leads to an increase in the corrosion resistance of aluminum alloys. This leads to a decrease in the depth of Type I IGC defects.
An increase in the GB areas leads to an increase in the fraction of fine Type II corrosion defects and, as a consequence, to an increase in the corrosion current density icorr. The primary reason for this is the effect of solid-phase wetting of GBs by β-phase [75,76,77] and the increased concentration of Mg at the GBs of aluminum alloys.
An additional factor contributing to the increase in icorr is the indirect effect of primary Al3(Sc,Zr) particles on the corrosion resistance of the cast Al alloys. As it was shown in [34,35,36,37,67], the Al3(Sc,Zr) particles have a negligible negative influence on the corrosion resistance of the Al alloys. However, as it was shown in [58,59,60,61,62,63,64], the intermetallic particles (Al6Mn, Al3(Sc,Zr), Al3Er@Al3Zr, etc.) can be a site of the β-phase formation. An increase in the number of the primary Al3(Sc,Zr) particles and, accordingly, an increase in the number of the β-phase nanoparticles would lead to an increase in the fraction of fine Type II defects in the cast alloys with 6%Mg.
ECAP at elevated temperatures (250–275 °C) leads to partial refinement of the large primary β-phase particles located along the boundaries of dendrites (see [82,83]). Elevated temperatures of SPD provide partial dissolution of large primary β-phase particles. This assumption is confirmed by the increase in the SER of the Al alloys after ECAP (Table 3). The refinement of large β-phase particles provides a slight decrease in the depth of large Type I IGC defects in the UFG alloys. A significant increase in the total length of the GBs in the UFG alloys provides a sharp increase in the number of fine Type II defects and, consequently, an increase in icorr (Figure 21a). As mentioned above, the largest difference in the icorr values was observed for the cast and UFG alloys with 6% Mg (Figure 21a). In our opinion, this is because cooling the UFG alloys after ECAP (TECAP = 250–275 °C) to RT leads to the formation of the secondary β-phase nanoparticles in the Mg-rich alloys. The preferential sites for the formation of the secondary β-phase nanoparticles are new GBs of deformation origin formed during ECAP and primary Al3(Sc,Zr) particles.

4.2.2. Effect of Sc/Zr Ratio

The issue of the effect of the Sc/Zr ratio on the corrosion resistance of the Al–Mg alloys is less straightforward. Increasing the Sc/Zr ratio results in the microstructure refinement of the cast Al alloys and a decrease in the number of the primary particles. These factors would lead to a decrease in the corrosion current density icorr and a decrease in the depth of Type I IGC defects.
As shown in the Introduction, the Al3Sc particles act as the cathodes with respect to the aluminum crystal lattice and form the Al3Sc/Al micro-galvanic couples contributing to the acceleration of the localized corrosion. Therefore, it can be assumed that the high values of icorr in the unannealed Al–Mg–Sc–Zr alloys with higher Sc/Zr ratios are due to the presence of the primary Al3(Sc,Zr) particles with an increased Sc content. The primary Al3Zr particles and the Al3(Sc,Zr) ones with the higher Zr content have less influence on the icorr. Hence, partial substitution of Sc for Zr (reducing the Sc/Zr ratio) leads to a decrease in icorr (Figure 21a).
A significant reduction in the corrosion current density in the alloys with Sc/Zr > 1, in our opinion, is due to the specific Al3Sc core—Al3Zr shell structure of the Al3(Sc,Zr) particles [41,42,43,44]. Since the diffusion coefficient of Sc in Al is much larger than that of Zr [84,85,86], the formation of corrosion-prone Al3Sc particles initially occurs during heating. Further, the Al3Zr shells emerge on the surfaces of the Al3Sc cores. This results in a reduction in the alloy’s corrosion rate to the values typical of the alloys with Sc/Zr > 1, along with an increased Zr content (Figure 21a).
ECAP has no significant effect on the size and number of the primary particles. Therefore, the scale of the Sc/Zr ratio effect on the corrosion resistance of the cast and UFG alloys is comparable (see above).
The result obtained some contradiction to the data of [64], in which the effect of Sc concentration on the corrosion rate of Al–6%Mg–0.56%Mn alloy in a 3% NaCl aqueous solution was studied. Al–6%Mg–0.56%Mn–Sc–Zr alloys were tested in a hot-deformed state after the high-temperature stabilizing annealing, as well as after annealing at 160–180 °C (24–50 h). At all the concentrations of Sc and Zr, the alloys are in a passive state—the corrosion potential is less than the pitting potential. It has been shown that small additives of Sc and Zr increase the ability of the Al–6%Mg alloy to self-passivate in a 3% NaCl aqueous solution. It was shown in [64] that the dependence of the IGC rate of the Al–6%Mg–0.56%Mn alloy on the Sc concentration is non-monotonic (Figure 27). The Al–6.2%Mg–0.56%Mn alloy (Russian analog—AMg6 alloy) has a tendency to IGC (Figure 27). The addition of 0.20% Sc (at 0.13% Zr) to the Al–6%Mg alloy leads to the disappearance of the IGC defects. The increase in the Sc concentrations from 0.20% Sc (at 0.13% Zr) to 0.52% Sc (at 0.05% Zr) leads to an increase in the depth of the IGC defects in the annealed alloys (Figure 27). The authors of [64] claimed the increased tendency of Al–Mg–Mn–Sc–Zr alloys to IGC to originate from the enrichment of the GBs with β′- and β-phases as well as with the Mg atoms. A decrease in the Mg concentration near the boundaries creates micro-galvanic pairs consisting of the grain boundaries (anodes)—near boundary zone (cathode), which provokes IGC.
In our opinion, the main origin of the discrepancy between the results of our study and the ones by [64] is the difference in the ranges of Sc and Zr concentrations, in which the effect of the Sc/Zr ratio on the corrosion resistance of the Al alloy was studied. An increase in the depth of IGC defects was observed in the concentration range from 0.32% Sc (at 0.06% Zr) to 0.52% Sc (at 0.05% Zr). In the concentration range from 0 to 0.20% Sc (at 0.13% Zr), the depth of the IGC defects decreased from 40–80 μm to zero (Figure 27). In the present study, a range of concentrations from 0.22% Sc + 0.10% Zr to 0.10% Sc + 0.22% Zr was investigated, which corresponds to the range of decreasing IGC defect depths in Figure 24.
The authors of [64] did not explain the origin of the increase in the IGC rate in the alloys with 0.32–0.52% Sc. The results of investigations of the primary particles are absent in [64]. In our opinion, a significant increase in the Sc concentration over 0.20–0.25% leads to an increase in the volume fraction of the primary Al3(Sc,Zr) particles and a decrease in the volume fraction of the secondary particles. This assumption is indirectly supported by the reduced values of the yield strength and UTS of the alloys with 0.32–0.52% Sc [64]. The second reason for the increase in the IGC rate in the alloys with 0.32–0.52% Sc may be the increased Fe impurities content in these alloys (0.11–0.15 wt.% at 0.06–0.07% Sc). At the same time, the alloys with 0–0.2% Sc contained 0.04–0.06% Fe and 0.05–0.10% Si.

4.2.3. Effect of Annealing: Synergistic Effect of Mg and Sc/Zr Ratio

In the present study, an unexpected result was found—a non-monotonic character of the dependence of the corrosion current density icorr on the annealing temperature of the cast and UFG alloys with 2.5 and 4%Mg (Figure 24). The maximum values of icorr were observed after 30 min annealing at 400–450 °C. In alloys with 6% Mg, the dependence of icorr(T) has a two-stage behavior. Heating to temperatures exceeding 350 °C results in a sharp decrease in icorr. It is also important to note that in all alloys (2.5%, 4%, and 6%Mg), an increase in the annealing temperature of more than 400–450 °C led to a monotonic decrease in both the number and area of IGC defects (Figure 24 and Figure 25).
As can be seen in Figure 15, annealing results in a reduction in the SER of the alloys and an increase in their hardness. The changes observed were attributed to the reduction in the concentration of AEs (Sc, Zr) in the aluminum crystal lattice and the formation of the secondary Al3(Sc,Zr) particles, which hinder the dislocation movement. The results of the resistivity studies are in good agreement with the TEM study results of the microstructure of the Al alloys (Figure 7, Figure 9 and Figure 10).
As is well known, Mg and Sc reduce each other’s solubility in the Al crystal lattice [87], thereby accelerating the precipitation process of Al3(Sc,Zr) particles. It has been demonstrated in [88,89] that Mg atoms segregate at the Al/Al3Sc interphase boundary. In [64], it was shown for the first time that the interphase boundaries of Al/Al3(Sc,Zr) are the place of preferential precipitation of β- and β’-phase particles, which are the anode with respect to Al grains. Later, it was demonstrated in [59,60,61,62,63,64,65] that the precipitation of the secondary β-phase particles is also observed on other particles, such as Al6Mn and Al3Er@Al3Zr. This may lead to an increase in the corrosion rate during annealing of Al–Mg–Sc–Zr alloys. The assumption about the precipitation of the β- and β’-phase particles at the GBs was confirmed by an increase in both the number and size of fine IGC defects when heated to 300–350 °C (Figure 25). Note that β-phase particles can be precipitated even in low-angle GB [12,27,33]. Such GBs are typical for coarse-grained aluminum alloys.
The second factor contributing to an increase in the corrosion current during the annealing of Al–Mg–Sc–Zr alloys is an increase in the area of GBs wetted by β-phase. As shown in [22,76,77,78], increasing the heating temperature of coarse-grained Al–Mg alloys containing 10–25%Mg from 210 °C to ~400 °C leads to a monotonic increase in the proportion of GBs wetted by β-phase, ranging from 0 to 100% (see Figure 3 in [76]). A feature of the experiments described in [76] is the extended isothermal exposure time (600–4000 h) at temperatures of 210–400 °C. In the present study, short 30 min annealing and alloys with a lower magnesium content (2.5–6%) were used. In this regard, it is assumed that the general pattern remains consistent, although the proportion of GBs wetted by β-phase will be smaller. Consequently, increasing the temperature of 30 min annealing leads to an increase in the area of GBs, which are the sites for the formation of thin IGC defects of Type II. It is important to note that the effect of solid-phase wetting of GBs is also observed in highly deformed Al–(3, 5, 10%)Mg alloys [22,78], although it has a number of features that cannot be described using the Al–Mg equilibrium diagram.
A decrease in the corrosion current density of the Al–Mg–Sc–Zr alloys at higher annealing temperatures (above 450 °C), in our opinion, is attributed to the following two main factors. First, at elevated heating temperatures, the dissolution of primary and secondary β-phase particles begins, and their contribution to the IGC rate decreases. The indirect evidence of the β-phase particle dissolution beginning is an increase in the SER at elevated annealing temperatures (Figure 15). A decrease in the number of the large primary β-phase particles leads to a decrease in the number of large Type I corrosion defects, whereas a decrease in the number of the secondary β-phase particles leads to a decrease in the number of fine Type II defects (Figure 24 and Figure 25).
Second, the Al3(Sc,Zr) particles begin to grow, with larger particles absorbing smaller ones during annealing. This leads to a reduction in the number of particles, as well as a decrease in the Al/Al3(Sc,Zr) interface area, which is accompanied by a reduction in their contribution to the corrosion rate of the aluminum alloy. The combination of these two factors leads to a reduction in the corrosion current density for the Al–Mg–Sc–Zr alloys at elevated annealing temperatures.
Finally, the effect of Mg concentration and Sc/Zr ratio on the scale of the increase in the corrosion current density icorr during annealing of Al–Mg–Sc–Zr alloys should be discussed.
As mentioned above, an increase in the Mg concentration leads to a decrease in icorr. However, no increase in icorr was observed during annealing the alloys with 6% Mg (Figure 24). In our opinion, this is due to the effect of Mg on the intensity of the precipitation of the Al3(Sc,Zr) particles. As illustrated in Figure 15, an increase in the Mg concentration from 2.5 to 6% led to a twofold decrease in the SER change. This, in turn, can be attributed to a decrease in the fraction of the secondary Al3(Sc,Zr) particles. The secondary Al3(Sc,Zr) particles are the sites of the secondary β-phase nanoparticle formation, which provokes the trace formation of fine Type II IGC defect. As a consequence, the increase in the IGC rate due to the formation of the secondary β-phase particles and the appearance of fine Type II defects is compensated by a decrease in the IGC rate due to the diffusion dissolution of the primary β-phase particles and a reduction in the size of large Type I defects.
Figure 24 shows that the maximum increase in the corrosion current density Δicorr was observed for the alloys with high Sc content. Figure 15 demonstrates that the alloys with high Sc content are characterized by a significant change in the resistivity during annealing. The Al3Sc and Al3(Sc0.5Zr0.5) particles are formed inside the grains during heating the alloys with Sc/Zr > 1, while the submicron fan-shaped Al3Zr particles are released near the GBs by the discontinuous precipitation mechanism (Figure 11a). A decrease in the Sc/Zr ratio leads to a decrease in the volume fractions of the Al3Sc and Al3(Sc0.5Zr0.5) particles and an increase in the number of the submicron Al3Zr fan-shaped particles formed by the discontinuous precipitation mechanism.
It is important to note that the atomic mass of Sc (~44.86 g/mol) is less than that of Zr (~91.22 g/mol). Therefore, substituting 0.02% Sc with 0.02% Zr leads to a decrease in the total concentration of Sc + Zr in the alloy. As a consequence, the volume fraction of the secondary particles decreases.
Thus, in the alloys with an increased Sc/Zr ratio, the rapid formation of a large number of the secondary Al3(Sc,Zr) particles was observed, which are areas of precipitation of the secondary β-phase particles. A decrease in the Sc/Zr ratio leads to a decrease in the volume fraction of the secondary Al3(Sc,Zr) particles and, as a result, to a decrease in the number and size of fine Type II IGC defects. This leads to a decrease in Δicorr during annealing of the alloys with Sc/Zr < 1 (Figure 22 and Figure 23).

4.3. Summary of the Analysis Results—Concluding Remarks

The primary objective for the effective use of aluminum alloys is to obtain both enhanced strength and improved corrosion resistance.
A summary of the presented results indicates that the increased rate of IGC of Al–Mg–Sc–Zr aluminum alloys is due to the presence of large primary β-phase particles along the boundaries of dendrites. Three cycles of ECAP at temperatures between 250 and 275 °C do not allow for the complete refinement of large primary β-phase particles. Probably, effective refinement of the β-phase particles can only be achieved at higher degrees of deformation (see, e.g., [22,23,83,90]). This leads to the appearance of large IGC defects, which are labeled as Type I defects. Changing the Mg concentration from 2.5% to 6% has minimal impact on the number and size of Type I defects. Such defects are observed, among other instances, in UFG materials, whose structure was formed by warm severe plastic deformation, as well as after a short-term 30 min annealing at 500–550 °C. The secondary β-phase particles are precipitated along the GBs after heating to 300–350 °C, leading to the formation of fine IGC defects, which are labeled as Type II defects. The most probable cause of Type II defects is the effect of solid-phase wetting of aluminum GBs by β-phase particles [76,77,78]. Type II defects are unstable, and their number begins to decrease after 30 min of annealing at temperatures exceeding 400–450 °C.
It is important to note that even high-temperature annealing for 30 min does not completely eliminate Type II IGC defects. It should be emphasized that the standard high-temperature homogenization annealing (e.g., 440–500 °C for 6–12 h [90]) is not an effective method for eliminating Type I defects. During such high-temperature annealing, the rapid release and growth of Al3(Sc,Zr) particles occur, and their contribution to the strength of the aluminum alloy is minimal. As illustrated in Figure 14, softening of cast Al–Mg–Sc–Zr alloys due to the growth of Al3(Sc,Zr) particles begins after 30 min of annealing at temperatures exceeding 350–400 °C.
It is important to note that in alloys with a high Zr content, the discontinuous precipitation of Al3Zr particles occurs, which prevents the obtaining of maximum strength in these alloys.
The secondary β-phase particles are also precipitated on the secondary Al3(Sc,Zr) particles that form during annealing of the UFG alloys at temperatures exceeding 300 °C. The maximum volume fraction of these secondary particles is achieved after 30 min of annealing at 350–400 °C. Despite the fact that the release of Al3(Sc,Zr) particles leads to an increase in the corrosion current, their contribution to the IGC rate is minimal, as these particles are located in the volume of grains. This, in turn, allows for the strengthening heat treatment of Al–Mg–Sc–Zr alloys without significantly reducing their IGC resistance.
Thus, the results confirm that β-phase particles both directly and indirectly reduce the corrosion resistance of Al–Mg–Sc–Zr alloys. While this is a well-established finding, our research indicates that it is necessary to apply complex processing to enhance the corrosion resistance of new aluminum alloys Al–Mg–Sc–Zr.
At the first stage, in our opinion, it would be optimal to use a two-stage heat treatment of cast alloys, which allows for the reduction in the discontinuous precipitation intensity of Al3Zr particles. In [52], the following two regimes of a two-stage heat treatment were developed to achieve maximum strength and thermal stability of Al–2.8%Mg–Zr and Al–2.8%Mg–Zr–Sc alloys: (i) 350 °C for 32 h + 400 °C for 4 h and (ii) 350 °C for 4 h + 400 °C for 4 h. In a later article [53], these regimes were refined and named T8 (360 °C for 4 h + 420 °C for 4 h) and T36 (360 °C for 32 h + 420 °C for 4 h). The T36 regime corresponded to the case of maximum hardness of Al–3%Mg–0.25%Zr alloys (see also [91]). Alloys processed under these regimes exhibited higher characteristics compared to alloys that were subjected to conventional single-stage annealing.
Also, the study [90] demonstrated that the precipitation of the secondary β-phase particles during the low-temperature annealing at 230 °C for 6 h results in the formation of a finer-grained structure during high-temperature forging at 350 °C of the AA5059 alloy. The alloy was preliminarily annealed at 460 °C for 8 h and then quenched in water. It is noteworthy that preliminary deformation provided a more uniform distribution of submicron β-phase particles after annealing at 230 °C for 6 h.
In our opinion, the following processing regime for Al–Mg–Sc–Zr ingots would be optimal:
Stage 1—a two-stage heat treatment according to the T36 regime, which ensures uniform precipitation of Al3(Sc,Zr) nanoparticles and partial dissolution of primary β-phase particles. This process is followed by quenching in water, resulting in an increase in the concentration of Mg in the aluminum crystal lattice.
Stage 2—the hot deformation processing (e.g., extrusion) of the annealed ingot at temperatures of 350–420 °C, which provides the refinement of large β-phase particles and ensures their uniform distribution in the volume of the deformed alloy.
Stage 3—cold deformation processing (e.g., rotary swaging) to enhance the density of lattice dislocations.
Stage 4—the stabilizing heat treatment (230 °C for 6 h or a similar annealing regime) of the deformed blank, which provides the uniform precipitation of the secondary β-phase nanoparticles on dislocations and secondary Al3(Sc,Zr) nanoparticles.
Stage 5—the final severe plastic deformation of the stabilized alloy using the ECAP method, which ensures the formation of a homogeneous UFG microstructure. The ECAP temperature must not exceed 350 °C, as this temperature initiates (i) the dissolution of the secondary β-phase particles, (ii) grain growth, and (iii) the coarsening of Al3(Sc,Zr) particles.
Such multistage processing should allow for the formation of a homogeneous UFG microstructure with the maximum volume fraction of the secondary Al3(Sc,Zr) nanoparticles, the absence of elongated particles formed by the discontinuous precipitation mechanism, as well as the maximum volume fraction of the secondary β-phase particles that are released on dislocations and secondary Al3(Sc,Zr) particles. Note that, in accordance with [90], the secondary submicron β-phase particles released in the volume of grains contribute to an additional increase in the ultimate strength of aluminum alloys Al–Mg.

5. Conclusions

(1)
After the corrosion tests in an aqueous solution of 3% NaCl + 0.3% HCl, two types of corrosion defects were observed on the surfaces of the cast Al–Mg–Sc–Zr alloy samples. Type I—large, wide IGC defects associated with corrosion destruction of the primary β-phase particles located along the dendrite boundaries. Type II—fine IGC defects associated with the grain boundaries, which are covered by thin layers of β-phase due to the effect of solid-phase wetting. The fractions of the defect depend on the Mg concentration, Sc/Zr ratio, grain sizes, and annealing regimes.
(2)
The main reason for the IGC defects in the cast Al–Mg–Sc–Zr alloys is the formation of the primary β-phase particles during the cooling of the ingots. An increase in the Mg concentration leads to a decrease in the depth of the IGC defects and an increase in the corrosion rate during the electrochemical tests (an increase in the corrosion current density icorr). An increase in the Sc/Zr ratio leads to a decrease in the depth of the IGC defects, but the scale of this effect is smaller than the one of Mg. An increase in the Sc/Zr ratio leads to a decrease in icorr in the electrochemical test.
(3)
ECAP leads to a slight decrease in the depth of the IGC defects and a significant increase in the corrosion current density icorr. The effect of the nature of the Mg concentration and the Sc/Zr ratio on the corrosion resistance of the UFG Al alloys is similar to that of the cast alloys.
(4)
The dependence of icorr on the annealing temperature of the cast and UFG alloys with 2.5% and 4% Mg has a three-stage character with a maximum value. The origin of the increase in the corrosion current density during heating of the Al–Mg–Sc–Zr alloys is the release of the secondary β-phase particles on the secondary Al3(Sc,Zr) particles and an increase in the proportion of grain boundaries wetted by β-phase. Decreasing icorr at elevated annealing temperatures can be attributed to the dissolution of β-phase particles.

Author Contributions

Conceptualization, V.C.; methodology, V.C. and A.N.; validation, A.N.; formal analysis, V.C., A.N., N.K., I.S., A.K., V.K., A.B. and E.M.; investigation, N.K., I.S., A.K., V.K., A.B. and E.M.; resources, V.C., V.K. and A.N.; data curation, A.N. and N.K.; writing—original draft preparation, V.C., A.N. and N.K.; writing—review and editing, V.C. and A.N.; visualization, A.N. and N.K.; supervision, V.C. and A.N.; project administration, V.C.; funding acquisition, V.C. All authors have read and agreed to the published version of the manuscript.

Funding

The study was supported by the Russian Science Foundation (grant No. 22-13-00149).

Data Availability Statement

The data presented in this study are available on request from the corresponding author. The data are not publicly available due to privacy or ethical restrictions.

Acknowledgments

The authors would like to thank V.V. Zakharov (Russian Institute of Light Alloys, Moscow, Russia) for his recommendations on the selection of compositions and casting regimes for the aluminum alloys. The authors also thank D.A. Zotov (Lobachevsky University, Nizhny Novgorod, Russia) for his assistance in preparing the Al alloy samples for corrosion testing. The authors thank N.Yu. Tabachkova (National University of Science and Technology MISIS, Moscow, Russia) for conducting the TEM investigations of the microstructure of Al alloys. The authors would like to thank K. Rubtsova (Lobachevsky University, Nizhny Novgorod, Russia) for providing the X-ray results.

Conflicts of Interest

The authors declare no conflicts of interest.

Abbreviations

The following abbreviations are used in this manuscript:
AEsalloying elements
ECAPequal channel Angular pressing
EDSenergy dispersion (analysis)
GBgrain boundary
GBsgrain boundaries
HAGBshigh-angle grain boundaries
IGCintergranular corrosion
RTroom temperature
SEMscanning electron microscopy
SERspecific electrical resistivity
SPDsevere plastic deformation
TEMtransmission electron microscopy
UFG (alloy)ultra-fine-grained (alloy)

References

  1. Filatov, Y.A.; Yelagin, V.I.; Zakharov, V.V. New Al-Mg-Sc alloys. Mater. Sci. Eng. A 2000, 280, 97–101. [Google Scholar] [CrossRef]
  2. Davydov, V.G.; Rostova, T.D.; Zakharov, V.V.; Filatov, Y.A.; Yelagin, V.I. Scientific principles of making an alloying addition of scandium to aluminium alloys. Mater. Sci. Eng. A 2000, 280, 30–36. [Google Scholar] [CrossRef]
  3. Avtokratova, E.; Sitdikov, O.; Markushev, M.; Linderov, M.; Merson, D.; Vinogradov, A. The processing route towards outstanding performance of the severely deformed Al-Mg-Mn-Sc-Zr alloy. Mater. Sci. Eng. A 2021, 806, 140818. [Google Scholar] [CrossRef]
  4. Malopheyev, S.; Kulitskiy, V.; Kaibyshev, R. Deformation structure and strengthening mechanisms in an Al-Mg-Sc-Zr alloy. J. Alloys Compd. 2017, 698, 957–966. [Google Scholar] [CrossRef]
  5. Vinogradov, A.; Washikita, A.; Kitagawa, K.; Kopylov, V.I. Fatigue life of fine-grained Al-Mg-Sc alloys produced by Equal-Channel Angular Pressing. Mater. Sci. Eng. A 2003, 349, 318–326. [Google Scholar] [CrossRef]
  6. Furukawa, M.; Utsunomiya, A.; Matsubara, K.; Horita, Z.; Langdon, T.G. Influence of magnesium on grain refinement and ductility in a dilute Al–Sc alloy. Acta Mater. 2001, 49, 3829–3838. [Google Scholar] [CrossRef]
  7. Avtokratova, E.; Sitdikov, O.; Markushev, M.; Mulyukov, R. Extraordinary high-strain rate superplasticity of severely deformed Al–Mg–Sc–Zr alloy. Mater. Sci. Eng. A 2012, 538, 386–390. [Google Scholar] [CrossRef]
  8. Ralston, K.D.; Birbilis, N.; Davies, C.H.J. Revealing the relationship between grain size and corrosion rate of metals. Scr. Mater. 2010, 63, 1201–1204. [Google Scholar] [CrossRef]
  9. Ralston, K.D.; Fabijanic, D.; Birbilis, N. Effect of grain size on corrosion of high purity aluminum. Electrochem. Acta 2011, 56, 1729–1736. [Google Scholar] [CrossRef]
  10. Segal, V.M.; Beyerlein, I.J.; Tome, C.N.; Chuvil’deev, V.N.; Kopylov, V.I. Fundamentals and Engineering of Severe Plastic Deformation; Nova Science Publishers: New York, NY, USA, 2010. [Google Scholar]
  11. Minoda, T.; Yoshida, H. Effect of grain boundary characteristics of intergranular corrosion resistance of 6061 aluminum alloy extrusion. Metall. Mater. Trans. A 2002, 33, 2891–2898. [Google Scholar] [CrossRef]
  12. Lervik, A.; Wenner, S.; Lunder, O.; Marioara, C.D.; Holmestand, R. Grain boundary structures and their correlation with intergranular corrosion in an extruded Al-Mg-Si-Cu alloy. Mater. Charact. 2020, 170, 110695. [Google Scholar] [CrossRef]
  13. Bałkowiec, A.; Michalski, J.; Matysiak, H.; Kurzydlowski, K.J. Influence of grain boundaries misorientation angle on intergranular corrosion in 2024-T3 aluminium. Mater. Sci-Pol. 2011, 29, 305–311. [Google Scholar] [CrossRef]
  14. Zhang, X.; Zhou, X.; Nilsson, J.O.; Dong, Z.; Cai, C. Corrosion behaviour of AA6082 Al-Mg-Si alloy extrusion: Recrystallized and non-recrystallized structures. Corros. Sci. 2018, 144, 163–171. [Google Scholar] [CrossRef]
  15. Sinyavskii, V.S.; Ulanova, V.V.; Kalinin, V.D. On the mechanism of intergranular corrosion of aluminum alloys. Prot. Met. 2004, 40, 481–490. [Google Scholar] [CrossRef]
  16. Sauvage, X.; Ganeev, A.; Ivanisenko, Y.; Enikeev, N.; Muraskin, M.; Valiev, R. Grain boundary segregation in UFG alloys produced by Severe Plastic Deformation. Adv. Eng. Mater. 2012, 14, 968–974. [Google Scholar] [CrossRef]
  17. Sauvage, X.; Enikeev, N.; Valiev, R.; Nasedkina, Y.; Murashkin, M. Atomic-scale analysis of the segregation and precipitation mechanisms in a severely deformed Al-Mg alloy. Acta Mater. 2014, 72, 125–136. [Google Scholar] [CrossRef]
  18. Buranova, Y.; Kulitskiy, V.; Peterlechner, M.; Moguchea, A.; Kaibyshev, R.; Divinski, S.V.; Wilde, G. Al3(Sc,Zr)-based precipitates in Al–Mg alloy: Effect of severe deformation. Acta Mater. 2017, 124, 210–224. [Google Scholar] [CrossRef]
  19. Popović, M.; Romhanji, E. Characterization of microstructural changes in an Al-6.8wt.% Mg alloy by electrical resistivity measurements. Mater. Sci. Eng. A 2008, 492, 460–467. [Google Scholar] [CrossRef]
  20. Bhargava, N.R.M.R.; Samajdar, I.; Ranganathan, S.; Surappa, M.K. Role of cold work and SiC reinforcements on the β′/β precipitation in Al-10 pct Mg alloy. Metall. Mater. Trans. A 1998, 29, 2835–2842. [Google Scholar] [CrossRef]
  21. Tang, Z.; Jiang, F.; Long, M.; Jiang, J.; Liu, H.; Tong, M. Effect of annealing temperature on microstructure, mechanical properties and corrosion behavior of Al-Mg-Mn-Sc-Zr alloy. Appl. Surf. Sci. 2020, 514, 146081. [Google Scholar] [CrossRef]
  22. Straumal, B.B.; Baretzky, B.; Mazilkin, A.A.; Phillipp, F.; Kogtenkova, O.A.; Volkov, M.N.; Valiev, R.Z. Formation of nanograined structure and decomposition of supersaturated solid solution during high pressure torsion of Al-Zn and Al-Mg alloys. Acta Mater. 2004, 52, 4469–4478. [Google Scholar] [CrossRef]
  23. Kogtenkova, O.; Straumal, B.B.; Mazilkin, A.A.; Czeppe, T.; Zięba, P. Phase transformations in the Al-Mg alloys driven by high-pressure torsion. Phys. Status Solidi (B) 2021, 258, 2100210. [Google Scholar] [CrossRef]
  24. Lyndon, J.A.; Gupta, R.K.; Gibson, M.A.; Birbilis, N. Electrochemical behaviour of the β-phase intermetallic (Mg2Al3) as a function of pH as relevant to corrosion of aluminium–magnesium alloys. Corros. Sci. 2013, 70, 290–293. [Google Scholar] [CrossRef]
  25. Gupta, R.K.; Zhang, R.; Davies, C.H.J.; Birbilis, N. Influence of Mg content on the sensitization and corrosion of Al-xMg(-Mn) alloys. Corrosion 2013, 59, 1081–1087. [Google Scholar] [CrossRef]
  26. Zhang, R.; Gupta, R.K.; Davies, C.H.J.; Hodge, A.M.; Tort, M.; Xia, K.; Birbilis, N. The influence of grain size and grain orientation of sensitization in AA5083. Corrosion 2016, 72, 160–168. [Google Scholar] [CrossRef]
  27. Zhang, R.; Qiu, Y.; Yuanshen, Y.; Birblis, N. A closer inspection of a grain boundary immune to intergranular corrosion in a sensitised Al-Mg alloy. Corros. Sci. 2018, 133, 1–5. [Google Scholar] [CrossRef]
  28. Chang, J.C.; Chuang, T.H. Stress-corrosion cracking susceptibility of the superplastically formed 5083 aluminum alloy in 3.5 pct NaCl solution. Metall. Mater. Trans. A 1999, 30, 3191–3199. [Google Scholar] [CrossRef]
  29. Popović, M.; Romhanji, E. Stress corrosion cracking susceptibility of Al-Mg alloy sheet with high Mg content. J. Mater. Proc. Technol. 2002, 125–126, 275–280. [Google Scholar] [CrossRef]
  30. Scotto D′Antuono, D.; Gaies, J.; Golumbfskie, W.; Taheri, M.L. Grain boundary misorientation dependence of β phase precipitation in an Al-Mg alloy. Scr. Mater. 2014, 76, 81–84. [Google Scholar] [CrossRef]
  31. Scotto D′Antuono, D.; Gaies, J.; Golumbfskie, W.; Taheri, M.L. Direct measurement of the effect of cold rolling on β phase precipitation kinetics in 5xxx series aluminum alloys. Acta Mater. 2017, 123, 264–271. [Google Scholar] [CrossRef]
  32. Sun, F.; Nash, G.L.; Li, Q.; Liu, E.; He, C.; Shi, C.; Zhao, N. Effect of Sc and Zr additions on microstructures and corrosion behavior of Al-Cu-Mg-Sc-Zr alloys. J. Mater. Sci. Technol. 2017, 33, 1015–1022. [Google Scholar] [CrossRef]
  33. Yang, J.; Heckman, N.M.; Velasco, L.; Hodge, A.M. Improve sensitization and corrosion resistance of an Al-Mg alloy by optimization of grain boundaries. Sci. Rep. 2016, 6, 26870. [Google Scholar] [CrossRef]
  34. Ahmad, Z.; Aleem, A.; Abbas, M. Effect of scandium doping on the corrosion resistance and mechanical behavior of Al-3Mg alloy in neutral chloride solutions. Mater. Sci. Appl. 2011, 2, 244–250. [Google Scholar] [CrossRef]
  35. Ahmad, Z.; Abdul Aleem, B.J. Effect of nano Al(Sc1−xZrx) precipitates on the mechanical and corrosion behavior of Al-2.5Mg alloys. Mater. Corros. 2011, 62, 335–345. [Google Scholar] [CrossRef]
  36. Rosalbino, F.; Delsante, S.; Borzone, G.; Scavino, G. Assessing the corrosion resistance of binary Al-Sc alloys in chloride-containing environment. Mater. Corros. 2017, 68, 444–449. [Google Scholar] [CrossRef]
  37. Tuan, N.Q.; Alves, A.C.; Toptan, F.; Lopes, A.B.; Pinto, A.M.P. The effect of Sc and Yb microalloying additions and aged-hardening heat treatment on corrosion behavior of Al-Mg alloys. Mater. Corros. 2016, 67, 60–71. [Google Scholar] [CrossRef]
  38. Li, M.; Liu, S.; Wang, X.; Shi, Y.; Pan, Q.; Zhou, X.; Zhang, R.; Birbilis, N. Improved intergranular corrosion resistance of Al-Mg-Mn alloys with Sc and Zr additions. Micron 2022, 154, 103202. [Google Scholar] [CrossRef]
  39. Lee, S.L.; Chiu, Y.C.; Pan, T.A.; Chen, M.C. Effects of trace amounts of Mn, Zr and Sc on the recrystallization and corrosion resistance of Al-5Mg alloy. Crystals 2021, 11, 926. [Google Scholar] [CrossRef]
  40. Qiu, Y.; Yang, X.; Li, J.; Xiang, S.; Shi, J.; Xu, J.; Sanders, R.E. The influence of Sc and Zr additions on microstructure and corrosion behavior of AA5182 alloy sheet. Corros. Sci. 2022, 199, 110181. [Google Scholar] [CrossRef]
  41. Forbord, B.; Lefebvre, W.; Danoix, F.; Hallem, H.; Marthinsen, K. Three dimensional atom probe investigation on the formation of Al3(Sc,Zr)-dispersoids in aluminum alloys. Scr. Mater. 2004, 51, 333–337. [Google Scholar] [CrossRef]
  42. Tolley, A.; Rodmilovic, V.; Dahmen, U. Segregation in Al3(Sc,Zr) precipitates in Al-Sc-Zr alloys. Scr. Mater. 2005, 52, 621–625. [Google Scholar] [CrossRef]
  43. Fuller, C.B.; Murray, J.L.; Seidman, D.N. Temporal evolution of the nanostructure of Al(Sc,Zr) alloys: Part I—Chemical compositions of Al3(Sc1−xZrx) precipitates. Acta Mater. 2005, 53, 5401–5413. [Google Scholar] [CrossRef]
  44. Deng, Y.; Yang, Z.; Zhang, G. Nanostructure characteristics of Al3Sc1−xZrx nanoparticles and their effects on mechanical property and SCC behavior of Al-Zn-Mg alloys. Materials 2020, 13, 1909. [Google Scholar] [CrossRef]
  45. Orthacker, A.; Haberfehlner, G.; Taendl, J.; Poletti, M.C.; Sonderegger, B.; Kothleitner, G. Diffusion-defining atomic-scale spinodal decomposition within nanoprecipitates. Nat. Mater. 2018, 17, 1101–1107. [Google Scholar] [CrossRef]
  46. Clouet, E.; Laé, L.; Épicier, T.; Lefebvre, W.; Nastar, M.; Deschamps, A. Complex precipitation pathways in multicomponent alloys. Nat. Mater. 2006, 5, 482–488. [Google Scholar] [CrossRef]
  47. Stroev, A.Y.; Gorbatov, O.I.; Gornostyrev, Y.N.; Korzhavyi, P.A. Ab-initio based modeling of precipitation in Al-(Sc,Zr) alloy. Formation and stability of a core-shell structure. Comp. Mater. Sci. 2023, 218, 111912. [Google Scholar] [CrossRef]
  48. Zha, M.; Tian, T.; Jia, H.L.; Zhang, H.M.; Wang, H.Y. Sc/Zr ratio-dependent mechanisms of strength evolution and microstructural thermal stability of multi-scale hetero-structured Al-Mg-Sc-Zr alloys. J. Mater. Sci. Technol. 2023, 140, 67–78. [Google Scholar] [CrossRef]
  49. Rokhlin, L.L.; Bochvar, N.R.; Leonova, N.P. Study of decomposition of oversaturated solid solution in Al-Sc-Zr alloys at different ratio of scandium and zirconium. Inorg. Mater. Appl. Res. 2011, 2, 517–520. [Google Scholar] [CrossRef]
  50. Li, G.; Zhao, N.; Liu, T.; Li, J.; He, C.; Shi, C.; Liu, E.; Sha, J. Effect of Sc/Zr ratio on the microstructure and mechanical properties of new type of Al-Zn-Mg-Sc-Zr alloys. Mater. Sci. Eng. A 2014, 617, 219–227. [Google Scholar] [CrossRef]
  51. Chuvil’deev, V.N.; Gryaznov, M.Y.; Shotin, S.V.; Nokhrin, A.V.; Likhnitskii, C.V.; Nagicheva, G.S. Effect of Sc/Zr ratio on superplastic behavior of ultrafine-grained Al-6%Mg alloys. Mater. Sci. Eng. A 2024, 898, 146409. [Google Scholar] [CrossRef]
  52. Mochugovskiy, A.G.; Mikhaylovskaya, A.V. Comparison of precipitation kinetics and mechanical properties in Zr and Sc-bearing aluminum-based alloys. Mater. Lett. 2020, 275, 128096. [Google Scholar] [CrossRef]
  53. Mochugovskiy, A.G.; Mikhaylovskaya, A.V.; Zadorognyy, M.Y.; Golovin, I.S. Effect of heat treatment on the grain size control, superplasticity, internal friction, and mechanical properties of zirconium-bearing aluminum-based alloy. J. Alloys Compd. 2021, 856, 157455. [Google Scholar] [CrossRef]
  54. Mikhaylovskaya, A.M.; Mukhamejanova, A.; Tabachkova, N.Y.; Kishchik, M.S.; Mochugovskiy, A.G. Effect of quasicrystalline phase precipitation on the strengthening and grain refinement of Al-Mg-Mn alloy after multidirectional forging. Mater. Lett. 2025, 384, 138033. [Google Scholar] [CrossRef]
  55. Cavanaugh, M.K.; Birbilis, N.; Buchheit, R.G.; Bovard, F. Investigating localized corrosion susceptibility arising from Sc containing intermetallics Al3Sc in high strength Al-alloys. Scr. Mater. 2007, 56, 995–998. [Google Scholar] [CrossRef]
  56. Birbilis, N.; Buchheit, R.G. Investigation and discussion of characteristics for intermetallic phases common to aluminum alloys as a function of solution pH. J. Electrochem. Soc. 2008, 155, C117. [Google Scholar] [CrossRef]
  57. Yasakau, K.A.; Zheludkevich, M.L.; Lamaka, S.V.; Ferreira, M.G.S. Role of intermetallic phases in localized corrosion of AA5083. Electrochem. Acta 2007, 52, 7651–7659. [Google Scholar] [CrossRef]
  58. Luo, X.; Fang, H.; Liu, H.; Yan, Y.; Zhu, H.; Yu, K. Effect of Sc and Zr on Al6(Mn,Fe) phase in Al-Mg-Mn alloys. Mater. Transact. 2019, 60, 737–742. [Google Scholar] [CrossRef]
  59. Yan, J.; Hoge, A.M. Study of β precipitation and layer structure formation in Al 5083: The role of dispersoids and grain boundaries. J. Alloys Compd. 2017, 703, 242–250. [Google Scholar] [CrossRef]
  60. Ding, Y.; Wu, X.; Gao, K.; Huang, C.; Xiong, X.; Huang, H.; Wen, S.; Nie, Z. The influence of stabilization treatment on long-term corrosion resistance and microstructure in Er and Zr containing 5083 aluminum alloy. Mater. Charact. 2020, 161, 110143. [Google Scholar] [CrossRef]
  61. Yang, Y.K.; Allen, T. Direct visualization of β phase causing intergranular forms of corrosion in Al-Mg alloys. Mater. Charact. 2013, 80, 76–85. [Google Scholar] [CrossRef]
  62. Zhu, Y.; Cullen, D.A.; Kar, S.; Free, M.L.; Allard, L.F. Evaluation of Al3Mg2 precipitates and Mn-rich phase in aluminum-magnesium alloy based on Scanning Transmission Electron Microscopy imaging. Metall. Mater. Trans. A 2012, 43, 4933–4939. [Google Scholar] [CrossRef]
  63. Ding, Y.; Gao, K.; Xiong, X.; Huang, H.; Wen, S.; Wu, X.; Nie, Z.; Shao, R.; Huang, C.; Guo, S.; et al. High corrosion resistance and strain hardening of high Mg Al-alloy with Er and Zr by using a new reverse stabilization process. Scr. Mater. 2019, 171, 26–30. [Google Scholar] [CrossRef]
  64. Synyavskii, V.S.; Val’kov, V.D.; Titkova, E.V. The Effect of Scandium and Zirconium Additions on Corrosion Properties of Al-Mg Alloys. Prot. Met. 1998, 34, 549–555. Available online: https://elibrary.ru/item.asp?id=13300299 (accessed on 11 March 2025). (In Russian).
  65. Leibner, M.; Vlach, M.; Kodetová, V.; Kudrnová, H.; Veselý, J.; Zikmund, S. Effect of deformation on evolution of Al3(Er,Zr) precipitates in Al-Er-Zr-based alloy. Mater. Charact. 2022, 186, 111781. [Google Scholar] [CrossRef]
  66. Ma, Y.; Liu, Y.; Wang, M. Microstructures and corrosion resistances of hypoeutectic Al-6.5Si-0.45Mg casting alloy with addition of Sc and Zr. Mater. Chem. Phys. 2022, 276, 125321. [Google Scholar] [CrossRef]
  67. Wloka, J.; Virtanen, S. Influence of scandium on the pitting behaviour of Al-Zn-Mg-Cu alloys. Acta Mater. 2007, 55, 6666–6672. [Google Scholar] [CrossRef]
  68. Ryabov, D.K.; Kolobnev, N.I.; Samohvalov, S.V. Effect of scandium addition on mechanical properties and corrosion resistance of medium strength Al-Zn-Mg-Cu alloy. Mater. Sci. Forum 2014, 794–796, 241–246. [Google Scholar] [CrossRef]
  69. Kannan, M.B.; Raja, V.S. Influence of heat treatment and scandium addition on the electrochemical polarization behavior of Al-Zn-Mg-Cu-Zr alloy. Metall. Mater. Trans. A 2007, 38, 2843–2852. [Google Scholar] [CrossRef]
  70. Kozlova, N.A.; Nokhrin, A.V.; Chuvil’deev, V.N.; Shadrina, Y.S.; Bobrov, A.A.; Chegurov, M.K. The effect of a Sc:Zr ratio on the corrosion resistance of cast Al-Mg alloys. Phys. Metals Metallogr. 2024, 125, 851–861. [Google Scholar] [CrossRef]
  71. Russian National Standard GOST 4784-2019; Aluminium and Wrought Aluminium Alloys. Grades. Interstandard: Moscow, Russia, 2019.
  72. Russian National Standard GOST 9.021-74; Unified System of Corrosion and Ageing Protection. Aluminium and Aluminium Alloys. Accelerated Test Methods for Intercrystalline Corrosion. Gosstandart: Minsk, Belarus, 1975.
  73. Russian National Standard GOST 9.908-85; Unified System of Corrosion and Ageing Protection. Metals and Alloys. Methods for Determination of Corrosion and Corrosion Resistance Indices. Gosstandart: Minsk, Belarus, 1987.
  74. Orlova, T.S.; Latynina, T.A.; Murashkin, M.Y.; Chabanais, F.; Rugutti, L.; Lefebvre, W. Effects of Mg on strengthening mechanisms in ultrafine-grained Al-Mg-Zr alloy. J. Alloys Compd. 2021, 859, 157775. [Google Scholar] [CrossRef]
  75. Shamtko, O.A.; Usov, Y.V. Structure and Properties of Metals and Alloys. Electrical and Magnetic Properties of Metals; Naukova Dumka: Kiev, Russia, 1987. (In Russian) [Google Scholar]
  76. Straumal, B.B.; Baretzky, B.; Kogtenkova, O.A.; Straumal, A.B.; Sidorenko, A.S. Wetting of grain boundaries in Al by the solid Al3Mg2 phase. J. Mater. Sci. 2010, 45, 2057–2061. [Google Scholar] [CrossRef]
  77. Kogtenkova, O.A.; Zieba, P.; Czeppe, T.; Litynska-Dobrzynska, L.; Straumal, B.B.; Nekrasov, A.N. Wetting of grain boundaries by the second solid phase in Al-based alloys. Bull. Russ. Acad. Sci. Phys. 2013, 77, 1386–1390. [Google Scholar] [CrossRef]
  78. Kogtenkova, O.; Straumal, B.; Korneva, A.; Czeppe, T.; Wierzbicka-Miernik, A.; Faryna, M.; Zięba, P. Grain boundary complexions and phase transformations in Al- and Cu-based alloy. Metals 2019, 9, 10. [Google Scholar] [CrossRef]
  79. Straumal, B.; Lepkova, T.; Korneva, A.; Gerstein, G.; Kogtenkova, O.; Gornakova, A. Grain boundary wetting by the second solid phase: 20 years of history. Metals 2023, 13, 929. [Google Scholar] [CrossRef]
  80. Straumal, B.B.; Mazilkin, A.A.; Baretzky, B. Grain boundary complexions and pseudopartial wetting. Curr. Opin. Solid State Mater. Sci. 2016, 20, 247–256. [Google Scholar] [CrossRef]
  81. Karkina, L.E.; Karkin, I.N.; Kuznetsov, A.R.; Razumov, I.K.; Korzhavyi, P.A.; Gornostyrev, Y.N. Solute-grain boundary interaction and segregation formation in Al: First principles calculations and molecular dynamics modeling. Comp. Mater. Sci. 2016, 112, 18–26. [Google Scholar] [CrossRef]
  82. Straumal, B.B.; Kulagin, R.; Klinger, L.; Rabkin, E.; Straumal, P.B.; Kogtenkova, O.A.; Baretzky, B. Structure refinement and fragmentation of precipitates under severe plastic deformation: A review. Materials 2022, 15, 601. [Google Scholar] [CrossRef]
  83. Nikulin, I.; Kipelova, A.; Malopheyev, S.; Kaibyshev, R. Effect of second phase particles on grain refinement during equal-channel angular pressing of an Al-Mg-Mn alloy. Acta Mater. 2012, 60, 487–497. [Google Scholar] [CrossRef]
  84. Fujikawa, S.I. Impurity diffusion of scandium in aluminium. Defect Diffus. Forum 1997, 143–147, 115–120. [Google Scholar] [CrossRef]
  85. Kerkove, M.A.; Wood, T.D.; Sanders, P.G.; Kampe, S.L.; Swenson, D. The diffusion coefficient of scandium in dilute aluminum-scandium alloys. Metall. Mater. Trans. A 2014, 45, 3800–3805. [Google Scholar] [CrossRef]
  86. Fuller, C.B.; Seidman, D.N. Temporal evolution of the nanostructure of Al(Sc,Zr) alloys: Part II-coarsening of Al3(Sc1−xZrx) precipitates. Acta Mater. 2005, 53, 5415–5428. [Google Scholar] [CrossRef]
  87. Asta, M.; Ozolins, V.; Woodward, C. A first-principles approach to modeling alloy phase equilibria. JOM 2001, 53, 16–19. [Google Scholar] [CrossRef]
  88. Vo, N.Q.; Dunand, D.C.; Seidman, D.N. Atom probe tomographic study of a friction-stir-processed Al-Mg-Sc alloy. Acta Mater. 2012, 60, 7078–7089. [Google Scholar] [CrossRef]
  89. Marquis, E.A.; Seidman, D.N.; Astra, M.; Woodward, C. Composition evolution of nanoscale Al3Sc precipitates in an Al-Mg-Sc alloy: Experiments and computations. Acta Mater. 2006, 54, 119–130. [Google Scholar] [CrossRef]
  90. Mikhaylovskaya, A.V.; Kishchik, M.S.; Kotov, A.D.; Tabachkova, N.Y. Grain refinement during isothermal multidirectional forging due to β-phase heterogenization in Al-Mg-based alloys. Mater. Lett. 2022, 321, 132412. [Google Scholar] [CrossRef]
  91. Mikhaylovskaya, A.V.; Mochugovskiy, A.G.; Levchenko, V.S.; Tabachkova, N.Y.; Mufalo, W.; Pornoy, V.K. Precipitation behavior of L12 Al3Zr phase in Al-Mg-Zr alloy. Mater. Charact. 2018, 139, 30–37. [Google Scholar] [CrossRef]
Figure 1. The scheme of cutting the ingot into samples.
Metals 15 00372 g001
Figure 2. General view (a) and drawing of the tensile test sample (b).
Metals 15 00372 g002
Figure 3. The E(t) curves of some cast alloys Al–Mg–Sc–Zr.
Metals 15 00372 g003
Figure 4. Macrostructure of the samples with 4% Mg (ac) and 6% Mg (df) with different Sc/Zr ratios: 0.45 (a,d), 1.0 (b,e), and 2.2 (c,f). OM. (ac) were reprinted with permission from ref. [51]. 2024 Elsevier.
Metals 15 00372 g004
Figure 5. Microstructure of the central sample parts with 2.5% Mg (ac), 4% Mg (df), and 6% Mg (gi) with different Sc/Zr ratios: 0.45 (a,d,g), 1.0 (b,e,h), and 2.2 (c,f,i) (SEM). Reprinted with permission from ref. [70]. 2024 Pleiades Publishing, Ltd.
Metals 15 00372 g005aMetals 15 00372 g005b
Figure 6. Dependence of the average grain size in the central ingot parts on the Sc/Zr ratio.
Metals 15 00372 g006
Figure 7. Microstructure of Al–6%Mg–Sc–Zr alloys: (a,b) primary Al3Zr particles in Al–6%Mg–0.10%Sc–0.22%Zr alloy, (c,d) primary Al3(Sc,Zr) particles in Al–6%Mg–0.16%Sc–0.16%Zr alloy, and (e,f) structure of Al–6%Mg–0.22%Sc–0.10%Zr alloy. OM (a,b) and SEM (cf). Reprinted with permission from ref. [51]. 2024 Elsevier.
Metals 15 00372 g007
Figure 8. XRD patterns of cast (a) and UFG alloy Al–6%Mg–0.22%Sc–0.10%Zr (b) in the unannealed state.
Metals 15 00372 g008
Figure 9. Microstructure of the UFG Al–6%Mg–0.10%Sc–0.22%Zr (a,d) and Al–6%Mg–0.22%Sc–0.10Zr alloy (bf). The particles of Al3(Sc,Zr) in (e) are marked with a dotted line (TEM). (e) was reprinted with permission from ref. [51]. 2024 Elsevier.
Metals 15 00372 g009aMetals 15 00372 g009b
Figure 10. Precipitation of Al3(Sc,Zr) particles in cast alloys Al–6%Mg–0.22%Sc–0.10%Zr (a,b) and Al–6%Mg–0.10%Sc–0.22%Zr (c,d) after annealing at 500 °C for 30 min. In (eg), the results of the EDS analysis of the Al3Sc particles (e) and Al3Sc-Al3Zr (f,g) are presented (TEM).
Metals 15 00372 g010
Figure 11. Al3(Sc,Zr) particles formed during annealing of the UFG Al–6%Mg–0.22%Sc–0.10%Zr (a) and Al-6%Mg-0.10%Sc-0.22%Zr (b) alloys after annealing at 500 °C for 30 min (TEM).
Metals 15 00372 g011
Figure 12. Microstructure of alloys with 2.5% (a,b), 4% (c,d), 6% Mg (e,f), and with Sc/Zr = 2.2 (a,c,e), Sc/Zr = 0.45 (b,d,f) after annealing at 500 °C for 30 min and (g) grain size dependence on annealing temperature. SEM (ad) and TEM (e,f).
Metals 15 00372 g012aMetals 15 00372 g012b
Figure 13. Microstructure of the Al–4%Mg–Sc–Zr alloys after annealing at 500 °C for 30 min: (a) alloy with 0.22% Sc and 0.10% Zr, (b) alloy with 0.10% Sc and 0.22% Zr. The largest etch pits from the β-phase particles are marked with dotted lines (SEM).
Metals 15 00372 g013
Figure 14. Microhardness of unannealed cast (blue lines) and UFG (orange lines) alloys.
Metals 15 00372 g014
Figure 15. Dependencies of the change in SER and HV on the annealing temperature of the cast alloys Al–2.5%Mg–Sc–Zr (a) and Al–6%Mg–Sc–Zr (b) Reprinted with permission from ref. [70]. 2024 Pleiades Publishing, Ltd.
Metals 15 00372 g015
Figure 16. Dependencies of the change in SER and HV on the annealing temperature of the UFG alloys Al–2.5%Mg–Sc–Zr (a) and Al–6%Mg–Sc–Zr (b).
Metals 15 00372 g016
Figure 17. Dependences of the UTS on the annealing temperature of cast (a) and UFG (b) alloys.
Metals 15 00372 g017
Figure 18. UTS—HV diagram for cast and UFG alloys.
Metals 15 00372 g018
Figure 19. IGC defects in cast (a,c) and UFG (b,d) alloys with 2.5% Mg (a,b) and 6% Mg (c,d) (OM).
Metals 15 00372 g019
Figure 20. Tafel curves for Al–2.5%Mg–Sc–Zr (a) and Al–6%Mg–Sc–Zr (b) cast and UFG unannealed alloys.
Metals 15 00372 g020
Figure 21. Effect of Sc/Zr ratio on corrosion current density icorr (a) and corrosion potential -Ecorr (b) of initial unannealed cast and UFG Al–Mg–Sc–Zr alloys.
Metals 15 00372 g021
Figure 22. The nature of corrosion destruction of the surfaces of the cast Al–2.5%Mg–0.12%Sc–0.20%Zr alloy samples after electrochemical testing: (a) Type I defects and (b) Type II defects (OM).
Metals 15 00372 g022
Figure 23. Dependence of the average depth of the IGC defects (a) and the maximum depth of the IGC defect (b) on the 30 min annealing temperature for cast and UFG alloys. The cast alloys are indicated by black dotted lines and filled markers; the UFG alloys—by solid red lines and white markers.
Metals 15 00372 g023
Figure 24. Dependencies of the icorr (a,c,e) and Ecorr (bd) on annealing temperature for Al–Mg cast alloys with different Sc/Zr ratios and Mg concentration in the alloys: 2.5% Mg (a,b), 4%Mg (c,d), and 6%Mg (e,f). The icorr(T) dependences for cast Al–2.5%Mg–Sc–Zr alloys. Reprinted with permission from ref. [70]. 2024 Pleiades Publishing, Ltd.
Metals 15 00372 g024aMetals 15 00372 g024b
Figure 25. Changes in Type II IGC defects during annealing of the Al–2.5%Mg–0.16%Sc–0.16%Zr (ad) and Al–2.5%Mg–0.22%Sc–0.10%Zr (eh) cast alloy samples. Annealing at 350 (a,e), 400 (b,f), 450 (c,g), and 500 °C (d,h) (OM).
Metals 15 00372 g025
Figure 26. Changes in Type I IGC defects during annealing of the Al–2.5%Mg–0.16%Sc–0.16%Zr cast alloy samples. Annealing at 350 (a) and 500 °C (b) (OM).
Metals 15 00372 g026
Figure 27. Effect of the Sc concentration on the maximum depth of the IGC defects in Al–6%Mg–0.56%Mn alloy. Electrochemical tests in 3% aqueous NaCl solution. Annealing regimes: #1—initial unannealed condition; #2—initial condition + annealing at 160 °C for 24 h; #3—initial condition + annealing at 180 °C for 50 h; #4—stabilizing annealing; #5—stabilizing annealing + annealing at 160 °C for 24 h; #6—stabilizing annealing + annealing at 180 °C for 50 h. Reprinted from Ref. [64].
Metals 15 00372 g027
Table 1. Compositions of aluminum alloys.
SeriesAlloy #AEs Concentration, % wt.
MgScZrSc + ZrSc/Zr
EstimatedActual
11-2.52.50.10−0.0130.22−0.0250.32−0.0380.450.45
1-4.04.0
1-6.06.0
22-2.52.50.12−0.0150.20−0.0220.32−0.0370.600.59
2-4.04.0
2-6.06.0
33-2.52.50.14−0.0180.18−0.020.32−0.0380.780.76
3-4.04.0
3-6.06.0
44-2.52.50.16−0.020.16−0.0210.32−0.0411.001.01
4-4.04.0
4-6.06.0
55-2.52.50.18−0.020.14−0.0110.32−0.0311.291.24
5-4.04.0
5-6.06.0
66-2.52.50.20−0.0110.12−0.0120.32−0.0231.671.75
6-4.04.0
6-6.06.0
77-2.52.50.22−0.0150.10−0.0040.32−0.0192.202.14
7-4.04.0
7-6.06.0
Note: The exponent indicates the deviation in the experimentally measured concentration of AEs from calculated values.
Table 2. Results of SER measurements in different sections of Al–6%Mg–Sc–Zr alloy ingots.
SER, μΩ·cm
Sample Zone
(see Figure 1)
Al-6%Mg-0.22%Sc-0.10%ZrAl-6%Mg-0.16%Sc-0.16%ZrAl-6%Mg-0.10%Sc-0.22%Zr
CenterEdgeCenterEdgeCenterEdge
#1
(bottom of the ingot)
6.34 ± 0.026.49 ± 0.146.34 ± 0.026.44 ± 0.046.31 ± 0.026.42 ± 0.05
#5
(center of the ingot)
6.23 ± 0.046.47 ± 0.076.46 ± 0.116.56 ± 0.076.19 ± 0.076.38 ± 0.04
#9
(top of the ingot)
6.22 ± 0.036.40 ± 0.056.31 ± 0.106.47 ± 0.066.20 ± 0.086.34 ± 0.05
#10
(remainder)
6.15 ± 0.046.33 ± 0.056.23 ± 0.096.49 ± 0.066.17 ± 0.076.38 ± 0.05
Table 3. Results of SER investigations of Al-Mg-Sc-Zr alloys.
Al–2.5%Mg–Sc–Zr Alloys
Alloy #1-2.52-2.53-2.54-2.55-2.56-2.57-2.5
ρ0, μΩ·cmCast4.50 ± 0.044.59 ± 0.034.37 ± 0.034.62 ± 0.034.55 ± 0.024.54 ± 0.034.50 ± 0.03
UFG4.54 ± 0.044.58 ± 0.044.55 ± 0.034.52 ± 0.034.56 ± 0.034.55± 0.044.49 ± 0.04
ρmax, μΩ·cmCast0.300.330.350.380.340.390.38
UFG0.420.440.460.440.350.400.36
ρth, μΩ·cm4.594.604.604.614.614.624.62
Al–4%Mg–Sc–Zr alloys
Alloy #1-4.02-4.03-4.04-4.05-4.06-4.07-4.0
ρ0, μΩ·cmCast5.25 ± 0.045.37 ± 0.045.34 ± 0.055.36 ± 0.055.37 ± 0.055.34 ± 0.045.39 ± 0.06
UFG5.41 ± 0.035.43 ± 0.045.43 ± 0.045.43 ± 0.035.49 ± 0.045.48 ± 0.055.52 ± 0.05
ρmax, μΩ·cmCast0.250.350.330.320.440.350.40
UFG0.370.370.350.330.260.260.24
ρth, μΩ·cm5.305.315.315.325.325.335.33
Al–6%Mg–Sc–Zr alloy
Alloy #1-6.02-6.03-6.04-6.05-6.06-6.07-6.0
ρ0, μΩ·cmCast6.27 ± 0.046.30 ± 0.046.30 ± 0.056.32 ± 0.056.33 ± 0.066.34 ± 0.046.35 ± 0.05
UFG6.31 ± 0.036.28 ± 0.036.38 ± 0.046.51 ± 0.046.40 ± 0.046.39 ± 0.046.38 ± 0.04
ρmax, μΩ·cmCast0.100.160.160.170.170.170.22
UFG0.110.150.210.300.220.180.22
ρth, μΩ·cm6.496.496.506.506.516.516.52
Disclaimer/Publisher’s Note: The statements, opinions and data contained in all publications are solely those of the individual author(s) and contributor(s) and not of MDPI and/or the editor(s). MDPI and/or the editor(s) disclaim responsibility for any injury to people or property resulting from any ideas, methods, instructions or products referred to in the content.

