Article

Tribological Investigation of Plasma-Based Coatings for Use in Quasi-Monolithic Engine Cylinder Bores

High Performance Powertrain Materials Laboratory, The University of British Columbia, 1540 Innovation Drive, Kelowna, BC V1V 1V7, Canada
*
Author to whom correspondence should be addressed.
Metals 2025, 15(4), 370; https://doi.org/10.3390/met15040370
Submission received: 1 March 2025 / Revised: 22 March 2025 / Accepted: 23 March 2025 / Published: 27 March 2025

Abstract

This study evaluates the tribological characteristics of quasi-monolithic engine cylinder coatings and piston rings using a custom-built linear reciprocating tribometer. The coatings were deposited on an Al-Si alloy cylinder bore using the Plasma Transfer Wire Arc (PTWA) and Electrolytic Jet Plasma Oxidation (EJPO) processes. The coatings’ tribological performances were investigated in the boundary lubrication regime. The performance of conventional chrome-coated cast iron piston rings was tested and compared to that of EJPO- and PTWA-coated engine cylinder samples that were extracted from a cast Al-Si engine block. Scanning electron microscopy and profilometry were used to compare the evolution of wear and the prevalent wear mechanism. This paper also presents the verification and repeatability analysis of a custom-built tribometer against a standard industry-calibrated tribometer. The wear test results showed that the EJPO coating had 0.05% to 10.35% lower wear rates than its PTWA counterpart throughout a wide range of loading conditions and sliding distances. The variation in the counter-face behavior is likely due to the different surface topographic parameters such as skewness, kurtosis, and porosity.

1. Introduction

In the current era of accelerated urbanization, maintaining appropriate/high air quality is a significant challenge that confronts society. One of the major contributors to poor air quality is the emission of greenhouse gases (GHGs), which are produced from sectors such as manufacturing, transportation, and agriculture. In 2021, the GHGs produced from the transportation sector alone accounted for about 25% of global GHGs [1]. A report published by The International Environment Agency’s (IEA) indicates that global fuel economy initiatives have the potential to reduce net emissions by 1 Gt-CO2 equivalent per year, which is 3% of the total global annual GHG emissions [2]. The primary method that demonstrates a significant potential for increasing the fuel efficiency of vehicles is to increase the specific thermal load management of the engine. This can be achieved through application of lighter and more conductive materials, as well as reduce the frictional losses during engine operation. For the latter, the primary contributor for frictional losses lies in the interaction of the piston, piston ring, and cylinder liner. It has been reported that approximately 50–68% of the engine’s frictional losses are caused by this piston–cylinder assembly [3]. These frictional losses have a dramatic effect on the engine’s overall efficiency.
The enhancement of fuel efficiency through vehicle weight reduction witnessed initial efforts in the 1970s when grey cast iron engine blocks were substituted with lightweight Al-Si engine blocks. However, the use of aluminum is impeded by various limitations, such as insufficient wear resistance and hardness, inadequate Young’s modulus, and substandard tensile strength [4]. To counter the poor wear properties of aluminum alloys, cast iron liners are commonly press-fit or cast-in as the cylinder bore surface. Although the wear resistance is improved, these liners lead to an overall increase in the weight of the engine. Potentially more problematic than the increased mass, is the effects that the differential in thermal expansion coefficient between the Fe-based liner and Al-based cylinder block materials, which often leads to unwanted residual stress, distortion, and expensive postprocessing heat treatments and machining [5].
The development of hyper-eutectic Al-Si alloys (e.g., AlSi17Cu4Mg), fortified with uniformly distributed hard Si crystals on the surface of the cylinder bore, contributed to solving the issues related to the weight and wear resistance of cylinder liners. The softer aluminum matrix surrounding the Si crystals gets eroded during the honing process and engine run-in phase, exposing the Si crystals on the surface of the cylinder bore. This creates crevices between the Si particles, which retains engine oil for lubrication of the sliding piston and piston ring on the cylinder bore surface [6]. The disadvantage of using hyper-eutectic Al-Si liners is the high cost of the manufacturing process due to complexities in the inhomogeneous distribution of primary Si particles and poor machinability [7].
In the last two decades, thermal spray coatings have emerged as a cost-efficient and reliable method of improving engine efficiency and tribological properties [8,9]. One industry-accepted thermal spray coating process, Plasma Transferred Wire Arc (PTWA), has gained traction in the production of quasi-monolithic engines due to its faster coating deposition rates [9] This method employs low-carbon steel wire as its feedstock to deposit a thick (about 200 µm) coating using a supersonic plasma jet that melts and propels the atomized feedstock onto the Al-Si substrate [10]. As a result of the high-velocity material deposition process, some of the molten particles oxidize and solidify before hitting the substrate. This leads to the formation of interfacial oxide regions with low fracture toughness that could be susceptible to delamination under frictional contact [11]. However, a 300 h endurance test was conducted with PTWA-coated engines in a laboratory at Ford Motor Company, which provided clear evidence that oil and fuel consumption decreased because of the diminished friction. Specifically, the fuel consumption was reduced by 6.8% in comparison to engine bores with traditional cast iron liners [12]. This PTWA technology can potentially be utilized in the restoration of older cast iron or aluminum engine blocks and in the refurbishment of worn engines that would otherwise have been discarded [13].
Recently, a new coating process that is a viable option for protecting and enhancing the surface of aluminum cylinders is Electrolytic Jet Plasma Oxidation (EJPO) [14]. It has emerged as an environmentally safe option that utilizes chemically benign, electrolytic baths that are typically low concentration, and the generated waste can directly be drained post-pH adjustment. It is an electrochemical technique to generate an oxide coating on a lightweight metal substrate. The EJPO coating exhibits bi-directional growth, expanding both towards the interior and exterior of the underlying substrate, resulting in stronger bonding strength [14]. The outer layer of the coating is porous due to escaping gases, which results in lower hardness at the surface. The coating process is done at room temperature, so the thermal stresses are low. The microcracks and porosity networks in its microstructure relieve residual stresses as oxygen gas is liberated. Although the EJPO coating process has benefits, compared to other plasma-based coatings, the wear performance of the EJPO coating, for cylinder liner application under realistic engine load and lubrication scenarios, remains unexplored. Thus, to enable the use of this advanced coating, it is imperative to evaluate its wear performance using conditions that replicate piston–cylinder interactions during engine operation.
During the power stroke of a spark-ignition engine, air–fuel combustion generates a rapid increase in gas pressure, which causes the piston to apply a radial force on the cylinder liner in the Top Compression Ring (TCR) reversal zone near the Top Dead Center (TDC). The elevated radial force leads to frictional contact between the piston ring and the cylinder liner. The severity of this phenomenon is worse during cold start conditions due to the delay in the arrival of the more viscous lubricating oil [15,16]. In situ studies demonstrate that wear on the engine liner surface is greatest around the TDC during the power stroke where the lubrication oil thickness is minimum [17]. Experimental findings indicate that frictional energy dissipation during cold start is 72% greater than during warmed up start across six engine cycles [15]. In a warmed up engine, the overall energy loss per engine cycle due to friction is 16 J, whereas, during a cold start, the energy loss value ranges from 74 to 96 J [18]. The wear caused by the increased frictional contact of the piston ring and cylinder liner has a direct influence on the energy loss due to the increase in blow-by gases [19]. In summary, the worst-case tribological interaction of a cylinder liner occurs when the engine is starved of fresh lubrication and maximum radial pressure exerted by the piston near TDC. Therefore, it is imperative for automakers who are developing advanced cylinder liner coatings to analyze their tribological behavior in test conditions that simulate the worst-case scenario. It should be noted that simulating real-world tribological conditions in a controlled environment is considerably difficult, as there are many variables (e.g., temperature, humidity, load variations, and material inhomogeneity).
The present research examines the evolution of surface topographic features such as roughness, skewness, kurtosis, and porosity of the EJPO and PTWA coatings throughout wear test experiments. The sliding counter-face wear characteristics of the coated samples against a CrN-coated piston ring were investigated using simplified component wear tests utilizing test parameters that simulate the pressure and lubrication conditions near the TDC position during the power stroke in cold start conditions. The analysis excludes the influence of combustion byproducts or thermal oil degradation on the lubricant and the effect of piston ring radial pressure distribution. This research utilized a custom-designed reciprocating tribometer to investigate the tribological properties of the two coatings in boundary-lubricated conditions. For real-world applications, the tribological evaluation of actual engine cylinder specimens in simplified component bench tests serves as a link between expensive full-scale durability tests and frequently inaccurate simulations to determine component durability. The tribological data obtained from these tests will serve as a benchmark for refining the coating process parameters, thereby enhancing the wear resistance of coatings, and potentially facilitating the application of EJPO coatings in next-generation engines.

2. Materials and Methods

2.1. Calibration Tests

For the validation tests, Al 6061 with a known hardness value of 90–100 HV and a yield strength of 240 MPa was used as the flat sample specimen. The 100Cr6 bearing steel spherical ball, with a hardness of 650 HV and a higher yield strength of 835 MPa, was selected for the custom device validation. The operating parameters for the validation tests are shown in Table 1. It should be noted that the ASTM G133-22 standard [20] for linear oscillating tests mentions that ambient conditions like relative humidity and ambient temperature affect the accuracy of the wear and friction devices up to a limit of ±3%. In the present study, the tests were conducted in a controlled ambient environment in a research laboratory, where both apparatuses were operated under the same conditions.
The commercial tribometer is equipped with weighed disks provided by the manufacturer, with a maximum load capacity of 20 N. Table 2 describes the profilometer measurement settings. The calibration of the Bruker Dektat XT profilometer platform (Billerica, Middlesex, MA, USA) was performed using a reference glass sheet with a precisely machined specific roughness profile. The calibration is necessary for the vertical scale of the profilometer to ensure accurate measurements of surface height or depth variations.

2.1.1. Sample Preparation

To prepare the samples for the validation tests, 40 mm long, 22 mm wide, and 8 mm thick specimen were cut using a water jet. To ensure consistency in surface roughness parameters across all samples, a manual polisher was utilized. The rotational velocity and polishing time were kept identical. The first step involved using coarse grit grinding paper, starting from abrasive sizes 120 to FEPA 1200 grit SiC paper. The next step involved rough polishing using 9 to 6 μm diamond, followed by fine polishing using a 3 μm diamond polishing pad. It is worth noting that the surface of the sample was inspected at each step using an optical microscope to ensure a consistent pattern of abrasive machining. The objective of this sequence of steps was to achieve uniformity in surface characteristics. The average surface roughness of the 24 samples for these tests was observed using the Bruker Dektat 2-D profilometer, at 30.26 nm.

2.1.2. Procedure for the Validation Tests

The general steps for the validation tests are as follows:
(i).
The polished flat specimen and the test ball were held using solvent-proof gloves. Both were cleaned in IP alcohol for 5 min to get rid of oil and dirt. They were taken out from the solvent and allowed to dry. It is recommended to clean the sample surface not more than 10 min before the test.
(ii).
The weight of the sample on the digital scale with a resolution of 0.0001 g and diameter of the ball using a micrometer with a resolution of 0.001 mm were recorded, and the sample is mounted on the device.
(iii).
The ball holder is disassembled and cleaned using pressurized air. The test ball is placed in the ball holder with tweezers and then tightened.
(iv).
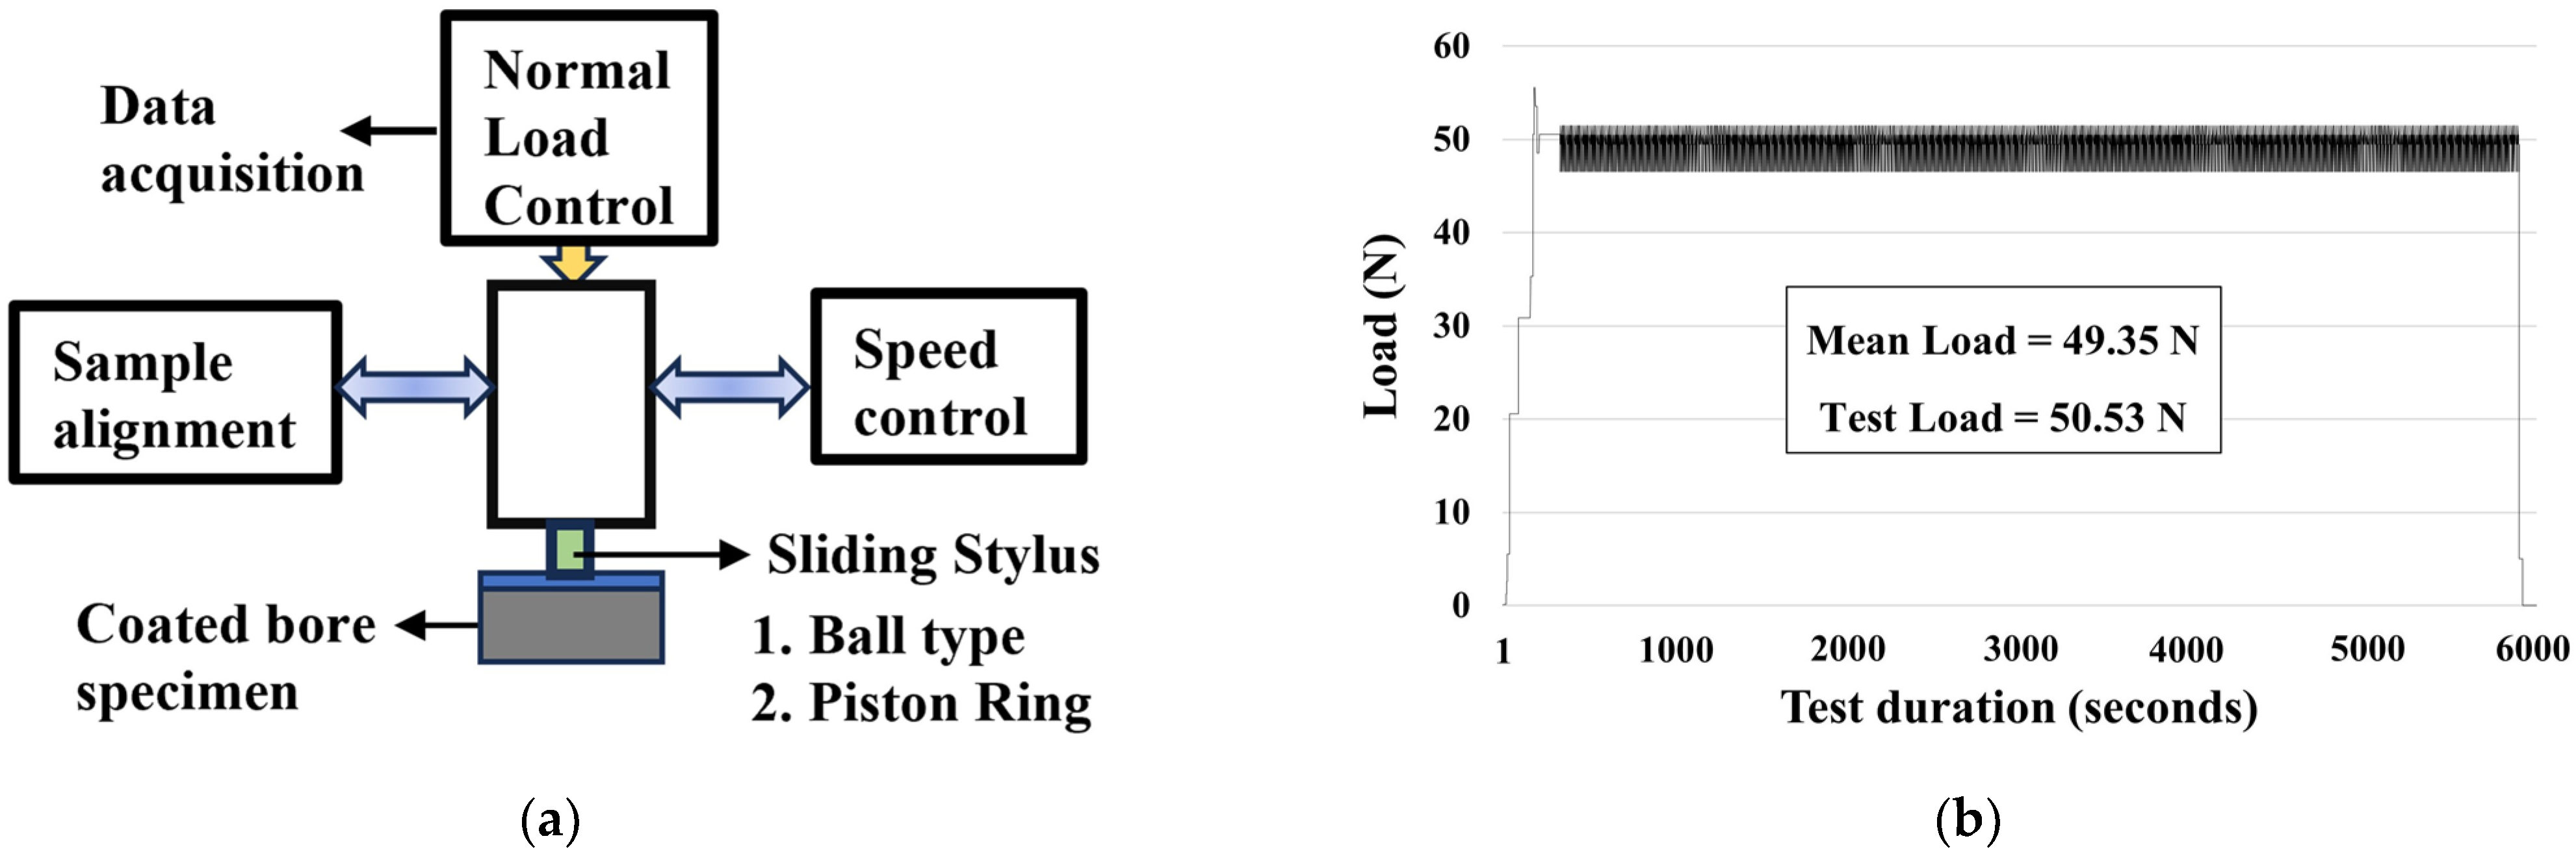
The normal load is applied on the system by placing weighted disks on the AP ball holder, and in the case of the HPPM tribometer, the load was applied by tightening the top bolt, and the lock nut was tightened. It is recommended to allow the load cell reading to stabilize for 2–5 min and then start the test.
(v).
Upon completion of the test, pressurized air is used to clean the sample surface and carefully unmounted and the weight of the flat specimen was noted, and diameter of the ball was recorded.
(vi).
The specimen is cleaned using IP alcohol for 1 min and allowed to dry and then labelled with the test number and operating condition details. The sample was wrapped in soft tissue and then placed in a plastic cover to avoid contamination.

2.1.3. Tribometer Setup and Validation

Tribometers are devices that are used to evaluate tribological characteristics of material pairs (also referred to as tribo-pairs) such as friction or resistance to wear in controlled operating conditions. A reciprocating tribometer was designed to precisely control two critical operational parameters, namely, the normal load and the sliding velocity (see Figure 1a). The custom-designed apparatus (HPPM tribometer) was fabricated for oscillating wear tests with piston ring segments and coated engine cylinder samples. Two separate detachable sliding styluses are designed to mount a piston ring segment and a 100Cr6 steel ball as the sliding counter-face material. A DC motor-driven cam-follower linkage propels the sliding component on the specimen surface. The average normal force acting on the ring holder is controlled using a force transducer with a load fluctuation deviation between ±2% of the test load (see Figure 1b) per ASTM G181 standard [21].
The repeatability and precision of the wear results produced by the custom HPPM tribometer were compared with that of a standard industry-certified Anton Paar (AP) sliding ball contact type tribometer. The variation of wear volume results within the tribometers was used to compare the devices. The wear profile readings were taken at the center of the wear track, perpendicular to the stroke length on each sample at the end of the test at different load values (Figure 2). The loads were selected based on contact pressures relevant to the piston ring-cylinder liner (PRCL) interaction in a passenger vehicle where combustion gas pressures range from 2.5 to 10 MPa [22]. The volume of material lost during the wear test is calculated by the gravimetric method which, is determined by the weight differential of homogenous specimen material. Compliance with a certified device can be claimed when using tribo-pairs with identical surface profiles and material properties under standardized operating conditions [20]. Origin Pro was used to assess machine-to-machine variability using the analysis of variance approach.
An intriguing observation arises from the mean wear width values at lower loads, as presented in Table 3. The tribometers exhibit a disparity in the mean width of wear, with values of 0.69 mm and 0.41 mm. Although, the difference has little effect on the wear volume as wear width is measured on the surface. It can be linked to the two devices’ differing normal load application mechanisms. The HPPM tribometer is designed for loading conditions ranging from 0 N to 490 N. It limits load fluctuations with a lock nut and rigid load transmission mechanism that eliminates reactionary lift when the sliding counter face encounters a smoother asperity. In contrast, the AP device to tends to slide over smoother asperities at lower loads such as 3 N. The HPPM tribometer tends to go through the asperities at lower and higher loads, which is why the wear width is greater at lower loads, but the wear depth remains unaffected (discussed in next sub-section).
Repeatability of the wear results is evaluated using the coefficient of variation (COV). It is a dimensionless statistical measure that indicates the relative dispersion or variability of a data set. The formula used to calculate % COV is:
%   COV = SD Mean × 100
As the test load increases from 3 N to 20 N, the coefficient of variation values of the wear width data decreases for the AP device (see Table 3). As shown in Figure 3, the %COV of the wear width results for the HPPM device is lower at 10 N and 20 N loads. This decrease is in line with the AP device, as the maximum COV for the AP device is 8.76% for the 3 N test and 7.48% for the 5 N test.
Another parameter to represent the repeatability of results is Confidence Interval. It indicates the degree of certainty in the measurements and establishes the precision of the resultant wear data for each load group in their respective tribometers. It means that if tests are repeated, there is a probability of 0.95 that the mean of the results lie within upper and lower bound of the Confidence Interval. The formula used to calculate 95% Confidence Interval is:
CI   = Mean × ±   1.96 × SD n
The narrow range of the 95% confidence interval of the HPPM tribometer quantifies the within-instrument data, as depicted in the figure below. The 95% confidence interval values for test loads of 3 N, 5 N, 10 N, and 20 N were ±0.07, ±0.18, ±0.16, and ±0.09, respectively, for the HPPM tribometer, compared to ±0.13, ±0.22, ±0.24, and ±0.09, respectively, for the AP tribometer. These wear width values of the custom-made tribometer demonstrate a remarkable congruence based on the three conducted tests when compared to the AP confidence interval values. Both the indicators show that at higher loads, both AP and HPPM tribometer show accurate and precise wear width values.
A similar study was done using two commercial tribometers with a scotch yoke drive mechanism comparable to the AP device used in this investigation. The wear volume findings published in that interlaboratory study indicated a maximum standard deviation of 0.078 mm3 with a mean value of 0.543 mm3 and an average 95% confidence interval value of 0.22 [20]. The wear volume data between two readings from the same device showed more repeatability in comparison to the volume loss readings between the two devices. The reproducibility of the results between the two devices is dependent on the test environment and precision limits of the testing apparatus. Hence, it is important to determine the precision limits of an apparatus under standard test conditions, which allows other tribologists to run the test with the same operating conditions listed in Table 1 on different devices, thereby creating a useful wear volume loss database for a wide variety of material-pairs and establishing a more reliable reproducibility limit.

2.2. Engine Cylinder Coating Sample Material

The material combinations used for the test were a chromium nitride-coated cast iron (CI) piston ring running against a coated cylinder bore specimen. The steel coating was deposited on the engine cylinder bore surface by the PTWA process on a cast engine block, and the porous oxide coating was developed using the EJPO process. Both the engine blocks were supplied by the industry partners. The coating surface produced by the PTWA process was finished with a crosshatch honing procedure, and the coating surface produced by the EJPO process was unidirectionally polished, as shown in Figure 4. The honing grooves observed on the PTWA-coated cylinder bore surface have a cross-hatch pattern with grooves inclined at 30° to each other. Honing groove angles between 30 and 60° is a prevalent practice in manufacturing engine cylinder surfaces to minimize friction by creating oil flow channels [23]. The EJPO-coated surface exhibited fine uniaxial polish at 20° to the cylinder bore longitudinal axis. The angular alignment of the asperities in the sliding direction is a crucial factor in determining the wear properties of the cylinder bore surface.
The typical dimensions of the coated cylinder sample used for the tribological tests were 40 mm × 22 mm × 8 mm, as shown in Figure 5b. ASTM G181-21 [21] states that the contact area between sliding tribo-pairs must be consistent throughout the oscillation stroke. Conformal contact between the tribo-pairs was ensured with a piston ring cut in segments of 10 mm that matched the radius of curvature of the cut cylinder samples, as shown in Figure 5a. This configuration produced a uniform wear track area for the tests, which met the criterion for comparison of wear rate between coated cylinder specimens. The shape and dimensions of the liner sample were developed for a line contact between the ring and the liner coating that is 10 mm in width. After extracting each cylinder liner sample, they were cleaned with acetone in a bath for fifteen minutes and dried with pressurized air.

2.3. Lubrication Concept

The test method is based on ASTM G181-21 [21] standards, but adapted to simulate starved boundary lubrication conditions during a cold start when fresh oil is yet to arrive in the engine cylinder. The sample preparation emulates the worst-case lubrication scenario at TDC. As combustion pressure peaks, the surface of the bore is starved of lubricating oil, and the engine is yet to reach operating temperatures. Standard SAE 0W30 synthetic engine oil for gasoline engines was utilized as the lubricant in all of the wear tests. The manufacturer rating of oil density at 20 °C is 841 kg/m3. Scuffing wear may also manifest at the bottom dead center (BDC), albeit to a comparatively lesser degree, or in the mid-stroke area, in the presence of abrasive particles. The primary factors contributing to wear in the mid-stroke region are the oscillatory movement of the rings and the existence of abrasive particles. Nevertheless, the present study does not prioritize the investigation of the wear characteristics exhibited by said zones.
To simulate the boundary lubrication regime during a cold start, the samples were first suspended in an acetone bath for 10 min to remove foreign particles and oil content. Then, 1 mL of engine oil was added to the surface of the coated cylinder bore samples and left for 30 min. Subsequently, the oil was drained from the surface of the sample under the influence of gravity for 30 min. This procedure was designed to simulate the start–stop system mode of the engine or the process of restarting the engine following a period of inactivity. The coating’s surface profiles served as oil reservoirs. Additionally, the honing or polishing patterns help to retain oil and sustain a layer of lubrication on the coatings, even when the engine is inactive. It is essential to prevent the oil from draining due to gravity, which could lead to metal-to-metal contact between the tribo-pair during engine startup.
The thickness of the oil film was measured using the OLS51000 3D Laser Microscope (Tokyo, Japan), as shown in Figure 6. Table 3 shows readings of film thickness measurement on the coated samples based on the lubrication concept. Ting et al. [4] reported that the lower limit of the film thickness below which boundary lubrication contact occurs between a piston ring and cylinder liner is 50 × 10−6 in (1.27 μm). As the values reported in Table 4 for both the coatings fall below the critical lower limit value of 1.27 μm, it is assumed that contact of ring-bore occurs, and wear takes place.
The Hutchings equation [24] (see Equation (3)) was used to calculate the minimum oil film thickness between the surfaces of the piston ring segment and the coated cylinder bore samples at different load values at the start of the wear test.
h min = 1.79   R 0.47 α 0.49 η 0 0.68 ( E * ) 0.12 V 0.68 p 0.07
where R is the radius of the ring (m), V is the sliding speed (m/s), p is the applied normal load (N), η 0 represents viscosity properties of the lubricating oil (Pa s), E* is the combined elastic modulus of sliding surfaces, and α represents the viscosity pressure coefficient (Pa s) [24]. Figure 7 helps infer that increasing the load decreases minimum film thickness at a constant relative velocity. As load is applied on two surfaces under lubricated conditions, the minimum lubricating film thickness resembles the minimum amount of lubrication oil that will always be present between the sliding surfaces. The calculations confirmed that the oil film thickness on the test sample’s surface at the start of the test is greater than the minimum amount of film thickness when the load is applied.

2.4. Wear Test Configuration

Fresh cylinder specimens, piston ring segments, and engine oil were used for each wear test. After the lubricated sample was mounted on the sample holder, the contact point of the piston ring was set at the center of the cylinder specimen. There was no applied force during this step, so the piston ring and cylinder sample did not touch. The only lubrication provided during the test is by the oil trapped in the valleys and micropores within the surface of the coatings. During the fitment of samples on the tribometer, a light 2 N load was applied to check for conformal contact between the liner’s surface and the piston ring segment. The alignment of the tribo-pair curvature is monitored using the light gap method. The line contact between the piston ring segment and the coated cylinder bore section was checked using a blue dye. Thereafter, the test load was applied and allowed to stabilize before initiating the reciprocating tests. The operating parameters are mentioned in Table 4. All factors, such as load, temperature, and relative humidity, were constant for the test duration.
It is not straightforward to compare the reproducibility of wear volume results for the piston ring-cylinder bore tribo-pair due to its dependence on environmental conditions and operating parameters. The use of wear rate data enables comparison between interlaboratory results unaffected by the contact variations and test duration. For wear rate calculation, the average of three readings of the surface profiles was used to determine the planimetric cross-sectional wear area, as shown in Figure 8. The ASTM G99-17 [25] standard defines the formula of specific wear rate (mm3/N-m) as:
W s p = V / LD
where V represents the total wear volume (mm3), L represents the normal load (N), and D represents the total sliding distance (m). A Bruker Dektat stylus profilometer was used to generate a 2D-profilogram (see Figure 8). The generated 2D profile was then used to calculate the planimetric wear volumes of the worn engine cylinder samples. Wear volume is the product of the wear width and the average planimetric cross-sectional area of the wear track shown in the schematic below. The surface profile measurements were taken at the center of the wear width and along the stroke length. The Origin Pro graphing analysis software (Origin Pro 2023, https://www.originlab.com/2023, accessed 1 June 2023) calculated the planimetric wear area enclosed within the stroke length and datum line. The stroke length is bounded by vertical bars on the left and right borders. A datum line represents the mean surface roughness line. The surface area that has undergone wear in the planimetric wear plane is denoted by the grey region in Figure 8.
The net radial force experienced by the PRCL system originates from the pressure of the gases in the cylinder acting on the surface area of the piston. The primary contributors to this radial load experienced by the cylinder liner can be attributed to two main sources: (i) the radial force transmitted from the connecting rod to the piston as a function of combustion pressure, piston axial velocity, and displacement, and (ii) the elastic tension of the piston rings [26]. The test loads were selected based on the contact area of the piston ring segment, as mentioned in Table 5. A spectrum of contact pressures can be observed in the contact scenario between the PRCL tribo-pair. Determining contact pressure values is contingent upon the combustion pressure and engine design specifications [17]. The normal loads used to evaluate the coated engine cylinder samples were derived from the nominal contact pressure values that correlate with the combustion pressure observed in passenger gasoline vehicles.

3. Results and Discussion

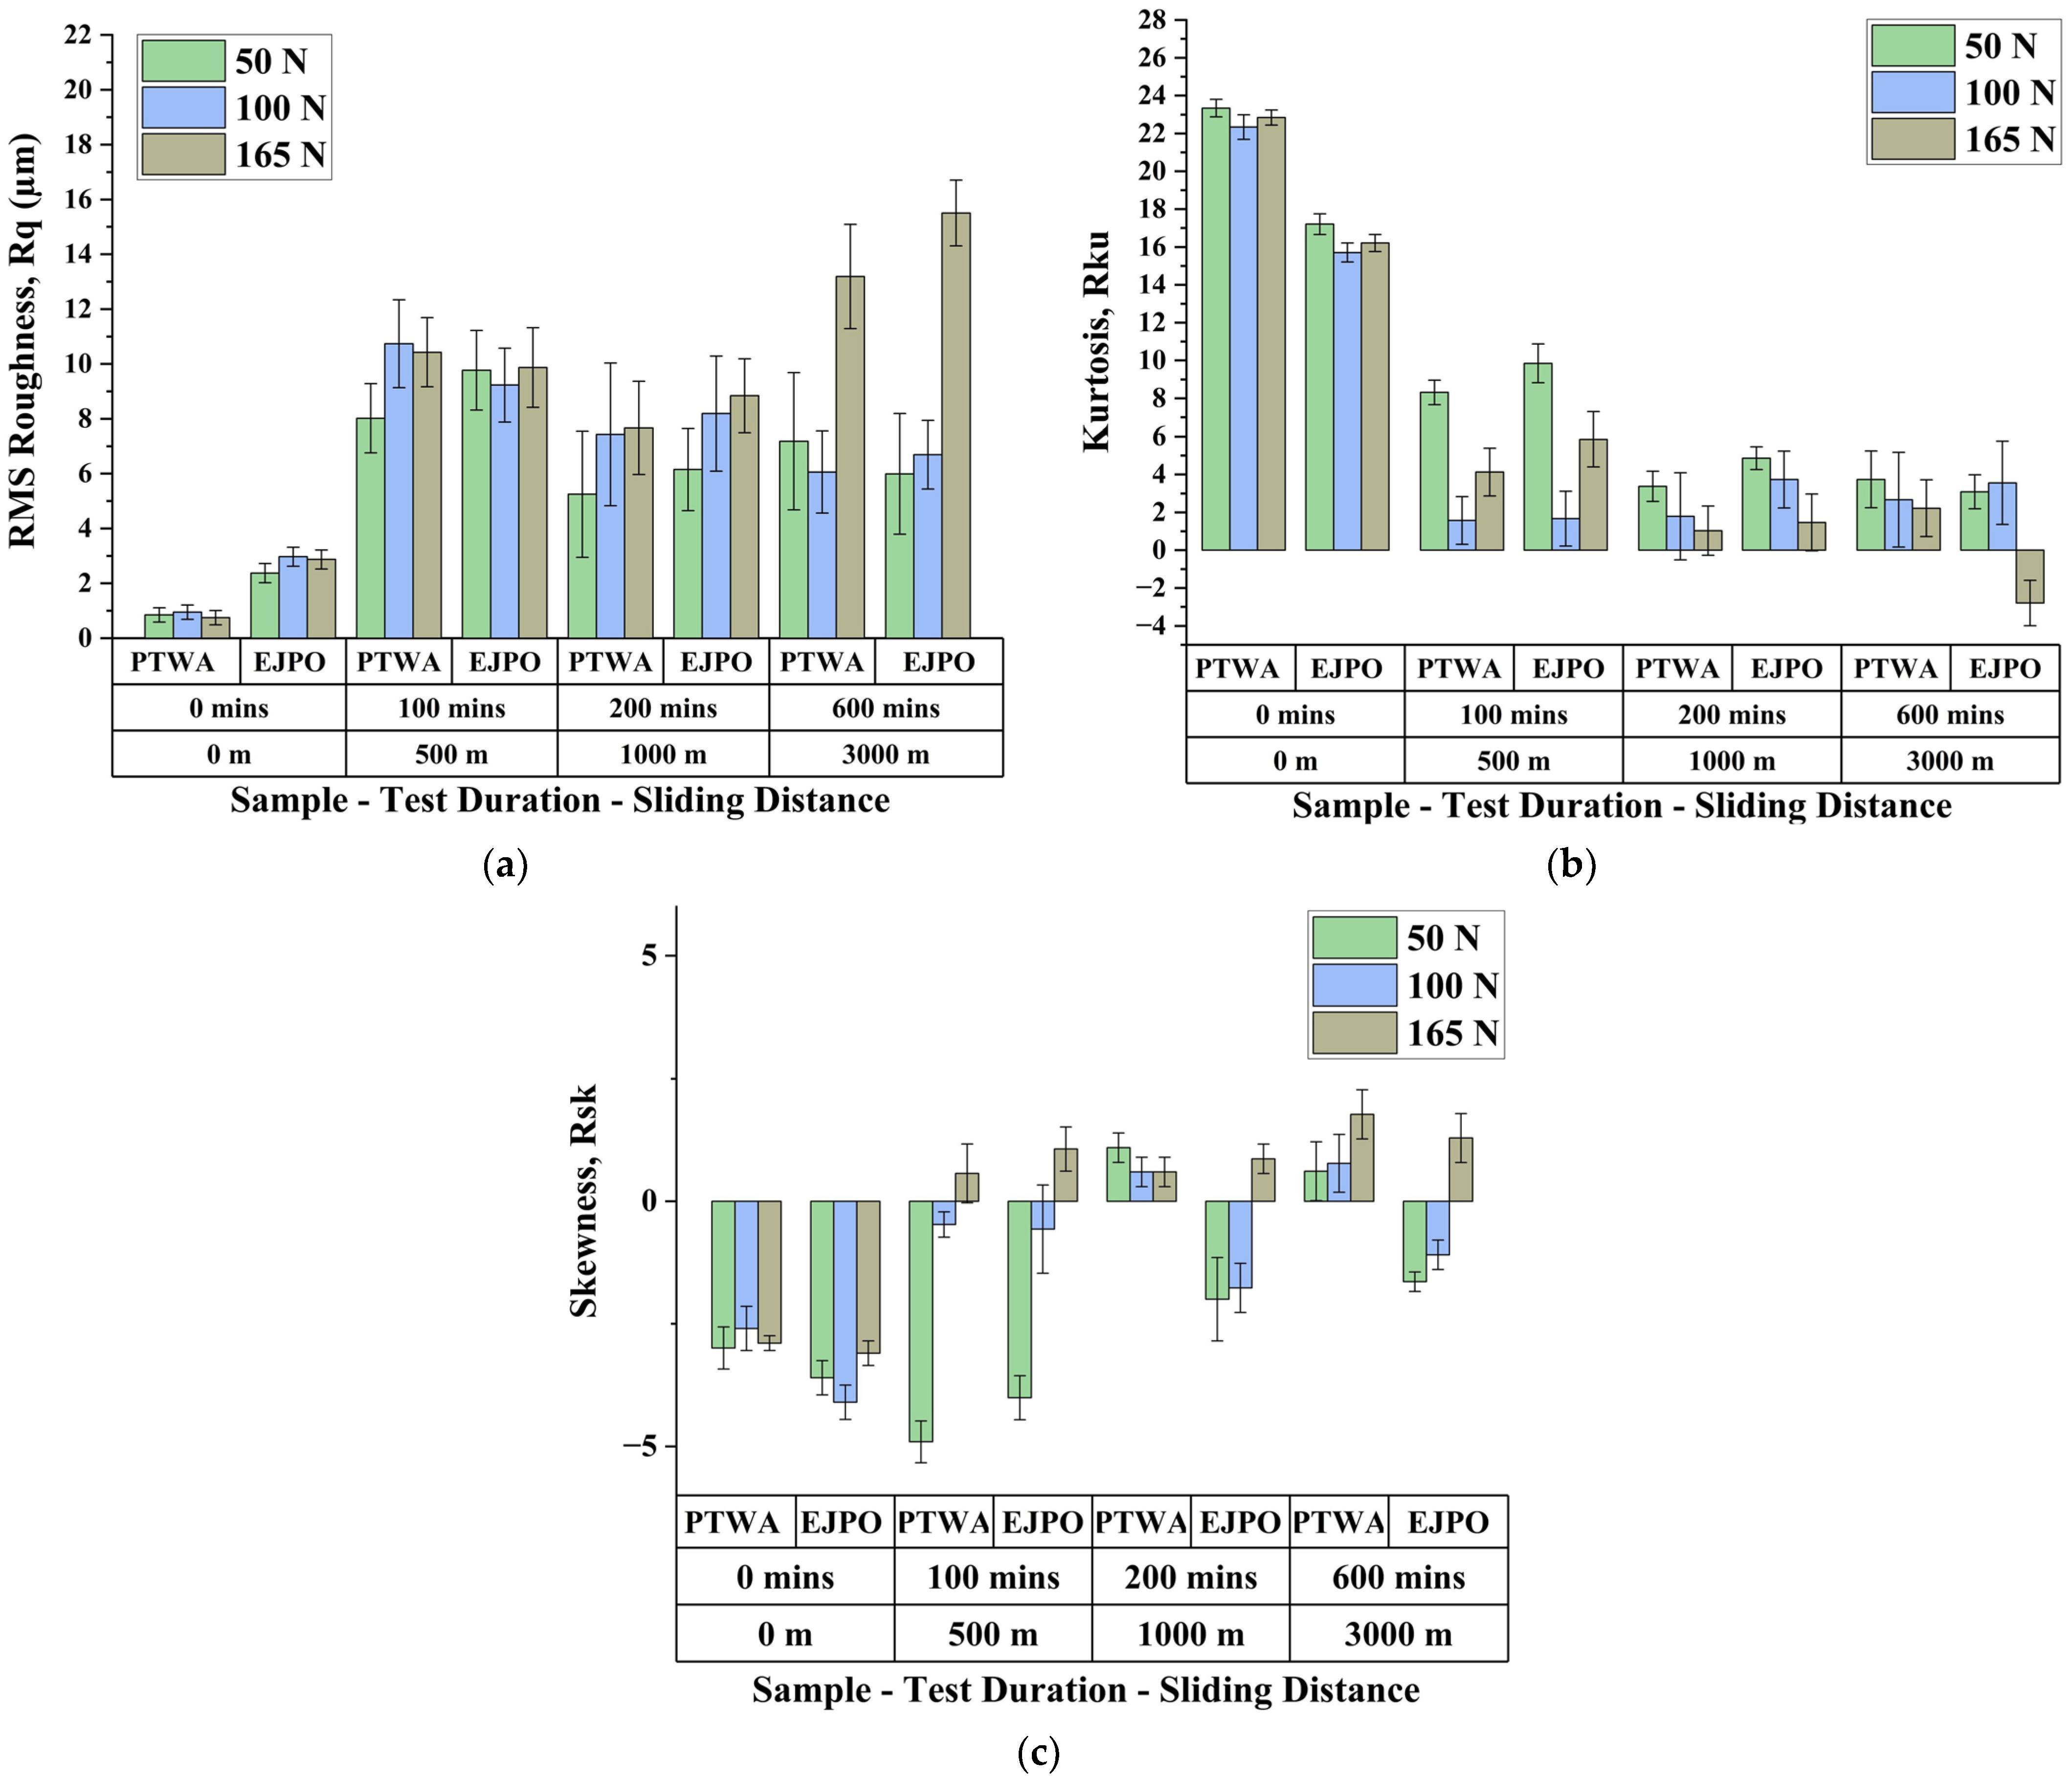
3.1. RMS Roughness, Skewness, and Kurtosis

The wear behavior of tribo-pairs largely depends on the surface roughness parameters [27]. Similarly, the frictional behavior of tribo-pairs is also influenced by surface roughness and distribution of the peaks and valleys within the surface profile. Before the tribological tests, surface topography profiles of the coated cylinder samples were recorded, as shown in Figure 9. Both unworn-coated cylinder liner surfaces exhibit flattened peaks as seen in the 2D-profilogram. This indicates that all three samples of both coatings show minimal probability of wear due to the peak asperity contact. The roughness averages, kurtosis, and skewness were calculated using the Bruker XT postprocessing software.
The unworn PTWA coating surface roughness (Ra) and RMS roughness (Rq) values are lower than measured for the unworn EJPO coating, as shown in Table 6. Roughness averages give information about the surface profile deviation of the mean datum line. Typically, smoother surfaces experience less wear. However, with less lubrication, more severe frictional wear is possible due to abrasive asperity contact. The distinct difference between the unworn surface profile of both coatings is represented by the deepest valley depths (Rv) value. Skewness (Rsk) denotes the distribution of peaks and valleys about the surface roughness mean line (see schematic in Figure 10). A slightly negative Rsk value for both coatings explains the choice of automakers to have fine asperities that encounter the piston ring and enable the initial running-in wear. Kurtosis is defined as the density of the sharpness of peaks in the surface profile. The negative skewness and high kurtosis values in Table 6 represent low friction between sliding contacts due to the relatively flat surface with deep valleys, as depicted in Figure 10.
The impact of surface roughness parameters on friction and wear can be attributed to two factors. Firstly, it regulates the thickness of the oil film, which leads to scuffing initiation. Secondly, it influences the contact area between the sliding surfaces. Pawlus et al. [28] found that lower Rq values lead to reduced friction between sliding surfaces, resulting in smoother contact surfaces and better lubricant retention. The study suggests that the resulting surface exhibits a distinct texture derived from the amalgamation of the two phenomena. The recommended surface texture for honed cylinder liner surfaces offered by engine manufacturers includes minimal surface roughness values and the bearing area parameters comprising smaller peaks that provide larger initial contact area for the counter face surface aimed to reduce contact stress during sliding.
The variation in roughness parameters post-tribological tests of the PTWA and EJPO coatings are shown in Figure 11. Initially, prior to the wear tests (i.e., at 0 m, 0 min bar plots of Figure 11a), the EJPO coating has a higher average Rq value, which is to be expected due to the nature of the manufacturing procedure and lack of postprocessing that the EJPO coating process receives. However, as the load and sliding distance increase, the Rq values for both coatings merge closer together. In general, it appears that the EJPO coating continues to have a slightly higher Rq than the PTWA coating. After the initial run-in phase, the 2D bar plots show a reducing trend in the RMS surface roughness value, until the load and sliding distance is increased to 165 N and 3000 m, respectively. The large increase in Rq value at 165 N-3000 m is potentially due to the presence of wear burrs and ploughing tracks formed by a highly abrasive three-body wear phenomenon. The observed Rq trends shown in Figure 11a suggest that wear induces the formation of pointed crests on the contact surface during the tests, followed by a gradual flattening of asperities.
The skewness and kurtosis values for the coated samples differ significantly from a standard Gaussian surface (Rsk = 0 and Rku = 3) [28]. The kurtosis values for both coated specimens clearly exhibit a decreasing trend over time as shown in Figure 11b. The observed trend indicates a reduction in surface asperity peak heights, and increasing contact pressure that signifies deteriorating wear resistance. A declining Rku value implies that the contact surface will eventually attain uniformity upon completion of the running-in phase as the fine peaks get eroded. The rate at which the skewness increases for the PTWA-coated specimen is 20% higher than the EJPO-coated samples for the increment in sliding distances. This means that at the asperity contact level, it can be estimated that the wear rate of the PTWA coating could be higher than that of the EJPO-coated bore surface. This is because the surface fatigue resistance decreases with an increase in skewness [29]. Surfaces with fewer peaks above the mean line may better retain impurities or debris from oxide film breakdown that otherwise might function as a third abrasive body at the contact. The EJPO-coated sample consisted of a high density of micropores when compared to the PTWA-coated sample, as seen in the initial Rv values shown in Figure 9. The oil held by porous valleys ensures a better wear resistance of the EJPO-coated sample. In the boundary lubrication regime, Rsk is the dominant surface roughness parameter that negatively correlates to friction experienced by the tribo-pairs [27]. The initial unworn profiles showed that the PTWA coating has lower skewness than the EJPO coated specimen owing to its more extensive surface preparation of the cylinder bore, as evident in the lower roughness values. The EJPO surface profile showed a lower value of Rsk when compared to its PTWA counterpart after the wear tests as shown in Figure 11c, suggesting that the EJPO coating may result in lower friction and thus wear rates during engine operation.

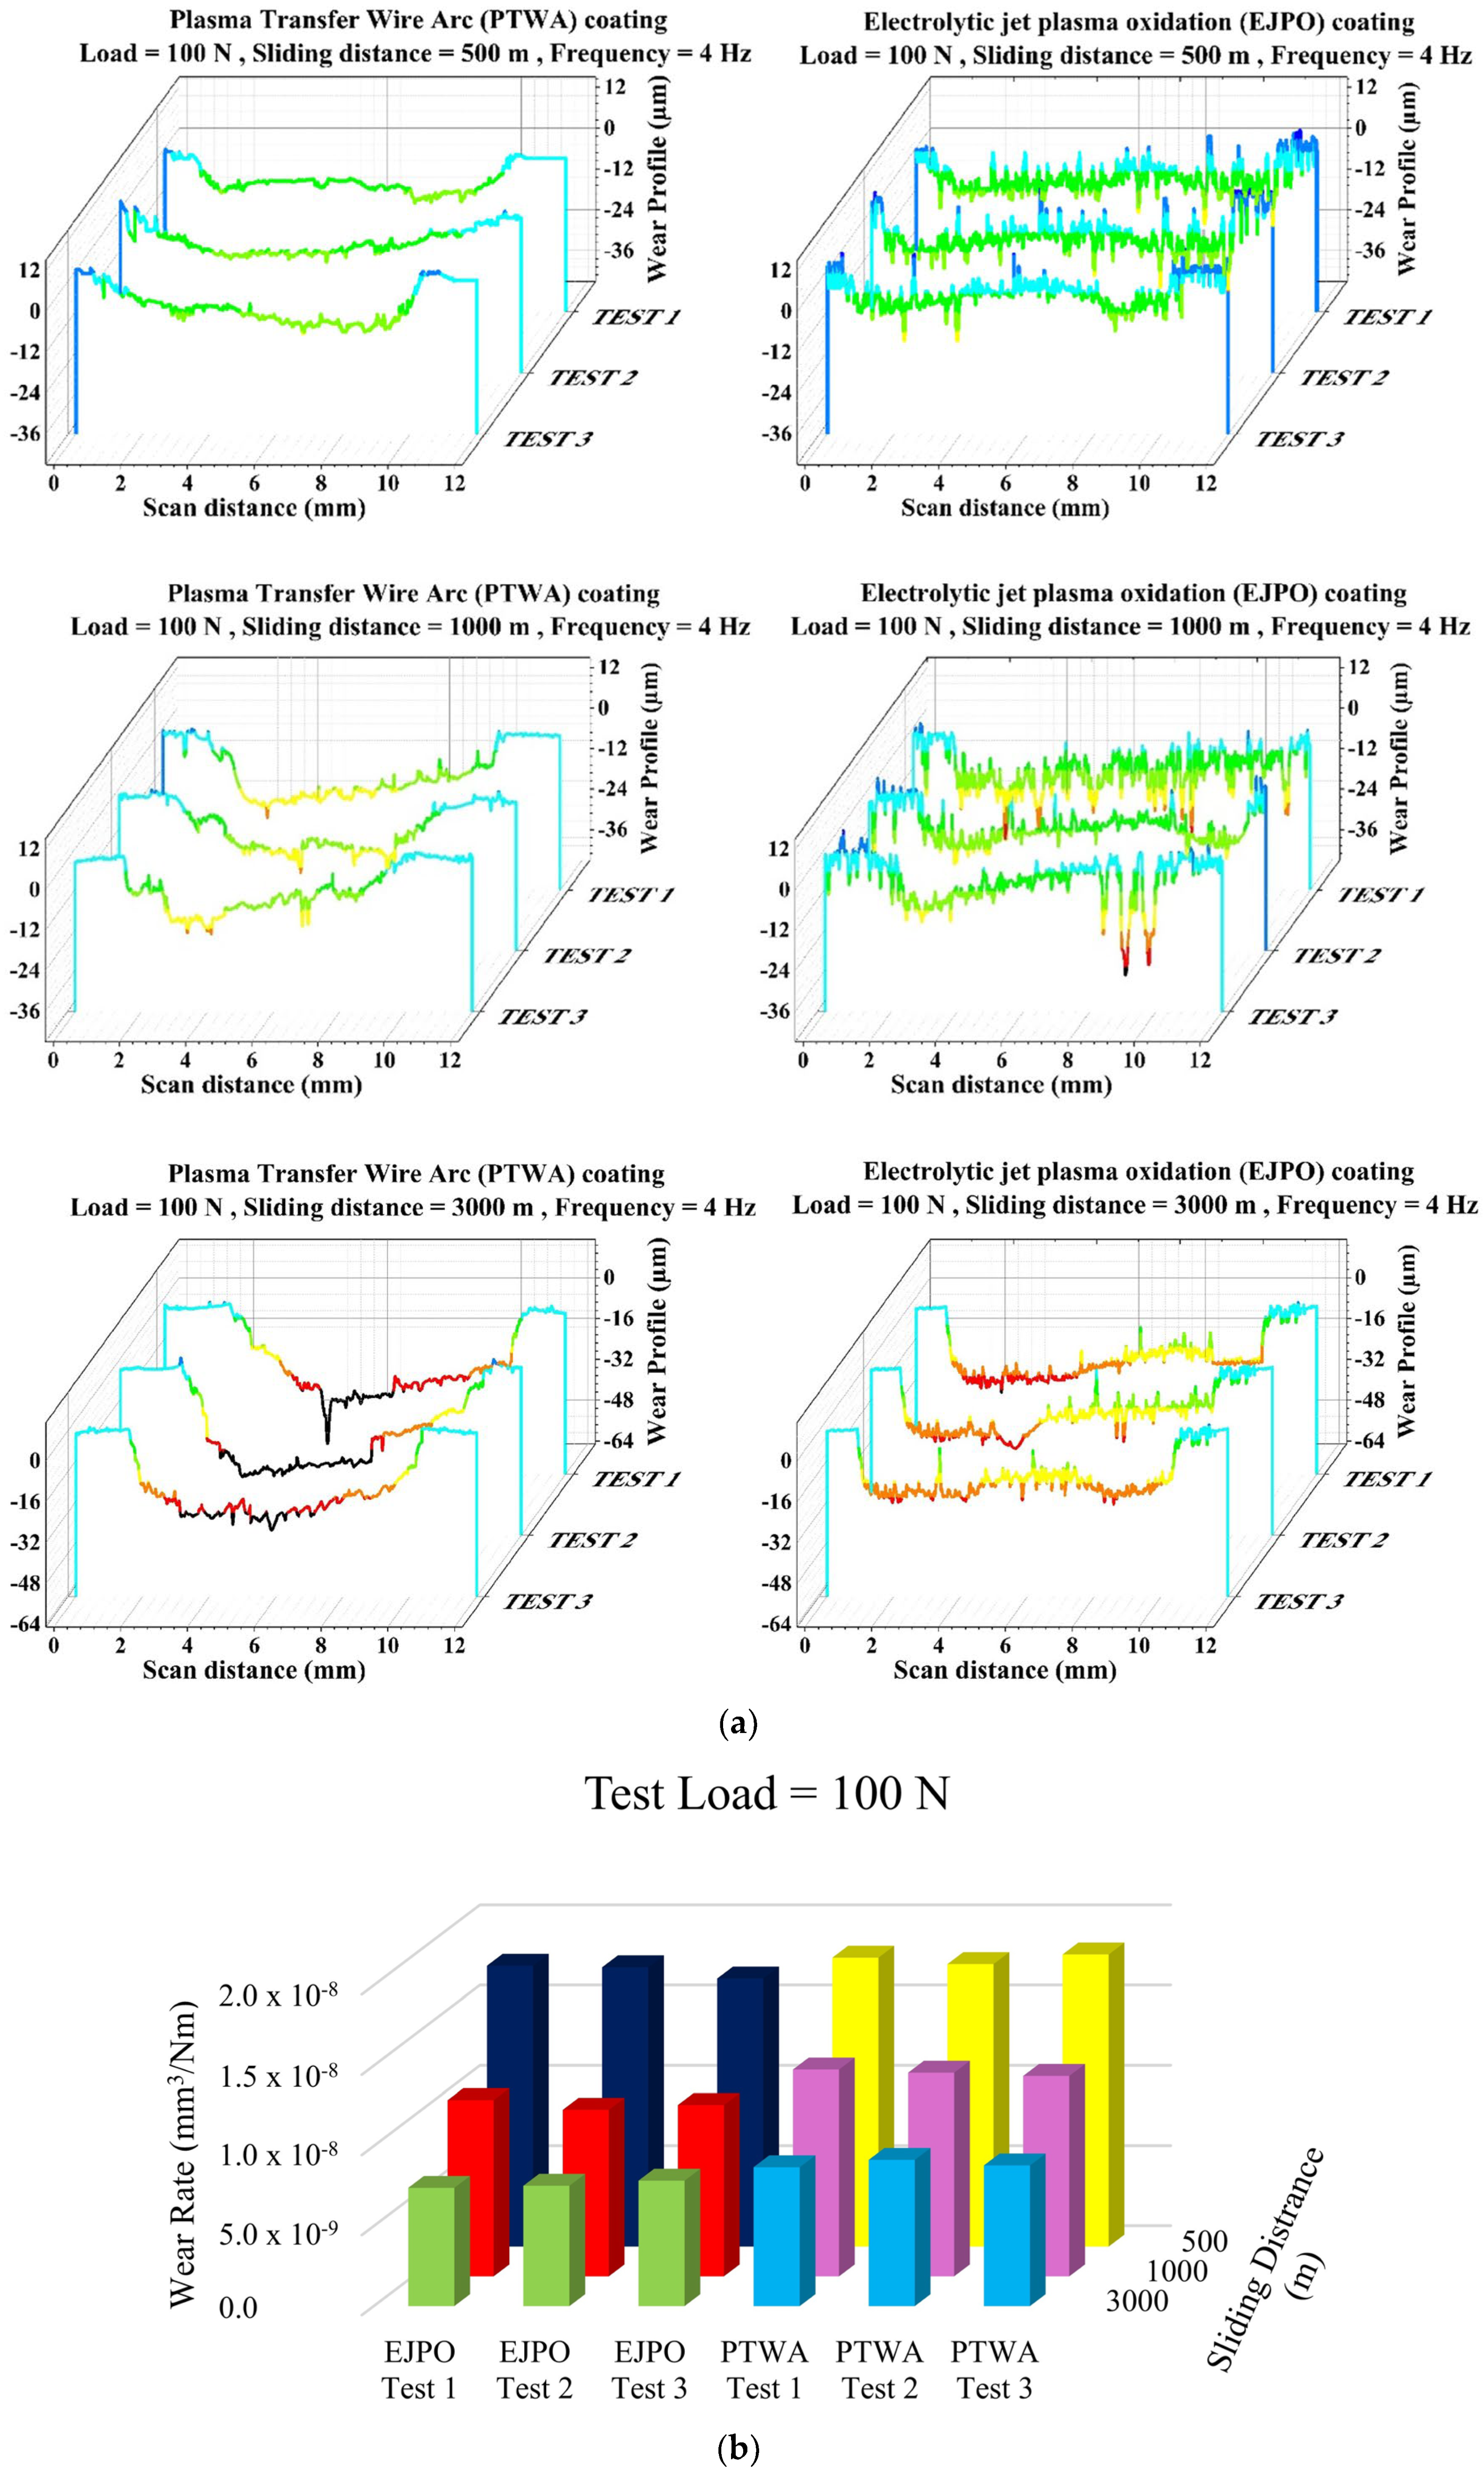
3.2. Dependence of Wear Rate on Sliding Distance

The wear rate during an engine operation is characterized by a high initial abrasive wear run-in phase of the plateau-honed cylinder surface, which then transitions to a lower steady rate of wear and is followed by marginally severe corrosive wear. In the early stages of engine operation, the engine liner experiences a smoothing process of the highest surface irregularities. Wear in the PRCL tribo-system initiates in the form of deformed asperities when the load surpasses a critical value, and the lubricant tribo-film reaches minimal thickness. Subsequently, the liner surface demonstrates a condition of steady-state wear during the useful service life period characterized by a low steady wear rate.
Figure 12 illustrates the results of three wear tests on both coated engine cylinder specimens in the boundary lubrication regime with a 100 N normal load applied on the tribo-pair. The wear rate value for the three tests was statistically close to the average of the sample set of readings, as shown in Table 6. ASTM 133-22 [20] states that taking three profile readings for a difference between planimetric wear areas within 25% is adequate for tribological tests.
The wear performance improved with increased sliding distances for the coated samples, and the running-in and steady-state wear trend was observed. The average wear rates for a 500 m sliding distance and 100 N normal load are 1.72 × 10⁻⁸ mm3/N-m (EJPO coating) and 1.79 × 10⁻⁸ mm3/N-m (PTWA coating), which represent the abrasive run-in phase. Increasing the sliding distance to 1000 m reduces the wear rate of the EJPO and PTWA coating by ~38 and 29%, respectively. Further increasing the sliding distance to 3000 m results in a further decrease in the wear rate for the EJPO (54% reduction compared to 500 m distance) and PTWA (51%) coatings. Overall, it was observed that the EJPO-coated specimen exhibited better wear resistance when compared to its PTWA counterpart during the running in and steady-state wear stages of the test. The uncertainty in the experimental wear rate values was evaluated by the 95% confidence interval shown in Table 7.

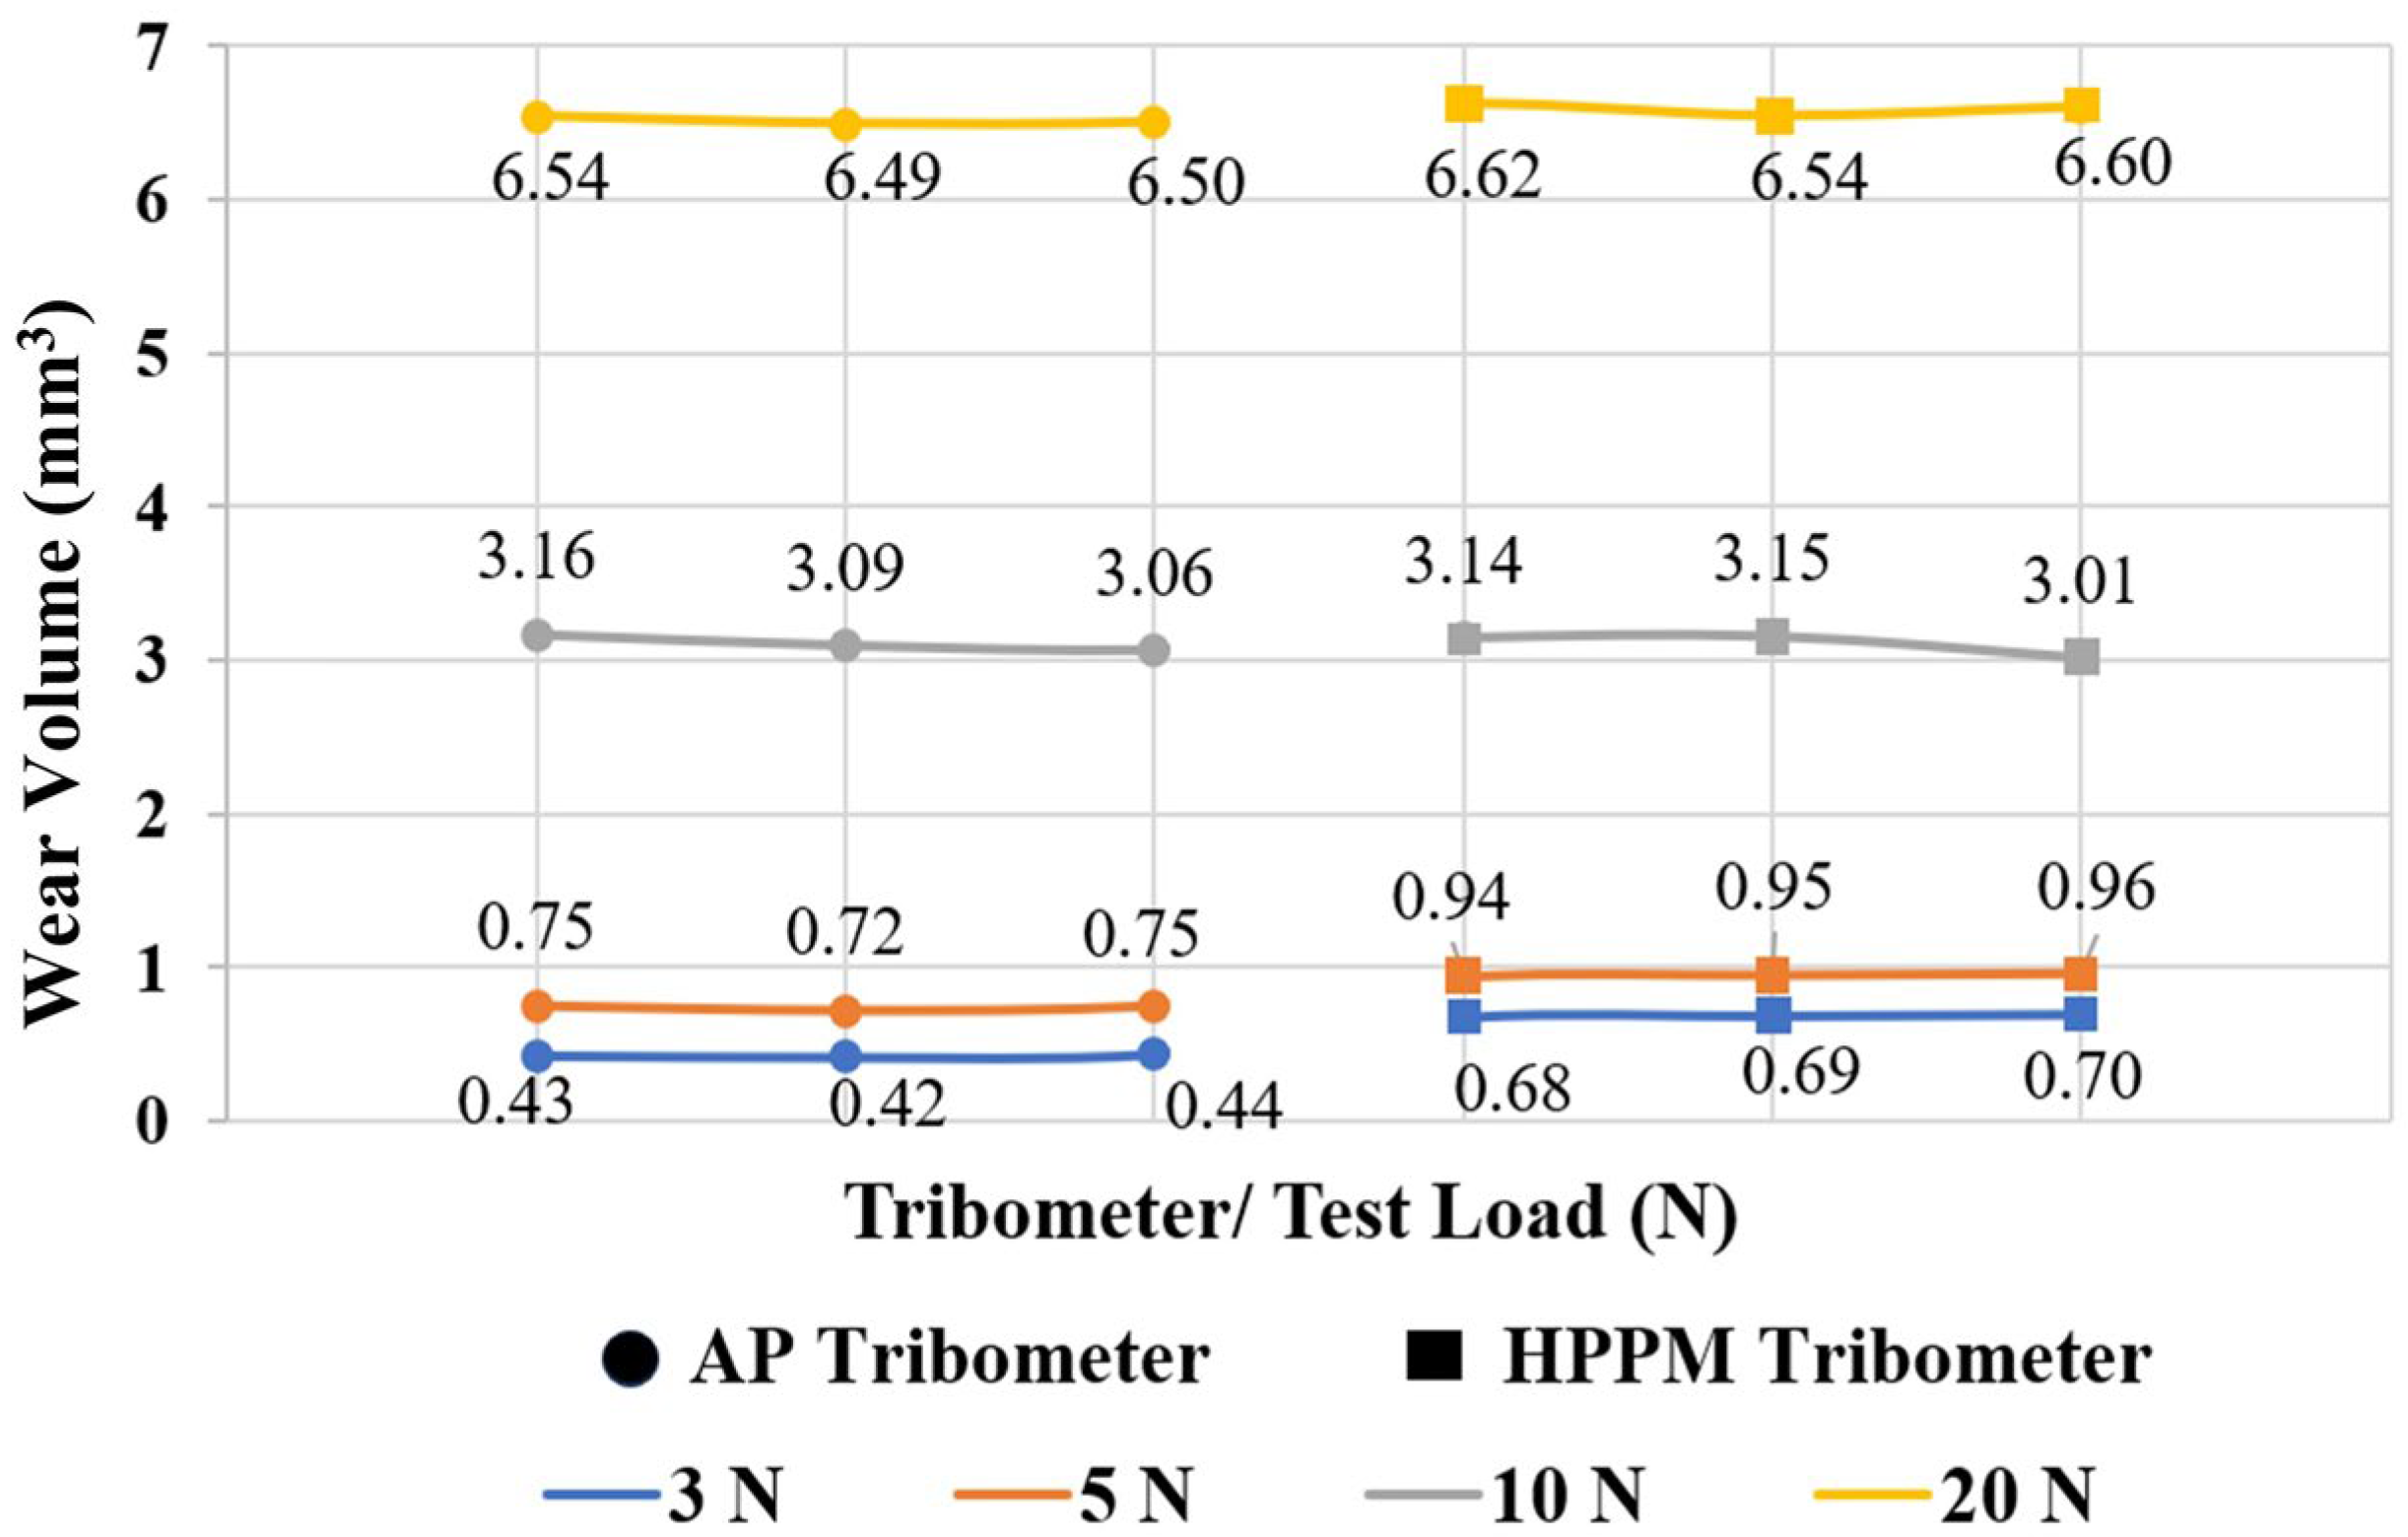
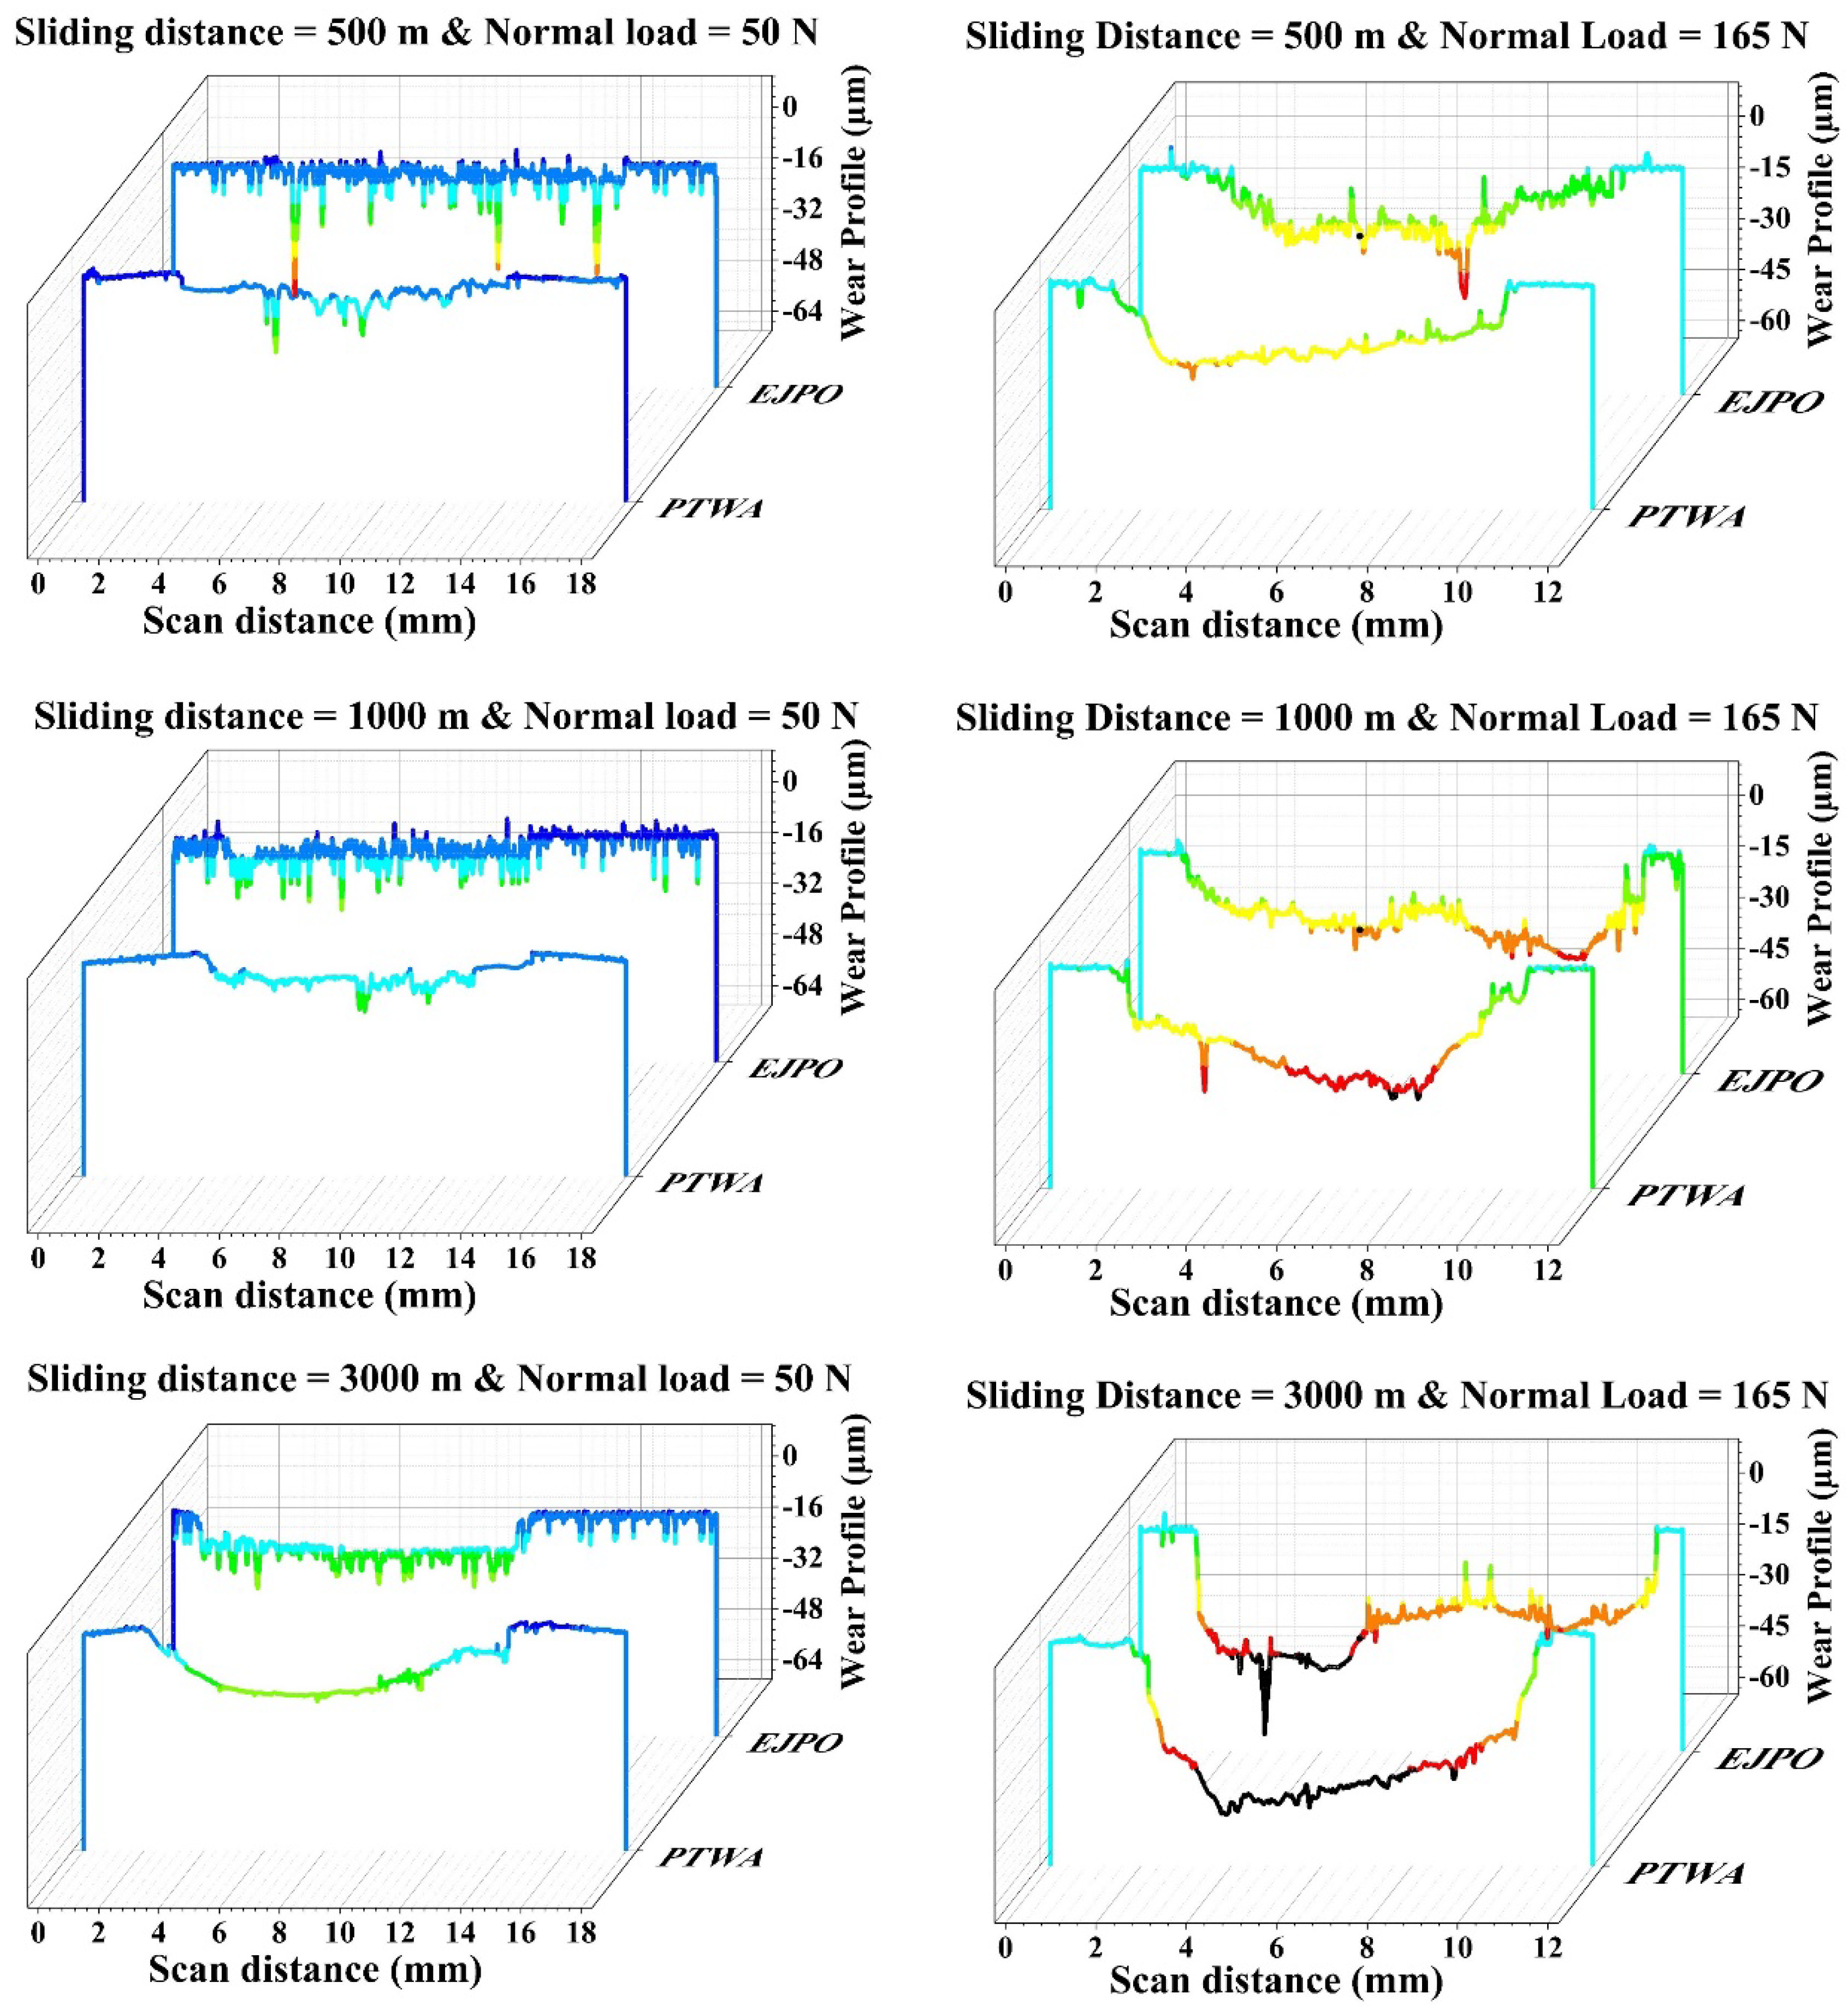
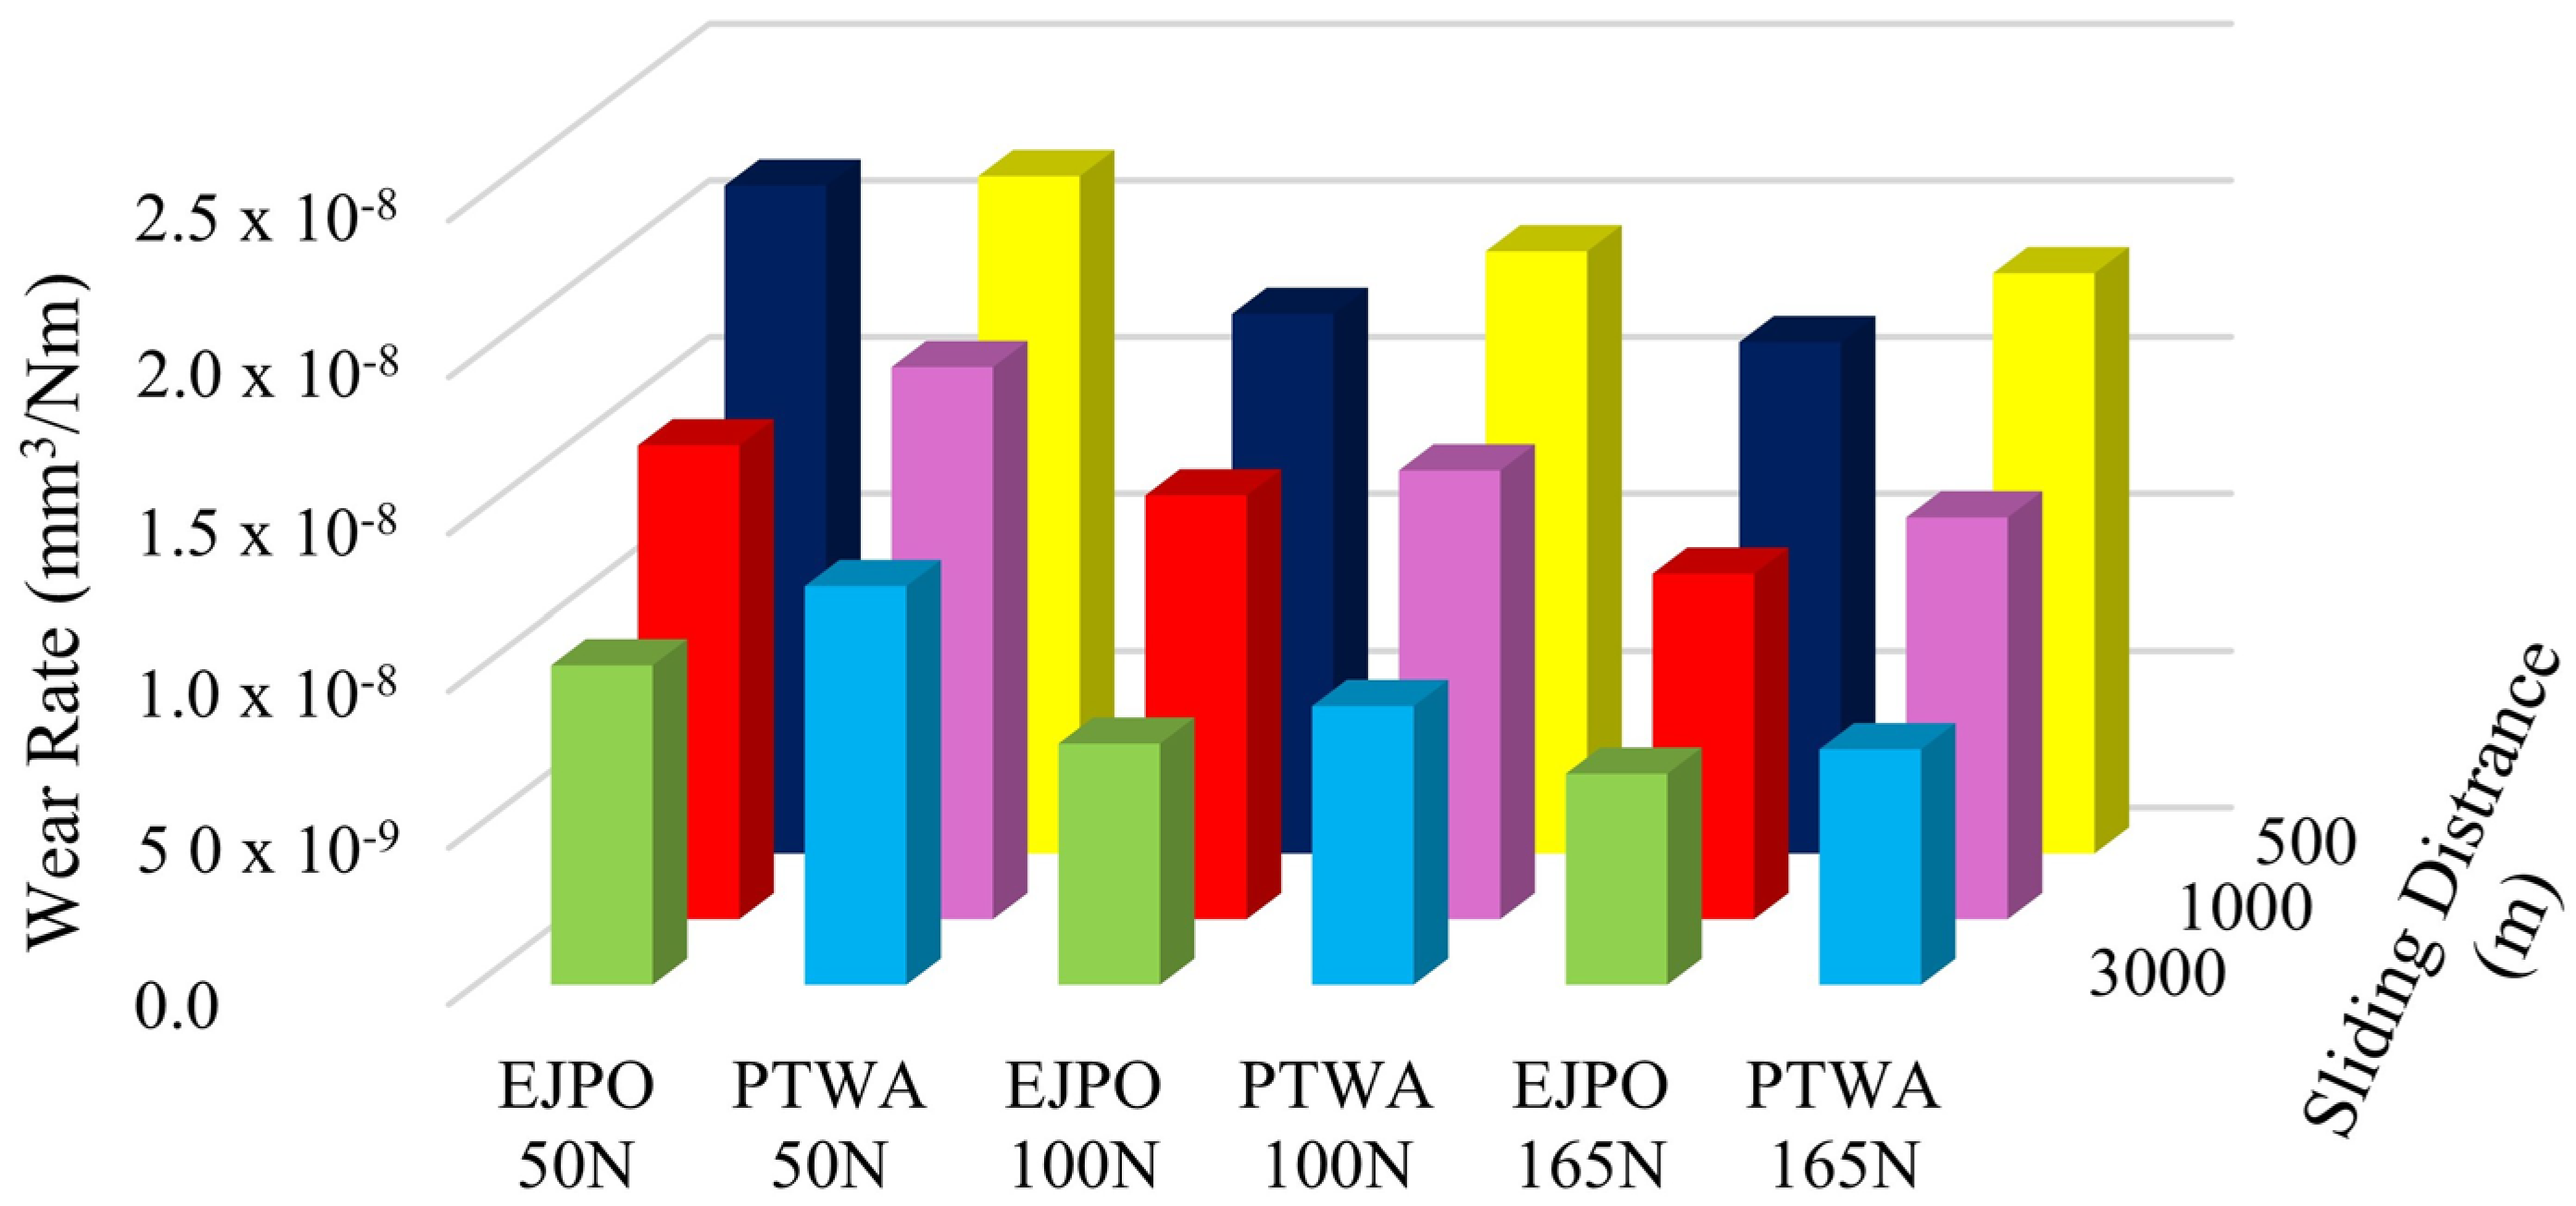
3.3. Dependence of Wear Rate on Normal Load

The applied load is proportional to the friction force experienced by the contact surfaces and is dependent on the contact area. The planimetric wear area augmented as expected with the increase in applied load. The surface profiles of the worn cylinder samples are shown in Figure 13. The wear rate values for varying load and sliding distance depicted in the illustrations shown in Figure 14 were derived by computing the mean of each wear test outcomes for both coated cylinder samples.
The findings show the superior wear resistance of the EJPO-coated sample, as compared to the PTWA coating, except in the 50 N-500 m tests, where the wear rates vary insignificantly. The similar wear rate values of both coatings during the 50 N-500 m tests can be correlated to the complex microstructure of the EJPO coating. The EJPO coating consists of three layers due to the complex nature of the electrochemical reaction that leads to the formation of the oxide coating on the substrate. A top porous layer (6–10 m thickness) is made of an amorphous structure due to the rapid quenching effect from the electrolyte, an inner dense layer, and a thin diffusion layer (100 nm thick) with Si-rich Al substrate. The lower hardness of the highly porous top surface of the EJPO coating allows for a faster run-in wear of the cylinder bore. Archard’s wear law states that the wear volume of the debris volume is inversely proportional to the hardness of the softer tribo-pair [30], which in this case is the coated cylinder bore specimen. However, as load and sliding duration were incremented, the wear rate of the EJPO-coated sample showed better resistance to wear, as compared to the PTWA sample.
The specific wear rate of the coating increased with load, as seen in Figure 14. Maximum wear was observed at 165 N loads due to higher friction and contact pressure. Under lower load test conditions, the EJPO coating exhibited lower wear rates as the sliding distance increased.
Following a visual and compositional inspection using scanning electron microscopy coupled with energy dispersive X-ray spectroscopy, no signs of mass transfer from the CI piston ring to the cylinder bore specimen, and vice versa, were observed. Hence, adhesive wear mechanisms are ruled out in the PRCL interaction. The prevalent wear mechanism is solely abrasive in nature. A detailed description of various wear mechanisms, in similar applications, can be found in Refs. [31,32]. At the end of 3000 m of piston ring reciprocation with a 165 N normal load, the CI piston ring weight was reduced by 4.892 × 10⁻³ g when run against the PTWA samples and 4.710 × 10⁻³ with EJPO samples. Considering the density of CI is 7.12 g/cm3, the average wear rate of the CI piston ring was calculated as 1.38 × 10⁻⁶ mm3/Nm for the piston ring run with PTWA samples and 1.33 × 10⁻⁶ mm3/Nm for the piston ring run with EJPO samples. The CI piston ring wear rate values agree closely with the boundary lubrication wear rate reported by Kragelskii et al. [32]. The wear rates of different piston ring-cylinder liner material pairings significantly affect the service life prediction and durability of the components. The increased wear affects the seepage of blow-by into the crankcase, resulting in inefficient fuel combustion.
At high loads, the elevation of surface roughness is due to the formation of surface protrusions, as shown in Figure 11a. The presence of lubricating films, oxide films, and similar substances between surfaces results in a decrease in adhesion propensity. However, in the boundary lubrication regime, the lubricating film saturates with the wear debris, and it starts to aggravate the wear rate of both the coated specimens caused by three-body wear mechanisms. Three-body wear is brought on by a hard particle caught between the rubbing surfaces, which in this case is wear debris, which increases the specific wear rate [33] This phenomenon was observed in the 165 N-3000 m wear test, where the volume of material lost was greater (see Figure 15). During engine operation, the continuous flow of fresh lubricating oil effectively prevents three-body abrasion within the PRCL tribo-system. However, this protective mechanism can be compromised if foreign contaminants or hard soot particles are introduced into the system. Given this, the EJPO coating’s higher wear resistance to foreign particles is a valuable feature. The greater redced valley depth (i.e., Rvk) of EJPO coating surface profiles enhances the probability of wear debris to get into these crevices, thereby reducing its contribution to wear [34]. signs of ploughing identified by the dotted lines in Figure 15 show an accumulation of material on the side of the three-body wear region.
The PTWA coating morphology consists of delaminated solidified splats, pores, and thin oxide layers. After wear tests, the surface is devoid of honing grooves caused by the reciprocating contact of the piston ring. The delamination pits have signs of crack initiation, as seen by the red arrows in Figure 16. During the PTWA coating process, low-carbon steel interacts with the oxygen in the air and forms iron oxide phases. Some of these molten plasma particles solidify before hitting the surface, leading to the formation of regions susceptible to delamination due to high shear stresses on shallow pits [34]. The microcrack propagation initiates at these non-melted splat sites. The weak bonds at splat interfaces separate under shear stress induced by the sliding piston ring. The high susceptibility to three-body abrasive wear shows that the PTWA coated engine cylinder is susceptible to an increase in the clearance between piston ring and the cylinder liner due to external particles during engine operation. This could result in a greater amount of blow-by, thereby reducing engine efficiency. For the EJPO coated specimens under boundary lubrication conditions, the wear branches out from the microcracks, which opens into a network of porosity pits, thereby further acting as reservoirs for the wear debris-rich lubricating oil.

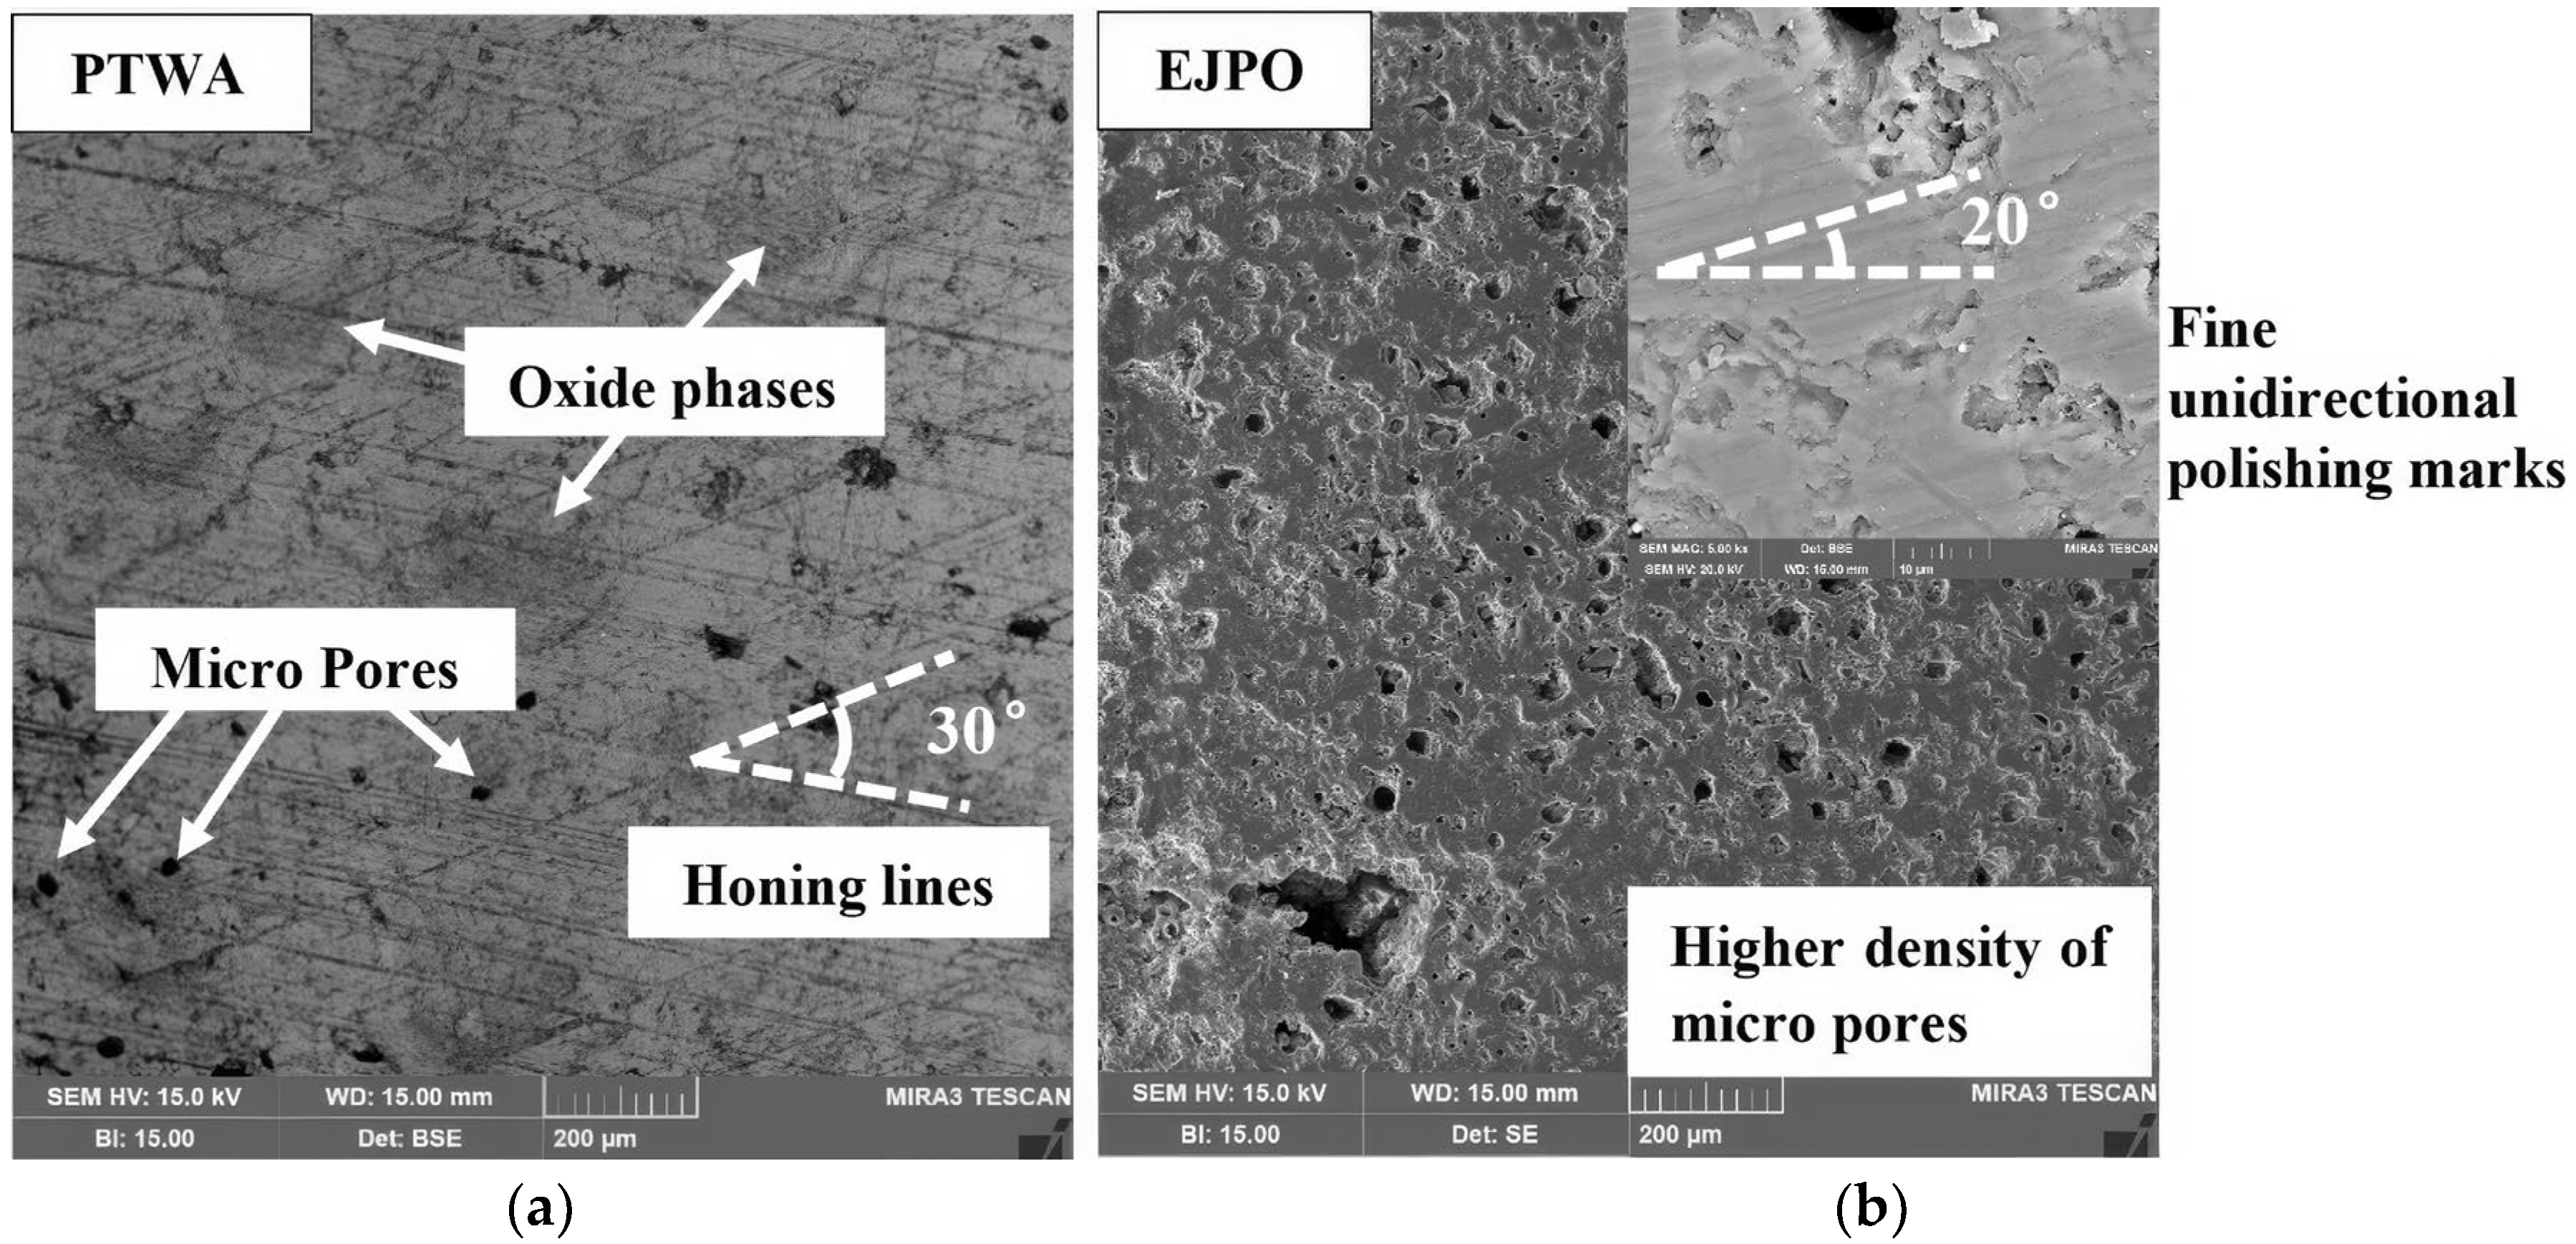
3.4. Evolution of Porosity

Compared to a hypereutectic Al-Si cylinder bore liner that employs Si particles with a high hardness that forms oil retention channels after initial running-in wear, the hypoeutectic Al-Si alloy coated with EJPO consists of micropores on its surface that function similarly to the protruded Si particles in hypereutectic Al-Si liners. The significant quantity of micropores on the EJPO-coated surface provides an additional ability to retain lubricating engine oil. Previous porosity studies done on EJPO coatings applied on an aluminum alloy substrate exhibited a porosity of around 20% [35]. Similar 2D porosity studies conducted on PTWA coatings by Ford Motor Company reported an average porosity of around 2–8% [36].
The 2D surface SEM micropore analysis is the most straightforward approach for porosity analysis of the plasma-based electrolytic oxidation layer on diverse substrates. This method does not consider enclosed voids, and the morphology of subsurface voids remains imperceptible. However, it provides quantifiable data for average top surface porosity distribution. EJPO coatings have a higher volume fraction of pores within the coating structure. After the initial duration of run-in, the 1000 m sliding distance wear test specimen forms fracture networks, as shown in Figure 16b. The process of wear entails the elimination of asperities while simultaneously filling existing pores with wear debris, resulting in a surface that possesses diminished porosity.
To quantify the percentage porosity, image stack processing software (Image-J, version 1.8.0_345) was utilized. The porosity can be determined by calculating the ratio of the total area occupied by the detected pores to the overall area of the analyzed region of interest (see Equation (5)). SEM micrographs offer the required accuracy in establishing the measurement scale per pixel. The lower limit on the width of the micropores is set at 10 μm. The blue region denotes the areas where porosities are observed, and the green region denotes regions where surface burrs or protrusions are observed.
Porosity   % = Total   area   of   micro pores / Total   area   of   analyzed   region  
High-porosity EJPO coatings have a higher volume fraction of interconnected pores within the coating structure. During the short duration of the initial run-in wear test of 500 m of sliding distance, the pores show signs of branching out. Thereafter, as the wear depth increases, the network of pores is exposed. The initial porosity level of PTWA coating is 3.7%. As the sliding distance is increased, the signs of scuffing are seen clearly (see Figure 17). The initial porosity levels of the EJPO coating are 16%, which is significantly higher compared to the PTWA coating. No signs of scuffing are seen even up to the maximum 3000 m sliding distance, which is an extremely desirable trait for engine cylinder applications.

4. Conclusions

The wear behavior of two plasma-based engine cylinder coatings was examined with chrome-coated CI piston rings in the boundary lubrication cold start engine conditions. To simulate the contact conditions within the piston ring cylinder liner system, a new bench-scale setup was developed as an alternative to full-scale wear test equipment. The following conclusions can be drawn from the results:
  • As the normal load and sliding distances were incremented during the boundary lubrication wear tests, the EJPO-coated engine cylinder samples show better wear resistance than its PTWA counterpart due to its ability to hold oil in its porous surface morphology.
  • The boundary-lubricated wear test on EJPO-coated engine cylinder samples shows better wear resistance than its PTWA counterpart across all loading conditions and test duration, except during the lowest load and sliding distance (i.e., 50 N-500 m), where the difference in wear rates of the two coatings is minimal. The maximum wear rate is observed at the initial 500 m of the tribo-test for the PTWA- (2.16 × 10⁻⁸ mm3/Nm) and EJPO-coated (2.13 × 10⁻⁸ mm3/Nm) specimens.
  • In the boundary-lubricated wear tests, 24% of the total wear volume was lost in the first 500 m sliding distance for the EJPO-coated sample. For PTWA-coated samples, around 26% of the coating volume was removed in the initial 500 m of the test. This comparable value of run-in wear of tribo-pairs shows that both coatings are suitable for cylinder bore applications, which employ CI piston rings. However, the EJPO coating showed lower wear rates across all loading scenarios.
  • A 20% slower rate of increase in skewness value of the EJPO samples compared to the PTWA samples during the wear tests indicates that the surface is filled with fine peaks and deep valleys. This aspect contributes to the lower wear rate due to the reduced counter-face friction.
  • The research findings highlight notable trends in surface roughness, skewness, and kurtosis of the EJPO coating comparable to the industry accepted PTWA coating during the different stages of the wear test. After the initial run-in stage of the EJPO coating, kurtosis and RMS surface roughness decreased, suggesting a reduction in surface peak heights and improved surface uniformity, proving its fitness for service despite less comprehensive surface preparation than the PTWA coating.
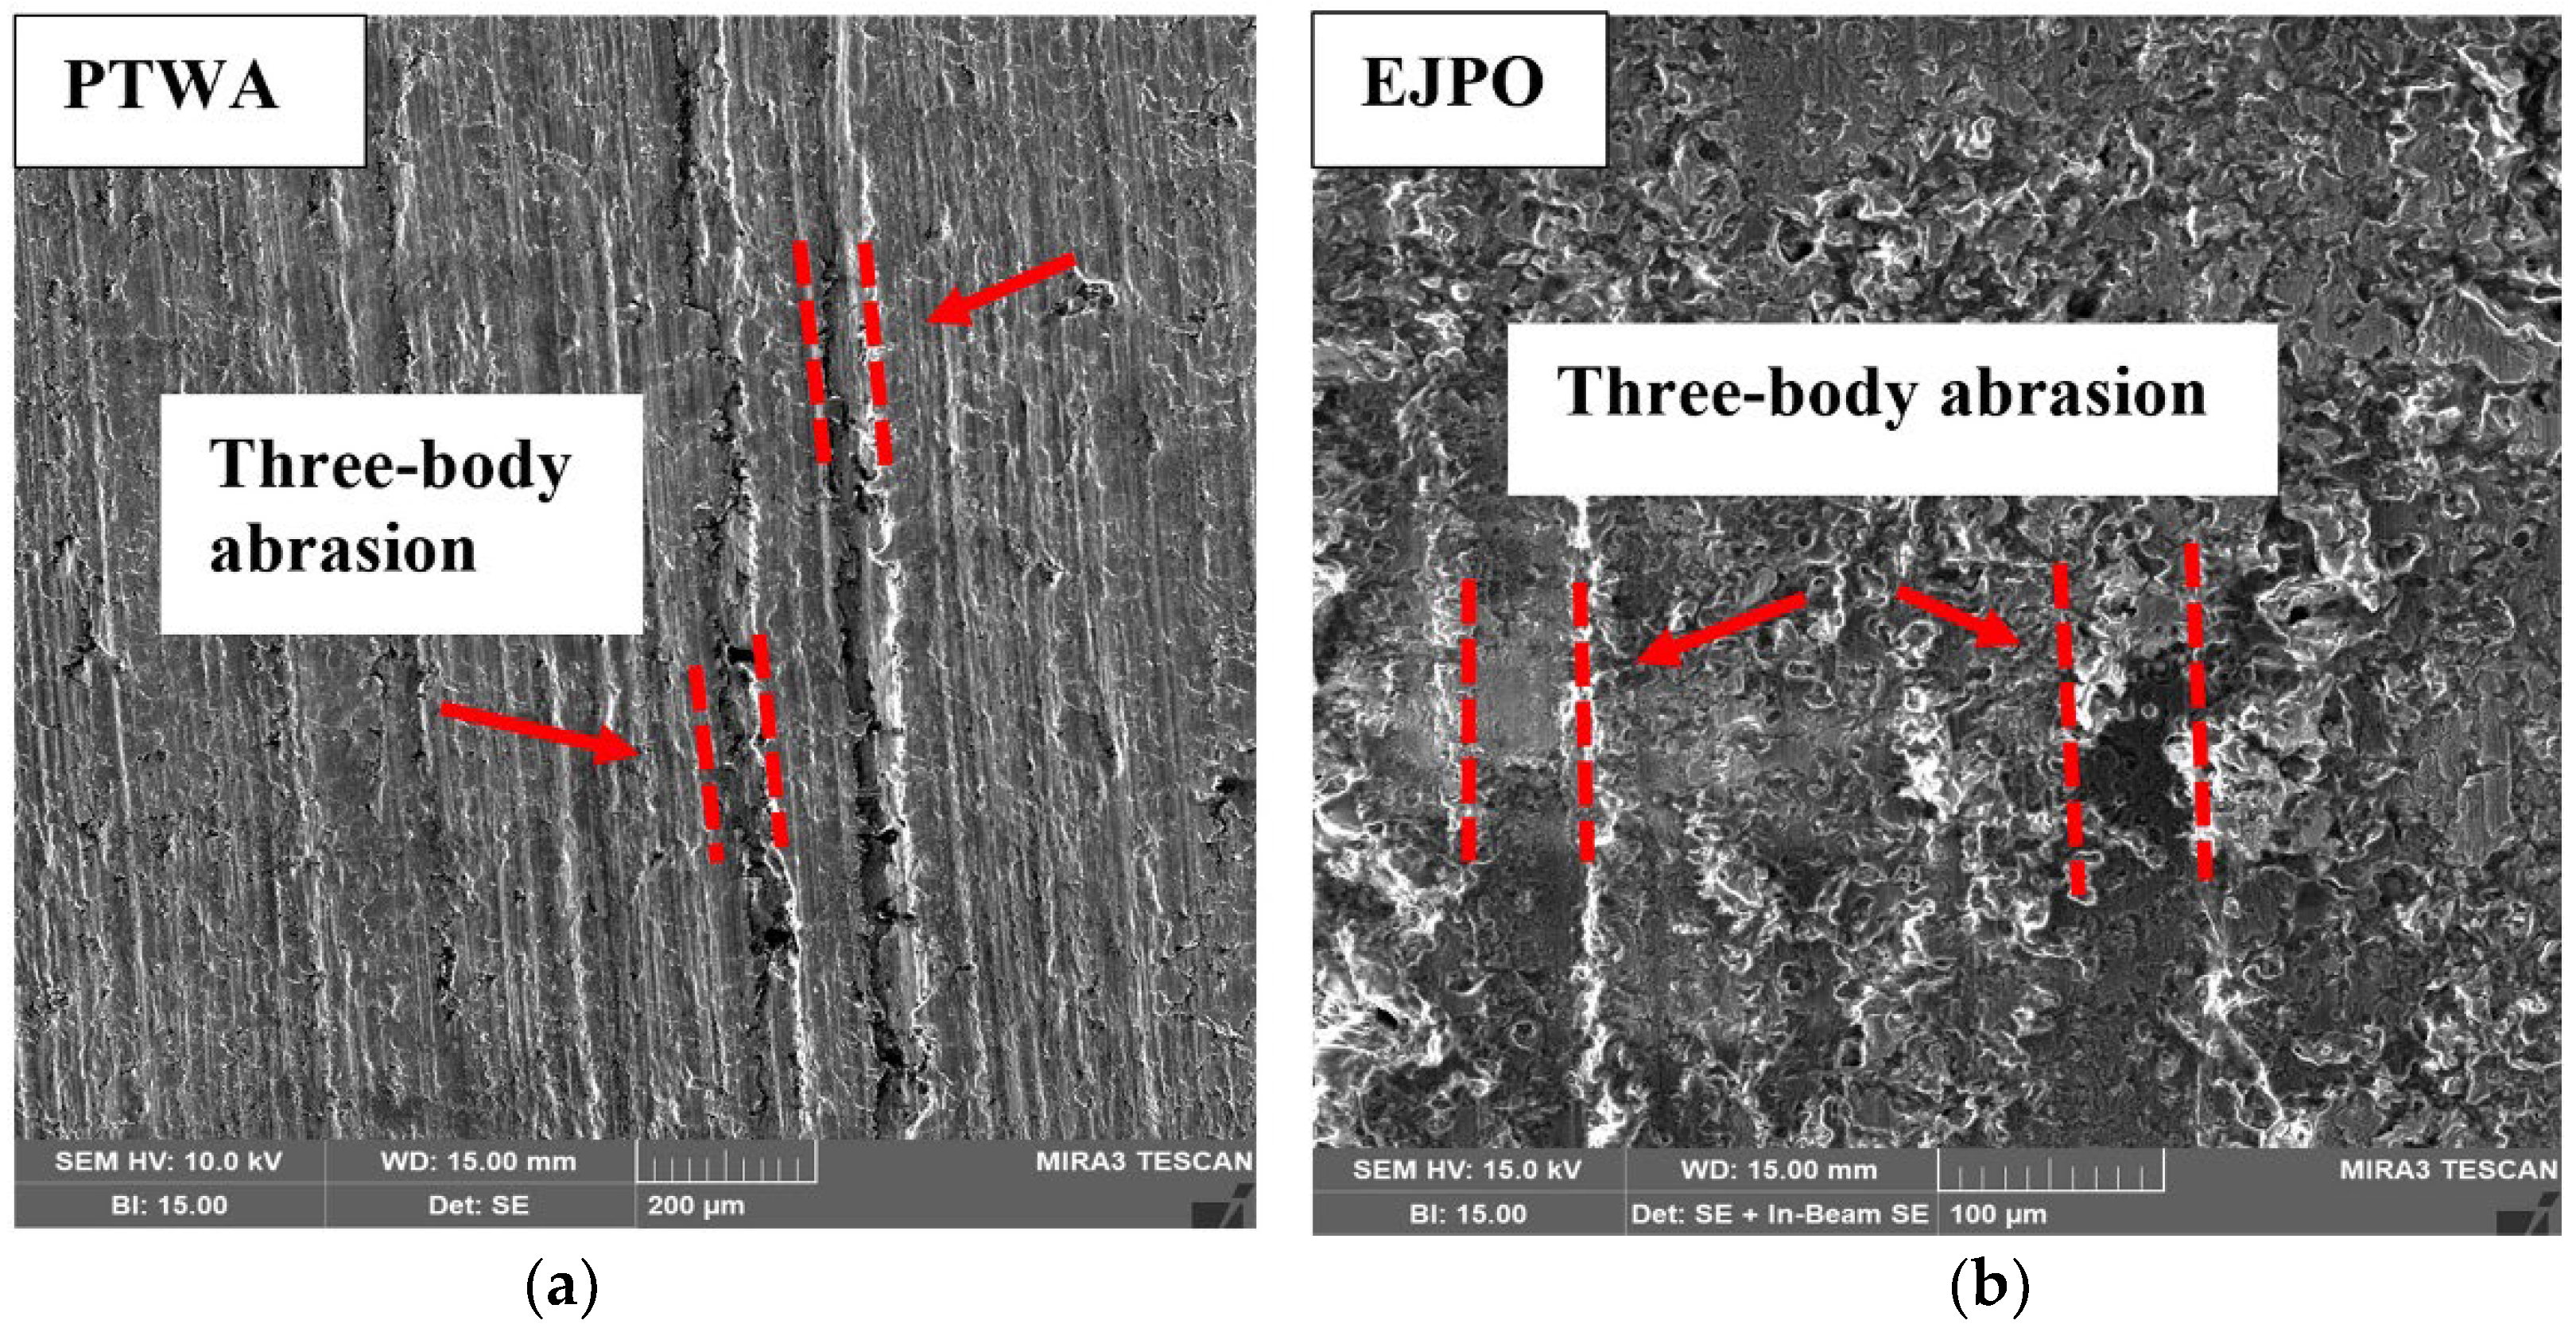
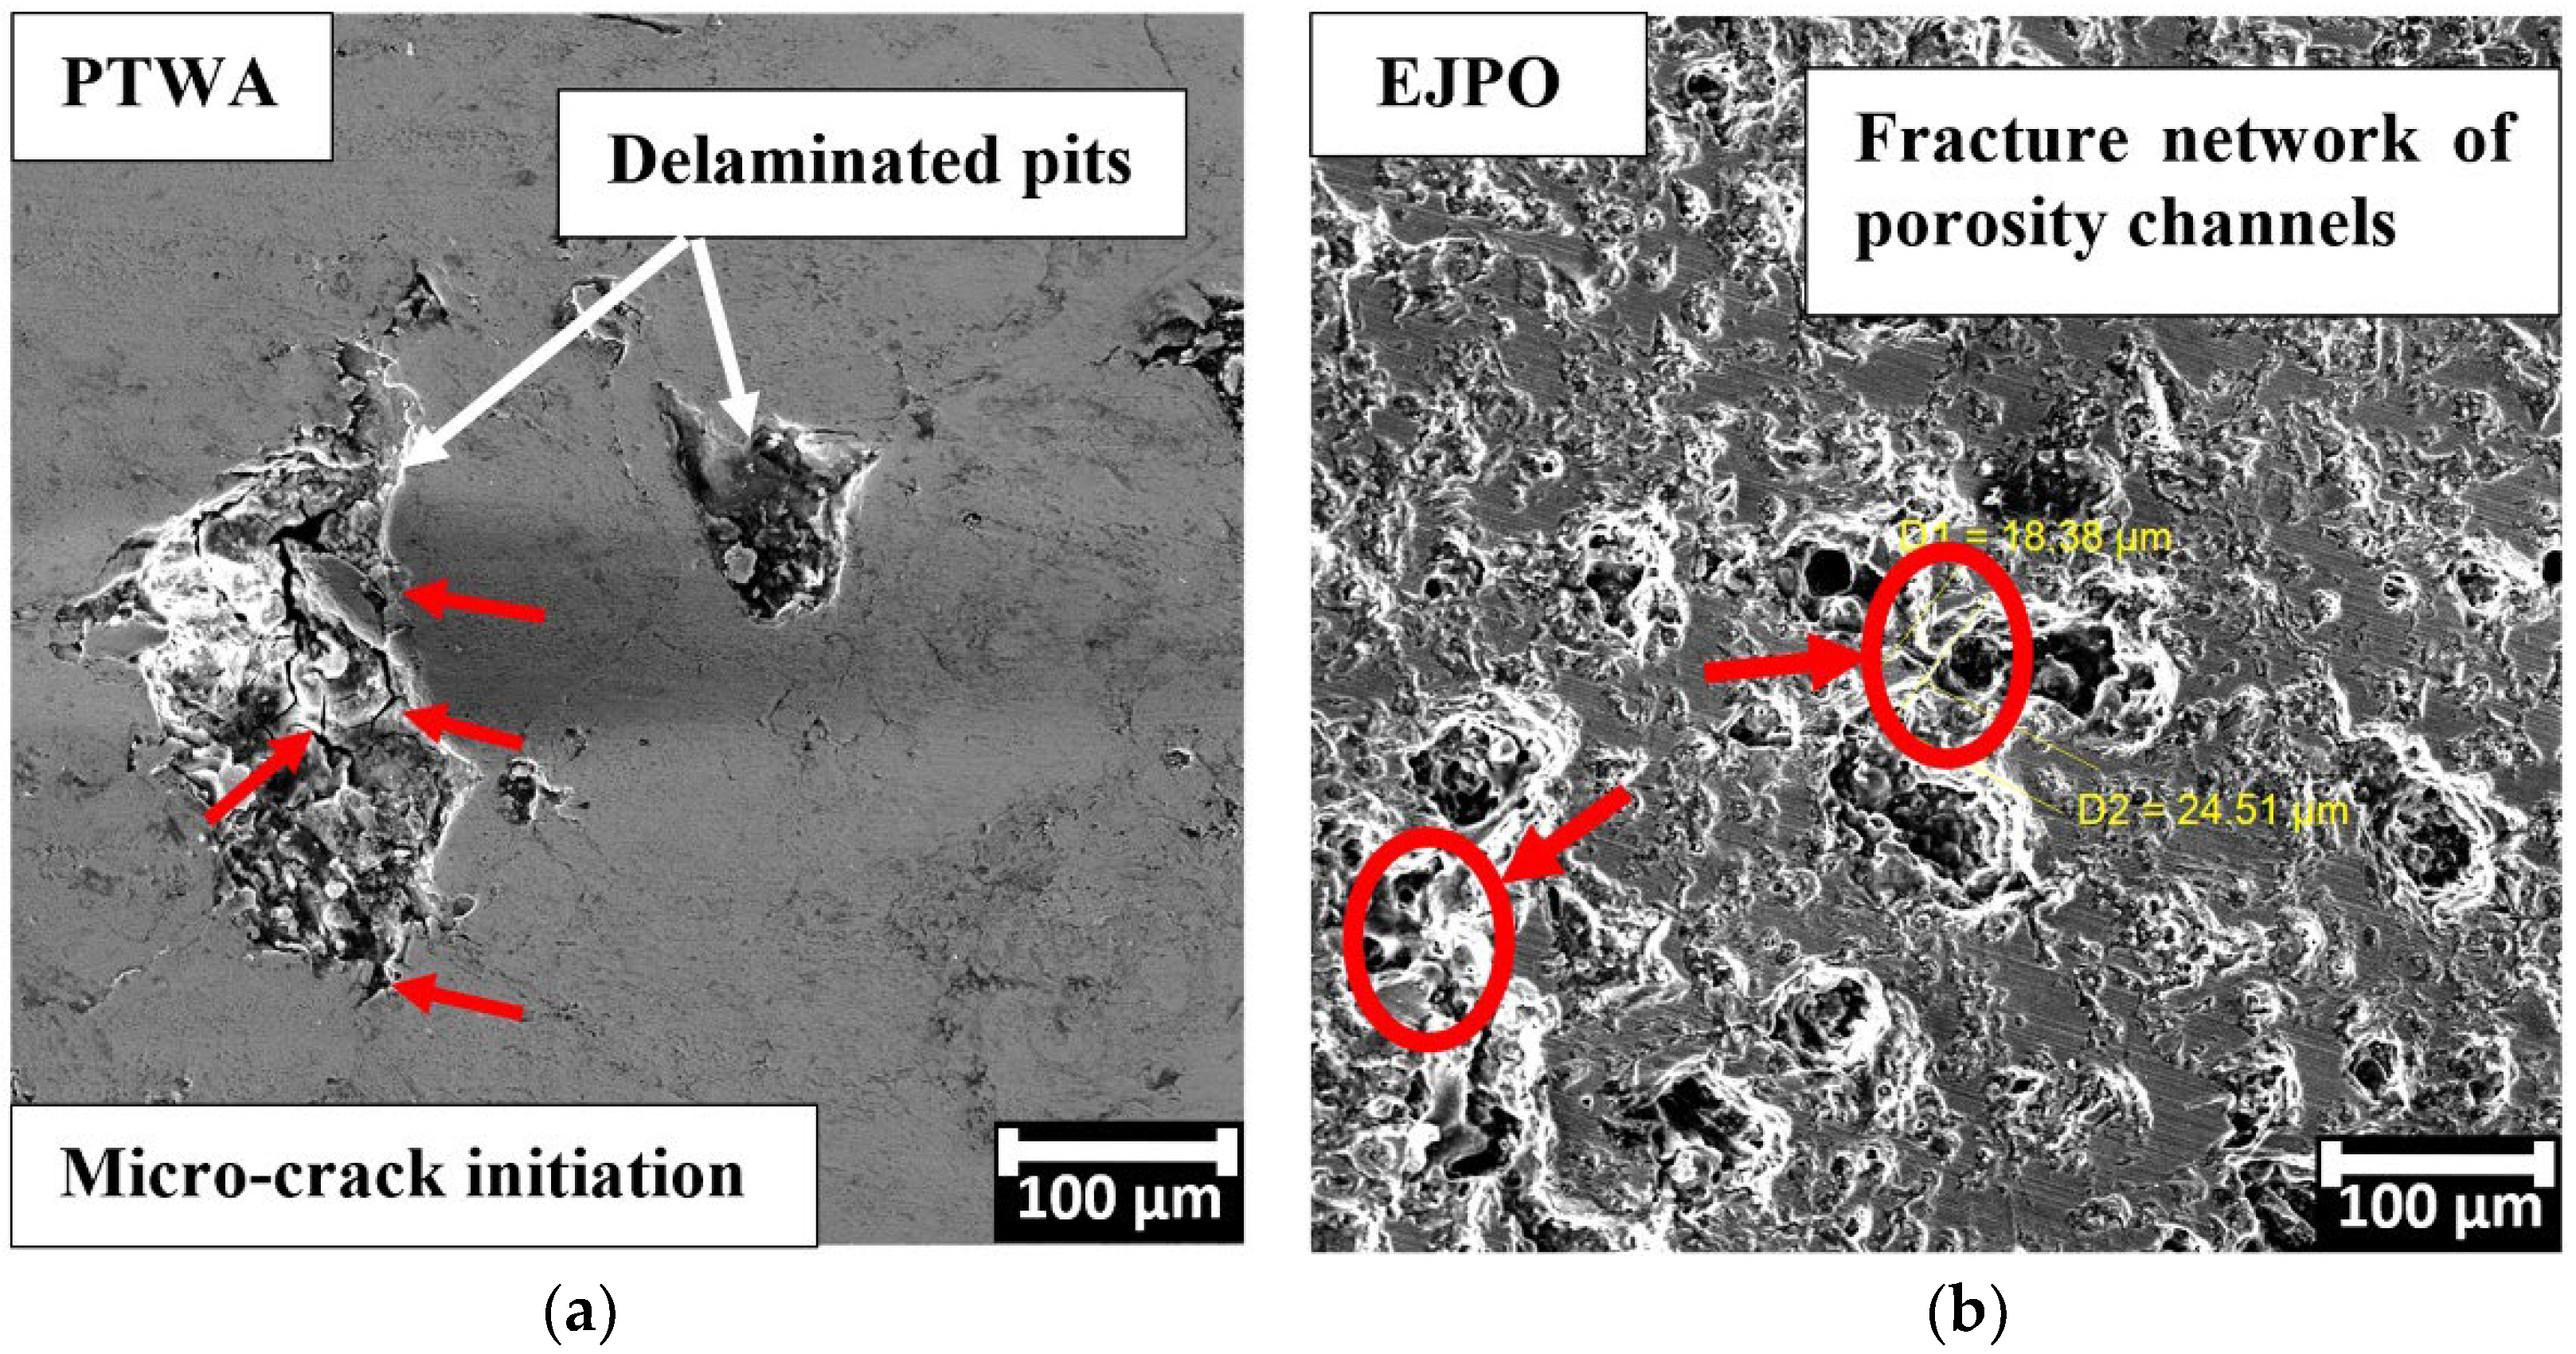
  • The wear process is initiated by abrasive wear. During the initial period of use, surface peaks, weak edges of cracks, and pores undergo removal, resulting in the generation of wear debris and the formation of wear scars on the surface. In the case of PTWA-coated samples, the wear is subsequently intensified by the separation of splats, which occurs due to the propagation of cracks at the interfaces between the oxides. The coating layers undergo removal due to surface fatigue and serve as the third-body particle during subsequent abrasive wear processes. The EJPO coating shows a much lesser propensity for scuffing and three-body abrasive wear as the greater amount of surface porosities can retain impurities or debris in the lubricating oil.

Author Contributions

Conceptualization, S.B., J.S. and D.S.; methodology, S.B.; validation S.B., J.S. and D.S.; formal analysis, S.B., J.S. and D.S.; investigation, S.B., J.S. and D.S.; resources, D.S. and J.T.; data curation, S.B.; writing—original draft preparation, S.B.; writing—review and editing, S.B., J.S., D.S. and J.T.; visualization, S.B.; supervision, J.S. and D.S.; project administration, D.S.; funding acquisition, D.S. and J.T. All authors have read and agreed to the published version of the manuscript.

Funding

This research was funded by Ford and a NSERC Alliance grant. The NSERC Alliance grant number is ALLRP 566184-21.

Data Availability Statement

The original contributions presented in this study are included in the article. Further inquiries can be directed to the corresponding author.

Acknowledgments

The authors would like to thank Nasim Bahramian and Sina Kianfar for their contribution to prototyping the original version of the custom tribometry system.

Conflicts of Interest

The authors declare no conflicts of interest.

Abbreviations

The following abbreviations are used in this manuscript:
PTWAPlasma transfer wire arc
EJPOElectrolytic jet plasma oxidation
GHGGreenhouse gas
SISpark ignition
TCRTop compression ring
TDCTop dead center
PRCLPiston ring-cylinder liner
BDCBottom dead center
CICast iron
SEMScanning electron microscope

References

  1. Kathryn, P. (Ed.) Second Global Sustainable Transport Conference Interagency Report; United Nations: New York, NY, USA, 2021. [Google Scholar]
  2. IPCC. Climate Change Synthesis Report; Core Writing Team, Lee, H., Romero, J., Eds.; Intergovernmental Panel on Climate Change (IPCC): Geneva, Switzerland, 2023. [Google Scholar]
  3. Wong, V.W.; Tung, S.C. Overview of automotive engine friction and reduction trends–Effects of surface, material, and lubricant-additive technologies. Friction 2016, 4, 1–28. [Google Scholar]
  4. Ting, L.; Mayer, J. Piston ring lubrication and cylinder bore analysis, part ii—Theory verification. ASME J. Lubr. Technol. 1974, 96, 258–266. [Google Scholar]
  5. Sediako, D.; D’Elia, F.; Machin, C.; Lombardi, A.; Ravindran, C. Analysis of residual stress profiles in the cylinder web region of an As-Cast V6 Al engine block with cast-in Fe liners using neutron diffraction. SAE Int. J. Mater. Manuf. 2011, 4, 138–151. [Google Scholar]
  6. KS Aluminum Technology. Aluminum Cylinder Blocks—Designs, Materials, Casting Methods and Cylinder Bore Surface Technologies for Light Weight Passenger-Car Engines; Springer: New York, NY, USA, 2009. [Google Scholar]
  7. Su, J.F.; Nie, X.; Hu, H.; Tjong, J. Friction and counterface wear influenced by surface profiles of plasma electrolytic oxidation coatings on an aluminum A356 alloy. J. Vac. Sci. Technol. 2012, 30, 061402. [Google Scholar]
  8. Lenny, J. Replacing the Cast Iron Liners for Aluminum Engine Cylinder Blocks: A Comparative Assessment of Potential Candidates; Graduate Faculty of Rensselaer Polytechnic Institute: Hartford, CT, USA, 2011. [Google Scholar]
  9. Wuest, G.; Barbezat, G.; Keller, S. The key advantages of the plasma-powder spray process for the thermal spray coating of cylinder bores in automotive industry. SAE Int. Congr. Expo. 1997, 106, 33–43. [Google Scholar] [CrossRef]
  10. Fauchais, P.L.; Heberlein, J.V.R.; Boulos, M.I. Thermal Spray Fundamentals: From Powder to Part; Springer Science & Business Media: Boston, MA, USA, 2014. [Google Scholar]
  11. Darut, G.; Liao, H.; Coddet, C.; Bordes, J.; Diaby, M. Steel coating application for engine block bores by Plasma Transferred Wire Arc spraying process. Surf. Coat. Technol. 2015, 268, 115–122. [Google Scholar]
  12. Bobzin, K.; Ernst, F.; Richardt, K.; Schlaefer, T.; Verpoort, C.; Flores, G. Thermal spraying of cylinder bores with the Plasma Transferred Wire Arc process. Surf. Coat. Technol. 2008, 202, 4438–4443. [Google Scholar]
  13. Krishna, L.R.; Somaraju, K.R.C.; Sundararajan, G. The tribological performance of ultra-hard ceramic composite coatings obtained through microarc oxidation. Surf. Coat. Technol. 2003, 163–164, 484–490. [Google Scholar]
  14. Bahramian, N.; Kianfar, S.; Stroh, J.; Sediako, D.; Tjong, J. An investigation of the microstructure and oil retention of electrolytic jet plasma oxidation (EJPO) coating. Miner. Met. Mater. Soc. 2002, 121, 629–638. [Google Scholar]
  15. Fanga, C.; Meng, X.; Kong, X.; Zhao, B.; Huang, H. Transient tribo-dynamics analysis and friction loss evaluation of piston during cold- and warm-start of a SI engine. Int. J. Mech. Sci. 2017, 133, 767–787. [Google Scholar]
  16. Forero, J.D.; Ochoa, G.V.; Alvarado, W.P. Study of the piston secondary movement on the tribological performance of a single cylinder low-displacement diesel engine. Lubricants 2020, 8, 80–97. [Google Scholar] [CrossRef]
  17. Morris, N.; Rahmani, R.; Rahnejat, H.; King, P.D.; Fitzsimons, B. Tribology of piston compression ring conjunction under transient thermal mixed regime of lubrication. Tribol. Int. 2013, 59, 248–258. [Google Scholar]
  18. Usman, A.; Park, C.W. Numerical investigation of frictional behavior and energy loss in mixed-hydrodynamic contact of piston ring pack with deformed cylinder liner during warm-up period of SI-engine. Energy Convers. Manag. 2016, 117, 115–131. [Google Scholar]
  19. Abril, S.O.; Rojas, J.P.; Flórez, E.N. Numerical methodology for determining the energy losses in auxiliary systems and friction processes applied to low displacement diesel engines. Lubricants 2020, 8, 103. [Google Scholar] [CrossRef]
  20. ASTM G133-22; Standard Test Method for Linearly Reciprocating Ball-on-Flat Sliding Wear. ASTM International: West Conshohocken, PA, USA, 2022.
  21. ASTM G181-21; Standard Test Method for Conducting Friction Tests of Piston Ring and Cylinder Liner Materials Under Lubricated Conditions. ASTM International: West Conshohocken, PA, USA, 2021.
  22. Duronio, F.; Vita, A.D.; Montanaro, A.; Villante, C. Gasoline direct injection engines—A review of latest technologies and trends. Fuel 2020, 265, 116947. [Google Scholar]
  23. Hartfield-Wunsch, S.E.; Tung, S.; Rivard, C. Development of a bench wear test for the evaluation of engine cylinder components. SAE Trans. 1993, 1131–1138. [Google Scholar] [CrossRef]
  24. Hutchings, I.; Shipway, P. Tribology: Friction and Wear of Engineering Materials; Butterworth-Heinemann: Oxford, UK, 1992. [Google Scholar]
  25. ASTM G99-17; Standard Test Method for Wear Testing with a Pin-on-Disk Apparatus. ASTM International: West Conshohocken, PA, USA, 2023.
  26. Totaro, P.P.; Westerfield, Z.; Tian, T. Introducing a new piston skirt profile to reduce engine friction. In Proceedings of the SAE 2016 World Congress and Exhibition, Detroit, MI, USA, 12–14 April 2016; SAE International Technical Paper. [Google Scholar]
  27. Sedlaček, M.; Podgornik, B.; Vižintin, J. Correlation between standard roughness parameters skewness and kurtosis and tribological behaviour of contact surfaces. Tribol. Int. 2012, 48, 102–112. [Google Scholar]
  28. Pawlus, P.; Reizer, R.; Wieczorowsk, M. Functional importance of surface texture parameters. Materials 2021, 14, 5326. [Google Scholar] [CrossRef]
  29. Yan, X.-L.; Wang, X.-L.; Zhang, Y.-Y. Influence of roughness parameters skewness and kurtosis on fatigue life under mixed hydrodynamic lubrication point contact. J. Tribol. 2014, 136, 50–62. [Google Scholar]
  30. Archard, J.F. Contact and rubbing of flat surfaces. J. Appl. Phys. 1953, 24, 981–988. [Google Scholar]
  31. Aslantas, K.; Hasçelik, A.; Erçetin, A.; Danish, M.; Alatrushi, L.K.H.; Rubaiee, S.; Bin Mahfouz, A. Effect of cutting conditions on tool wear and wear mechanism in micro-milling of additively manufactured titanium alloy. Tribol. Int. 2024, 193, 109340. [Google Scholar] [CrossRef]
  32. Kragelskii, I.; Mikhin, N.; Myshkin, N.; Bronovets, M.A.; Dobychin, M.N.; Dubnyakov, V.N.; Litvinov, V.N. The mechanism of the initial stage of selective transfer during frictional contact. Wear 1978, 47, 133–138. [Google Scholar] [CrossRef]
  33. Kumar, T.; Raghu, R.; Thankachan, T.; Čep, R.; Kalita, K. Mechanical property analysis and dry sand three-body abrasive wear behaviour of AZ31/ZrO2 composites produced by stir casting. Sci. Rep. 2024, 14, 1543. [Google Scholar] [CrossRef]
  34. Wopelka, T.; Cihak-Bayr, U.; Lenauer, C.; Ditrói, F.; Takács, S.; Sequard-Base, J.; Jech, M. Wear of different material pairings for the cylinder liner—Piston ring contact. Ind. Lubr. Tribol. 2018, 70, 687–699. [Google Scholar] [CrossRef]
  35. Curran, J.; Kalkancı, H.; Magurova, Y.; Clyne, T. Mullite-rich plasma electrolytic oxide coatings for thermal barrier applications. Surf. Coat. Technol. 2007, 201, 8633–8687. [Google Scholar] [CrossRef]
  36. Ford Motor Company. Power Cylinder Friction Reduction and Through Coatings, Surface Finish and Design; Ford Motor Company: Dearborn, MI, USA, 2021. [Google Scholar]
Figure 1. (a) Schematic arrangement of the novel experimental apparatus. (b) Normal load fluctuations during unlubricated friction tests.
Metals 15 00370 g001
Figure 2. Validation test profile readings at (a) 3 N, (b) 5 N, (c) 10 N, and (d) 20 N loads for both of the wear testing apparatuses.
Metals 15 00370 g002
Figure 3. Comparison of wear volumes at different applied loads for the tribometers.
Metals 15 00370 g003
Figure 4. (a) SEM micrograph of the surface topography of the PTWA and (b) EJPO plasma-based engine cylinder coatings.
Metals 15 00370 g004
Figure 5. (a) 10 mm CrN-coated CI piston ring segment. (b) Unworn coated engine cylinder samples. (c) Samples cut from V8 Ford EJPO-coated engine block.
Metals 15 00370 g005
Figure 6. Laser interferometry to determine the oil film thickness. Each colored line denotes the measurement path for oil film thickness. The measurements were recorded at an identical distance from the centerline on both cylindrical cross-section samples.
Metals 15 00370 g006
Figure 7. Minimum oil film thickness between tribo-pairs at different applied loads.
Metals 15 00370 g007
Figure 8. Surface profile measured along the stroke at the center of the wear track.
Metals 15 00370 g008
Figure 9. Profile data of unworn EJPO And PTWA-coated specimen samples.
Metals 15 00370 g009
Figure 10. Schematic diagram depicting the effect of skewness and kurtosis on friction.
Metals 15 00370 g010
Figure 11. Evolution of surface roughness parameters during the wear tests. (a) RMS roughness average, (b) kurtosis, and (c) skewness.
Metals 15 00370 g011
Figure 12. (a) 2D-Profilogram depicting wear for 100 N load at varying sliding distances. (b) Calculated wear rate based on the planimetric wear area acquired from the wear profile at different sliding distances at 100 N load.
Metals 15 00370 g012
Figure 13. 2D-Profilogram depicting wear caused by variation of applied load at constant sliding distances.
Metals 15 00370 g013
Figure 14. Wear rates plot for EJPO- and PTWA-coated cylinder bore specimens.
Metals 15 00370 g014
Figure 15. SEM micrographs showing three-body abrasive wear mechanism at 165 N load, 3000 m duration tests on the (a) PTWA sample and (b) EJPO sample.
Metals 15 00370 g015
Figure 16. SEM micrographs to demonstrate wear propagation on the (a) PTWA sample and (b) EJPO sample.
Metals 15 00370 g016
Figure 17. Porosity evolution during wear tests with 101 N normal load.
Metals 15 00370 g017
Table 1. Operating parameters for the comparative analysis of wear testing devices.
ParametersValue
Normal Load (N)3, 5, 10, and 20
Initial Contact Pressure (MPa)10.42, 13.23, 17.09, and 32.68
Final Contact Pressure (MPa)2.22, 2.40, 2.94, and 3.76
Frequency (Hz)4
Sliding Distance (m)50
Stroke Length (m)0.01
Oscillation Speed (m/s)0.08
MaterialAlloy 61S (flat sample specimen) and 100Cr6 (6 mm diameter)
Temperature (°C)21–23
Composite Roughness (nm)241–383
Relative Humidity (%)16.1–17.4
Lubrication RegimeDry
Table 2. Commercial profilometry specifications.
Profilometry LabelsValue
Measurement TypeHills and Valleys
Scan Duration30 s
Scan Length4000 μm
Stylus Orientation90°
Stylus Force10 mg
Stylus TypeRadius: 12 μm
Table 3. Comparison of wear volume data obtained for validation of custom-made device.
TribometerLoads
(N)
Mean
(mm3)
SD
(mm3)
±95% Confidence IntervalMax
(mm3)
Min
(mm3)
COV
(%)
Standard
(AP)
3 N0.430.010.020.440.422.33
5 N0.740.020.030.750.732.34
10 N3.100.050.083.143.061.65
20 N6.510.030.046.536.490.41
Custom
(HPPM)
3 N0.690.010.020.700.681.45
5 N0.950.010.020.960.941.05
10 N3.100.080.123.163.042.52
20 N6.590.040.076.626.550.63
Table 4. Line readings taken on the laser interferometer.
Coated
Samples
Oil Film Thickness Measurement Readings (µm)
1234567MeanSD
PTWA0.9770.9680.9770.9770.9810.9680.8630.9590.0393
EJPO0.9680.9771.1641.0551.0230.9970.9681.0220.0652
Table 5. Operating parameters for the PRCL wear test.
ParametersValue
Normal Loads (N)50, 100, 165
Nominal Contact Pressure (MPa)3.72, 8.44, 13.8
Contact Area (mm2)13.4, 11.9, 12.1
Frequency (Hz)5
Sliding Distances (m)500, 100, 3000
Composite Surface Roughness of Cylinder Sample and Piston Ring (µm)1.72 (PTWA), 1.97 (EJPO)
Stroke Length (m)0.01
MaterialCoated engine bore sample (stationary) and piston ring segment (oscillating)
Initial Temperature (°C)22 ± 1
Lubrication RegimeBoundary lubrication
Relative Humidity (%)14.5–16
Oscillation Speed (m/s)0.10
Test Duration (min)100, 200, 600
Table 6. Initial surface roughness parameters of the coated-cylinder samples (average of five profile readings).
CoatingRq (µm)Rv (µm)Ra (µm)RkuRsk
PTWA0.75 ± 0.267.60 ± 2.30.53 ± 1.0424.34 ± 0.65−3.59 ± 0.45
EJPO2.87 ± 0.3519.60 ± 1.41.92 ± 0.4216.74 ± 0.51−4.10 ± 0.35
Table 7. Statistical significance of wear rate data.
Coated Bore SampleSliding Distance (m)S.D.The Margin of Error (95% CI)
EJPO5003.78 × 10−10±2.49%
10003.51 × 10−10 ±3.69%
30002.19 × 10−10 ±3.20%
PTWA5006.11 × 10−10 ±3.70%
10002.51 × 10−10 ±2.23%
30002.41 × 10−10±3.08%
Disclaimer/Publisher’s Note: The statements, opinions and data contained in all publications are solely those of the individual author(s) and contributor(s) and not of MDPI and/or the editor(s). MDPI and/or the editor(s) disclaim responsibility for any injury to people or property resulting from any ideas, methods, instructions or products referred to in the content.

