Abstract
A solid solution of rare-earth atoms in the iron matrix is a prerequisite for the microalloying effect in steels. However, to date, there has been considerable controversy regarding whether rare-earth atoms can form solid solutions within the iron matrix. Here, the effect of mixing entropy (Smix) on the solid solubility of the rare-earth element lanthanum in Fe alloys was quantitatively analyzed using the non-aqueous solution electrolysis method. The results indicate that the solid solubility of lanthanum in Fe alloys increases with an increase in mixing entropy. Meanwhile, the thermodynamic essence of the formation of the solid solution was analyzed via the combination of first-principles calculation, thermodynamic analysis, and microstructure analysis.
1. Introduction
Rare-earth elements play crucial roles in the advancement of modern materials science and engineering, and they also represent important research directions in this field [1,2,3,4,5,6]. The applications of rare-earth elements in the domain of steel materials are also extensive. Dong’s team studied the effect of rare-earth microalloying on the hydrogen embrittlement sensitivity of Fe-18Mn-0.6C TWIP steel using increasing linear stress tests, with the results showing that the addition of trace rare-earth elements (La, Ce, mixed rare-earth) reduced the influence range and brittleness characteristics of hydrogen and changed the full brittleness fracture into a partial ductile fracture [7]. Kang et al. investigated the effect of lanthanum on the modifying inclusions in steel, finding that one of the most effective ways to refine spheroid inclusions was by adding lanthanum to the molten steel [8]. The addition of rare-earth elements can effectively decrease the levels of oxygen and sulfur in steels, due to their strong affinity towards the abovementioned elements [9,10]. Guo and his co-workers reported that rare-earth elements can promote grain refinement and further enhance the hot ductility of reactor pressure vessel steels due to grain boundary segregation [11]. After extensive research, the primary roles of rare-earth elements in steels can be summarized as purifying liquid steels, modifying inclusions, grain refinement, and microalloying effects.
The mechanisms of molten steel purification and inclusion modification by rare-earth elements have been researched relatively extensively [12,13]. The mechanisms of grain refinement can be summarized into two paths: The first is that rare-earth elements transform into inclusions with high melting points and specific crystal orientation relationships within the steel matrix. As a result, the grains are refined via heterogeneous nucleation particles, which can improve the nucleation rate [14,15]. The second is that rare-earth atoms can change the distribution behavior of solute atoms at the solid–liquid interface during solidification, thus refining the grains [4,16]. As yet, there is still no unified understanding of the microalloying effects of rare-earth elements in steel. This is primarily because the significantly larger atomic radius of rare-earth elements, compared to that of iron, leads to the high positive enthalpy of the solution in the iron matrix [17]. According to the laws of thermodynamics, positive mixing enthalpies indicate that extra energy is needed for the solid solution process due to the larger atomic radius of rare-earth elements. Therefore, the more positive the enthalpy of mixing, the more difficult the formation of a solid solution. Moreover, due to their high chemical reactivity, rare-earth elements readily react with oxygen and sulfur in molten steel to form inclusions, further limiting their ability to form solid solutions in steels [18,19,20]. Hence, a large number of studies have not addressed the problem of the solid solution of rare-earth elements in steels [21,22,23,24,25], despite the fact that a solid solution of rare-earth atoms in the iron matrix is a prerequisite for the microalloying effect in steels. As a result, this issue must be studied in detail before researching the microalloying mechanisms of rare-earth elements in steels.
According to the Gibbs free energy change formula, the thermodynamic criterion for determining whether solute atoms can dissolve in the solvent lattice is the change in Gibbs free energy that results from the dissolution of the solute atom. This change indicates the system’s tendency to achieve a more thermodynamically stable state, thereby offering a basis for evaluating the solubility of the solute within the solvent lattice [26,27]. Due to the low mixing entropy of the steel composition system (primarily composed of iron), during the dissolution process, steels with different mixing entropies are heated to the same temperature. Consequently, the change in the free energy of dissolution is primarily determined by the enthalpy change that occurs. In fact, the effect of mixing entropy on the formation of solid solutions is usually ignored, as its contribution to the total Gibbs free energy change is relatively small. However, the effect of mixing entropy on the free energy cannot be ignored when the component contents of the alloy are high, such as in high-alloy steels, high-entropy alloys, and other multi-component alloys. In this work, we found that the solid solubility of lanthanum in Fe alloys increases with the increase in the mixing entropy of the Fe alloy’s composition system. In other words, lanthanum atoms are more soluble in Fe alloys that have a higher alloy content. The mechanism of this phenomenon is discussed in this work. The purpose of this study is to provide a reference method for the prediction of the solid solubility of rare-earth elements in steels. The scientific results are expected to provide a theoretical reference for composition design in the research and development of steel products containing rare-earth elements.
2. Experimental Section
2.1. Sample Preparation
Ingots were prepared using medium-frequency induction melting in a vacuum environment. The capacity of the melting furnace was 30 kg, and four 25 kg experimental Fe alloy ingots were melted. Subsequently, the melts were poured into the casting mold, which was made of cast iron, and the ingots were left to cool in the furnace chamber. The pressure used in the vacuum induction melting (VIM) process was 10−1–10−2 Pa. Since La has a strong tendency to evaporate and has high chemical activity, a 30% La-Fe alloy was added into the melt. In addition, the yield of La was approximately 40%. The La-Fe alloy was added to the melts about 5 minutes before the pouring process via the stock bin of the VIM apparatus. The chemical compositions and mixing entropies (calculated using Equation (1) [28]) of the experimental Fe alloys are listed in Table 1. The cast ingots were homogenized at 1523 K for 6 h, followed by ice brine cooling.
where R is the gas constant, n is the number of alloying elements, and ci is the atomic percentage of the alloying element.

Table 1.
Chemical compositions of the experimental Fe alloys (wt%).
2.2. Solid Solubility Measurement
Cylindrical specimens of Φ10 × 100 mm in size were wire-electro-discharge-machined from the four homogenized ingots. After polishing the surface of the specimens, the pre-electrolysis process was carried out in 5% KCl + 0.5% C6H8O7 aqueous solution at room temperature for 25 min. Subsequently, the specimens were electrolyzed in 2% LiCl + 2% C6H15NO3 + 0.5% (CH2OH)2 + 1.5% C6H6 + 0.2% C13H13N3 ethanol solution at 258–263 K for 50 min. This low-temperature electrolysis process is generally defined as the non-aqueous solution electrolysis method, and it allows the solid solution atoms to be placed into the electrolyte solution [9]. The second-phase particles of the Fe alloys were separated from the matrix as sediments in the electrolyte solution. After suction filtration, evaporation, hydrochloric acid dissolution, and fixing the volume of the volumetric bottles, the concentration of lanthanum ions in the solutions was measured using an inductively coupled plasma source mass spectrometer (ICP-MS)(PerkinElmer, Waltham, Mass, USA). The solid solubility was calculated using Equation (2):
where w (ppm) is the solid solubility of lanthanum, C is the concentration of La3+ (ng/mL) in the solution, V (mL) is the volume of the volumetric bottle, and M1 and M2 (g) are the mass of the alloy specimen before and after the electrolysis process, respectively.
Subsequently, the ratio of the solid solubility to the total content was calculated using Equation (3):
where Rw (%) is the solid solution ratio of rare-earth La, w (ppm) is the solid solubility of lanthanum, and W is the total content of rare-earth La (%) (Table 1).
2.3. Microstructural Characterization
The morphologies and elemental compositions of the inclusions were characterized using a Zeiss Sigma 300 field-emission scanning electron microscope (SEM, Carl Zeiss AG, Jena, Germany) coupled with an Oxford X-MaxN energy-dispersive spectrometer (EDS, Oxford Instruments, Abingdon, UK). The crystal structures were identified using a Rigaku smartlab-9 kW X-ray diffractometer (XRD, Cu-Kα radiation, Rigaku Corporation, Tokyo, Japan) at a scanning rate of 4°/min and a scanning 2θ range of 10–100°. The grain size distributions were observed and analyzed via the above SEM with an Oxford Symmetry electron backscatter diffraction (EBSD, Oxford Instruments, Kidlington, Oxfordshire, UK) instrument. The grain sizes and micro-strains were detected using the above XRD, with a step of 0.02° from 20° to 100°.
2.4. Computational Details
The solvation energies of the solid solution atoms were calculated using the first-principles calculation method, which is based on density functional theory (DFT). In the calculation, the interaction between valence electrons and ions was modeled using the Projector Augmented Wave (PAW) method, while the exchange–correlation interaction between electrons was described using the Perdew–Burke–Ernzerhof (PBE) function within the framework of Generalized Gradient Approximation (GGA) [29]. The plane-wave cutoff energy was set to 450 eV, and Brillouin zone integration used a Monkhorst–Pack k-points grid of 4 × 4 × 4 [30]. The energy tolerance of each electronic self-consistent cycle and force convergence threshold was ruled as 1.0 × 10⁻⁶ eV/atom and 0.02 eV/Å, respectively. In addition, the Gibbs free energy changes in the solid solution processes were calculated based on Miedema’s model [31].
3. Results and Discussion
3.1. Solid Solubility of Lanthanum in Fe Alloys
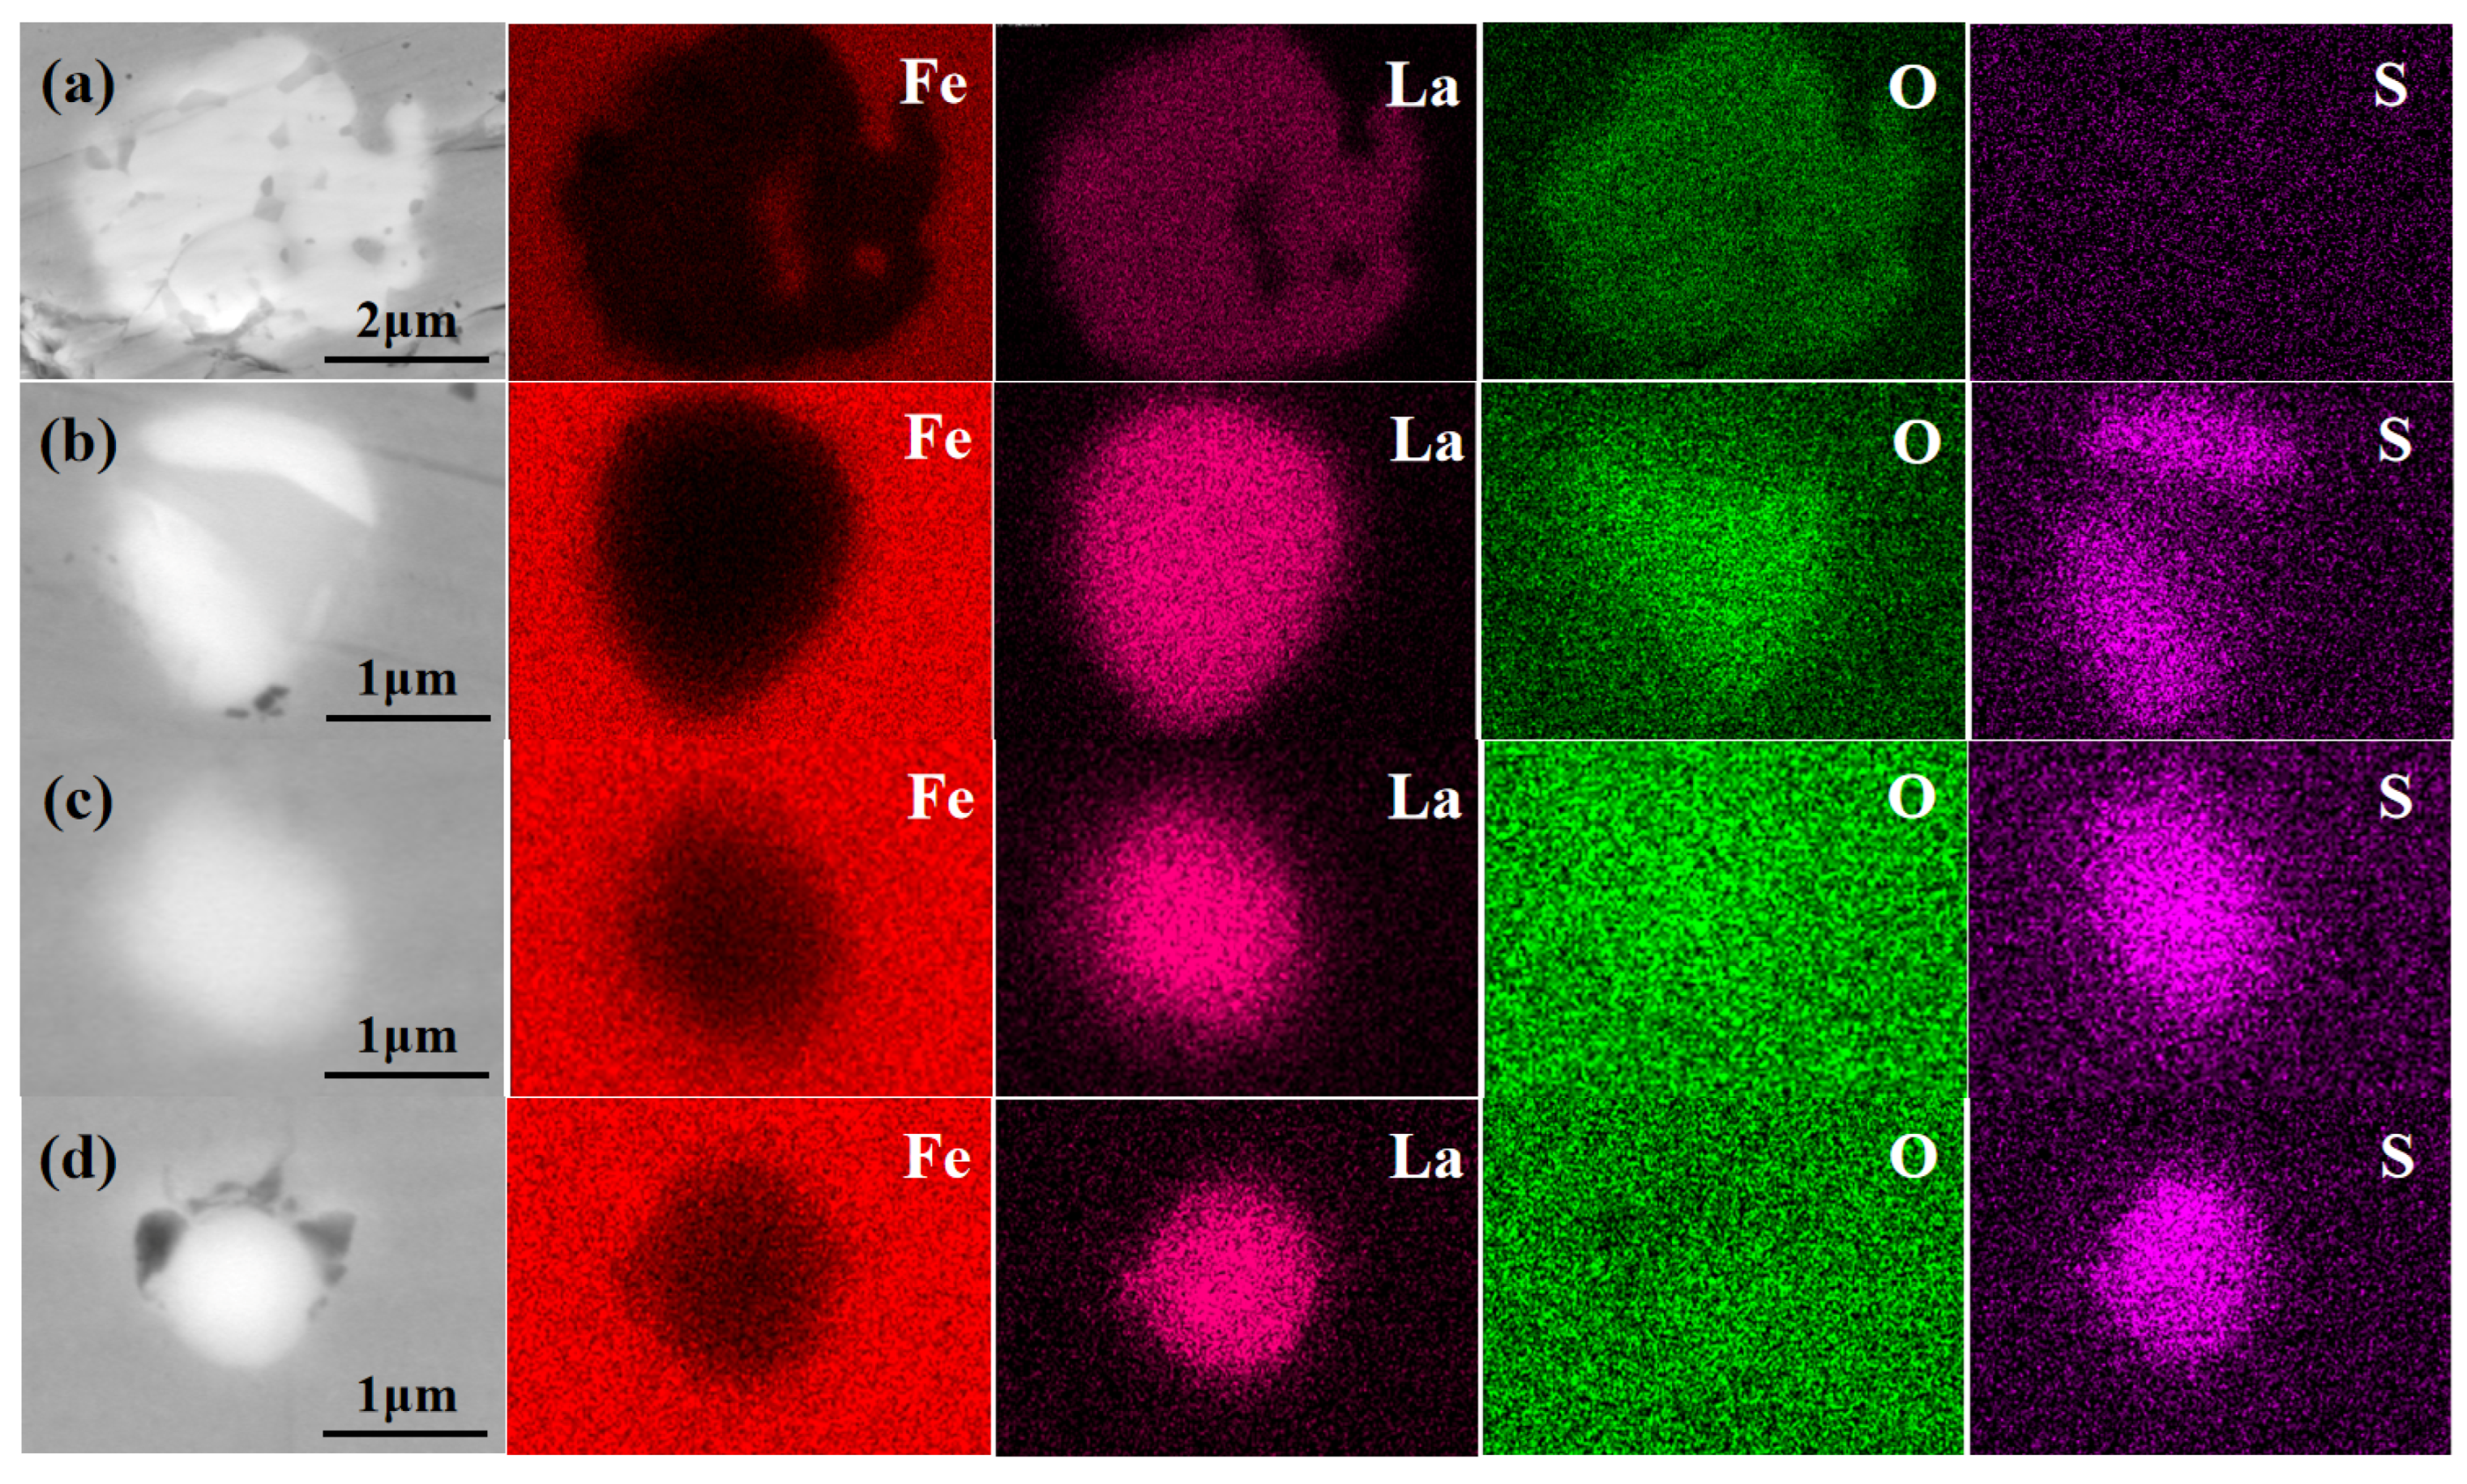
The solid solubility of lanthanum in the Fe alloys was calculated using Equation (2). In addition, the ratios between the solid solubility and the total content of lanthanum (solid solution rate, Rw) were also acquired. The results are listed in Table 2. The solid solubility of lanthanum in the four Fe alloys was 11.61 ppm, 14.34 ppm, 29.06 ppm, and 37.05 ppm, respectively. Meanwhile, the solid solution rates increased from 3.74% to 12.35% with the increase in mixing entropy. This shows that it is easier for lanthanum atoms to solidly dissolve in the iron matrix when the mixing entropy of the Fe alloy is higher. Most of the lanthanum formed inclusions of lanthanum sulfur oxide in the Fe alloys, as shown in Figure 1. These sources of sulfur and oxygen are the raw materials used in the Fe alloy production process. Even with the use of high-purity raw materials, trace amounts of sulfur and oxygen may still be present as impurities. Meanwhile, the chemical stoichiometry and detailed crystal structure formations of these inclusions are primarily La₂O₃ (hexagonal; a = b = 3.93 Å, c = 6.11 Å; α = β = 90° ≠ γ = 120°), La₂O₂S (hexagonal; a = 4.04 Å, c = 6.91 Å), and La2S3 (orthorhombic; a = 7.67 Å, b = 4.22Å, c = 15.95Å; α = β = γ = 90°).
Table 2.
Results of the solid solubility of lanthanum in the Fe alloys.

Figure 1.
Inclusions containing lanthanum in the Fe alloys: (a) No.1; (b) No.2; (c) No.3; (d) No.4.
3.2. Crystal Structures of Fe Alloys
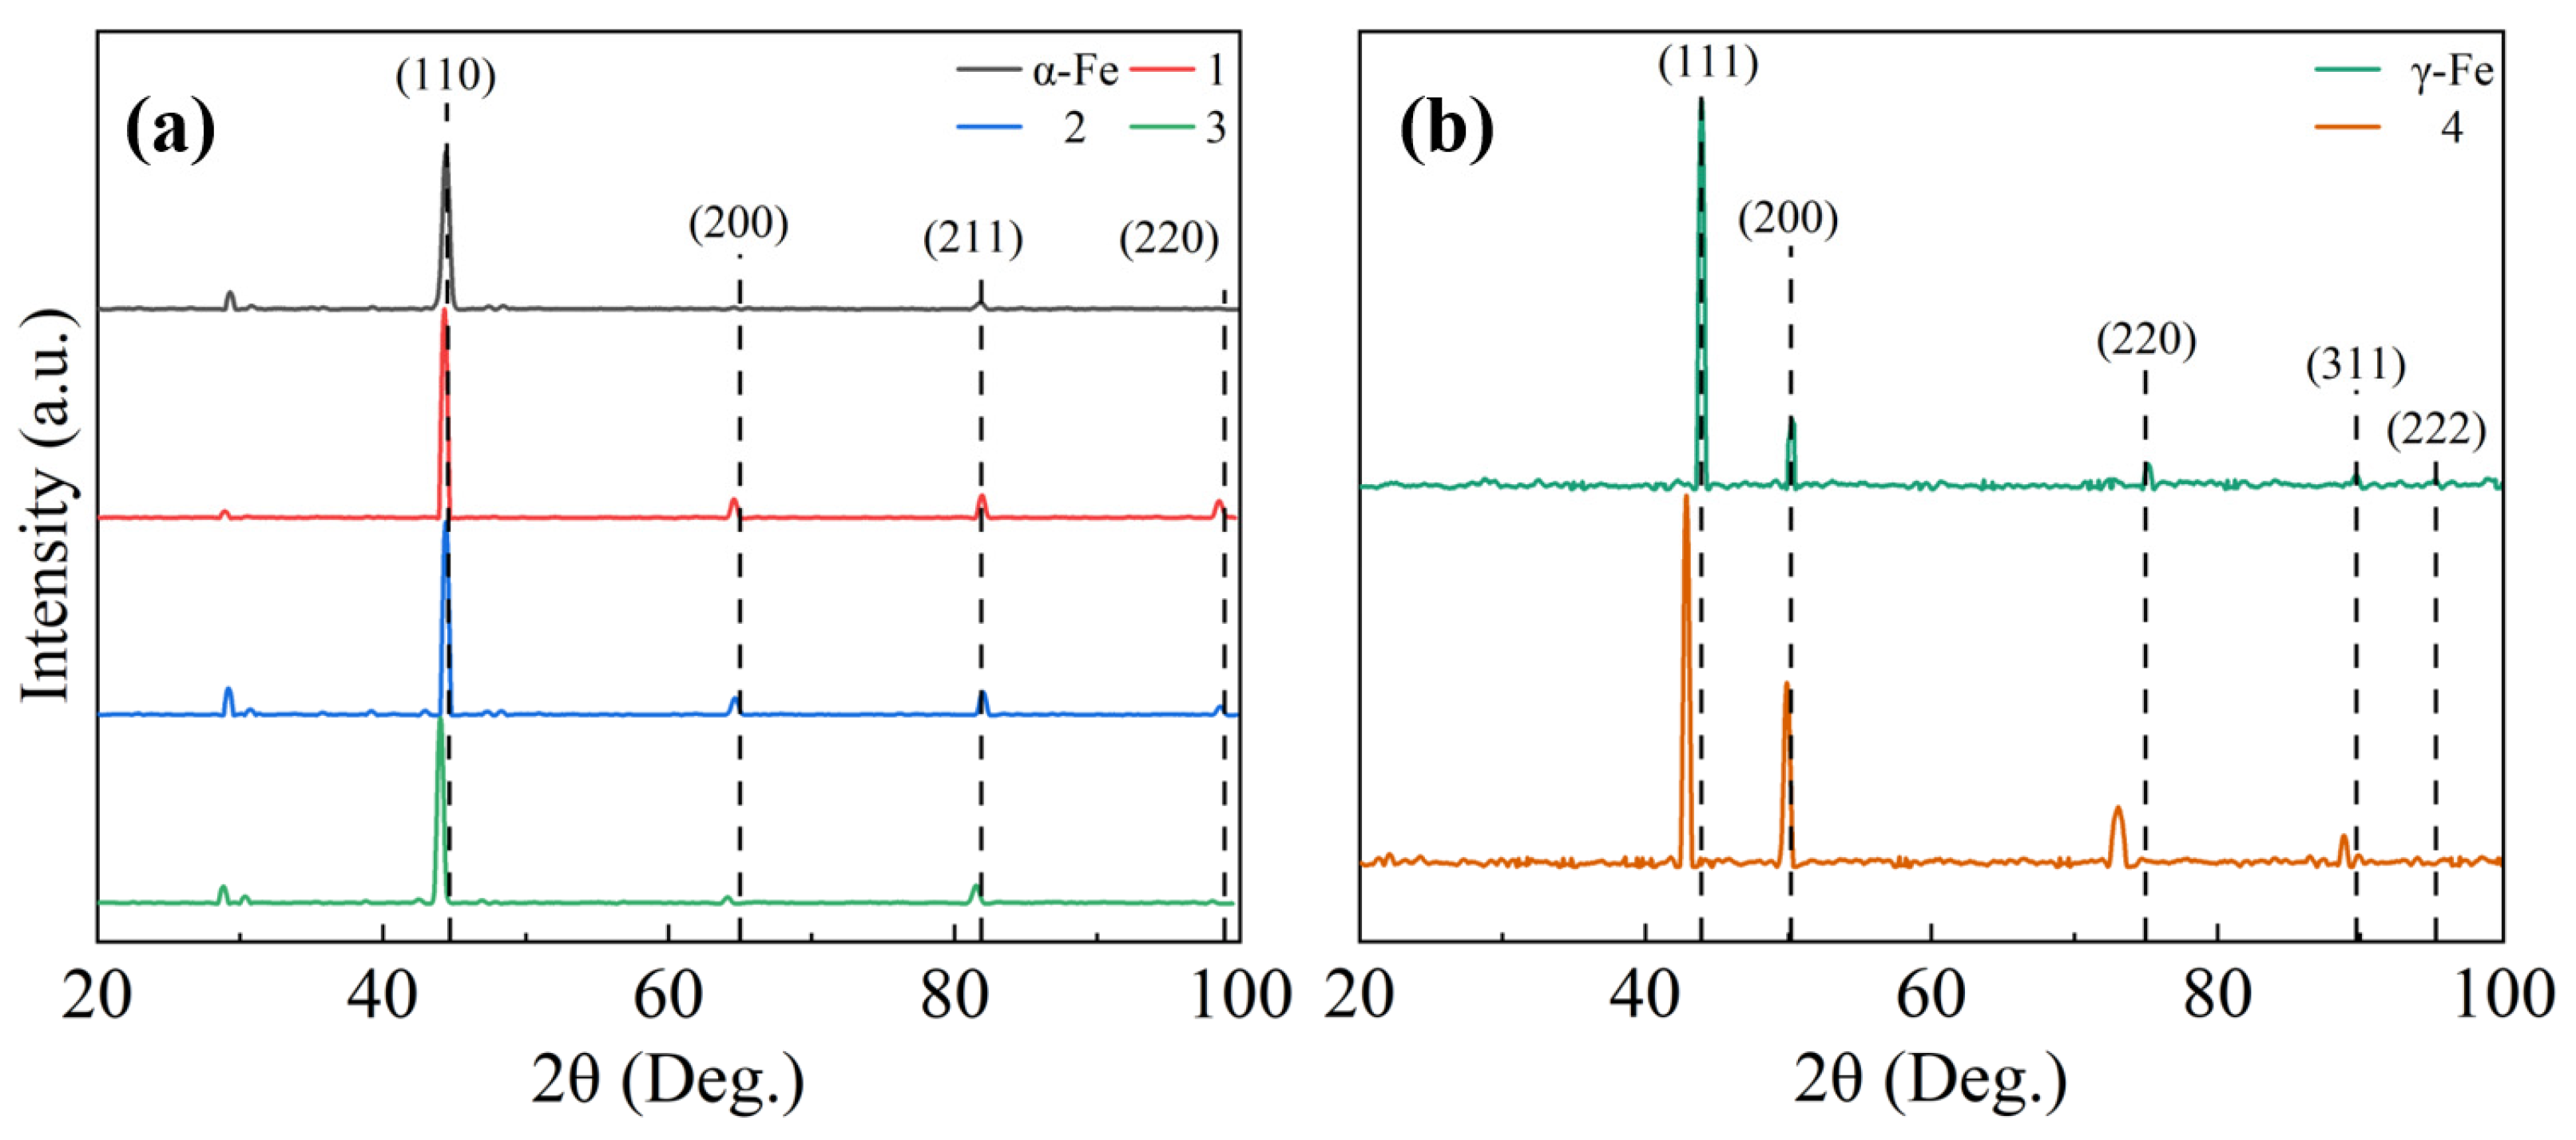
Figure 2 demonstrates the XRD patterns of the pure iron and the four experimental Fe alloys. The matrices of No.1, No.2, No.3, and pure iron at room temperature (RT) are all α-ferrite (α-Fe) with a body-centered cubic (BCC) structure; however, the diffraction peaks shift to the low angles with the increase in the mixing entropy, as shown in Figure 2a. As the matrix of the No.4 experimental Fe alloy is austenite (γ-Fe) with a face-centered cubic (FCC) structure, the crystal structures of the pure iron and the No.4 experimental Fe alloy were detected at 1273 K using high-temperature in situ XRD. Compared with the XRD patterns of the two specimens, the diffraction peaks of the No.4 experimental Fe alloy noticeably shifted to the low angles, as displayed in Figure 2b. The lattice parameter of a cubic structure can be determined using the following equation:
where (h k l) are the Miller indices and d is the spacing between the lattice planes, which can be calculated using the Bragg law [28]:
where n is the reflection series, λ is the wavelength of incident radiation, d is the lattice spacing, and θ is the diffraction angle.

Figure 2.
XRD patterns of the specimens: (a) α-Fe and experimental Fe alloys No.1, No.2, and No.3; (b) γ-Fe and experimental Fe alloy No.4 at 1273 K.
The lattice parameters of the pure iron and the four experimental Fe alloys were calculated using the Nelson–Riley extrapolation method and the least-squares approach [32,33]. The Nelson–Riley extrapolation equation can be expressed as follows:
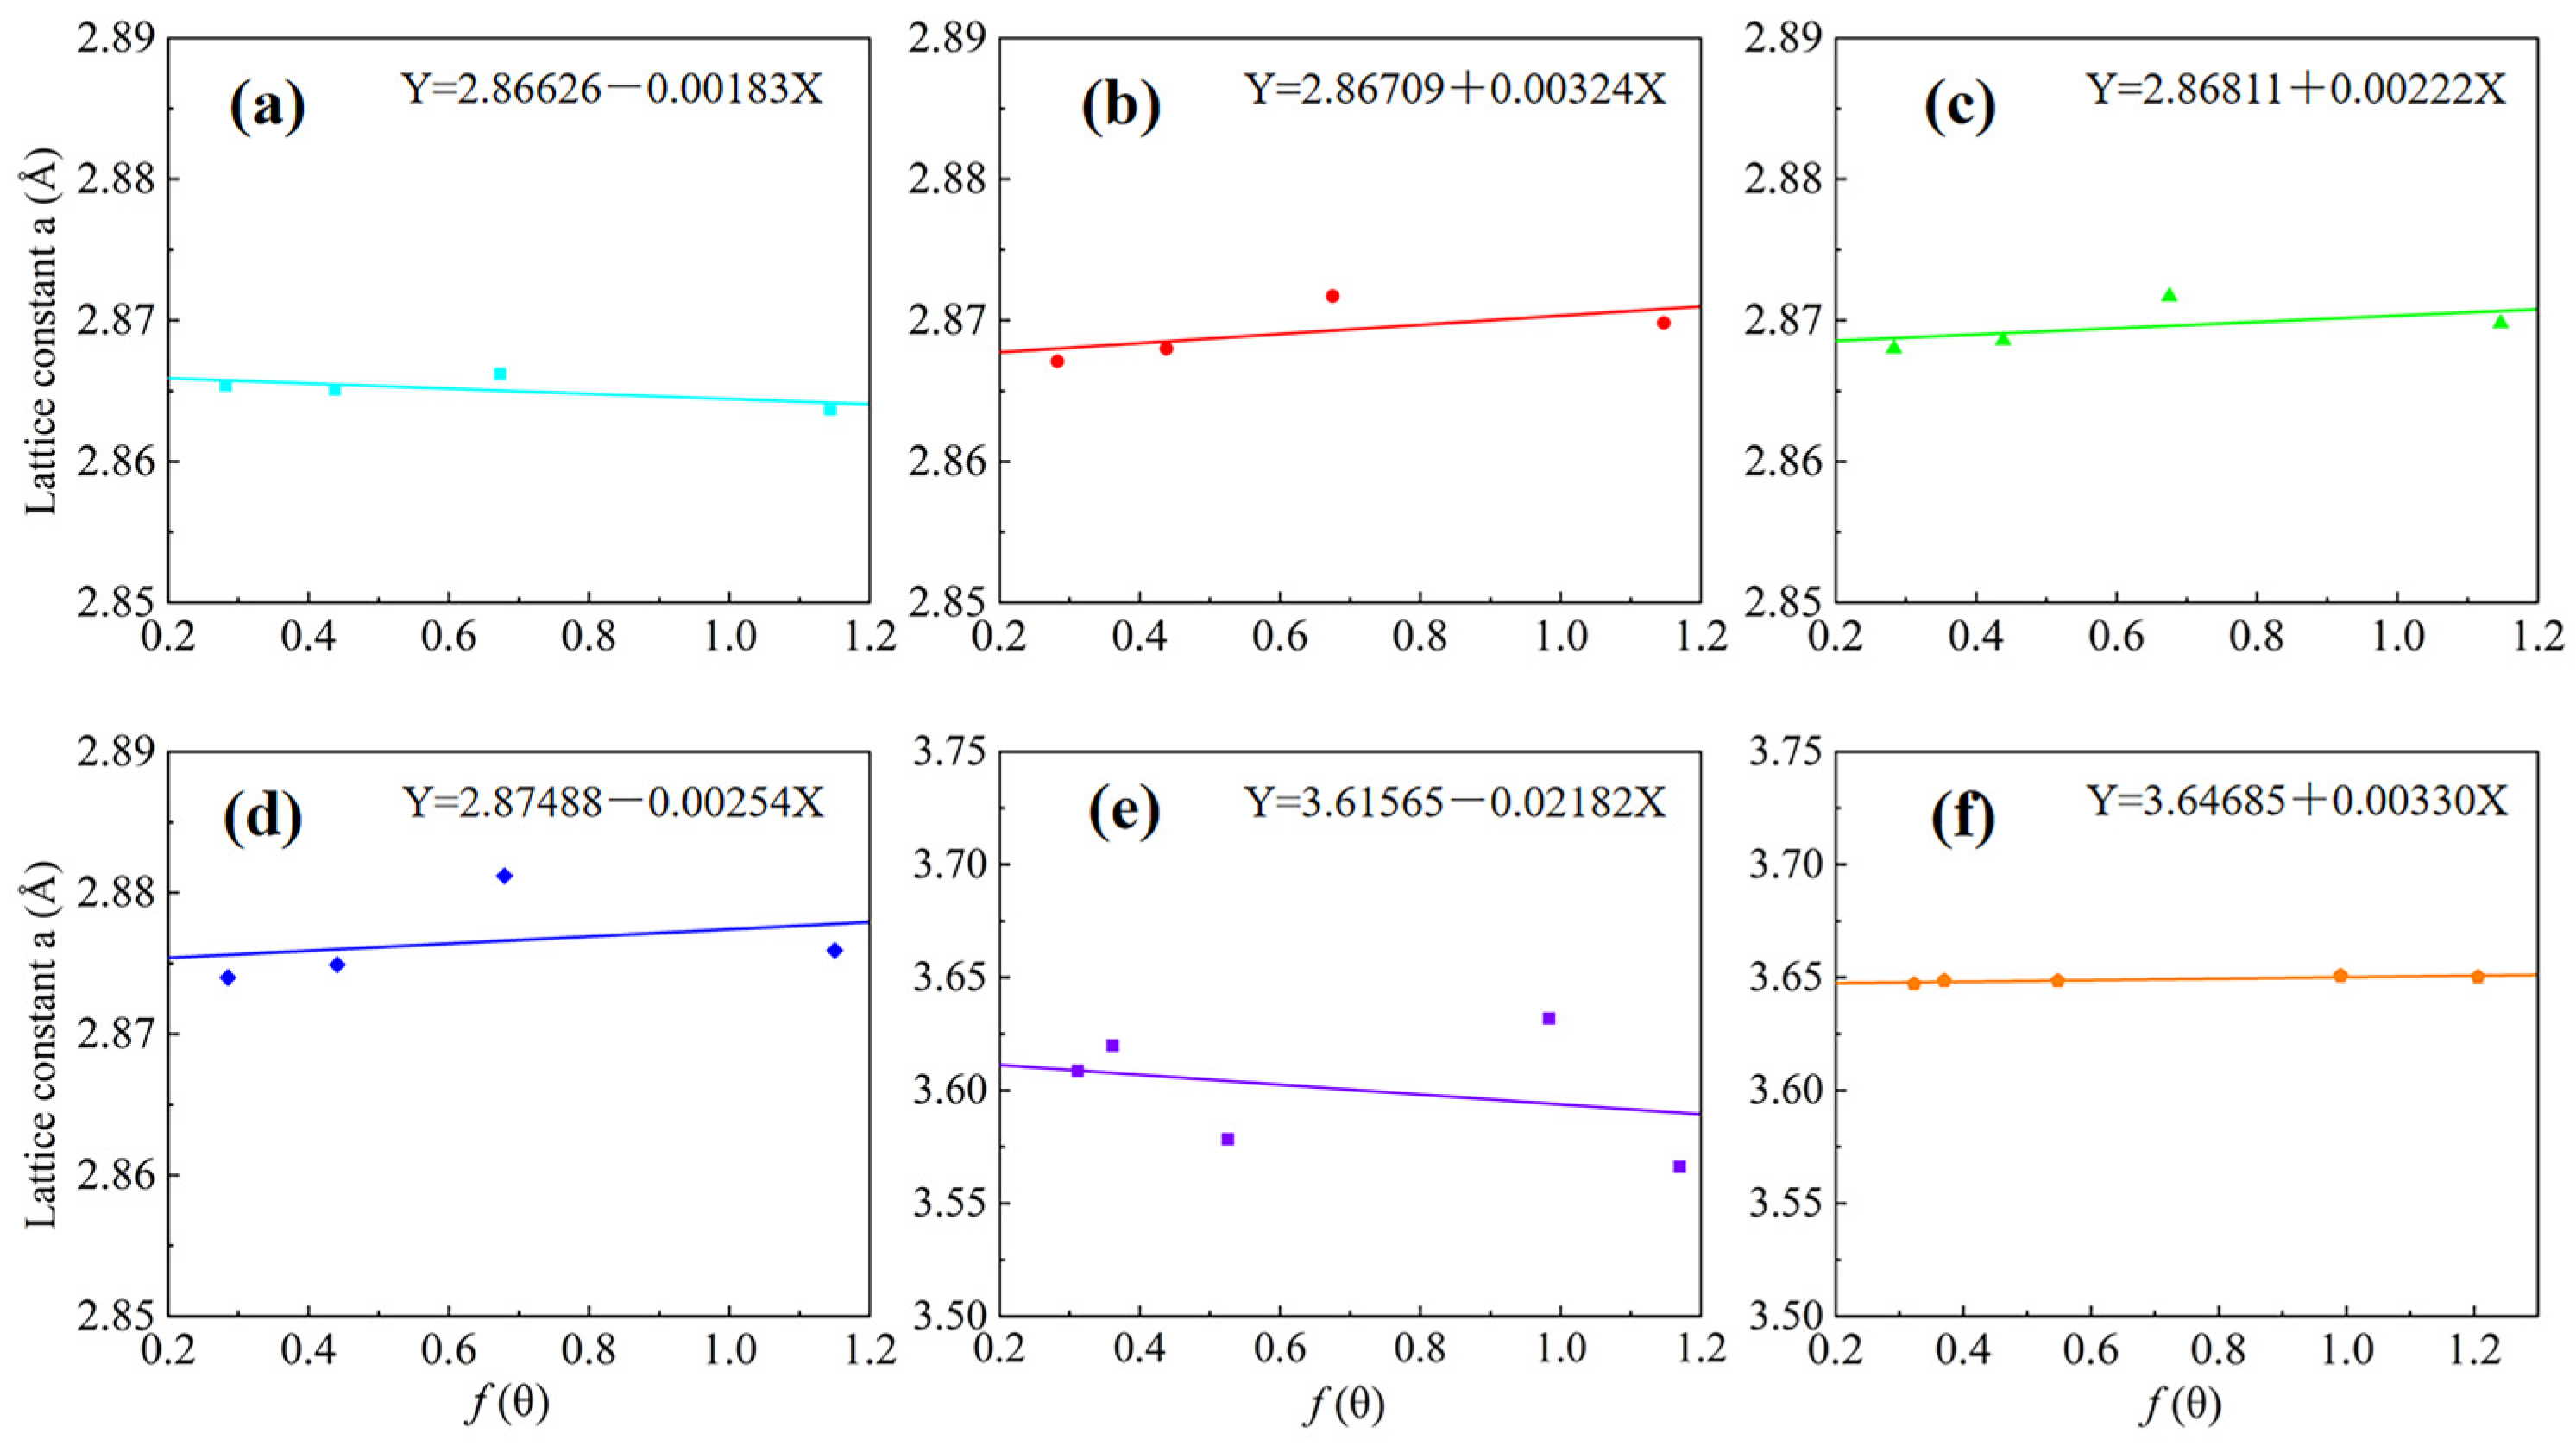
The lattice parameters of the pure iron and experimental Fe alloys in the above extrapolation function are listed in Table 3. Subsequently, the corrected value of the lattice parameter “a” was obtained by extrapolating the plot to θ = 90°, as shown in Figure 3. The lattice parameters of the pure iron and experimental Fe alloys No.1, No.2, and No.3 at room temperature were 2.86626 Å, 2.86709 Å, 2.86811 Å, and 2.87488 Å, respectively. Meanwhile, the lattice parameters of the pure iron and experimental Fe alloy No.4 at 1273 K were 3.61565 Å and 3.64685 Å, respectively. These results indicate that, as the mixing entropy increases, more large atoms, specifically La atoms, are solidly dissolved in the experimental Fe alloys, leading to an increase in the lattice parameters of the experimental Fe alloy.
Table 3.
Angles of the diffraction peaks.

Figure 3.
Lattice parameters of the pure iron and experimental Fe alloys: (a) pure iron (RT); (b) No.1; (c) No.2; (d) No.3; (e) pure iron (1273 K); (f) No.4.
The atomic radiuses of Si, Mn, Al, Nb, La, and Fe are 1.46 Å, 1.79 Å, 1.82 Å, 2.08 Å, 2.74 Å, and 1.72 Å, respectively. The atomic radius of La is the largest and differs the most from that of Fe atoms. According to the size effect of solute atoms, atoms with a significant size difference compared to the matrix atom can cause obvious lattice distortion and an increase in lattice parameters after the solid solution process [34,35]. Therefore, combined with the variation in the specimens’ lattice parameters, the increase in the solid solubility of La atoms with the increase in mixing entropy is reflected from another perspective.
3.3. First-Principles Calculations and Analysis
To identify the microscale thermodynamic mechanism of the solid solution process, an analysis was conducted via first-principles calculations. The calculation model was established as follows:
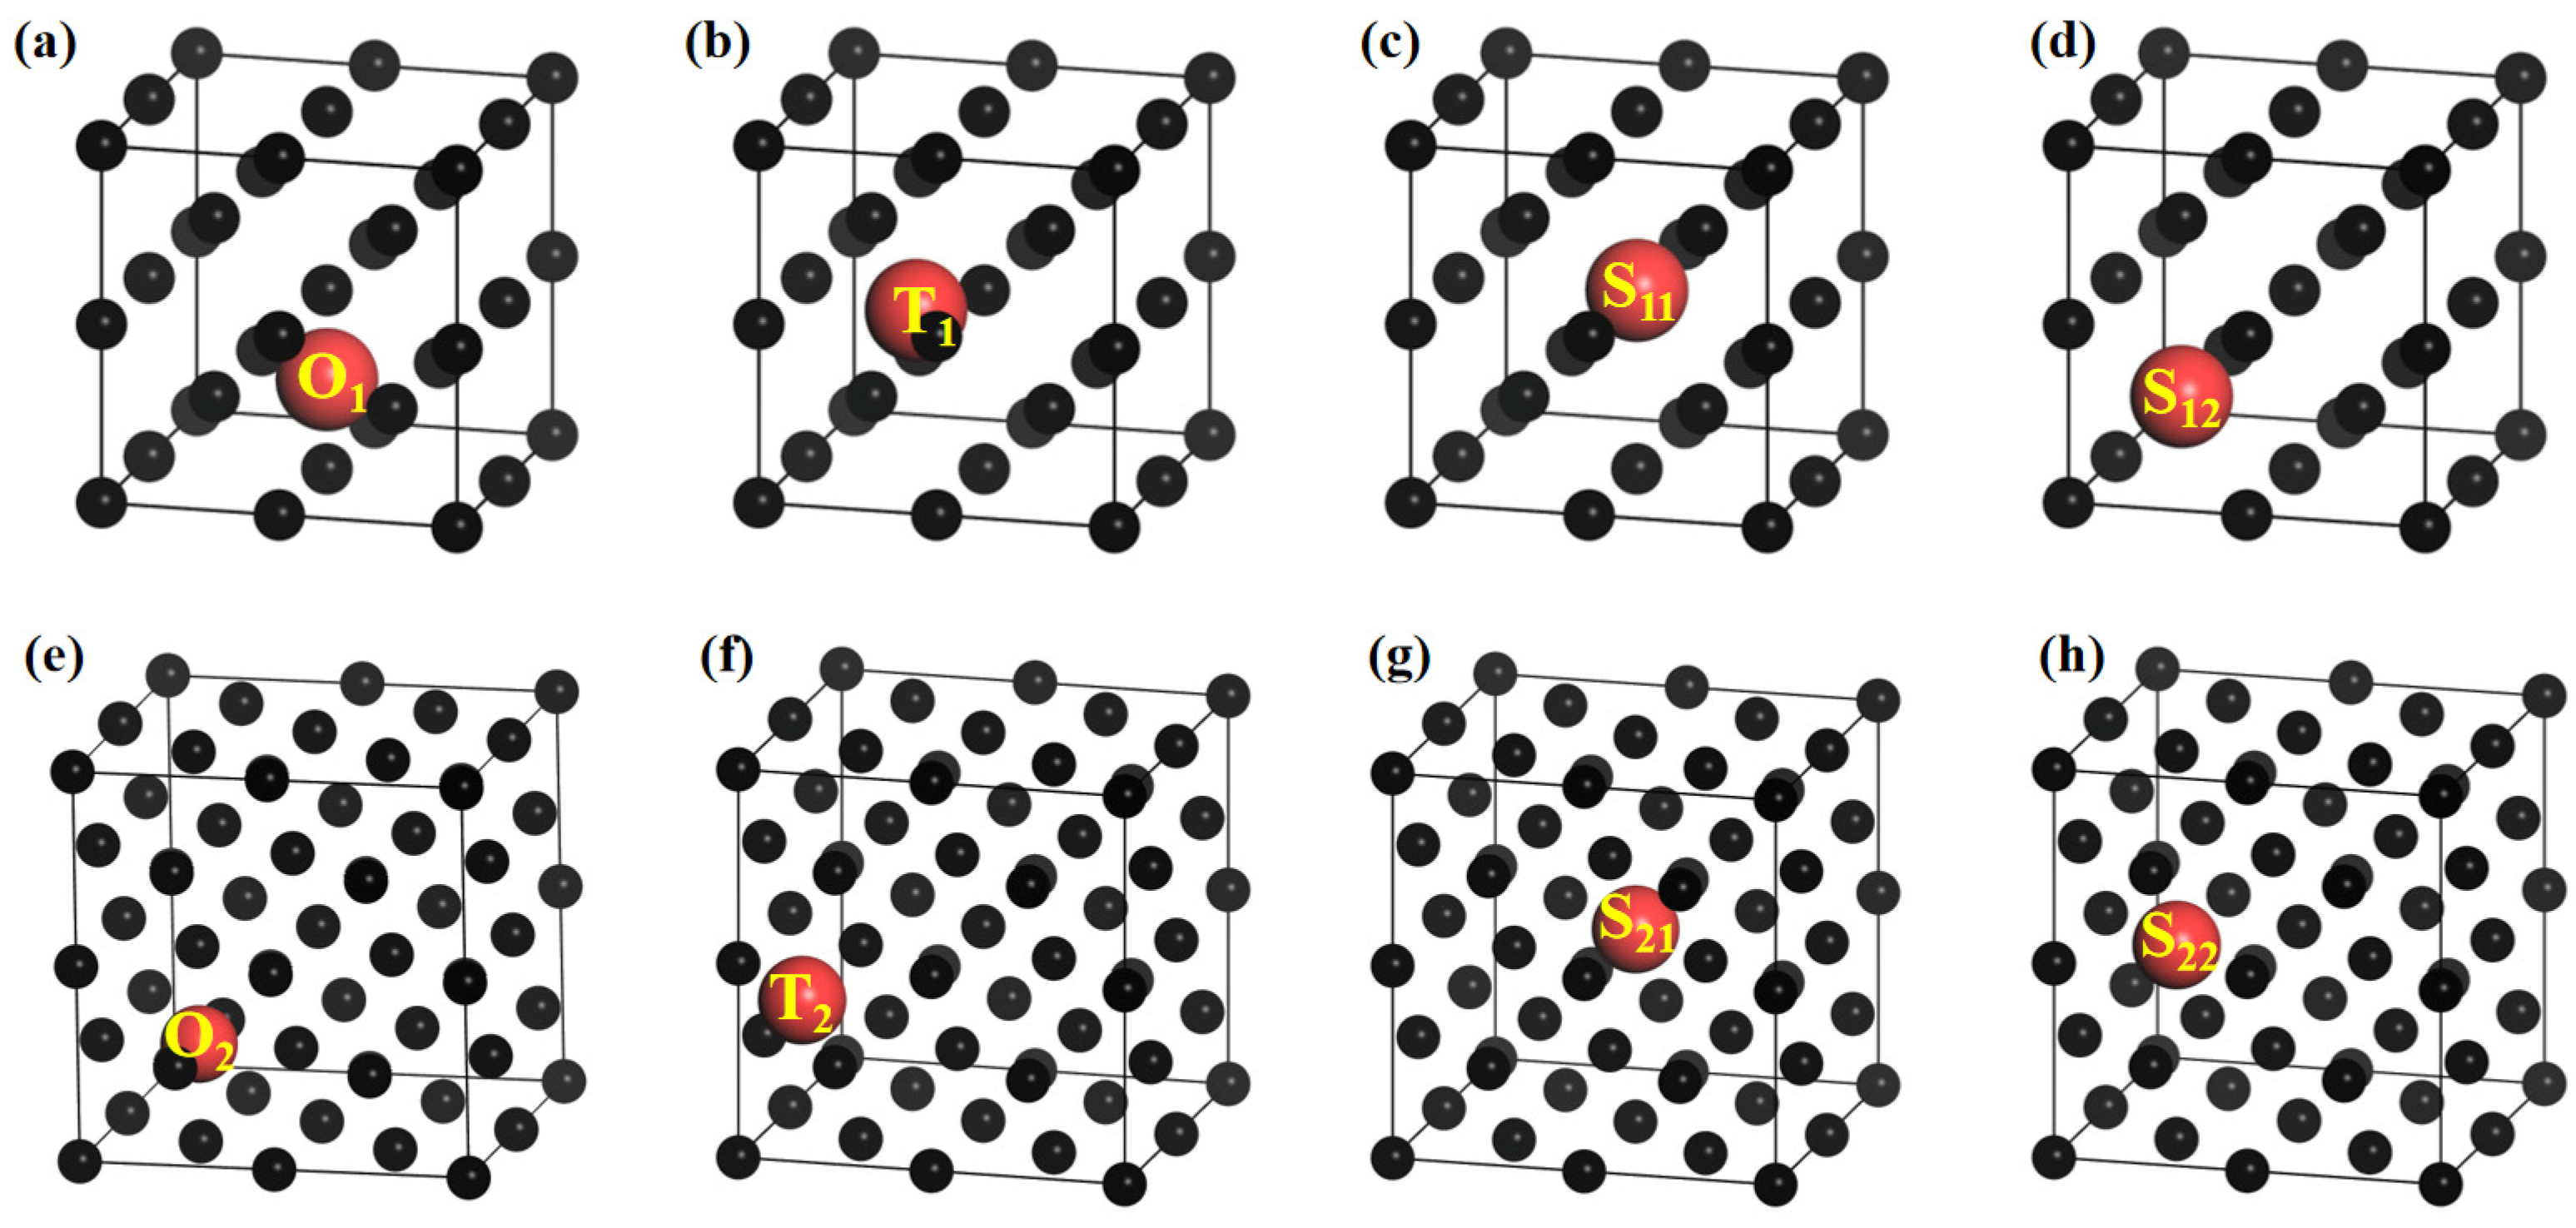
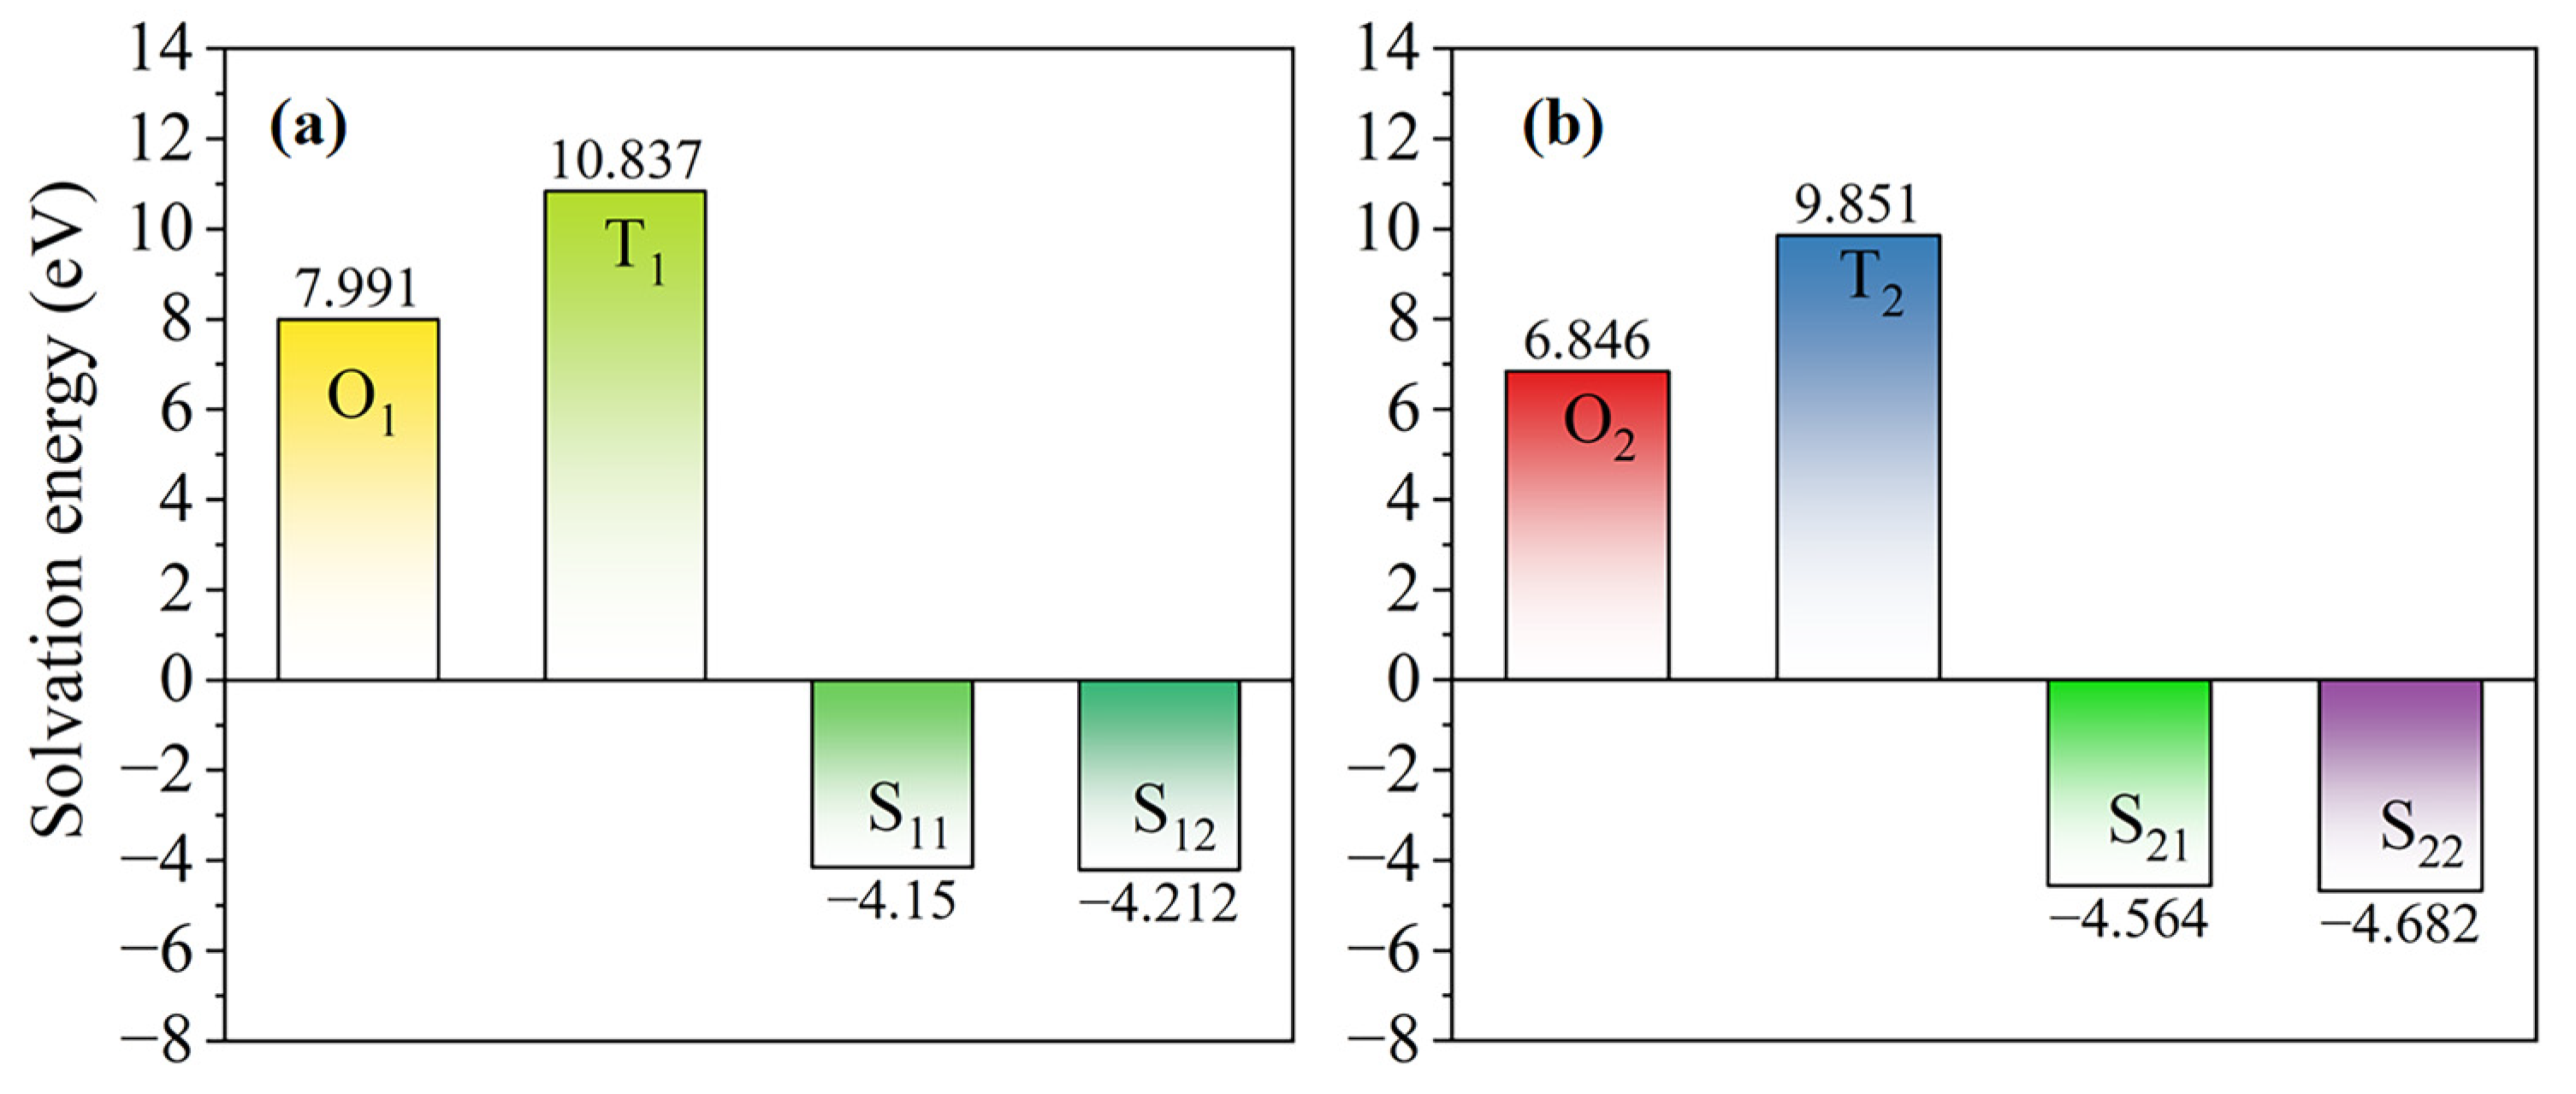
According to the literature [36], the two Fe atoms of α-Fe (BCC) are inclined to occupy the lattice positions (0, 0, 0) and (0.5, 0.5, 0.5), respectively, whereas the four Fe atoms of γ-Fe (FCC) tend to occupy the lattice positions (0, 0, 0), (0.5, 0.5, 0), (0.5, 0, 0.5), and (0, 0.5, 0.5), respectively. Therefore, there are four kinds of potential positions that can provide space for the solute atoms, as shown in Figure 4a–d, which demonstrate the octahedral gap sites (O1), tetrahedral gap sites (T1), vertex sites (S11), and body-centered sites (S12) in the α-Fe supercell, respectively. Similarly, the four kinds of potential positions are octahedral gap sites (O2), tetrahedral gap sites (T2), vertex sites (S21), and face-centered sites (S22) in the γ-Fe supercell, as shown in Figure 4e–h.

Figure 4.
Schematic diagram of the potential positions of solute atoms in the 2 × 2 × 2 Fe supercell: (a) octahedral gap sites (O1, α-Fe); (b) tetrahedral gap sites (T1, α-Fe); (c) vertex sites (S11, α-Fe); (d) body-centered sites (S12, α-Fe); (e) octahedral gap sites (O2, γ-Fe); (f) tetrahedral gap sites (T2, γ-Fe); (g) vertex sites (S21, γ-Fe); (h) face-centered sites (S22, γ-Fe).
Generally, a doping atom with a larger atomic radius usually replaces the Fe atom in the lattice position, forming a substitution solid solution. On the other hand, smaller atoms are inclined to occupy an octahedral or tetrahedral interstitial site in the crystal lattice, forming an interstitial solid solution [37]. The preferred position of the solute atom of the gap site in the Fe supercell can be evaluated using solvation energy (Esol (X)), which can be calculated as follows [38]:
where E(X) represents the total energy of the Fe supercell where a solute atom occupies an interstitial site, E(Febulk) is the total energy of the original Fe supercell, and E(X) is the energy of the isolated solute atom.
Meanwhile, if the solute atom is located at the substitute site, the solvation energy (Esol ()) can be calculated as follows:
where E(X) is the total energy of the Fe supercell where a solute atom occupies a substitute site, E(Febulk) is the total energy of the original Fe supercell, E(X) is the energy of the isolated solute atom, and n represents the number of Fe atoms in the Fe supercell.
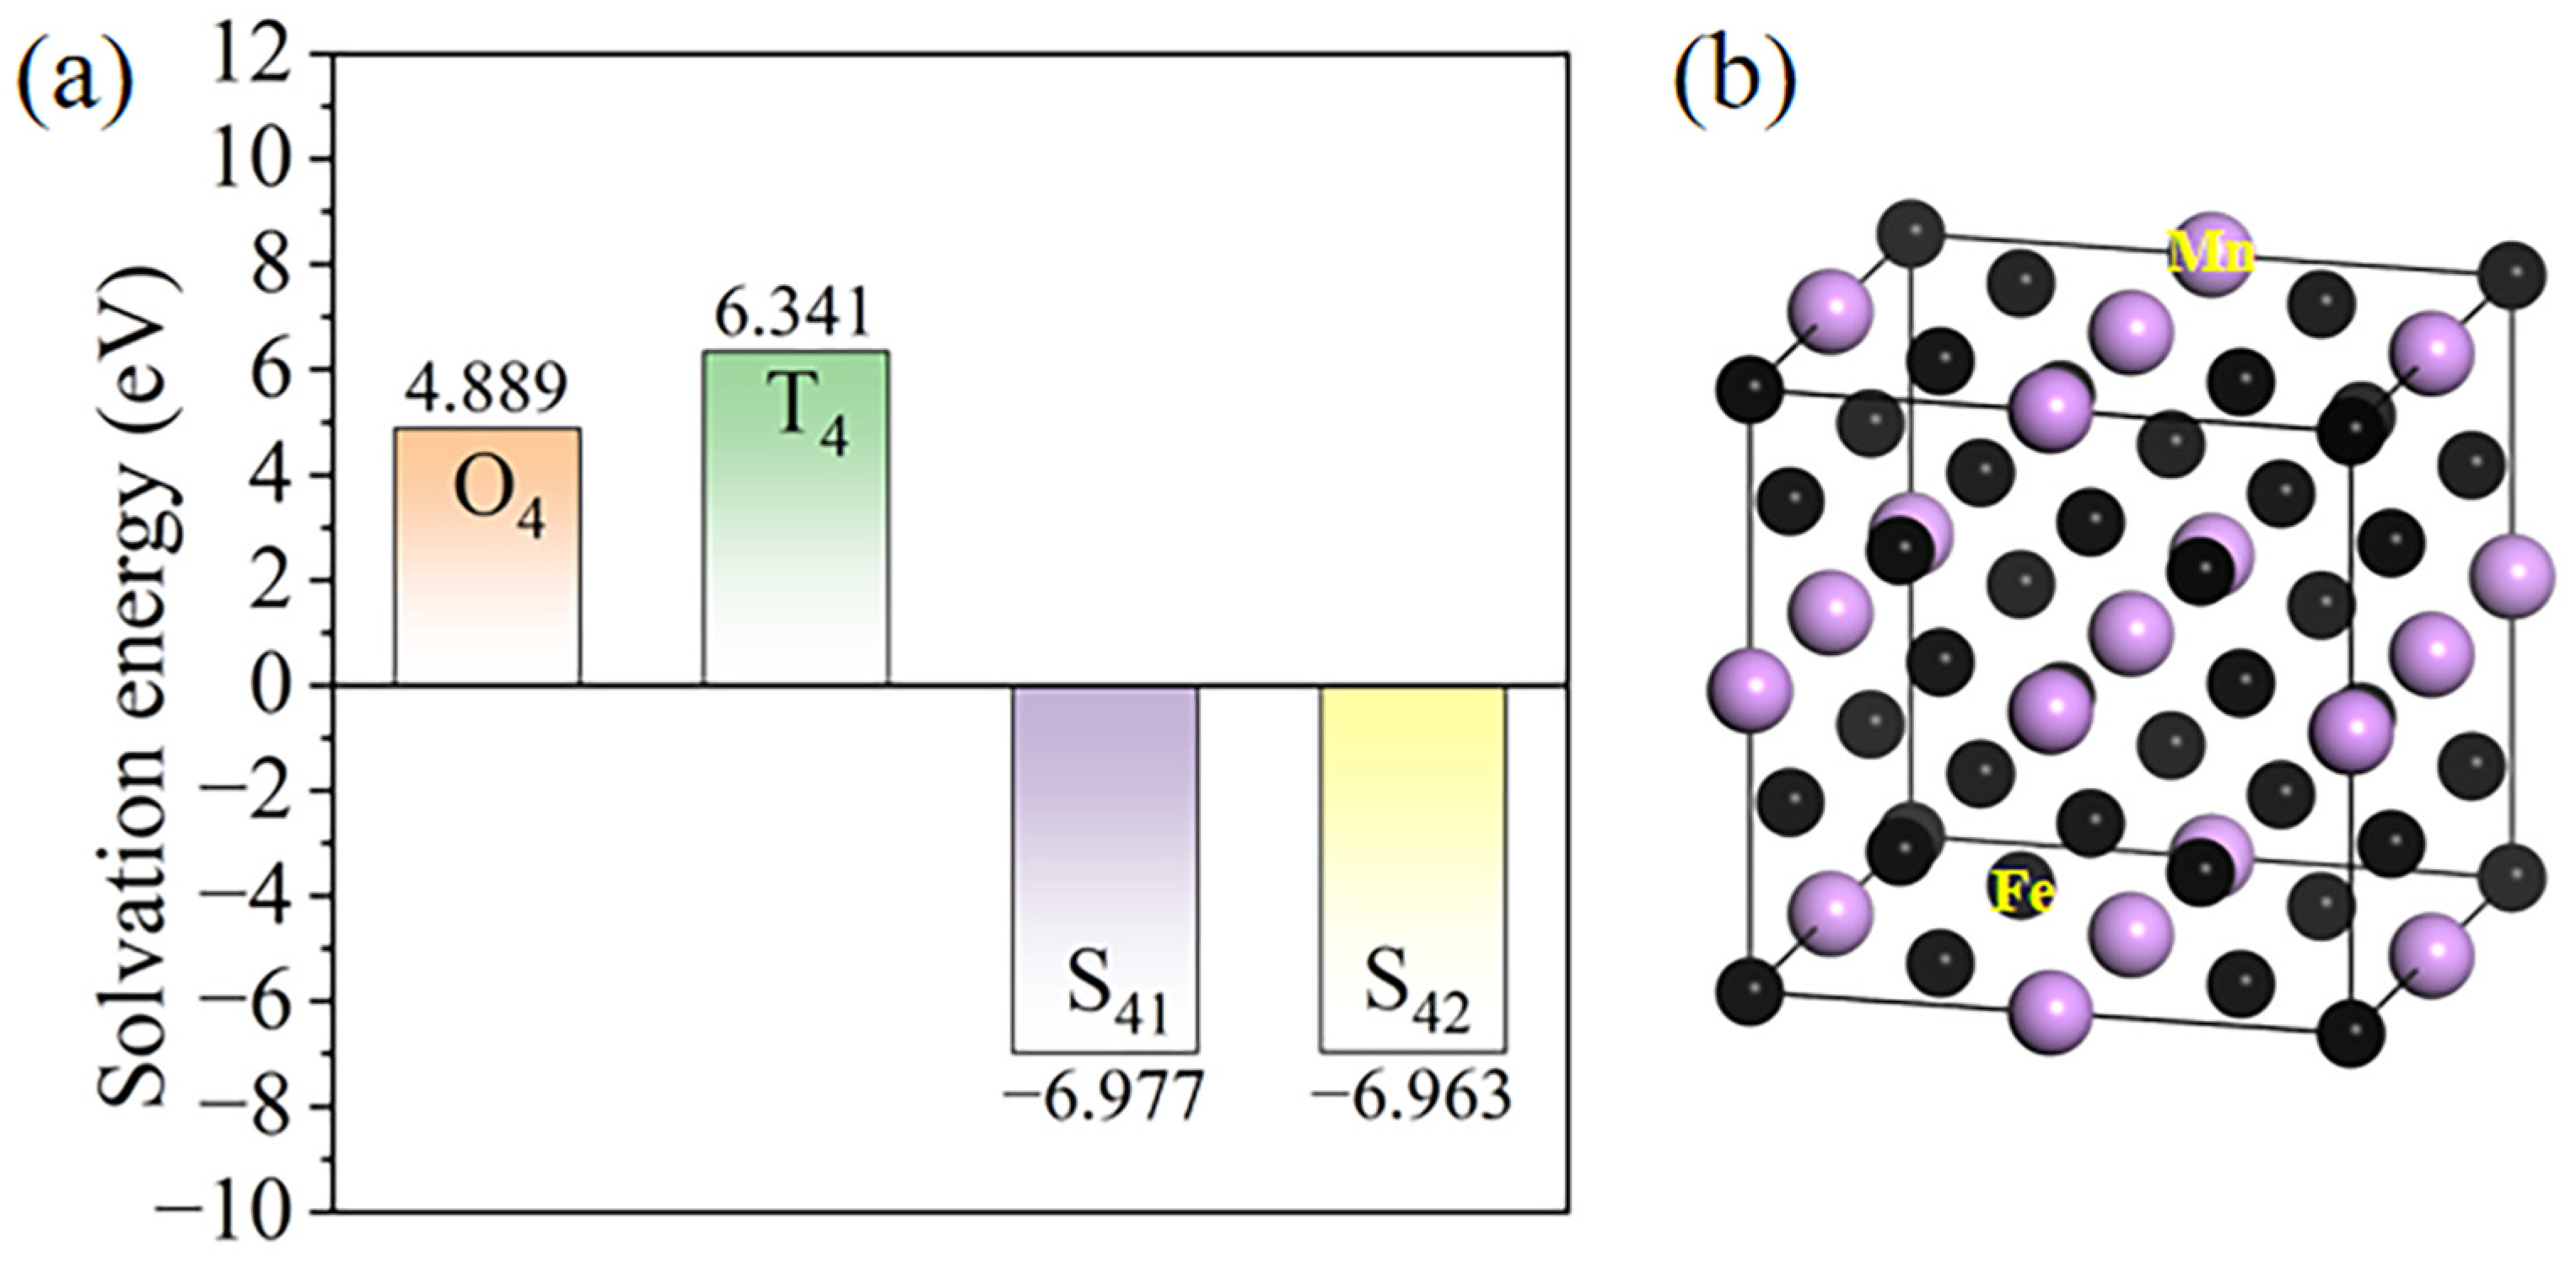
Figure 5 demonstrates the solvation energies of La atom doping into the Fe supercell. By comparing these values, it can be seen that the preferred position of the solute atom is the body- or face-centered site that has the minimum negative solvation energy value in the Fe supercell. Therefore, in this model, the La atom has been doped at the body-centered site of the α-Fe supercell (La-α-Fe) and the face-centered site of the γ-Fe supercell (La-γ-Fe). In addition, the Mn concentration of experimental Fe alloy No.4 was 22 wt%, which was non-negligible. Therefore, the lattice positions of Mn atoms were considered via the above method. The calculated results are shown in Figure 6. Comparing the solvation energies of different sites, the preferred position of the Mn atom is at the vertex site (S21) of the γ-Fe supercell. We refer to this supercell with the addition of Mn as a γ-Fe-Mn supercell.

Figure 5.
Solvation energies of La atom doping into the Fe supercell: (a) α-Fe; (b) γ-Fe.

Figure 6.
Mn atom addition into the Fe supercell: (a) solvation energies; (b) lattice positions of Mn atoms.
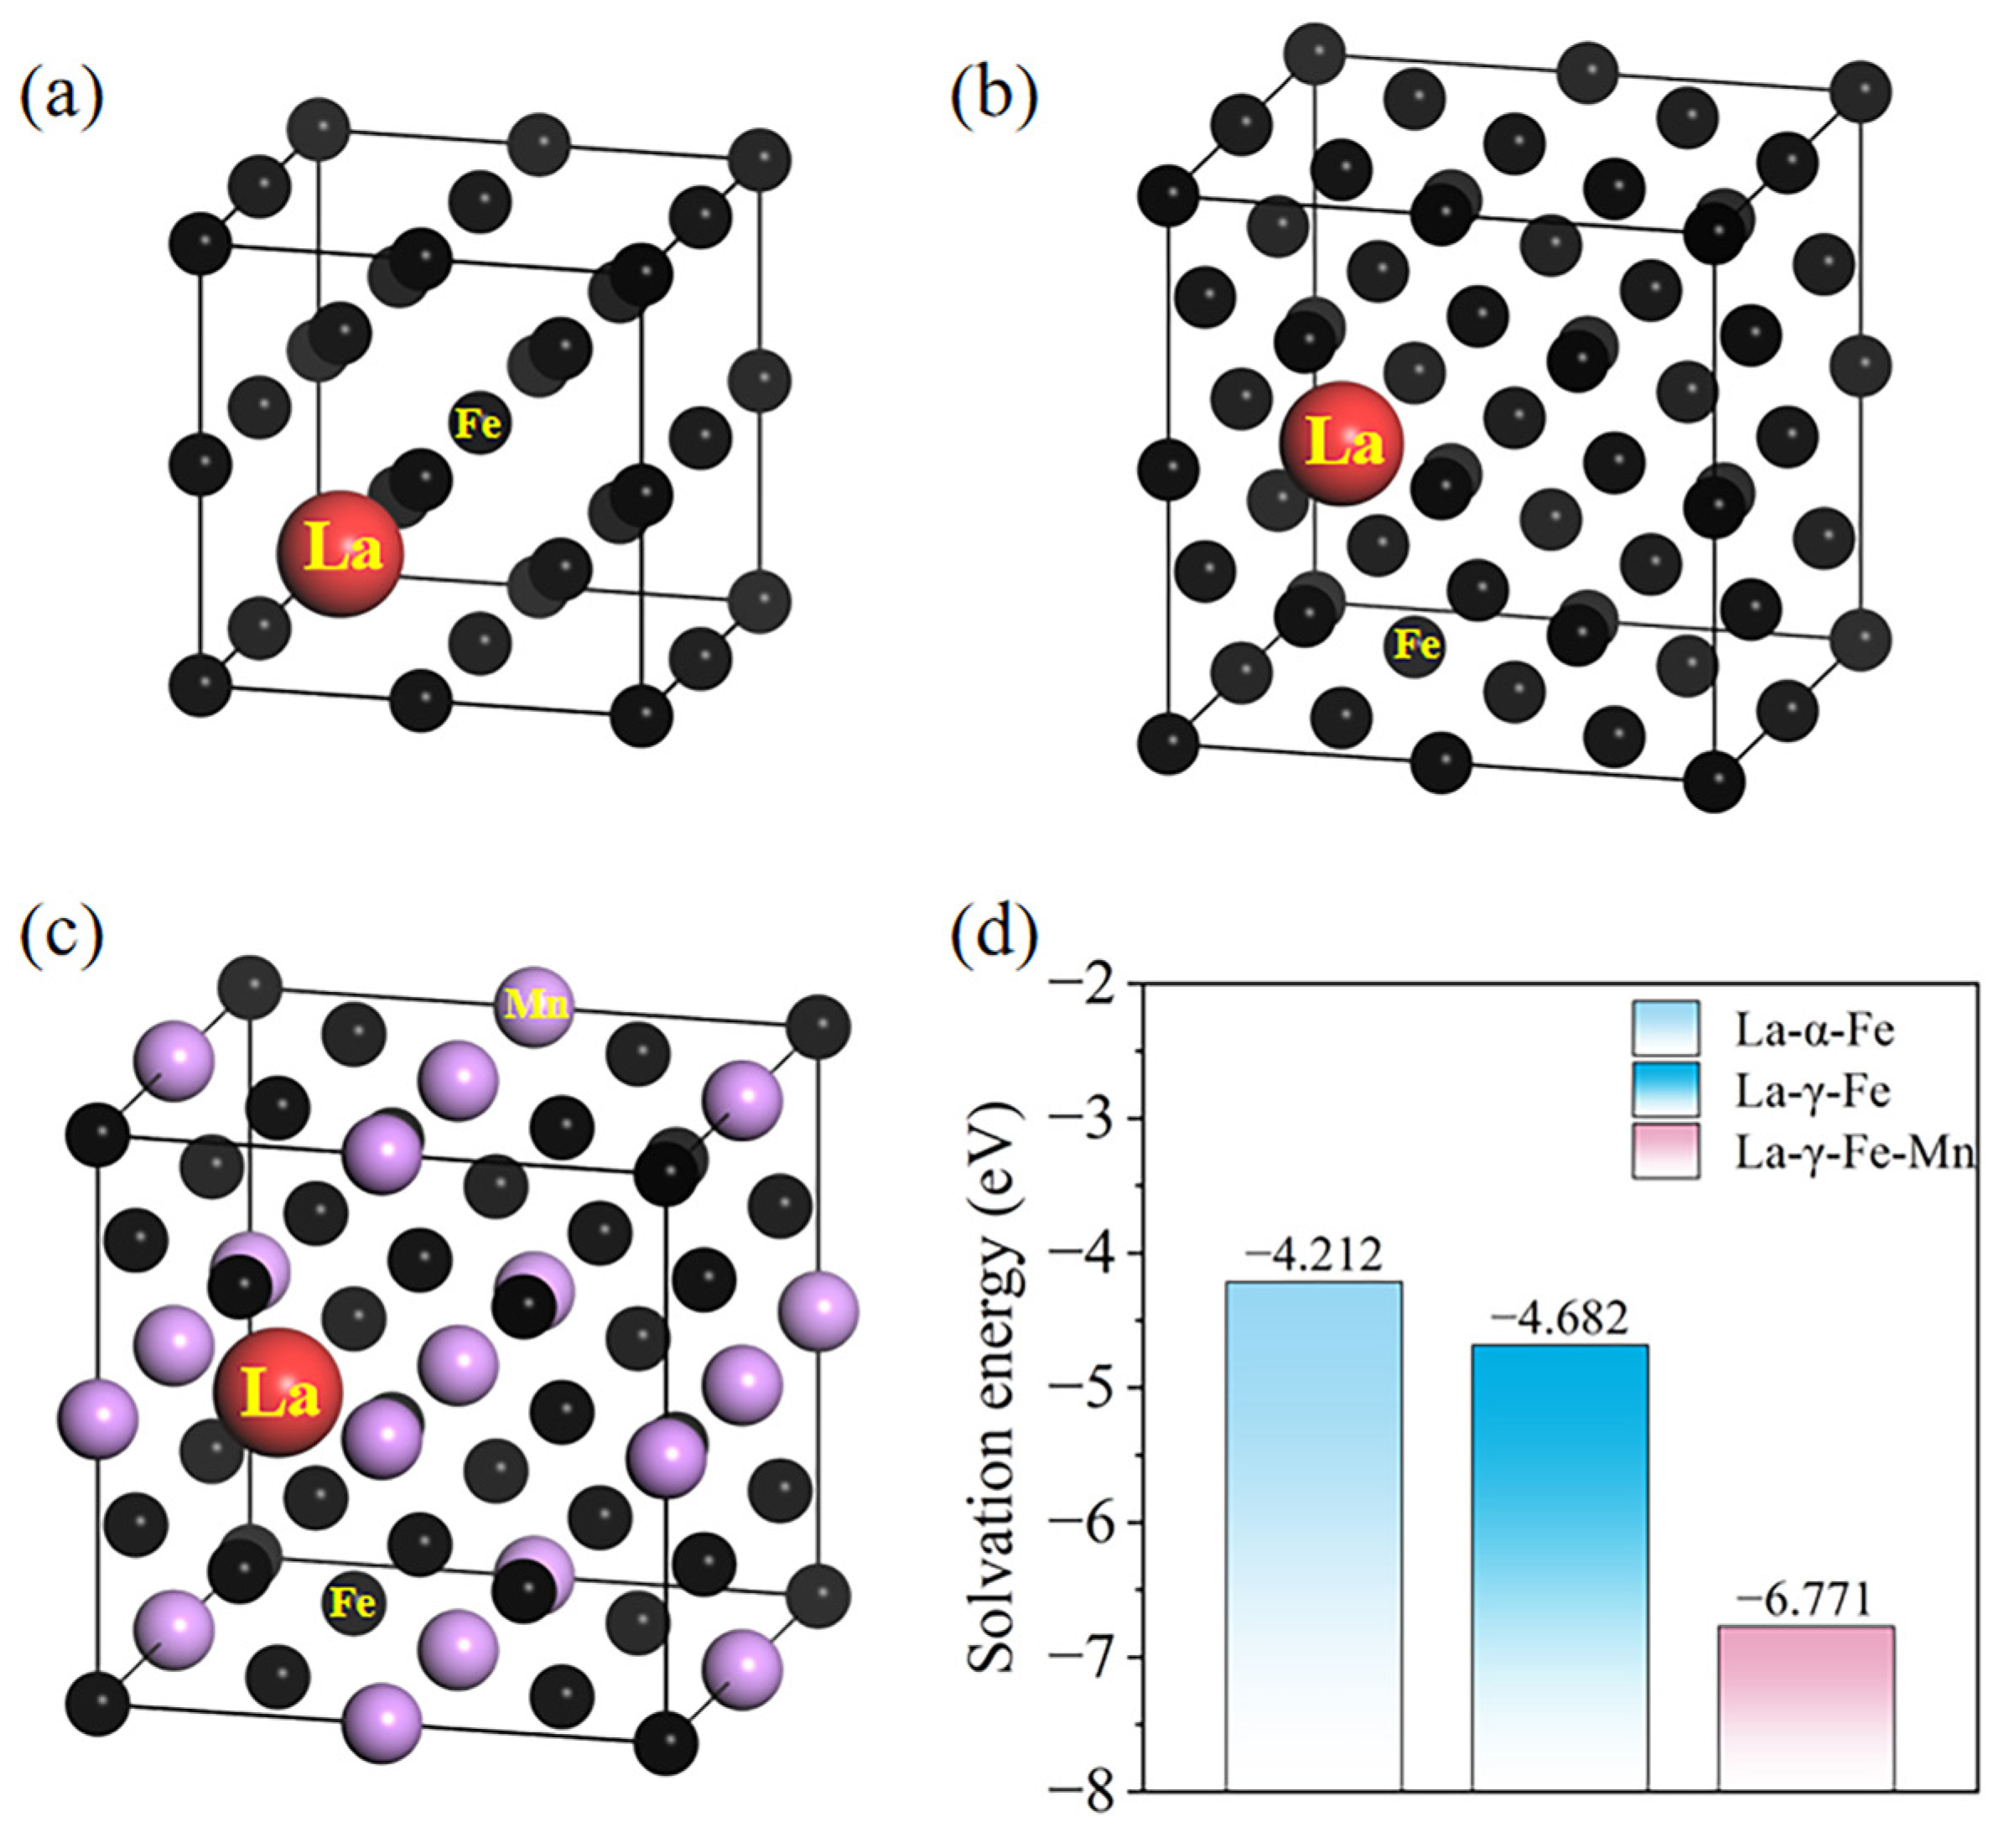
Similarly, for the solvation energy of La atom doping into the γ-Fe-Mn supercell (La-γ-Fe-Mn), Esol can be calculated as follows [39]:
where Etot is the total energy of the doped system, E(Febulk) is the total energy of the Fe supercell, E(Mn) and E(La) represent the energies of single Mn atoms and La atoms in the ground state, respectively, and n is the number of Fe atoms in the supercell.
The most stable of each type of solid solution after La atom doping is shown in Figure 7a–c, respectively. Meanwhile, Figure 7d exhibits the solvation energies of La atom doping into the three supercells. The results show that the order of solvation energies, from high to low, is La-α-Fe, La-γ-Fe, and La-γ-Fe-Mn, which indicates that, in this order, the structure of the supercell becomes more stable and the solid solution forms more easily. Considering the relatively small size of the supercell in the La solid solution, significant interactions are deemed to occur across the supercell. In structural relaxation, the atomic displacement is presumably limited to keep the strain effect within the cell. The chemical detection results indicated that the amount of La in the solid solution was much smaller than the concentration in the calculated supercell. Therefore, the trend of solvation energy remains unchanged even in larger supercells.

Figure 7.
La atom doping into the supercells: (a) α-Fe; (b) γ-Fe; (c) γ-Fe-Mn; (d) solvation energies.
3.4. Thermodynamic Analysis
According to the second law of thermodynamics, the change in Gibbs free energy can be considered as the criterion for whether a reaction is spontaneous [40]. The change in Gibbs free energy during the formation of solid solution can be expressed as follows:
where ∆ is the formation enthalpy of the solid solution, A and B are the solute and solvent elements, respectively, T is the temperature, and ∆Smix is the mixing entropy of the solid solution.
The formation enthalpy of the solid solution can be calculated using Miedema’s model. If metals A and B are both transition metals, the heat of the solution during A atoms’ solubility in metal B can be expressed as follows [41,42]:
where A is the solute (La), B is the solvent (Fe), is the body surface area of the A component after alloying, is the electronegative parameter, nws is the electron density, and p and q are constants whose values are 14.20 and 133.48, respectively.
Owing to the significant Mn content in the No.4 experimental Fe alloy, the effect of Mn alloying on the formation enthalpy of the solid solution must be considered. According to the results from the first-principles computation (as shown in Figure 7), the lattice positions of Mn and Fe atoms are equivalent. Therefore, the formation enthalpy of the solid solution, ∆, was calculated as follows:
where xFe and xMn are the molar fractions of the Fe atoms and Mn atoms, respectively.
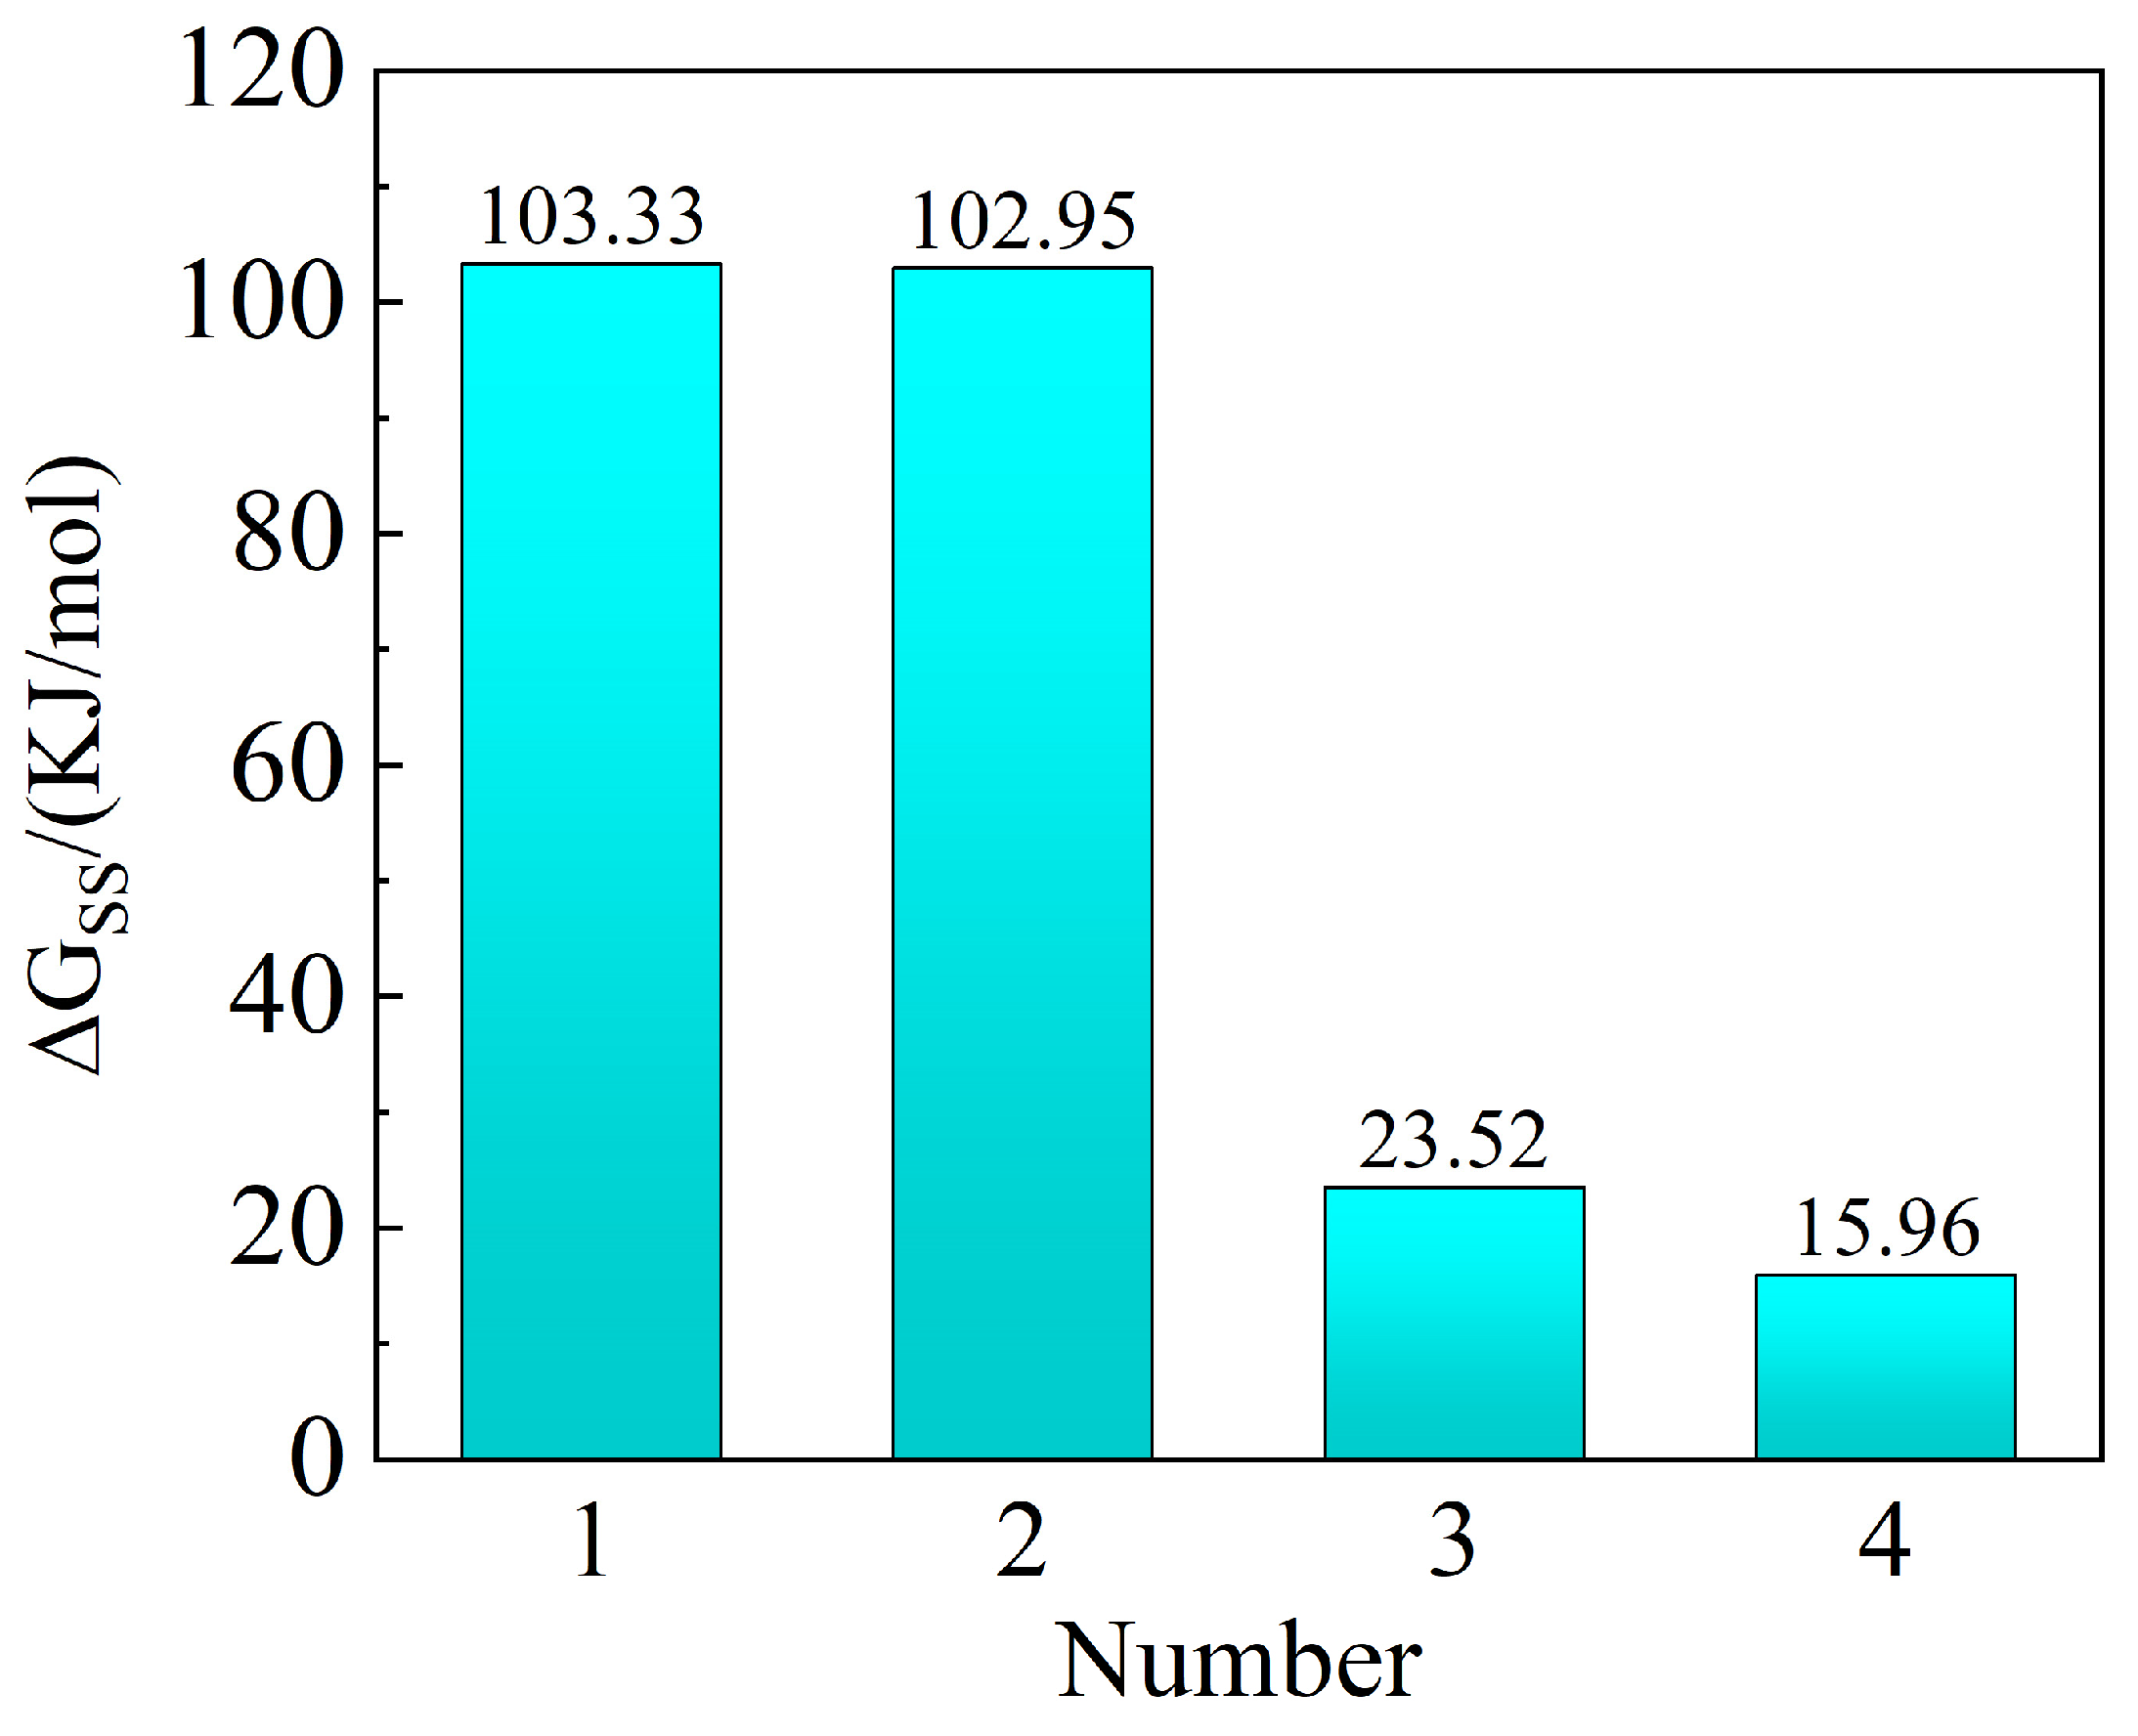
The relevant parameters can be obtained from the literature [42], and the mixing entropy of solid solutions can be calculated using Equation (1). Figure 8 shows the change in the Gibbs free energy during the formation of the solid solution (1523 K), calculated via Equation (10). The changes in the Gibbs free energy of the four experimental Fe alloys were 103.33 KJ·mol−1, 102.95 KJ·mol−1, 23.52 KJ·mol−1, and 15.96 KJ·mol−1, respectively. The changes tended to be negative, indicating that the formation of solid solutions was favored. This suggests that the higher the mixing entropy, the more easily lanthanum atoms dissolve in the Fe alloy.

Figure 8.
Change in the Gibbs free energy of La atoms solidly dissolved in the four experimental Fe alloys.
3.5. Effects of the Crystal Defects
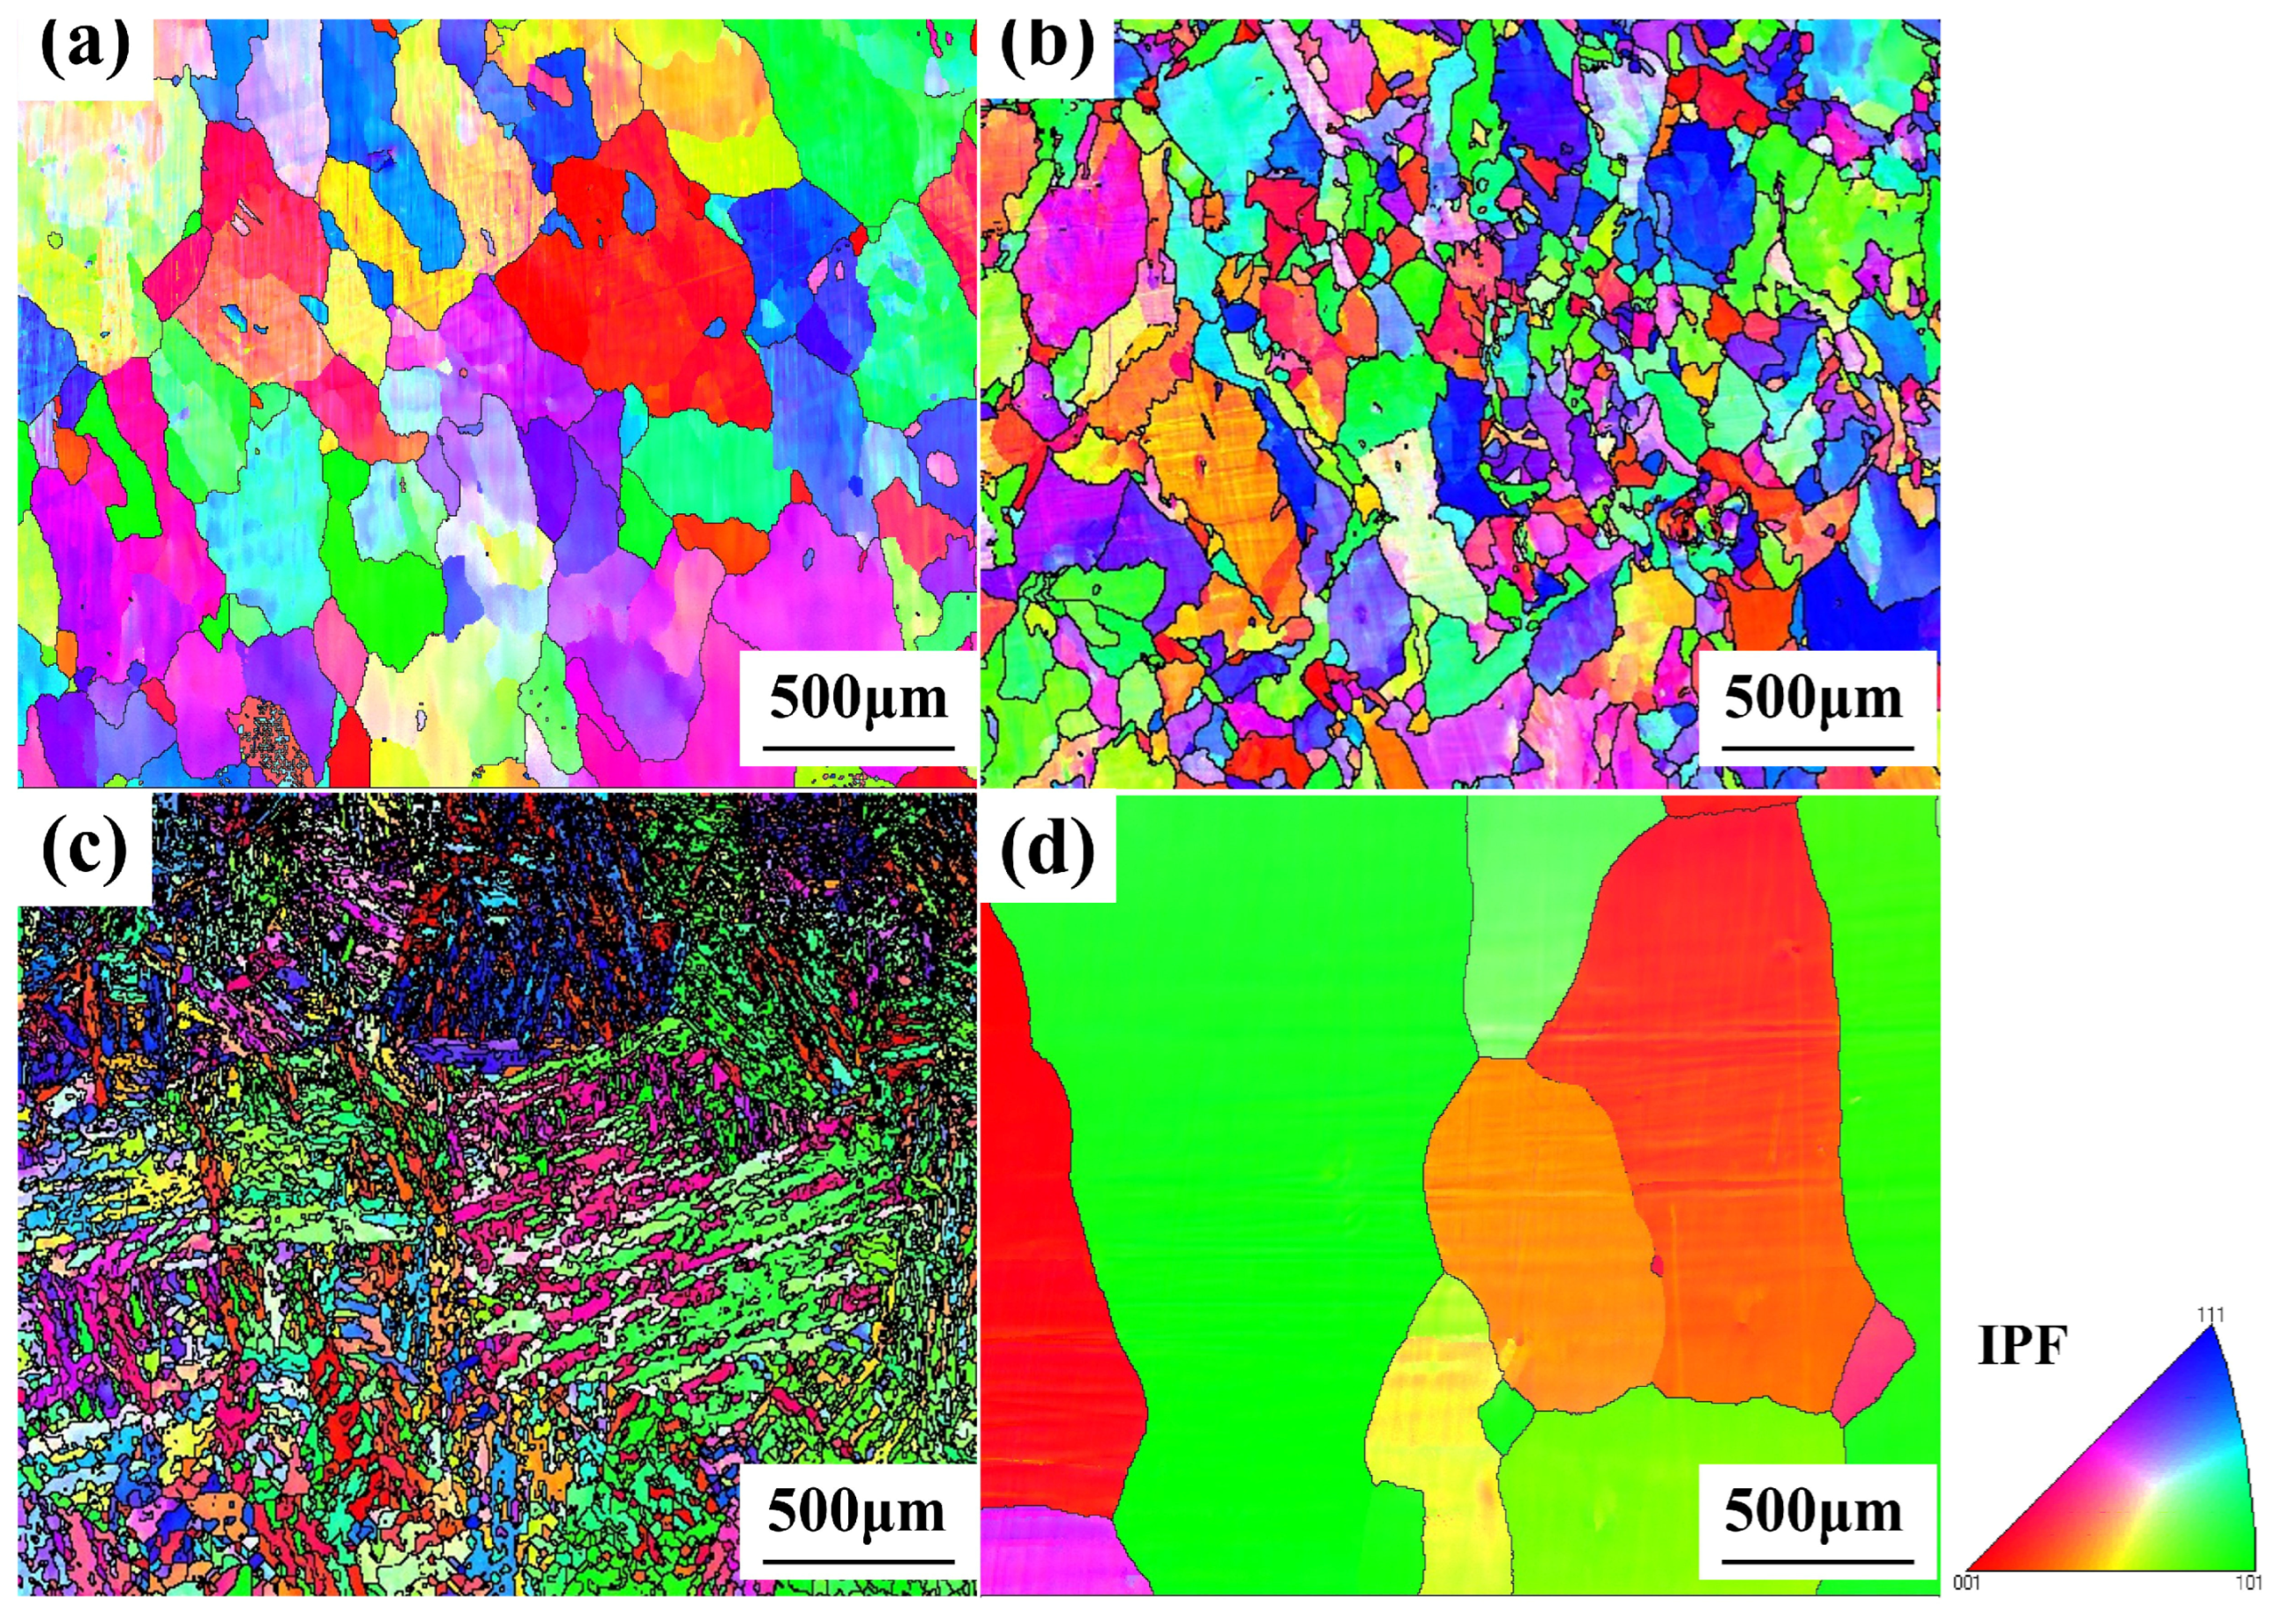
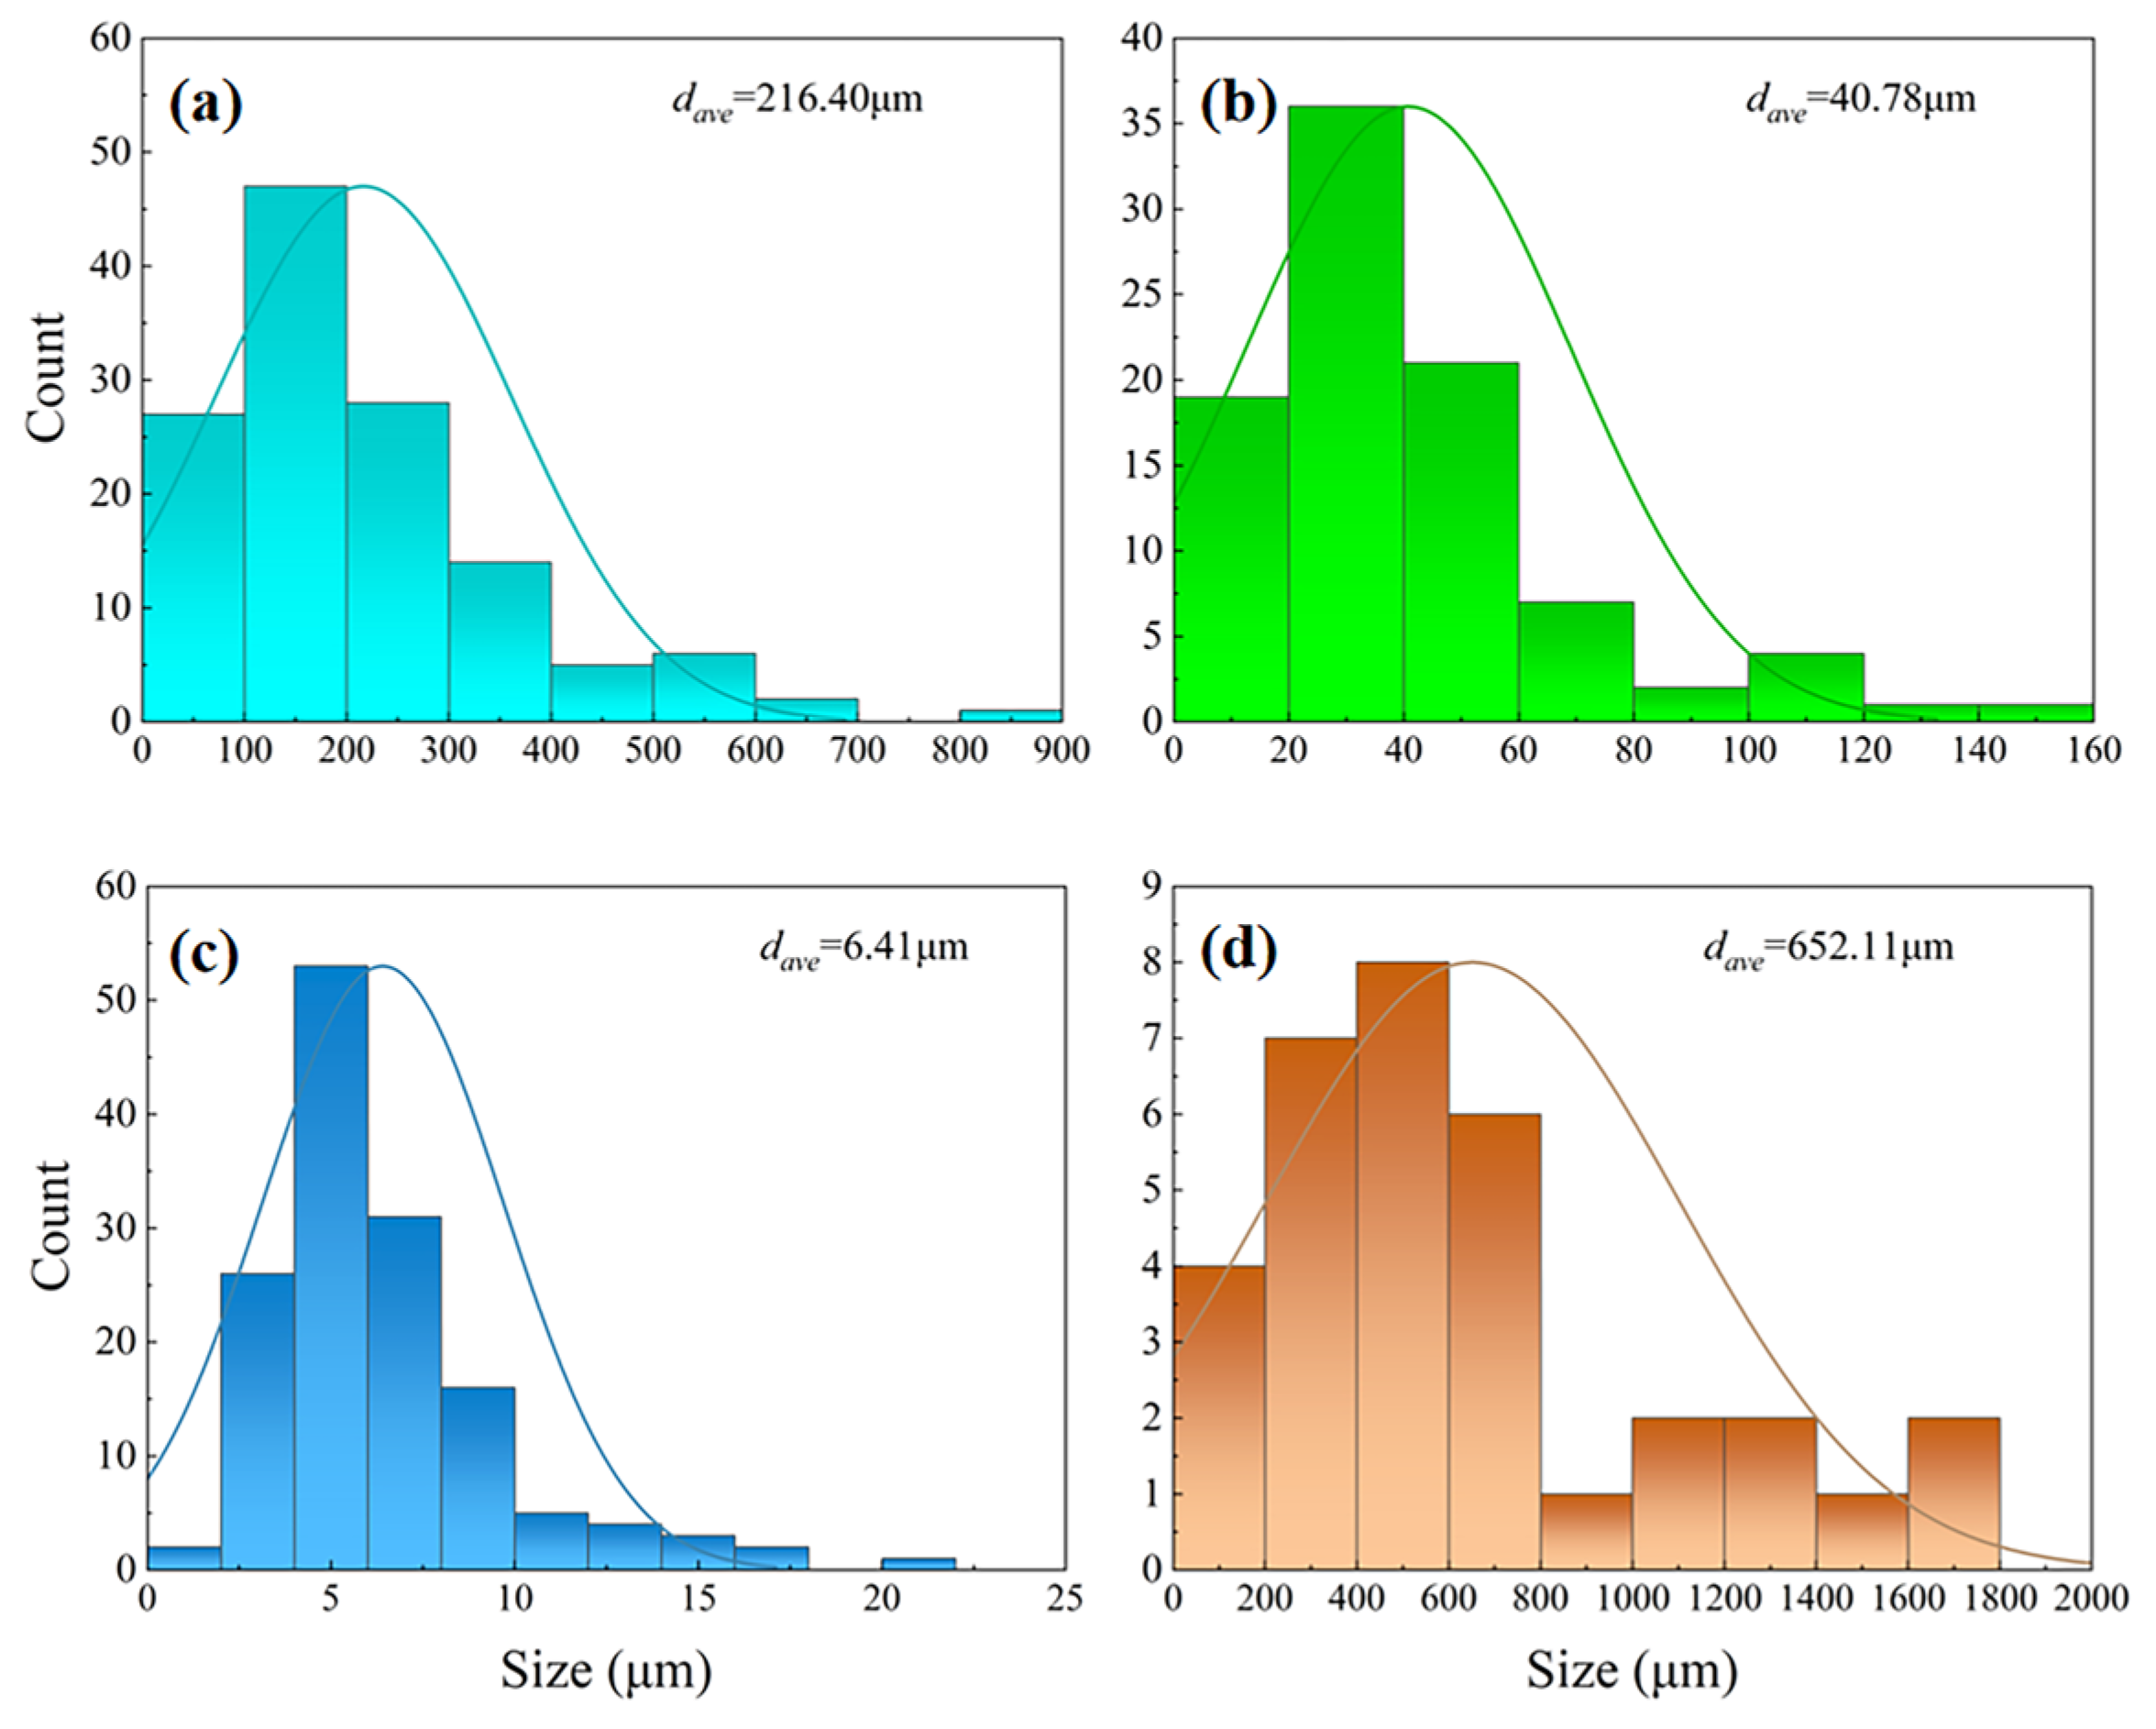
Although the changes in the Gibbs free energy of the four experimental Fe alloys were all positive values, the trace La atoms can dissolve in the alloys because crystal defects, such as grain boundaries and dislocations, provide low-energy positions for the solid solution atoms [43,44]. Figure 9 demonstrates the grain distributions of the four experimental Fe alloys, as detected via EBSD. Comparing the four experimental Fe alloys, the order of grain size, from coarse to fine, is No.4, No.1, No.2, and No.3. Figure 10 shows the grain size distributions of the four experimental Fe alloys. The grain sizes of No.1, No.2, No.3, and No.4 are mainly distributed in the ranges of 50–400 μm, 10–80 μm, 2–10 μm, and 100–800 μm, respectively. Meanwhile, the average grain sizes (dave) of the four Fe alloys are 216.40 μm, 40.78 μm, 6.41 μm, and 652.11 μm, respectively.

Figure 9.
Grain distributions of the four experimental Fe alloys: (a) No.1; (b) No.2; (c) No.3; (d) No.4.

Figure 10.
Grain size distributions and average grain sizes of the experimental Fe alloys: (a) No.1; (b) No.2; (c) No.3; (d) No.4.
By combining the results of Figure 9 and Figure 10, we found that the grain size of the α-ferritic matrix Fe alloys (No.1, No.2, and No.3) became smaller with the increase in the mixing entropy. As a result, the volume densities of the grain boundaries increased with the increase in the mixing entropy. Since there was no γ→α phase transition in the austenitic matrix of Fe alloy No. 4, the state of the grains at 1523 K (the homogenization temperature) were maintained, meaning that these grains were the coarsest of all.
According to the Williamson–Hall relationship [45,46], the dislocation density of the Fe alloy ρ can be calculated using Equation (13):
where ε is the micro-strain of the matrix, dave is the average grain size, and b is the Burgess vector (bγ-Fe = 0.269 nm and bα-Fe = 0.252 nm).
The micro-strain ε can be calculated as follows [47,48]:
where β is the full width at half-maximum of the diffraction peak, and θ is the diffraction angle. Both can be obtained through XRD measurements.
After calculation by combining Equation (13) and Equation (14), the dislocation densities of the four experimental Fe alloys were found to be 9.60 × 10⁶ m−2, 5.88 × 10⁷ m−2, 5.27 × 10⁸ m−2, and 4.68 × 10⁶ m−2, respectively. The results indicate that the dislocation densities of experimental Fe alloys No. 1, No. 2, and No. 3 increased with the increase in the mixing entropy. However, experimental Fe alloy No. 4 exhibited the lowest dislocation density among all alloys, due to the absence of the γ→α phase transition.
The above results indicate that crystal defects, represented by grain boundaries and dislocations, can facilitate the solid solubility of La atoms in Fe alloys. However, the lanthanum atoms were more readily solidly dissolved in the No.4 experimental Fe alloy with the highest mixing entropy, despite the crystal defect densities of this alloy being the lowest. In other words, integrating the outcomes of first-principles and thermodynamic calculations indicated that the solid solubility of La atoms in Fe alloys is concurrently influenced by the solvation energy and crystal defects. In essence, increasing the mixing entropy, which reduces the Gibbs free energy during the formation of solid solutions, is fundamental to enhancing solid solubility.
4. Conclusions
A comprehensive evaluation of the solid solubility of lanthanum in Fe alloys was carried out in this study. Based on the results and analysis, the following conclusions were obtained:
- (1)
- The solid solubility of lanthanum in the four experimental Fe alloys was 11.61 ppm, 14.34 ppm, 29.06 ppm, and 37.05 ppm, respectively. Meanwhile, their solid solution rates were 3.74%, 4.94%, 9.69%, and 12.35%, respectively. In addition, most of the lanthanum formed inclusions in the Fe alloys.
- (2)
- Although the changes in the Gibbs free energy values during the La atoms’ solid solution process were all positive, trace amounts of La atoms were still dissolved in the matrix of the Fe alloys, owing to the presence of crystal defects such as grain boundaries and dislocations, which offer low-energy sites for the accommodation of solid solution atoms.
- (3)
- Based on the concurrent influences of the solvation energy and crystal defects, the increase in the mixing entropy led to a decrease in the Gibbs free energy required for the formation of solid solutions, serving as the fundamental impetus for enhancing the solid solubility of La atoms in Fe alloys.
Author Contributions
Conceptualization, W.G.; Methodology, W.G., Z.L. (Zhigang Liang), W.Z., H.S. and J.S.; Software, Z.L. (Zhili Li), C.J., W.Z. and H.S.; Validation, W.Z., Z.L. (Zhigang Liang), Z.L. (Zhili Li), Z.L. (Zhouli Liu), and C.J.; Formal Analysis, W.Z. and Z.L. (Zhili Li); Investigation, W.Z.; Resources, W.Q., H.R. and H.S.; Data Curation, W.Z., Z.L. (Zhigang Liang), Z.L. (Zhili Li), Z.L. (Zhouli Liu), C.J. and J.S.; Writing—Original Draft, W.Z.; Writing—Review and Editing, Z.L. (Zhigang Liang), Z.L. (Zhili Li), Z.L. (Zhouli Liu), and C.J.; Visualization, C.J.; Supervision, W.Z., Z.L. (Zhigang Liang), H.R. and Z.L. (Zhouli Liu); Project Administration, W.Q. and H.R.; Funding Acquisition, W.Q. All authors have read and agreed to the published version of the manuscript.
Funding
This research was funded by the Open Research Fund of the State Key Laboratory of Baiyun Obo Rare Earth Resource Research and Comprehensive Utilization (No. 0904052306) and the Natural Science Foundation of Inner Mongolia Autonomous Region (No. 2024MS05018 and No. 2023ZD03).
Data Availability Statement
The original contributions presented in the study are included in the article, further inquiries can be directed to the corresponding author.
Conflicts of Interest
Author Zhigang Liang, Zhili Li, Zhouli Liu and Cheng Ji was employed by the Inner Mongolia Baotou Steel Union Co.,Ltd. The remaining authors declare that the research was conducted in the absence of any commercial or financial relationships that could be construed as a potential conflict of interest.
References
- Caretta, L.; Rosenberg, E.; Büttner, F.; Fakhrul, T.; Gargiani, P.; Valvidares, M.; Chen, Z.; Reddy, P.; Muller, D.A.; Ross, C.A.; et al. Interfacial Dzyaloshinskii-Moriya interaction arising from rare-earth orbital magnetism in insulating magnetic oxides. Nat. Commun. 2020, 11, 1090. [Google Scholar] [CrossRef] [PubMed]
- Zheng, J.H.; Feng, Y.; Zhao, Y.; Chen, Y.Q. High-temperature oxidation behavior and mechanism of 18Cr-Mo-type ferritic stainless steel containing W and Ce in simulated automotive exhaust gas. J. Iron. Steel Res. Int. 2024, 1–17. [Google Scholar] [CrossRef]
- Pollnau, M. Rare-earth-ion-doped channel waveguide lasers on silicon. IEEE J. Sel. Top. Quantum Electron. 2014, 21, 414–425. [Google Scholar] [CrossRef]
- Qu, W.; Hou, Y.; Ren, H.P.; Zhang, M.X.; Ji, Y.P. Grain refinement of the CrMnFeCoNi high entropy alloy cast ingots by adding lanthanum. Metall. Mater. Trans. B 2021, 52, 1194–1199. [Google Scholar]
- Ma, F.X.; Gu, Q.; Liu, G.Q.; Zhang, Y.; Li, H.X. A systematic study of carbon-free oxide-based lining for preventing submerged entry nozzle clogging in continuous casting of rare earth steel. J. Iron. Steel Res. Int. 2024, 1–12. [Google Scholar]
- Wang, Y.H.; Bai, S.C.; Liang, H.; Li, C.; Tan, T.Y.; Yang, G.; Wang, J.W. Lanthanide ions doped rare earth-based double perovskite single crystals for light-emitting diodes. J. Alloys Compd. 2023, 934, 167952. [Google Scholar] [CrossRef]
- Dong, F.T.; Venezuela, J.; Li, H.X.; Shi, Z.M.; Zhou, Q.J.; Chen, L.S.; Chen, J.; Du, L.X.; Atrens, A. Effect of vanadium and rare earth microalloying on the hydrogen embrittlement susceptibility of a Fe-18Mn-0.6 C TWIP steel studied using the linearly increasing stress test. Corros. Sci. 2021, 185, 109440. [Google Scholar]
- Kang, J.; Wang, H.P.; Wang, Y.; Chen, K. Effect of steel-refractory reactions on inclusion modification in lanthanum-, cerium-, and yttrium-added steels. Ceram. Int. 2024, 50, 31364–31374. [Google Scholar] [CrossRef]
- Li, D.Z.; Wang, P.; Chen, X.Q.; Fu, P.X.; Luan, Y.K.; Hu, X.Q.; Liu, H.W.; Sun, M.Y.; Chen, Y.; Cao, Y.F.; et al. Low-oxygen rare earth steels. Nat. Mater. 2022, 21, 1137–1143. [Google Scholar] [CrossRef]
- Zhang, P.Z.; Meng, Z.; Li, G.Q.; Liu, C.; Wang, X.J.; Liu, Y. Industrial Trials on the Cleanliness Improvement, Microstructure Refinement and Performance Enhancement of Rare-Earth-Treated 75Cr1 Steel. Steel Res. Int. 2024, 96, 2400576. [Google Scholar] [CrossRef]
- Guo, Y.; Sun, S.F.; Song, S.H. Effect of minor rare earth cerium addition on the hot ductility of a reactor pressure vessel steel. Results Phys. 2019, 15, 102746. [Google Scholar] [CrossRef]
- Bai, G.J.; Yang, J.C.; Liang, W.J. Effect of lanthanum-cerium mixed rare earth on inclusions in U76CrRe eavy rail steel. Can. Metall. Q. 2023, 62, 720. [Google Scholar] [CrossRef]
- Wang, X.Q.; Wu, Z.W.; Li, B.; Chen, W.X.; Zhang, J.; Mao, J. Inclusions modification by rare earth in steel and the resulting properties: A review. J. Rare Earths 2024, 42, 431–445. [Google Scholar] [CrossRef]
- Ueda, K.; Nakaoka, S.; Narushima, T. β-Grain Refinement of α+β-Type Ti-4.5 Al-6Nb-2Fe-2Mo Alloy by Using Rare-Earth-Oxide Precipitates. Mater. Trans. 2013, 54, 161–168. [Google Scholar] [CrossRef]
- Guo, Z.; Lee, C.S.; Morris, J.W. On coherent transformations in steel. Acta Mater. 2004, 52, 5511–5518. [Google Scholar] [CrossRef]
- Meng, C.C.; Tang, H.Q.; Wang, C.; Sun, Y.H.; Peng, F.; Zheng, X.; Wang, J.S. Anti-fading study of Al-Ti-B by adding Ce on 6111 aluminum alloy. J. Mater. Res. Technol. 2024, 30, 2420–2434. [Google Scholar] [CrossRef]
- Fu, X.M.; Jiang, J.X.; Jiang, X.S. Research progress in interfacial characteristics and strengthening mechanisms of rare earth metal oxide-reinforced copper matrix composites. Materials 2022, 15, 5350. [Google Scholar] [CrossRef]
- Nhlapo, T.A.; Dlamini, S.T.; Mokoena, T.P.; Mokhena, T.C.; Mahule, T.S.; Malevu, T.D.; Moyo, T. Influence of rare-earth elements (RE=Ce, Nd, Gd) on structural, ESR and Mössbauer spectroscopy studies of Ni0.5Co0.5RE0.03Fe1.97O4 synthesized by glycol-thermal method. J. Solid State Chem. 2024, 330, 124479. [Google Scholar] [CrossRef]
- Wang, H.H.; Long, Q.; Zeng, J.; Cao, X.; Zhou, Y.; Zheng, Z.X.; Wang, W.L. Purifying 7CrSiMnMoV Steel from Scrap Modified with Rare Earth Cerium Alloying. J. Sustain. Metall. 2024, 10, 1–16. [Google Scholar] [CrossRef]
- Yue, L.J.; Wang, L.M.; Han, J.S. Effects of rare earth on inclusions and corrosion resistance of 10PCuRE weathering steel. J. Rare Earths 2010, 28, 952–956. [Google Scholar] [CrossRef]
- Han, Y.J.; Wang, H.; Zhang, T.L.; He, Y.K.; Jiang, C.B. Exploring structural origin of the enhanced magnetostriction in Tb-doped Fe83Ga17 ribbons: Tuning Tb solubility. Scr. Mater. 2018, 150, 101–105. [Google Scholar] [CrossRef]
- Yabe, H.; Kuji, T. Crystal structure and its magnetization of rare earth-iron alloys by mechanical alloying. J. Alloys Compd. 2006, 408, 313–318. [Google Scholar] [CrossRef]
- Ahn, J.H.; Jung, H.D.; Im, J.H.; Jung, K.H.; Moon, B.M. Influence of the addition of gadolinium on the microstructure and mechanical properties of duplex stainless steel. Mater. Sci. Eng. A 2016, 658, 255–262. [Google Scholar] [CrossRef]
- Wei, G.M.; Li, M.H.; Fang, Q.; Sun, W.; Jin, Z.L. Effect of ‘genetic’ rare earth on alloy dissolution behavior in micro-alloyed steel. Mater. Res. Express 2021, 8, 056511. [Google Scholar] [CrossRef]
- Li, Y.G.; Guo, F.; Wang, Y.W.; Cai, H.S.; Liu, L. Quantitative analysis of rare earth elements in Mg-Zn-RE (Ce, Y., Gd)-Zr alloy. Mater. Res. Express 2022, 9, 046518. [Google Scholar] [CrossRef]
- Tang, F.W.; Hou, C.; Lu, H.; Zhao, Z.; Song, X.Y. Grain-boundary segregation and grain growth in nanocrystalline substitutional solid solution alloys. J. Mater. Sci. Technol. 2024, 168, 239–249. [Google Scholar] [CrossRef]
- Tang, F.W.; Liu, X.M.; Wang, H.B.; Hou, C.; Lu, H.; Nie, Z.R.; Song, X.Y. Solute segregation and thermal stability of nanocrystalline solid solution systems. Nanoscale 2019, 11, 1813–1826. [Google Scholar] [CrossRef]
- Qu, W.; Hou, Y.; Li, W.; Liu, Y.B.; Xing, L.; Ren, H.P. Microstructure control and strength improvement of La0.005Al0.17FeCoCrNiMn high entropy alloy by rapid solidification and aging treatment. J. Alloys Compd. 2021, 874, 159960. [Google Scholar] [CrossRef]
- Khalid, S.; Ma, Y.; Sun, X.L.; Zhou, G.G.; Wu, H.C.; Lu, G.W.; Yang, Z.Q.; Khan, J.; Khenata, R.; Bouhemadou, A. Electronic and optical properties of Tl4GeX3 (X=S, Se and Te) compounds for optoelectronics applications: Insights from DFT-computations. J. Mater. Res. Technol. 2020, 9, 413–420. [Google Scholar] [CrossRef]
- Blöchl, P.E.; Jepsen, O.; Andersen, O.K. Improved tetrahedron method for Brillouin-zone integrations. Phys. Rev. B 1994, 49, 16223. [Google Scholar] [CrossRef]
- Kacher, J.; Landon, C.; Adams, B.L.; Fullwood, D. Bragg’s Law diffraction simulations for electron backscatter diffraction analysis. Ultramicroscopy 2009, 109, 1148–1156. [Google Scholar] [CrossRef]
- Menon, E.S.K.; Fox, A.G.; Mahapatra, R. Accurate determination of the lattice parameters of γ-TiAl alloys. J. Mater. Sci. Lett. 1996, 15, 1231–1233. [Google Scholar]
- Yang, M.; Guo, Z.X.; Xiong, J.; Liu, F.J.; Qi, K.F. Microstructural changes of (Ti, W) C solid solution induced by ball milling. Int. J. Refract. Met. Hard Mater 2017, 66, 83–87. [Google Scholar]
- Thirathipviwat, P.; Sato, S.; Song, G.; Bednarcik, J.; Nielsch, K.; Jung, J.; Han, J. A role of atomic size misfit in lattice distortion and solid solution strengthening of TiNbHfTaZr high entropy alloy system. Scr. Mater. 2022, 210, 114470. [Google Scholar]
- Roy, A.; Sreeramagiri, P.; Babuska, T.; Krick, B.; Ray, P.K.; Balasubramanian, G. Lattice distortion as an estimator of solid solution strengthening in high-entropy alloys. Mater. Charact. 2021, 172, 110877. [Google Scholar]
- Britvin, S.N.; Bogdanova, A.N.; Boldyreva, M.M.; Aksenova, G.Y. Rudashevskyite, the Fe-dominant analogue of sphalerite, a new mineral: Description and crystal structure. Am. Mineral. 2008, 93, 902–909. [Google Scholar]
- Olsson, P.; Klaver, T.P.C.; Domain, C. Ab initio study of solute transition-metal interactions with point defects in bcc Fe. Phys. Rev. B Condens 2010, 81, 054102. [Google Scholar] [CrossRef]
- You, Y.; Yan, J.H.; Yan, M.F.; Zhang, C.S.; Chen, H.T.; Wang, Y.X.; Zhang, Y.X.; Wang, C.H. La interactions with C and N in bcc Fe from first principles. J. Alloys Compd. 2016, 688, 261–269. [Google Scholar]
- Yu, X.; Lin, G.T.; Zhang, Z.H.; Xie, J.X. Electronic structure characteristics of Fe-6.5 wt% Si alloy doped with rare earth elements and its effect on mechanical properties. J. Alloys Compd. 2020, 843, 155916. [Google Scholar]
- Wu, X.F.; Zhao, F.; Chen, M.G.; Ji, Z.H.; Ma, Q. A simple way of calculating the change in the Gibbs’ free energy of ion adsorption reactions. Adsorpt. Sci. Technol. 2009, 27, 1–17. [Google Scholar]
- Qu, W.; Ji, C.; Min, L.L.; Liu, Y.B.; Li, W.; Xing, L.; Ren, H.P. Super capacity of boron on the grain refinement of FeCoCrNiMn high entropy alloy. J. Alloys Compd. 2023, 945, 169320. [Google Scholar] [CrossRef]
- De Boer, F.R.; Mattens, W.C.M.; Boom, R.; Miedema, A.R.; Niessen, A.K. Cohesion in Metals. Transition Metal Alloys; U.S. Department of Energy Office of Scientific and Technical Information: Oak Ridge, TN, USA, 1988.
- Dawson, J.A.; Tanaka, I. Local structure and energetics of Pr-and La-doped SrTiO3 grain boundaries and the influence on core-shell structure formation. J. Phys. Chem. C 2014, 118, 25765–25778. [Google Scholar] [CrossRef]
- Zhang, Y.W.; Zhao, S.J.; Weber, W.J.; Nordlund, K.; Granberg, F.; Djurabekova, F.G. Atomic-level heterogeneity and defect dynamics in concentrated solid-solution alloys. Curr. Opin. Solid State Mater. Sci. 2017, 21, 221–237. [Google Scholar] [CrossRef]
- Qu, W.; Hou, Y.; Li, W.; Xing, L.; Liu, Y.B.; Ren, H.P. Enhancing strength via nano-lattice defects in La0.008Al0.08FeCoCrNiMn high-entropy alloy produced by rapid solidification, cold rolling and annealing. Mater. Sci. Eng. A 2022, 839, 142860. [Google Scholar] [CrossRef]
- Williamson, G.K.; Hall, W.H. X-ray line broadening from filed aluminium and wolfram. Acta Metall. 1953, 1, 22–31. [Google Scholar] [CrossRef]
- Tanbir, K.; Ghosh, M.P.; Kar, M.; Mukherjee, S. Tailoring the microstructural, magnetic and dielectric properties of vanadium ions substituted nickel ferrite nanocrystals. J. Mater. Sci. Mater. Electron. 2021, 32, 10140–10150. [Google Scholar]
- Zak, A.K.; Majid, W.H.A.; Abrishami, M.E.; Yousefi, R. X-ray analysis of ZnO nanoparticles by Williamson-Hall and size-strain plot methods. Solid State Sci. 2011, 13, 251–256. [Google Scholar]
Disclaimer/Publisher’s Note: The statements, opinions and data contained in all publications are solely those of the individual author(s) and contributor(s) and not of MDPI and/or the editor(s). MDPI and/or the editor(s) disclaim responsibility for any injury to people or property resulting from any ideas, methods, instructions or products referred to in the content. |
© 2025 by the authors. Licensee MDPI, Basel, Switzerland. This article is an open access article distributed under the terms and conditions of the Creative Commons Attribution (CC BY) license (https://creativecommons.org/licenses/by/4.0/).