Abstract
High-chromium white iron (HCWI) alloys are often used in industries such as mining which require a high wear resistance. Whilst nitrogen is known as a good austenitic stabiliser, the effects of nitrogen on corrosion properties for welded HCWI have not been studied. Chromium hardfacing alloys were deposited via gas metal arc welding using nitrogen as a shielding gas at flow rates of 5 L/min, 10 L/min, and 15 L/min. The corrosion behaviour of these modified alloys was studied using electrochemical techniques such as potentiodynamic measurements and electrochemical impedance spectroscopy. Higher gas flow rates were found to increase the volume fraction of the eutectic austenite while reducing the amounts of eutectic carbides. Nitrogen did not transform the M7C3 (M = Cr, Fe) carbides into any other form of carbides. The sample without nitrogen as a shielding gas was found to display the worst corrosion resistance after electrochemical testing, such as corrosion resistance parameters in EIS tests. Higher nitrogen shielding gas flow rates were found to produce higher levels of corrosion resistance; this was especially true for the 15 L/min sample with a corrosion resistance parameter to EIS that was more than double that of the sample without nitrogen shielding gas (e.g., 4700 vs. 2325 Ω·cm2 respectively).
1. Introduction
Hardfacing coatings based on high-chromium white irons are used extensively in several industries requiring wear resistance, including mining and metallurgy. The selection of the alloys is based mainly on hardness [1]. AS/NZS 2576:2005 [1] provides guidance on the selection of welded hardfacing alloys based on specifications of the chemical composition and microstructure. High-chromium white iron (HCWI) contains a high chromium content, typically above 12%, and a carbon content above 2% in order to provide high wear resistance when the two elements combine to form carbides [2]. Additionally, high levels of chromium are advantageous in resisting corrosion due to its ability to form passive Cr2O3 layers. Although the alloy selection is based on hardness, resistance to corrosion is also important as the materials are used in a variety of environments.
Hardfacing can be applied through a variety of methods such as thermal spraying, laser cladding, or weld deposition. Weld deposition of hardfacing alloys is covered in this paper. The properties of the weld hardfacing can be modified by a suitable shielding gas based on the properties required. Shielding gases play a critical role in protecting welds from reacting with atmospheric contaminants such as oxygen and carbon dioxide, as well as increasing the penetration of welds. However, inappropriate selection of shielding gas may lead to undesirable effects, including increased oxidation or the formation of porosities in the deposited material.
Nitrogen is one type of shielding gas commonly used in welding. It is considered to be inert, as well as being less expensive than other shielding gases such as helium and argon [3]. Moreover, research has shown that trace amounts of nitrogen within the molten weld pool can improve properties such as tensile strength [4] as well as wear resistance through solid solution strengthening and stimulating the precipitation of secondary carbides [5]. Shielding gases with as little as 2% nitrogen added to the protective atmosphere have been found to improve the stability of passive films and reduce the effects of stress corrosion within duplex stainless steel [6]. Additionally, nitrogen can serve as an austenitic stabiliser [7], increasing the proportion of the austenite phase within the metal, resulting in further increases in corrosion resistance [3]. In hardfacing alloys, this may also improve toughness [1].
Conversely, care must be regarding nitrogen shielding gas levels to prevent oversaturation within the metal. Not only can this result in excess porosity during deposition [8], but the precipitation of nitrides such as Cr2N 2N and Fe4N can reduce toughness and increase embrittlement [3,9]. Varying recommendations have been made regarding the optimisation of nitrogen as a shielding gas. For instance, using Gas Tungsten Arc Welding (GTAW) for high-nitrogen stainless steels, one researcher suggested that nitrogen when used as a shielding gas with argon or helium should be limited at 20% [10]. However, another study has suggested that nitrogen should be limited to 6% to minimise porosity [11].
For high-chromium irons produced by casting, increasing the amount of nitrogen has been found to result in the precipitation of Cr2N, as well as refining primary carbides and increasing austenitic content. Research by Yawei et al. has found that a content of 0.15 wt% N in the metal enhances wear resistance, whilst a content of 0.30 wt% N provides the best corrosion resistance [12]. Similarly, another study on high-chromium cast irons found the optimum wear resistance to be 0.15 wt% N, though maximum toughness was observed at 0.093 wt% N [13]. Given the industrial applications of HCWI alloys in abrasive and high-wear environments, improving wear and corrosion resistance is of considerable significance [14,15].
While it has been shown in the literature how the use of nitrogen as a shielding gas affects alloys such as stainless steels [16,17], as well as its effects when used as a casting additive [14], its effects on HCWI when deposited by welding do not appear to have been studied. As such, the modification of HCWI properties using nitrogen as a shielding gas as a means of controlling the presence of carbides and austenite and improving corrosion resistance is of interest in future research. The present study seeks to achieve this research by comparing four different HCWI alloys: one that has been deposited under regular conditions (without nitrogen), and three other alloys that have been deposited using a nitrogen shielding gas at flow rates of 5 L/min, 10 L/min, and 15 L/min.
2. Materials and Methods
2.1. Material Preparation
Commercially available hardfacing wire (Supershield CrC) [18] was deposited onto a mild steel substrate using gas metal arc welding (GMAW). The hardfacing alloy produces chromium carbides to provide the wear resistance; generally, eutectic austenite also provides moderate toughness. The typical composition of the weld metal provided by the manufacturer is given in Table 1.

Table 1.
Typical composition of Supershield CrC weld metal.
The wire was manually deposited using a gas metal arc welding machine using a voltage and current of 32 V and 350 A, respectively, along with a wire feed speed of 11.5 m/min, and a travel rate of 400 mm/min. Welding parameters were selected based on manufacturer recommendations. As per AS/NZS 2576:2005, a minimum of four welding layers was applied in order to reduce dilution effects between the substrate and deposited material, for a total depositional thickness layer of 1.5 cm.
Four different sample sets were created using nitrogen as shielding gas during welding deposition. These are as described in Table 2.
Table 2.
Nitrogen gas flow rate treatments.
After deposition, the topmost layer was cut off to expose a flat 2 cm by 2 cm surface. This flat surface of the top surface was used for surface characterisation and electrochemical testing.
Artificial seawater was used for electrochemical testing. Artificial seawater as per ASTM D1141-98 [19] was as shown in Table 3.
Table 3.
Composition of artificial seawater.
2.2. Surface Characterisation
Samples were polished to 1 µm finish. and etched using 5% Nital for 20 s.
Surface characterisation was carried out on a PhenomXL Scanning Electron Microscope (SEM) (Thermofisher, Adelaide, Australia) fitted with an EDS instrument and this was performed before and after corrosion measurements. Images taken using SEM were analysed using imageJ software (version 1.54) for gauging the carbide volume fraction. The PANanalytical Empyrean machine was used to take X-ray diffraction measurements, using a copper target, for a step size of 0.0394° and a duration of 300 s per step from 2θ = 20 to 90°. Cu Kα-1 and Kα-2 had values of 1.5406 and 1.5444 Angstroms, respectively, whilst a Kα ratio of 0.5 was used.
The hardness of the samples was evaluated using a DuraScan 70 machine with a 0.05 kgf load.
2.3. Electrochemical Testing
Electrochemical testing of the samples was conducted using a three-electrode set up on the flat top surface of the samples. This was performed using a Gamry 3000 potentiostat (sourced from Menai, Australia), using an Ag/AgCl reference electrode, a platinum-coated counter electrode, in artificial seawater as the test medium. The electrochemical tests conducted were potentiodynamic testing, potentiostatic testing, and electrochemical impedance spectroscopy (EIS).
Before running the tests, all samples were polished to 1 μm and then subsequently exposed to the artificial seawater solution for sixty minutes to let the system normalise. The Open Circuit Potential (OCP) was measured over a course of ten minutes before carrying out the electrochemical tests. For potentiodynamic tests, polarisation was started from −0.2 V below OCP to transpassive potential at a scan rate of 0.167 mV/s. Using Gamry Echem Analyst software (version 7.9.0), potentiostatic points were chosen to gauge the behaviour of the alloy at different potentials. After potentiostatic testing, surface characterisation and compositional analysis was undertaken after gently rinsing the samples with water to remove any surface products.
Similarly, EIS measurements were taken after polishing the sample and exposure to the artificial seawater system for an hour. OCP was recorded for ten minutes before the EIS test, in the frequency range of 0.1–100,000 Hz.
3. Results
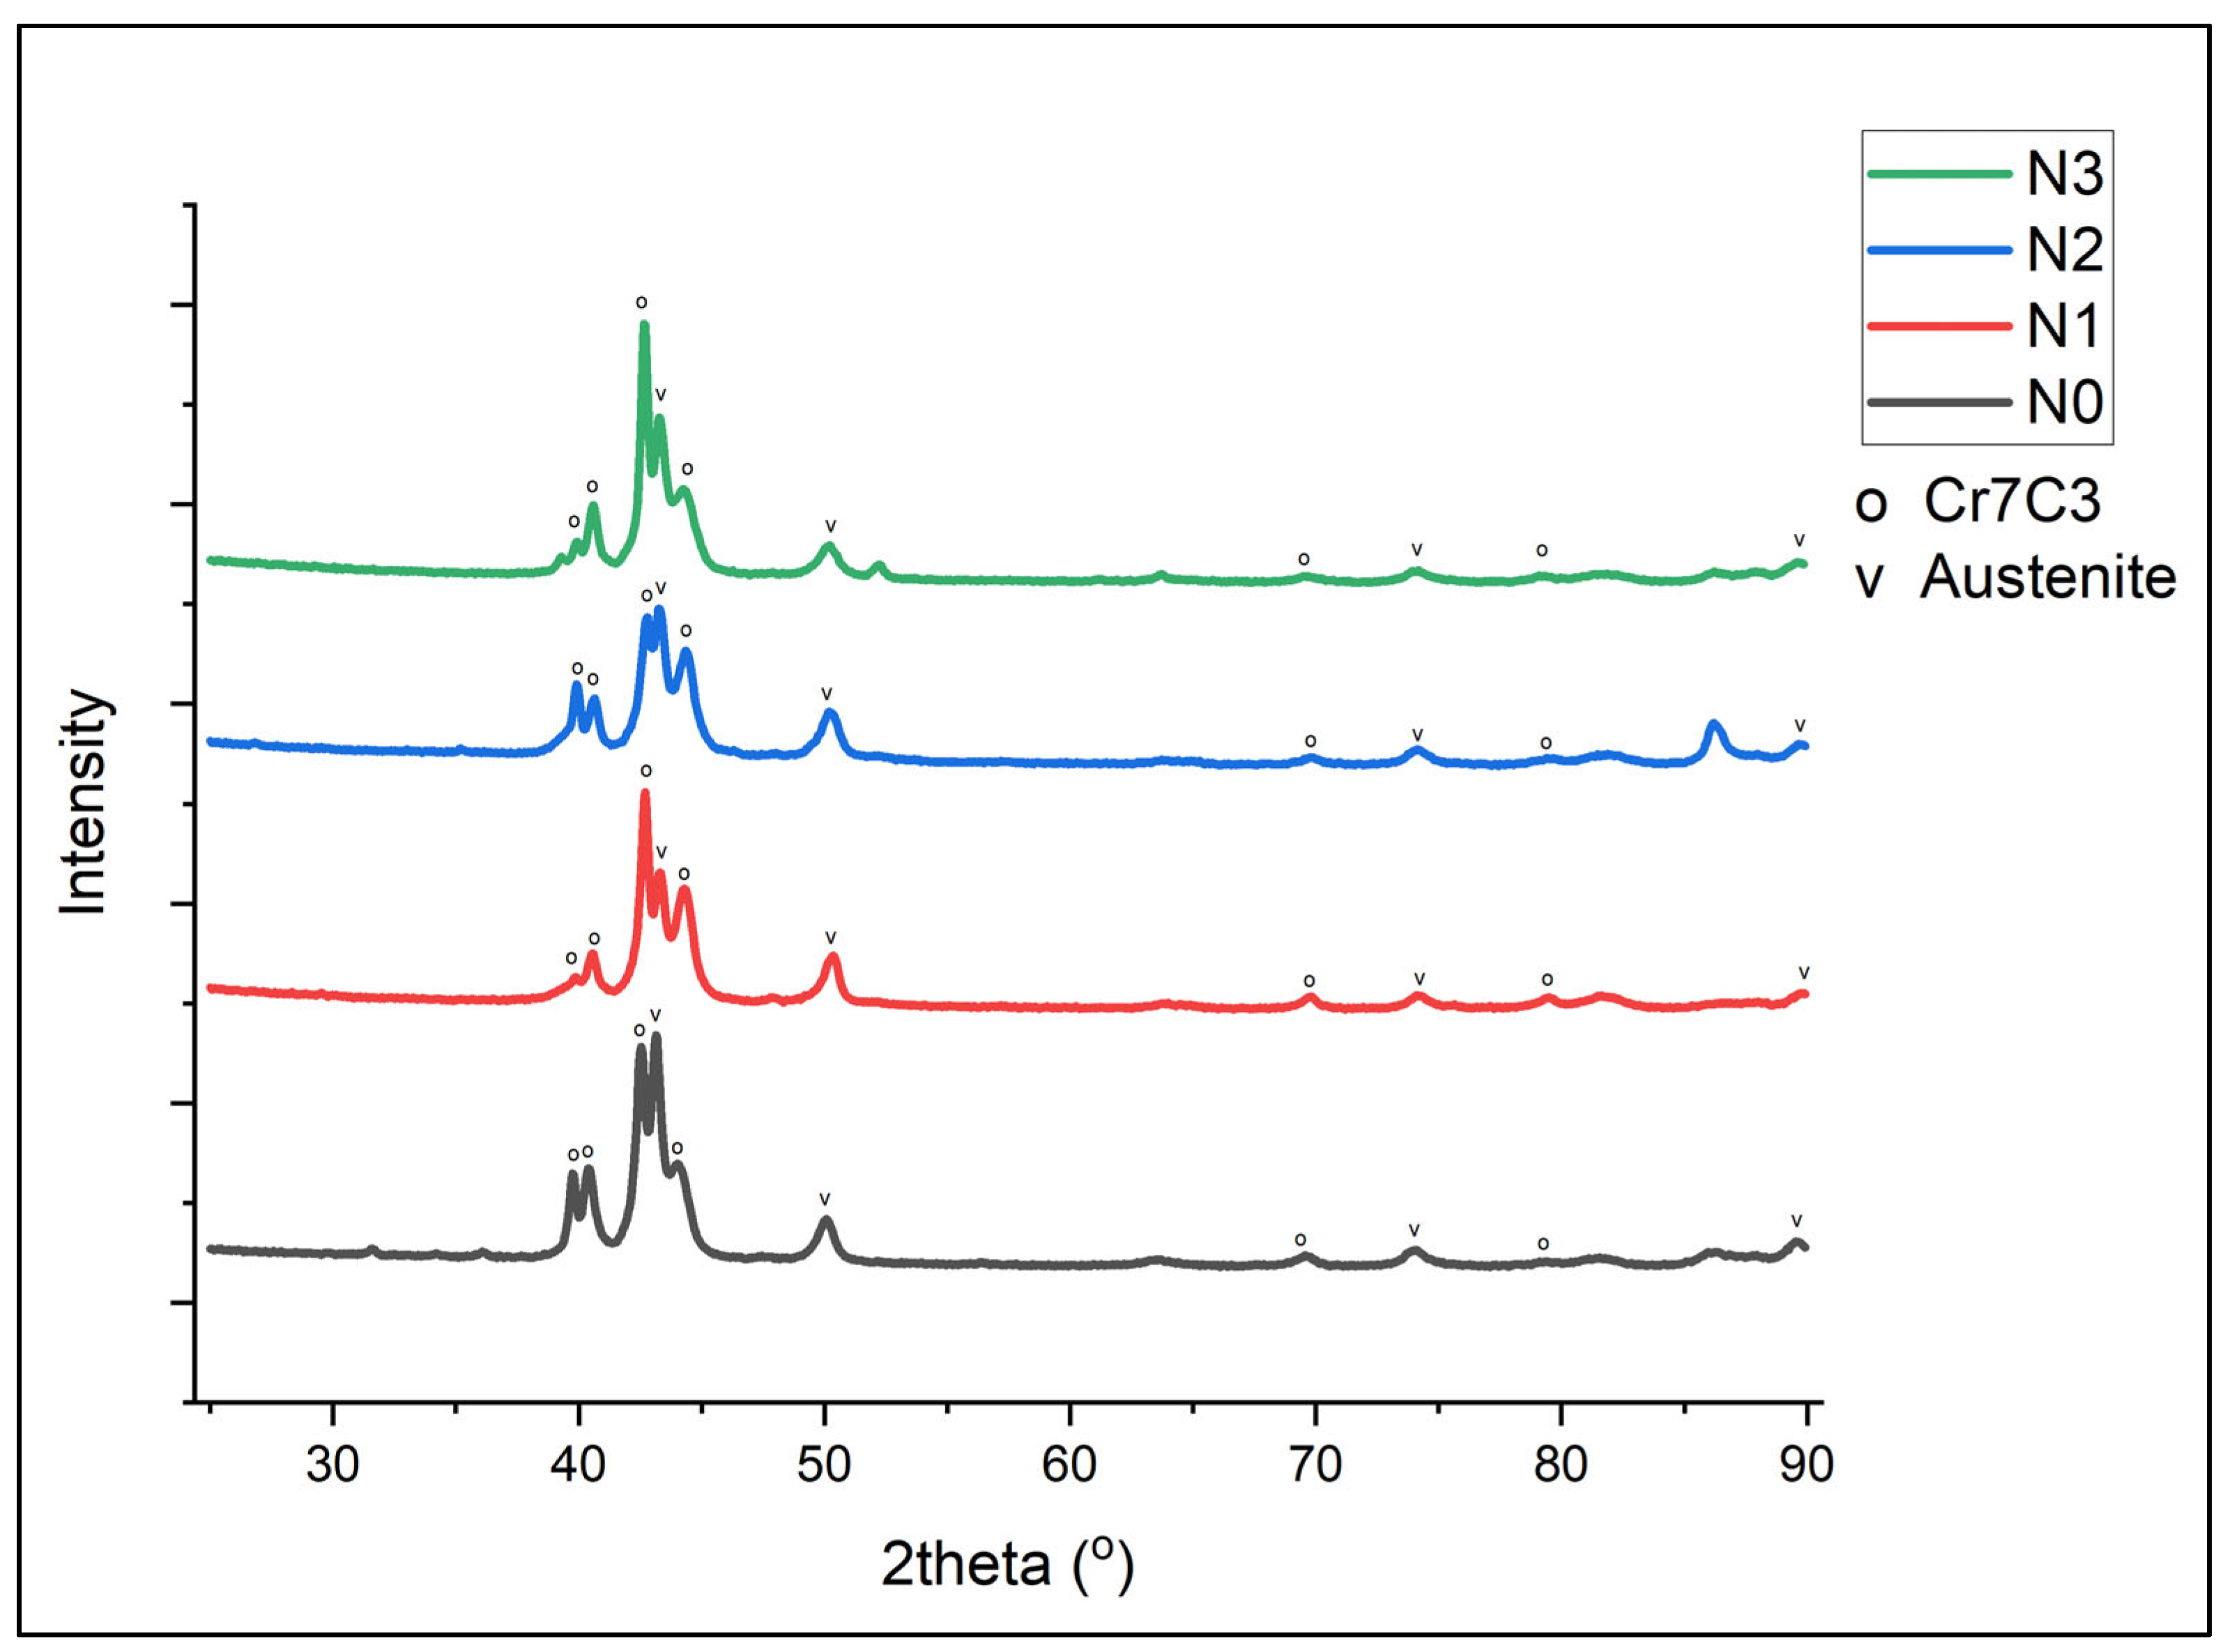
3.1. X-Ray Diffraction
The XRD of Samples N0 to N3 is shown in Figure 1. It can be seen that the primary form of carbides was Cr7C3, along with peaks matching austenitic and martensitic structures [12].
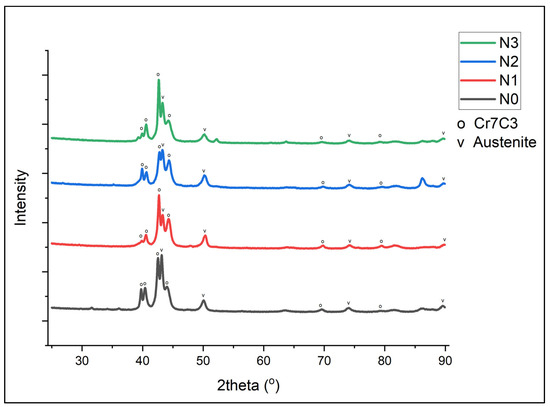
Figure 1.
XRD plot for Alloy N0.
3.2. Microstructural Characterisation and Hardness
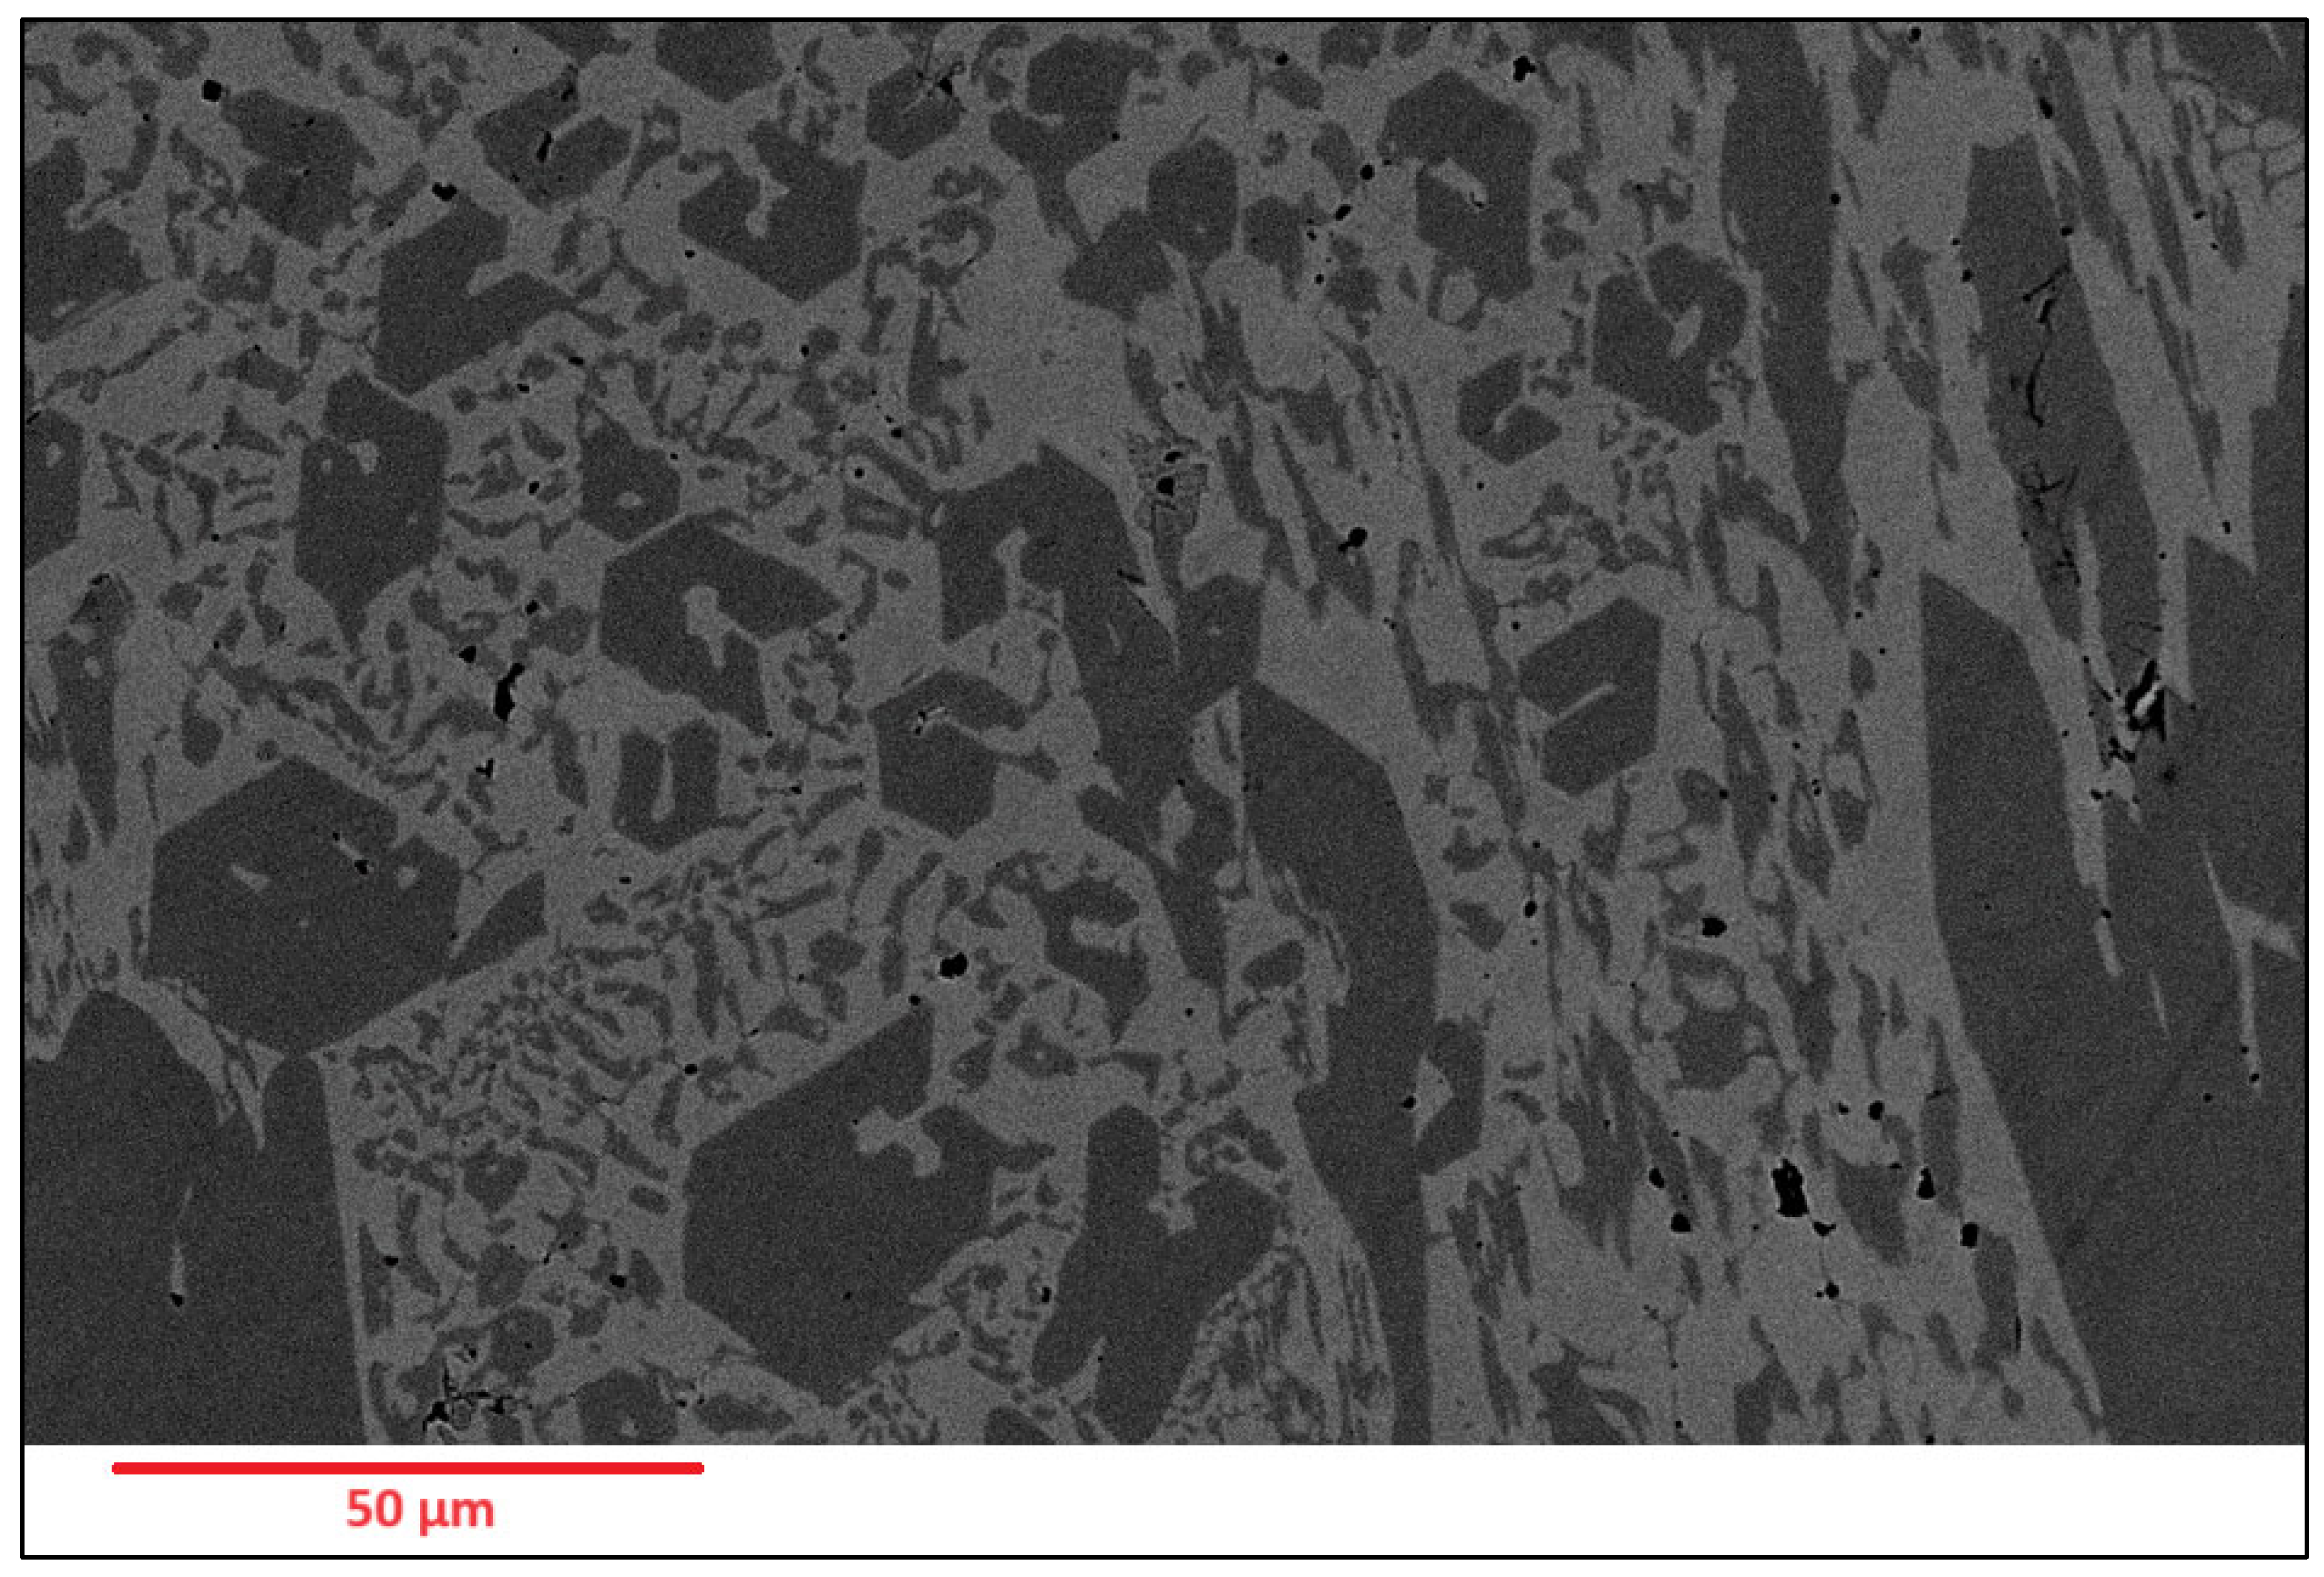
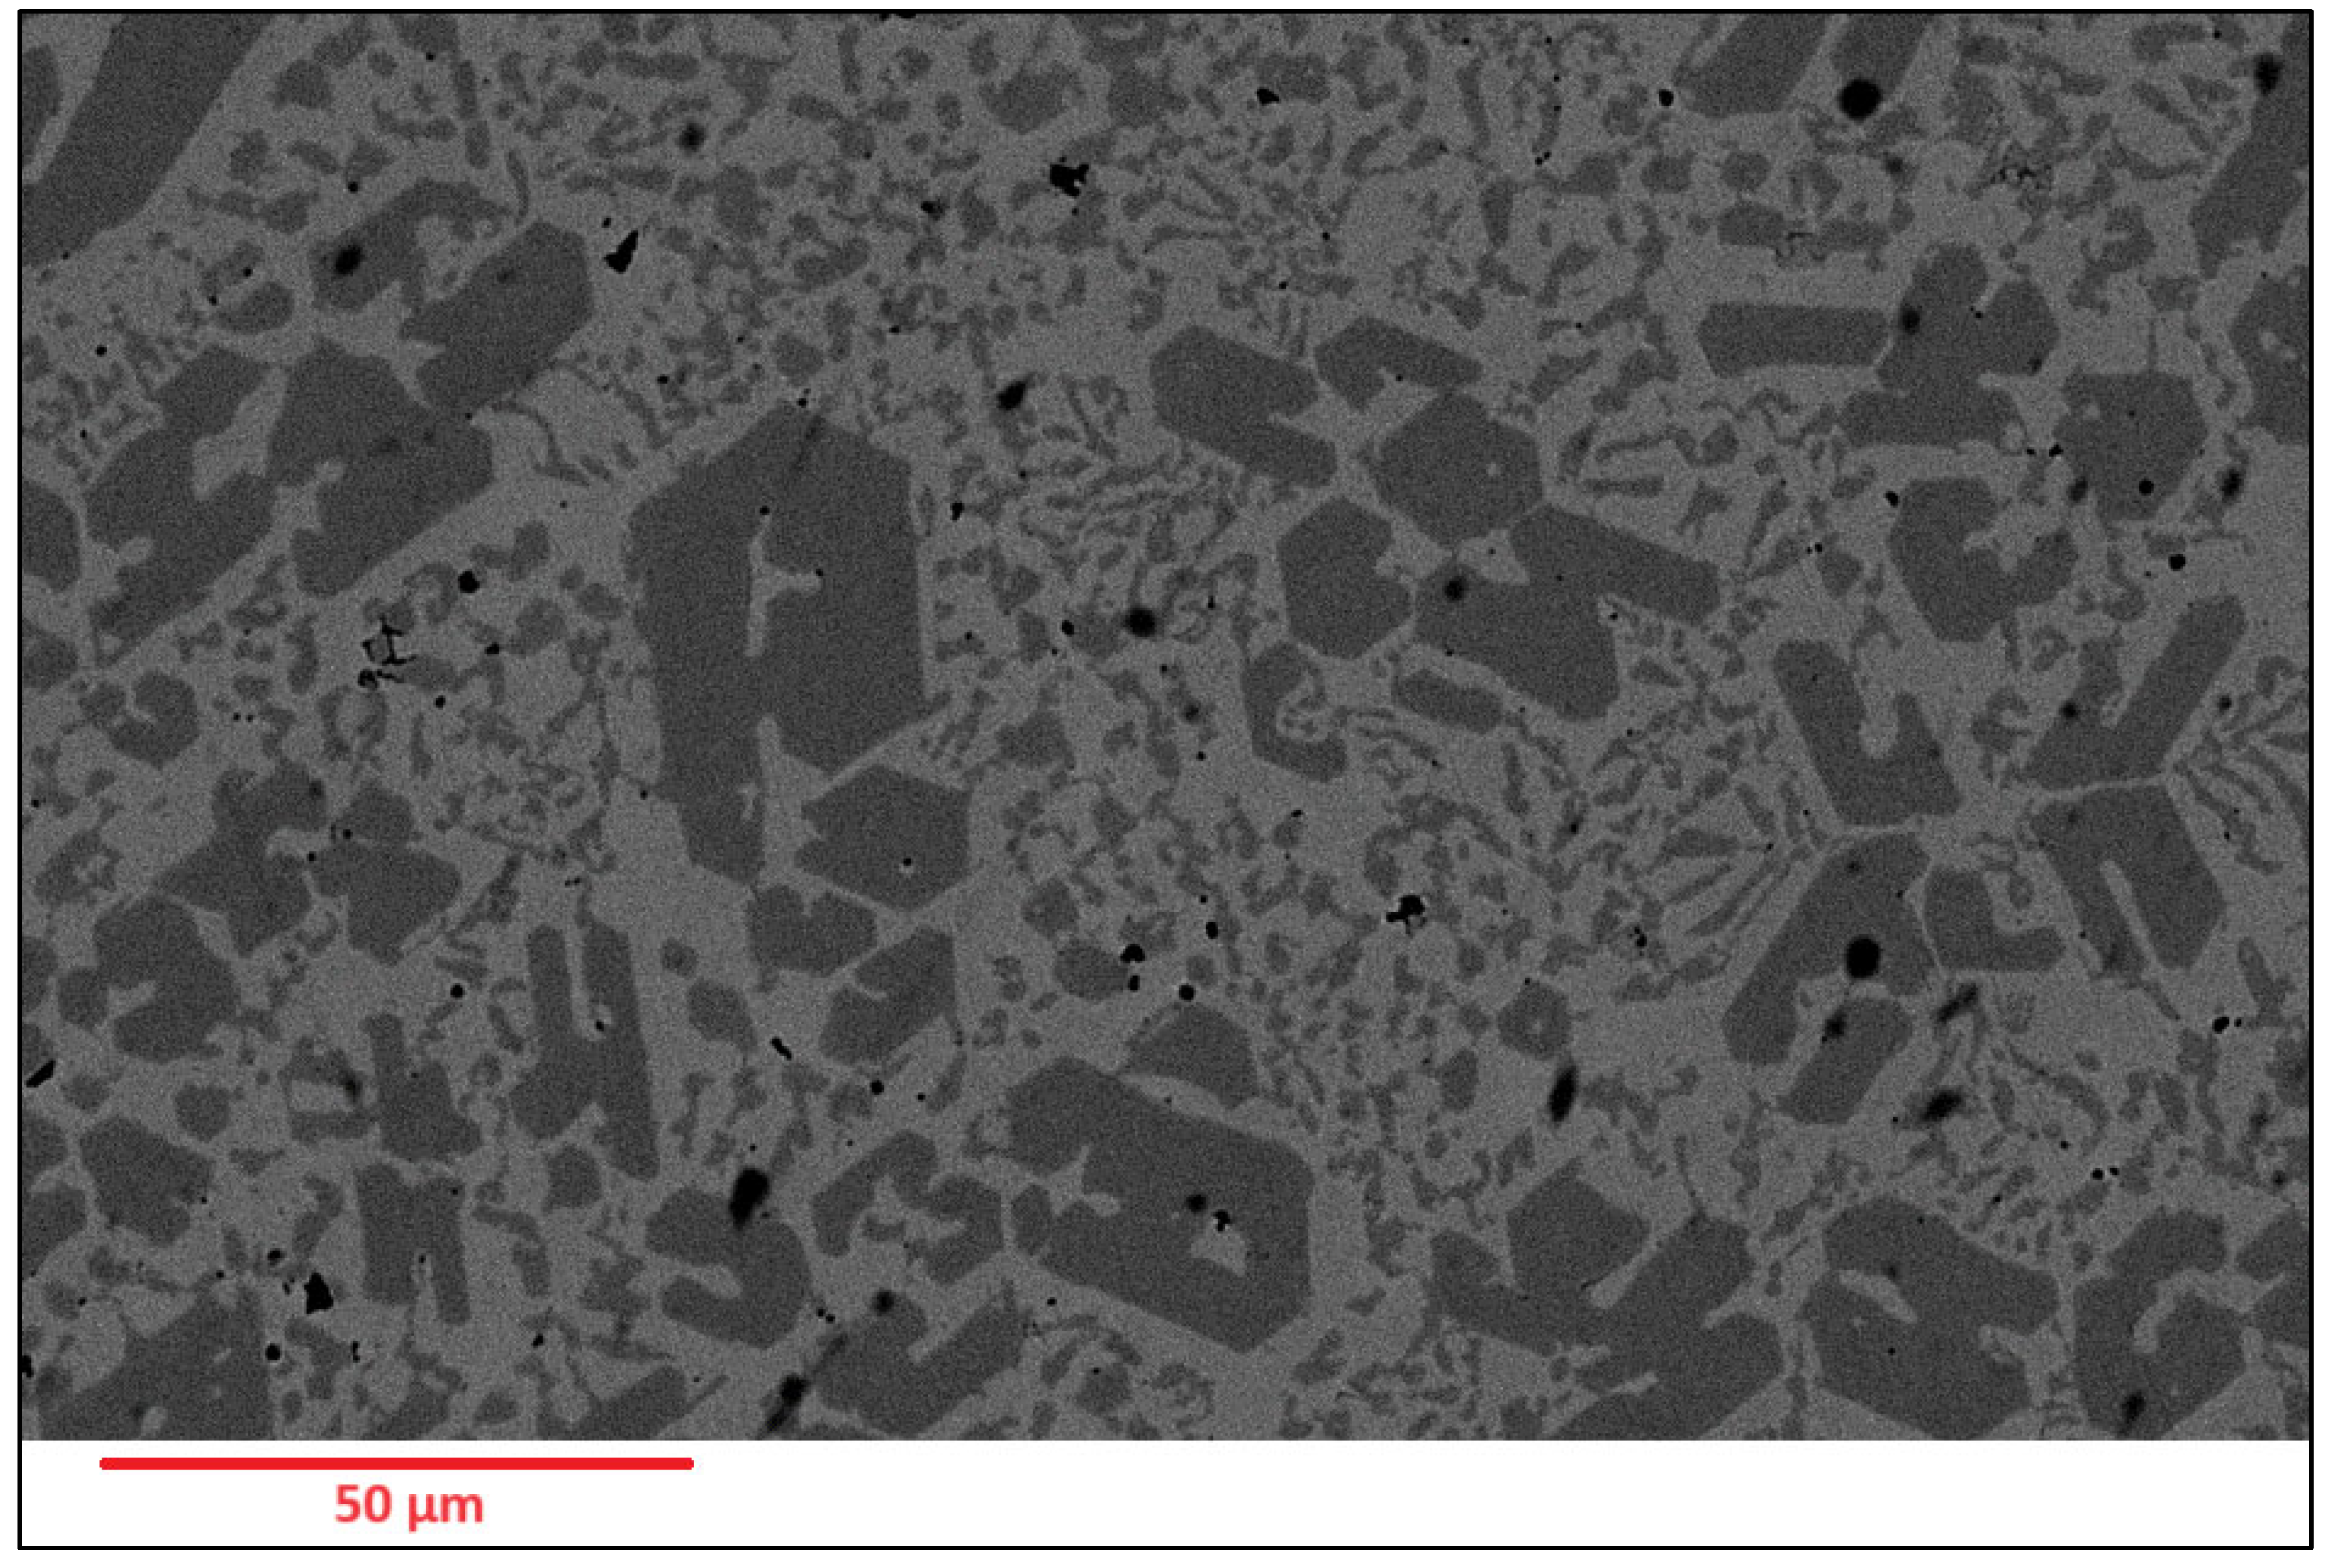
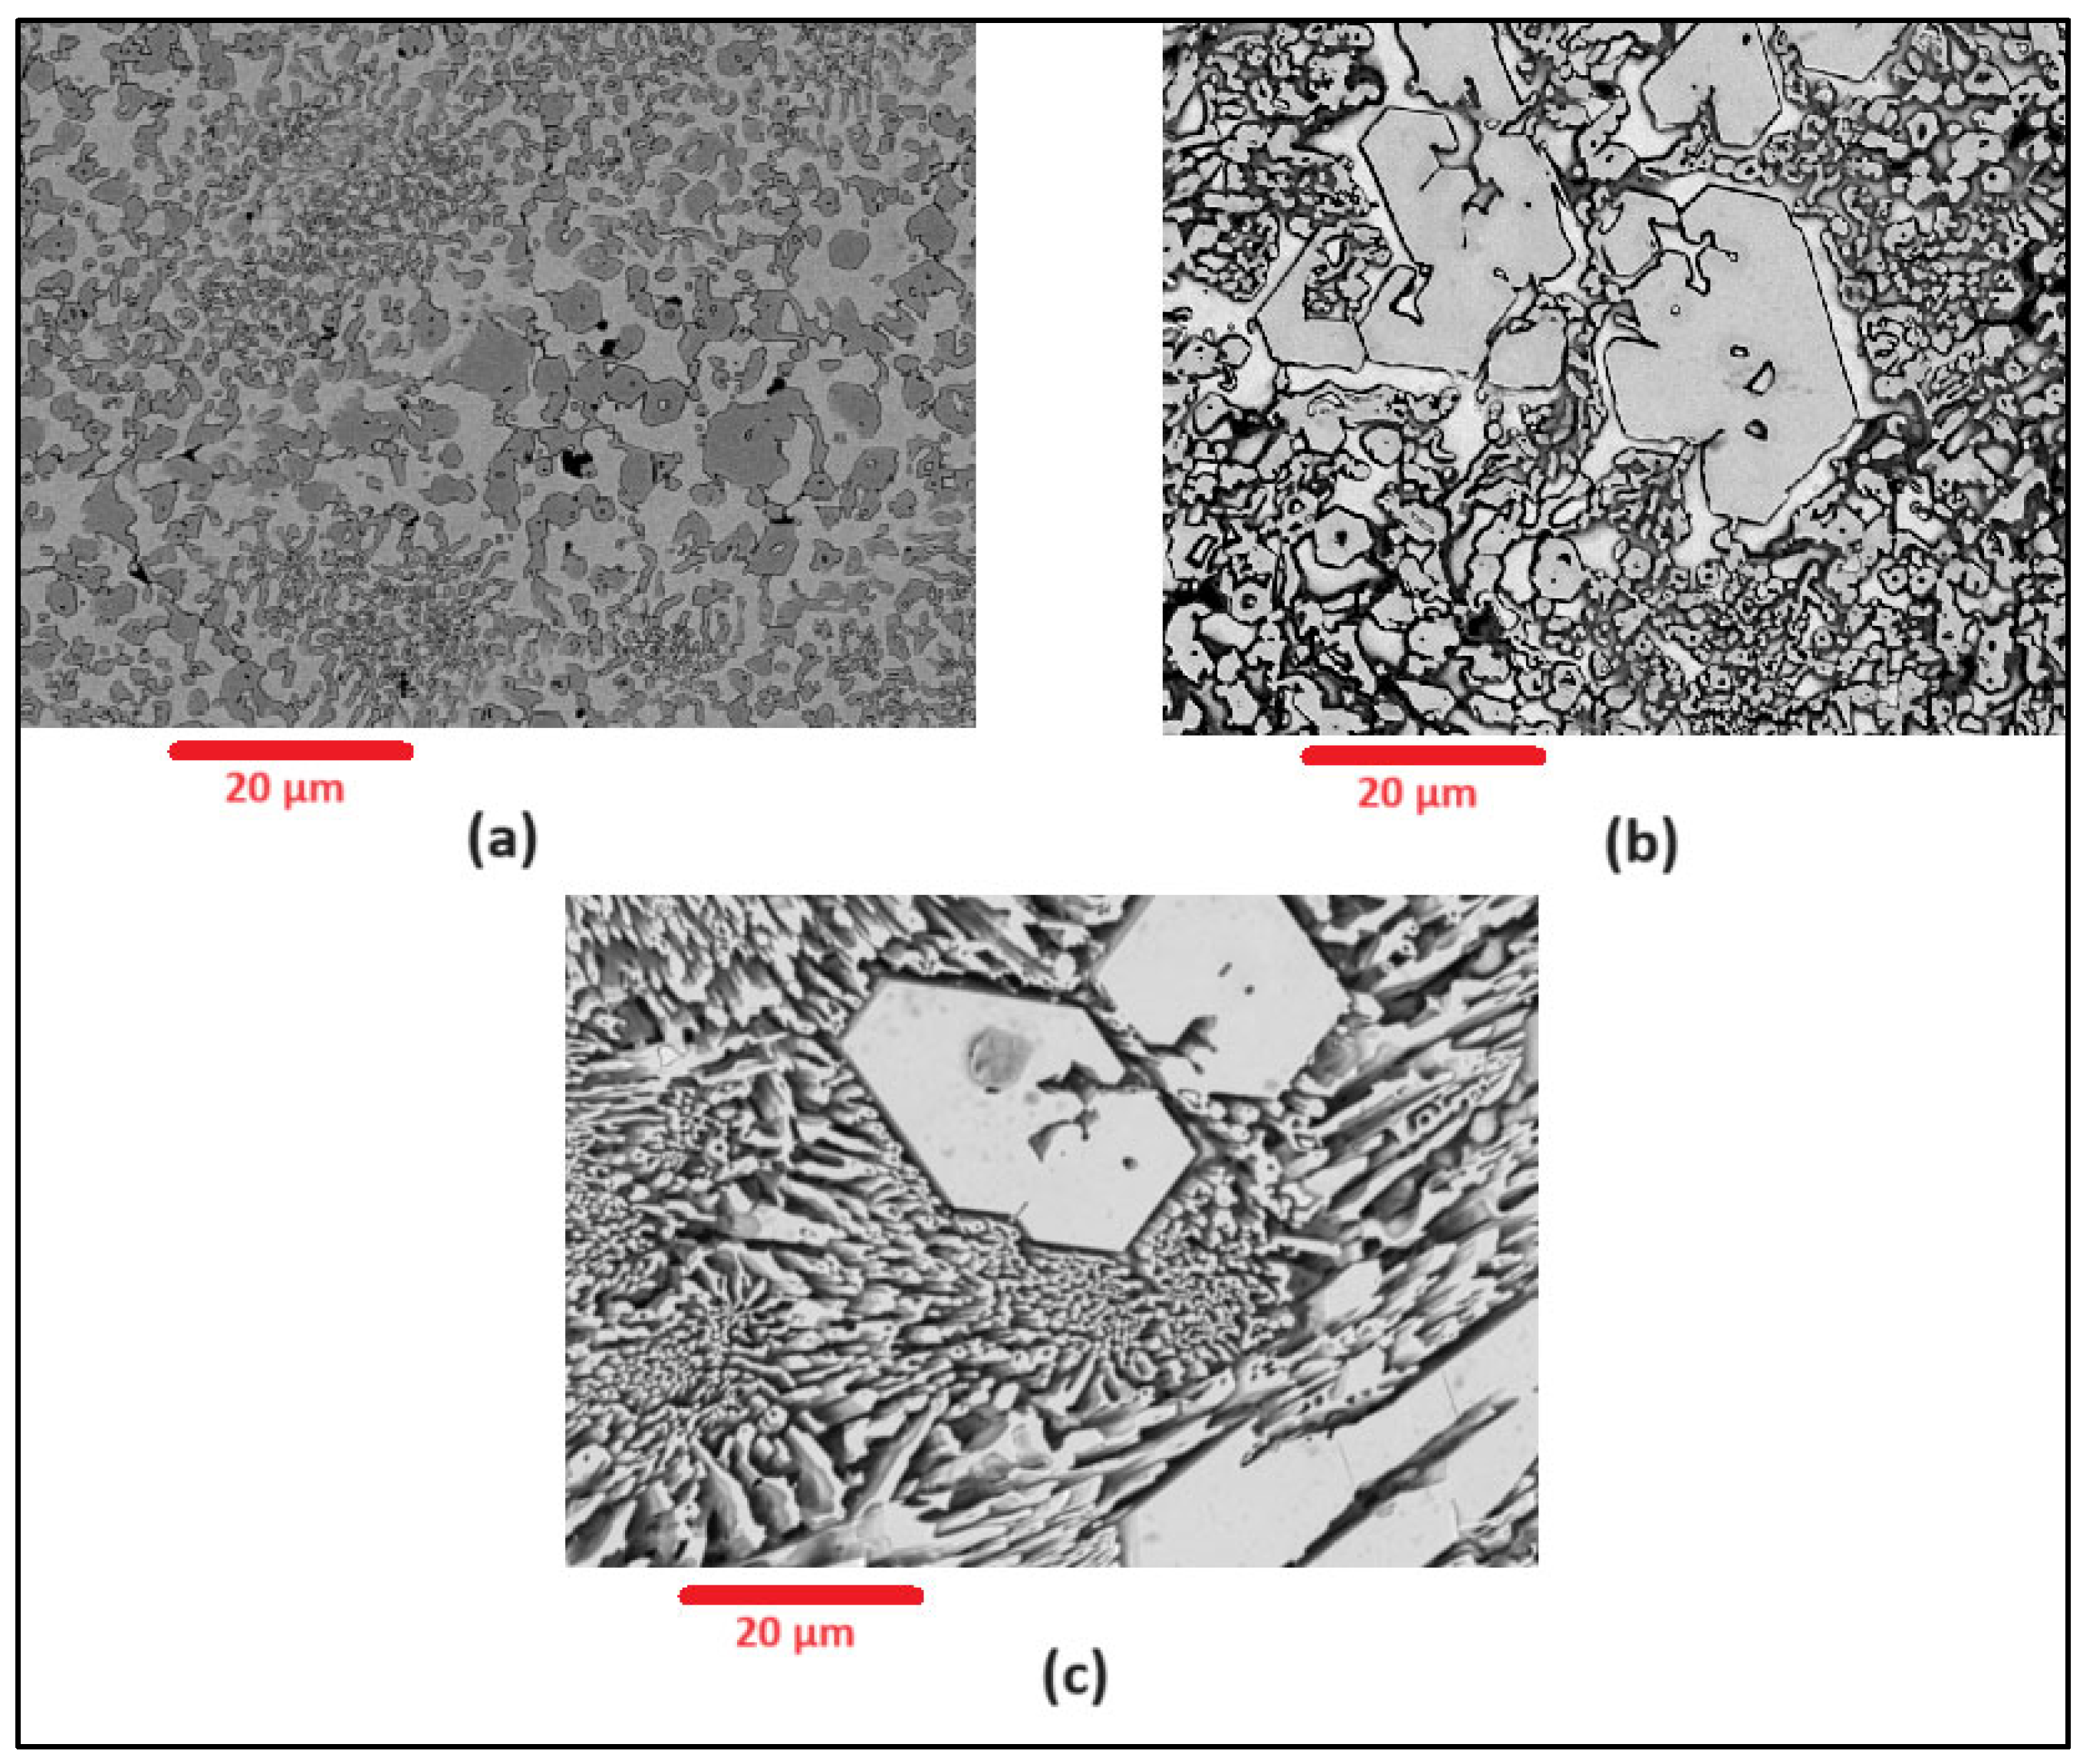
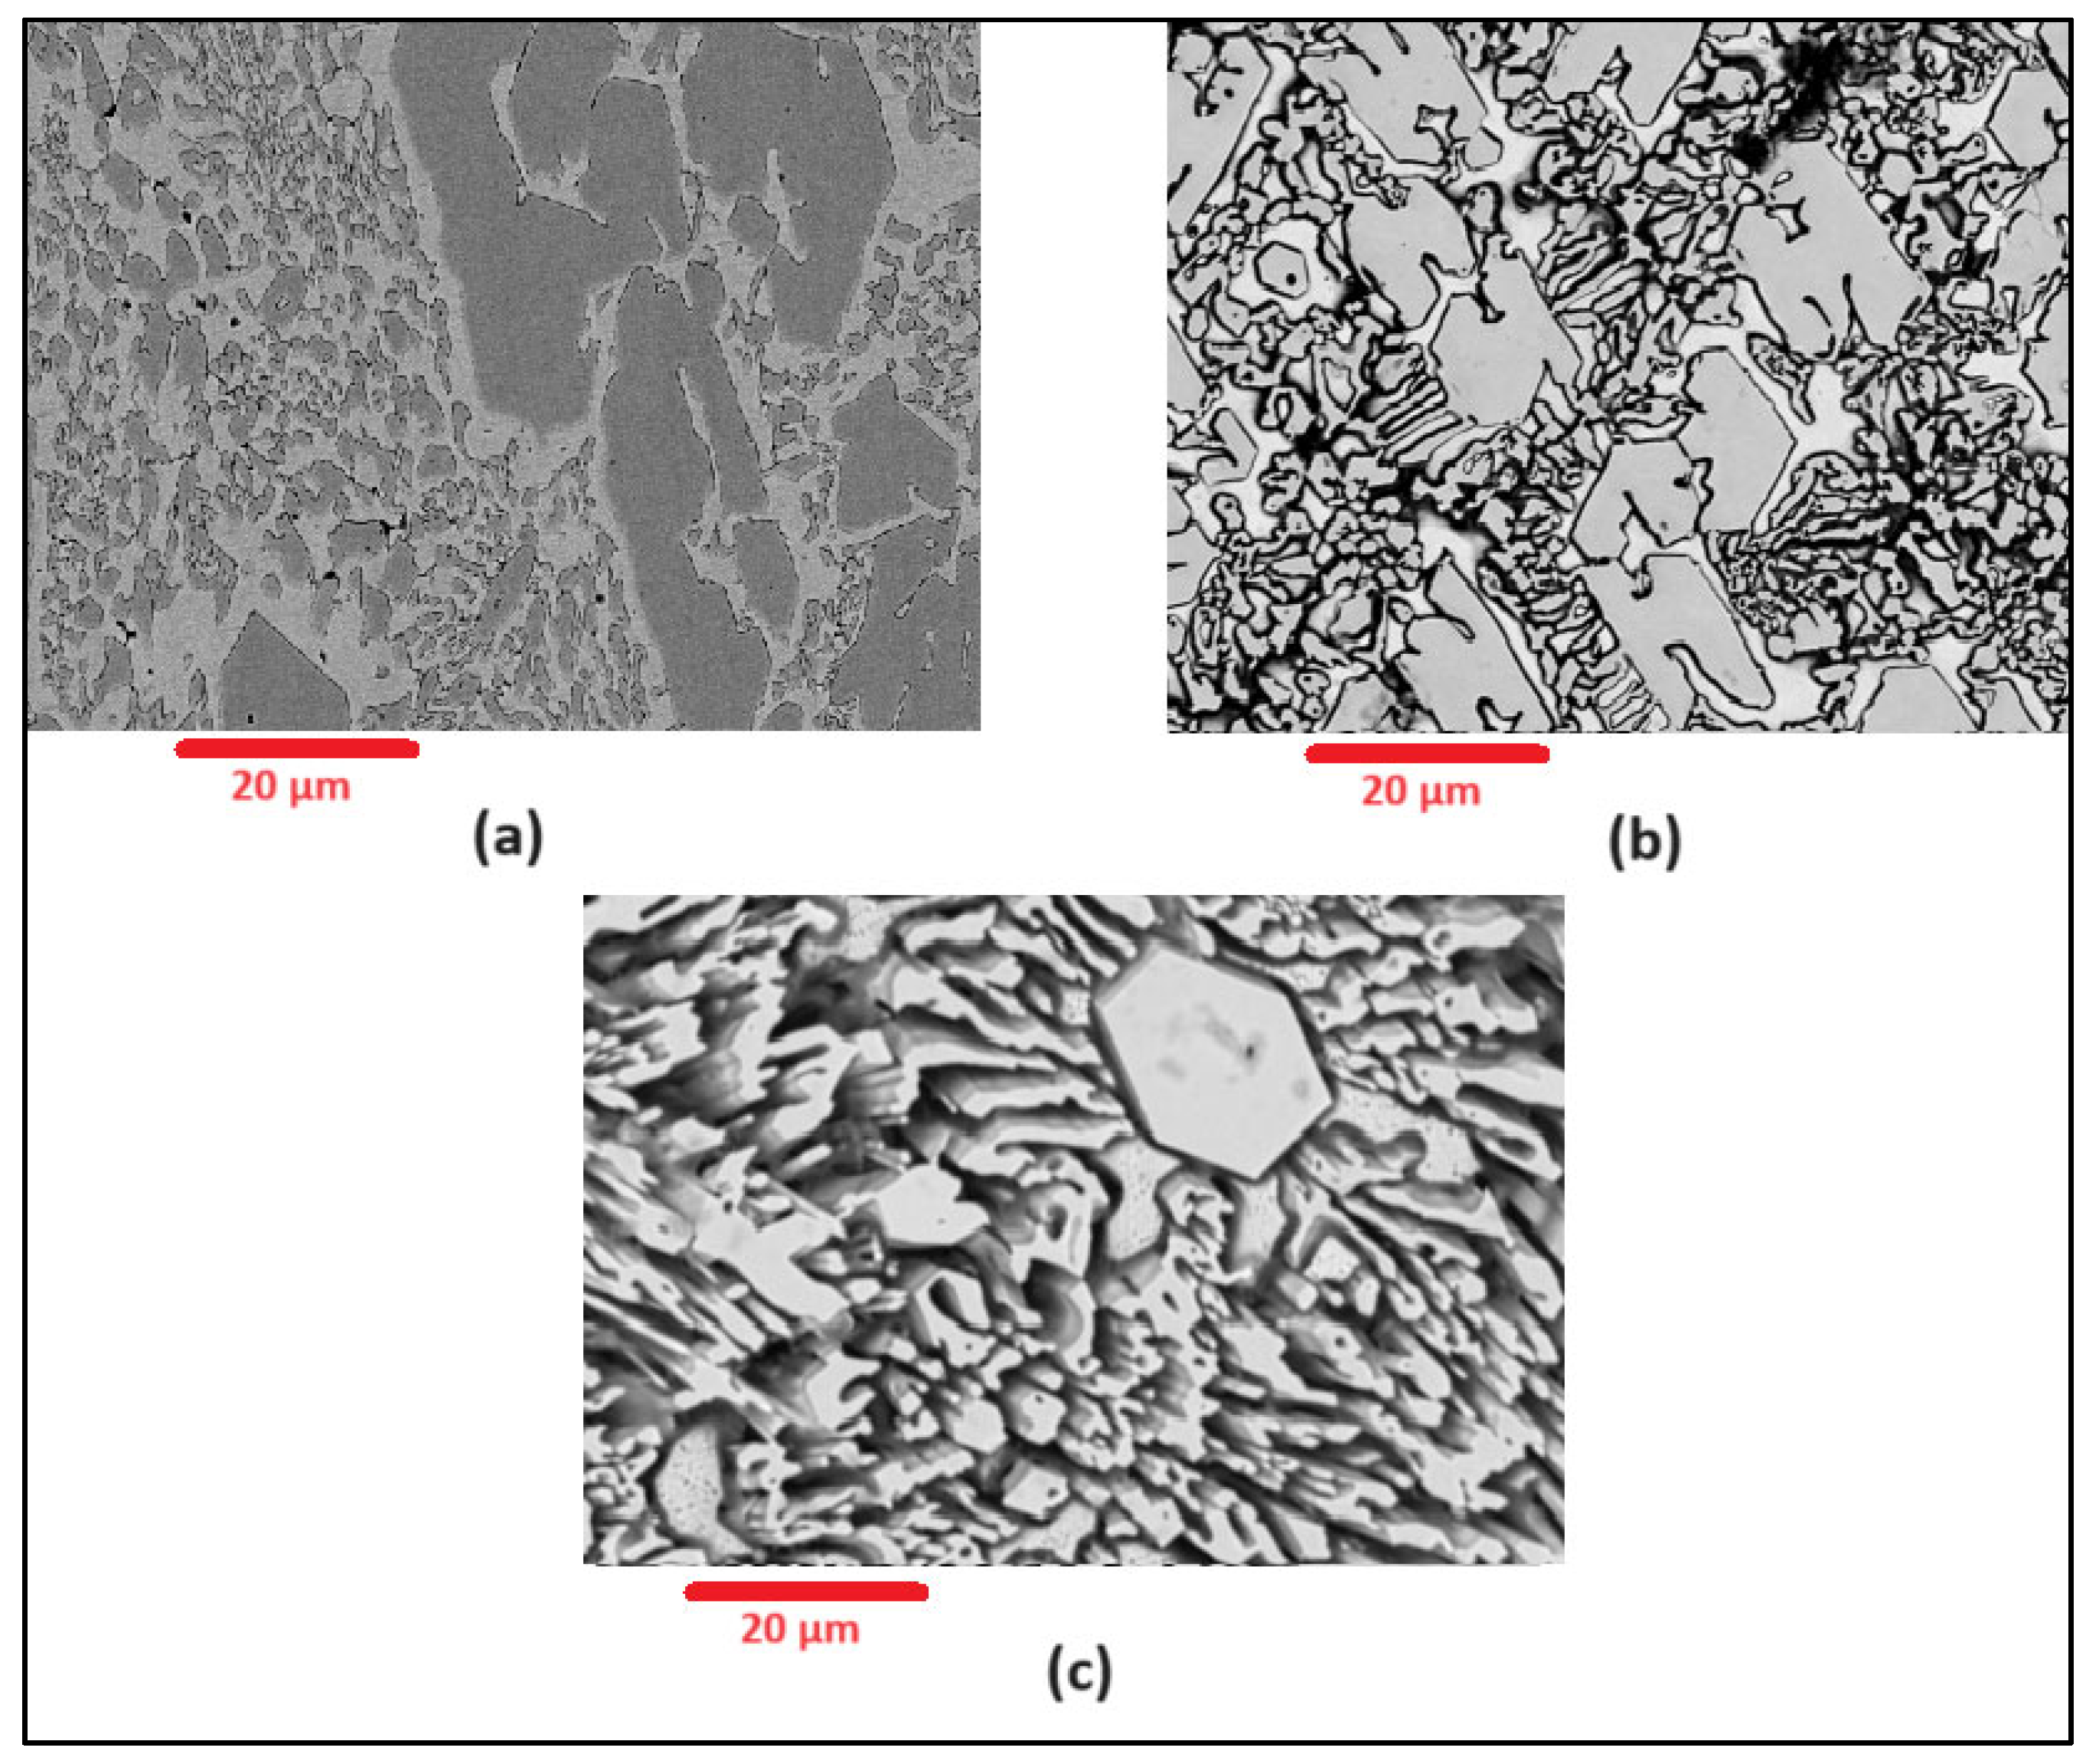
Scanning Electron Microscopy (SEM) images of the deposited surfaces are as shown in Figure 2, Figure 3, Figure 4 and Figure 5 with various amounts of nitrogen. Points A, B, and C in Figure 2, appear to show a number of larger carbides, surrounded by smaller eutectic carbides and austenite. As seen in Figure 2, Figure 3, Figure 4 and Figure 5, both the primary and secondary eutectic carbides are in line with the standards [1], with carbides appearing dark and austenite appearing light in Figure 2, Figure 3, Figure 4 and Figure 5.

Figure 2.
As-deposited surface of Alloy N0, showing (A) primary carbide (polygonal-shaped), (B) eutectic carbides (dark, finer-shaped) and (C) austenite (light-coloured).
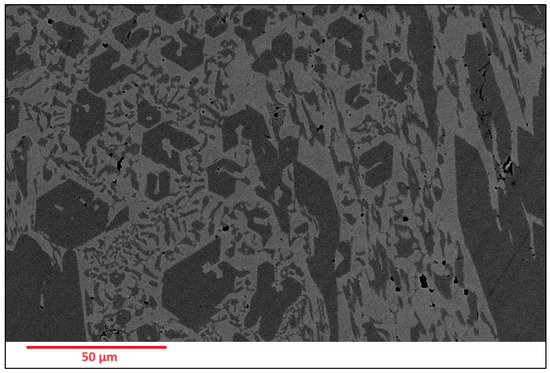
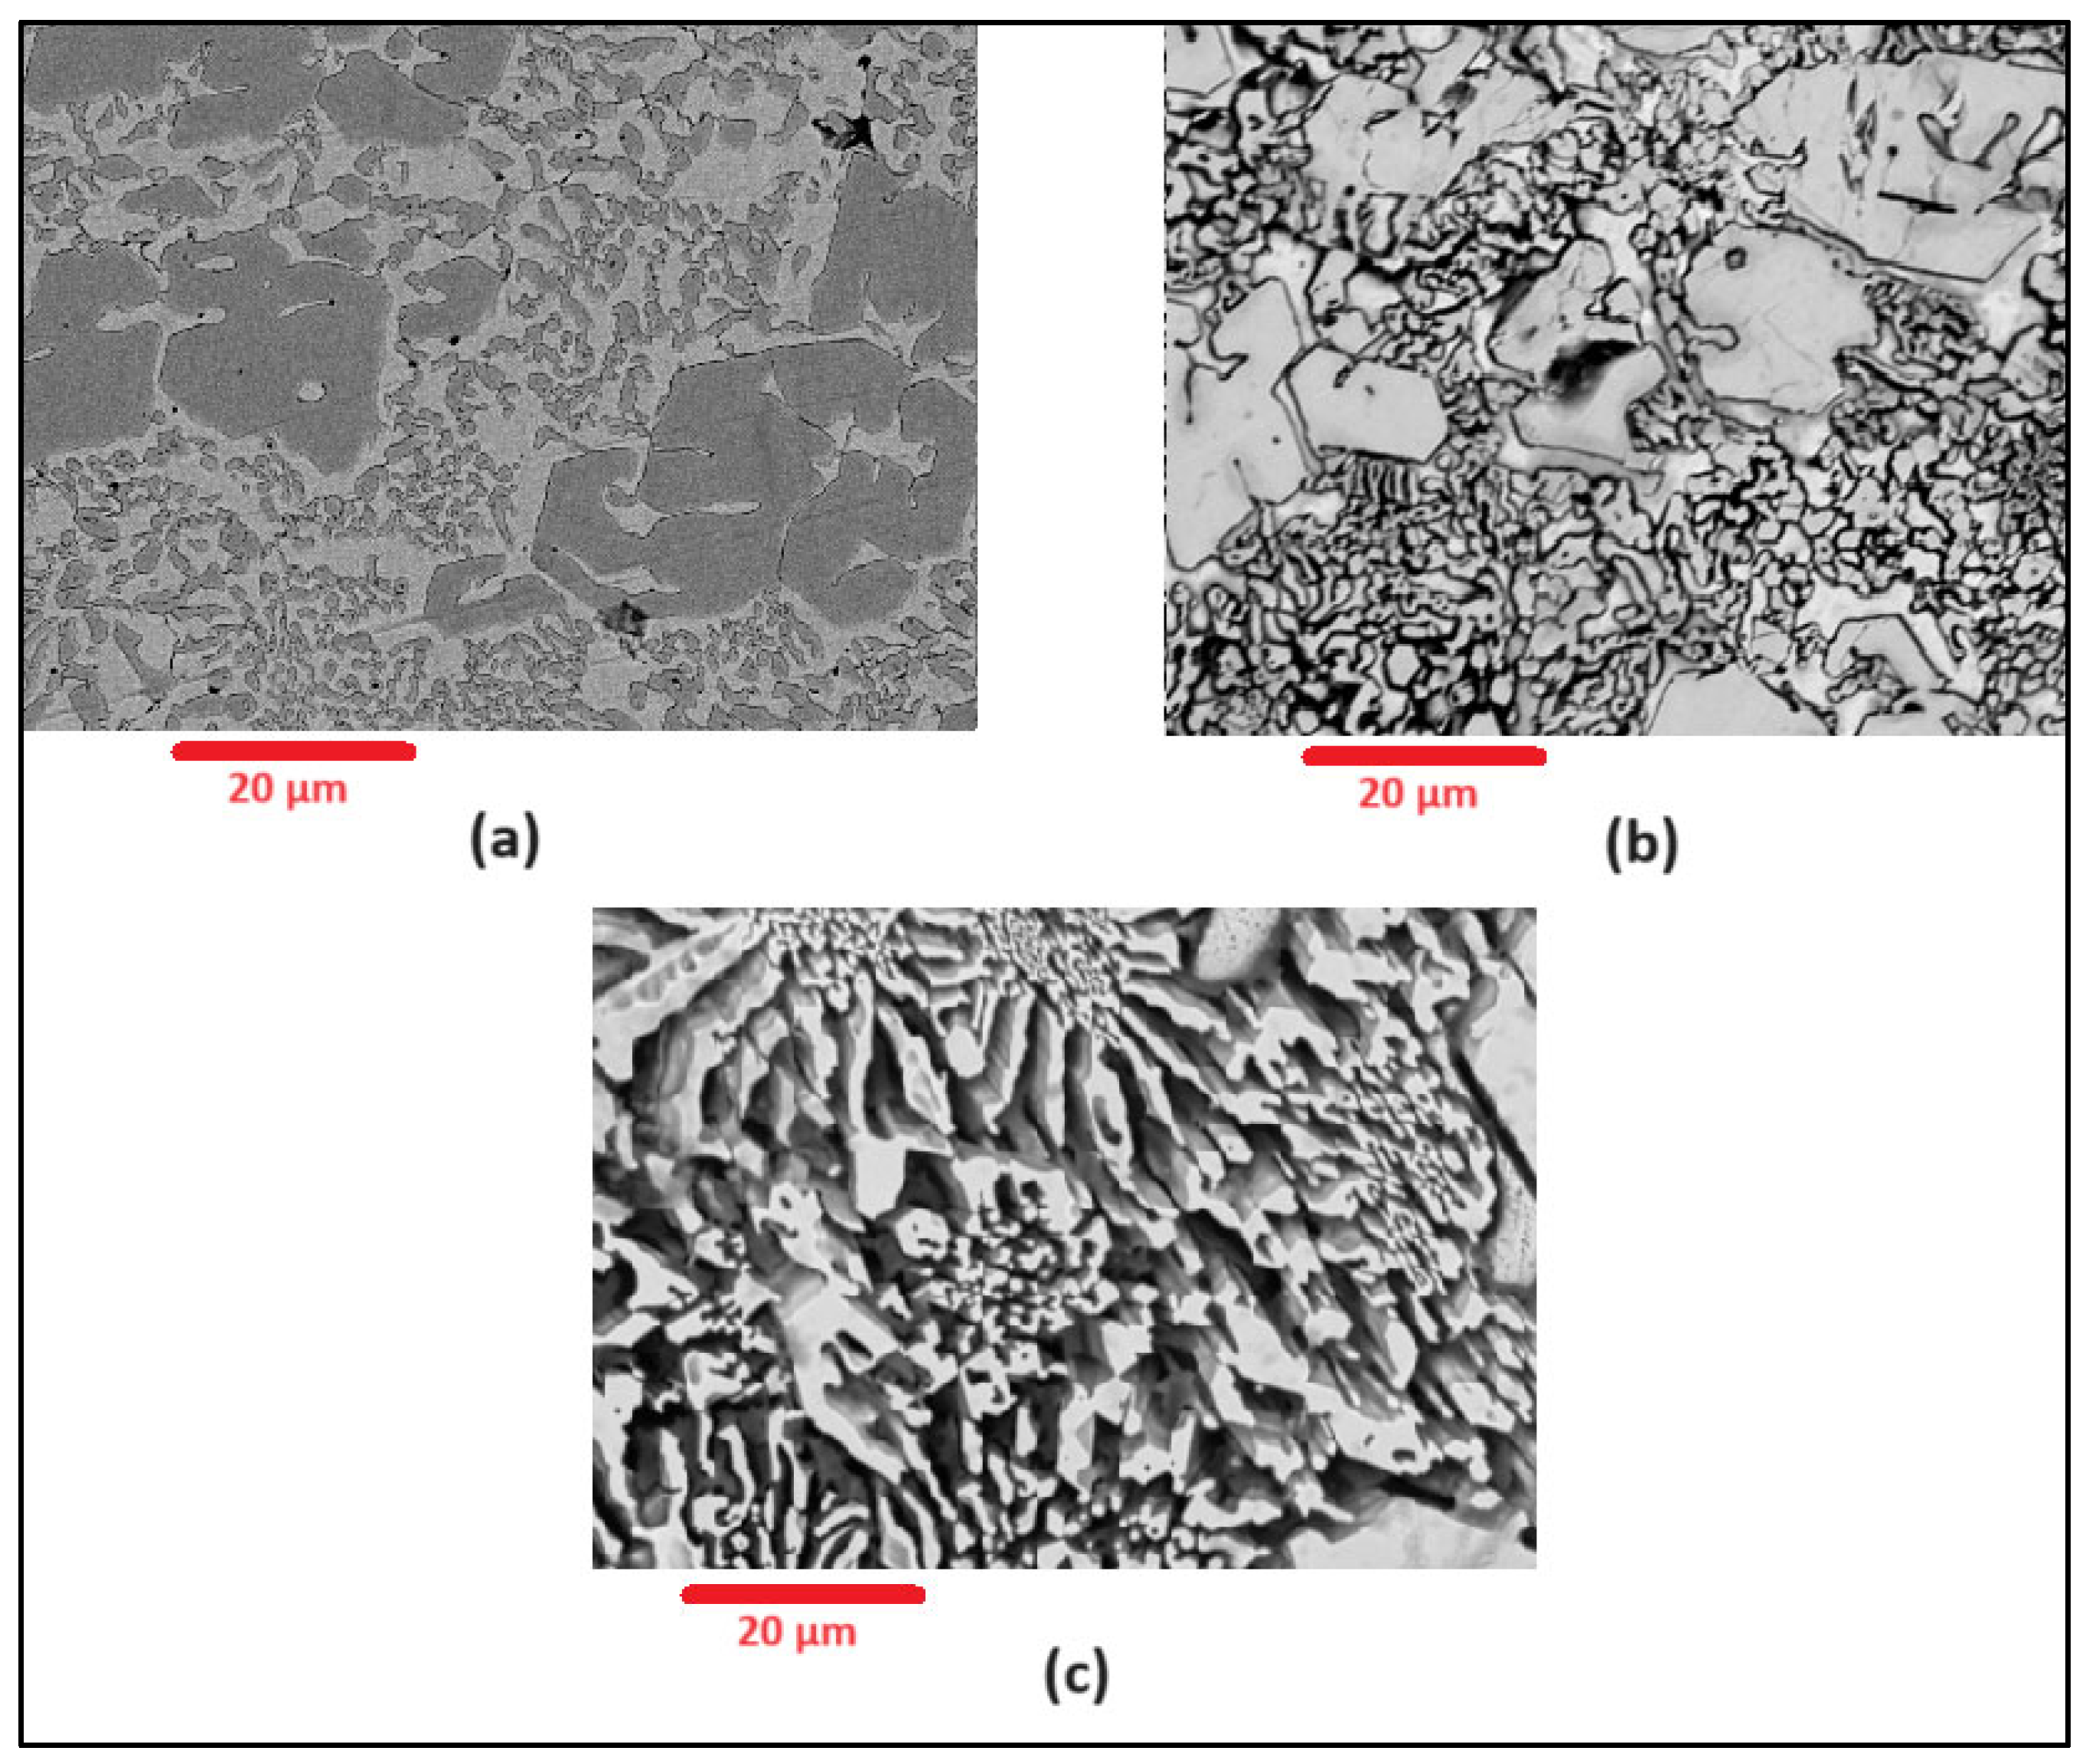
Figure 3.
As-deposited surface of Alloy N1.

Figure 4.
As-deposited surface of Alloy N2.
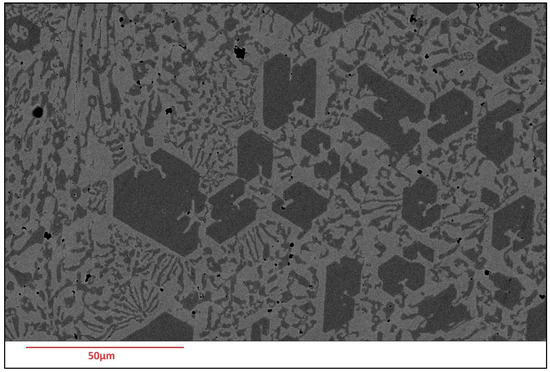
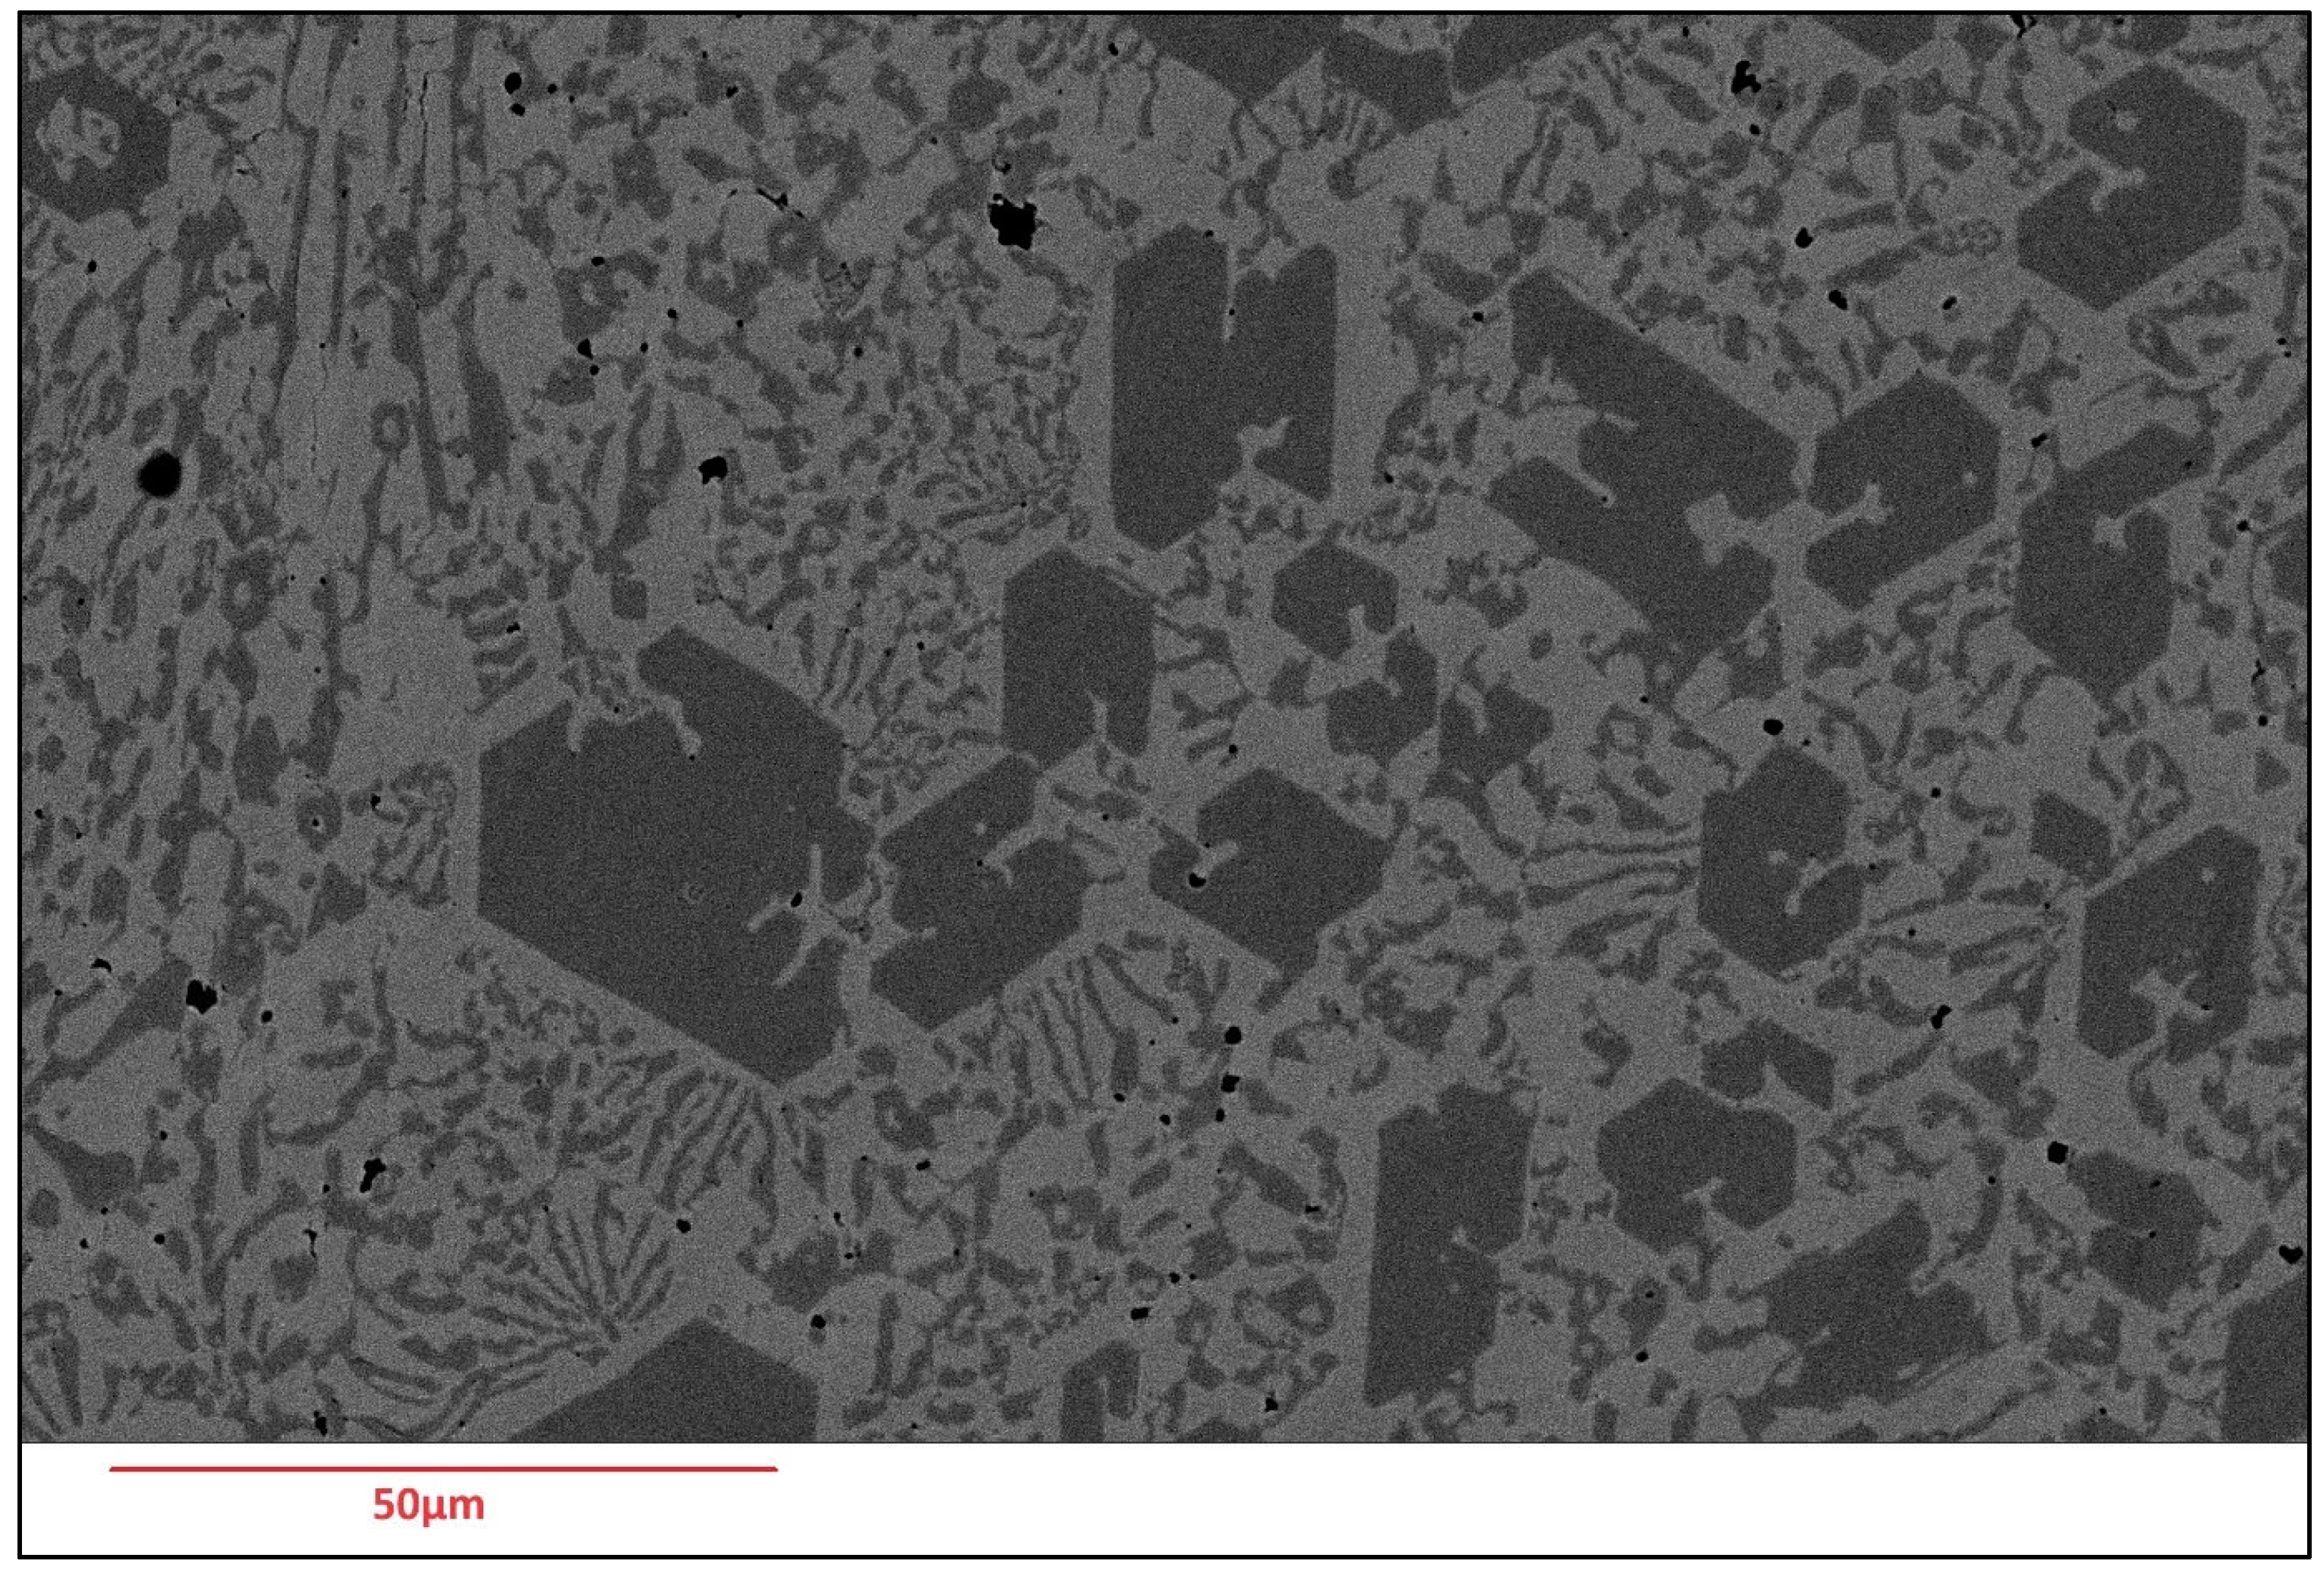
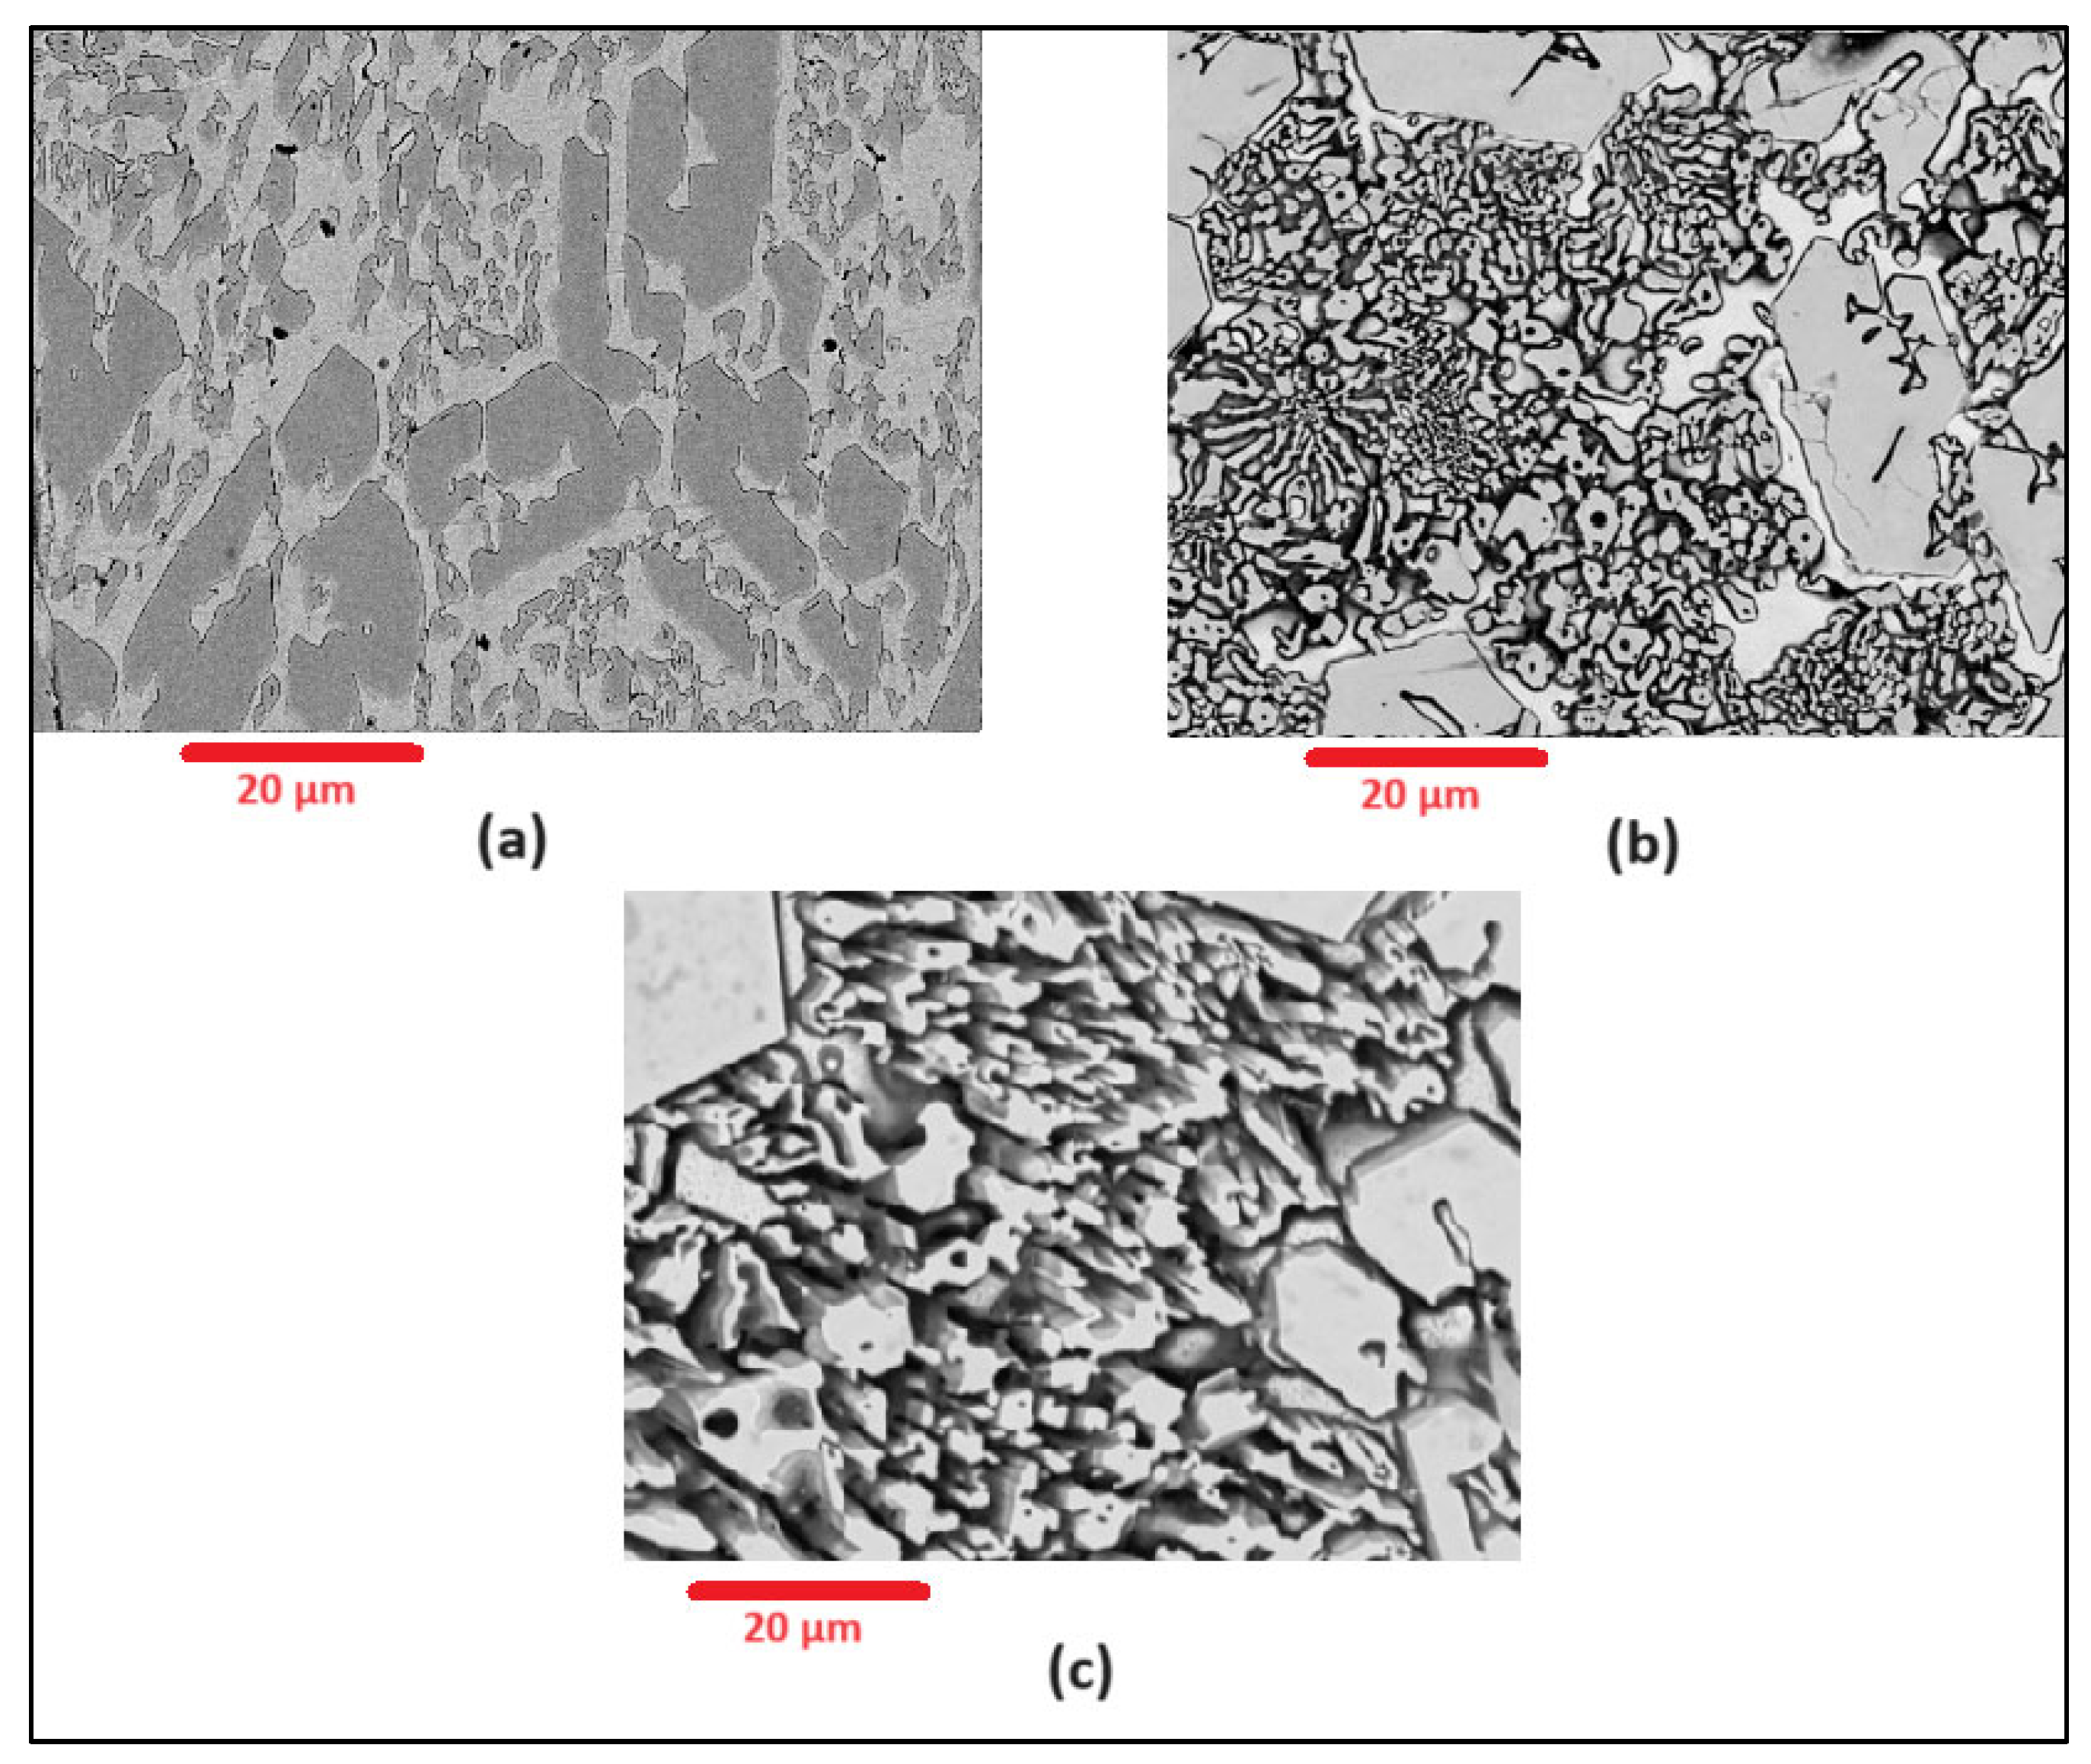
Figure 5.
As-deposited surface of Alloy N3.
ImageJ was used to find the proportion of austenite to the carbides, with the average results from three different equal-sized surfaces from each sample as shown in Table 4.
Table 4.
Austenite% and carbide% (both primary and eutectic) between each alloy.
As seen in Table 4, the average percentage of the austenite increased with higher nitrogen gas flow rates, with Alloy N0 without nitrogen shielding gas having the lowest austenite proportion at 31.84%, and Alloy N3 with 15 L/min nitrogen shielding gas having the highest austenite proportion at 39.79%.
Sample N0 appeared to have a greater proportion of smaller eutectic carbides, while Samples N1–N3 as deposited under nitrogen shielding gas appeared to promote the formation of larger carbides. This was confirmed using the particle analysis function in imageJ, finding the average of three same size surfaces for each sample. These results are provided in Table 5.
Table 5.
Average carbide size and numbers.
It can be seen in Table 5 that Alloy N0 had both the largest number of carbides at 5269, as well as the smallest average carbide size of 0.825 µm2. When nitrogen flows as a shielding gas at 5 L/min, the total number of carbides decreases to 3179, as seen in Alloy N1. Samples N2 and N3 at nitrogen flow rates of 10 L/min and 15 L/min respectively, contain total number of carbides within the same range, at 1566 and 1620. However, Alloy N3 displays the largest average size of carbides at 4.66 µm2, indicating that the increase in nitrogen induced the growth of stable carbides.
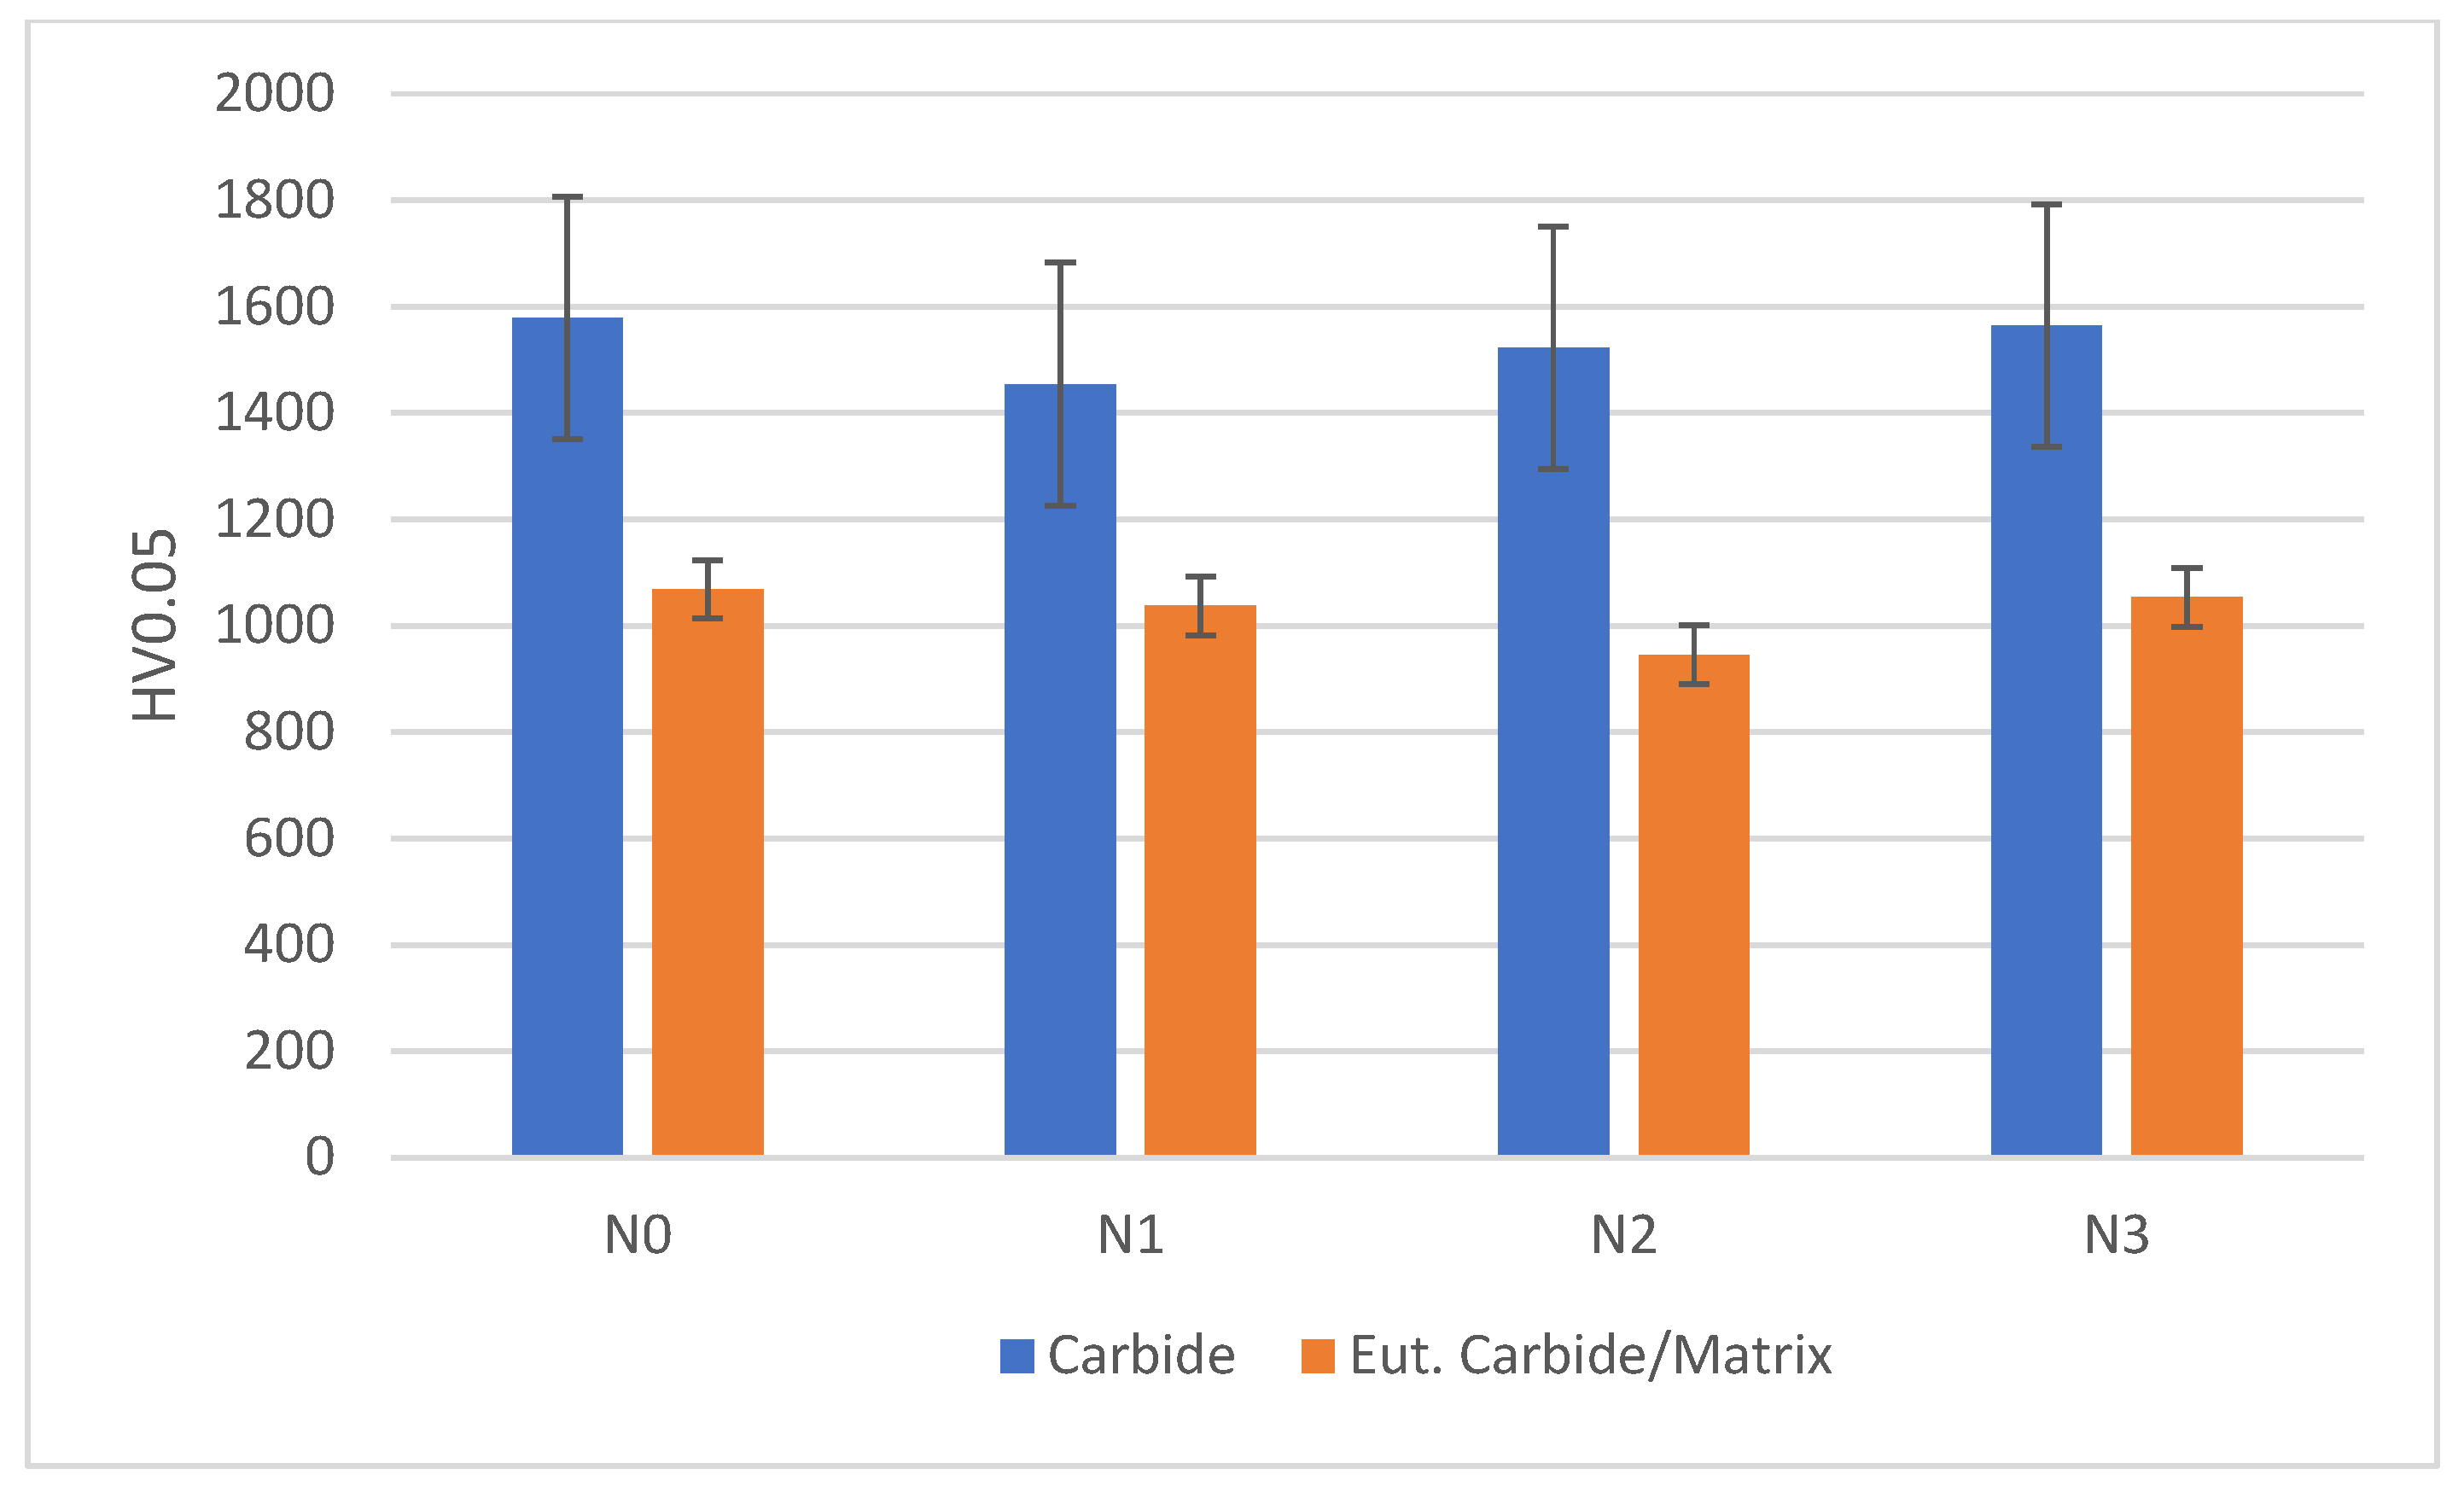
Hardness of chromium carbides and a eutectic carbide/austenite mix was measured using 0.05 kg load. The hardness of a mixture of the eutectic carbide/austenite area was taken due to difficulty in carrying out indentation separately on each phase. Hardness was evaluated using an average of three different points, as shown in Figure 6.
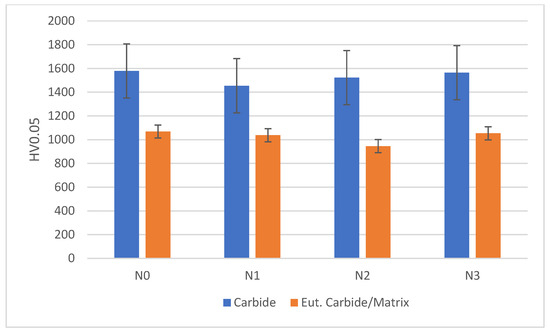
Figure 6.
Comparison of carbide hardness and eutectic carbide/austenite hardness between alloys.
3.3. EDS Results
The compositions of the austenite, carbides, and eutectic carbides were found using SEM-EDS. Sample points are shown as Points A, B, and C in Figure 2, with the EDS results shown in Table 6, Table 7 and Table 8.
Table 6.
EDS composition of the austenite microstructure.
Table 7.
EDS composition of primary carbides.
Table 8.
EDS composition of eutectic carbides.
It can be seen from Table 8 that the nitrogen shielding gas led to an increase in nitrogen within the austenite, from 0.6 wt% in Alloy N0 to 1.1 wt% in Alloy N3. This likely resulted in higher austenite content as a result of adding nitrogen as the shielding gas. The nitrogen content within both carbides and eutectic carbides appeared to fluctuate between 0.1 and 0.3 wt% between alloys. From Table 7 to Table 9, it can be seen that the larger carbides had the highest chromium content and the lowest iron content, whilst austenite had the lowest chromium content and highest iron content, with the eutectic carbides lying in between. For instance, with Alloy N0, the carbides mainly appeared to contain a chromium content of 48.1 wt%, subsequently decreasing to 29.9 wt% and 10.0 wt% for the eutectectic carbides and austenite, respectively. The austenite for Alloy N0 had the highest level of iron content at 80.6 wt%, which decreased to 56.7 wt% and 41.1 wt% for the eutectic carbides and primary carbides, respectively.
Table 9.
Corrosion parameters as found from the potentiodynamic plot.
3.4. Potentiodynamic and Potentiostatic Results
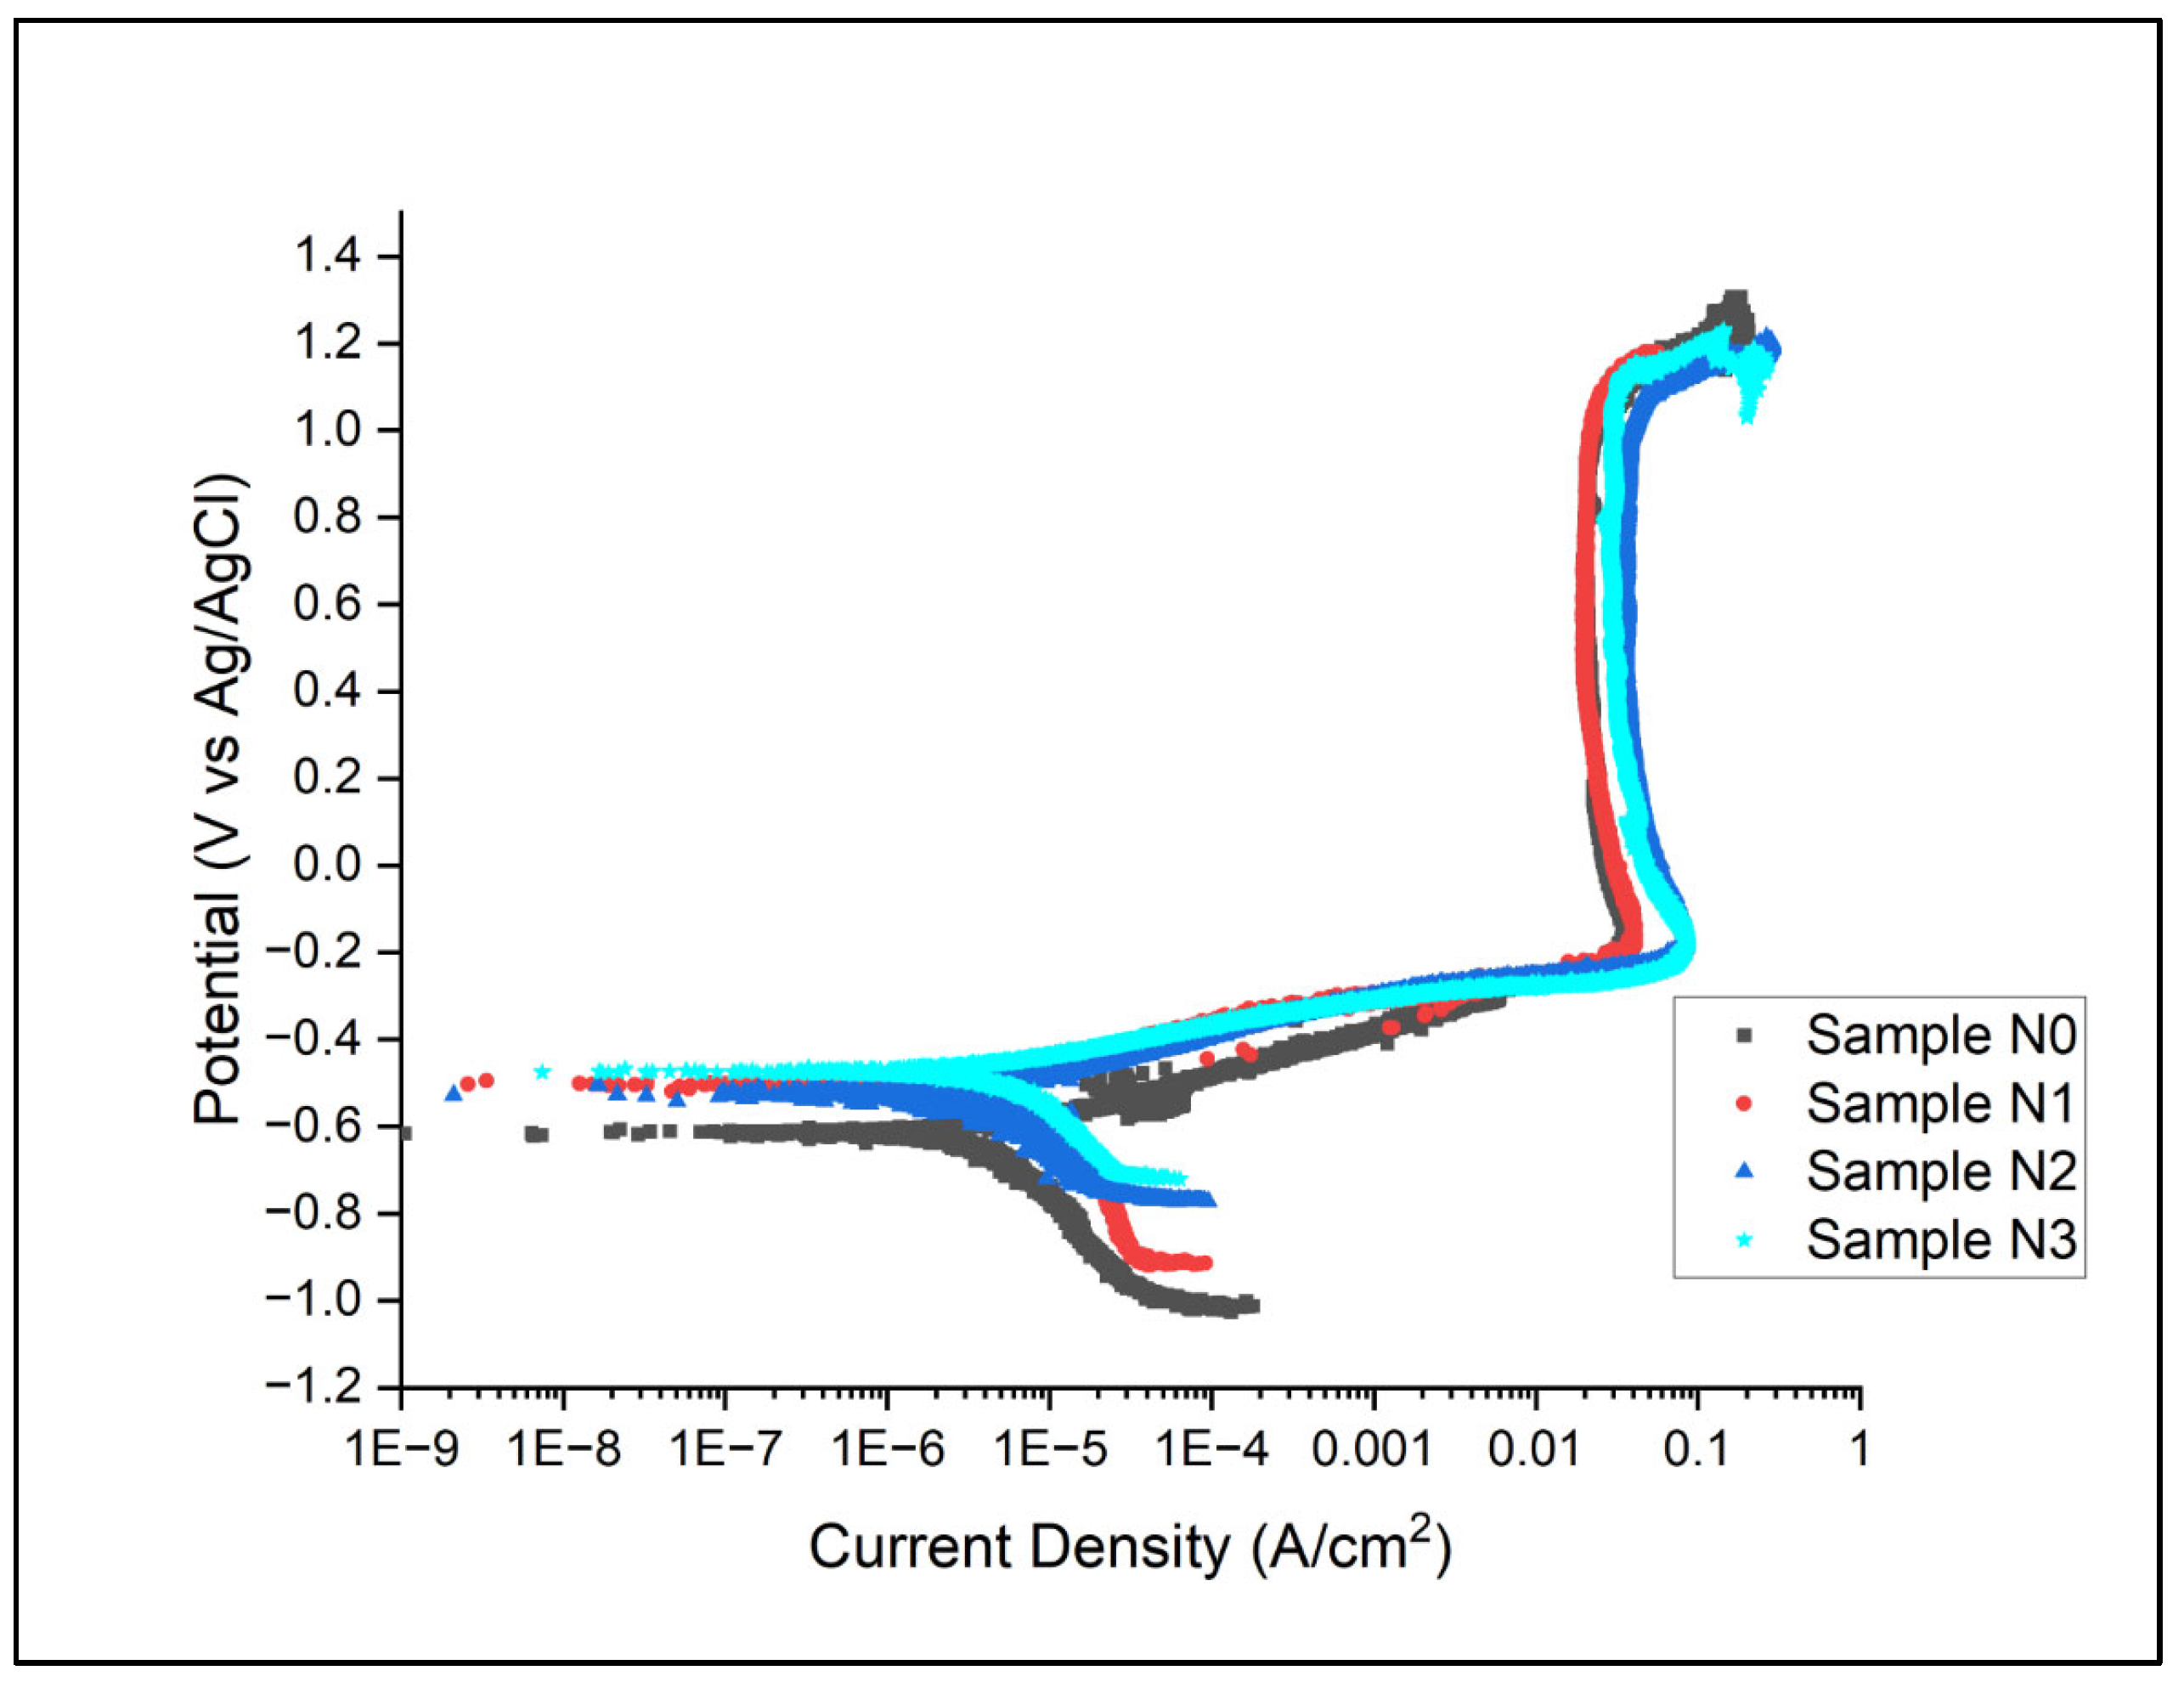
Potentiodynamic results for the samples in artificial seawater conditions are as shown in Figure 7.

Figure 7.
Potentiodynamic Plots for Alloys N0–N3. Sample N0 visibly shown to have lowest corrosion potential.
From the results in Figure 7, the Ecorr and Icorr values for all samples are as shown in Table 9. This was evaluated through the Gamry EChem Analyst software (ver 7.9.0) using Tafel methodology.
The potentiodynamic polarisation curves presented in Figure 7, coupled with the corrosion parameters summarised in Table 10, provide valuable insights into the electrochemical behaviour of the hardfacing deposits (N0, N1, N2, and N3) in artificial seawater. These results illuminate the effects of nitrogen shielding gas on the corrosion resistance of the alloys. The corrosion potential (Ecorr) shows a significant positive shift with the introduction of nitrogen during the welding process, from −618 mV for Alloy N0 to −474 mV for Alloy N3, indicating that the nitrogen-containing alloys are thermodynamically more stable in a corrosive environment. However, the corrosion current density (Icorr) values do not follow a clear trend with increasing levels of nitrogen content, suggesting that while nitrogen improves the thermodynamic stability, the kinetics of corrosion are influenced by other factors, possibly microstructural changes induced by the nitrogen shielding. Examination of the passive regions reveals that nitrogen-shielded alloys generally show earlier passivation, lower passive current densities, wider passive ranges, and higher breakdown potentials, all indicating more stable and protective passive films. The cathodic portions of the curves also show differences, with nitrogen-shielded alloys generally exhibiting lower cathodic current densities and steeper slopes, suggesting changes in the kinetics of the cathodic reaction. Overall, the nitrogen-shielded alloys demonstrate improved corrosion resistance compared to Alloy N0, with Alloy N3 (15 L/min N2) offering the best overall performance. These improvements can be attributed to several factors, including microstructural modifications, increased nitrogen content in the austenite, possible formation of nitrogen-enriched surface layers, and alterations in the electrochemical properties of the alloy surface.
Table 10.
Potentiostatic points chosen for Alloys N0–N3.
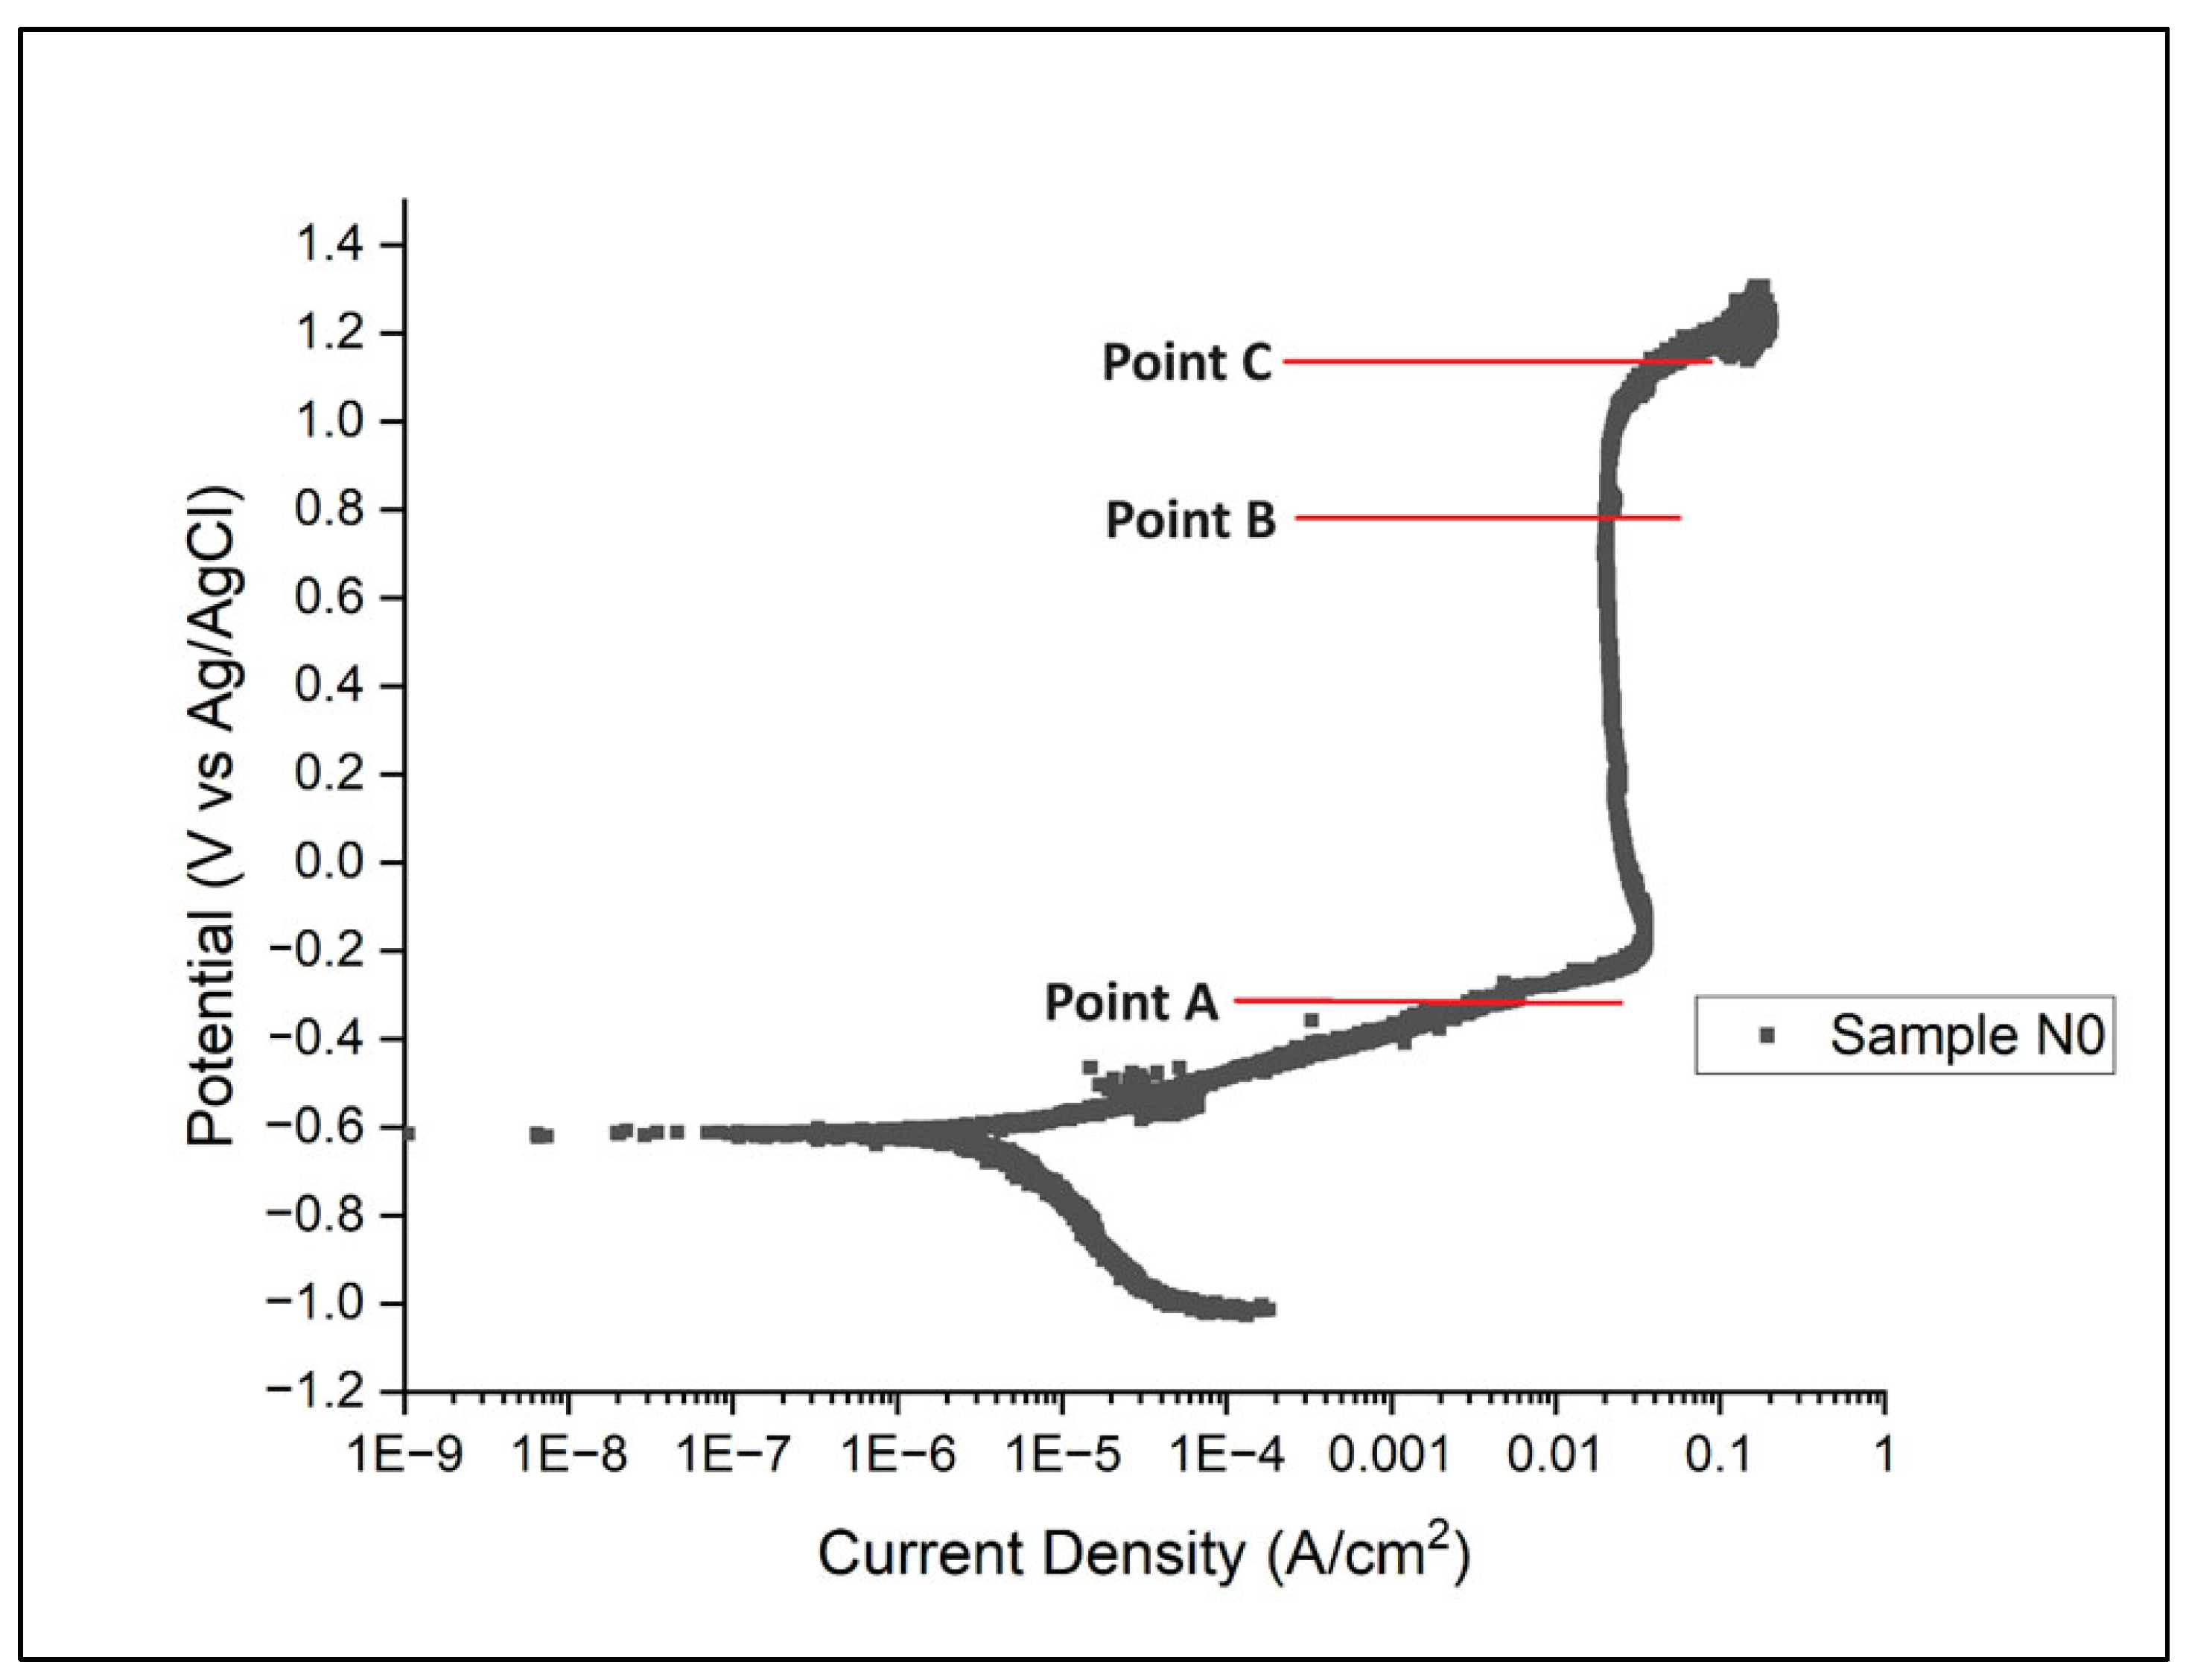
Potentiostatic etching was carried out at Points A, B, and C, as shown in Figure 8; these values are provided in Table 10.

Figure 8.
Schematic for choice of potentiostatic points.
From these points, SEM images of potentiostatically etched alloys are shown in Figure 9, Figure 10, Figure 11 and Figure 12. EDS was carried out for the primary carbides and austenite to evaluate the potential changes in composition post etching. These compositional results are shown in Table 11 and Table 12. Notably, the composition of the carbides did not appear to significantly change throughout potentiostatic etching, with detected elements all lying within ~3% of each other. However, oxygen appears to significantly increase within the austenite for all alloys when etched at 800 mV to ~35 wt%, whereas this was previously undetected when etched at −330 mV. This suggests the growth of products such as oxides.

Figure 9.
SEM images for Alloy N0 under (a) −330 mV (b) 800 mV (c) 1100 mV. Carbides visibly remain intact compared to matrix.

Figure 10.
SEM images for Alloy N1 under (a) −330 mV, (b) 800 mV, and (c) 1100 mV.

Figure 11.
SEM images for Alloy N2 under (a) −330 mV, (b) 800 mV, and (c) 1100 mV.

Figure 12.
SEM images for Alloy N3 under (a) −330 mV, (b) 800 mV, and (c) 1100 mV.
Table 11.
Carbide EDS composition at potentiostatic points.
Table 12.
Austenite EDS composition at potentiostatic points.
Building upon the potentiodynamic analysis, further insights can be gleaned by correlating these results with the potentiostatic etching data presented in Table 10, Table 11 and Table 12, and visualised in Figure 9, Figure 10, Figure 11 and Figure 12. The potentiostatic points chosen at −330 mV, 800 mV, and 1100 mV (Table 11) correspond to distinct regions in the polarisation curves, allowing for a more detailed examination of the corrosion mechanisms. At −330 mV, near the corrosion potential, minimal changes were observed in the microstructure across all alloys. However, at 800 mV, within the passive region, significant differences emerged. The EDS results in Table 12 reveal a substantial increase in oxygen content within the austenite for all alloys, ranging from 33.1 wt% to 39.9 wt%, indicating the formation of oxide layers. Notably, the nitrogen-containing alloys (N1, N2, and N3) showed a more pronounced decrease in chromium content in the austenite compared to N0, suggesting a more efficient incorporation of chromium into the passive film. This corroborates the improved passive behaviour observed in the polarisation curves. At 1100 mV, in the transpassive region, the austenite was almost completely dissolved for all alloys, as evidenced by Figure 9, Figure 10, Figure 11 and Figure 12. Interestingly, the carbide composition remained stable throughout the potentiostatic etching, as shown in Table 11, with only slight increases in oxygen content (1.2–3.0 wt%) at 1100 mV. This stability of the carbides, coupled with the preferential dissolution of the austenite, supports the hypothesis of galvanic corrosion between the austenite and the carbides. Alloy N3 aligns with the superior corrosion resistance indicated by the polarisation curves. These observations collectively suggest that the addition of nitrogen not only enhances the stability of the passive film, but also modifies the microstructure in a way that mitigates the galvanic effect between the austenite and carbides, thereby improving overall corrosion resistance.
3.5. Electrochemical Impedance Spectroscopy Results
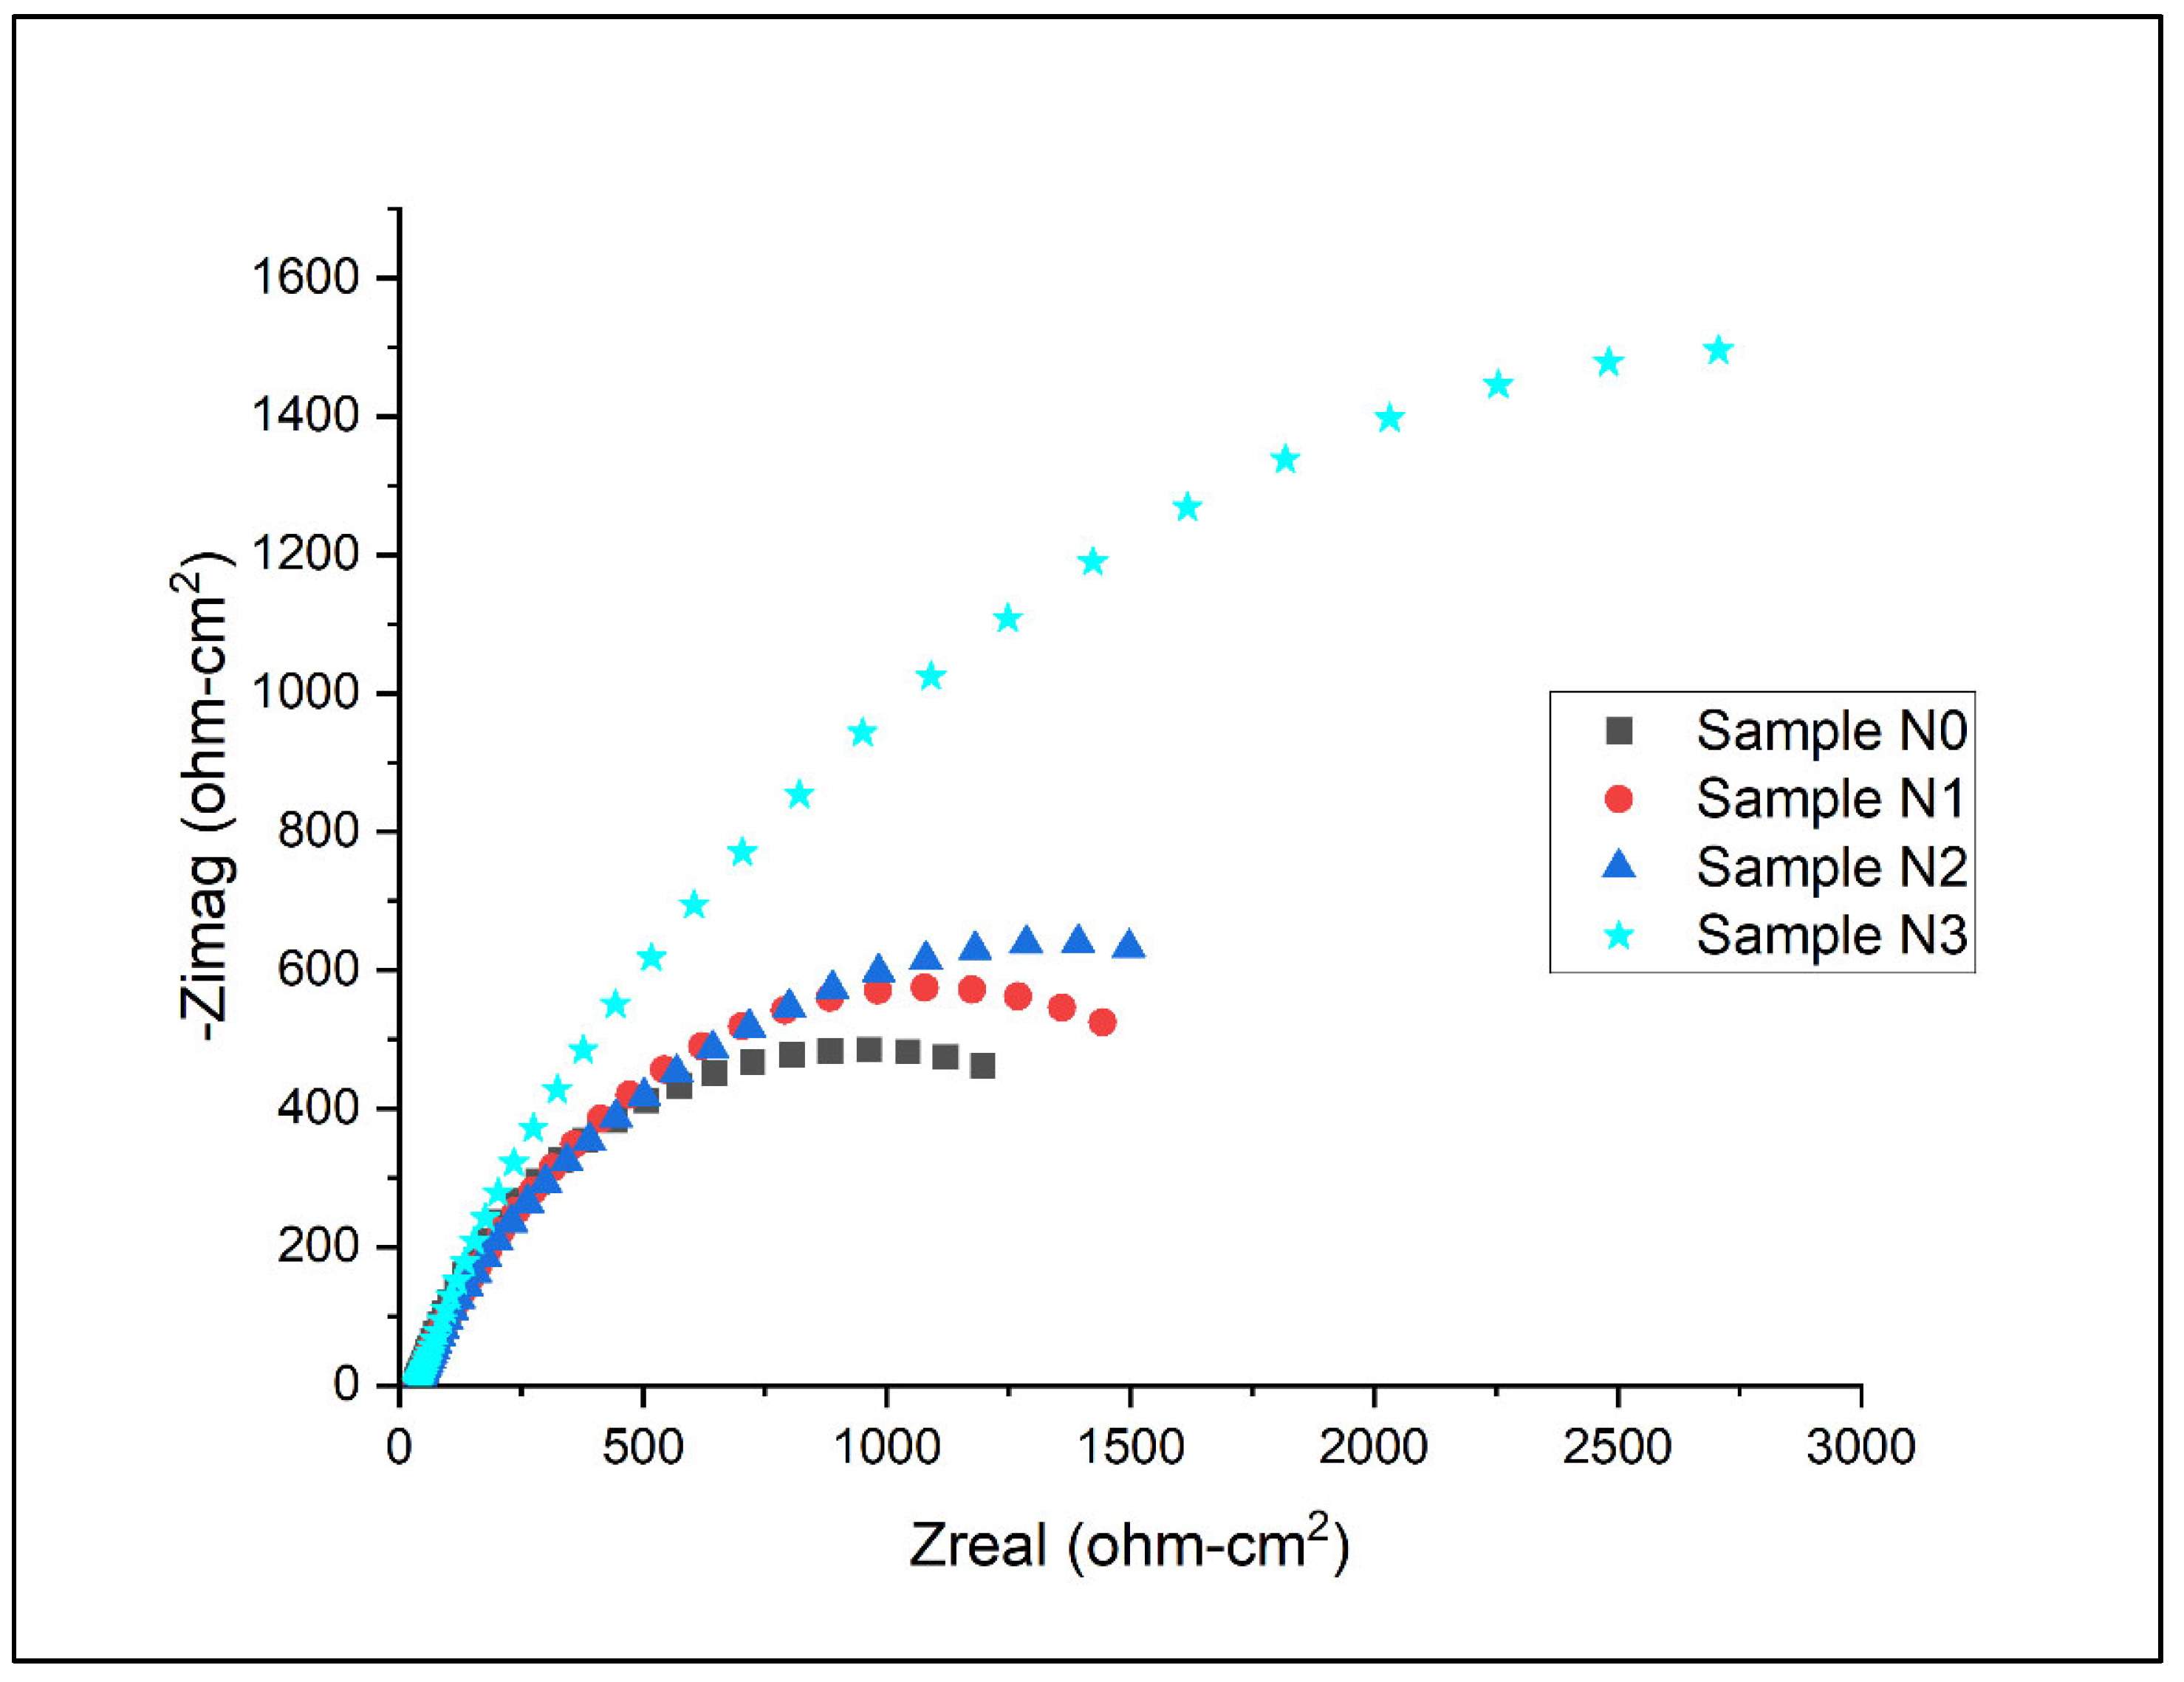
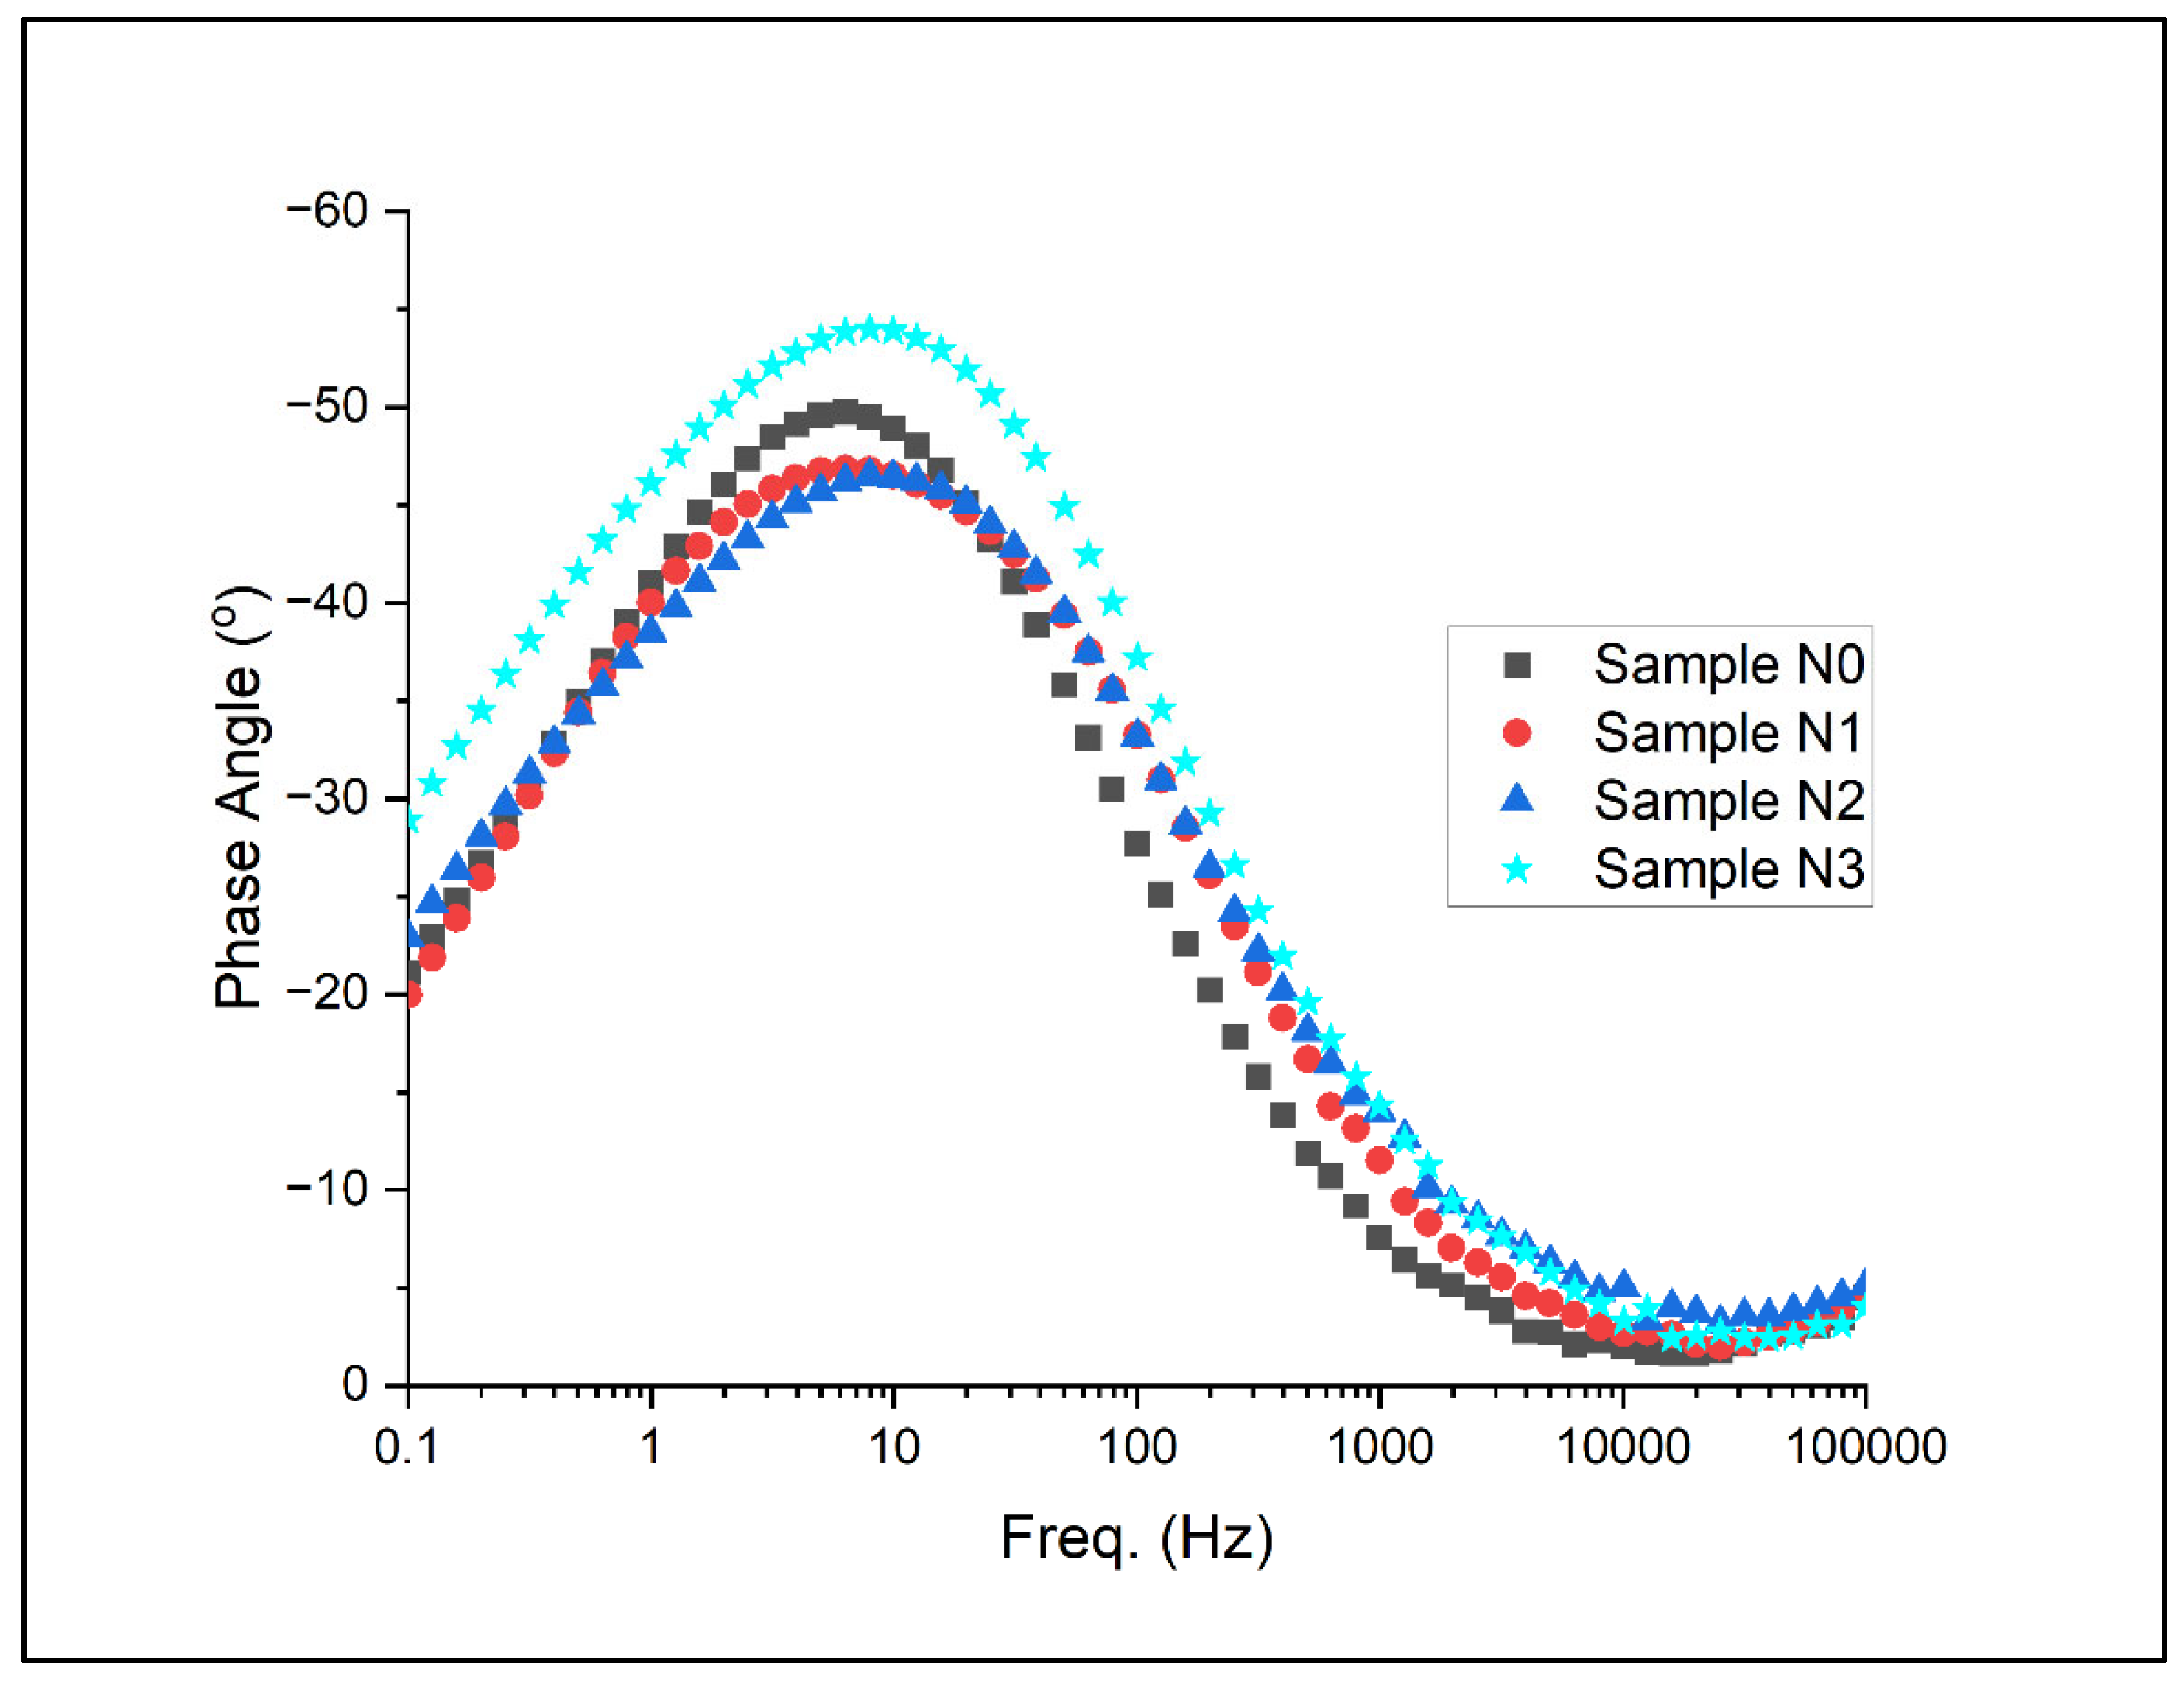
Electrochemical impedance spectroscopy (EIS) results for the samples under artificial seawater conditions are as shown for the Nyquist plots and Bode plots in Figure 13, Figure 14 and Figure 15 below.

Figure 13.
Nyquist plot for Alloys N0, N1, N2, and N3.
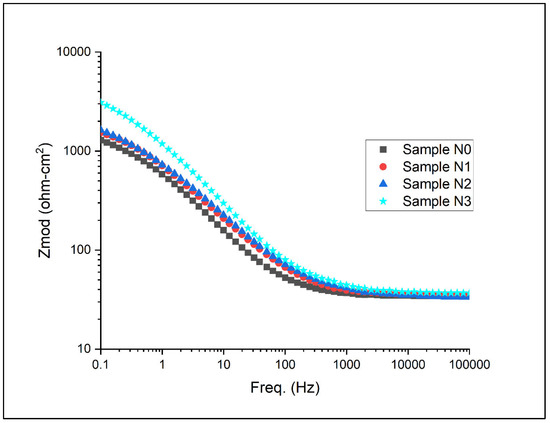
Figure 14.
Bode plot with respect to magnitude for Alloys N0, N1, N2, and N3.

Figure 15.
Bode plot with respect to phase for Alloys N0, N1, N2, and N3.
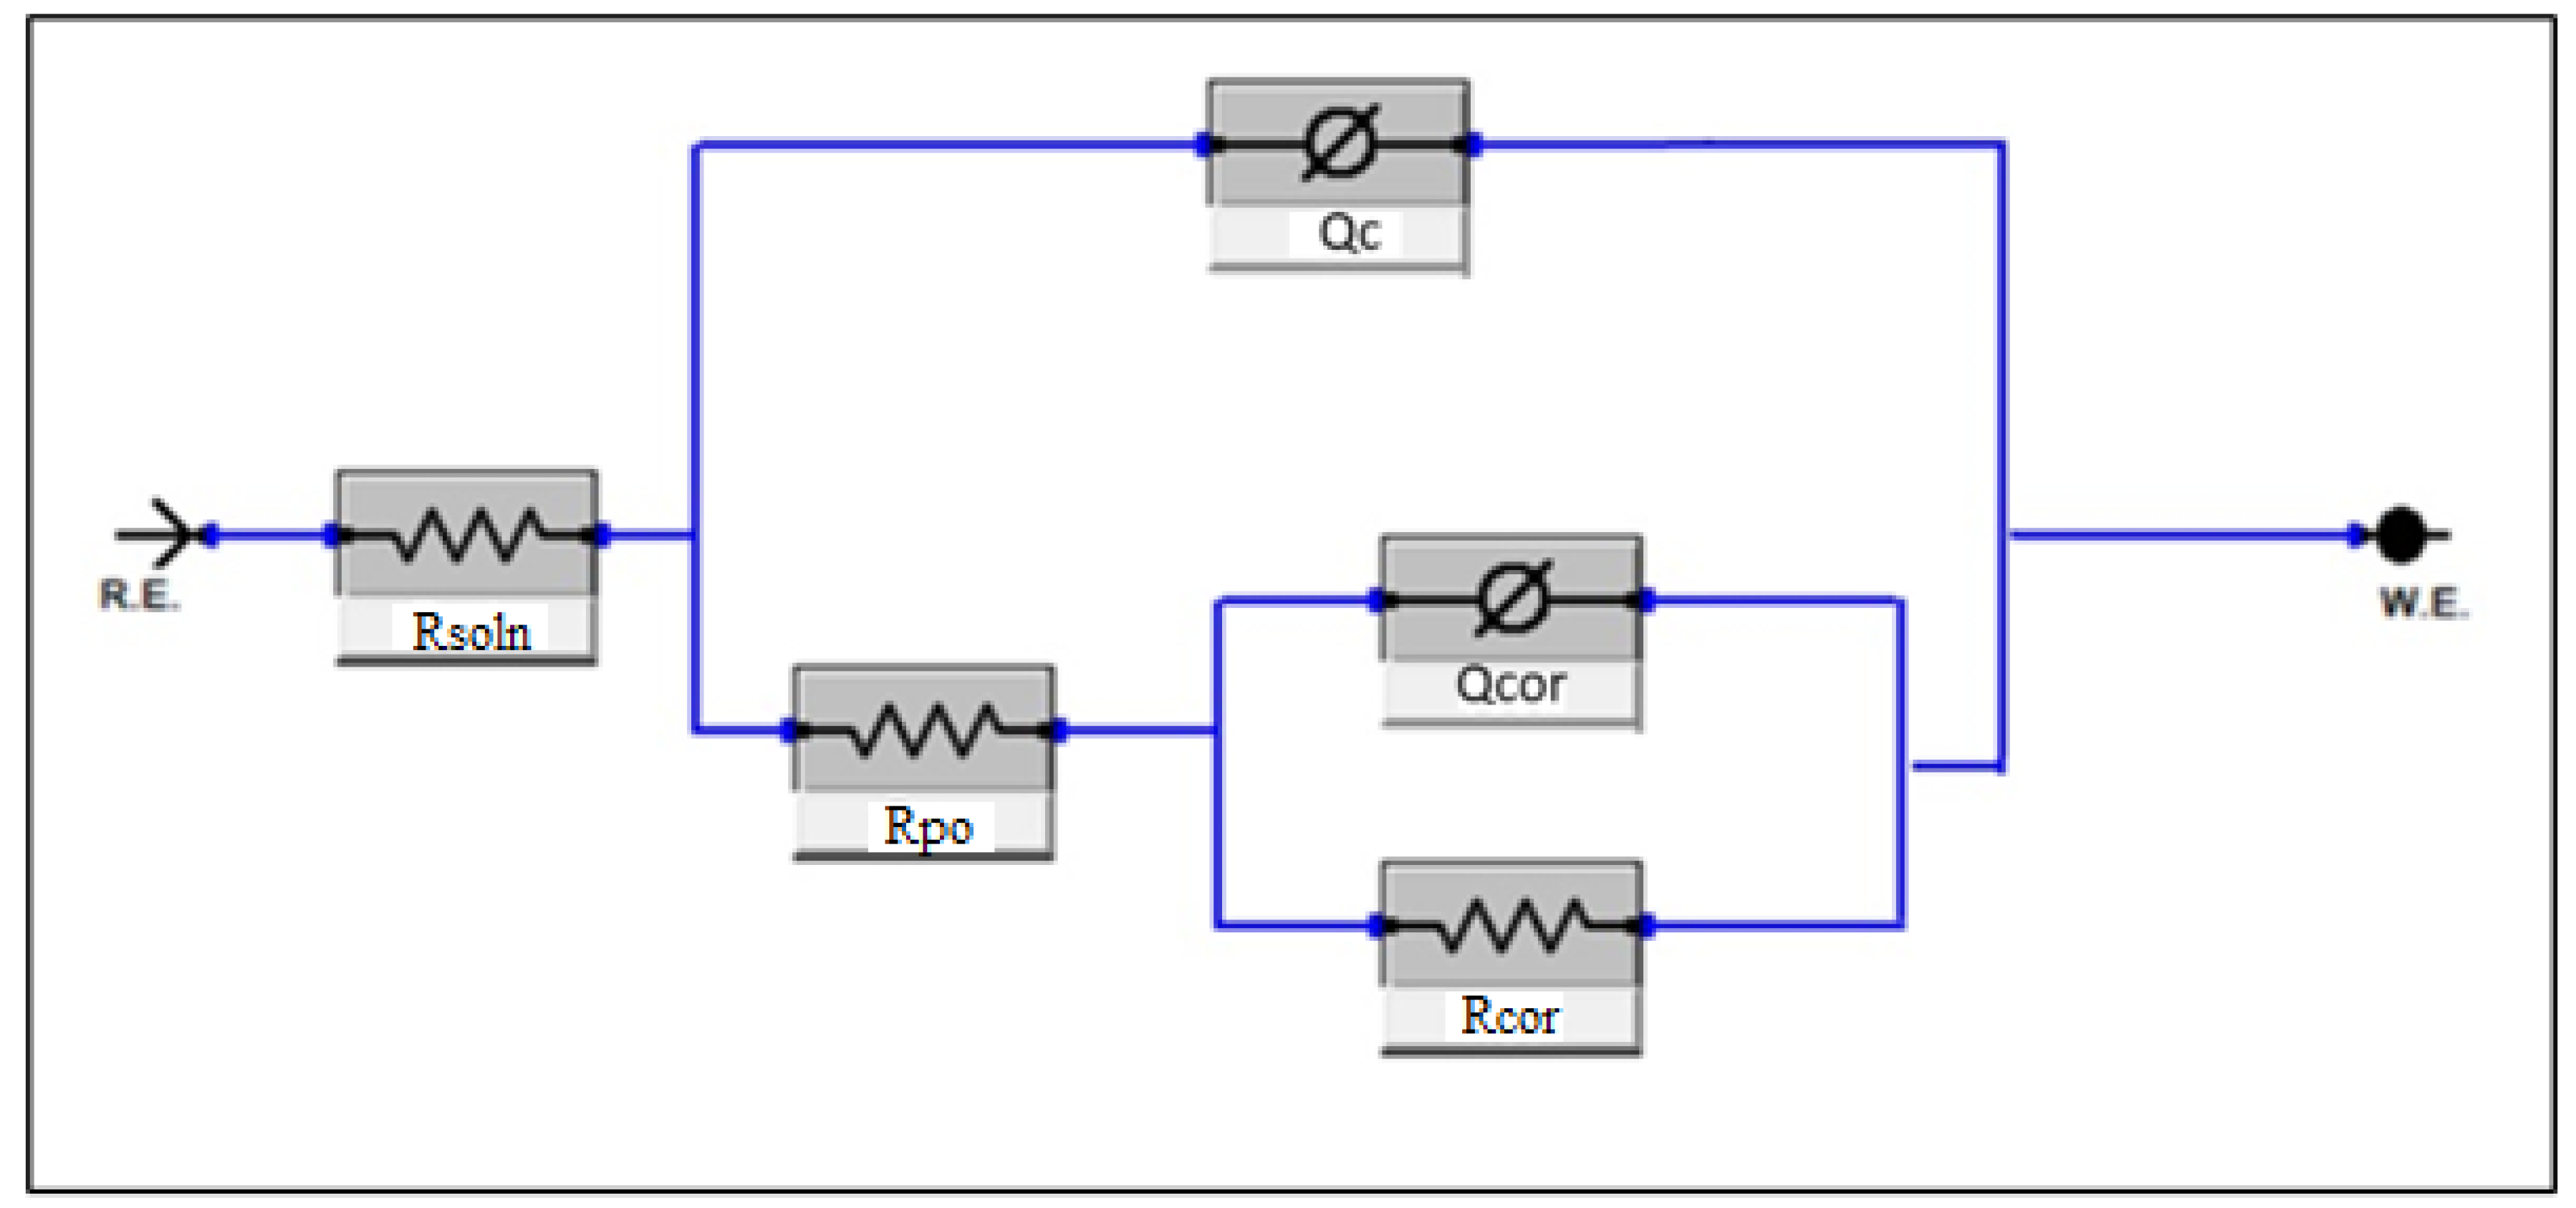
Using the data from the EIS results, equivalent circuit models can be fit in to gauge how the system corrodes based off of its modelled resistances and capacitances [20]. For hardfaced coatings such as HCWI, these are typically expected to be modelled by the double-layer model of the form Rsoln[Cc[Rpo[CcorRcor]]]. In this model, Rsoln represents the solution resistance, CC represents the overall coating capacitance, Rpo represents the porous resistance of the coating, Ccor represents the double-layer capacitance, and Rcor represents the charge transfer resistance. It should be noted that this model has been found to fit more reliably when modelling the capacitors (C) as constant phase elements (Q) due to not acting perfectly as capacitors; as such, it may be better described by the model Rsoln[Qc[Rpo[QcorRcor]]], as seen in Figure 16. This may stem from non-homogenous elements within the system such as porosities or imperfections.

Figure 16.
Equivalent circuit model of the system.
Using this model, the following EIS parameters in Table 13 were found for Alloys N0 to N3.
Table 13.
Equivalent circuit parameters as obtained from EIS modelling.
Chi-squared values for all samples were all below 1 × 10⁻³, indicating a high level of fit for all equivalent circuit models.
The electrochemical impedance spectroscopy (EIS) results, as depicted in Figure 13 and quantified in Table 13, provide further insight into the corrosion behaviour of the high-chromium hardfacing alloys with varying levels of nitrogen content. The Nyquist plots in Figure 13 reveal distinct semicircular arcs for all alloys, characteristic of a charge-transfer-controlled corrosion process. The diameter of these semicircles is directly related to the charge transfer resistance, which is indicative of the corrosion resistance of the alloys.
A clear trend is observed in the size of the semicircles, with Alloy N3 exhibiting the largest arc, followed by N2, N1, and N0. This progression aligns well with the corrosion resistance parameters (Rcor) derived from the equivalent circuit modelling in Table 13. The Rcor values increase from 2325 Ω·cm2 for Alloy N0 to 4700 Ω·cm2 for Alloy N3, quantitatively confirming the enhanced corrosion resistance with increasing nitrogen content. This trend corroborates the findings from the potentiodynamic polarisation tests, reinforcing the beneficial effect of nitrogen on the alloys’ corrosion behaviour.
The equivalent circuit parameters in Table 13 offer additional insights into the electrochemical processes at the alloy–electrolyte interface. The coating capacitance (Qc) and its associated exponential term (n) provide information about the homogeneity and protectiveness of the surface film. The lower Qc values for nitrogen-containing alloys, particularly N3 (0.000195 Ω−1cm−2sn), suggest the formation of a more compact and protective surface layer.
The porous resistance of the coating (Rpo) shows a significant increase with increased nitrogen content, from 19.93 Ω·cm2 for N0 to 3795 Ω·cm2 for N3. This substantial rise indicates that the nitrogen-induced microstructural changes lead to a more resistant outer layer, potentially due to the formation of a more stable passive film or alterations in the carbide–austenite interface.
The double-layer capacitance (Qcor) and its exponential term (n) provide insights into the characteristics of the electrical double layer at the alloy–electrolyte interface. The decreasing Qcor values from N0 (0.000289 Ω−1cm−2sn) to N3 (0.000117 Ω−1cm−2sn) suggest a more compact and less-defective interface layer in the nitrogen-rich alloys. This trend aligns with the improved passive film stability observed in the potentiodynamic tests and the microstructural changes evidenced by the potentiostatic etching results.
The increasing n values associated with Qcor, from 0.7413 for N0 to 0.8657 for N3, indicate a surface that behaves more like an ideal capacitor with increasing levels of nitrogen content. This could be interpreted as a more uniform and homogeneous surface layer, possibly due to the more even distribution of alloying elements or a more consistent passive film formation.
These EIS results, when considered alongside the potentiodynamic and potentiostatic findings, paint a comprehensive picture of the corrosion mechanism in these alloys. The nitrogen addition appears to enhance corrosion resistance through multiple mechanisms, given as follows: (a) the formation of a more stable and protective passive film, as evidenced by the increased Rcor and Rpo values; (b) the development of a more homogeneous surface layer, indicated by the changes in Qc, Qcor, and their associated n values; (c) possible modification of the carbide–austenite interface, leading to reduced galvanic coupling effects, as suggested by the potentiostatic etching results and the enhanced overall impedance.
The Bode plots presented in Figure 14 and Figure 15 offer complementary insights into the Nyquist plots and further elucidate the electrochemical behaviour of the high-chromium white iron alloys. Figure 14 displays the magnitude of impedance |Z| as a function of frequency. At high frequencies (>103 Hz), all alloys exhibit similar low impedance values, primarily representing the solution resistance. As the frequency decreases, the impedance increases, with clear differences emerging among the alloys. In the mid-frequency range (1 to 103 Hz), the slopes of the curves provide information about the capacitive behaviour of the electrode–electrolyte interface. Notably, Alloy N3 shows the steepest slope, followed by N2, N1, and N0, indicating an increasing capacitive character with higher nitrogen content. This aligns with earlier observations of improved passive film formation in nitrogen-rich alloys.
At low frequencies (<1 Hz), where the impedance is dominated by the charge transfer resistance and diffusion processes, a clear hierarchy in impedance values is indicated. Alloy N3 consistently displays the highest impedance, followed by N2, N1, and N0. This trend corroborates the Rcor values obtained from the equivalent circuit modelling and further confirms the enhanced corrosion resistance with increasing nitrogen content. The higher low-frequency impedance suggests a more effective barrier against charge transfer and mass transport processes at the alloy surface.
Figure 15 presents the phase angle as a function of frequency, offering insights into the nature of the electrochemical processes occurring at different timescales. In the high-frequency region, all alloys show a phase angle near 0°, characteristic of resistive behaviour dominated by the electrolyte resistance. As the frequency decreases, a shift occurs towards more negative phase angles, indicating an increasing contribution of capacitive elements.
The mid-frequency region (100 to 103 Hz) reveals distinct differences among the alloys. Alloy N3 exhibits the widest frequency range, with phase angles approaching −70° to −80°, suggesting a more ideal capacitive behaviour. This broad capacitive region indicates a more stable and protective surface film, consistent with observations from the potentiodynamic and potentiostatic tests. The phase angle peaks for N2 and N1 are slightly less pronounced and span a narrower frequency range, while N0 shows the least-pronounced capacitive behaviour.
In the low-frequency region (<100 Hz), a trend towards less-negative phase angles is observed, indicating an increasing influence of resistive components. This transition is most gradual for Alloy N3, maintaining higher phase angles down to lower frequencies compared to the other alloys. This behaviour suggests that N3 maintains its capacitive character over a wider frequency range, implying a more effective barrier against corrosive species even at longer time scales.
The presence of a single, broad time constant in the Bode plots for all alloys supports the choice of the equivalent circuit model. However, the subtle differences in the shapes of the phase angle curves, particularly in the low-frequency region, hint at the complexity of the electrochemical processes occurring at the alloy–electrolyte interface. These nuances may be attributed to the varying distributions of carbides, the nature of the passive film, and potential diffusion processes within the surface layers.
4. Discussion
4.1. Effect of Nitrogen Shielding Gas on Microstructure
Under regular welding deposition conditions without nitrogen as a shielding gas, primary carbides were found to be predominantly in the form Cr7C3, with a eutectic austenitic and secondary carbides (Cr7C3). Given the presence of other elements in the carbide EDS, these carbides may nominally be referred to as M7C3, where M refers to chromium, iron, etc. Nitrogen did not appear to affect the form of M7C3 carbides. Further evidence of the lack of carbide transformation can be seen from the compositional information for carbides in Table 7, as chromium and carbon contents remain stable in the range 46–49 wt% and 6–9 wt%, respectively. Overall, this lack of transformation aligns with research of nitrogen additions towards steel containing Mr7C3 [21]. It can be noted that compositional comparison of at% with authors such as Atamert shows a similarity of around 5–7% [22].
Nitrogen as a shielding gas did not appear to stimulate the precipitation of nitrides such as Cr2N within these samples. Nitrogen has a higher solubility in austenite. This results in greater interstitial solid solution strengthening, especially if the alloys do not contain strong nitride-forming elements, such as Ti, Nb, or V [23]. In the present study, nitrides could not be detected. Instead, the main effects of the nitrogen shielding gas mostly affected austenite, as seen in the increase from 0.6 wt% in Alloy N0 to 1.1%wt% in Alloy N3. This aligns with other research showing the enrichment of nitrogen in the matrix [24]. The nitrogen content of up to 1.1 wt% in austenite appears to be greater than that of stainless steels, which was found in the literature for nitrogen gas to be absorbed up to a maximum saturation of 0.27 wt% in the solid solution [25]. Nitrogen is a strong austenitic stabiliser [7]. This is seen from the increase in the proportion of austenite to carbides, where the austenite increased from 31.8% to 36.8% between Samples N0 and N3, respectively, as seen in Table 4. Nitrogen as an austenitic stabiliser may also explain the lack of nitride precipitation, as these can reduce the overall precipitation of nitrides such as Cr2N [26]. It can now be said that alloying nitrogen to weld deposited hardfacing alloys can be performed using nitrogen as a shielding gas.
The increase in austenite proportion and carbide size with nitrogen content can be correlated with the EIS results. The Rpo values increased significantly from 19.93 Ω·cm2 for N0 to 3795 Ω·cm2 for N3, suggesting that these microstructural changes led to a more resistant outer layer. This could be due to a more uniform distribution of chromium in the austenite, which is supported by the EDS results showing a more consistent chromium content in the austenite of nitrogen-rich alloys (Table 6).
Some studies have shown the addition of nitrogen to affect the morphology and shape of eutectic carbides. Notably, nitrogen additions of up to 0.164 N have been found to lead towards change from more “block-like” to more circular, “brain-like” clumps [21]. While it is possible that nitrogen additions may have affected the shape of carbides, in the present study no clumping of eutectic carbides was observed in the SEM pictures for higher gas flow rates shown in Figure 2, Figure 3, Figure 4 and Figure 5. From the same paper, Li et al. also found that increasing the nitrogen content from 0.043% to 0.164% refined the size of eutectic carbides, but increased the overall number density of carbides precipitated [21]. These authors speculate that this mechanism was due to nitrogen promoting the supersaturation of chromium in the matrix causing such precipitation of chromium carbides to occur. In the present study, however, such a mechanism was not found, as a larger number of eutectic carbides was found within Alloy N0 compared to Alloys N1–N3. This is as evidenced by the results in Table 5, where the total number of carbides detected progressively decrease from 5269, 3179, 1566, to 1620 for Alloys N0, N1, N2, and N3, respectively. Increased saturation of chromium within the austenite with increasing nitrogen content was not seen in this study, with contents of 10.0 wt%, 8.5 wt%, 10.7 wt%, and 10.2 wt% found for Alloys N0, N1, N2, and N3, respectively as per the EDS results shown in Table 7.
In the present study, the average primary carbide size was found to increase significantly with increased nitrogen flow rates from 0.825 to 4.66 µm2 for Alloys N0 to N3, as seen in Table 5. This contradicts other studies regarding nitrogen additions towards high-chromium iron, which normally indicate the refinement of carbides with increased nitrogen content [12,27,28,29]. As per Table 6, the nitrogen content of the austenite increased by 0.5% between Alloys N0 and N3. It is possible that since the addition of nitrogen increased the austenite area, the carbide size also increased. One reason that the carbide size became higher is possibly due to the way that nitrogen was added to the alloy. In previous studies [27,28,29], nitrogen was added to the alloy through additions of nitrides in the form of nitride ferrochrome with added titanium and niobium, which are strong nitride formers. The fine nitrides, acting as nucleating agents, probably led to the refinement of carbides in the previous studies. Nitrogen, when it is added to the hardfacing alloy as shielding gas, would dissociate in the welding arc as N2 → 2N, which most likely dissolved in the molten metal and formed a solid solution with the metal. This is possibly the reason that the size of carbides increased with increase in nitrogen content.
Nitrogen shielding gas did not appear to significantly affect the hardness of alloys, as hardness for both carbides and the eutectic carbide/austenite appears to lie within the same error ranges as seen in Figure 6. The increase in austenite proportion with increased nitrogen flow rates likely increased the overall toughness of the material by providing better support for the carbides [27].
4.2. Effect of Nitrogen Shielding Gas on Corrosion
As seen in Figure 9, Figure 10, Figure 11 and Figure 12, corrosion of the alloys under artificial seawater conditions appeared to be galvanic for all samples, with austenite corroding in preference to the carbides. Particularly, potentiostatic etching in the transpassive region at 1100 mV showed almost complete dissolution of the austenite. Galvanic corrosion results can be compared to other tests for HCWI alloys. In any electrolyte, uncertainty exists as to whether the matrix microstructure or carbides will preferentially corrode. For instance, it has been found for similar hardfacing alloys that under neutral pH buffer conditions without sodium chloride, the matrix will corrode in preference to the carbides; however, in the same research, carbides have been found to preferentially corrode with respect to the matrix under saltwater conditions at the same neutral pH [15]. Salasi et al. have speculated that the ability of carbides or corrosion of the matrix depends on the ability of passive Cr2O3 layers to form, with chloride attack effectively attacking passive layers and inhibiting their ability to form passive layers [30].
Iron oxides also appeared to form during corrosion. At a potential of 800 mV, oxygen was detected at levels of around 33–39 wt%, which was not previously detected when potentiostatically held at −330 mV. The eutectic austenite appeared to almost fully preferentially corrode when increased to a potentiostatic potential of 1100 mV. Similar results were found in nitride-added stainless steel manufactured by laser powder bed fusion, where iron hydroxide formed in the outermost region of the passive layer [31]. This is especially the case as the chromium content within carbides did not appear to significantly decrease, fluctuating around 43–48 wt% in all alloys for all potentiostatic points. In support of this studies on corrosion of similar HCWI alloys in alkaline (pH 14) solution found that FeO forms dominantly within a film layer on the eutectic matrix, with trace amounts of CrO also detected within the film [32]. Furthermore, the observations from the Bode plots (Figure 14 and Figure 15) reveal that nitrogen-rich alloys maintain their capacitive character over a wider frequency range, suggesting that nitrogen not only improves initial passivation but also enhances the long-term stability of the passive film. This is particularly evident in the phase angle plot (Figure 15), where Alloy N3 exhibits the widest frequency range with phase angles approaching −70° to −80°, indicating a more ideal capacitive behaviour.
Nitrogen appeared to be beneficial in preventing corrosion of the alloys. Without using nitrogen shielding gas, Alloy N0 had the lowest Ecorr value at −618 mV. Ecorr values for Alloys N1, N2, and N3 were all at least 100 mV higher, at −496, −528, and −474 mV, respectively. Alloy N0 having the worst corrosion resistance and Alloy N3 having the best corrosion resistance are also backed by the EIS data through the size of the impedance curve on the Nyquist curve. Greater-sized impedance loops can be associated with greater resistance of the system, with the diameter of the curve becoming larger as the nitrogen gas flow rate increases (i.e., from smallest to largest—Alloy N0 → Alloy N1 → Alloy N2 → Alloy N3). Further analysis of the EIS equivalent circuit model also agrees with this finding, with Alloy N0 having the lowest corrosion resistance Rcor of 2325 Ω, whilst Alloy N3 has the highest Rcor parameter of 4700 Ω. The most direct explanation for corrosion resistance improvement is the increase in nitrogen content within the austenite with increasing gas flow rates, from 0.6 wt% up to 1.1 wt% as per Table 6. As discussed in the literature, nitrogen additions can increase the electrode potential of substrates, reducing the electrode potential differences with the carbide and thus reducing corrosion [27]. The inclusion of nitrogen content can also reduce the number of metallic coating bonds, raising resistivity [33]. Nitrided steels have also been reported to form NH4+ and NH3 when nitrogen is released into the electrolyte during corrosion [34]. This results in an increase in interfacial pH, which has been stated to decrease the driving force for oxidation [33]. Increases in pH can also be shown using Pourbaix diagrams to increase the likelihood of forming passive Cr2O3 layers rather than other corrosion products [35,36].
As discussed, nitrogen addition can increase the inherent corrosion resistance of metals through alloying [27]. However, it is also possible that nitrogen indirectly reduced corrosion by affecting the galvanic effect between the carbides and austenite. As discussed in Section 4.1, the proportion of the austenite increased with increasing nitrogen gas flow rates. This affects the anode–cathode ratio, with the anode size (i.e., the austenite) increasing in relation to the cathode (carbides). Further, with carbides size increasing with nitrogen additions, this decreases the interface boundary between the carbide and the austenite. Due to this increase in size, less-severe corrosion is expected to occur within the austenite. The refinement of carbides has also been associated with improvements in the corrosion wear performance of hypereutectic high-chromium cast iron [27,37].
This study has shown that adding nitrogen to the hardfacing alloy improves the corrosion resistance of the alloy. When the hardfacing alloys are used in erosion–corrosion conditions with moderate impact, nitrogen-alloyed hardfacing alloys are likely to perform better. Further, heat treatment to redistribute the nitrogen could increase the wear resistance of the alloys [38]. It would also be interesting to study if nitrogen precipitates [39] when the hardfacing alloys are heat-treated. Other future work to emphasise the results of this study should be conducted, such as quantitative phase analysis of XRD patterns and fracture toughness to understand the effects of increased levels of austenite.
5. Conclusions
In this study, nitrogen as a shielding gas was used to evaluate its effects on microstructure and corrosion resistance of high-chromium white iron.
The following points were found:
- Using nitrogen as a shielding gas is a viable method of addition to improve hardfacing alloys produced by welding.
- Increased nitrogen was alloyed into the hardfacing weld deposit as the flow rate of nitrogen as the amount of shielding gas increased. As the nitrogen flowrate increased, there was an increase in the amount of austenite.
- Shielding gas appeared to inhibit the growth of eutectic carbides, with larger austenite proportions associated with higher nitrogen gas flow rates likely due to the use of nitrogen as an austenitic stabiliser.
- Nitrogen was found to improve the corrosion resistance of the hardfacing alloy even when nitrogen was added to the weld deposit as a shielding gas.
- Austenite corroded in preference to the carbides, which showed that austenite was anodic to the carbides.
Considering the lack of research for these effects on as-deposited high- chromium white iron alloys, the results of this research should enable greater optimisation and the design of better-performing materials.
Author Contributions
Conceptualization, C.T. and K.K.; Formal analysis, C.T.; Investigation, C.T.; Methodology, C.T. and K.K.; Supervision, K.K. and N.K.E.; Validation, C.T.; Writing—original draft, C.T.; Writing—review and editing, C.T., K.K. and N.K.E. All authors have read and agreed to the published version of the manuscript.
Funding
This research was supported by the Australian Government Research Training Program Scholarship through Charles Darwin University.
Data Availability Statement
The original contributions presented in this study are included in the article. Further inquiries can be directed to the corresponding author.
Conflicts of Interest
The authors declare no conflicts of interest.
References
- AS 2576-1982; Welding Consumables for Build-Up and Wear Resistance—Classification System. Available online: https://infostore.saiglobal.com/ (accessed on 18 August 2024).
- Tabrett, C.P.; Sare, I.; Ghomashchi, M. Microstructure-property relationships in high chromium white iron alloys. Int. Mater. Rev. 1996, 41, 59–82. [Google Scholar] [CrossRef]
- Wu, S.; Zheng, K.; Zou, J.; Jiang, F.; Han, X. A study of the behavior and effects of nitrogen take-up from protective gas shielding in laser welding of stainless steel. J. Manuf. Process. 2018, 34, 477–485. [Google Scholar] [CrossRef]
- Wang, S. Mechanical Behaviors and Mechanisms of Nitrogen Effect of High Nitrogen Austenitic Stainless Steels; Technical Institute of Physics and Chemistry: Beijing, China; Institute of Metal Research, Chinese Academy of Sciences: Shenyang, China, 2008. [Google Scholar]
- Lu, F.; Wei, S.; Xu, L.; Zhou, Y.; Wang, F.; Yang, Y.; Wang, X. Investigation on erosion-wear behaviors of high-chromium cast iron with high nitrogen content in salt–sand slurry. Mater. Res. Express 2019, 6, 106558. [Google Scholar] [CrossRef]
- Gong, L.-H.; Zhang, H.; Cheng, D.-L. Effect of nitrogen addition in shielding gas on corrosion behavior of duplex stainless steel welded joints. Trans. Mater. Heat Treat. 2013, 34, 112–115. [Google Scholar]
- Galloway, A.; McPherson, N.; Baker, T. An evaluation of weld metal nitrogen retention and properties in 316LN austenitic stainless steel. Proc. Inst. Mech. Eng. Part L J. Mater. Des. Appl. 2011, 225, 61–69. [Google Scholar] [CrossRef]
- Kamiya, O.; Chen, Z.; Kikuchi, Y. Microporosity formation in partially melted zone during welding of high nitrogen austenitic stainless steels. J. Mater. Sci. 2002, 37, 2475–2481. [Google Scholar] [CrossRef]
- Wang, Q.; Gu, G.; Jia, C.; Li, K.; Wu, C. Investigation of microstructure evolution, mechanical and corrosion properties of SAF 2507 super duplex stainless steel joints by keyhole plasma arc welding. J. Mater. Res. Technol. 2023, 22, 355–374. [Google Scholar] [CrossRef]
- Qiang, W.; Wang, K. Shielding gas effects on double-sided synchronous autogenous GTA weldability of high nitrogen austenitic stainless steel. J. Mater. Process. Technol. 2017, 250, 169–181. [Google Scholar] [CrossRef]
- Zhao, L.; Tian, Z.-L.; Peng, Y.; Qi, Y.-C.; Wang, Y.-J. Influence of nitrogen and heat input on weld metal of gas tungsten arc welded high nitrogen steel. J. Iron Steel Res. Int. 2007, 14, 259–262. [Google Scholar] [CrossRef]
- Yawei, L.; Liqiang, G.; Minqi, D.; Zhengyang, C.; Tounan, J.; Wenhang, Y.; Hanguang, F. Microstructure and properties of hypereutectic high chromium cast iron containing nitrogen. Mater. Sci. Technol. 2024, 40, 26–41. [Google Scholar] [CrossRef]
- Ibrahim, M.M.; Ibrahim, K.M. Effect of nitrogen addition on microstructure and mechanical properties of as-cast high-chromium cast iron containing niobium. Trans. Indian Inst. Met. 2020, 73, 2259–2267. [Google Scholar]
- Xu, L.; Wang, F.; Li, M.; Li, F.; Wang, X.; Jiang, T.; Deng, X.; Wei, S. Fabrication and abrasive wear property of high chromium cast iron with high vanadium and high nitrogen content (HCCI-VN). Wear 2023, 523, 204828. [Google Scholar] [CrossRef]
- Marimuthu, V.; Kannoorpatti, K. Corrosion Behaviour of High Chromium White Iron Hardfacing Alloys in Acidic and Neutral Solutions. J. Bio- Tribo-Corros. 2016, 2, 29. [Google Scholar] [CrossRef]
- Zou, Y.; Zhou, X. Effects of nitrogen-added double shielding gas and solution treatment on duplex stainless steel weld microstructure of deep-penetration tungsten inert gas welding. J. Mater. Eng. Perform. 2023, 32, 6995–7003. [Google Scholar]
- Hafez, K.M. The influence of shielding gases on keyhole-induced porosity and nitrogen absorption in SS 304 stainless steel fiber laser welds. Int. J. Adv. Manuf. Technol. 2023, 127, 1887–1894. [Google Scholar] [CrossRef]
- HyundaiWelding. Supershield CrC. Available online: https://www.hyundaiwelding.com/data/file/consumables/catalog/Supershield%20CrC_en_eng.pdf (accessed on 18 August 2024).
- ASTM D1141-98; Standard Practice for the Preparation of Substitute Ocean Water. 1998. Available online: https://www.astm.org/d1141-98r21.html (accessed on 31 July 2024).
- Panda, P.K.; Cho, T.-S.; Hsieh, C.-T.; Yang, P.-C. Cobalt-and copper-doped NASICON-type LATP polymer composite electrolytes enabling lithium titania electrode for solid-state lithium batteries with high-rate capability and excellent cyclic performance. J. Energy Storage 2024, 95, 112559. [Google Scholar] [CrossRef]
- Li, S.; Li, J.; Sun, C.; Zhu, S. Effect of nitrogen content on the precipitation and growth behavior of eutectic carbides M7C3 in electroslag remelted 7Cr13 steel. J. Mater. Res. Technol. 2023, 24, 9793–9807. [Google Scholar] [CrossRef]
- Atamert, S.; Bhadeshia, H. Microstructure and stability of Fe-Cr-C hardfacing alloys. Mater. Sci. Eng. A 1990, 130, 101–111. [Google Scholar] [CrossRef]
- Simmons, J.W. Overview: High-nitrogen alloying of stainless steels. Mater. Sci. Eng. A 1996, 207, 159–169. [Google Scholar] [CrossRef]
- Jiang, Z.; Li, H.; Chen, Z.; Huang, Z.; Zou, D.; Liang, L. The nitrogen solubility in molten stainless steel. Steel Res. Int. 2005, 76, 740–745. [Google Scholar]
- Tsuchiyama, T.; Takaki, S.; Ito, H.; Kataoka, K. Fabrication of ultrahigh nitrogen austenitic steels by nitrogen gas absorption into solid solution. Metall. Mater. Trans. A 2003, 34, 2591–2599. [Google Scholar]
- Zhang, Z.; Jing, H.; Xu, L.; Han, Y.; Zhao, L.; Zhou, C. Effects of nitrogen in shielding gas on microstructure evolution and localized corrosion behavior of duplex stainless steel welding joint. Appl. Surf. Sci. 2017, 404, 110–128. [Google Scholar]
- Gong, L.; Fu, H.; Zhi, X. Corrosion wear of hypereutectic high chromium cast iron: A review. Metals 2023, 13, 308. [Google Scholar] [CrossRef]
- Ding, H.; Liu, S.; Zhang, H.; Guo, J. Improving impact toughness of a high chromium cast iron regarding joint additive of nitrogen and titanium. Mater. Des. 2016, 90, 958–968. [Google Scholar]
- Wang, J.; Liu, T.; Zhou, Y.; Xing, X.; Liu, S.; Yang, Y.; Yang, Q. Effect of nitrogen alloying on the microstructure and abrasive impact wear resistance of Fe-Cr-C-Ti-Nb hardfacing alloy. Surf. Coat. Technol. 2017, 309, 1072–1080. [Google Scholar]
- Salasi, M.; Stachowiak, G.; Stachowiak, G. Chloride effect on corrosion & corrosive wear of high-Cr cast irons in different pH solutions. In Proceedings of the 18th International Corrosion Congress, Perth, WA, Australia, 20–24 November 2011; pp. 20–24. [Google Scholar]
- Vukkum, V.B.; Christudasjustus, J.; Darwish, A.A.; Storck, S.M.; Gupta, R.K. Enhanced corrosion resistance of additively manufactured stainless steel by modification of feedstock. npj Mater. Degrad. 2022, 6, 2. [Google Scholar] [CrossRef]
- Marimuthu, V.; Gore, P.; Raja, V.S.; Kannoorpatti, K. Analysis of Film Formation in High Chromium White Iron Hardfacing Alloys in Alkaline Solution using EIS and SIMS. J. Bio- Tribo-Corros. 2018, 4, 41. [Google Scholar] [CrossRef]
- Lavigne, O.; Alemany-Dumont, C.; Normand, B.; Berger, M.H.; Duhamel, C.; Delichére, P. The effect of nitrogen on the passivation mechanisms and electronic properties of chromium oxide layers. Corros. Sci. 2011, 53, 2087–2096. [Google Scholar] [CrossRef]
- Fenker, M.; Balzer, M.; Kappl, H. Corrosion protection with hard coatings on steel: Past approaches and current research efforts. Surf. Coat. Technol. 2014, 257, 182–205. [Google Scholar]
- Marimuthu, V.; Dulac, I.; Kannoorpatti, K. Significance of Pourbaix Diagrams to Study the Corrosion Behaviour of Hardfacing Alloys Based on Chromium Carbides at 298 K (25 °C). J. Bio- Tribo-Corros. 2016, 2, 17. [Google Scholar] [CrossRef]
- Tan, C.; Krishnan, K. Thermodynamic Analysis of the Corrosion Behaviour of Hardfacing Alloys Containing Chromium Nitrides. Metals 2023, 13, 1895. [Google Scholar] [CrossRef]
- Jain, A.-S.; Chang, H.; Tang, X.; Hinckley, B.; Zhang, M.-X. Refinement of primary carbides in hypereutectic high-chromium cast irons: A review. J. Mater. Sci. 2021, 56, 999–1038. [Google Scholar]
- Xu, H.-f.; Yu, F.; Wang, C.; Zhang, W.-l.; Li, J.; Cao, W.-q. Comparison of microstructure and property of high chromium bearing steel with and without nitrogen addition. J. Iron Steel Res. Int. 2017, 24, 206–213. [Google Scholar]
- Berns, H.; Duz, V.A.; Ehrhardt, R.; Gavriljuk, V.G.; Petrov, Y.N.; Tarasenko, A.V. Precipitation During Tempering of Chromium-rich Iron-based Martensite Alloyed with Carbon and Nitrogen. Int. J. Mater. Res. 1997, 88, 109–116. [Google Scholar] [CrossRef]

Disclaimer/Publisher’s Note: The statements, opinions and data contained in all publications are solely those of the individual author(s) and contributor(s) and not of MDPI and/or the editor(s). MDPI and/or the editor(s) disclaim responsibility for any injury to people or property resulting from any ideas, methods, instructions or products referred to in the content. |
© 2025 by the authors. Licensee MDPI, Basel, Switzerland. This article is an open access article distributed under the terms and conditions of the Creative Commons Attribution (CC BY) license (https://creativecommons.org/licenses/by/4.0/).