Article

Study on the Effects of Cryogenic Treatment on WC-Co Cemented Carbide at Different Scales Using an Indentation Technique

by
Suparoj Premjarunan
1,2,
Karuna Tuchinda
1,2,* and
Kaweewat Worasaen
2,3
1
Mechanical Engineering Simulation and Design, Mechanical and Automotive Engineering, The Sirindhorn International Thai-German Graduate School of Engineering, King Mongkut’s University of Technology North Bangkok (KMUTNB), Bangkok 10800, Thailand
2
Material Manufacturing and Surface Engineering Research Center (MaSE), Science and Technology Research Institute, King Mongkut’s University of Technology North Bangkok (KMUTNB), Bangkok 10800, Thailand
3
Department of Information and Production Technology Management (IPTM), King Mongkut’s University of Technology North Bangkok (KMUTNB), 1518 Pracharat 1 Road, Wongsawang, Bangsue, Bangkok 10800, Thailand
*
Author to whom correspondence should be addressed.
Metals 2025, 15(3), 297; https://doi.org/10.3390/met15030297
Submission received: 8 January 2025 / Revised: 14 February 2025 / Accepted: 5 March 2025 / Published: 8 March 2025
(This article belongs to the Special Issue Microstructure and Characterization of Metal Matrix Composites)

Abstract

Cemented carbide (WC-Co) combines high hardness, wear resistance, and toughness, making it ideal for tooling applications. This study investigated cryogenic treatment’s effects on the mechanical properties of samples from various suppliers prepared at different scales. Indentation tests were performed to assess the mechanical properties at the microscale and nanoscale. Overall, the mean microhardness did not show a significant change after cryogenic treatment. Instead, nanoindentation testing was used to identify the improvement after cryogenic treatment. However, considering the mean nanohardness may not adequately capture improvements in the material’s resistance to deformation, the maximum nanoindentation depth and nanohardness were analyzed to elucidate the mechanisms underlying mechanical property improvements in the form of histograms of %frequency along with load–displacement curves. The results showed a decreased frequency of high maximum indentation depths from Co phase improvement. This agreed with an increased frequency of moderate and high nanohardness and a decreased frequency of low nanohardness representing different areas with different phase controls. These results indicate that an alternative interpretation of nanoindentation data, presenting nanohardness and nanoindentation depth in the form of histograms, can provide a more detailed representation of the data distribution.

Graphical Abstract

1. Introduction

WC-Co cemented carbide is widely used in hard metal industries to manufacture cutting tools, drill bits, and highly wear-resistant components [1,2,3]. It also serves as a material for high-precision tools used in electronic component production and other high-precision equipment, such as nozzles for soldering and microdrills [4,5]. These industries utilize tungsten carbide-based alloys due to their desirable mechanical properties, including high strength, hardness, and wear resistance [6].
WC-Co cemented carbide is composed of WC particles and Co, a metallic binder phase synthesized through powder metallurgy [7]. The combination of the hard tungsten carbide (WC) phase and the softer cobalt (Co) matrix phase leads to high wear resistance from the WC and high toughness from the Co phase [8,9,10,11]. An increased amount of Co phase increases the fracture toughness but lowers the hardness and wear resistance [12].
The failure modes of WC-Co have been reviewed in multiple studies, focusing on the wear of WC-Co tools. These tools fail via various wear mechanisms, including abrasive wear, adhesive wear, and erosion–corrosion wear [1,13,14,15]. In cutting applications, abrasive minerals can erode the cutting surface during use, leading to sliding and rubbing actions on the WC-Co tool bits. The high hardness and sharp edges of the minerals contribute to a scraping effect on the WC-Co tool’s teeth [16].
The presence of Co significantly affects the mechanical properties and failure modes of WC-Co tools [8]. An increase in Co content reduces the hardness and abrasion resistance. Erosive particles preferentially remove the Co binder, which has lower local hardness, leading to carbide pullout that can cause failure at the cemented carbide surface [17,18,19]. The lower hardness of the Co binder phase makes it susceptible to removal through plastic deformation and micro-abrasion. This removal is often followed by the fracture and fragmentation of the WC grains. Additionally, preferential Co binder removal, which occurs as the binder is gradually extruded, has also been observed during the sliding wear of WC-Co surfaces [20,21].
Failures often manifest at the nanoscale or submicron scale. To understand the material’s failure behavior, it is crucial to conduct appropriate tests corresponding to the length scale associated with the expected failure mode. Therefore, different applications require varying testing scales to effectively study failure. The deformation or failure of WC crystals and the preferential sites for the nucleation of critical damage events at the carbide–binder interfaces are typically identified in smaller testing areas. In contrast, larger testing areas tend to exhibit a combination of failure mechanisms that are more representative of the bulk sample [22].
A related study on the deterioration and wear of WC-Co materials focused on the material loss in rock drill buttons. Catastrophic fractures generally occur when a sufficiently high stress concentration develops [23]. Multiple removal mechanisms have been investigated, including the degradation of the binder phase leading to Co removal, and the detachment of WC grains due to the lack of support from both the WC grains and the binder after removal. Various studies indicate that failure in a localized area can lead to more extensive material removal, resulting in more severe failures and reduced tool lifetimes [1,13,17,18,19,20,21,22,23].
Multiple studies have characterized WC-Co cemented carbide using nanoindentation to investigate the properties of individual phases. Research on WC-Co hard metal has shown that the mechanical properties can vary based on phase and orientation; different orientations also result in varying nanoindentation depths and hardness values [18,19]. The average hardness of the WC phase was found to be 32.8 GPa for prismatic planes and 40.4 GPa for basal planes, while the Co binder exhibited the lowest hardness, averaging around 10 GPa, along with the highest indentation depth [24]. Another study reported the hardness of the WC phase to range from 25 to 55 GPa and noted that the hardness values could be influenced by the larger indentation size relative to crystal size and by the surrounding phases [25].
Improving the mechanical properties of WC-Co can significantly extend tool lifetimes and reduce manufacturing costs. Another effective method for enhancing these properties is cryogenic treatment. Several studies have examined the effects of cryogenic treatment under various conditions [25,26,27,28,29]. This treatment can be classified into two categories: shallow cryogenic treatment and deep cryogenic treatment.
Research indicates that wear resistance and hardness improve following cryogenic treatment. These enhancements are attributed to factors such as the precipitation of the eta phase (η), WC grain refinement, and a reduction in the binder phase [27,28,29,30,31]. Notably, deep cryogenic treatment at −196 °C results in greater wear resistance compared to shallow cryogenic treatment at −110 °C, while shallow cryogenic treatment results in superior wear resistance compared to untreated samples [27]. Despite multiple studies claiming to have achieved the grain refinement of WC, a number of studies still show increasing WC grain size [32].
The eta phase (η) results from the combination of the tungsten (W), carbon (C), and cobalt (Co) binder, exhibiting higher hardness as demonstrated through microhardness testing and corroborated by several studies [27,28,29,30,33,34]. Although the local hardness of the η-phase is lower than that of the WC phase, it is higher than that of the Co binder phase. The formation of the η-phase reduces the likelihood of a preferential attack on the Co binder, which is softer than WC grains. This precipitation can prevent the removal of the Co binder, which would otherwise be followed by the removal of WC grains [18,35].
Additionally, cryogenic treatment induces a phase transition in cobalt from face-centered cubic (FCC) α-Co to hexagonal close-packed (HCP) ε-Co. The lower number of slip systems in ε-Co compared to α-Co contributes to increased hardness and strength, making the material more resistant to deformation [20]. Another study found that cryogenic treatment enhances the densification of the Co binder, leading to stronger bonding between carbide grains and the binder [30].
While the cryogenic treatment process and its effects have been extensively studied in the past, this research focused on different aspects. Most studies on the nanoindentation of WC-Co have typically presented results as mean nanohardness or mean nanoindentation depth, leading to the development of a practical methodology to qualitatively characterize materials’ behavior under load. In contrast, this study emphasizes the drawbacks of focusing on mean values obtained from multiple nanoindentations alone. Overlooking the load–displacement data distribution could lead to inaccurate conclusions on the effect of cryogenic treatment.
This research investigated the testing method of microindentation and nanoindentation tests of WC-Co before and after deep cryogenic treatment. The nanoindentation depth and nanohardness determined through nanoindentation testing were plotted on a histogram in the form of %frequency to analyze the results in detail.
Two grades of materials studied in this work were recommended by industrial partners from different industries. One material grade, commonly used in machining and forming processes, is typically obtained in cylindrical bar form (B samples). The other material grade, used in precision soldering nozzle applications, was provided as a sub-millimeter hollow tube (P samples). These raw materials were expected to undergo different preparation processes and exhibit variations in composition. Each type of sample was characterized separately to provide insights into the effects of testing methods and scale. Due to size limitations, only nanoindentation could be performed on the P samples, while both micro- and nanoindentation tests were conducted on the H samples. This study highlights the importance of nanoindentation instruments in various applications.
This study aimed to investigate the effect of cryogenic treatment on the behavior of WC-Co materials under load, with the goal of improving our understanding of material failure and enhancing the predictive capability of the in-service life of tools made from this material. The findings highlight the importance of using appropriate testing techniques in practical applications, aiming to improve material characterization for various industrial uses.

2. Materials and Methods

2.1. Materials

The experimental materials consisted of two types of WC-Co hard metals sourced from different suppliers, referred to as high-precision (P) and bulk (B) samples. Figure 1 illustrates these sample types.
The high-precision sample (P) has a tubular form, with an inner diameter of 1.5 mm, outer diameter of 2.2 mm, and length of 3 mm. The bulk sample (B), in contrast, is disk-shaped with a diameter of 20 mm and thickness of 5 mm. Table 1 provides the composition of both sample types in weight percentage as determined through energy dispersive spectroscopy (EDS) using FEI QUANTA 450 (FEI Company, Hillsboro, OR, USA) (eight positions per sample type).
Both types of samples were commercial grade. The bulk samples (B) were provided by an Asian manufacturer, while the high-precision samples (P) were provided by a Middle Eastern manufacturer. Both types of samples had submicron grain sizes.
In this study, the bulk samples were prepared with a surface roughness of 0.4 μm, a characteristic commonly employed in cutting tool applications. The top surface (xy-plane) of each sample was analyzed for microstructure and indentation at both the micro- and nanoscale (see Figure 1). Four untreated and four treated bulk samples were examined in this study.
A total of 13 high-precision samples were also prepared. Due to the limited size of these samples, only SEM (scanning electron microscopy) and nanoscale indentation tests were performed. Each sample was ground and polished on one outer surface (see Figure 2) using a 0.05 μm diamond paste. SEM and nanoindentation tests were conducted near the bottom end (+x direction) and top end (−x direction) of the samples, respectively.
Each type of sample was also subjected to NCT (non-cryogenic treatment) and DCT (deep cryogenic treatment).

2.2. Deep Cryogenic Treatment

Deep cryogenic treatment was conducted to enhance the mechanical properties of the WC-Co for the P and B samples. These treatments were performed at Nichidai (Thailand) Co., Ltd. (Nong Kakha, Thailand), using ULVAC Cryogenic technology (Ulvac Cryogenic Incorporated, Chigasaki, Japan), which is capable of cryogenic treatment at ultra-low temperatures while employing controlled cooling and heating rates.
All the samples underwent deep cryogenic treatment under conditions designed based on a parametric study conducted in-house. While the specific treatment conditions cannot be disclosed, the samples were maintained at the target temperature with a 99% control level for a specified soaking duration. Although not explicitly detailed, the cooling rate was maintained at the designed value with 95% control.
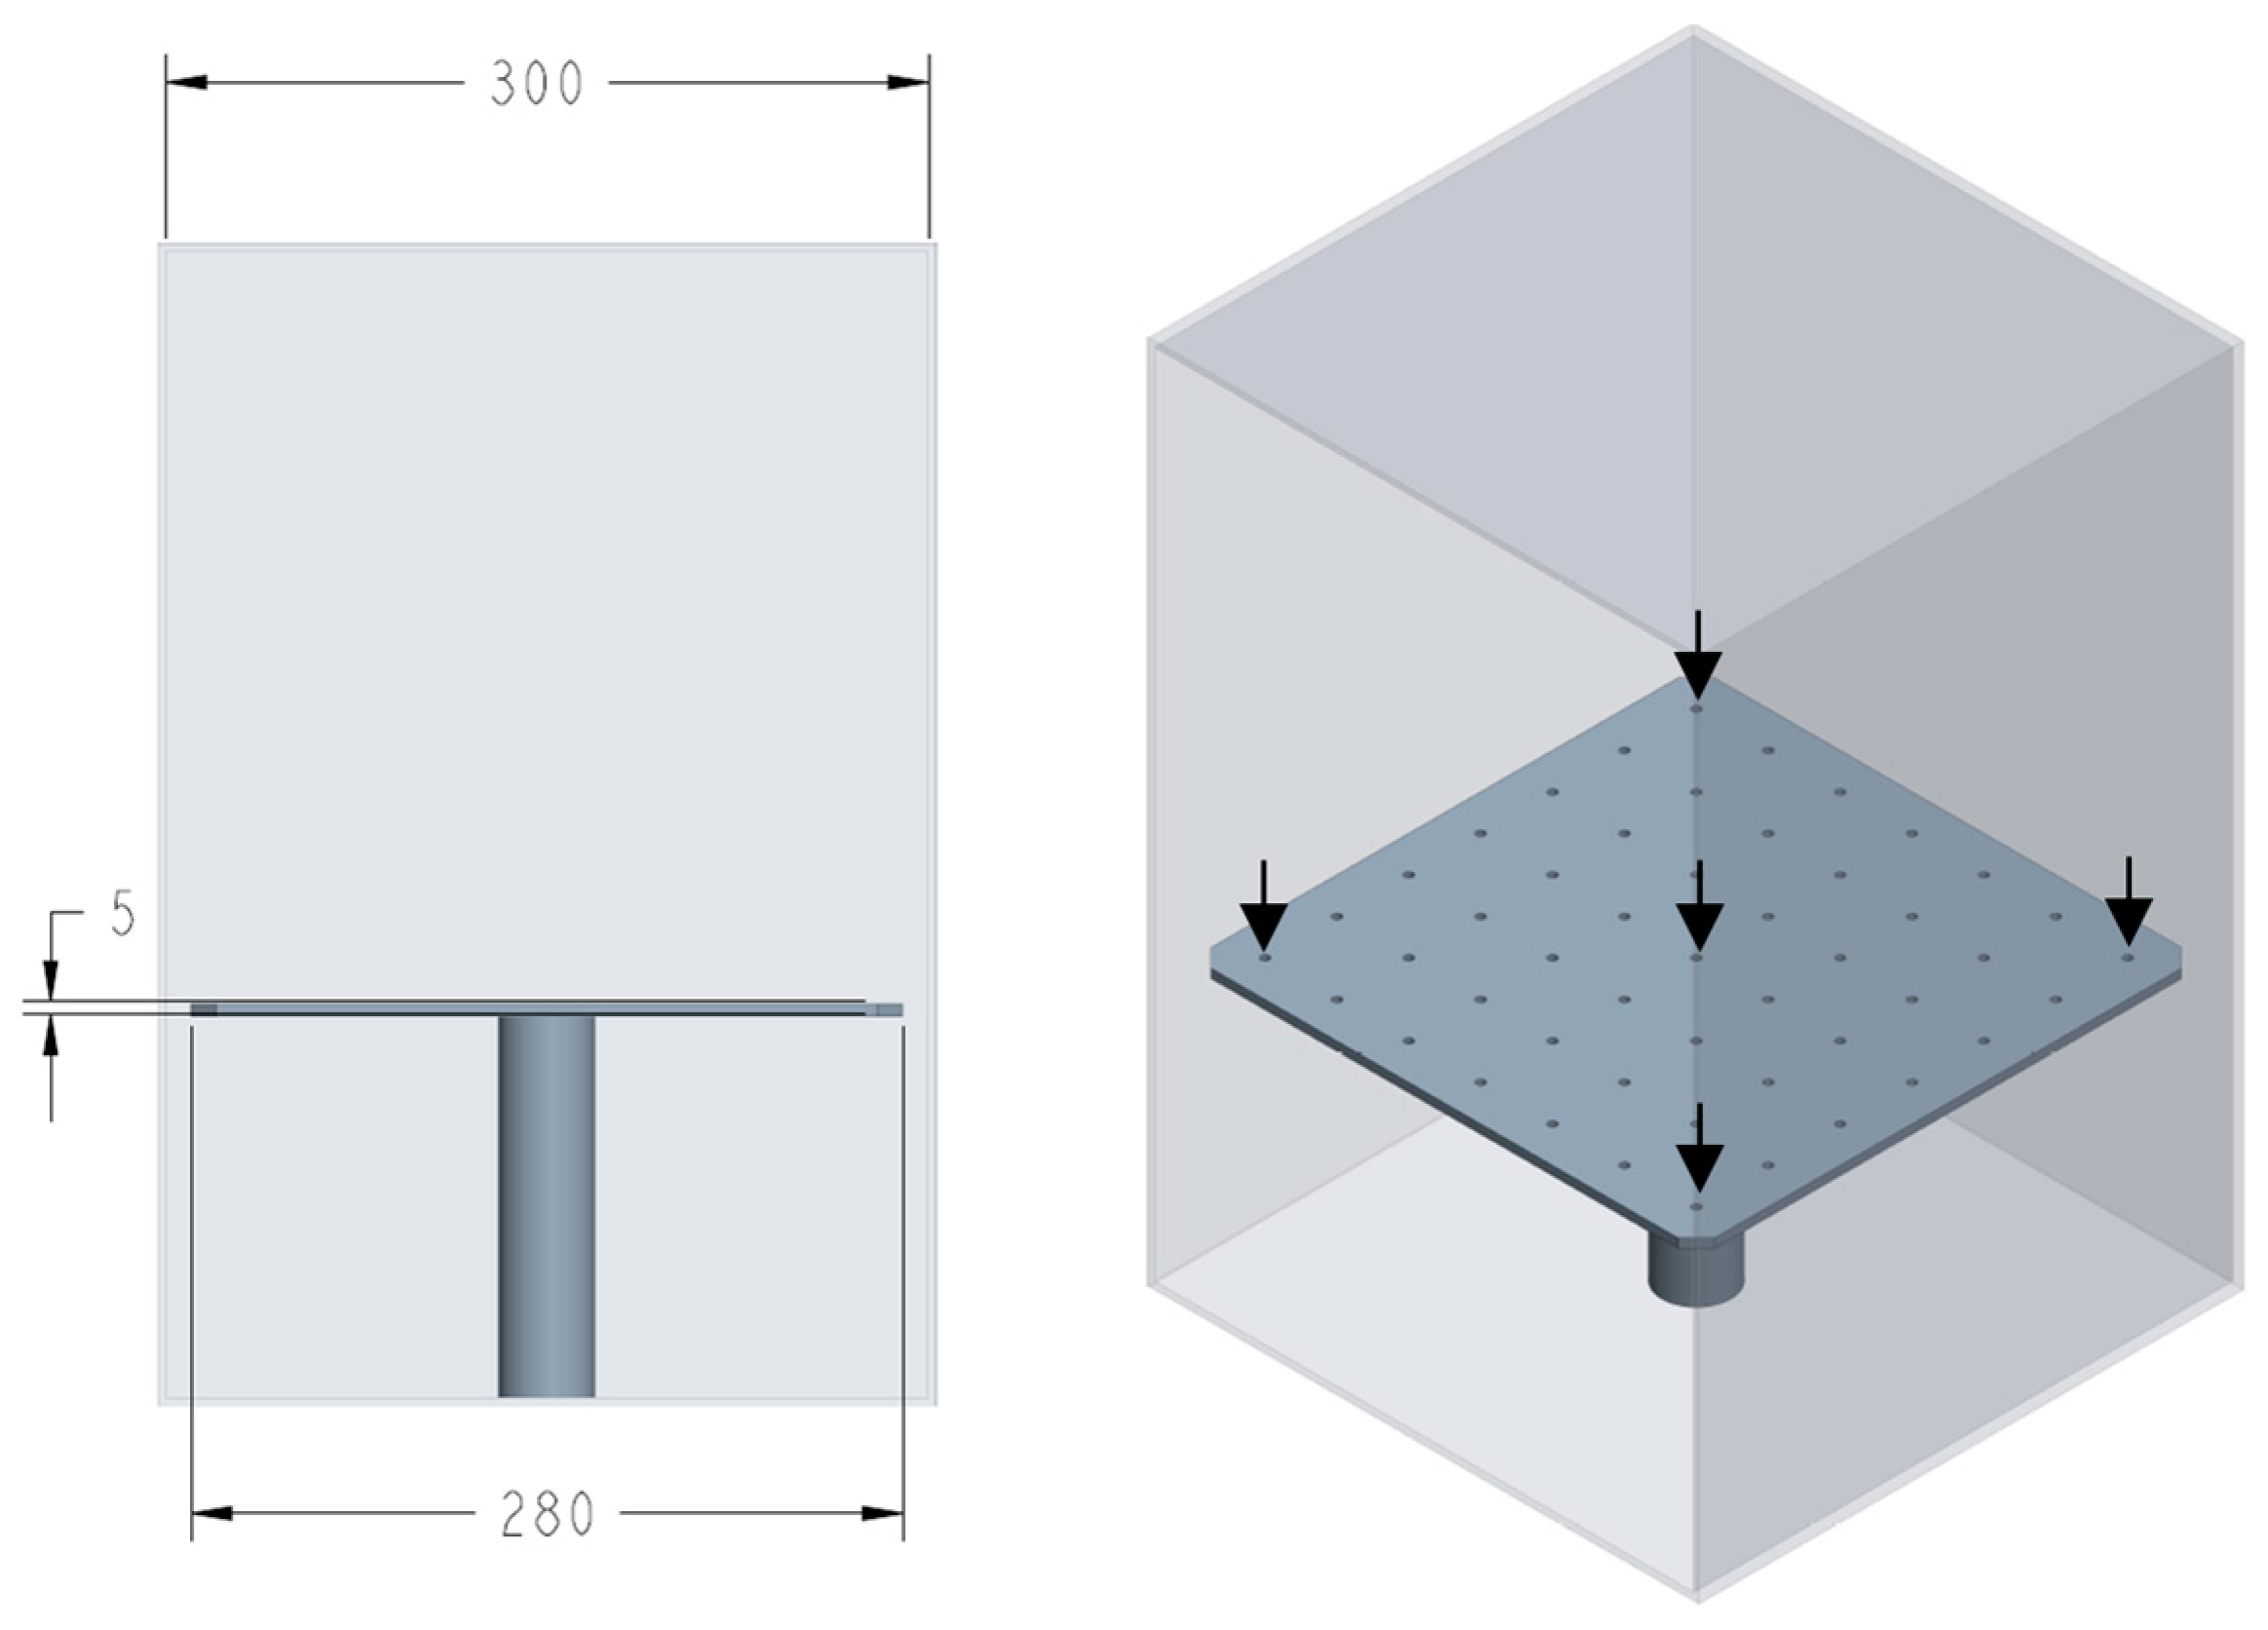
A preliminary investigation into the temperature distribution at various locations within the cryogenic chamber demonstrated effective temperature control, with a maximum temperature variation of less than 1% across different locations (the four corners and the center) during the soaking phase.
Furthermore, a preliminary study was performed through a virtual inspection of the microstructure and microhardness analysis of the bulk samples to determine suitable cryogenic conditions. The B and P samples were cryogenically treated within a chamber equipped with a sample stage, as depicted in Figure 2. The positions of the temperature sensors within the cryogenic chamber are indicated by five arrows.

2.3. Microstructure Investigation

The microstructure was evaluated using an Ultra-55-44-07 scanning electron microscope (SEM) (Carl Zeiss AG, Oberkochen, Germany) at a magnification of 7500 times and an accelerating voltage of 20 kV according to other work related to ultrafine-grain WC [36]. SEM images were captured from two specific areas of each P sample, located near the top and bottom of the flat-side surface, as detailed in the Materials Section. For the B samples, SEM images were taken randomly from four areas around the top surface.
The grain size was measured using the line intercept method based on the SEM images analyzed with ImageJ software (version 1.54d), including both WC grains and η-phases. Additionally, the binder areas before and after cryogenic treatment were investigated.

2.4. Nanoindentation Testing

The nanomechanical tester HYSITRON TI PREMIER (Hysitron, Minneapolis, MN, USA) model was used for nanoindentation testing. The indenter was a Berkovich indenter with a tip radius of 100 nm. A maximum indentation load of 10 mN was used for all the cases, following that employed in other studies, to minimize the surface effect [24], and the nanomechanical properties of cemented carbide with a final surface polished using 0.5 μm diamond were studied. Nanoindentation testing for the B samples was performed in nine random areas with five measurements per area on each sample. The P samples were tested with five measurements per area on two areas per sample, with one area near the top and the other near the bottom of the sample. The nanoindentation load vs. depth during loading and unloading results and hardness results were recorded for each sample. The loading and unloading time was 5 s, while the dwelling time was 2 s. Atomic force microscopy (AFM) was performed with a Berkovich indenter in the same nanomechanical tester to visualize some locations and represent indentation in different areas.

2.5. Microindentation Testing

Microindentation testing was conducted using the Sinowon MicVision VH-1 model (Sinowon, Dongguan, China). A load of 9.81 N (1 kgf) was applied, and the tests were performed in accordance with ASTM E92-17 [37] (Vickers hardness testing). The measurement sites were randomly selected, covering various areas on the top surface of the B samples, with five sites analyzed per sample. Microindentation tests were carried out on three samples. Subsequently, the microhardness values were determined and compared to the nanohardness results obtained from the nanoindentation testing of the B samples.

3. Results and Discussion

3.1. Microstructure Analysis

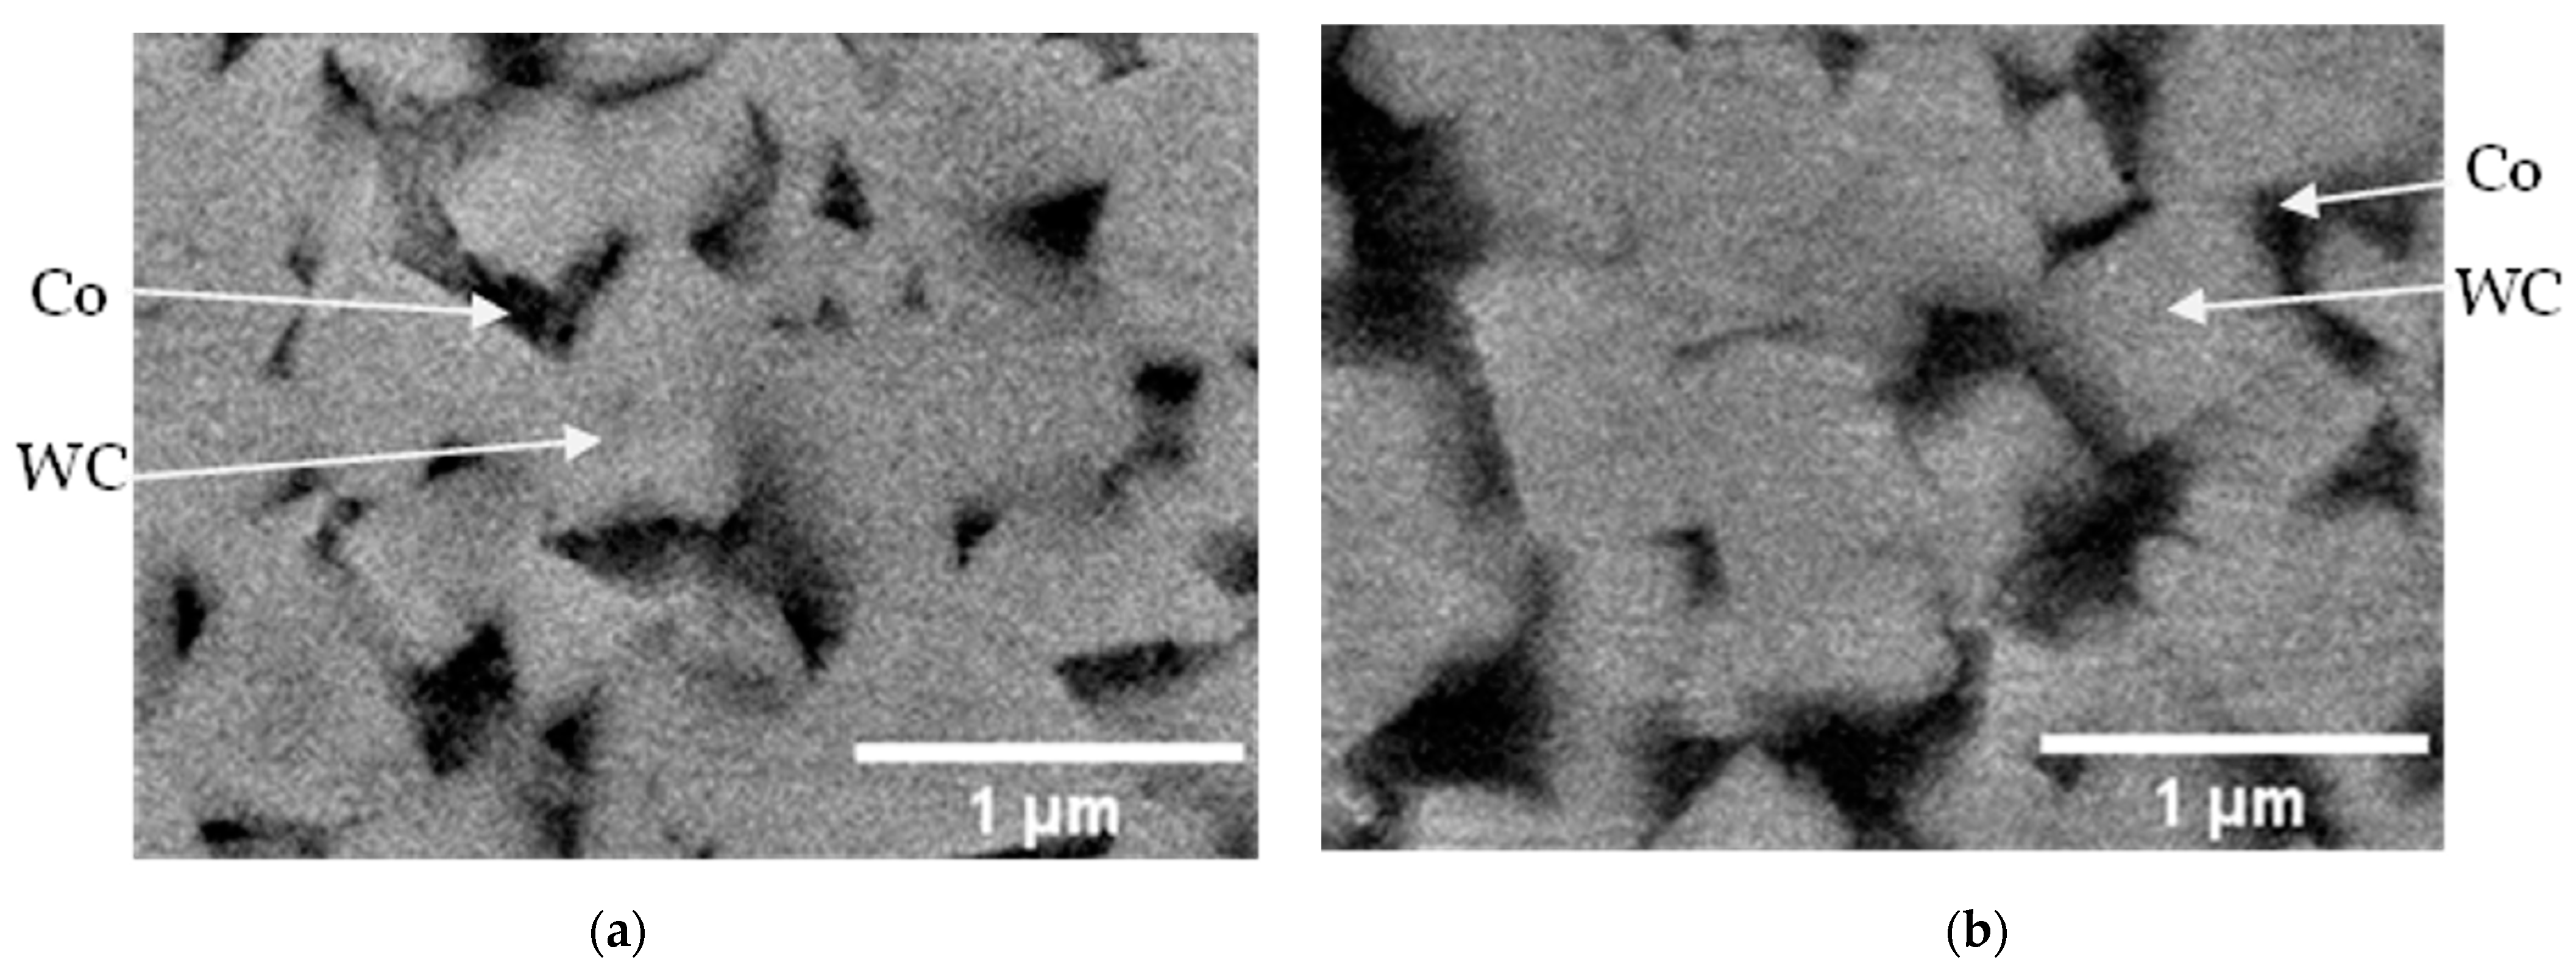
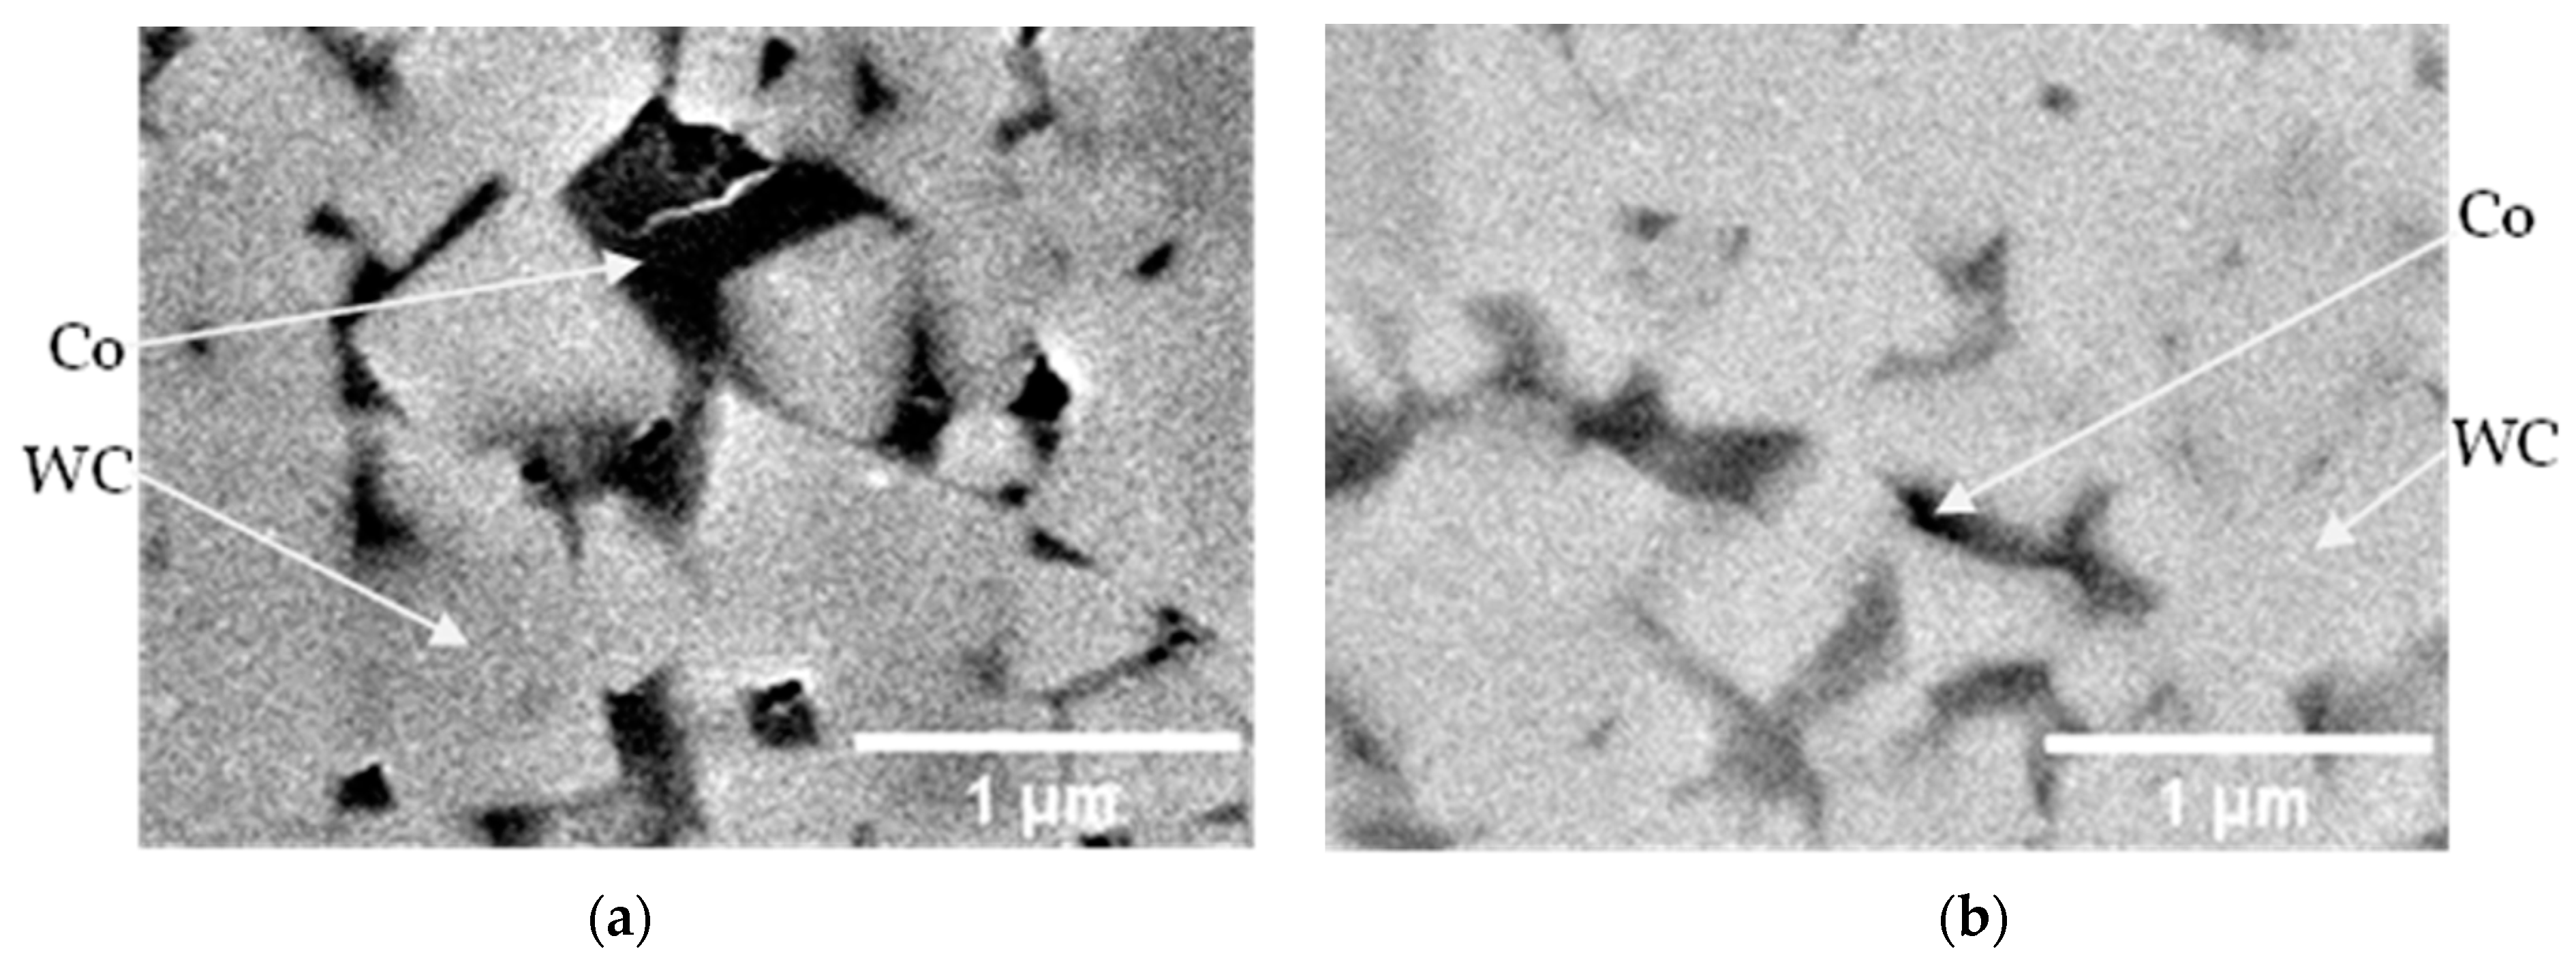
Figure 3 and Figure 4 present examples of scanning electron microscopy (SEM) images for the B and P samples, respectively. The SEM images illustrate the presence of various phases: the carbide phase appears as the white phase, and the binder as the black phase. The η-phase is expected to form from the carbide phase due to carbon deficiency and is embedded within the cobalt-rich binder phase. However, the precipitated η-phase was unclear in the SEM images; TEM was required to accurately characterize the precipitation of such secondary carbide.
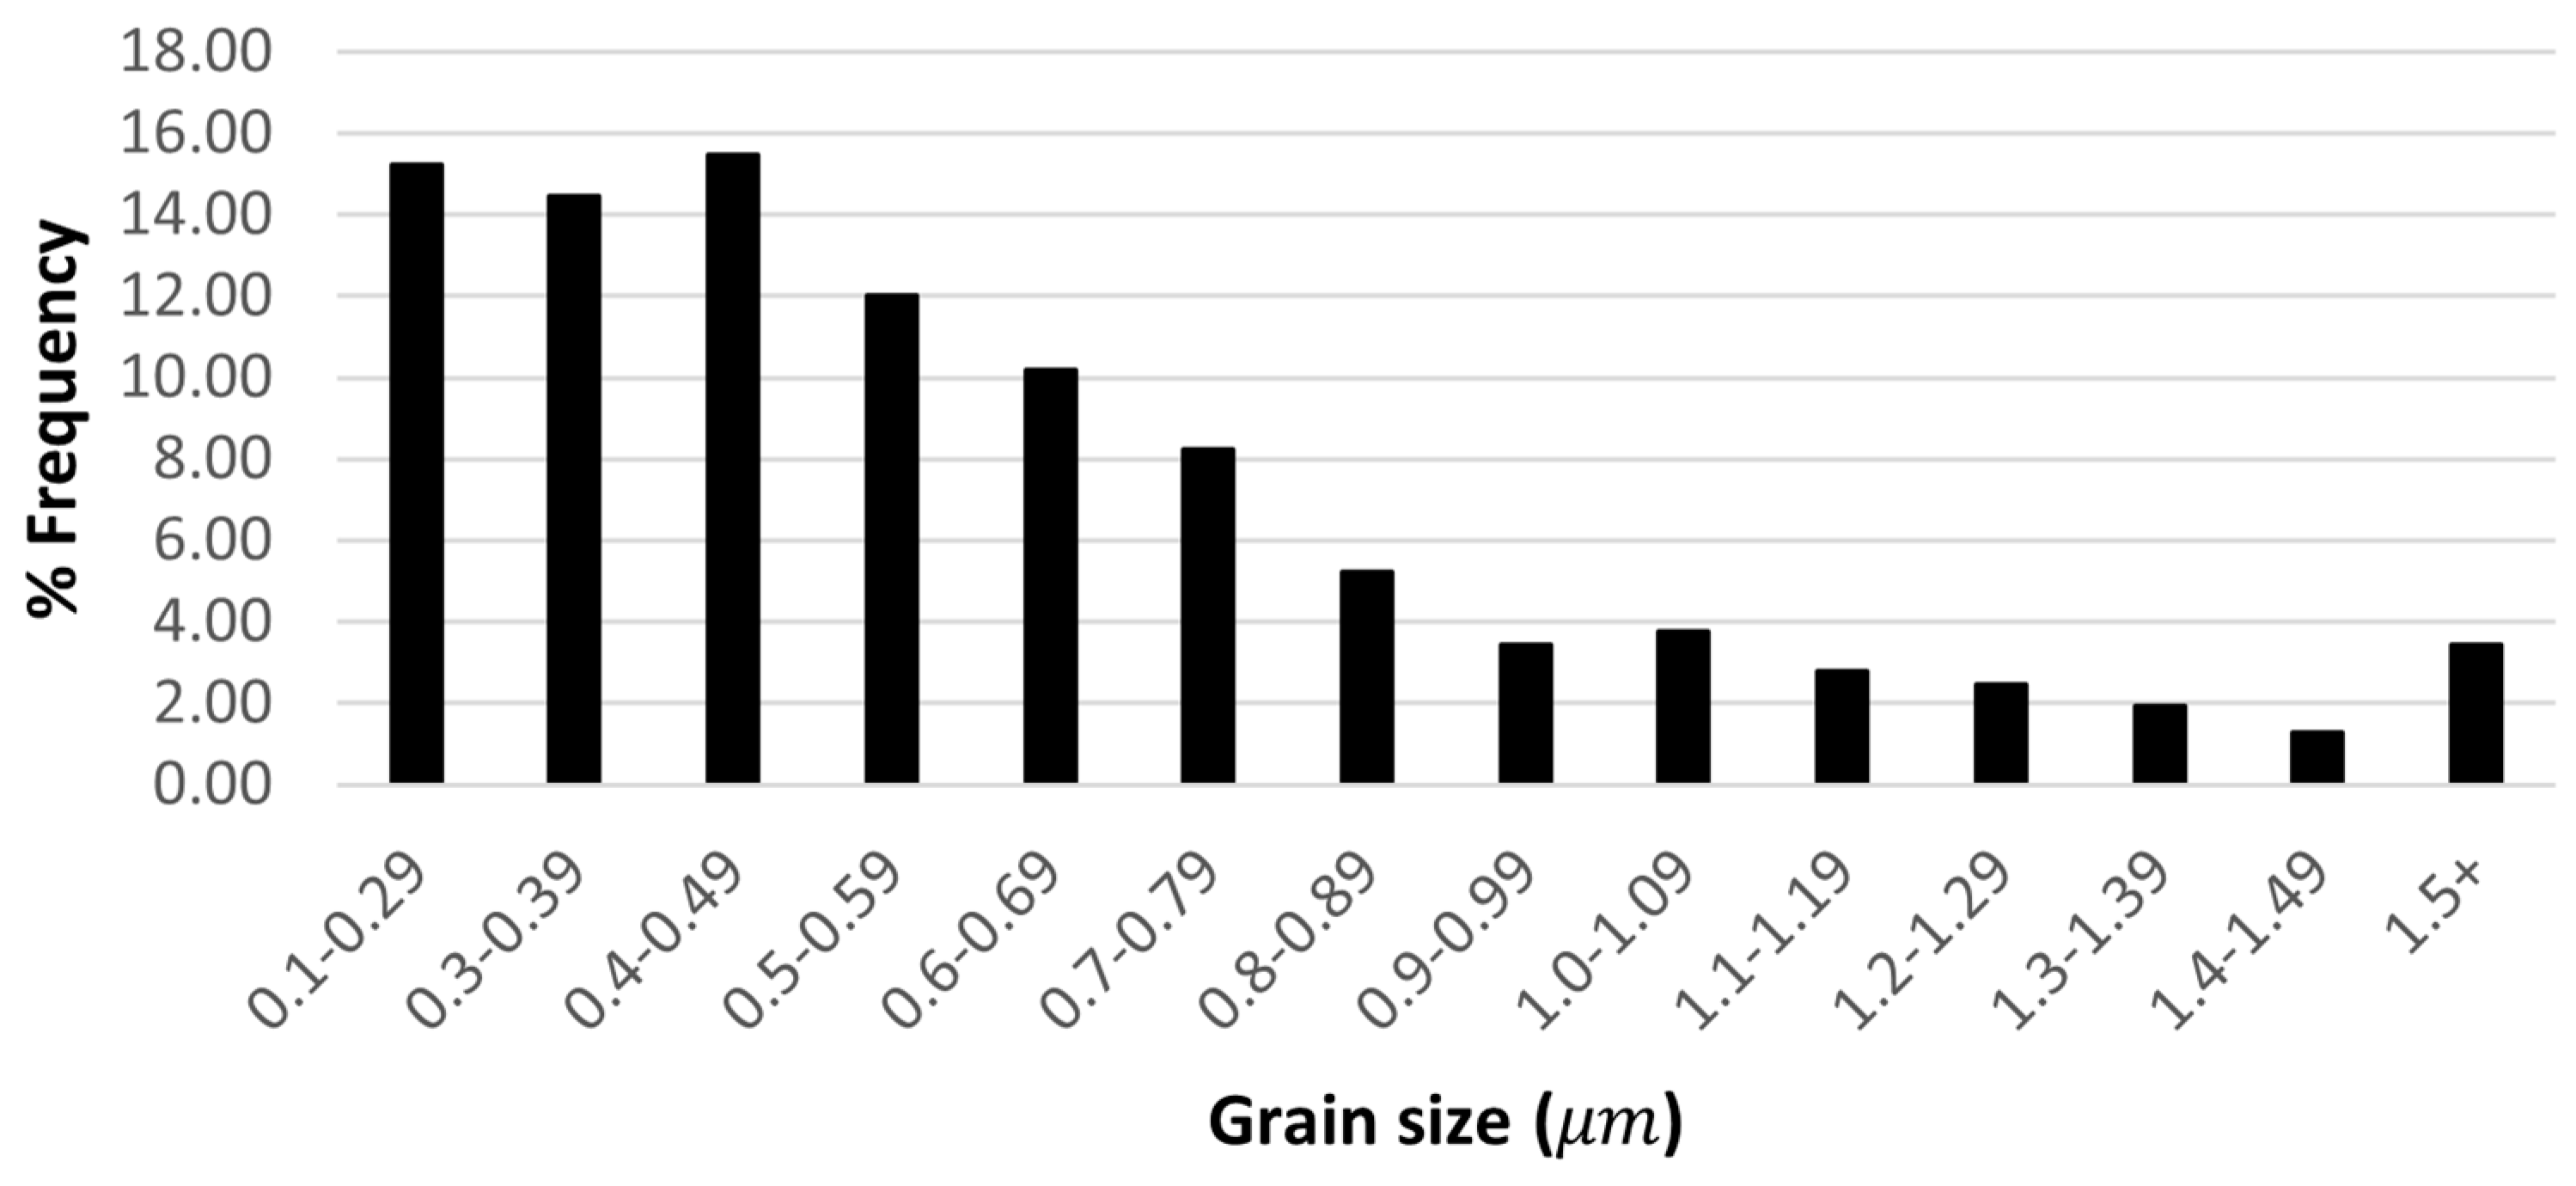
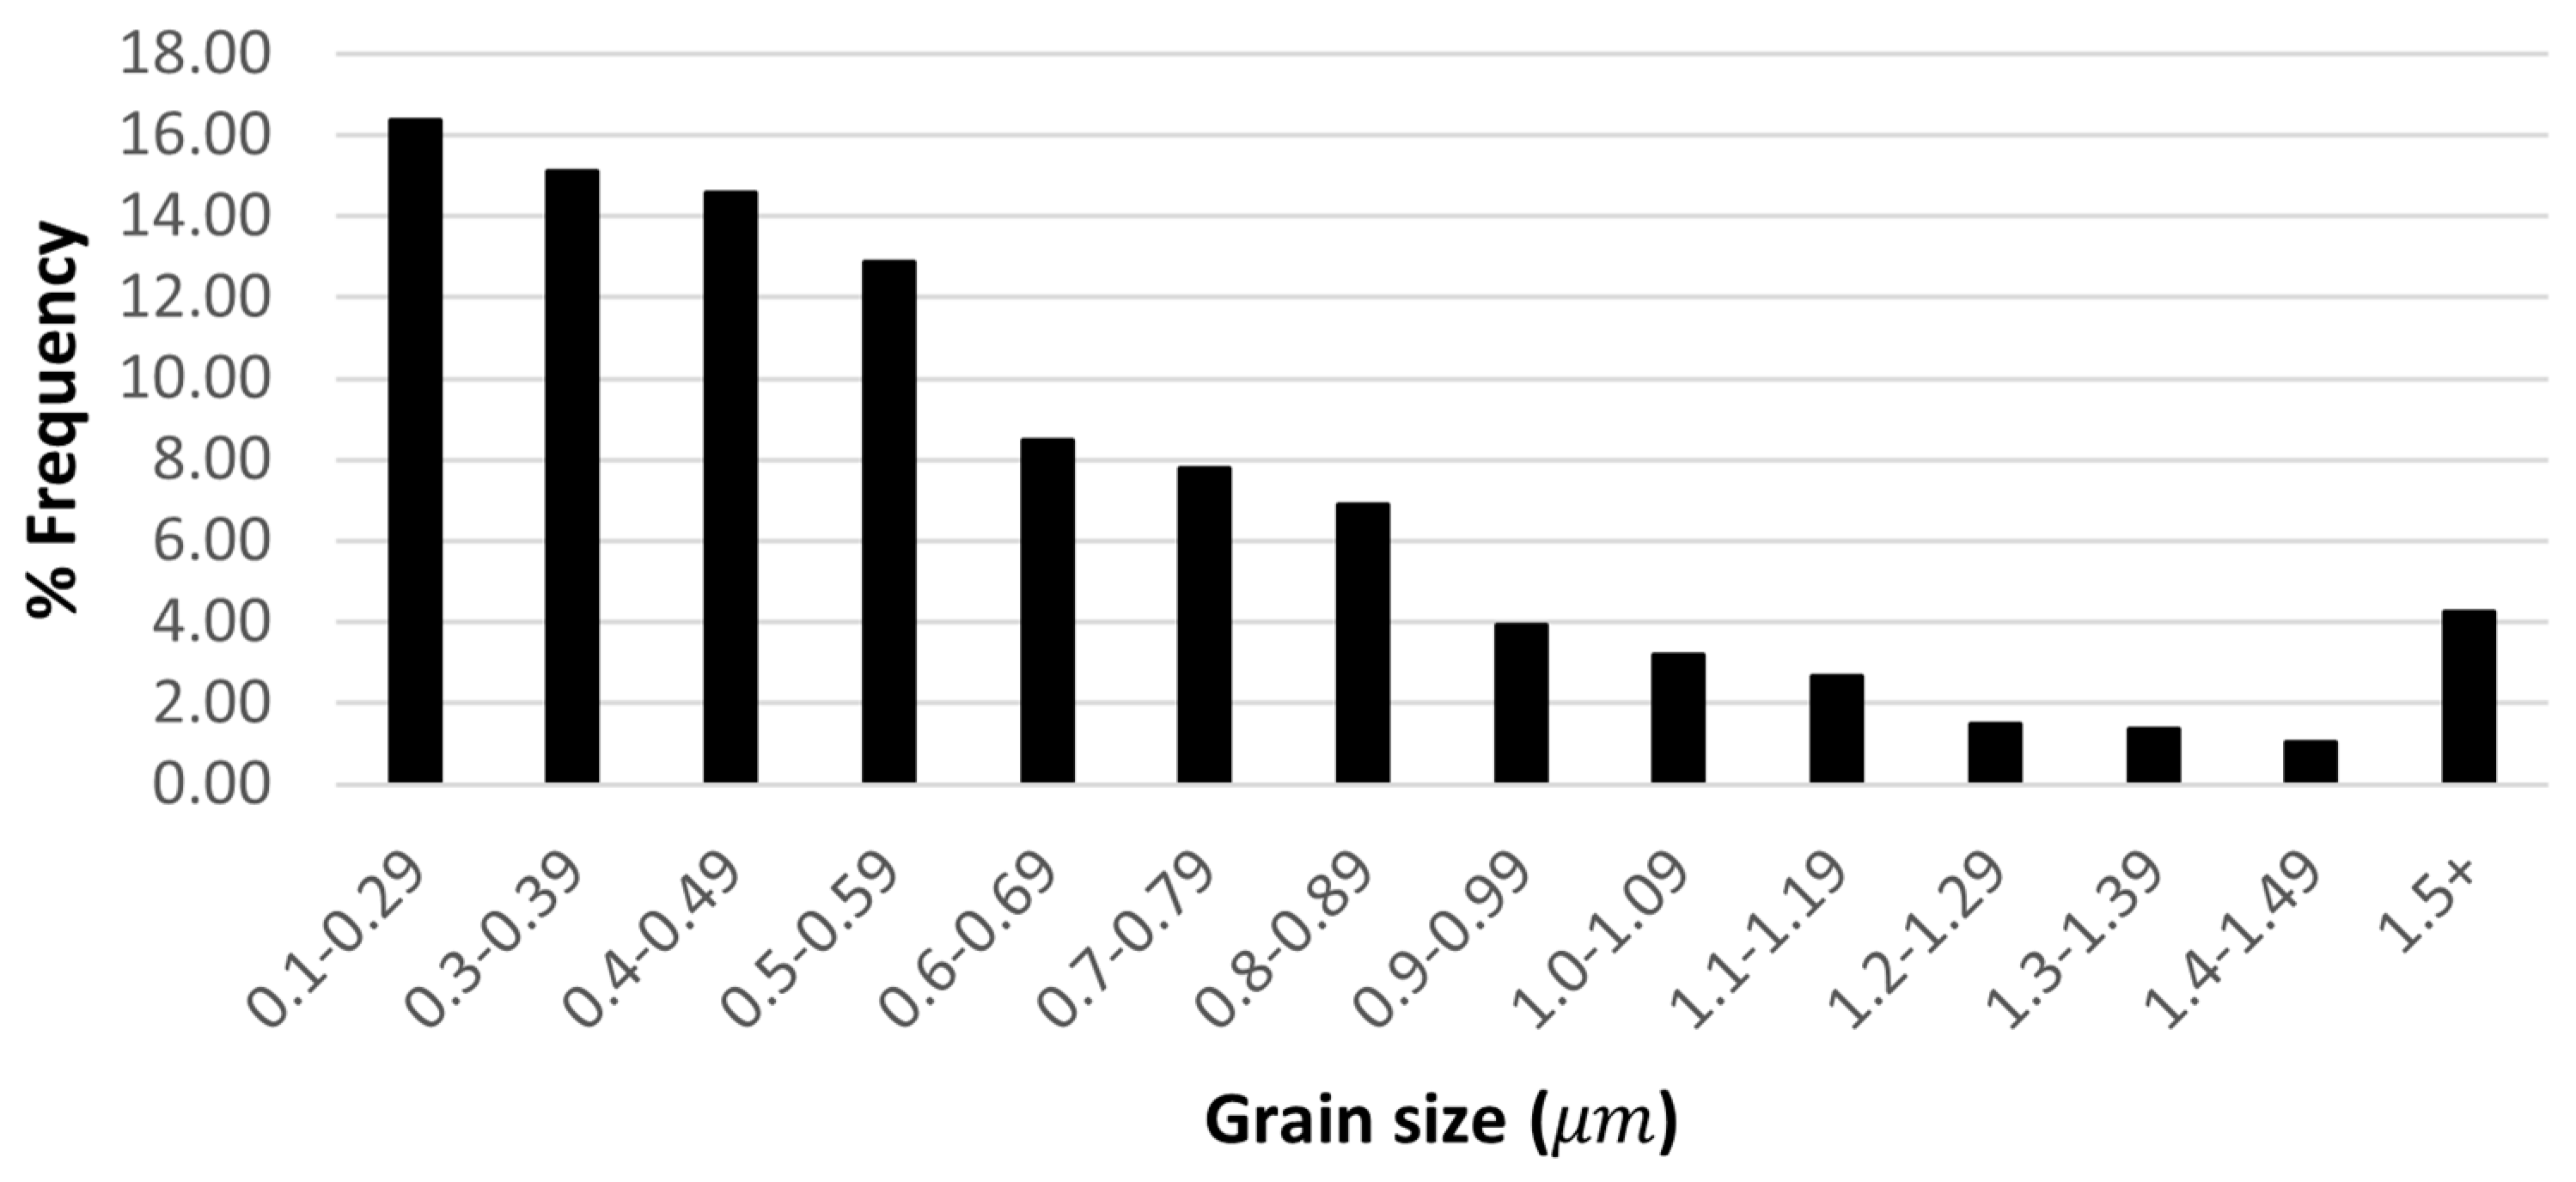
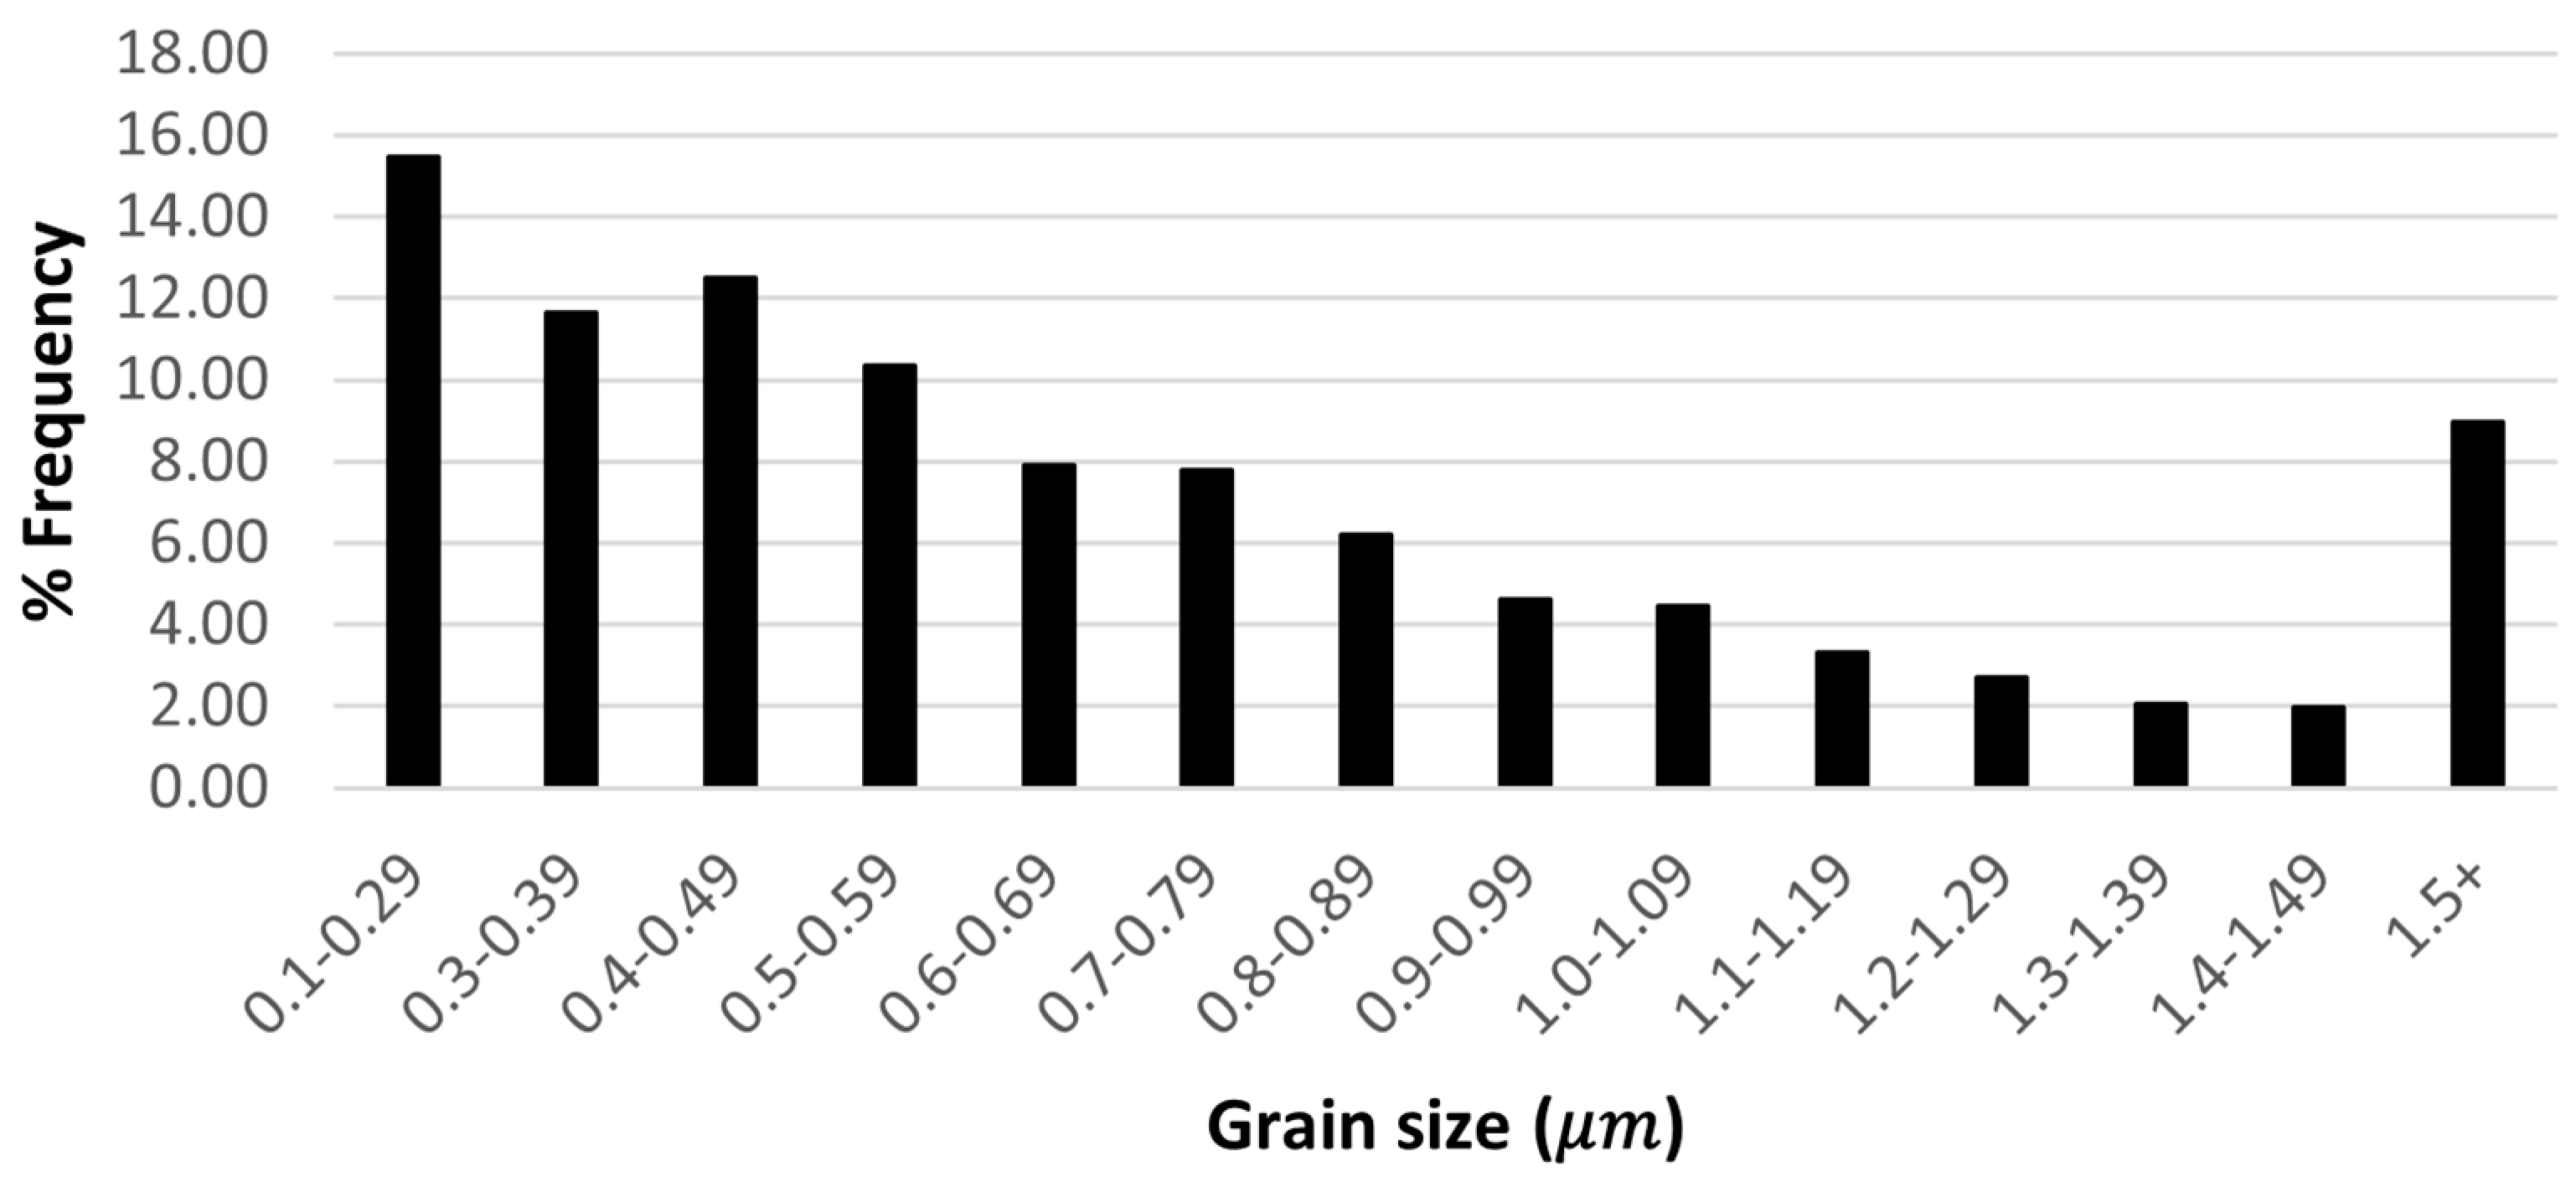
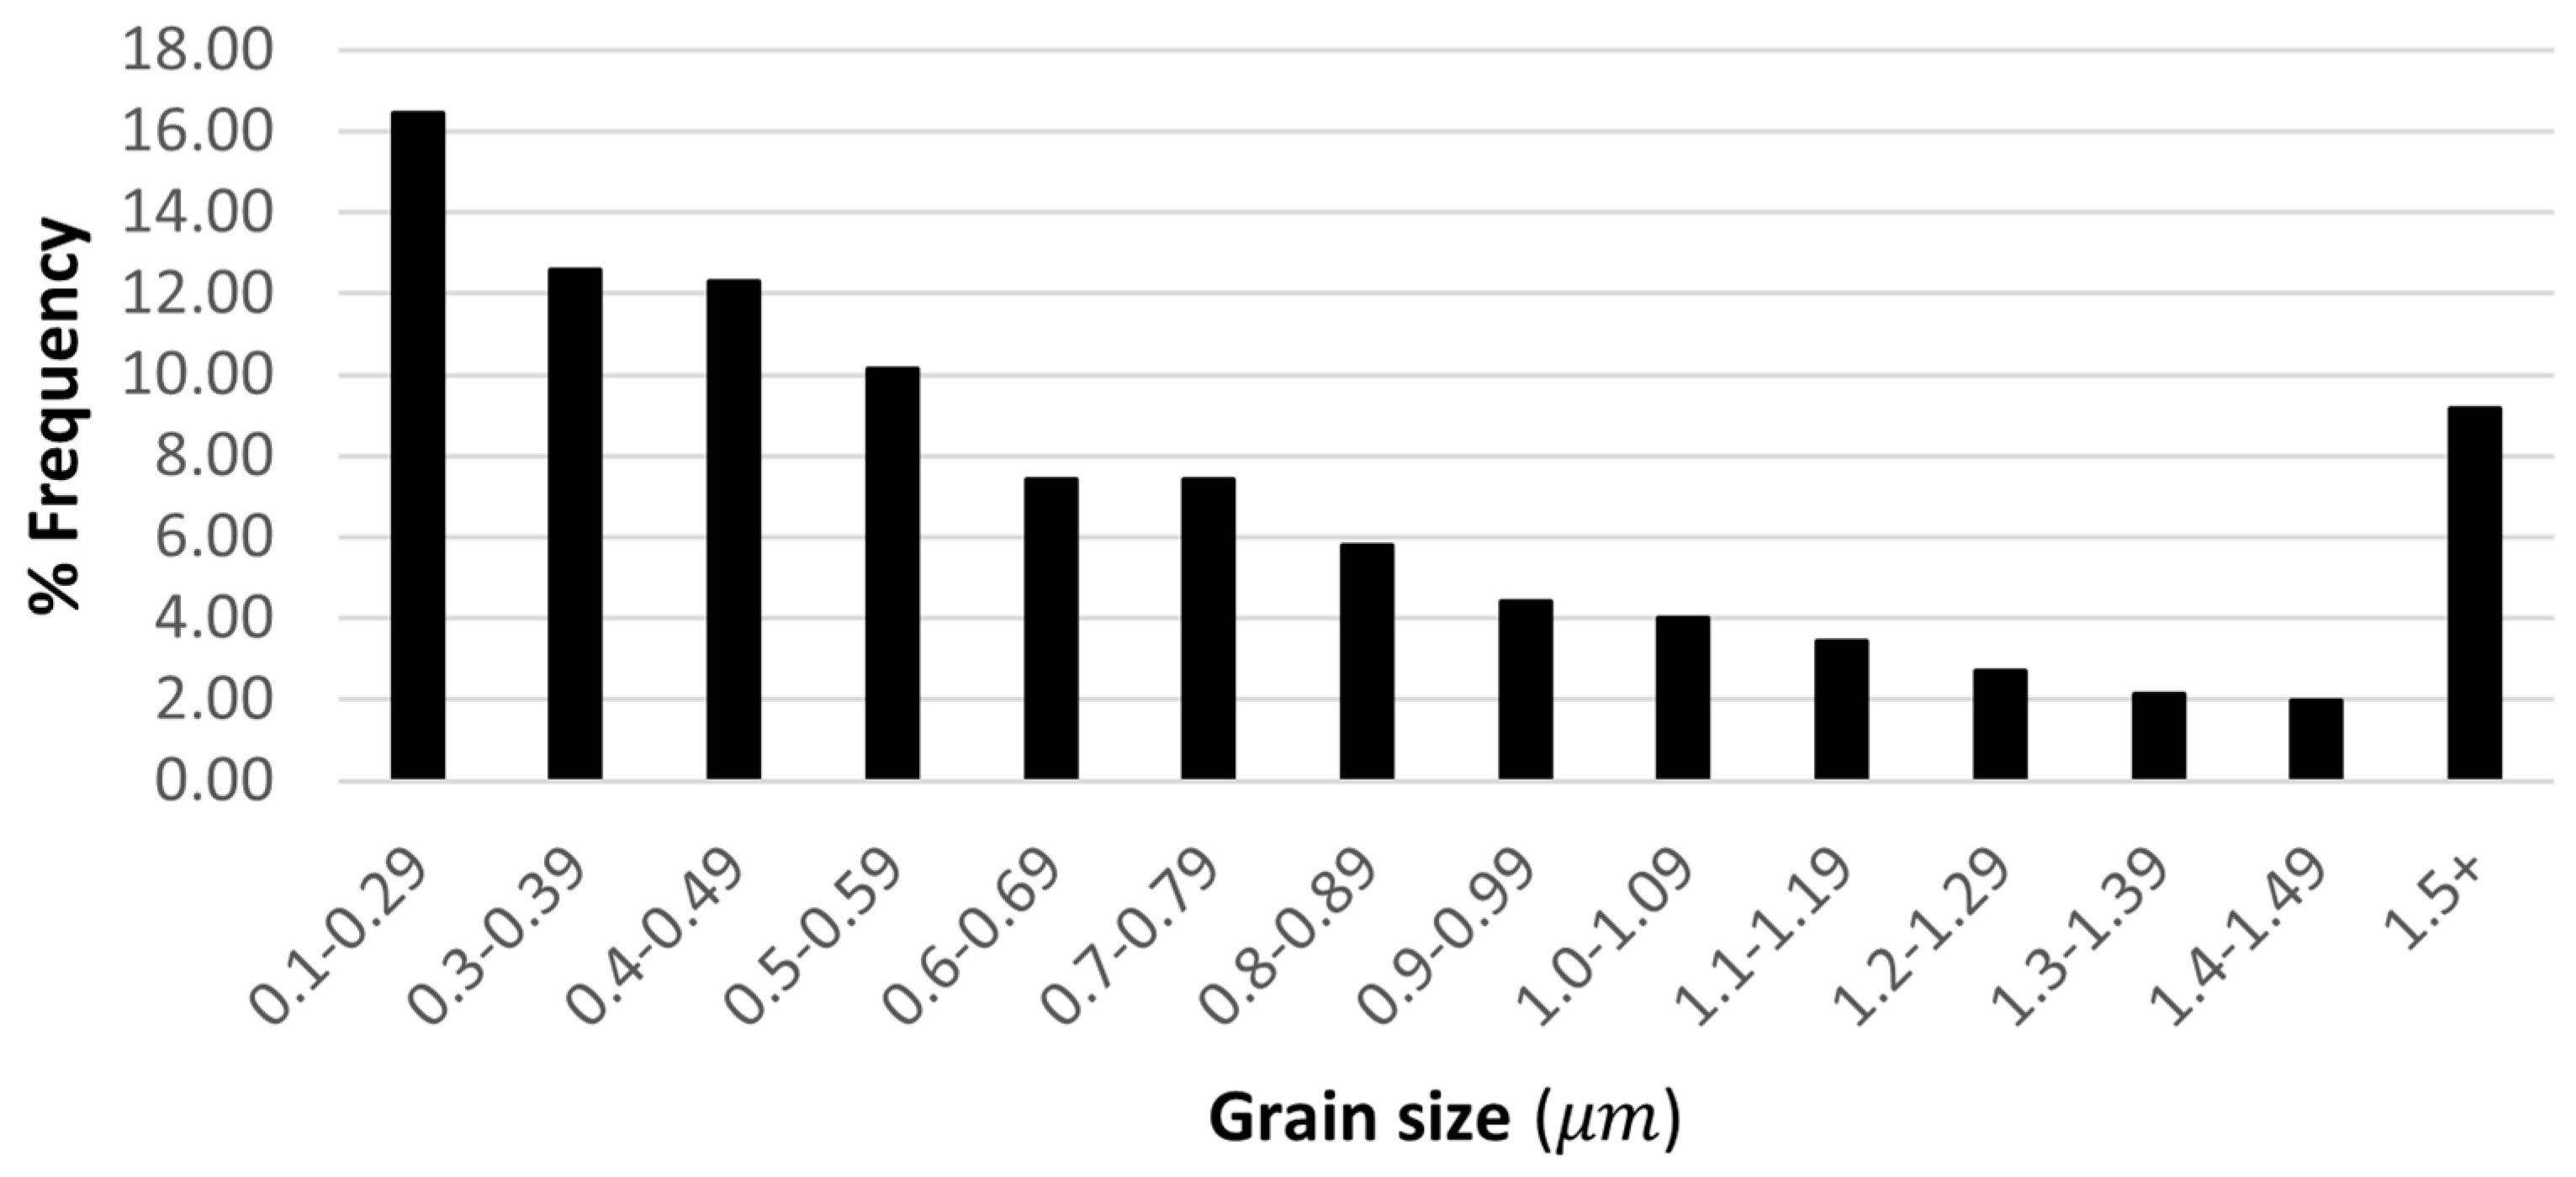
The grain size of WC was measured using the line-intercept method for both types of samples. The B samples’ grain sizes are visualized in the form of histograms in Figure 5 and Figure 6, for samples without cryogenic treatment (NCT) and those subjected to deep cryogenic treatment (DCT), respectively. The H samples’ grain sizes are plotted in histograms in Figure 7 and Figure 8, for NCT and DCT, respectively. The measured grain sizes do not show a significant difference between NCT and DCT.

3.2. Indentation Test Result

3.2.1. Nanoindentation Result

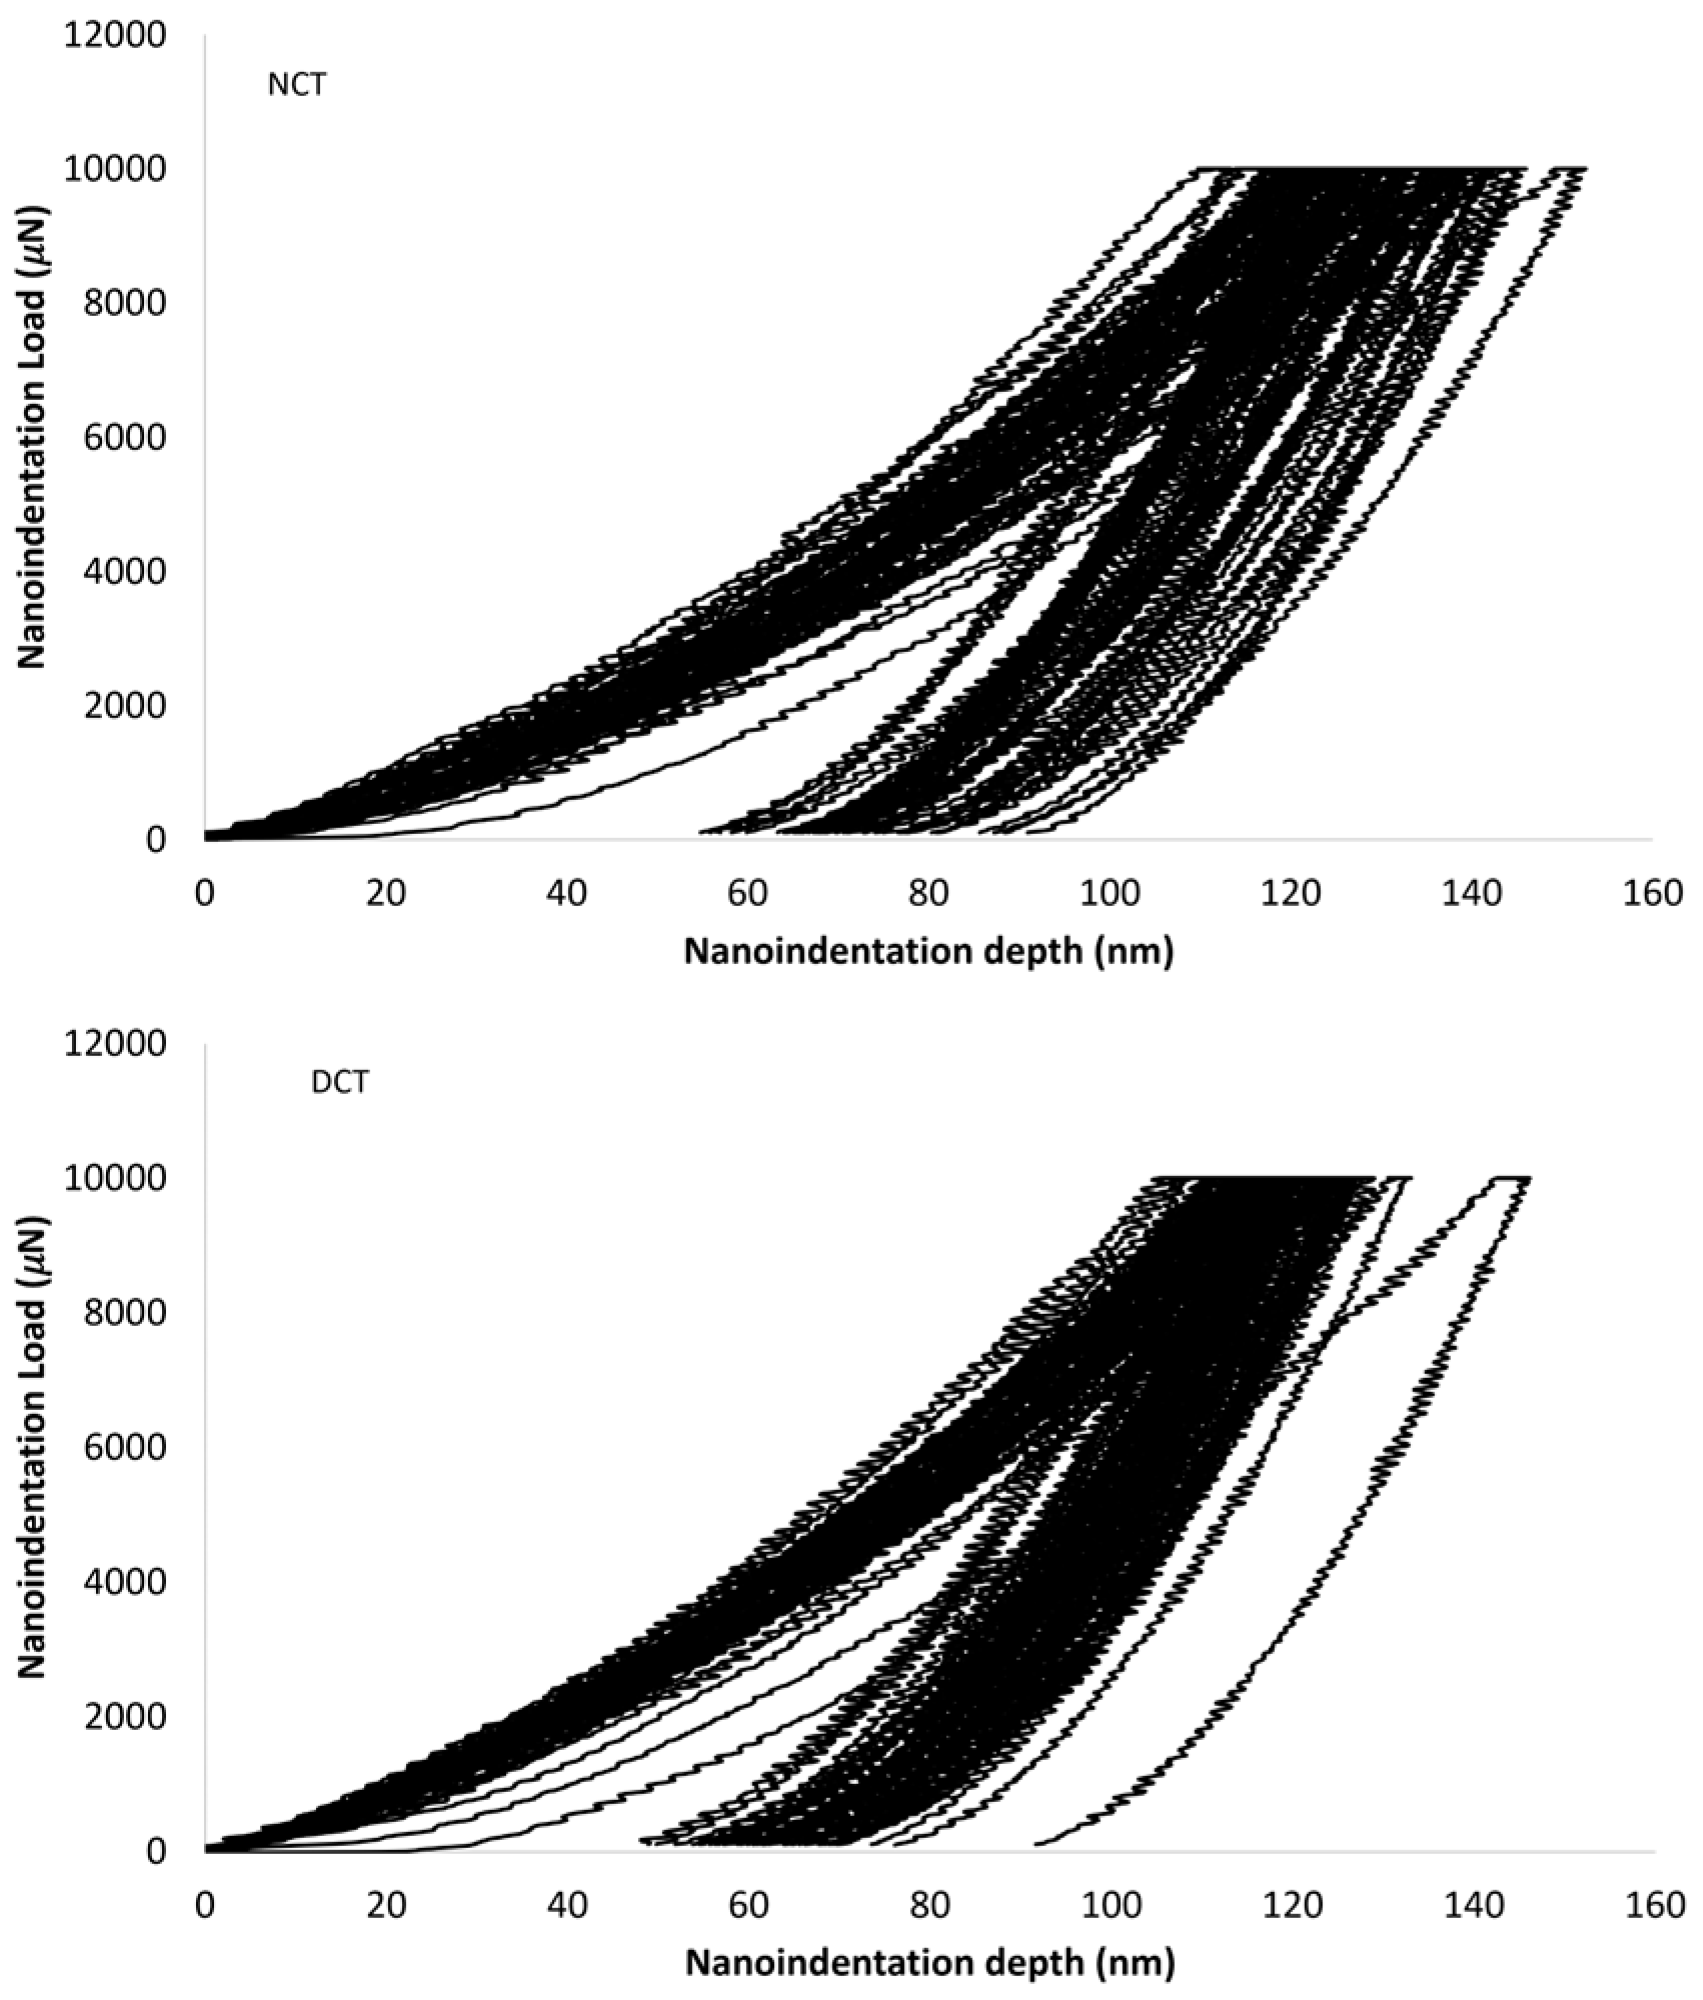
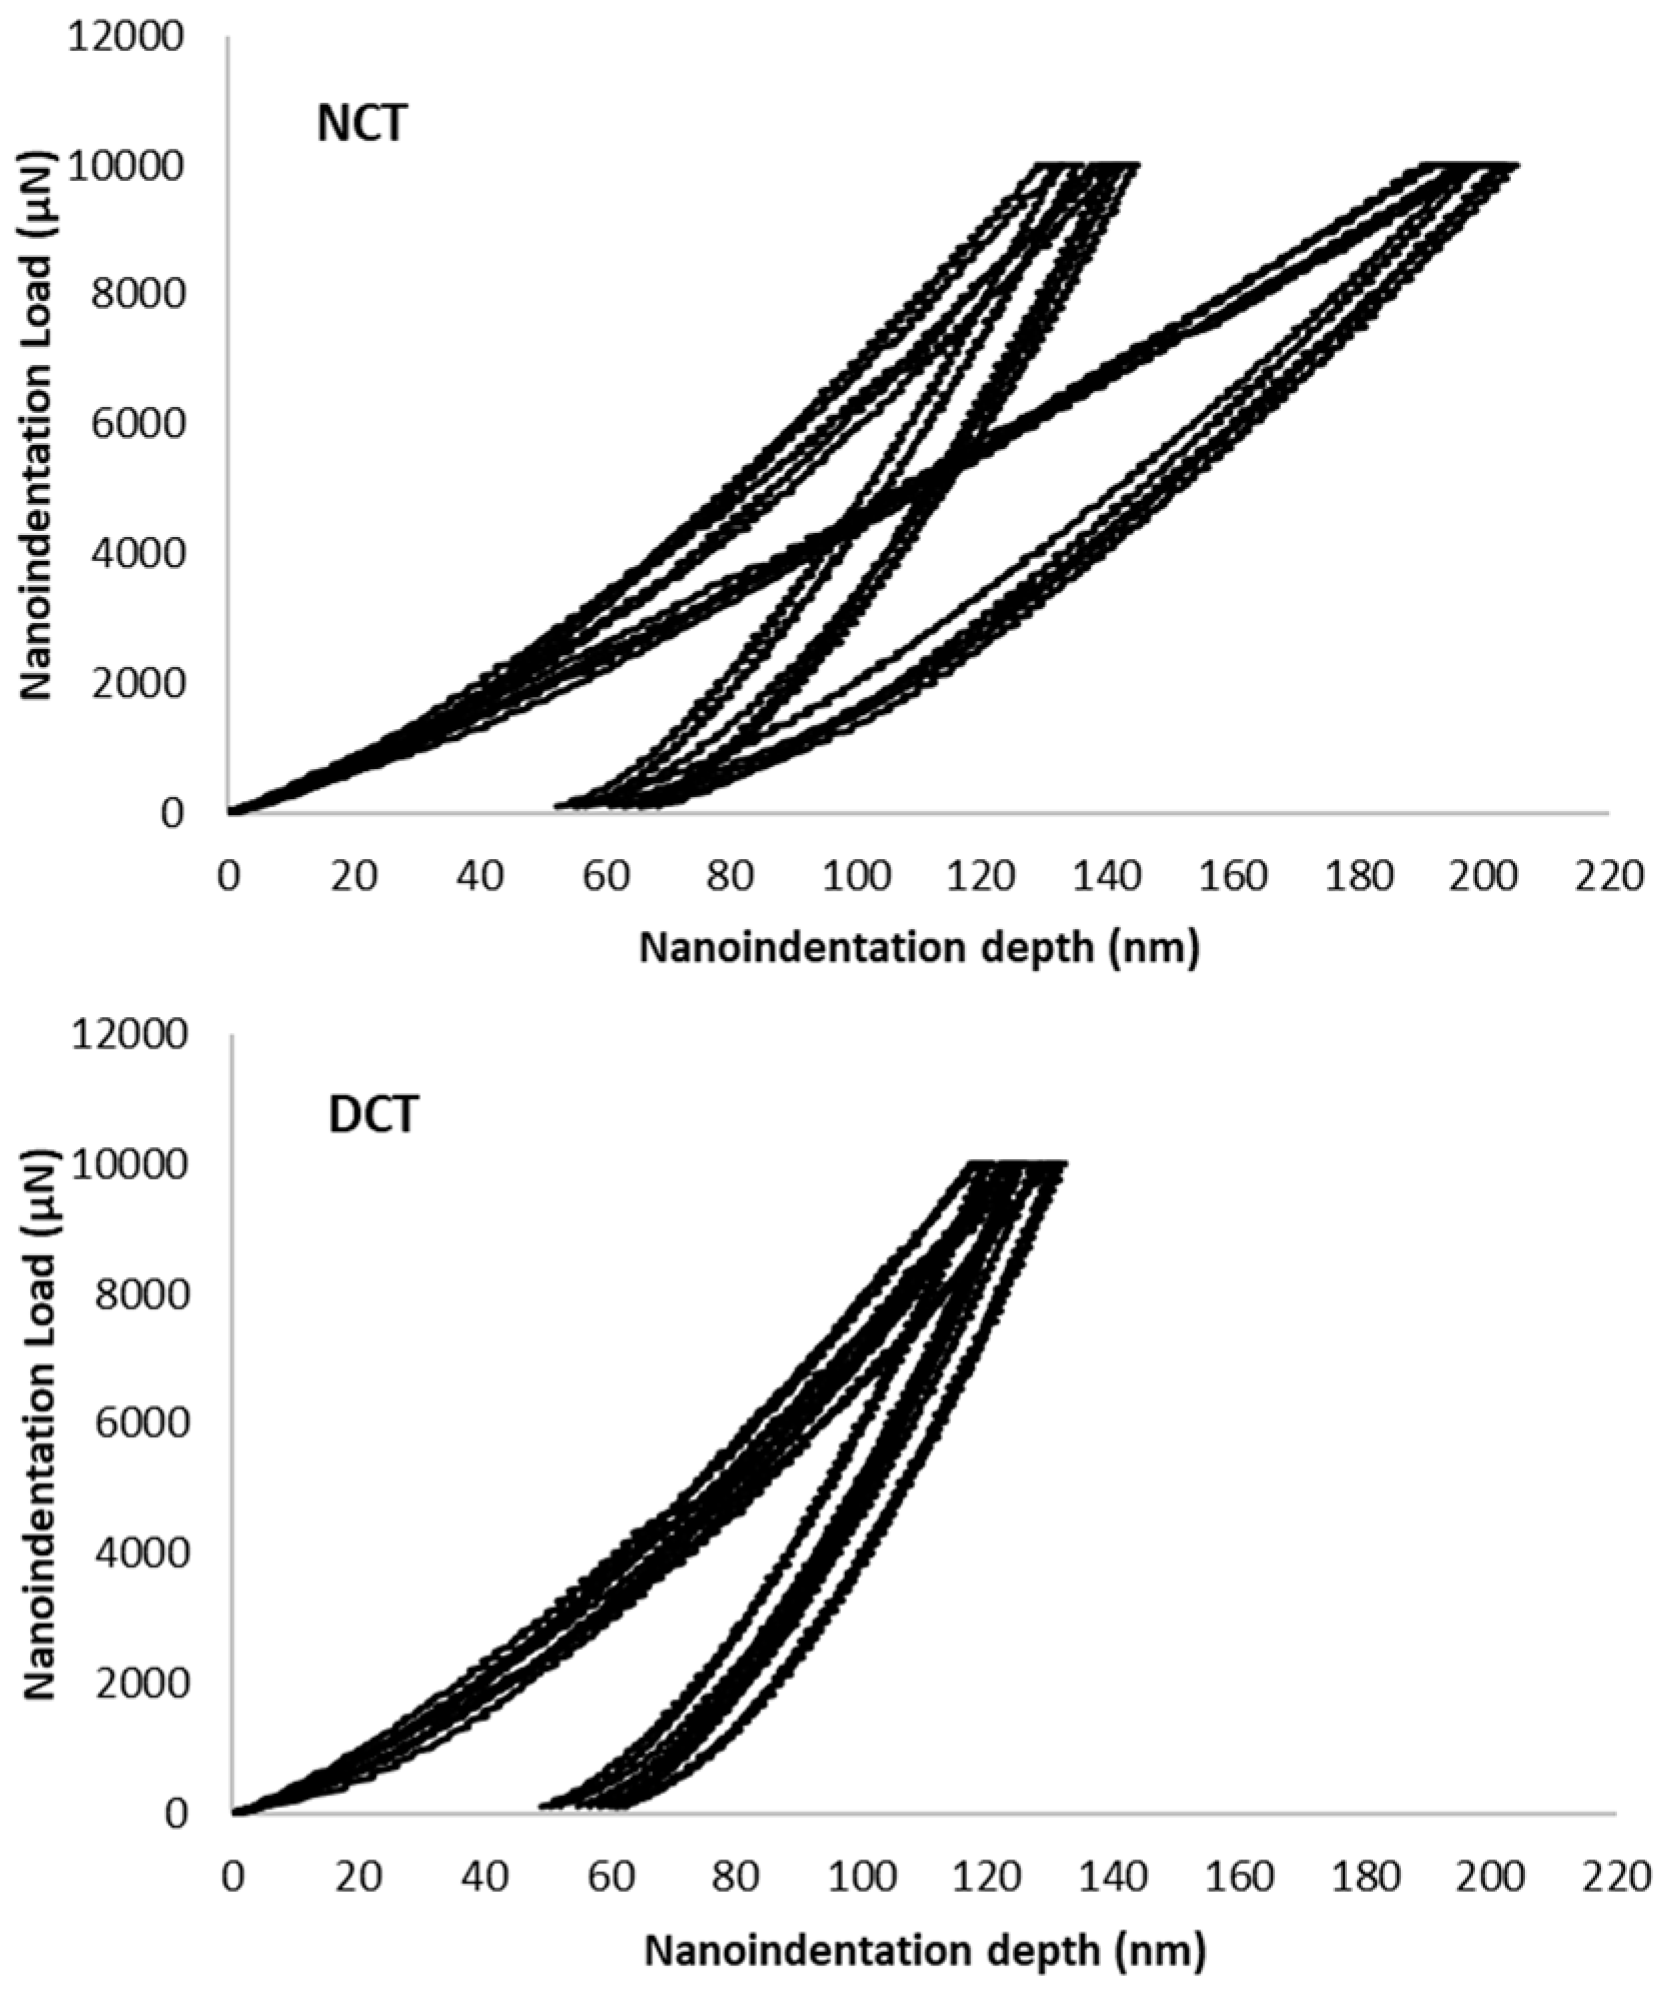
For the nanoindentation of the bulk samples (B), load–displacement curves were established by measuring from a random area around the top surface. The load–displacement curves for NCT and DCT are shown in Figure 9. The results showed a reduction in maximum nanoindentation depth (hmax) higher than 130 nm.
The load–displacement curves of the P samples are shown in Figure 10. The results showed a wide range of hmax, 111 to 215 nm, representing the characteristics of multiple phases along hmax before cryogenic treatment. After deep cryogenic treatment, the results showed a narrower range of hmax, 108 to 138 nm.
The hmax of WC could be influenced by the orientation of carbide grains. The values around 115–130 nm, 95–125 nm, or 125–170 nm as indicated by previous studies on WC-Co systems [24,38,39] could be expected. However, in this work, the nanoindentation impression image, together with the load–displacement data, suggested that the values of hmax over 130 nm represented the phase with the Co binder effect. Maximum nanoindentation depths below 130 nm reflect an indentation area primarily composed of carbide. Conversely, maximum nanoindentation depths greater than 190 nm represent the Co binder majority area, calculated from a nanohardness of 10 GPa, which is associated with cobalt binders in the literature [24]. Equation (1) was used to calculate back to the nanoindentation depth for comparison with other phases. The maximum nanoindentation depth between 130 and 190 nm was expected to represent a mixed-phase effect from nanoindentation covering multiple phases during nanoindentation testing.
H = P m a x A ( h c ) ,
where H is the hardness, Pmax is the maximum indentation load, and A(hc) is the contact area under the assumption of no effect of pile-up or sink-in.
The results for the P samples in Figure 11 suggested a more uniform distribution of the phase after cryogenic treatment and an improvement in the Co binder phase.
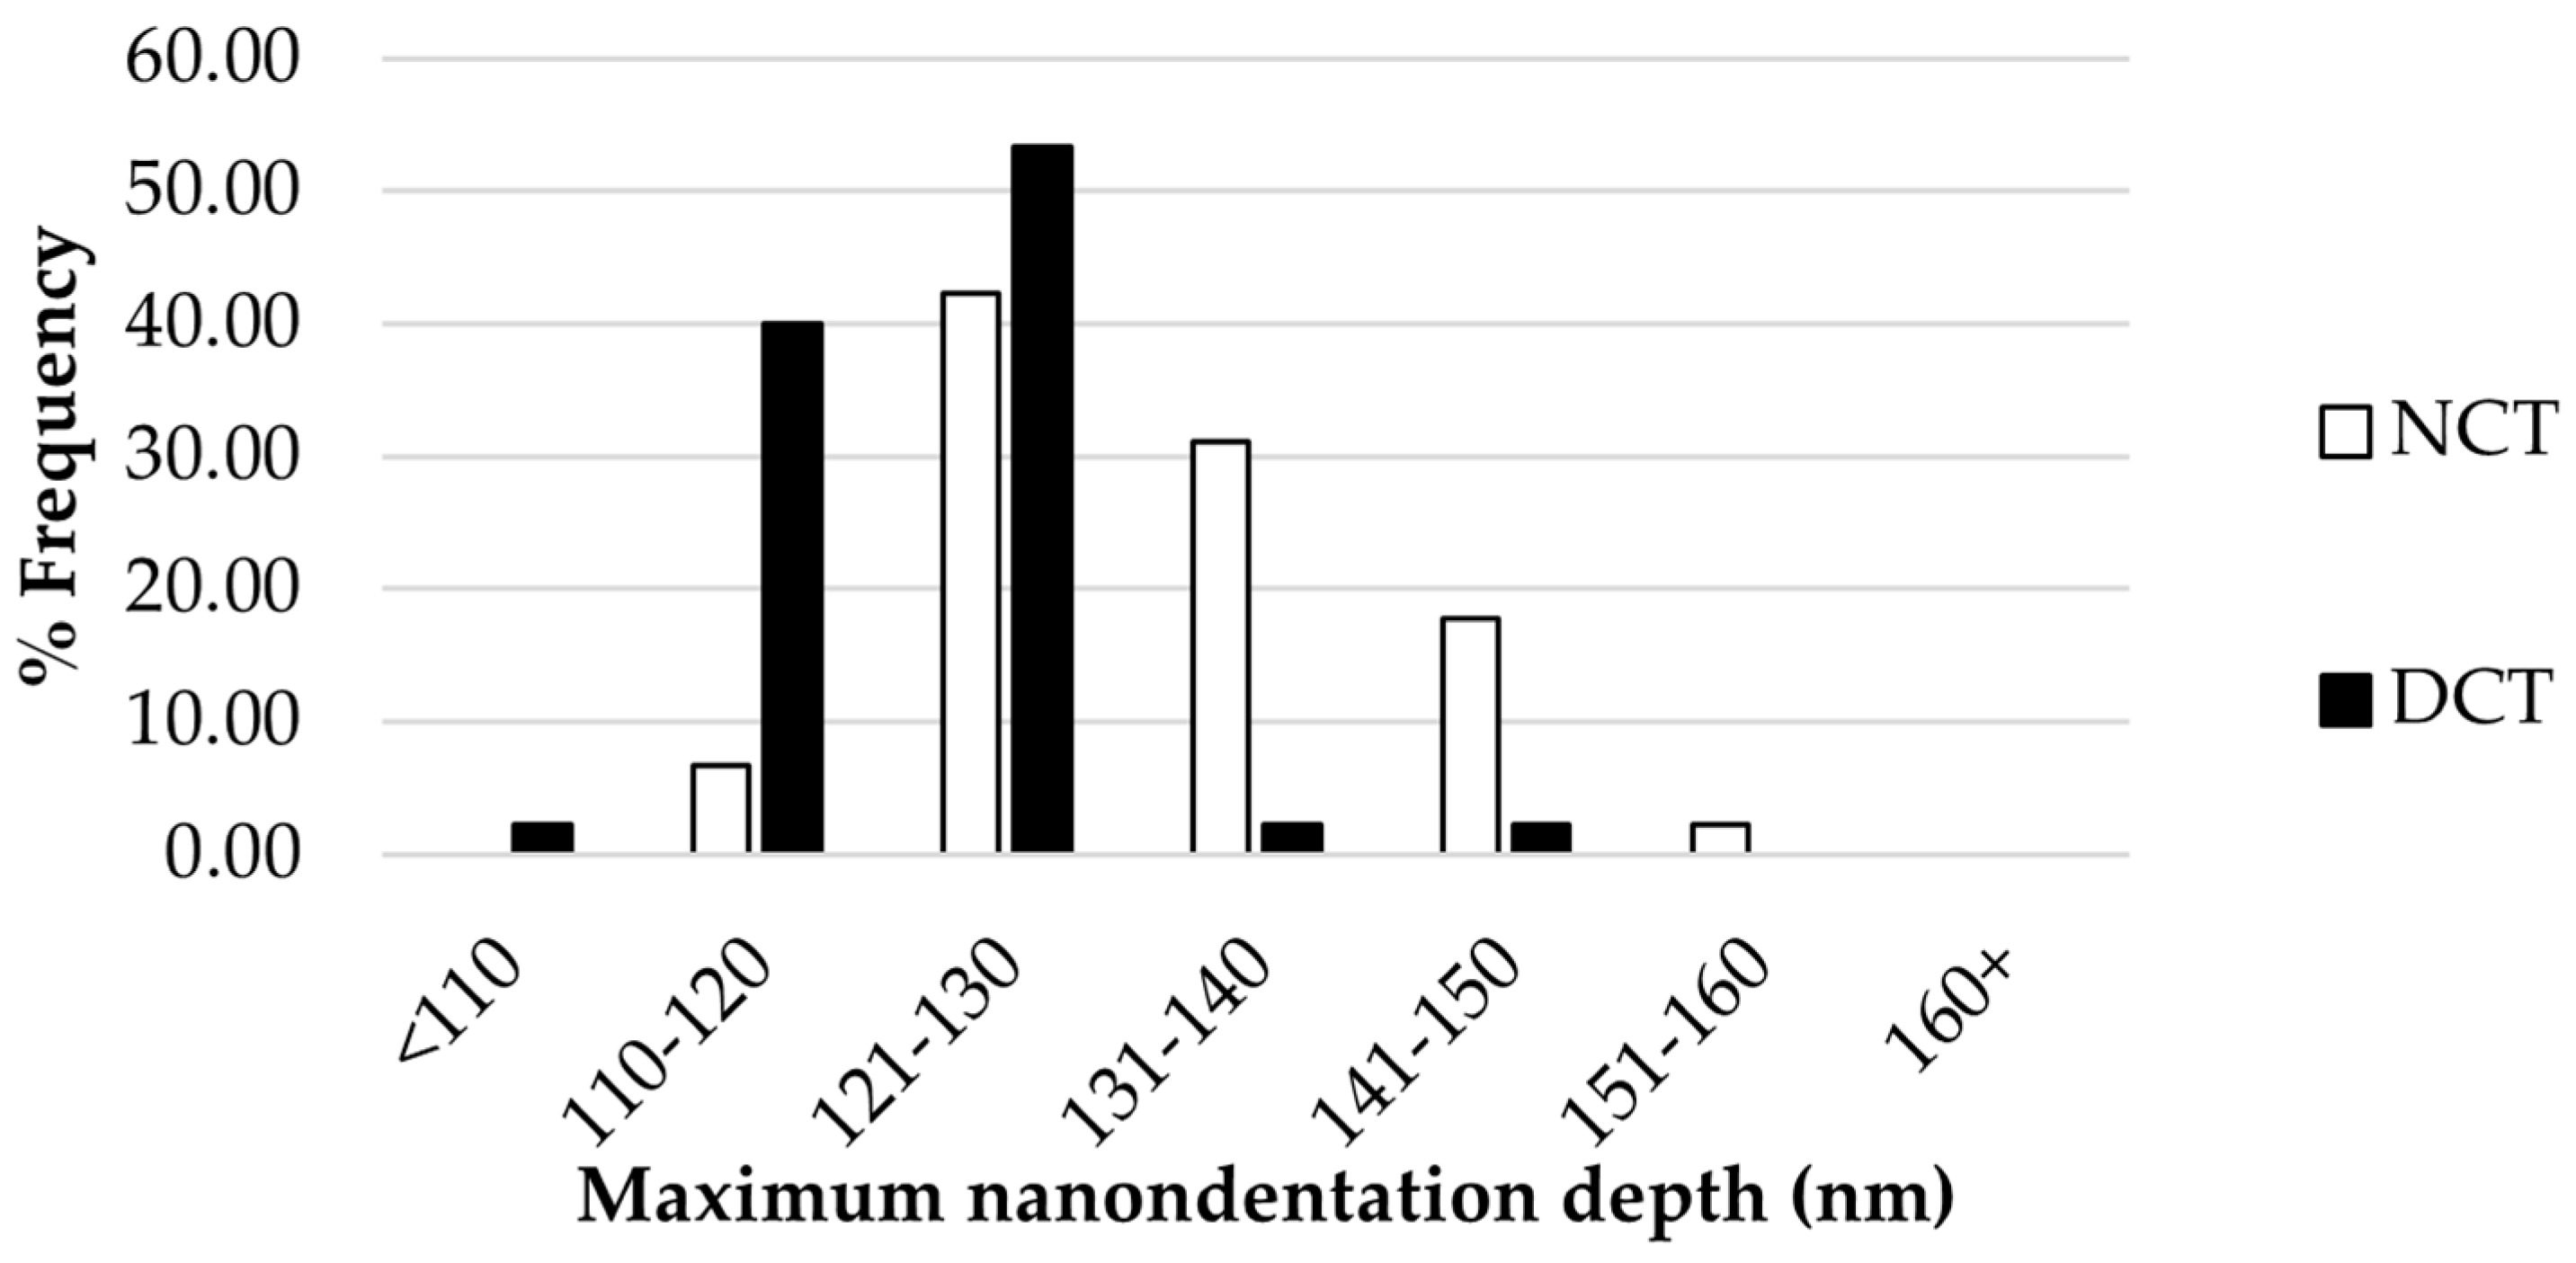
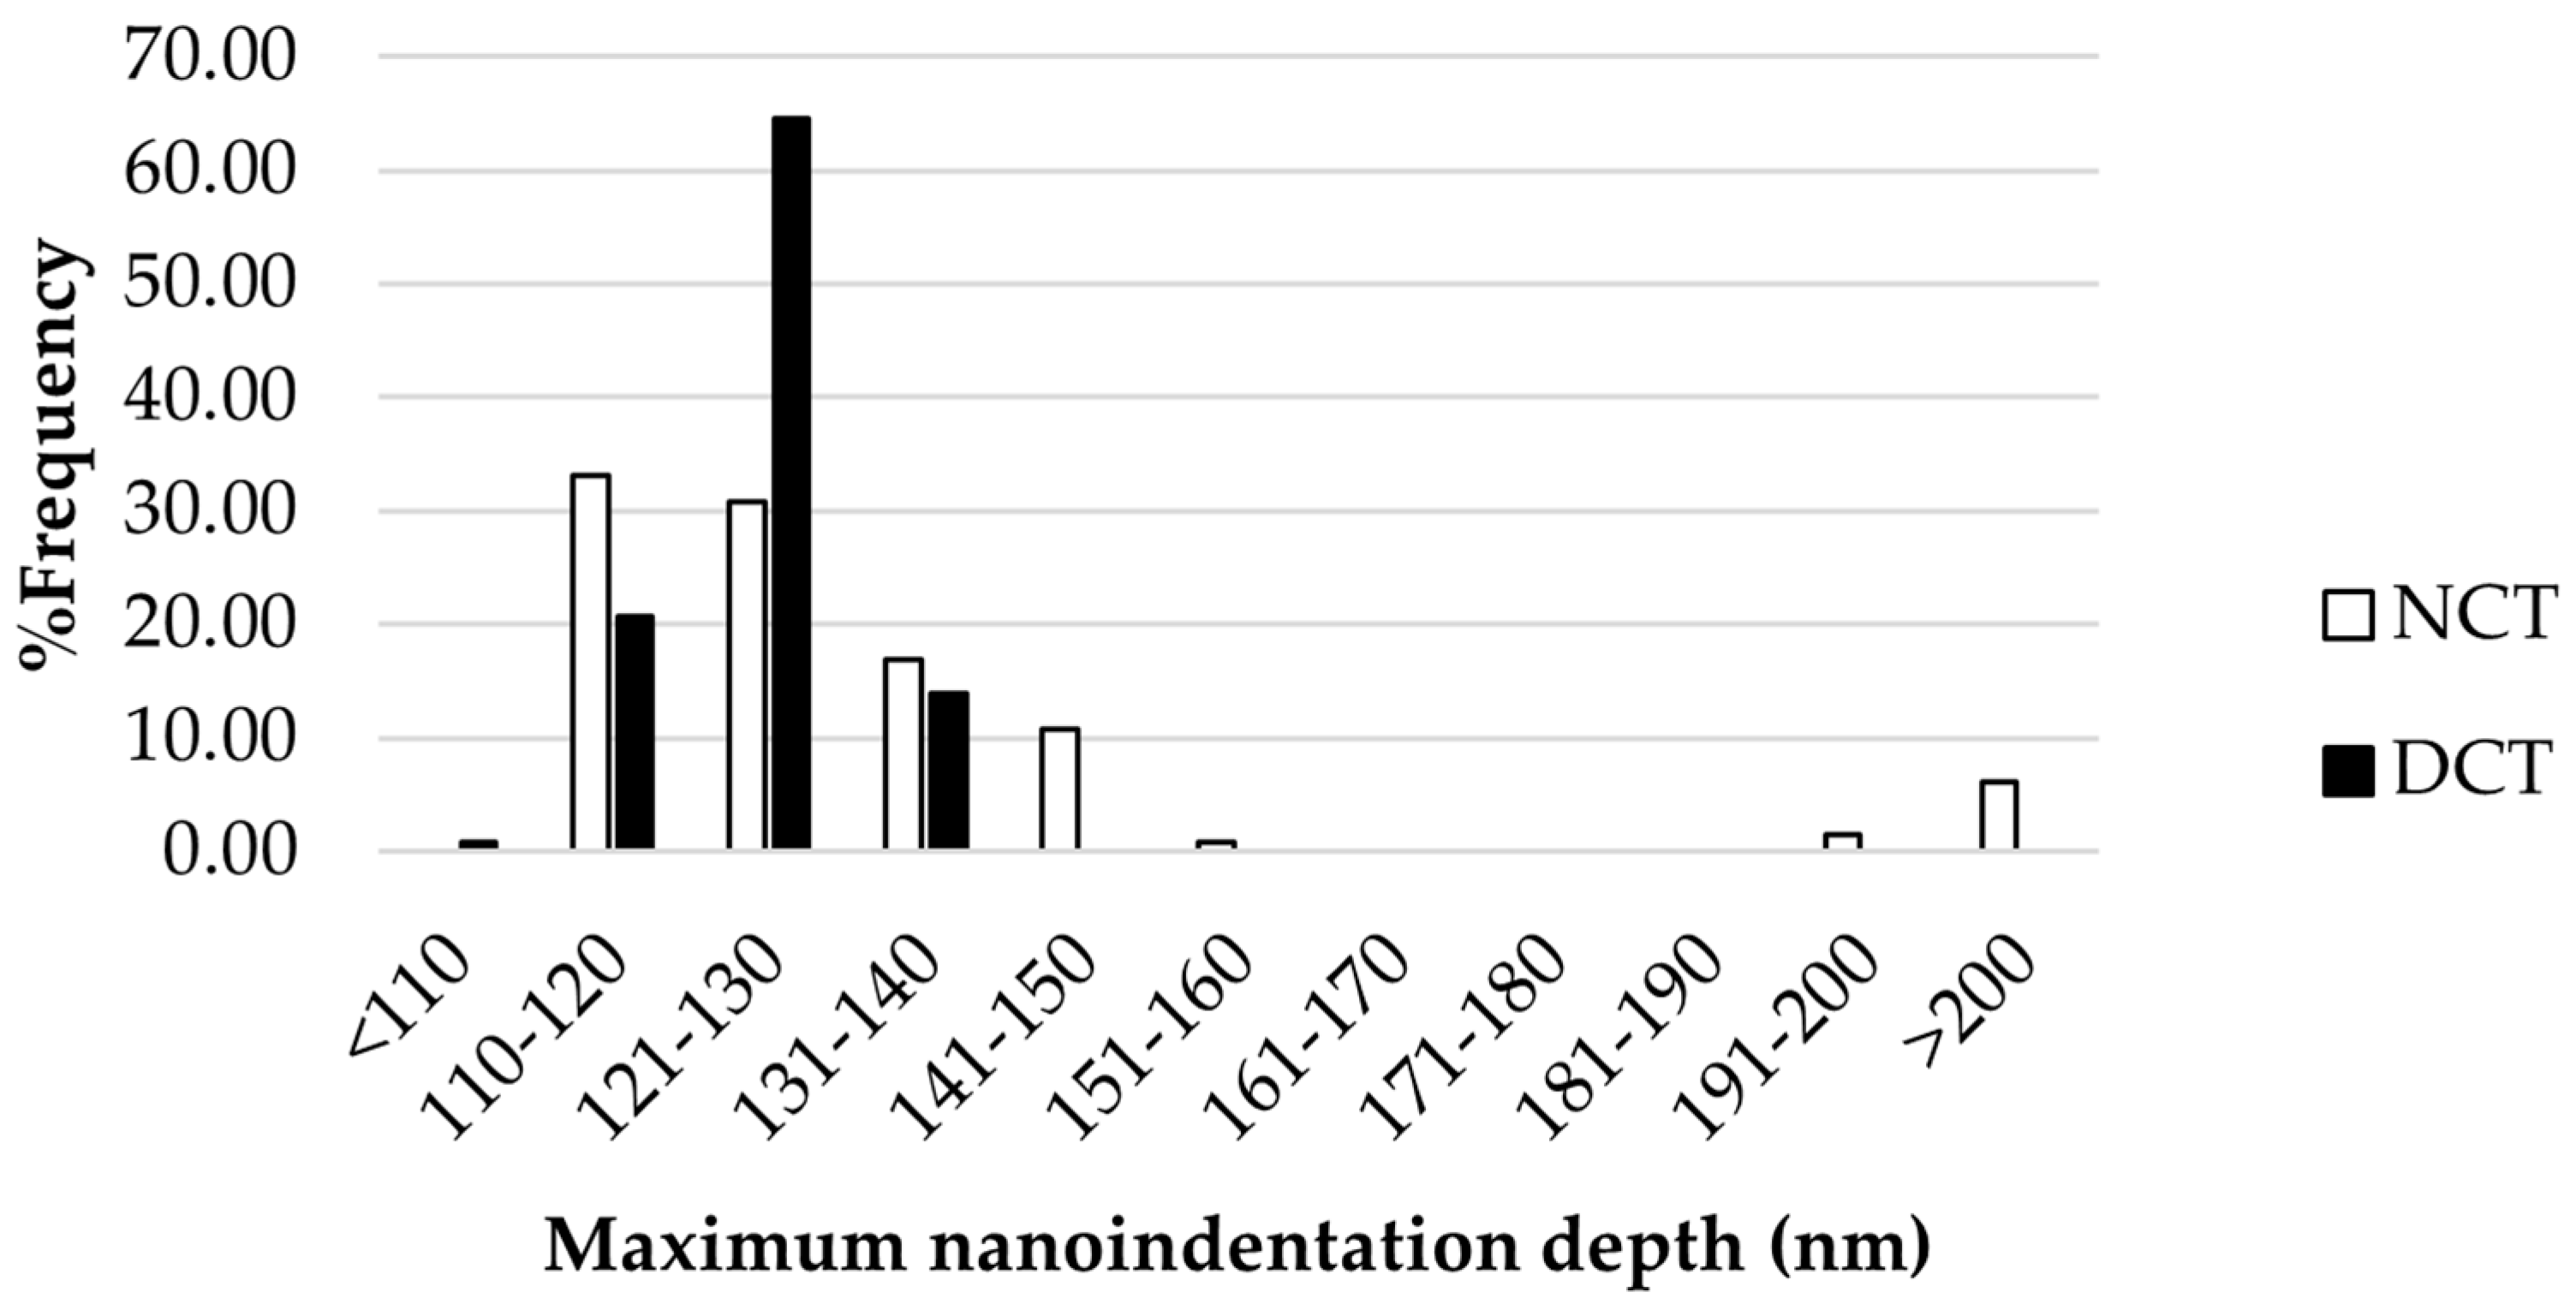
The reduction in maximum nanoindentation depth (hmax) after deep cryogenic treatment is further illustrated in the histogram plot shown in Figure 11 and Figure 12, for the B and P samples, respectively.
The samples showed a significant reduction in hmax for the region with binder majority (high indentation depth) and mixed phase (intermediate range of indentation depth). The plot indicates a significant reduction in the %frequency of hmax with values exceeding 130 nm following the treatment. Notably, hmax greater than 190 nm was not observed. The majority of the nanoindentation depth results clustered around 110–130 nm. This reduction could represent enhancing hardness and wear resistance decreasing the likelihood of binder failure.
A comparison between the hmax histogram plots of the B samples and P samples (Figure 11 and Figure 12) showed the same trend; the %frequency of the mixed-phase area that exhibited a maximum indentation depth of more than 130 nm was decreased, while that with a maximum indentation depth of less than 130 nm was increased.
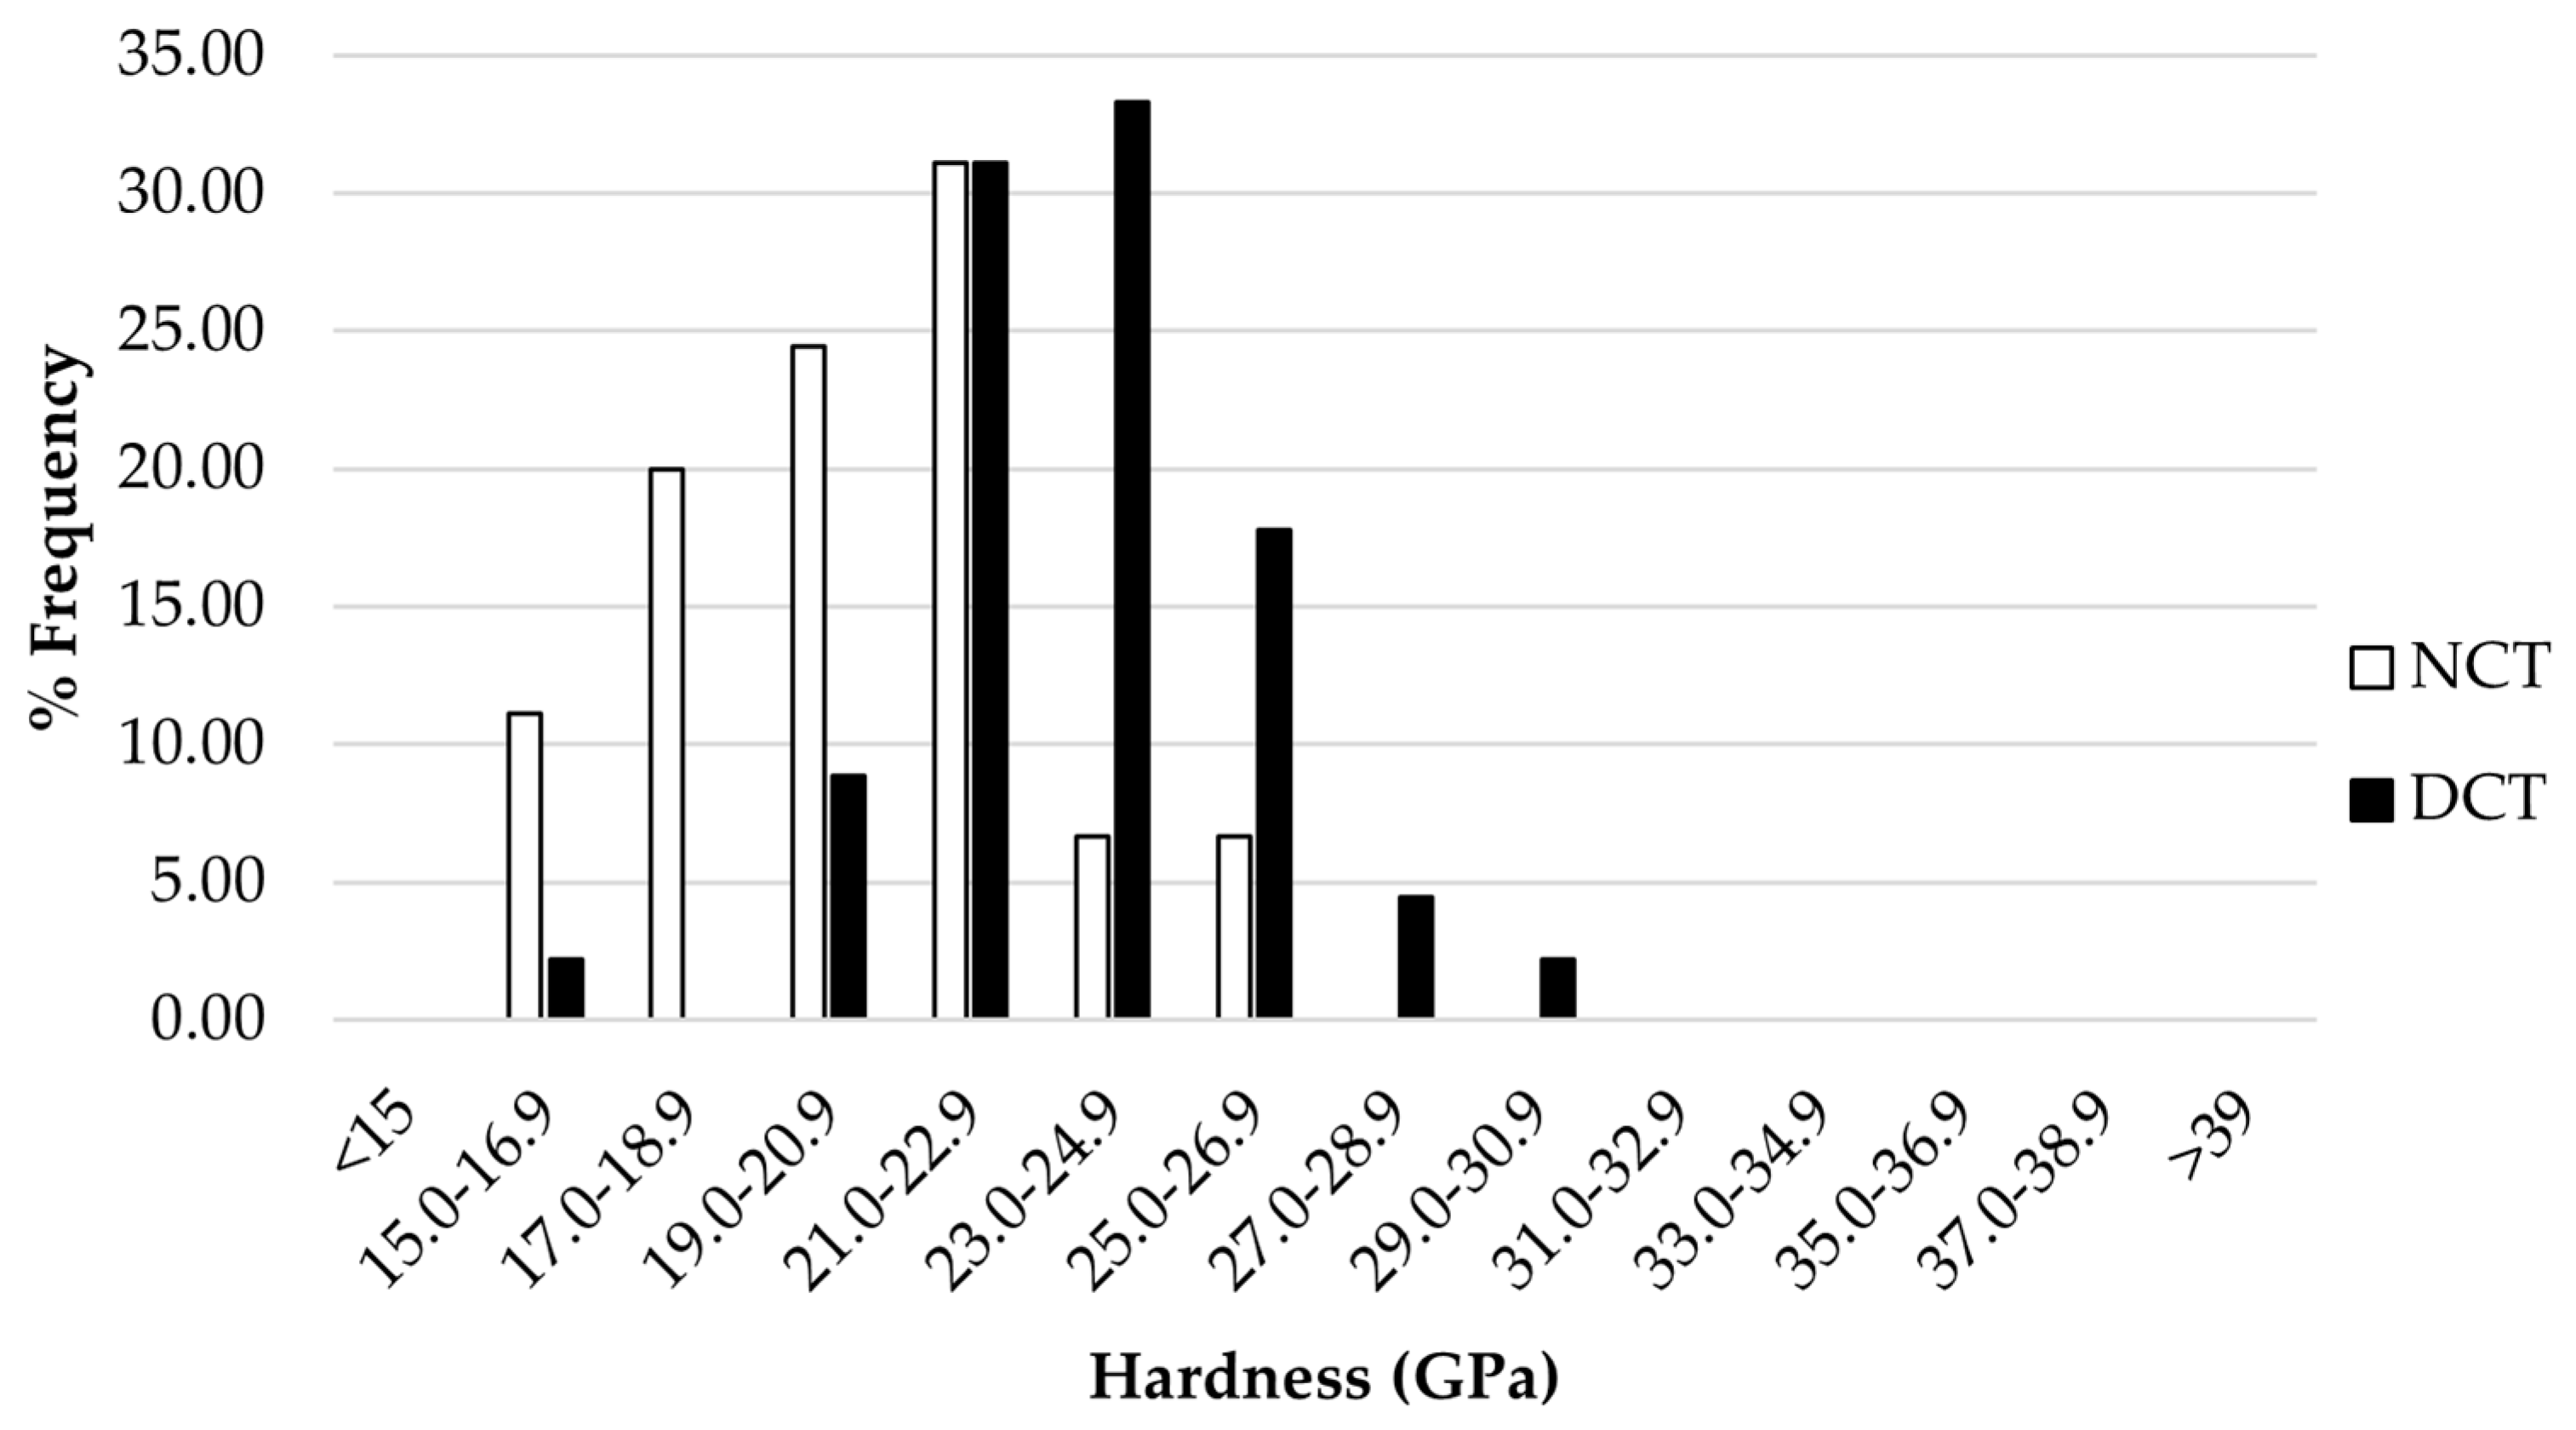
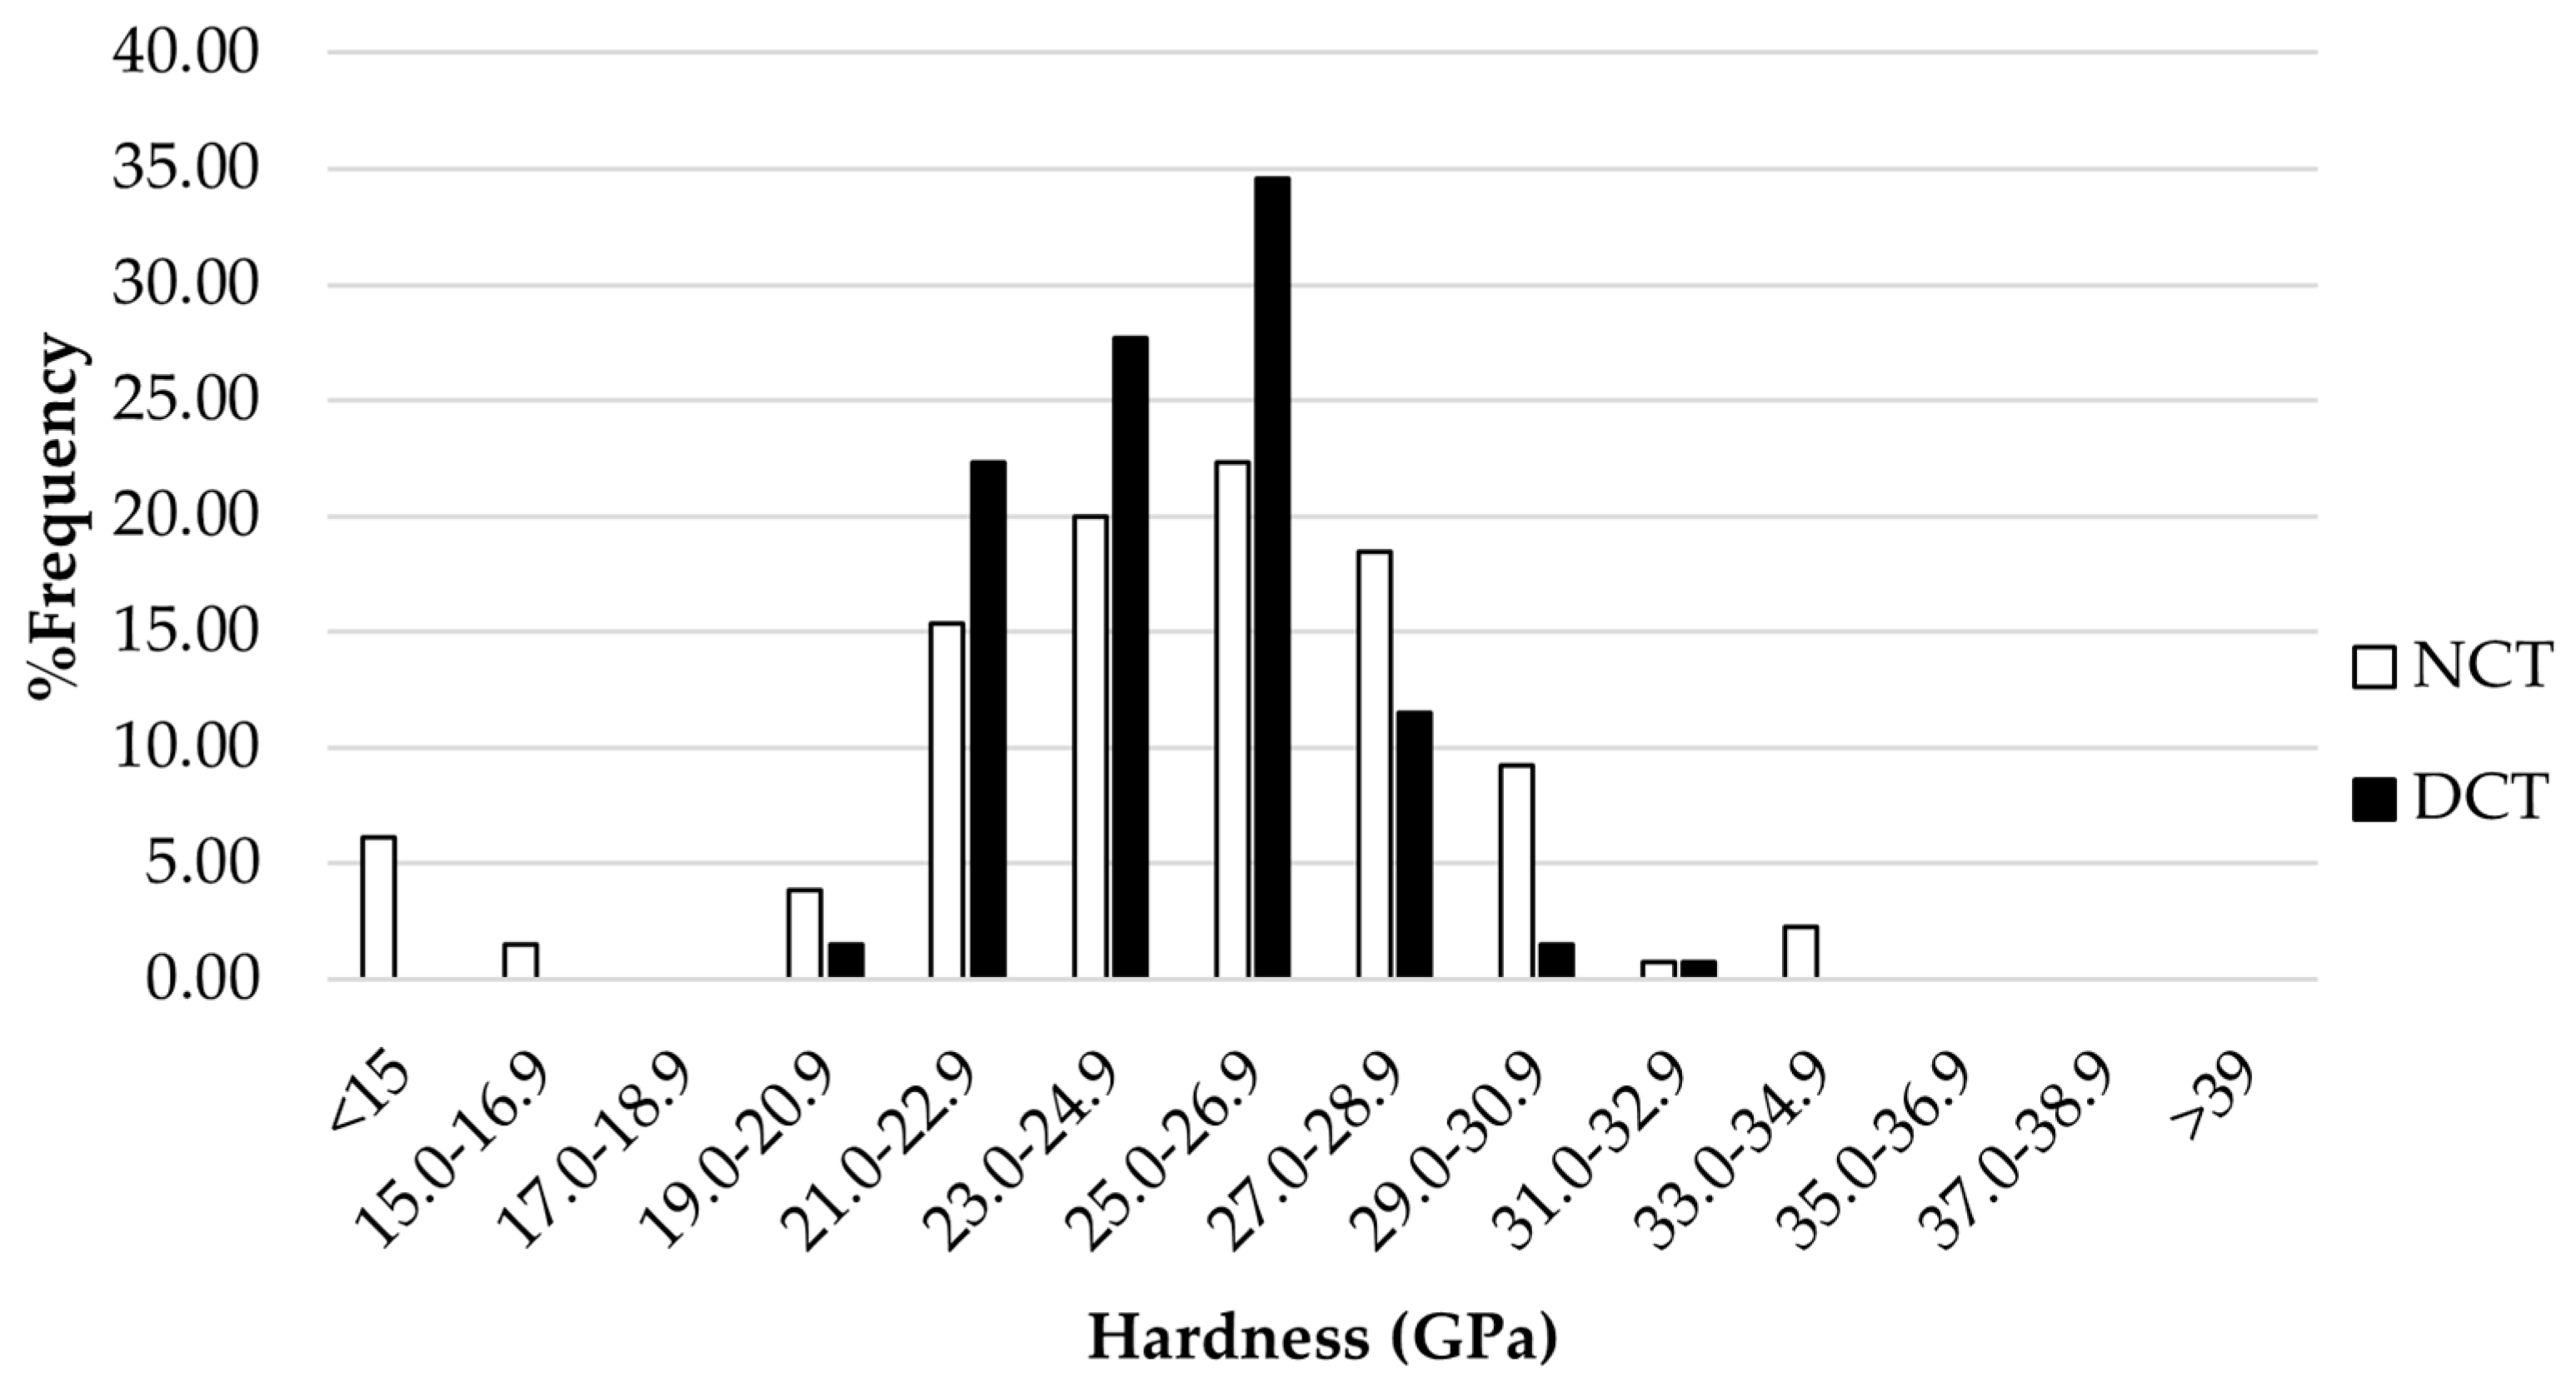
Nanohardness histogram plots for the B and P samples are shown in Figure 13 and Figure 14, respectively. The %frequency of nanohardness less than 21 GPa significantly decreased after deep cryogenic treatment. The reduction in %frequency at a nanohardness less than 21 GPa was related to an improvement in the binder and led to higher nanohardness.
A comparison using results from Figure 13 and Figure 14 indicates that the results for the P and B samples showed the same trend of %frequency reductions after deep cryogenic treatment at a hardness lower than 21 GPa and an increases in the %frequency of hardness between 21 and 27 GPa. However, hardness higher than 27 GPa led to contradictory results between the P and B samples; the B samples showed increases in %frequency while the P samples showed decreases in %frequency after deep cryogenic treatment.
The difference in the distribution of the nanohardness results between the two sample types may have been influenced by the lower Co content in the P samples compared to the B samples, which promotes more phase transformation of α-Co to ε-Co, resulting in higher hardness [31].
The mean values and standard deviations for the nanoindentation depth and nanohardness are presented in Table 2 and Table 3. The results indicate that the B samples exhibited a mean nanohardness approximately 14% higher with cryogenic treatment, while the P samples showed minimal variation in mean nanohardness (less than a 0.3% difference) after treatment.
Afterward, the P samples were classified into two groups—those with hmax less than 130 nm and those with that between 130 and 190 nm—to clarify the effect of cryogenic treatment. This classification was based on the mean hmax of each sample before cryogenic treatment. The results are presented in Table 4.
As shown in Table 4, samples with an initial hmax less than 130 nm exhibited no significant changes in nanohardness or hmax after treatment. In contrast, samples with an initial hmax greater than 130 nm demonstrated a more substantial reduction in hmax and an improvement in nanohardness compared to the lower hmax group.
The group of test data with hmax < 130 nm, expected to represent the WC-majority phase in the material, exhibits an almost unchanged load–displacement response. In contrast, the test data representing the phase with a high Co binder effect, referred to as the Co-majority phase, shows a significant change after treatment. A clear reduction in hmax is observed for the Co-majority phase, implying that the soft phase, which contains more binder, was improved due to cryogenic treatment. Meanwhile, the process had an insignificant effect on the carbide-majority phase, consistent with findings from other studies [31].
These findings suggest that the evaluation of nanohardness through nanoindentation testing should encompass more than just the mean nanohardness, as shown in the histogram plot in Figure 13 and results after classification in Table 4. A thorough analysis of the nanoindentation depth and nanohardness in this pattern can lead to a more comprehensive understanding of the material’s properties and failure behavior at the nanoscale during nanoindentation testing.

3.2.2. Microindentation Test Results

Microindentation testing was performed exclusively on bulk sample B. The microhardness of the B samples before and after cryogenic treatment was examined to compare the hardness of samples subjected to deep cryogenic treatment (DCT) with those not treated (NCT). The results indicated that the samples subjected to deep cryogenic treatment exhibited an approximately 4.5% improvement in hardness. The microhardness values were converted to gigapascals (GPa) and are presented in Table 4. After that, the microhardness results were compared with the hardness results obtained from nanoindentation testing.
The microhardness results in Table 5 show a lower percentage of the standard deviation of hardness compared to the hardness determined from nanoindentation, as shown for NCT and DCT B samples in Table 3. The higher standard deviation observed in nanohardness testing can be attributed to the indentation size effect and load distribution during nanoindentation. In microindentation, the load is distributed across multiple phases, leading to a reduced indentation size effect compared to the nanoindentation results. Variations in hardness may arise due to the contrast between the high hardness of the WC phase and the low hardness of the Co binder phase.
Microhardness testing revealed that the B samples exhibited lower hardness compared to the results from nanoindentation testing, as indicated in Table 3. The higher mean hardness observed in the nanoindentation results is attributed to the size effect of the testing method [40]. However, the improved microhardness is not significant. This result indicated that nanoindentation testing should be continued.
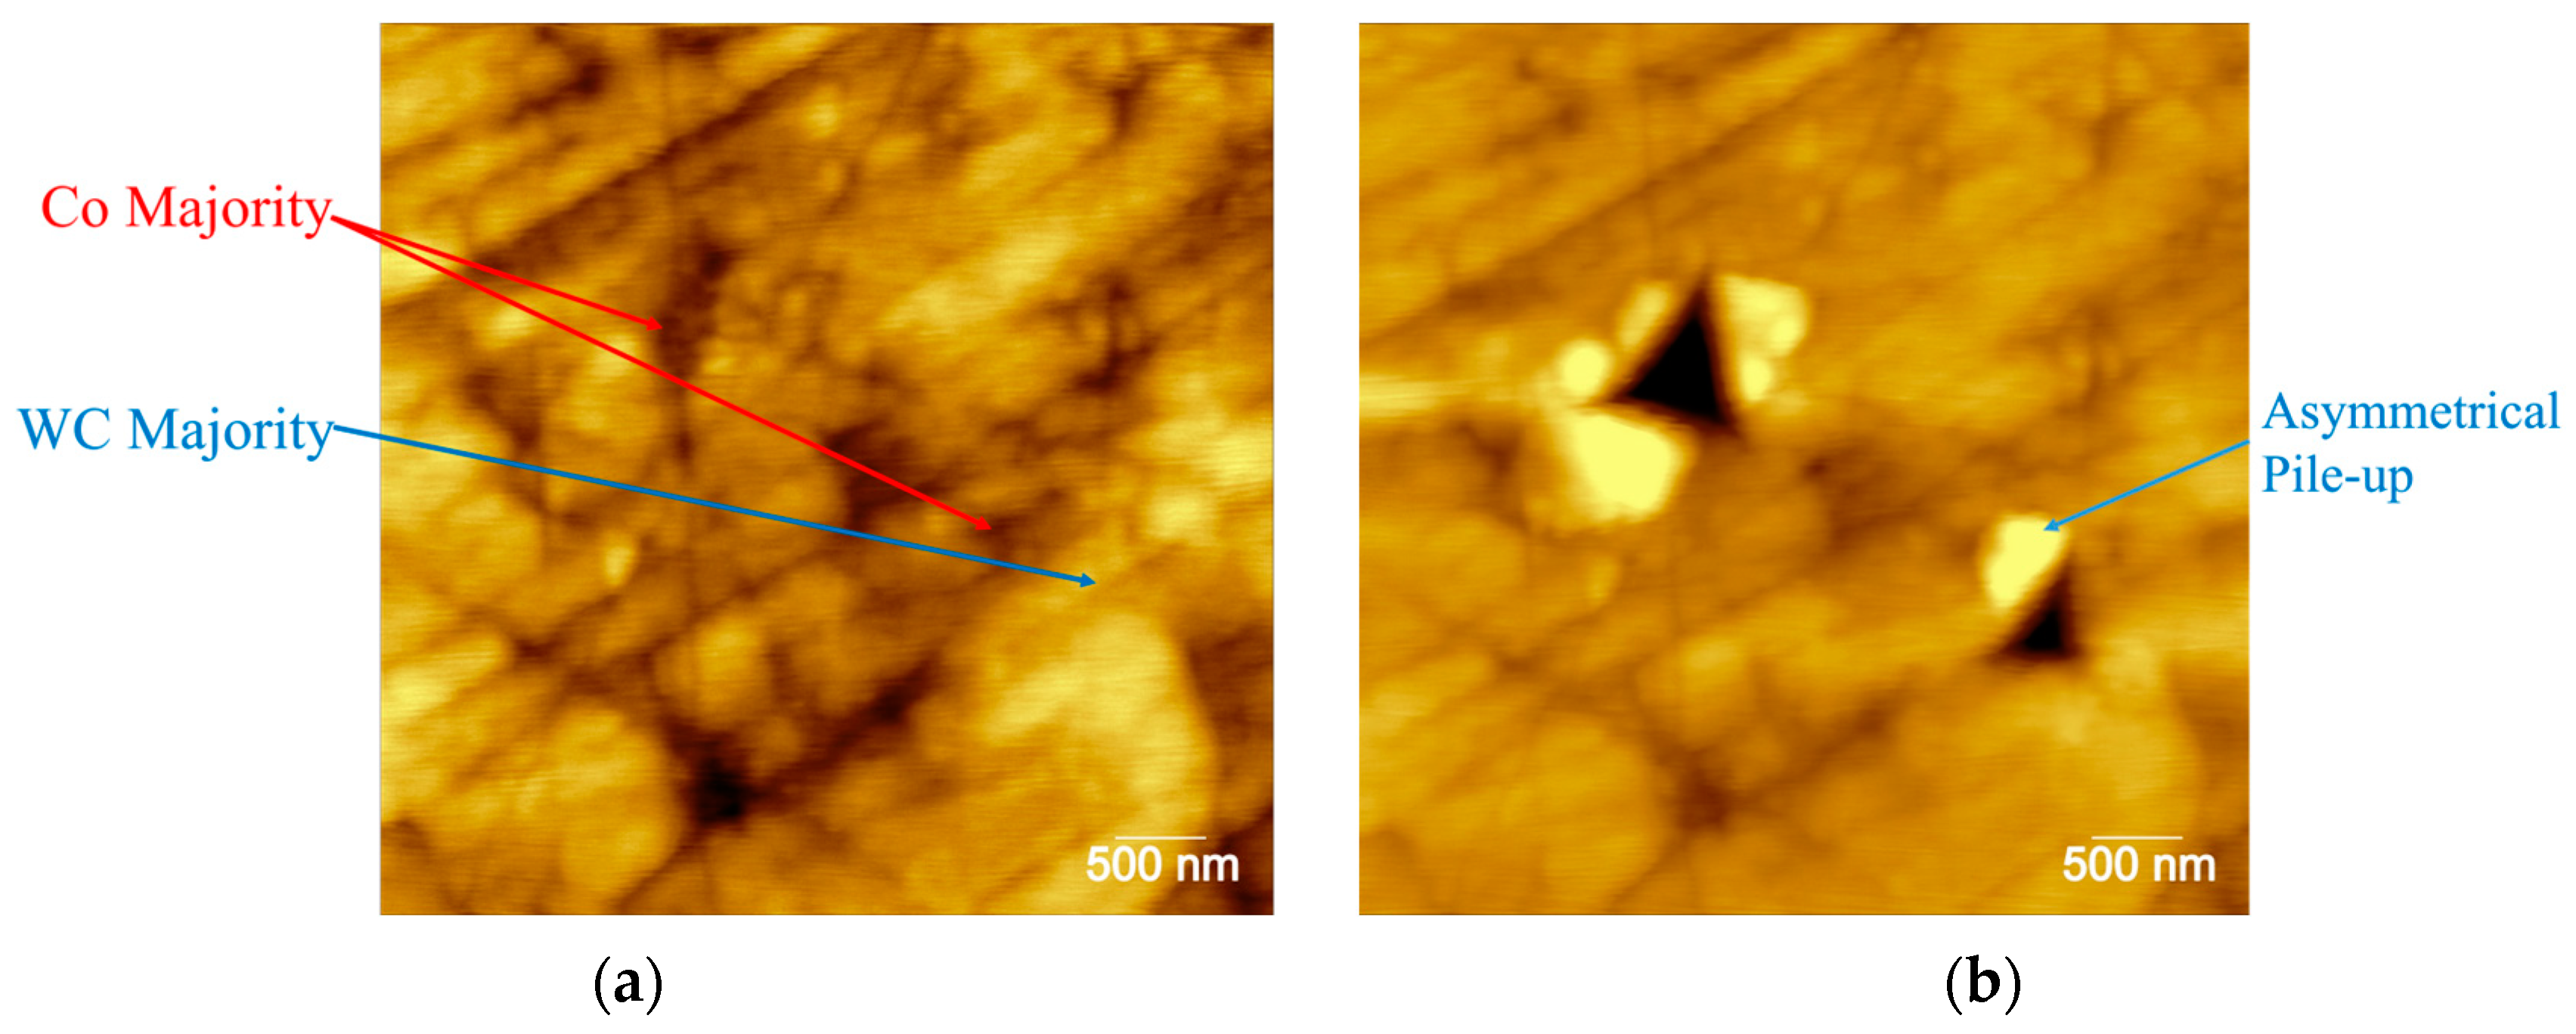
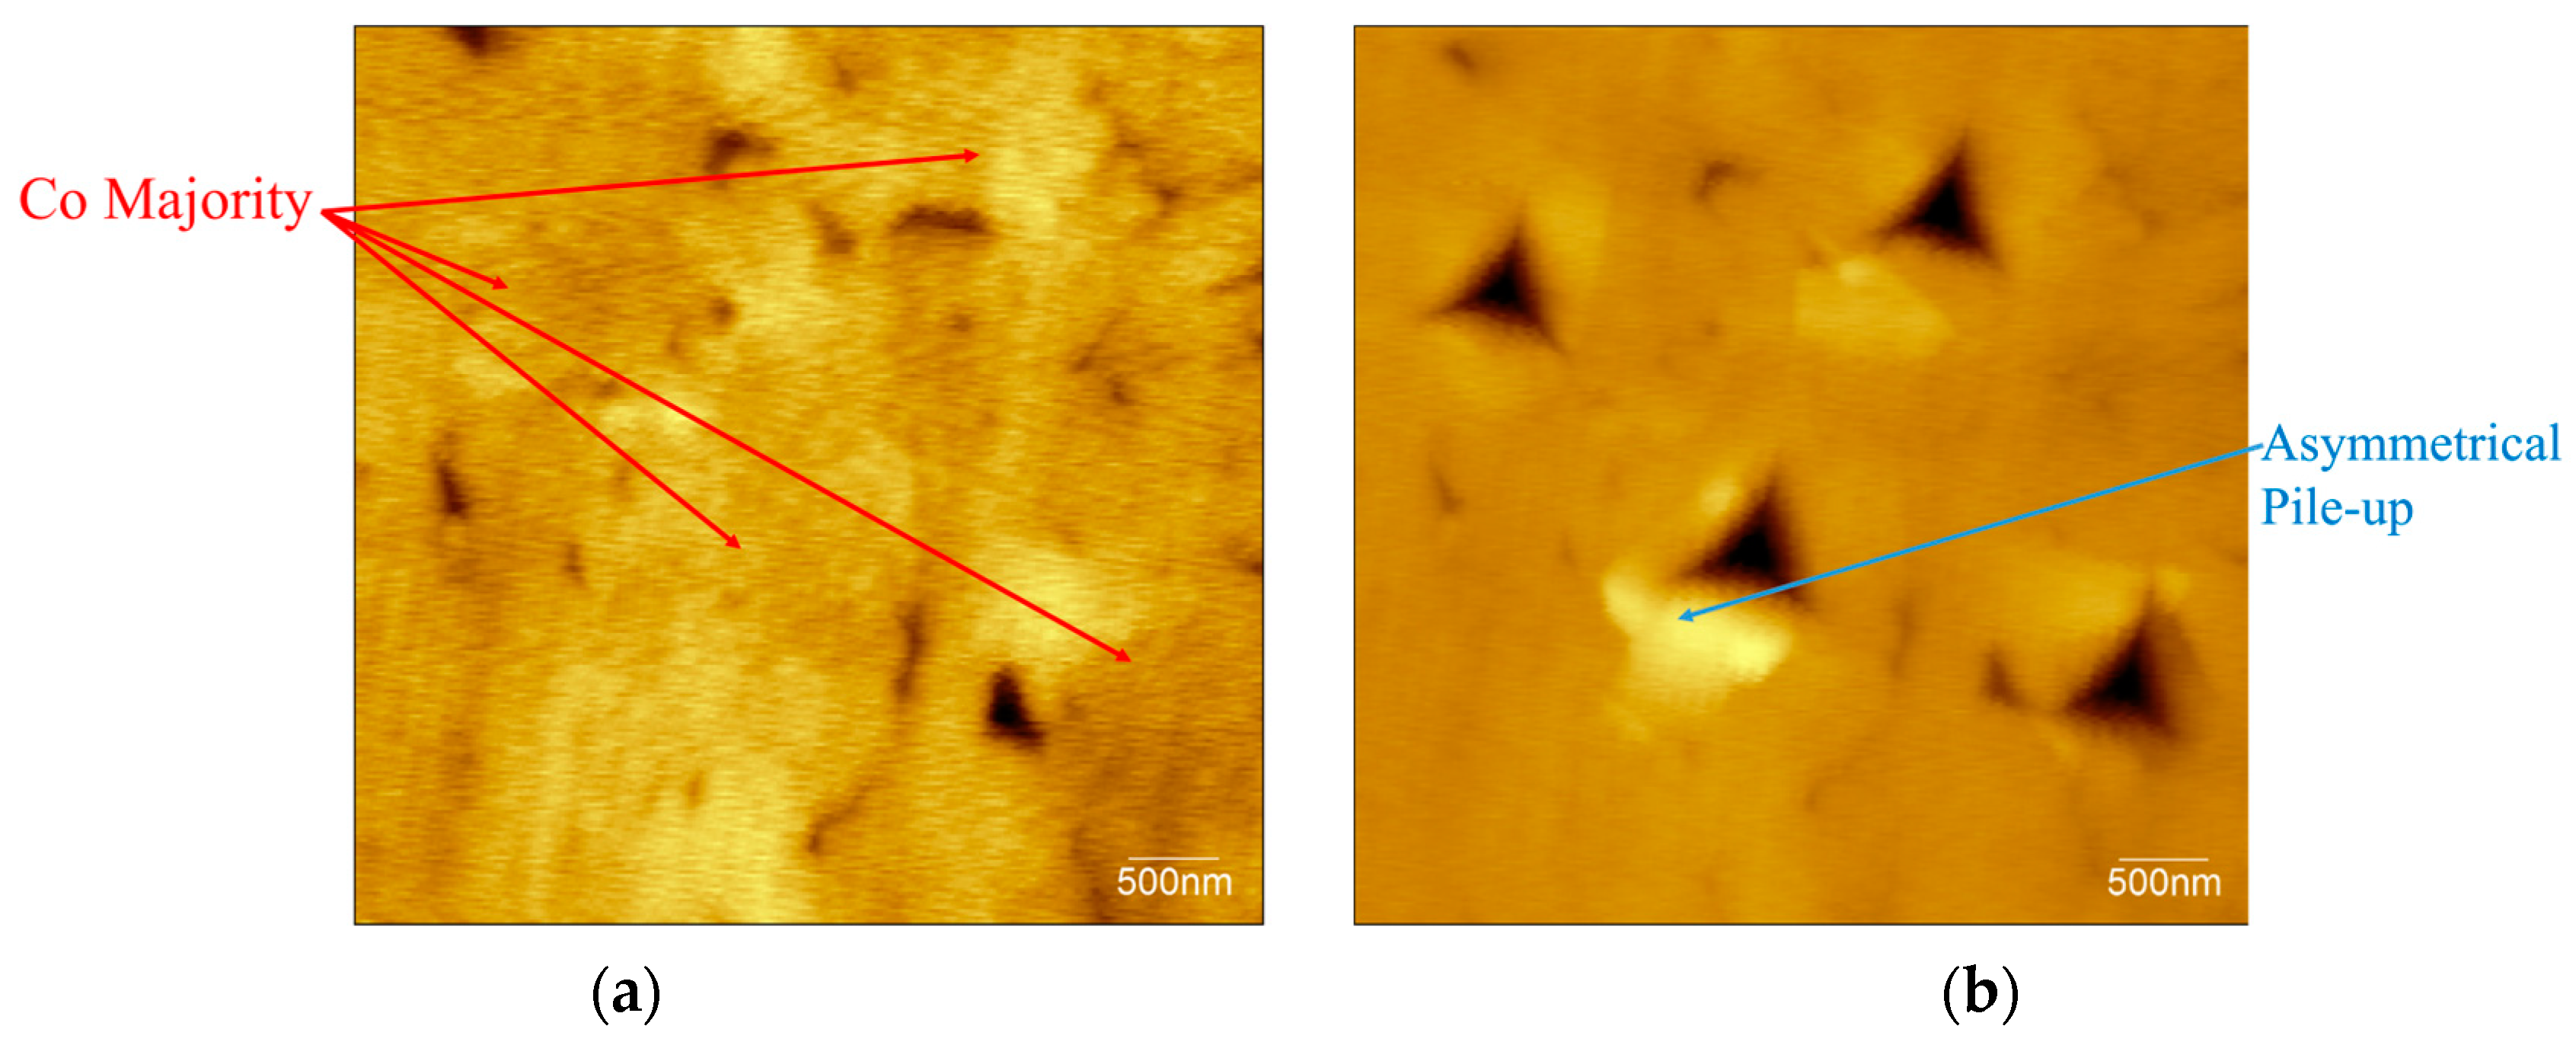
The findings indicate that both the size effect and testing scale significantly influence the outcomes of microhardness and nanohardness measurements. To illustrate the differences in the testing areas between micro- and nanoindentation tests, AFM testing was performed with a nanomechanical tester using a Berkovich indenter to represent the topography at the indentation location as shown in Figure 15 and Figure 16. Figure 15 represents the indentation on the area containing Co with hmax of 135 and 140 nm from a B sample before cryogenic treatment. Figure 16 shows the indentation on the carbide-majority phase from a B sample after cryogenic treatment. The maximum indentation depths (hmax) for three out of the four indentations fell between 120 and 125 nm, while the highest hmax among the four indentations was 135 nm. This particular indentation exhibited an asymmetrical pile-up, which may have been influenced by the nearby soft phase, such as the Co binder phase.
The indentation area that covered a larger portion of the binder resulted in lower hardness, whereas the area that covered a significant portion of the WC grains exhibited notably higher hardness. The most common WC-Co failure in machining and soldering applications is abrasion or erosion, which involves small particles that can directly attack the binder and ultimately lead to the failure of the surrounding phases, including the WC grains. Hence, the testing scale and data interpretation technique should be selected based on the failure mode and area of interest.

4. Conclusions

This work emphasizes the significance of appropriate testing methods and methodologies in accurately interpreting material behavior, which could lead to an accurate understanding of material failure, especially local failure for multiphase materials.
Nanoindentation can be used to investigate the effect of deep cryogenic treatment through multiple testing iterations, with the results plotted as the frequency distribution of the maximum nanoindentation depth or hardness. These findings suggest that the nanoindentation testing of WC-Co materials enables a detailed examination of local areas, leading to a better understanding of a material’s behavior under load, including the carbide-majority phase, binder-majority phase, and mixed-phase regions.
The research outcomes could be beneficial for practical applications, such as quality control processes. The nanoindentation technique provides valuable insights into load–displacement behavior, which can be directly applied to failure analysis and life prediction in the design process. Additionally, it minimizes the need for extensive microstructural analysis and micrography measurements, offering economic benefits such as cost and time savings while reducing the potential for human error.

Author Contributions

Conceptualization, S.P. and K.T.; methodology, S.P. and K.W.; validation, K.W.; investigation, S.P.; formal analysis, S.P.; writing—original draft preparation, S.P.; writing—review and editing, K.T.; project administration, S.P.; supervision, K.T.; visualization, S.P. All authors have read and agreed to the published version of the manuscript.

Funding

This work received funding supported by NSRF via the Program Management Unit for Human Resources and Institutional Development, Research and Innovation (PMU-B) [B13F660125].

Data Availability Statement

The original contributions presented in this study are included in the article. Further inquiries can be directed to the corresponding author.

Acknowledgments

Special thanks go to Nichidai (Thailand). Co., Ltd. for equipment support. Appreciation is also given to the Studies for Society Science and Technology Foundation (STF) for providing laboratory support.

Conflicts of Interest

The authors declare no conflicts of interest.

References

  1. Katiyar, P.K.; Singh, P.; Singh, R.; Kumar, A. Modes of failure of cemented tungsten carbide tool bits (WC/Co): A study of wear parts. Int. J. Refract. Met. Hard Mater. 2016, 54, 27–38. [Google Scholar] [CrossRef]
  2. Tang, J.Y.; Luo, L.M.; Liu, Z.; Zan, X.; Wu, Y.C. Shape Retention of Cemented Carbide Prepared by Co Melt Infiltration into Un-Sintered WC Green Parts Made via BJ3DP. Int. J. Refract. Met. Hard Mater. 2022, 107, 105904. [Google Scholar] [CrossRef]
  3. Yildiz, A.B.; Babu, R.P.; Bonvalet-Rolland, M.; Busch, S.; Ryukhtin, V.; Weidow, J.; Norgren, S.; Hedström, P. Quantification of Nano-Scale Interface Structures to Guide Mechanistic Modelling of WC Grain Coarsening Inhibition in V-Doped Hard Metals. Mater. Des. 2021, 207, 109825. [Google Scholar] [CrossRef]
  4. Stein, S.; Heberle, J.; Gürtler, F.J.; Cvecek, K.; Roth, S.; Schmidt, M. Influences of Nozzle Material on Laser Droplet Brazing Joints with Cu89Sn11 Preforms. Phys. Procedia 2014, 56, 709–719. [Google Scholar] [CrossRef]
  5. Huang, X.; Jiang, F.; Wang, Z.; Wu, X.; Huang, S.; Liu, Y.; Zhang, J.; Shi, X. A Review on the Balancing Design of Micro Drills. Int. J. Adv. Manuf. Technol. 2023, 126, 4849–4871. [Google Scholar] [CrossRef] [PubMed]
  6. Yang, Y.; Zhang, C.; Wang, D.; Zhang, H. Additive Manufacturing of WC-Co Hardmetals: A Review. Int. J. Adv. Manuf. Technol. 2020, 108, 1653–1673. [Google Scholar] [CrossRef]
  7. Sarin, V.K. Cemented carbide cutting tools. In Advances in Powder Technology; Chin, D.Y., Ed.; ASM: Almere, The Netherlands, 1981; pp. 253–287. [Google Scholar]
  8. Oksa, M.; Turunen, E.; Suhonen, T.; Varis, T.; Hannula, S.-P. Optimization and characterization of high velocity oxy-fuel sprayed coatings: Techniques, materials, and application. Coatings 2011, 1, 17–52. [Google Scholar] [CrossRef]
  9. Vilhena, L.; Domingues, B.; Fernandes, C.; Senos, A.; Ramalho, A. Mechanical and tribological characterization of WC-Co and WC-AISI 304 composites by a newly developed equipment. Materials 2022, 15, 1187. [Google Scholar] [CrossRef] [PubMed]
  10. García, J.; Ciprés, V.C.; Blomqvist, A.; Kaplan, B. Cemented carbide microstructures: A review. Int. J. Refract. Met. Hard Mater. 2019, 80, 40–68. [Google Scholar] [CrossRef]
  11. Schwanekamp, T.; Marginean, G.; Reuber, M.; Ostendorf, A. Impact of Cobalt Content and Grain Growth Inhibitors in Laser-Based Powder Bed Fusion of WC-Co. Int. J. Refract. Met. Hard Mater. 2022, 105, 105814. [Google Scholar] [CrossRef]
  12. Ma, R.; Ju, S.; Chen, H.; Shu, C. Effect of cobalt content on microstructures and wear resistance of tungsten carbide–cobalt-cemented carbides fabricated by spark plasma sintering. IOP Conf. Ser. Mater. Sci. Eng. 2017, 207, 012019. [Google Scholar] [CrossRef]
  13. Saketi, S.; Odelros, S.; Östby, J.; Olsson, M. Experimental study of wear mechanisms of cemented carbide in the turning of Ti6Al4V. Materials 2019, 12, 2822. [Google Scholar] [CrossRef]
  14. Olsson, M.; Lenrick, F.; M’Saoubi, R.; Larsson, H.; Markström, A.; Petrusha, I.; Ståhl, J.E.; Bushlya, V. Study of wear mechanisms of cemented carbide tools during machining of single phase niobium. Wear 2020, 458–459, 203244. [Google Scholar] [CrossRef]
  15. Katiyar, P.K.; Maurya, R.; Singh, P.K. Failure Behavior of Cemented Tungsten Carbide Materials: A Case Study of Mining Drill Bits. J. Mater. Eng. Perform. 2021, 30, 6090–6106. [Google Scholar] [CrossRef]
  16. Scussel, H.J. Friction and wear of cemented carbides. In ASM Handbook; ASM International: Materials Park, OH, USA, 1992; Volume 18, p. 796.S. [Google Scholar]
  17. Shipway, P.H.; Hogg, J.J. Dependence of microscale abrasion mechanisms of WC-Co hardmetals on abrasive type. Wear 2005, 259, 44–51. [Google Scholar] [CrossRef]
  18. Doeg, H.H. Cemented hard metals: Their basis with particular reference to the tungsten carbide-cobalt system. J. S. Afr. Inst. Min. Metall. 1960, 60, 663. [Google Scholar]
  19. Pirso, J.; Letunovitš, S.; Viljus, M. Friction and wear behaviour of cemented carbides. Wear 2004, 257, 257–265. [Google Scholar] [CrossRef]
  20. Larsen-Basse, J. Binder extrusion in sliding wear of WC-Co alloys. Wear 1985, 105, 247–256. [Google Scholar] [CrossRef]
  21. Pereira, P.; Vilhena, L.; Sacramento, J.; Senos, A.; Malheiros, L.; Ramalho, A. Influence of Different Binders and Severe Environmental Conditions on the Tribological and Electrochemical Behaviour of WC-Based Composites. Lubricants 2022, 10, 145. [Google Scholar] [CrossRef]
  22. Sandoval, D.A.; Rinaldi, A.; Tarragó, J.M.; Roa, J.J.; Fair, J.; Llanes, L. Scale effect in mechanical characterization of WC-Co composites. Int. J. Refract. Met. Hard Mater. 2018, 72, 157–162. [Google Scholar] [CrossRef]
  23. Beste, U.; Jacobson, S. A new view of the deterioration and wear of WC/Co cemented carbide rock drill buttons. Wear 2008, 264, 1129–1141. [Google Scholar] [CrossRef]
  24. Duszová, A.; Halgaš, R.; Bľanda, M.; Hvizdoš, P.; Lofaj, F.; Dusza, J.; Morgiel, J. Nanoindentation of WC–Co hardmetals. J. Eur. Ceram. Soc. 2013, 33, 2227–2232. [Google Scholar] [CrossRef]
  25. Bonache, V.; Rayón, E.; Salvador, M.D.; Busquets, D. Nanoindentation study of WC–12Co hardmetals obtained from nanocrystalline powders: Evaluation of hardness and modulus on individual phases. Mater. Sci. Eng. A 2010, 527, 2935–2941. [Google Scholar] [CrossRef]
  26. Arunkarthikeyan, K.; Balamurugan, K.; Rao, P.M.V. Studies on cryogenically treated WC-Co insert at different soaking conditions. Mater. Manuf. Process. 2020, 35, 545–555. [Google Scholar] [CrossRef]
  27. Gill, S.S.; Singh, J.; Singh, H.; Singh, R. Metallurgical and mechanical characteristics of cryogenically treated tungsten carbide (WC–Co). Int. J. Adv. Manuf. Technol. 2011, 58, 119–131. [Google Scholar] [CrossRef]
  28. Zhang, W.; Tian, J.; Wu, X.; Zheng, Y.; Yuan, J.; Zheng, M. Wear Characteristics and Micro-Cutting Damage Model of Cemented Carbide by Deep Cryogenic Treatment. J. Mater. Res. Technol. 2024, 32, 2279–2295. [Google Scholar] [CrossRef]
  29. Chinnasamy, M.; Rathanasamy, R.; Palaniappan, S.K.; Pal, S.K.; Muthuswamy, P.; Korrayi, R.R.; Uddin, M.E. Microstructural and Tribological Characterization of Cryogenic Treated WC-Co Cutting Bits under Different Holding Times for Rock Cutting Applications. J. Mater. Eng. Perform. 2024, 33, 4933–4950. [Google Scholar] [CrossRef]
  30. Thakur, D.; Ramamoorthy, B.; Vijayaraghavan, L. Influence of different post treatments on tungsten carbide-cobalt inserts. Mater. Lett. 2008, 62, 4403–4406. [Google Scholar] [CrossRef]
  31. Padmakumar, M.; Guruprasath, J.; Achuthan, P.; Dinakaran, D. Investigation of phase structure of cobalt and its effect in WC–Co cemented carbides before and after deep cryogenic treatment. Int. J. Refract. Met. Hard Mater. 2018, 74, 87–92. [Google Scholar] [CrossRef]
  32. Formisano, A.; Capece Minutolo, F.; Caraviello, A.; Carrino, L.; Durante, M.; Langella, A. Influence of eta-phase on wear behavior of WC-Co carbides. Adv. Tribol. 2016, 2016, 5063274. [Google Scholar] [CrossRef]
  33. Průcha, V.; Jansa, Z.; Veselý, V. Influence of deep cryogenic processing on carbide grain size in sintered carbide WC-Co. Manuf. Technol. 2021, 21, 32–37. [Google Scholar] [CrossRef]
  34. Kim, J.; Suh, Y.J.; Kang, I. First-principles calculations of the phase stability and the elastic and mechanical properties of η-phases in the WC–Co system. J. Alloys Compd. 2016, 656, 213–217. [Google Scholar] [CrossRef]
  35. Zhang, W.; Wu, X.; Tian, J.; Huang, X.; Yu, W.; Zhu, W.; He, J. Improving wear resistance and corrosive resistance of cemented carbide for mud pulser rotor by deep cryogenic treatment. Materials 2024, 17, 1195. [Google Scholar] [CrossRef]
  36. Chen, Y.; Zhang, L.; Zhong, Z.; Wang, S. Effect of substrates characteristics on tribological behaviors of AlTiN-based coated WC–Co cemented carbides. Coatings 2022, 12, 1517. [Google Scholar] [CrossRef]
  37. ASTM E92-17; Standard Test Methods for Vickers Hardness and Knoop Hardness of Metallic Materials. ASTM International: West Conshohocken, PA, USA, 2017.
  38. Pero, R.; Maizza, G.; Montanari, R.; Ohmura, T. Nano-Indentation Properties of Tungsten Carbide-Cobalt Composites as a Function of Tungsten Carbide Crystal Orientation. Materials 2020, 13, 2137. [Google Scholar] [CrossRef]
  39. Bľanda, M.; Duszová, A.N.; Csanádi, T.; Dusza, J. Indentation fatigue of WC grains in WC–Co composite. J. Eur. Ceram. Soc. 2014, 34, 3365–3370. [Google Scholar] [CrossRef]
  40. Shen, Z.; Su, Y.; Liang, Z.; Long, X. Review of Indentation Size Effect in Crystalline Materials: Progress, Challenges, and Opportunities. J. Mater. Res. Technol. 2024, 31, 117–132. [Google Scholar] [CrossRef]
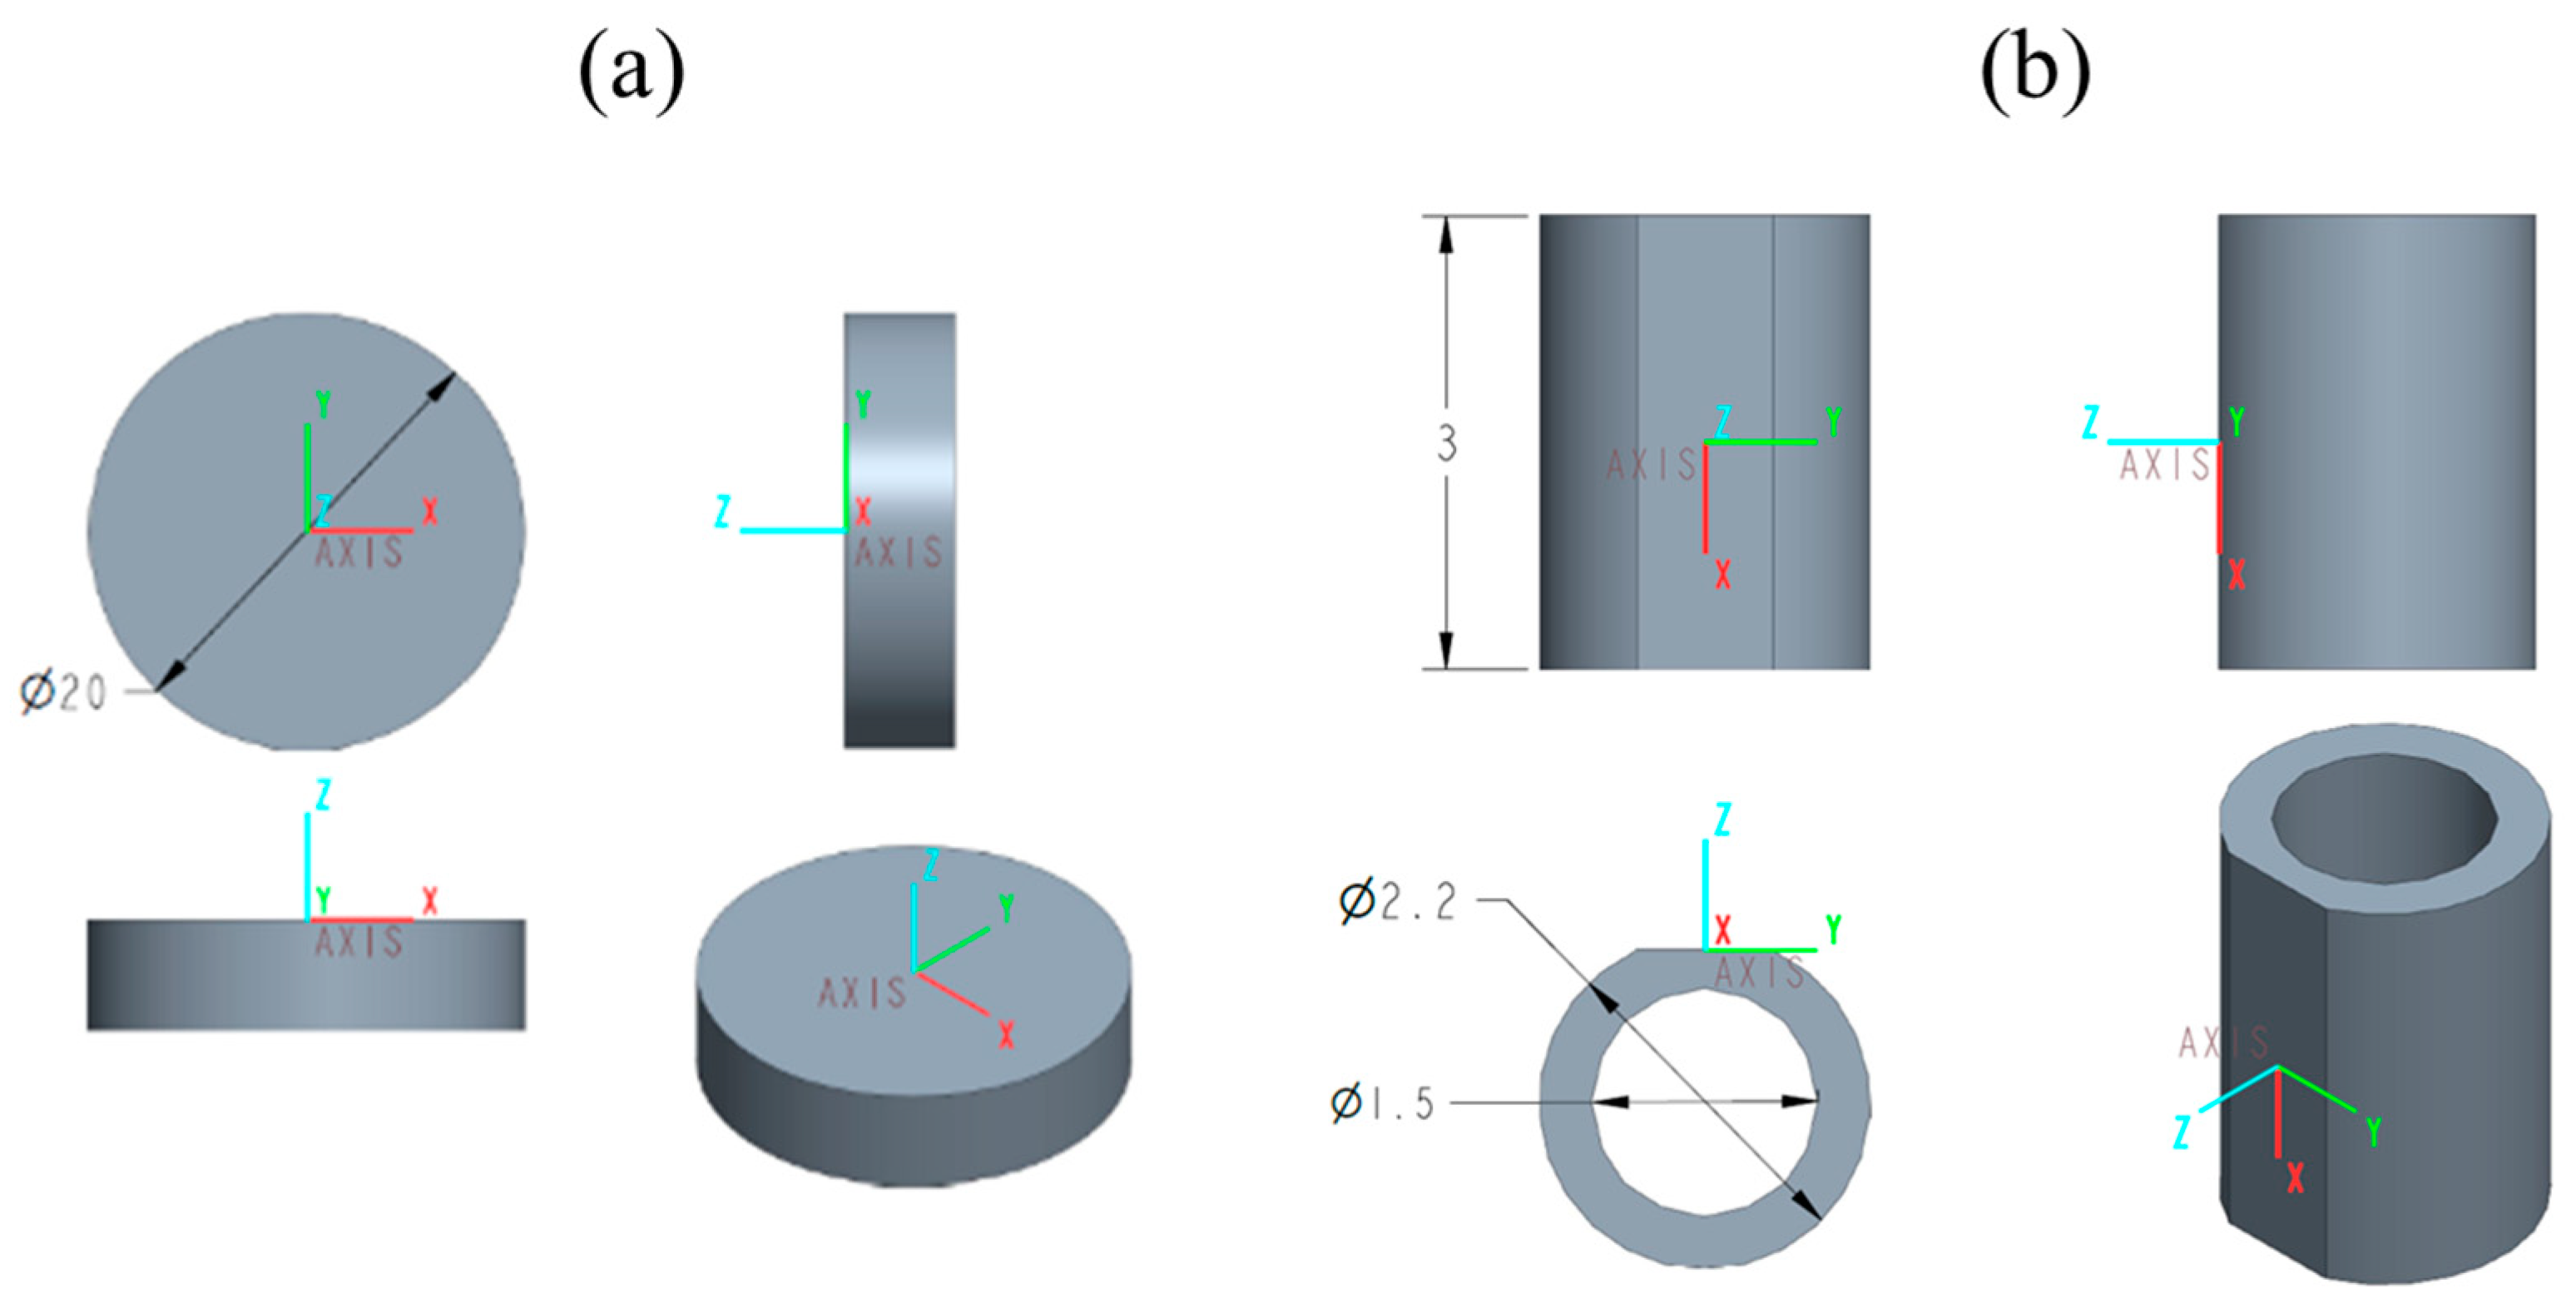
Figure 1. Drawing of samples: (a) bulk sample, B; (b) high-precision sample, P (dimensions in mm).
Metals 15 00297 g001
Figure 2. Arrangement for temperature sensor positions inside the cryogenic chamber (dimensions in mm, arrows show temperature sensor location for process control).
Metals 15 00297 g002
Figure 3. SEM image for B sample (a) before cryogenic treatment and (b) after cryogenic treatment.
Metals 15 00297 g003
Figure 4. SEM image for P sample (a) before cryogenic treatment and (b) after cryogenic treatment.
Metals 15 00297 g004
Figure 5. Grain size distribution of B samples before cryogenic treatment (NCT).
Metals 15 00297 g005
Figure 6. Grain size distribution of B samples after deep cryogenic treatment (DCT).
Metals 15 00297 g006
Figure 7. Grain size distribution of P samples before cryogenic treatment (NCT).
Metals 15 00297 g007
Figure 8. Grain size distribution of P samples after deep cryogenic treatment (DCT).
Metals 15 00297 g008
Figure 9. Load–displacement curves of B samples before (NCT) and after cryogenic treatment (DCT).
Metals 15 00297 g009
Figure 10. Examples of load–displacement curves of P samples before (NCT) and after deep cryogenic treatment (DCT).
Metals 15 00297 g010
Figure 11. Maximum nanoindentation depths of bulk samples (B) before (NCT) and after cryogenic treatment (DCT).
Metals 15 00297 g011
Figure 12. Maximum nanoindentation depths of high-precision samples (P) before and after cryogenic treatment.
Metals 15 00297 g012
Figure 13. Nanohardness of B samples.
Metals 15 00297 g013
Figure 14. Nanohardness of P samples.
Metals 15 00297 g014
Figure 15. AFM image of carbide phase indentation (a) before and (b) after indentation of B sample before deep cryogenic treatment.
Metals 15 00297 g015
Figure 16. AFM image of carbide phase indentation (a) before and (b) after indentation of B sample after deep cryogenic treatment.
Metals 15 00297 g016
Table 1. Chemical composition (wt%) of sample.
SampleWt% WWt% CWt% Co
P77 ± 3.8319 ± 3.305 ± 0.83
B80 ± 1.2112 ± 1.709 ± 0.62
Table 2. Nanoindentation results for maximum indentation depths and nanohardness of P samples.
Indentation Depth and HardnessP Sample
NCTDCT
hmax (nm)H (GPa)hmax (nm)H (GPa)
Mean131.9924.84124.0524.78
SD23.864.255.352.15
%SD18.0817.124.328.69
Table 3. Nanoindentation results for maximum indentation depths and nanohardness of B samples.
Indentation Depth and HardnessB Sample
NCTDCT
hmax (nm)H (GPa)hmax (nm)H (GPa)
Mean131.1220.66121.1423.53
SD8.642.646.272.41
%SD6.5912.795.1710.23
Table 4. Nanoindentation results for maximum indentation depths and nanohardness of P samples after classification into two groups.
Indentation Depth
and Hardness
hmax Before Treatment < 130 nmhmax Before Treatment > 130 nm
NCTDCTNCTDCT
hmax (nm)H (GPa)hmax (nm)H (GPa)hmax (nm)H (GPa)hmax (nm)H (GPa)
Mean120.8126.70122.9324.96149.8722.57125.8324.21
SD6.002.795.612.2927.474.264.581.80
%SD4.9610.474.569.1818.3318.893.647.42
Table 5. Vickers hardness testing of bulk samples (B).
SampleSampleVickers Hardness (HV1)Cal. Hardness (GPa)%SD
BNCT1764 ± 4317 ± 0.422.52
DCT1842 ± 5818 ± 0.573.14
Disclaimer/Publisher’s Note: The statements, opinions and data contained in all publications are solely those of the individual author(s) and contributor(s) and not of MDPI and/or the editor(s). MDPI and/or the editor(s) disclaim responsibility for any injury to people or property resulting from any ideas, methods, instructions or products referred to in the content.