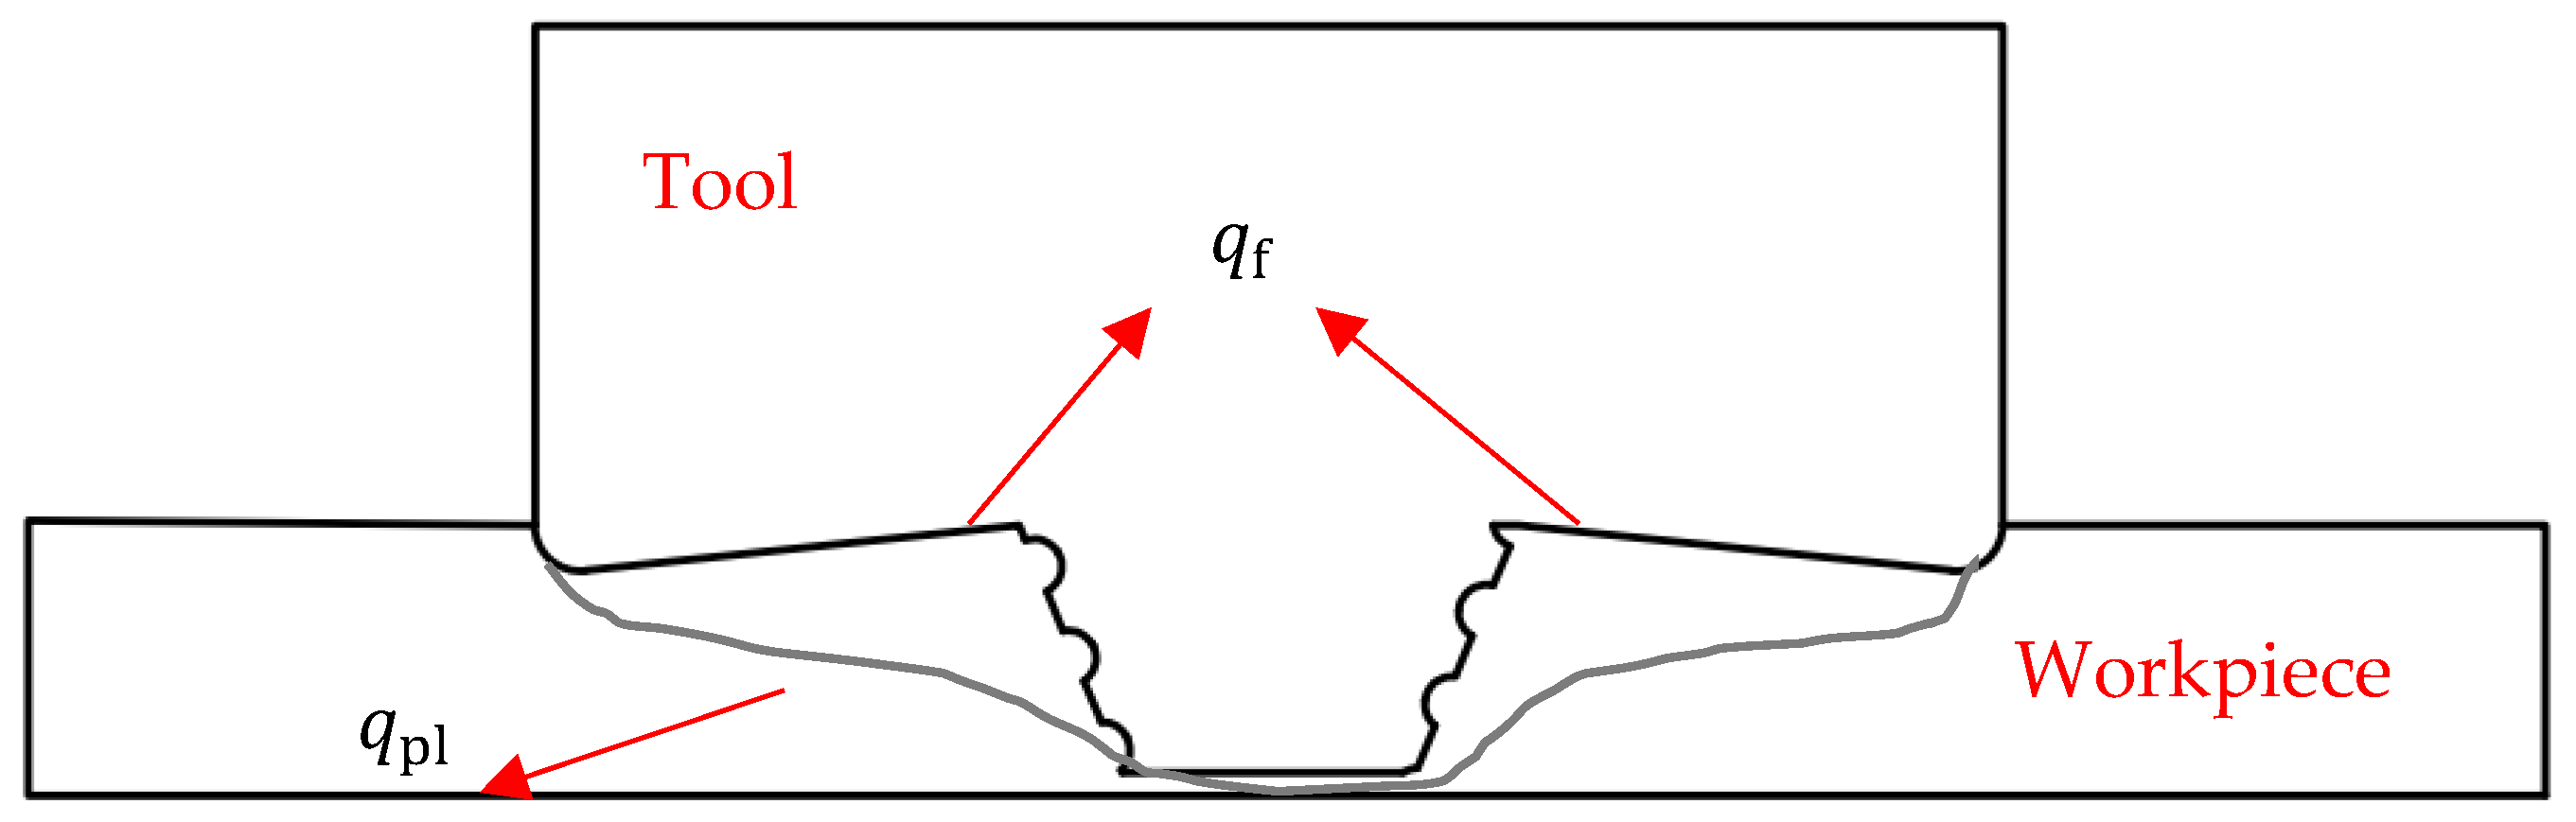
Article

Effects of Tool Structure and Process Parameters in Friction Stir Welding on the Temperature and Mechanical Properties of Dissimilar Copper–Aluminium Welded Joints

1
School of Mechanical Engineering, Dongguan University of Technology, Dongguan 523808, China
2
Shenzhen Tairuiqi Hardware Electronics Co., Ltd., Shenzhen 515100, China
3
Dongguan Tairuiqi Precision Technology Co., Ltd., Dongguan 523710, China
*
Author to whom correspondence should be addressed.
Metals 2025, 15(2), 193; https://doi.org/10.3390/met15020193
Submission received: 14 January 2025 / Revised: 1 February 2025 / Accepted: 7 February 2025 / Published: 12 February 2025
(This article belongs to the Section Welding and Joining)

Abstract

:
Friction stir welding (FSW) is a solid-state welding method. The effects of tool structure, tool rotational speed, and welding speed in friction stir welding on the temperature, microstructure, and mechanical properties during the welding of 3 mm thick 6061-T6 aluminium alloy and T2 pure copper plates were investigated through experiments, numerical simulations, mechanical property tests, and microstructural observations, with the aim of enhancing welding strength and efficiency. The results showed that the welding heat input increased with the shoulder and pin diameters. When the shoulder diameter was in the range of 10–16 mm, proportional increases in the pin diameter resulted in an approximate increase of 30 °C in the weld centre temperature for every 2 mm increase in shoulder diameter. Compared to welding speed, rotational speed had a more significant effect on the heat input. Compared to the smooth tool, the threaded tool promoted the dispersion of copper particles within the aluminium matrix, facilitating the formation of Al2Cu phases. This increased the tensile strength of the weld joint from 183 to 236 MPa (a 28.9% improvement), along with a 57% increase in the weld centre hardness. An energy-dispersive X-ray spectroscopy analysis indicated that welding with the threaded tool resulted in the presence of significantly hard and brittle intermetallic compounds, including AlCu and Al2Cu, in the stirring zone, which substantially enhanced the weld strength.

1. Introduction

Copper is highly valued because of its excellent electrical and thermal conductivities, making it the preferred material for electrical products. However, its relative scarcity and high cost limit its application [1]. Aluminium is less conductive and thermally conductive than copper, but it is abundant, cheap, and has a high electrical conductivity, making it a potential alternative to copper conductors [2]. However, the lower corrosion resistance and weaker mechanical properties of aluminium prevent it from completely replacing copper. Consequently, aluminium–copper composite joints have become a promising solution for maximising the advantages of both materials, achieving cost efficiency, reducing weight, and meeting strength requirements. Aluminium–copper composite joints are mainly used in applications such as generator busbars, conductive components of transformers, refrigeration, aerospace, and chemical containers. Friction stir welding (FSW) technology has been widely employed to weld similar and dissimilar materials, such as aluminium alloys, titanium alloys, pure copper, and alloy steels, due to its excellent welding characteristics. Mabuwa S [3] conducted a comparative study on TIG-welded AA6082/AA8011 dissimilar aluminium joints and friction-stir-welded AA6082/AA8011 joints. The results showed that applying friction stir welding treatment to the TIG-welded joints increased the ultimate tensile strength from 86.9 MPa to 90.2 MPa. This indicates that friction stir welding treatment can further enhance the joint performance. Pandian V [4] conducted a numerical study on the temperature distribution in dissimilar friction stir welding of aluminium alloys 7075 and 2014, with experimental validation. The simulation incorporated the frictional effects of the tool shoulder, pin-to-workpiece interaction, and stick–slip mechanisms. The results demonstrated that different numerical models predicted the temperature across the weld zone, and the measured temperatures throughout the weld were in good agreement with the simulated values. This indicates that friction stir welding is highly effective for joining dissimilar aluminium alloys. Çam G [5] conducted friction stir welding experiments on 6061 aluminium alloy, successfully preparing aluminium alloy joints, and investigated the influence of high-strength interlayers on joint performance. The results showed that although friction stir welding can produce AA6061-T6 joints, a loss of strength occurs in the weld zone. Furthermore, this study demonstrated that the use of higher-strength interlayers during friction stir welding can enhance the strength of the weld nugget. Su Y [6] successfully prepared Ti-4Al-0.005B titanium alloy T-joints using two different friction stir welding (FSW) sequences and investigated their effects on low-cycle fatigue performance. The results indicated that the hysteresis loop transformed into a straight line, and no significant fatigue damage was observed at low strain amplitudes (0.2% and 0.4%). This demonstrates that the friction-stir-welded titanium alloy T-joints exhibited excellent joint performance. Du S [7] successfully fabricated titanium alloy joints using friction stir welding (FSW) technology. To broaden the narrow process window of FSW for TA5 alloy, a titanium-supported friction stir welding (TSFSW) method was proposed. The TSFSW approach eliminates the need for complex devices and preparatory work. By reducing heat dissipation at the bottom of the weld, defect-free joints were achieved at higher welding speeds, thereby improving the mechanical properties and expanding the parameter range. Liu J [8] successfully fabricated aluminium–steel dissimilar metal joints and investigated the influence of tool length on the microstructure and mechanical properties of the dissimilar joints. The results indicated that as the tool length increased, the joint strength initially increased and then decreased. Additionally, partial tensile failure occurred in the aluminium-based metal region.
However, when welding dissimilar materials, such as aluminium and copper, the high melting point of copper necessitates a high heat input for effective bonding. Under these conditions, aluminium alloys are prone to adhere to the tool, which can result in defects, such as voids, and a reduction in joint performance. Therefore, the appropriate design of the tool structure and welding process parameters are crucial to ensure weld quality.
In terms of tool structure, researchers have conducted studies on tool shape, size, and the presence of threads. Mehta and Badheka [9] analysed the tensile properties, hardness, and macro- and microstructures of weld seams on 6.3 mm aluminium/copper plates formed using nine different tool designs, including triangular, square, hexagonal, and circular shapes. The results showed that, when welded using polygonal tools, the stir zone exhibited higher hardness and brittleness than when welded using other shapes, resulting in a lower joint strength, with a maximum tensile strength of only 75.2 MPa. Subsequently, Mehta and Badheka [10] conducted FSW of 6.3 mm aluminium/copper plates using conical and cylindrical tools and found that the cylindrical pin produced the strongest joints. However, owing to the formation of a significant number of intermetallic compounds, the maximum tensile strength was only 133 MPa, representing 58% of the strength of the copper base material, and increasing the pin and shoulder diameters resulted in higher impact loads. Sharma et al. [11] performed FSW of dissimilar 3 mm thick aluminium/copper joints and observed that, compared to cylindrical and conical tools, a square pin promoted better material flow. Under the processing conditions of rotational and welding speeds of 900 rpm and 40 mm/min, respectively, the square pin resulted in superior mechanical properties and microstructures of the aluminium alloy and industrial pure copper joints. However, the square pin is prone to wear, increases the machining difficulty, and produces a stir-zone hardness of 248 HV, resulting in the formation of a large number of hard and brittle intermetallic compounds, posing significant risks to mechanical performance. Akinlabi [12] investigated copper–aluminium FSW using shoulder diameters of 15, 18, and 25 mm and concluded that at a rotational speed of 950 rpm and welding speed of 50 mm/min, an optimal tensile strength of 208 MPa was achieved with a shoulder diameter of 18 mm. Trimble et al. [13] investigated a more suitable tool to determine effective parameters for higher welding speeds and showed that a good weld quality could be obtained at 355 mm/min using swirl shoulder and triple-groove pin welding with a rotational speed of 450 rpm. Scialpi et al. [14] studied the effect of different stir head shoulder shapes on the performance of friction-stir-welded joints and showed that for thin sheets, the best joint was welded using a shoulder with a fillet and cavity. Kumar et al. [15] performed FSW of a 4.4 mm thick aluminium alloy using different tools, and the results showed that the weld defect severity was minimal and the weld tensile strength was highest when the shoulder diameter was 20 mm and the stirring needle diameter was 6 mm.
However, the overall impact of tool shape, size, and threading on the weld zone in copper–aluminium FSW remains unclear. In addition, the maximum welding speed remains relatively low, limiting the application of the FSW technology for joining dissimilar copper and aluminium materials. To improve welding efficiency, researchers have explored the effects of welding parameters on the temperature and weld quality. Chauhan et al. [16] used the coupled Eulerian and Lagrangian method to simulate the FSW process and concluded that a stir length of 2.5 mm was optimal when the welding speed was 60 mm/min; the simulations could also accurately predict defects for different welding parameters. Bisadi et al. [17] analysed copper–aluminium friction stir lap welding at different rotational speeds and found that a reasonable temperature range and optimal joint tensile strength were achieved at a rotational speed of 825 rpm and a welding speed of 32 mm/min. The observed heat input closely matched the values predicted from the rotational speed–welding speed heat input model proposed by Ghosh et al. [18]. Devarajan K et al. [19] successfully fabricated aluminium–copper lap joints. The results demonstrated that the combination of a rotational speed of 1900 rpm, dwell time of 16 s, and welding speed of 12 mm/min yielded the highest lap shear strength value of 107.34 MPa. Chen Yaoyuan [20] investigated the friction stir welding process parameters for butt joints of 2 mm thin plates of T2 copper and 1060 aluminium. The results showed that when the process parameters were set at a spindle speed of 1000 rpm and a welding speed of 70 mm/min, the maximum tensile strength of the joint reached 84.76% of that of the 1060 aluminium base material. Tehrani-Moghadam H G et al. [21] investigated the effects of rotational speed on the microstructure and mechanical properties of Al/Cu friction-stir-welded joints. The results indicated that as the rotational speed increased, the complex intercalated structure at the Al-Cu interface gradually thickened. When the welding parameters were set at 1000 r/min and 60 mm/min, the joint achieved a maximum tensile strength of 177.2 MPa. Wang Chenji [22] conducted lap joint experiments on 2 mm thick 6061-T6 aluminium alloy and T2 copper plates using FSW. The results showed that the joint attained a maximum tensile shear load of 4.65 kN at a rotational speed of 900 r/min and a welding speed of 100 mm/min. Che Qianying [23] successfully fabricated butt joints made of 3 mm thick 6061Al alloy and T2 copper. The optimal welding parameter range for the Al/Cu welded joints was found to be 750–1180 r/min and 30–47.5 mm/min, with a maximum tensile strength of 203 MPa.
Despite these advancements in understanding the key factors influencing the weld temperature and developing predictive heat input models, a relatively low welding feed rate remains a limiting factor for the broader application of this process.
Therefore, this study aimed to investigate the effects of tool shape, size, thread structure, and welding parameters on the temperature, weld morphology, microstructure, and mechanical properties of copper–aluminium weld joints using 3 mm thick plates. Through numerical analysis and experimental methods, this study provides insights into the design and optimisation of tools and processes for welding dissimilar copper and aluminium metals.

2. Research Methodology

This study analysed the effects of tool structure (including thread design and shoulder diameter) and welding parameters on the joint morphology, microstructure, and mechanical properties of T2 pure copper and 6061-T6 aluminium plates through numerical simulations and experiments.
The temperature and material flow during FSW significantly influence the morphology, organisation, and mechanical properties of the weld head. The welding process primarily includes two sources of heat generation: one is the frictional heat between the tool and the plates, and the other is the heat generated by plastic deformation. In this study, both heat generation mechanisms were considered, namely the frictional heat between the tool and the plates and the heat generated by plastic deformation. The heat generation process is illustrated in Figure 1. The frictional heat generation can be calculated using the following equation [24]:
q f = η 1 τ γ ˙
In this equation, q f is the surface heat flux density; η 1 is the thermal efficiency, which was set as 0.95 in this study; γ ˙ is the slip rate; and τ is the frictional shear stress. According to the classical Coulomb friction law, τ can be expressed as
τ = μ p
In this equation, μ is the coefficient of friction and p is the normal pressure exerted by the tool on the contact surface.
The heat generated by plastic deformation is expressed as follows:
q p l = η 2 σ ε ˙ p l
In this equation, q p l is the volumetric heat flux density; η 2 is the conversion efficiency of work into heat, which was set as 0.9; σ is the stress; and ε ˙ p l is the plastic strain rate.
The structural shape, size, and specifications of the tool shoulder, welding pin, and welding process directly affect the welding heat generation, which in turn affects the temperature of the weld metal, material flow, organisation morphology, and welding quality. Conical structures are widely used in tool design because they can reduce the resistance in the axial and feeding directions to a certain extent, while the addition of threads can enhance the material stirring effect. Therefore, this study used numerical simulations and experiments to analyse the effects of the conical stirring head structure (shoulder diameter and welding needle with or without threads) and the FSW process parameters on the joint morphology, organisation, and mechanical properties of the weld between a T2 pure copper plate and a 6061-T6 aluminium plate. This study aims to provide a reference for high-efficiency copper–aluminium FSW processes, in which the diameters of the stirring needle and shoulder increase in equal proportions.

2.1. Experiments and Methods

The experimentally obtained compositions, mechanical properties, and thermophysical parameters of pure copper and 6061-T6 aluminium alloy are listed in Table 1, Table 2 and Table 3. As shown in Figure 2a, a static gantry-type FSW equipment was used to perform the FSW experiments on T2 pure copper and 6061-T6 aluminium plates with dimensions of 60 mm × 80 mm × 3 mm, this equipment is sourced from Saifusite Technology Co., Ltd. in Beijing, China. These experiments aimed to investigate the effects of different tool structures and welding process parameters on joint quality, as summarised in Table 4. The tool material used in the experiment was H13 mould steel (Figure 2b,c), which was divided into conical threaded and conical unthreaded tools, and the root of the stirring needle was rounded.
Before welding, the welded surface of the plate was treated by removing the oxide film and cleaning it with ethanol. During the welding process, the plates were pressed together using the tool shown in Figure 2a to prevent relative movement. After welding, specimens for hardness, tensile strength, and metallographic tests were prepared using a wire-cutting machine (Suzhou Zhikai CNC Technology Co., Ltd., Suzhou, China) following the sampling method shown in Figure 3a.
Microhardness testing of the welded joint cross-section was performed using an HV-1000 Vickers hardness tester (Shanghai Hualong Testing Machine Co., Ltd., Shanghai, China) at the test points shown in Figure 3b (0.8 mm for the upper layer, 1.5 mm for the middle layer, and 2.2 mm for the lower layer), with 30 points measured in each area. In accordance with the ASTM E8/E8M-16a standard [25], the welded specimens were subjected to tensile testing using a JZY-6691T universal tensile-testing machine (Jiangsu Jinzhi Testing Instrument Co., Ltd., Suzhou, China) at a tensile strain rate of 1 mm/min. Three specimens were tested for each specification and the average values were recorded.
After the metallographic specimens were ground and polished sequentially with 600, 800, 1000, 1500, and 2000 grit sandpapers, and their microstructures were examined and analysed using an IE500M (SOPTOP, Hong kong, China) optical microscope (OM). Subsequently, the weld region was characterised using a ZEISS Sigma500 field-emission scanning electron microscope (Carl Zeiss AG, Oberkochen, Germany). The compositions of the metal compounds at the weld bond interface were determined using energy-dispersive spectroscopy (EDS) (Oxford Instruments, Abingdon, UK) to perform qualitative and quantitative analyses of the phase elements.

2.2. Numerical Simulations

A thermal coupling model was established using ABAQUS(2022) finite element analysis software based on the coupled Euler–Lagrangian (CEL) model to analyse the influence of the tool structure on the temperature field. The tool and workpiece were modelled using SolidWorks(2022). Figure 4a,b show the modelling diagram of the tool, and the meshing diagram of the tool; Figure 4c,d show the FSW assembly diagram and the mesh division diagram of the workpiece, respectively. Based on the structural characteristics of the welded workpiece and tool, the copper/aluminium plates were defined as Eulerian bodies, and a node hexahedral Eulerian cell (EC3D8RT) was used to mesh the workpiece. To reduce the computation time, the mesh was refined in the vicinity of the weld seam, while the remaining area was sparsely meshed. The tool was defined as a rigid body, and a four-node rigid-body cell (R3D4) is employed for meshing. The size of the copper/aluminium plates was 200 mm × 60 mm × 3 mm. The tool was made of H13 steel and the stirring needle was conical with a length of 2.7 mm. The dimensions of the five tool structures are listed in Table 5.
The tool was defined as a rigid body, and the workpiece was described using the Johnson–Cook principal model, as shown in Equation (4), to describe the relationship between stress, temperature, strain, and strain rate. The principal parameters of the aluminium and copper materials are listed in Table 6 [26,27]. In finite element numerical simulations, accurate simulation results require the definition of material properties, which mainly include specific heat capacity, density, thermal conductivity, elastic modulus, thermal expansion coefficient, and Poisson’s ratio. The temperature-dependent thermal properties of aluminium [26] are shown in Table 7. The copper material data were calculated using JMatPro software(15), and the specific results are presented in Table 8.
σ = ( A + B ε ¯ p l n ) ( 1 + C l n ε ¯ ˙ p l ε ˙ 0 )   [ 1 ( T T r e f T m e l t T r e f ) m ]
In Equation (4), ε ¯ p l represents the equivalent plastic strain; ε ¯ ˙ p l represents the equivalent plastic strain rate; A, B, C, n, and m denote material constants, where n represents the strain hardening effect, m represents the high-temperature softening effect, C represents the degree of strain rate sensitivity, and A, B, and n are obtained through tests at room temperature, T r e f ; and T m e l t represents the melting point of the material.
In the FSW simulation, the bottom and side surfaces of the workpiece were constrained to limit the movement. The intersection point of the tool axis and the upper surface of the stirring needle was set as the reference point, and the rotation and movement of the tool were achieved by controlling the reference point to simulate the plunge depth, preheating, and welding processes of the tool. Numerical simulations were performed for the four types of tools under the same process parameters to explore the influence of different tool shoulder diameters on the welding temperature. The process parameters were as follows: a tool rotational speed of 1400 rpm, welding speed of 80 mm/min, shoulder plunge depth of 0.2 mm, inclination angle of 2.5°, and offset of 0.6 mm.
The friction stir welding process is shown in Figure 5a, where the welding speed (V) moves horizontally forward, the stirring head rotational speed (S) rotates counterclockwise, the copper plate is placed on the retreating side (RS), and the aluminium plate is placed on the advancing side (AS). To analyse the temperature variation with time at different positions from the weld centre, temperature field simulations and measurements were conducted at two characteristic points located 10 mm on either side of the weld centre and 1.5 mm in the thickness direction, as shown in Figure 5b. The temperatures at these points were measured using a K-type thermocouple(K) and TP700 recorder(TP700) (Beijing Jing Heng, Beijing, China), as shown in Figure 6a,b. During the temperature measurement experiment, thermal conductive silicone grease was used to increase the contact area between the thermocouple and the characteristic points, ensuring the accuracy of the temperature readings. In the FSW temperature field simulation, heat was dissipated from the workpiece surface to the air through convection and radiation. Since radiation is a more complex issue, for modelling simplicity, radiation heat transfer was considered equivalent to convection heat transfer. After reviewing multiple studies [16,28,29,30], it was found that the contact heat transfer coefficient between the substrate bottom surface and the fixture base typically ranges from 1000 to 4000 W/(m2·K), while the heat transfer coefficient between the substrate and air generally falls within the range of 10 to 100 W/(m2·K). After adjustment, the overall heat transfer coefficients between the copper–aluminium workpieces and air were set to 100 W/(m2·K) and 50 W/(m2·K), respectively. Contact heat transfer occurs between the workpiece and the backing plate as well as the pressure block. After adjustment, the heat transfer coefficients between the copper-aluminium workpieces and the backing plate were set to 2000 W/(m2·K) and 1000 W/(m2·K), respectively.

3. Results and Discussion

3.1. Effect of the Tool Structure on the Joint Temperature

Figure 7 shows the temperature distribution on the surface of the weld for the five different tools. Figure 7a shows the temperature scale of the temperature field, Figure 7b shows the stable welding temperature distributions at a shoulder diameter of 10 mm, Figure 7c shows the stable welding temperature distributions at a shoulder diameter of 12 mm, Figure 7d shows the stable welding temperature distributions at a shoulder diameter of 14 mm, Figure 7e shows the stable welding temperature distributions at a shoulder diameter of 16 mm, and Figure 7f shows the stable welding temperature at a shoulder diameter of 16 mm using a threaded tool distribution diagram. All contour maps represent the temperature distribution at the 20th second of the stable welding stage.
As shown in Figure 7, using an unthreaded tool at a rotational speed of 1400 rpm and a welding speed of 80 mm/min, the highest temperature in the centre was 465 °C with a shoulder diameter of 10 mm. However, when the shoulder diameter was increased to 12, 14, and 16 mm, the maximum temperatures at the weld increased to 502.7, 531.8, and 569.9 °C, respectively, representing proportional increases of 8% (37.7 °C), 14% (66.8 °C), and 23% (104.9 °C). For the same 16 mm shoulder diameter and process parameters, the weld temperature of 569.9 °C with an unthreaded tool increased to 588 °C with a threaded tool. Thus, the threaded tool provided an improvement of 18.1 °C, and the area of the high-temperature region also increased. This demonstrates that under the same conditions, increasing the shoulder diameter and adding threads increased the contact area between the welding tool and material. This increased the heat generated, which in turn increased the temperature of the weld material. This increased temperature can enhance the bonding effect between copper and aluminium materials at low speeds, thus improving the welding efficiency.
Figure 8a shows the comparison of and variation in the simulated and experimental temperatures at two characteristic points over the time interval from 1 s after the welding starts to 1 min after the welding ends and cooling begins. Figure 8b illustrates the arrangement of the simulated measurement path and the temperature distribution along the path after 20 s of welding using different tools. The simulated measurement path is located at the centre in the Z-direction, 1.5 mm from both the top and bottom surfaces, and extends within 20 mm on either side of the weld centre line in the X-direction.
As shown in Figure 8a, the experimental and simulated temperature results at the two characteristic points showed a general agreement. At 36 s after welding, the temperatures reached their maximum value. The temperature difference between the experimental and simulated results for the copper substrate on the retreating side was only 2.1 °C, with an error of approximately 0.8%. During the temperature rise phase, the simulated temperature increased more rapidly, maintaining a temperature difference of 5–27 °C compared to the experimental data. However, the temperature trends for both were consistent, with the error within 10.2%. During the temperature decline phase, the simulated temperature was higher than the experimental temperature by 0–20 °C, and the temperature difference gradually decreased over time, with the error within 7.5%. On the advancing side, when the maximum temperature was reached, the temperature difference between the experimental and simulated results for the aluminium substrate was only 11.5 °C, with an error of approximately 3.7%. The maximum error during the temperature rise phase was around 16.5%, while the maximum error during the temperature decline phase was about 17.2%. The comparison between the experimental and simulated temperatures demonstrated that the model exhibited high accuracy.
As shown in Figure 8b, the temperature field during the welding of dissimilar materials was the highest in the middle and lowest on both sides. The distribution was not completely symmetrical along the weld midline; with increasing distance from the centre of the weld, both the temperature and temperature gradients gradually decreased. This was mainly attributed to the stirring effect during the welding process and differences in the heat transfer characteristics of dissimilar materials.

3.2. Effect of the Tool Structure on the Joint Morphology and Hardness

Building on the previous section’s analysis of the influence of tool structure and dimensions on the temperature field, this section presents experiments to further investigate their impact on welding quality.
Figure 9 shows the cross-sectional and surface morphologies of the weld bead formed using the different tools at a rotational speed of 1400 rpm and a welding speed of 80 mm/min. Figure 9a shows the cross-sectional and surface views of the weld produced using a tool with a 12 mm shoulder diameter and no threads. Figure 9b shows the cross-sectional and surface views of the weld produced using a tool with a 16 mm shoulder diameter and no threads. Figure 9c shows the cross-sectional and surface views of the weld produced using a tool with a 16 mm shoulder diameter and threads. As shown in Figure 9a, the unthreaded tool with a shoulder diameter of 12 mm had difficulty in forming an effective connection, and obvious surface cracks were observed in the weld. As shown in Figure 9b, under the same conditions, a tool with a shoulder diameter of 16 mm produced no evident defects on the surface or internal weld. Moreover, compared to the joint with a 12 mm shoulder diameter, the copper–aluminium interface area in the cross-section was significantly increased, which helped improve the joint quality. The weld surface and internal defect results show that, under the same conditions, the use of a larger tool shoulder diameter can significantly improve the macroscopic quality of the weld, reduce surface defects, and improve the overall quality and reliability of the joint.
In addition, significant differences in the cross-sectional morphology were observed under the different tool configurations. In the joint cross-section obtained with the unthreaded tool (Figure 9b), the copper–aluminium bond at the bottom was not obvious, and there was a risk of unwelded bonding. The copper–aluminium joint welded using the threaded tool (see Figure 9c) exhibited a tighter bond, with more thorough mixing of the copper and aluminium materials at the bottom, forming a ring-like structure. This significantly increases the copper–aluminium interface area in the cross-section, which is expected to enhance joint performance. This hypothesis was confirmed through subsequent mechanical performance testing. Therefore, compared to the tool without threads, the threaded tool demonstrated a stronger stirring capability and a more effective crushing action on the metals, leading to a significant improvement in joint performance.
Figure 10 show the microhardness distribution curves of the joints welded using different tool configurations (unthreaded and threaded). The hardness results for both tools indicated that, in terms of the transverse hardness distribution, the hardness was higher in the central region of the welded joint, with a region of reduced hardness surrounding it. Longitudinally, in the heat-affected zone of the copper–aluminium joint, the surface hardness was lower than the bottom hardness. Conversely, in the heat-affected zones on both sides of the copper–aluminium joint, the surface hardness was higher than that of the base metal.
As shown in Figure 10b, under the stirring action of the threaded tool, the hardness of the weld zone was significantly higher than that of the base metal or other materials. In aluminium–copper alloys, Al2Cu is a common T6-strengthened phase. Under the influence of welding heat, copper diffuses into the aluminium alloy and forms a certain degree of solid solution and ageing at the interface, resulting in a higher hardness at the centre of the weld. Furthermore, the subsequent experimental tests confirmed the presence of intermetallic compounds. This suggests that metal-strengthening phases were generated, which is consistent with the observations reported under high heat input conditions by Mehta and Badheka [9]. The highest microhardness was observed in the weld core area, whereas relatively low microhardness values were observed in regions on both sides.
The highest hardness value was observed in the copper–aluminium mixing zone on the copper side with the threaded tool. As shown in Figure 10a, the highest hardness value was observed in the copper–aluminium mixing zone on the aluminium side when using the unthreaded tool. However, when the threaded tool was used, the highest hardness value was observed in the copper–aluminium mixing zone on the copper side. Additionally, the hardness of the welded joint increased to HV152 with the threaded tool, representing an increase of nearly 57% compared to the HV97 of the unthreaded tool.
The hardness trend shows that intermetallic compounds (IMCs) existed in discontinuous forms and different phase states. As shown in Figure 10b, the heat-affected zone (TMAZ) on the aluminium side exhibited increased hardness compared to the base material, whereas the effect on the hardness of the TMAZ on the copper side was not significant. This difference is related to the variations in the flow, heat generation, and heat dissipation characteristics of the two materials.

3.3. Effect of the Welding Parameters on the Joint Temperature

Ghosh et al. [18] provided an equation for the maximum process temperature in FSW by considering the effects of the rotational and welding speeds on the temperature of the welded joint.
T = K ( n 2 ν × 10 4 ) α T m ,
where T represents the welding heat input (°C); K is a constant, generally set as 0.65–0.75; α is a constant, generally set as 0.04–0.06; T m represents the melting point of the base material (°C); n is the rotational speed of the tool (rpm); and ν is the welding speed (cm/min).
In Equation (5), K and α are constants; thus, the welding heat input in FSW is mainly determined by the rotational speed of the tool and the welding speed. Reasonable and effective control of the rotational speed of the tool and the welding speed can optimise the heat input during the welding process, thereby ensuring weld quality. In this analysis, since T m was taken as the lower melting point of the aluminium alloy, which is 583 °C, the values of K and α were set to 0.75 and 0.06, respectively, both chosen as the maximum values within their respective ranges to ensure data accuracy. At a rotational speed of 1400 rpm and a welding speed of 80 mm/min, the resulting temperature was calculated to be 529.8 °C, and the simulation temperature was 588.1 °C. Therefore, the peak temperatures in the simulation and those derived from the heat input equation were within an error of approximately 58.3 °C, an error of only 9.9%, verifying the accuracy of the simulation results.
Figure 11 shows the temperature distribution distributions obtained using the threaded tool at different rotational speeds. Figure 11a–c show the temperature distributions at 1000, 1200, and 1400 rpm, respectively. To ensure the accuracy of the simulation results and the consistency of the data parameters, temperature maps were extracted after 20 s of stable welding. The results show that, with a threaded tool and a welding speed of 80 mm/min, the temperature of the welded joint increased significantly with increasing rotational speed, and the temperature at the centre of the weld seam reached 526.3, 559.8, and 588.1 °C under rotational speeds of 1000, 1200, and 1400 rpm, respectively, representing sequential increases of 33.5 and 28.3 °C. Thus, increasing the rotational speed increases the heat input and temperature. At 1400 rpm, the weld centre temperature was closer to the melting point of the aluminium alloy but remained within the temperature range consistent with FSW.
Figure 12 shows the temperature distributions obtained using the threaded tool at different welding speeds. As shown in Figure 12b–f, the joint temperatures were 595.4, 590.2, 588.1, 588.7, and 569.4 °C at a rotational speed of 1400 rpm and welding speeds of 40, 70, 80, 90, and 200 mm/min, respectively. When the welding speed was 40 mm/min, the temperature at the weld centre slightly exceeded the melting point of the aluminium alloy, potentially reducing the weld strength due to tissue changes. At welding speeds of 70–90 mm/min, the temperature remained almost unchanged and was close to the melting point of the aluminium alloy, meeting the temperature requirements for FSW. However, at a welding speed of 200 mm/min, the temperature was significantly lower, and the high-temperature zone was reduced. This may prevent the material from reaching sufficient plasticity, potentially leading to weld defects and a decrease in joint strength. Based on the simulation results, lowering the welding speed or increasing the rotation speed can raise the material temperature, a conclusion also supported by M Akbari [31]. As the material becomes softer due to the elevated temperature, its flowability increases, which may improve the welding quality of the joint. These findings provide valuable insights for subsequent experiments.

3.4. Effect of the Welding Parameters on the Joint Morphology

Based on the simulated thermal input results, we identified the key parameters, such as the optimal rotational speed, welding speed, and tool geometry, that can minimise defects and improve welding quality. These parameters helped us analyse the influence of welding process variables on weld morphology. Figure 13 shows the macroscopic morphology of the weld obtained using the conical threaded tool at a rotational speed of 1400 rpm at different welding speeds. Figure 13a–h show the cross-sectional morphology of the weld and the surface morphology of the weld at welding speeds of 70, 80, 90, and 100 mm/min, respectively. As the welding speed increased, the surface of the weld gradually became smooth, and the macroscopic morphology of the cross-section showed no obvious defects inside the joint. At a welding speed of 80 mm/min, the surface of the weld was the smoothest, and the cross-sectional morphology showed no defects. However, when the welding speed was increased to 100 mm/min, holes and continuous tunnelling defects appeared on the surface of the weld and inside the joint, indicating that the high welding speed resulted in insufficient heat input to reach the temperature required for effective welding, resulting in insufficient plastic deformation of both the copper and aluminium base materials. This impedes effective material flow and mixing, leading to the formation of defects such as voids, cracks, and grooves in the joint.
Based on the analysis of the FSW experiments and simulations, it can be concluded that a threaded tool provides a better heat input, weld shaping, and performance improvement in aluminium/copper welding. This supports the conclusions drawn from the numerical simulations.

3.5. Mechanical Properties, Fracture Morphology, and Organisation Analysis

The mechanical properties of copper/aluminium dissimilar joints are influenced by various microstructural factors, such as grain size and IMCs. During dissimilar copper/aluminium welding, when the welding temperature exceeds 120 °C, a metallurgical reaction occurs between aluminium and copper, producing hard and brittle IMCs that affect the joint properties [32].
Figure 14a,b show the tensile strength and elongation at break of the copper/aluminium joints welded using different tool and parameters, where the rotational speed was fixed at 1400 rpm and the welding speed was gradually increased. The results indicated that the tensile strength and elongation of the joints welded using threaded and unthreaded tools initially increased and then decreased as the welding speed increased. At a welding speed of 80 mm/min, the tensile strengths of the joints obtained using the two tools reached their maximum values. The tensile strength of the joint welded using a threaded tool was 236 MPa, which is 94% of the copper base material’s strength and 86.3% of the aluminium base material’s strength. However, due to the brittleness of the stir zone, the elongation rate was 5.4%, which is lower than that of the two base materials. This decrease in elongation was primarily related to the formation of hard and brittle IMCs in the copper–aluminium joints. The tensile strength of the joint with the unthreaded tool was 183 MPa, with an elongation of 3.6%. These results indicate that the performance of the joints welded with the threaded tool improved by 29% compared to that of the joints welded using the unthreaded tool.
Figure 14c–f show the fracture morphologies of the joints welded using different tools, and Table 9 lists the fracture characteristics for the different tools. When using the unthreaded tool (refer to Figure 14c,d), the fracture location of the joint was mainly concentrated at the copper–aluminium bonding surface and the heat-affected zone (HAZ) on the aluminium side. The fracture mode was dominated by brittle fractures with low toughness, which was primarily attributed to the insufficient heat production, slow diffusion of elements, and poor material bonding at the welded joint. When a threaded tool was used (refer to Figure 14e,f), the fracture surface of the joint was primarily located in the aluminium side HAZ and TMAZ, with the fracture mode being ductile fracture and ductile–brittle fracture. Based on the temperature field simulation results, the threaded tool provided higher heat input, leading to an increased weld temperature. At higher temperatures, a strong solid solution formed in the weld zone. The elevated temperature causes softening of the heat-affected zone (HAZ), resulting in the weld nugget strength exceeding that of the HAZ, which led to a decrease in the mechanical properties of the HAZ. At lower temperatures, the reduced bonding area in the weld nugget may contribute to the formation of cracks and void defects, potentially causing brittle fracture and a decline in mechanical performance. This further confirmed that the joint welded using the threaded tool exhibited significantly a higher tensile strength compared to the joint welded using the non-threaded tool.
Figure 15 shows the fracture scan of a joint welded using different tools. Figure 15a shows the fracture scan of the joint welded using an unthreaded tool. Figure 15b,c shows an enlarged image of two positions, 1 and 2, in the figure. Figure 15d shows an enlarged image of the joint welded using a threaded tool, and Figure 15e shows an enlarged image of Position 3. As shown in Figure 15a, tough nests and disintegration steps are visible in the fig., and the fracture mode was identified as a tough-brittle fracture, primarily occurring at the copper–aluminium bonding surface. Nearly half of the fracture surface did not consist of tough nests but instead exhibited streaks resembling water ripples, indicating insufficient mixing of the aluminium and copper. Larger copper particles were also present at the fracture location, and micro-tunnelling defects were visible at high magnification. These defects significantly affected the tensile strength of the joint and increased the potential risk of fracture. In this fracture mode, the tensile strength of the joint was 183 MPa, which is only 70% of the strength of the base material.
Figure 15d,e show a fracture scan of a joint welded using a threaded tool. The fracture was located in the HAZ on the aluminium side. In the low-magnification image, several tough sockets of different sizes, varying by approximately 10 μm, were observed. The fracture surface exhibited small equiaxed tough sockets, indicating that the fracture mode was ductile. A bright white substance was observed, which, upon EDS analysis, was found to contain an Al content of 64.38% and Cu content of 35.62%. It was identified as Al2Cu.

3.6. Microstructure

Figure 16 shows the microstructures of the joints welded using threaded and non-threaded tools, as observed using optical microscopy (OM) and scanning electron microscopy (SEM). Figure 16a shows the cross-sectional view of the joint, while Figure 16b,c show the OM images of Region 1 and Region 2, respectively. Figure 16b reveals that copper particles were randomly distributed within the aluminium matrix, and the stirred zone exhibited a swirling structure with a small number of micropores. The magnified image of Region 2 in Figure 16c shows that the copper particles ranged in size from 10 to 200 μm, with significant differences in shape and distribution. This was attributed to the pronounced fragmentation effect of the threaded tool on the copper particles, indicating significant plastic deformation during the FSW process. The material flow characteristics and patterns in the FSW of different materials were more complex than those in the FSW of same materials.
Figure 16d,e show the SEM images of Regions 1 and 3, respectively. In the images, the bright areas represent copper, and the dark areas represent aluminium. Figure 16e is an enlarged view of Region 3 from Figure 16d. As shown in Figure 16d,e, on the copper side, the image reveals a distinct interface between the base material and the molten core, while the interface on the aluminium side was less distinct. Copper particles exhibited non-uniform sizes in the aluminium matrix and flowed in a swirling pattern, indicating good stirring characteristics.
Figure 17 shows the SEM images of the cross-section of the joint welded using a threaded tool, highlighting the regions with higher hardness, along with the corresponding EDS results. As shown in Figure 17a, three points were selected: one on the copper side, one at the interface, and one on the aluminium side. The EDS results indicated a significant decrease in the copper content at the interface, which fluctuated in the vortex region, confirming the presence of copper in this area. The aluminium and magnesium contents increased significantly in the vortex region and at the connecting surface, indicating sufficient mixing of the copper and aluminium. This strongly explains the higher strength and better weld quality of the joint welded using a threaded tool. Therefore, effective material flow and sufficient mixing during the FSW of dissimilar materials are essential for achieving high-quality joints.
Figure 17b–d show the distribution of aluminium, copper, and magnesium, where copper and aluminium were the key elements responsible for the formation of the hard and brittle Al2Cu intermetallic compound.

4. Conclusions

Through a series of analyses, the effects of different tools and process parameters on the properties and microstructures of copper–aluminium friction-stir-welded joints were investigated. The main conclusions were as follows:
(1)
The numerical simulation analysis showed that in the range of 10~16 mm, the weld temperature can be increased by about 30 °C for every 2 mm increase in the tool shoulder diameter and a proportional increase in the tool diameter. The numerical simulation analysis also showed an increase in temperature of about 30 °C for every 200 r/min increase in rotational speed. As the welding speed increased, the peak temperature changed less.
(2)
The weld morphology was superior when using the threaded tool. At a welding speed of 80 mm/min, the peak weld temperature with the threaded tool was 18.1 °C higher than that with the unthreaded tool, and the area of the high-temperature zone was larger when using the threaded tool.
(3)
For a tool with a shoulder diameter of 12 mm, the process parameter that yielded the maximum mechanical performance was a welding speed of 40 mm/min. For a shoulder diameter of 16 mm, the optimal welding speed was 80 mm/min, which resulted in a 100% increase in the welding rate.
(4)
Compared to unthreaded tools, the use of threaded tools facilitated the dispersion of copper particles in the aluminium matrix, resulting in the formation of Al2Cu IMCs, which increased the tensile strength of the obtained welded joints from 183 MPa to 236 MPa, and enhanced the hardness of weld centres by 57%.
(5)
An elemental analysis of the joint welded using the threaded tool was performed using EDS. The results showed that hard and brittle IMCs, such as CuAl and Al2Cu, were generated at the joint surface, and the copper content decreased sharply. In the stirring vortex region, the distribution of copper exhibited a fluctuating trend, further verifying the presence of copper.

Author Contributions

Conceptualisation, Y.Z. and J.S.; methodology, J.S., G.L. and Y.Z.; data curation, F.S., J.S. and S.K.; writing—original draft preparation, J.S., R.L. and J.P.; visualisation J.S., J.P. and R.L.; writing—review and editing, Y.Z., F.S., S.K. and G.L.; supervision and project administration, Y.Z. and G.L.; funding acquisition, Y.Z. All authors have read and agreed to the published version of the manuscript.

Funding

This research was funded by the National Key Research and Development Program of China (NKRDP) (for the project “High-Precision Processing Technology of Embedded Groove Substrate For In-Situ Manufacturing of Sensitive Elements in Bearing Inner/Outer Rings”, grant number 2023YFB3406105) and the National Natural Science Foundation of China (NSFC) (for project “Research on Evolutionary Mechanisms of Ultra-Low-Temperature Deformation Dislocations in Optical Microcrystalline Aluminum and Methods of Tissue Regulation”, grant number 52375398).

Data Availability Statement

The original contributions presented in the study are included in the article, further inquiries can be directed to the corresponding author.

Acknowledgments

The authors thanks Shenzhen Tairuiqi Hardware Electronics Co., Ltd. and Dongguan Tairuiqi Precision Technology Co., Ltd. for providing project funding (“Research on Welding Process of Aluminum Alloy Components” project) and equipment support. The authors also thank Yuxun Zhang, School of Mechanical Engineering, for providing computational equipment.

Conflicts of Interest

Author Jinlong Shi, Guofang Liao, Ruixiang Li, Jianyun Peng, Shaoqun Kuang were employed by the company Shenzhen Tairuiqi Hardware Electronics Co., Ltd. and Dongguan Tairuiqi Precision Technology Co., Ltd. The remaining authors declare that the research was conducted in the absence of any commercial or financial relationships that could be construed as a potential conflict of interest.

References

  1. Lacaze, J.; Tierce, S.; Lafont, M.-C.; Thebault, Y.; Pébère, N.; Mankowski, G.; Blanc, C.; Robidou, H.; Vaumousse, D.; Daloz, D. Study of the microstructure resulting from brazed aluminium materials used in heat exchangers. Mater. Sci. Eng. A 2005, 413, 317–321. [Google Scholar] [CrossRef]
  2. Hirsch, J. Recent development in aluminium for automotive applications. Trans. Nonferrous Met. Soc. 2014, 24, 1995–2002. [Google Scholar] [CrossRef]
  3. Mabuwa, S.; Msomi, V.; Muribwathoho, O.; Motshwanedi, S.S. The microstructure and mechanical properties of the friction stir processed TIG-welded aerospace dissimilar aluminium alloys. Mater. Today 2021, 46, 658–664. [Google Scholar] [CrossRef]
  4. Pandian, V.; Kannan, S. Numerical prediction and experimental investigation of aerospace-grade dissimilar aluminium alloy by friction stir welding. J. Manuf. Process. 2020, 54, 99–108. [Google Scholar] [CrossRef]
  5. Çam, G.; İpekoğlu, G.; Tarık Serindağ, H. Effects of use of higher strength interlayer and external cooling on properties of friction stir welded AA6061-T6 joints. Sci. Technol. Weld Join. 2014, 19, 715–720. [Google Scholar] [CrossRef]
  6. Su, Y.; Li, W.; Shen, J.; Bergmann, L.; dos Santos, J.F.; Klusemann, B.; Vairis, A. Comparing the fatigue performance of Ti-4Al-0.005 B titanium alloy T-joints, welded via different friction stir welding sequences. Mater. Sci. Eng. A 2022, 859, 144227. [Google Scholar] [CrossRef]
  7. Du, S.; Liu, H.; Jiang, M.; Hu, Y.; Zhou, L. Eliminating the cavity defect and improving mechanical properties of TA5 alloy joint by titanium alloy supporting friction stir welding. J. Manuf. Process. 2021, 69, 215–222. [Google Scholar] [CrossRef]
  8. Liu, J.; Wu, B.; Wang, Z.; Li, C.; Chen, G.; Miao, Y. Microstructure and mechanical properties of aluminum-steel dissimilar metal welded using arc and friction stir hybrid welding. Mater. Des. 2023, 225, 111520. [Google Scholar] [CrossRef]
  9. Mehta, K.; Badheka, V. Influence of tool design and process parameters on dissimilar friction stir welding of copper to AA6061-T651 joints. J. Adv. Manuf. Technol. 2015, 80, 2073–2082. [Google Scholar] [CrossRef]
  10. Mehta, K.; Badheka, V. Influence of tool pin design on properties of dissimilar copper to aluminum friction stir welding. Trans. Nonferrous Met. Soc. 2017, 27, 36–54. [Google Scholar] [CrossRef]
  11. Sharma, N.; Siddiquee, A.; Khan, Z.; Mohammed, M. Material stirring during FSW of Al–Cu: Effect of pin profile. Mater. Manuf. Process. 2018, 33, 786–794. [Google Scholar] [CrossRef]
  12. Akinlabi, E. Effect of shoulder size on weld properties of dissimilar metal friction stir welds. J. Mater. Eng. Perform. 2012, 21, 1514–1519. [Google Scholar] [CrossRef]
  13. Trimble, D.; O’donnell, G.; Monaghan, J. Characterisation of tool shape and rotational speed for increased speed during friction stir welding of AA2024-T3. J. Manuf. Process. 2015, 17, 141–150. [Google Scholar] [CrossRef]
  14. Scialpi, A.; De Filippis, L.; Cavaliere, P. Influence of shoulder geometry on microstructure and mechanical properties of friction stir welded 6082 aluminium alloy. Mater. Des. 2007, 28, 1124–1129. [Google Scholar] [CrossRef]
  15. Kumar, K.; Kailas, S.; Srivatsan, T. Influence of tool geometry in friction stir welding. Mater. Manuf. Process. 2008, 23, 188–194. [Google Scholar] [CrossRef]
  16. Chauhan, P.; Jain, R.; Pal, S.; Singh, S. Modeling of defects in friction stir welding using coupled Eulerian and Lagrangian method. J. Manuf. Process. 2018, 34, 158–166. [Google Scholar] [CrossRef]
  17. Bisadi, H.; Tavakoli, A.; Sangsaraki, M.; Sangsaraki, K. The influences of rotational and welding speeds on microstructures and mechanical properties of friction stir welded Al5083 and commercially pure copper sheets lap joints. Mater. Des. 2013, 43, 80–88. [Google Scholar] [CrossRef]
  18. Ghosh, M.; Kumar, K.; Mishra, R. Friction stir lap welded advanced high strength steels: Microstructure and mechanical properties. Mater. Sci. Eng. A 2011, 528, 8111–8119. [Google Scholar] [CrossRef]
  19. Devarajan, K.; Karuppanan, V.V.S.; Duraisamy, T.; Bhavirisetty, S.K.; Laxmaiah, G.; Chauhan, P.K.; Razak, A.; Asif, M.; Linul, E. Experimental investigation and characterization of friction stir spot-welded dissimilar aluminum copper metallic lap joints. ACS Omega 2023, 8, 35706–35721. [Google Scholar] [CrossRef]
  20. Chen, Y.Y. Study on Microstructure and Properties of Friction Stir Welded Joints of Copper-Aluminum Dissimilar Metals. Master’s Thesis, Chongqing Jiaotong University, Chongqing, China, 2024. [Google Scholar]
  21. Tehrani-Moghadam, H.; Jafarian, H.; Heidarzadeh, A.; Eivani, A.; Do, H.; Park, N. Achieving extraordinary strength and ductility in TRIP steels through stabilization of austenite up to 99.8% by friction stir welding. Mater. Sci. Eng. A 2020, 773, 138876. [Google Scholar] [CrossRef]
  22. Wang, C.J. Study on Friction Stir Welding Process and Mechanical Behavior of Aluminum/Copper Dissimilar Metal Joints. Master’s Thesis, Shijiazhuang Tiedao University, Shijiazhuang, China, 2023. [Google Scholar]
  23. Che, Q.Y. Study on Microstructure and Properties of Friction Stir Welded Joints of Al/Cu Dissimilar Alloys. Master’s Thesis, Xi’an University of Architecture and Technology, Xi’an, China, 2018. [Google Scholar]
  24. Zhang, Z.; Zhang, H.-w. Effect of contact model onnumerical simulation of friction stir welding. Acta Metall. Sin. 2008, 44, 85–90. [Google Scholar]
  25. ASTM E8/E8M-16a; Standard Test Methods for Tension Testing of Metallic Materials. ASTM International: West Conshohocken, PA, USA, 2016.
  26. Al-Badour, F.; Merah, N.; Shuaib, A.; Bazoune, A. Coupled Eulerian Lagrangian finite element modeling of friction stir welding processes. J. Mater. Process. Technol. 2013, 213, 1433–1439. [Google Scholar] [CrossRef]
  27. Li, Z.-c. Numerical Simulation of Metal Flow Behavior in Friction Stir Welding Process of Aluminum-Copper Composite Plates. Master’s Thesis, Shenyang Aerospace University, Shenyang, China, 2023. [Google Scholar]
  28. Zhu, Z.; Wang, M.; Zhang, H.; Zhang, X.; Yu, T.; Wu, Z. A Finite Element Model to Simulate Defect Formation during Friction Stir Welding. Metals 2017, 7, 256. [Google Scholar] [CrossRef]
  29. Zhu, Z.; Wang, M.; Zhang, H.; Zhang, X.; Yu, T.; Wu, Z. Simulation of material flow and defects in friction stir welding based on the CEL method. Chin. J. Nonferrous Met. 2018, 28, 294–299. [Google Scholar]
  30. Salloomi, K.N.; Al-Sumaidae, S. Coupled Eulerian-Lagrangian prediction of thermal and residual stress environments in dissimilar friction stir welding of aluminum alloys. J. Adv. Join. Process. 2021, 3, 100052. [Google Scholar] [CrossRef]
  31. Akbari, M.; Asiabaraki, H.R.; Aliha, M.R.M. Investigation of the effect of welding and rotational speed on strain and temperature during friction stir welding of AA5083 and AA7075 using the CEL approach. Eng. Res. Express 2023, 5, 025012. [Google Scholar] [CrossRef]
  32. Ouyang, J.; Yarrapareddy, E.; Kovacevic, R. Microstructural evolution in the friction stir welded 6061 aluminum alloy (T6-temper condition) to copper. J. Mater. Process. Technol. 2006, 172, 110–122. [Google Scholar] [CrossRef]
Figure 1. FSW process heat production.
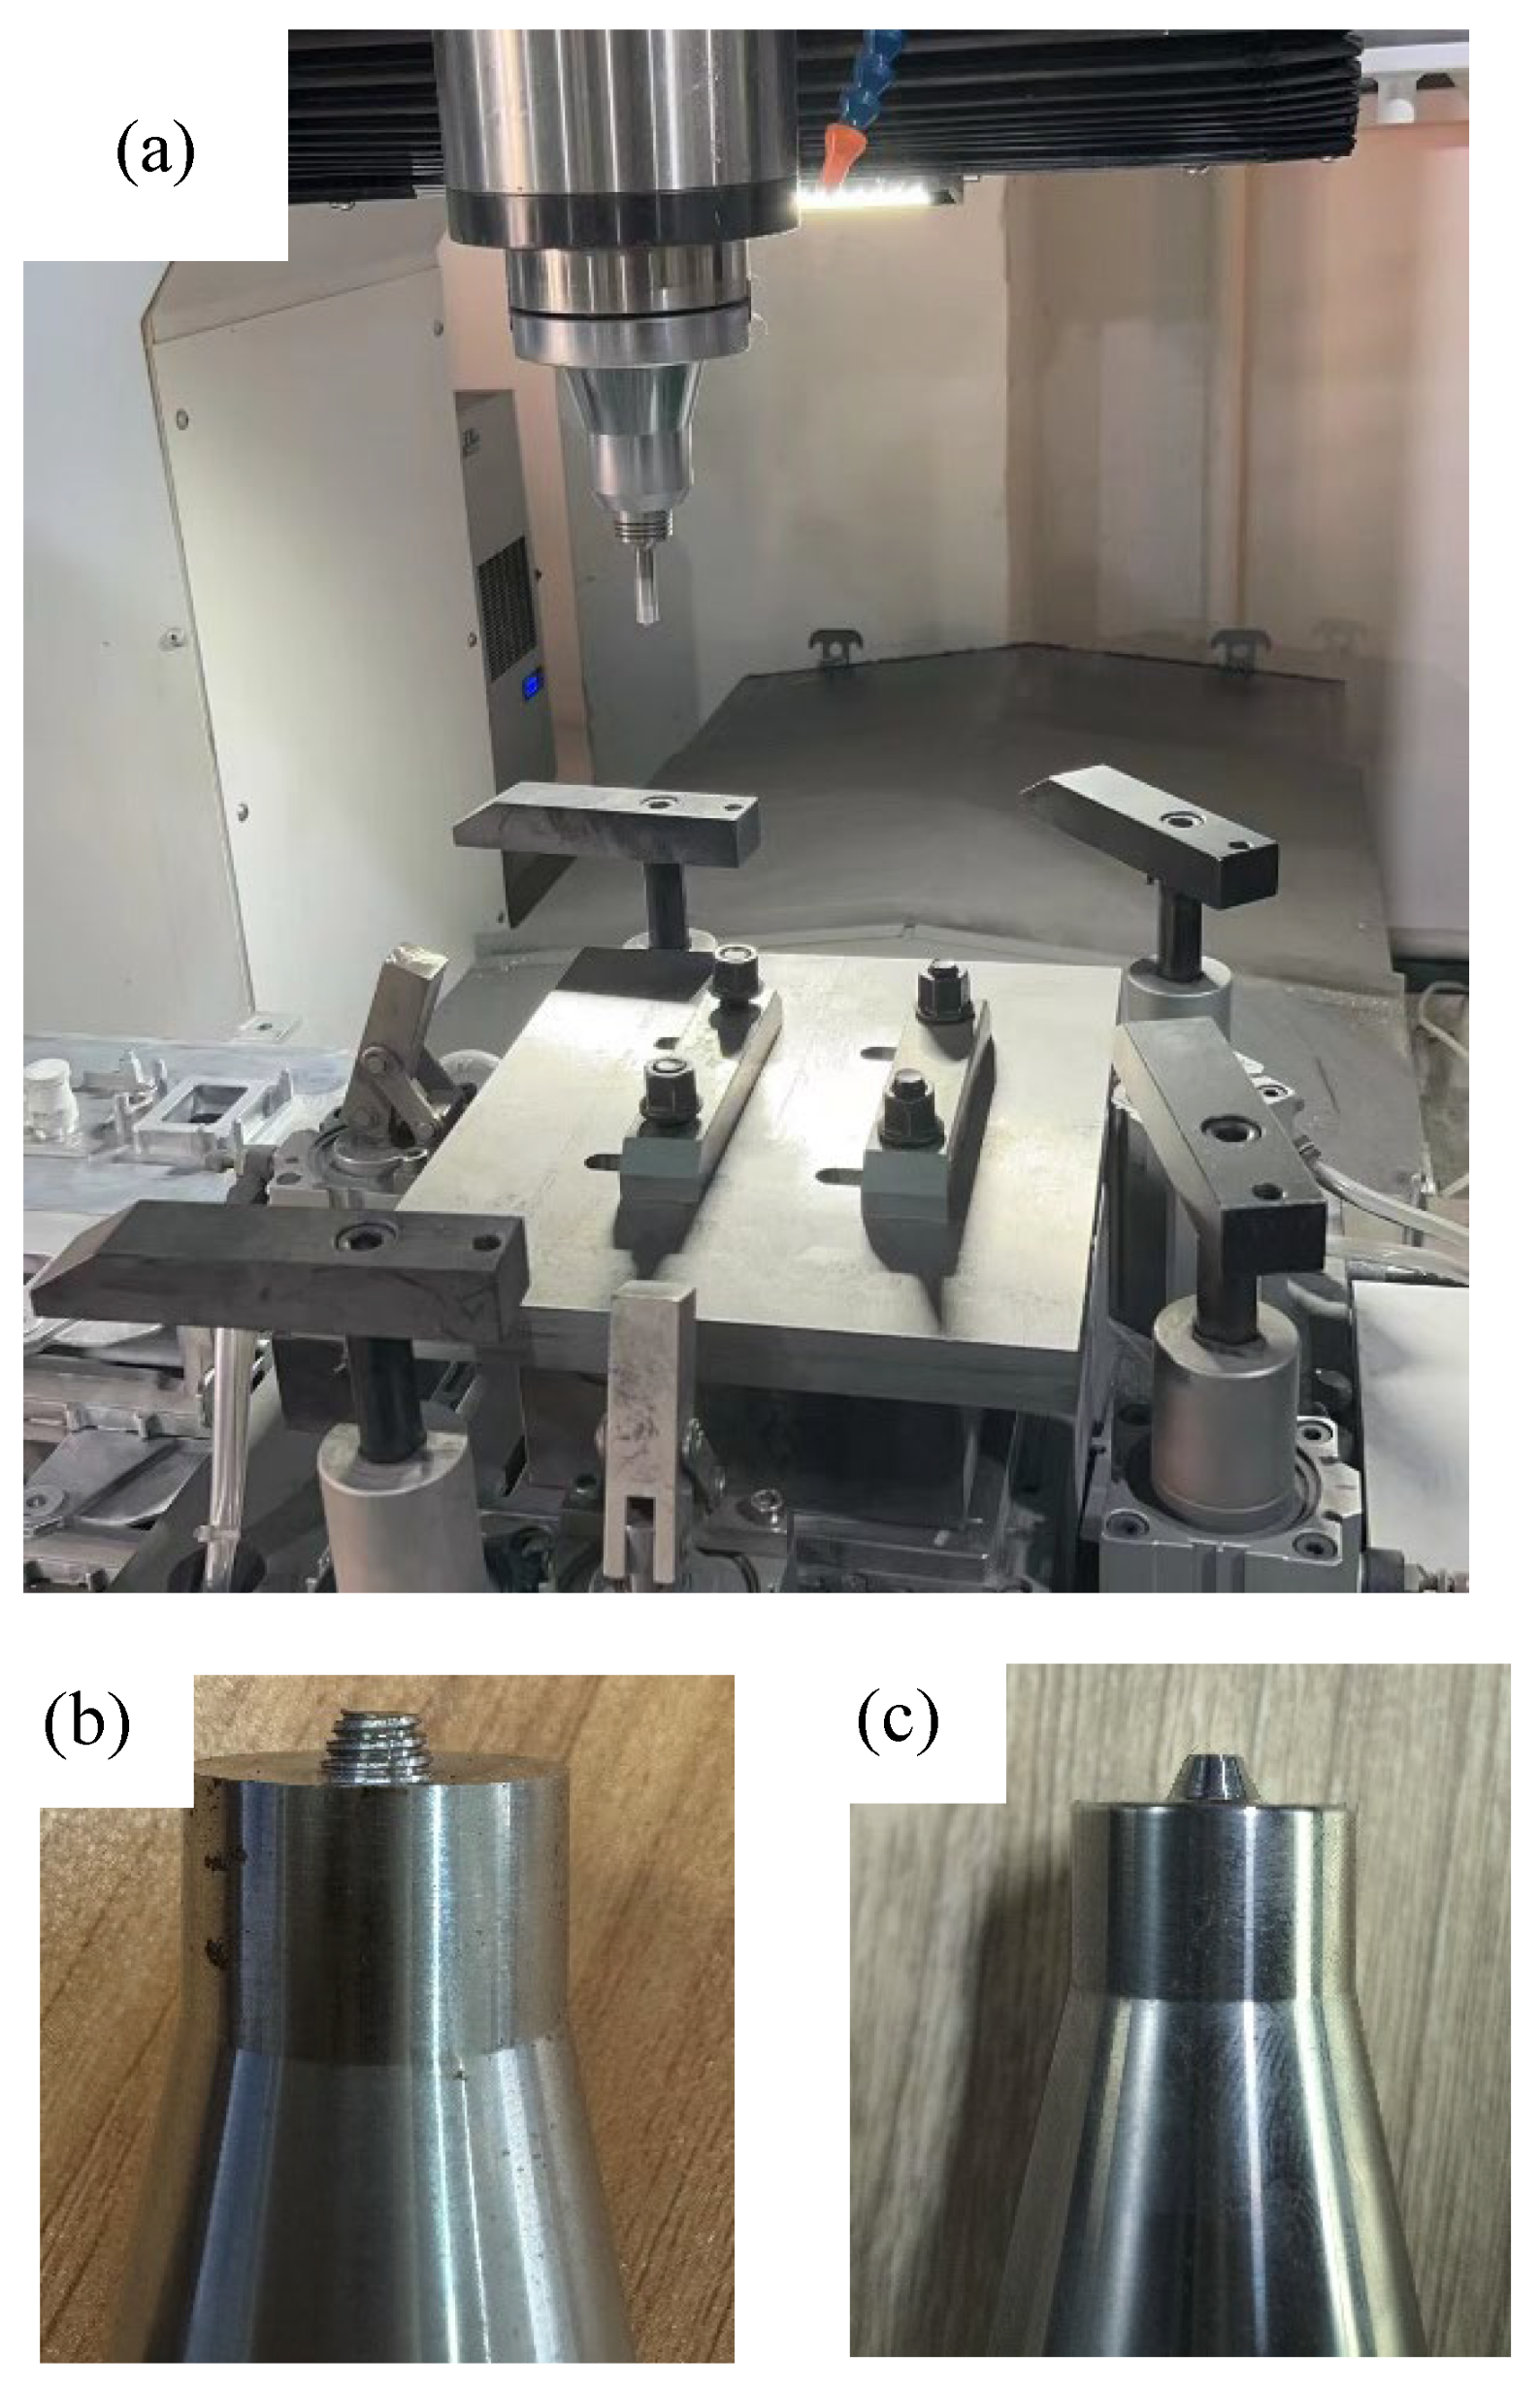
Metals 15 00193 g001
Figure 2. Friction stir welding equipment and tools ((a) FSW-LM-AM1290 friction stir welding equipment; (b) threaded tool; (c) unthreaded tool).
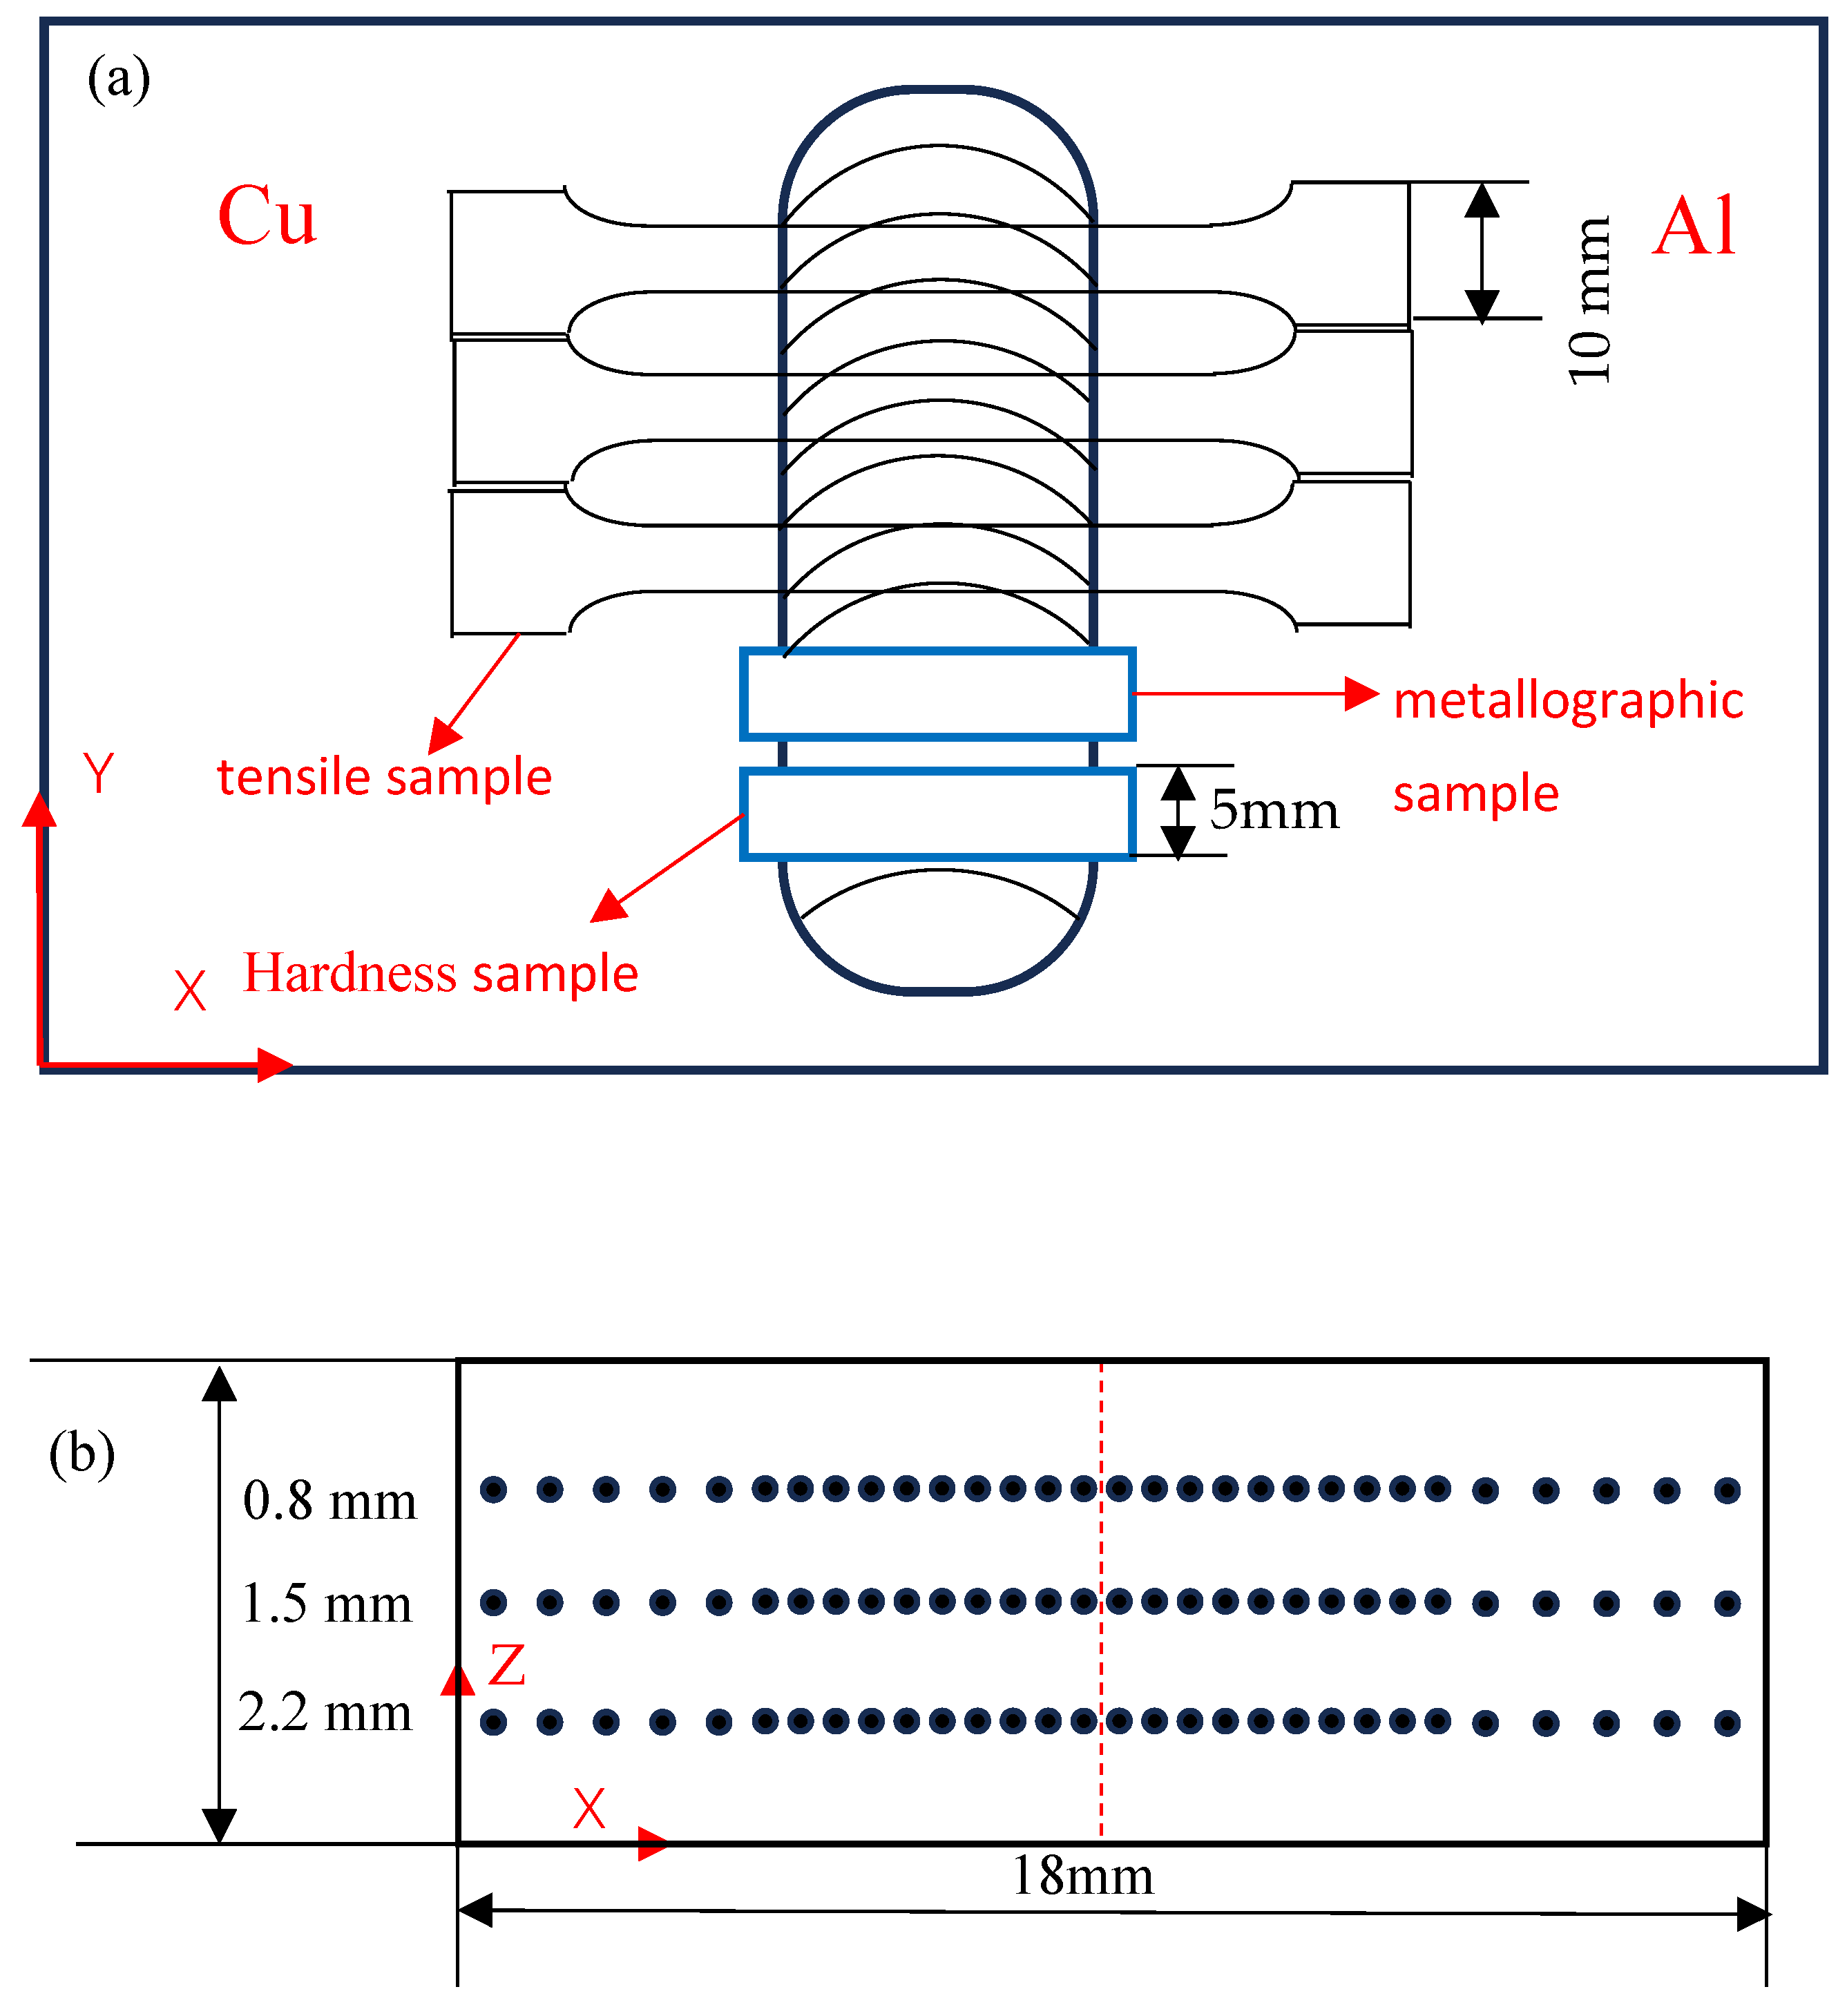
Metals 15 00193 g002
Figure 3. Metallographic sampling and hardness testing ((a) sample sampling method; (b) hardness measurement paths).
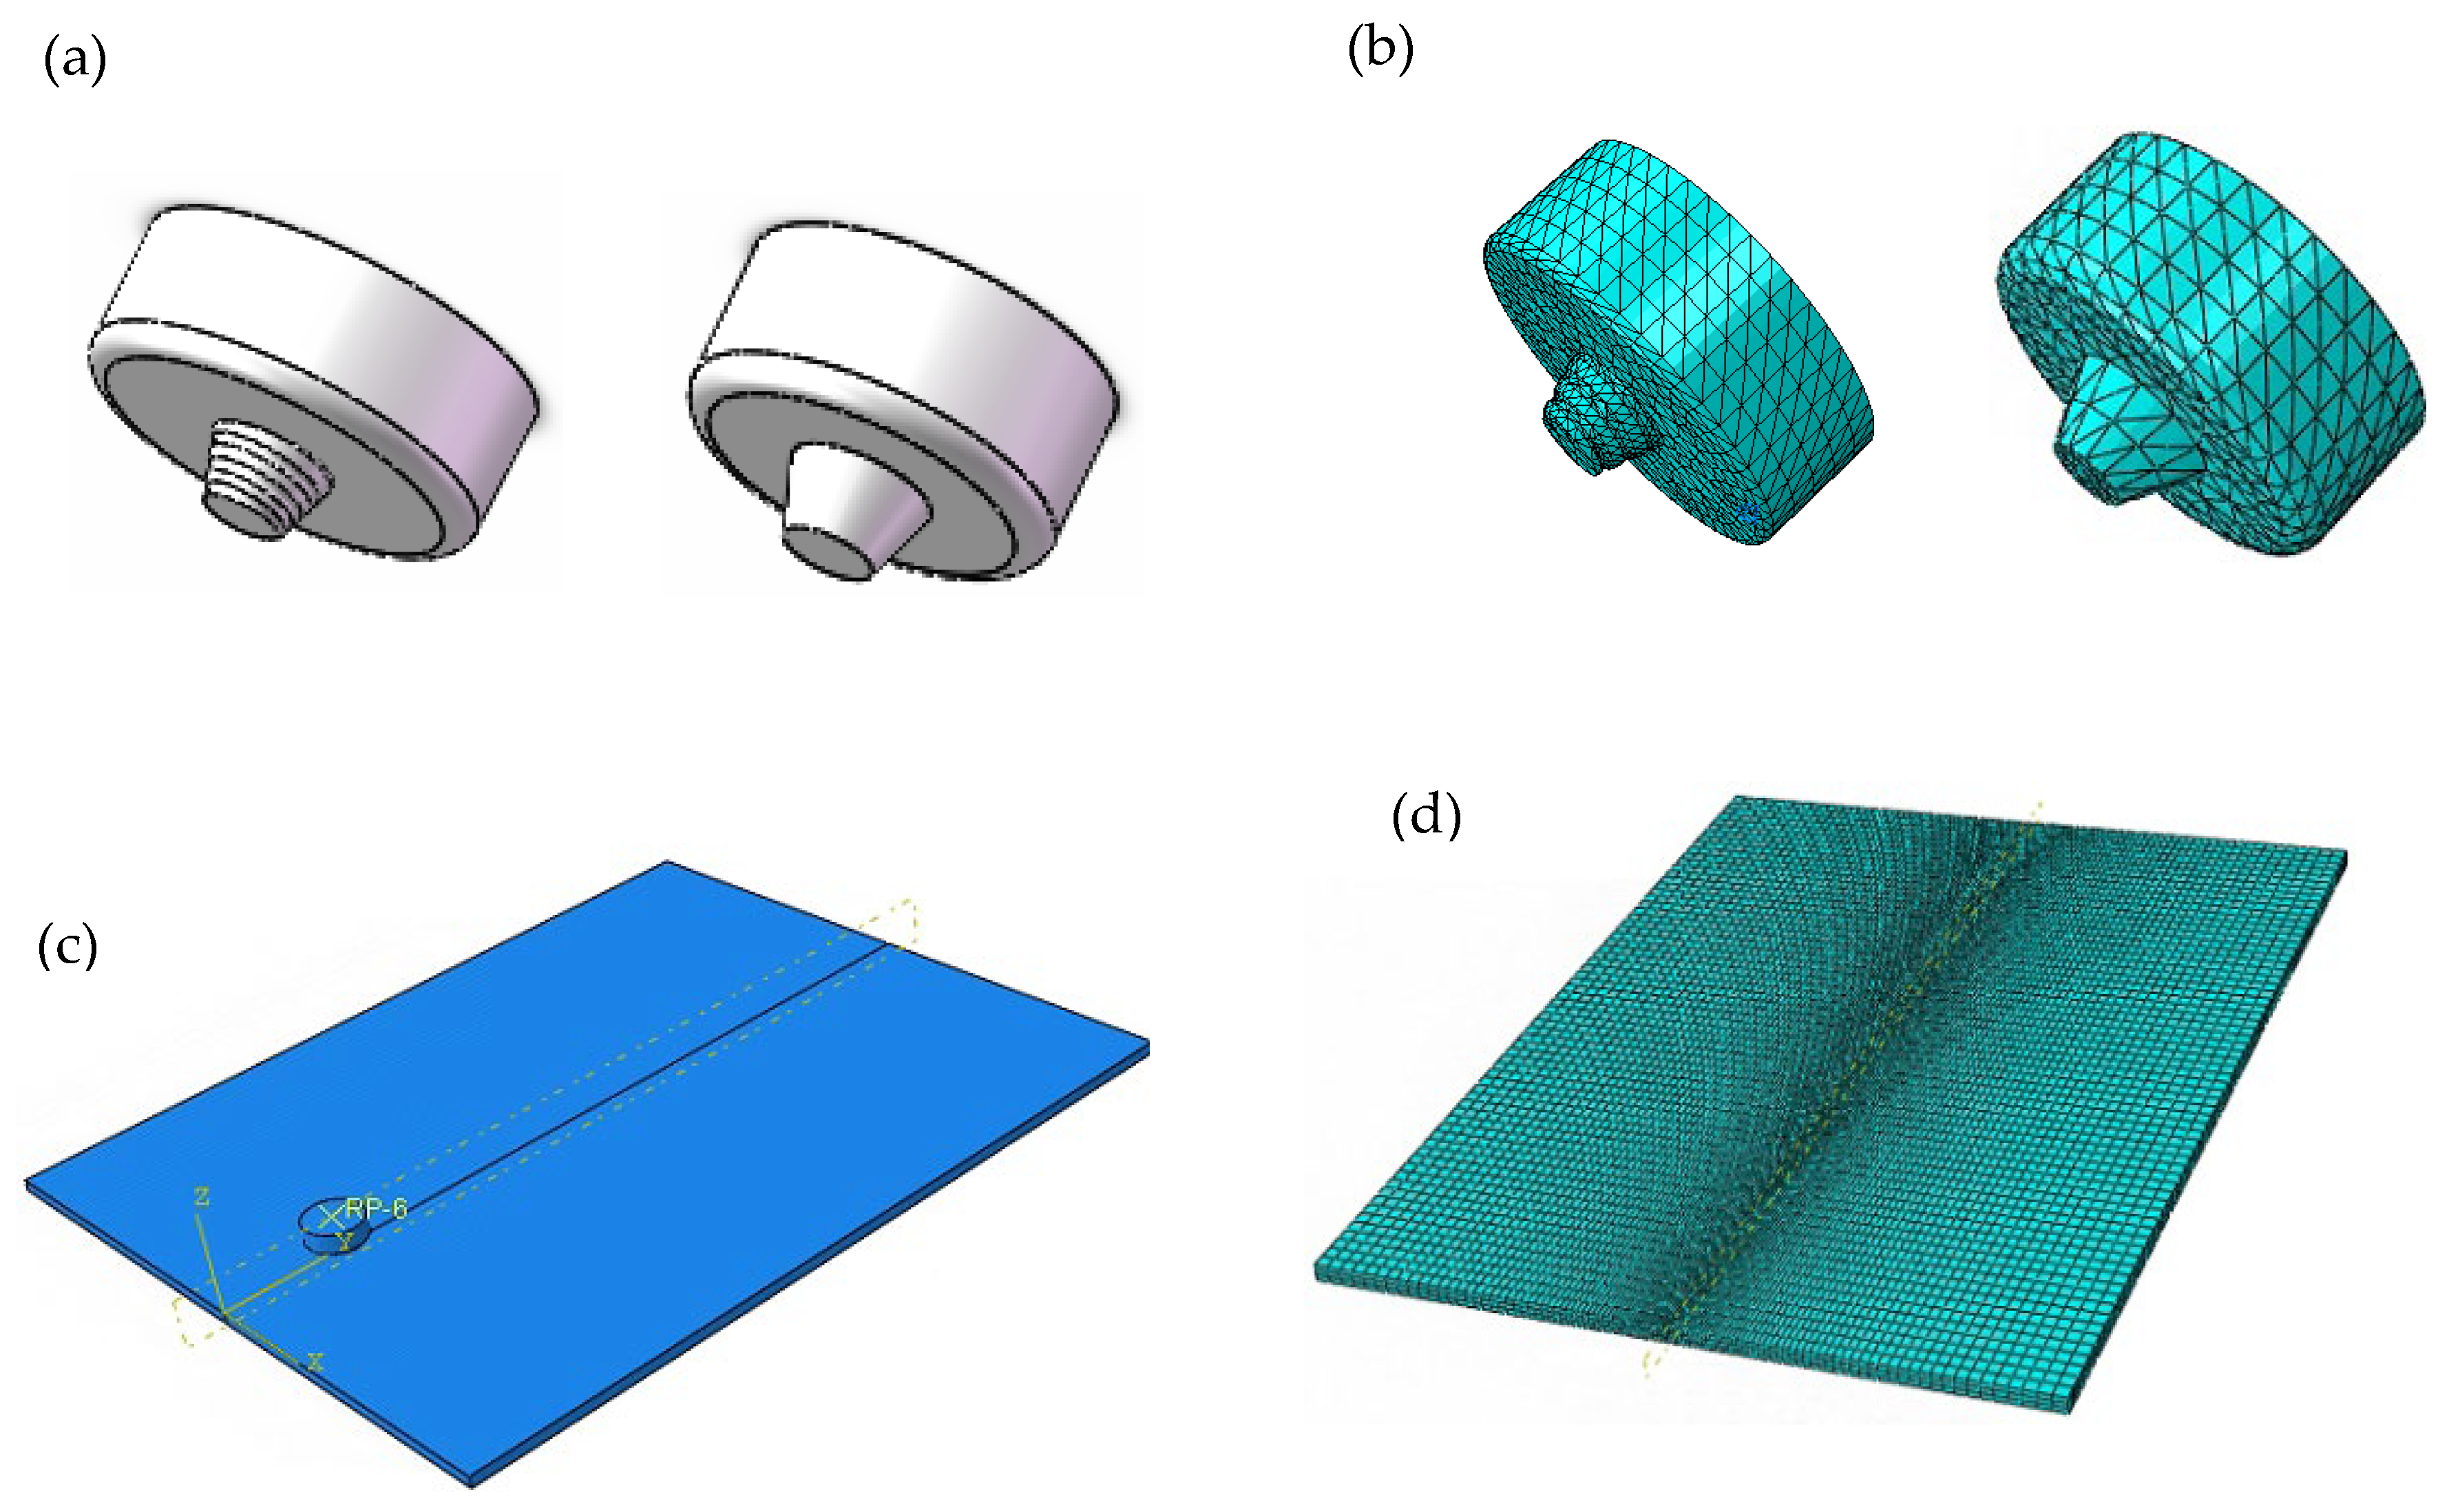
Metals 15 00193 g003
Figure 4. Schematic of the CEL model ((a) tool construction (threaded—unthreaded); (b) finite element mesh of the tool; (c) assembly diagram; (d) finite element mesh of the workpiece).
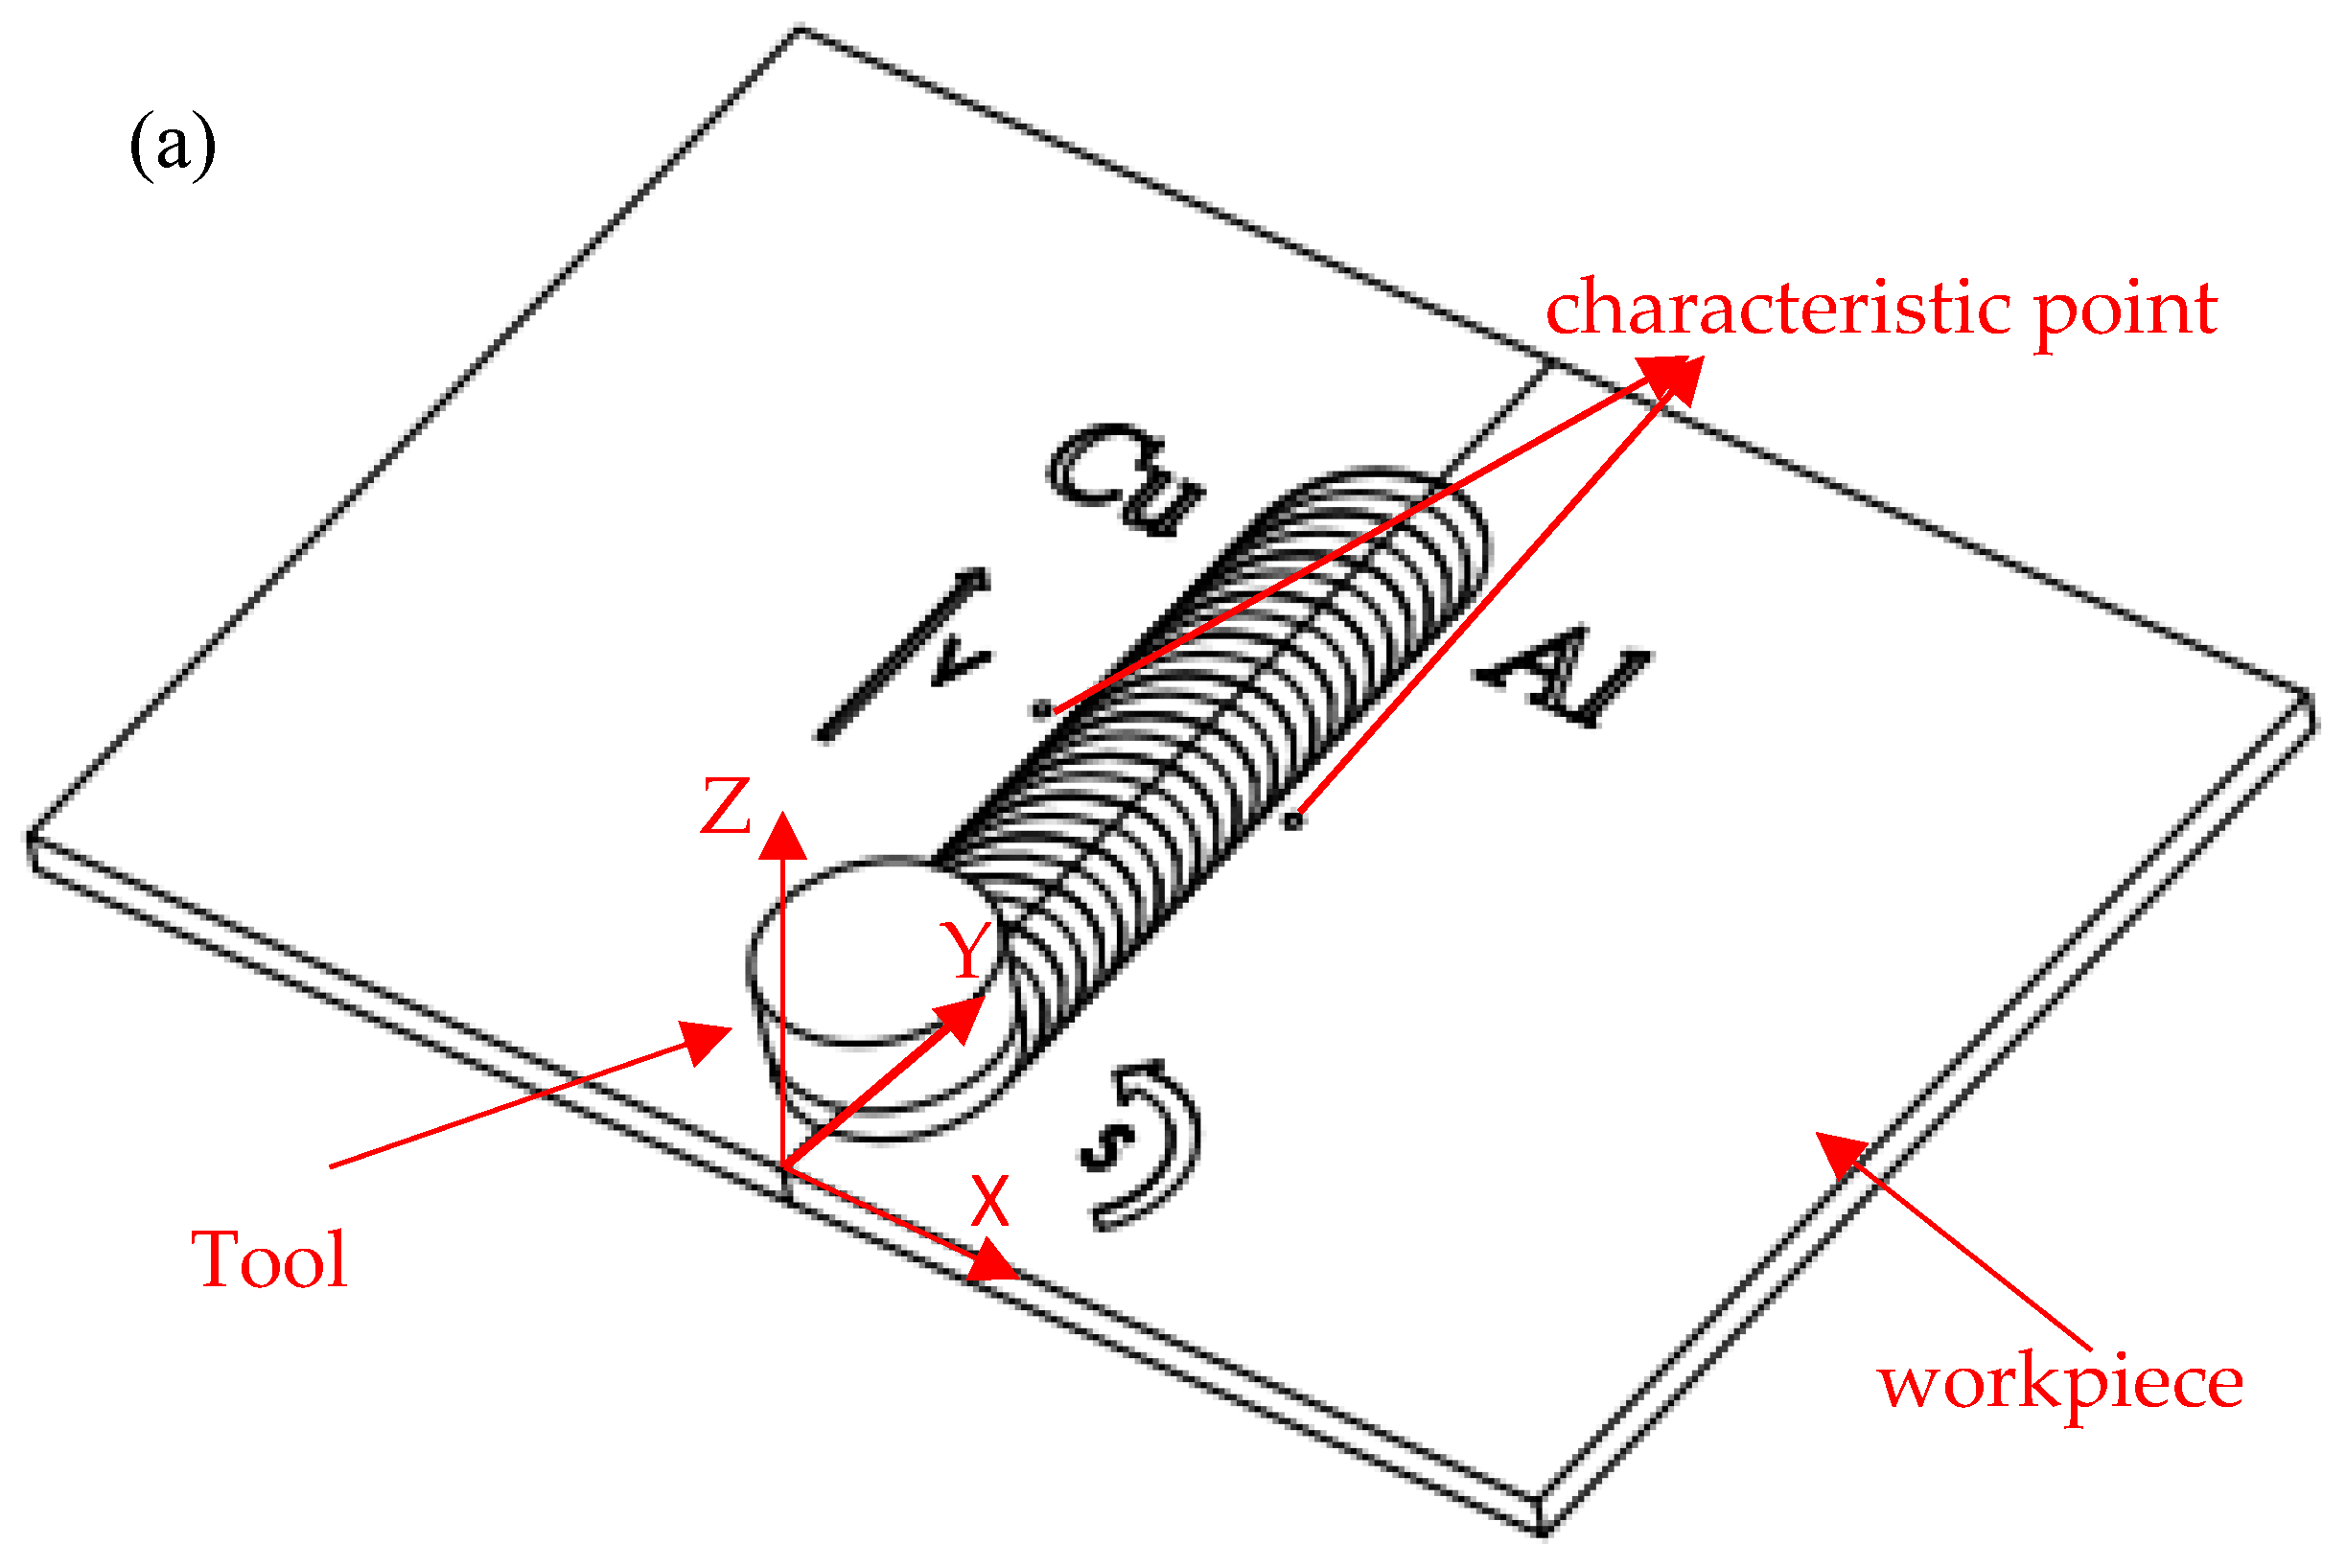
Metals 15 00193 g004
Figure 5. FSW schematic diagram ((a) welding speed direction (v), rotational speed direction (s), and characteristic points; (b) detailed distribution of characteristic points).
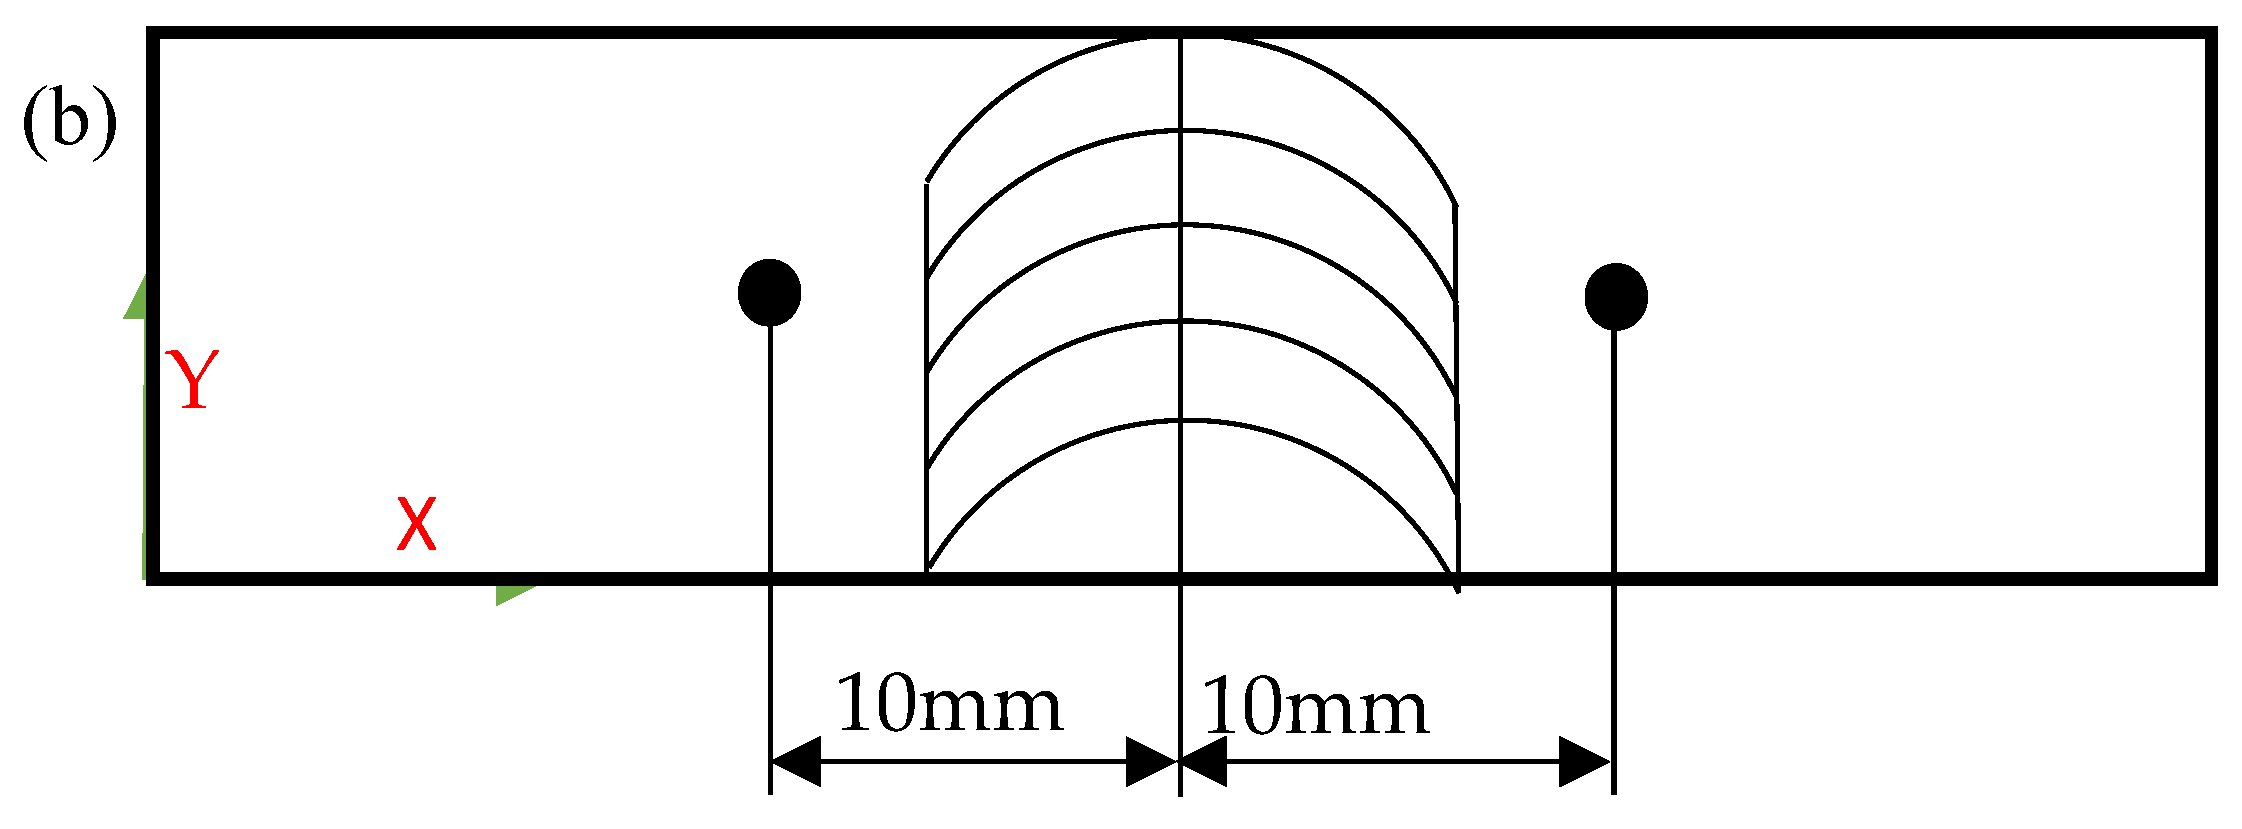
Metals 15 00193 g005aMetals 15 00193 g005b
Figure 6. Temperature measurement experiment ((a) K-type thermocouple; (b) TP700 recorder).
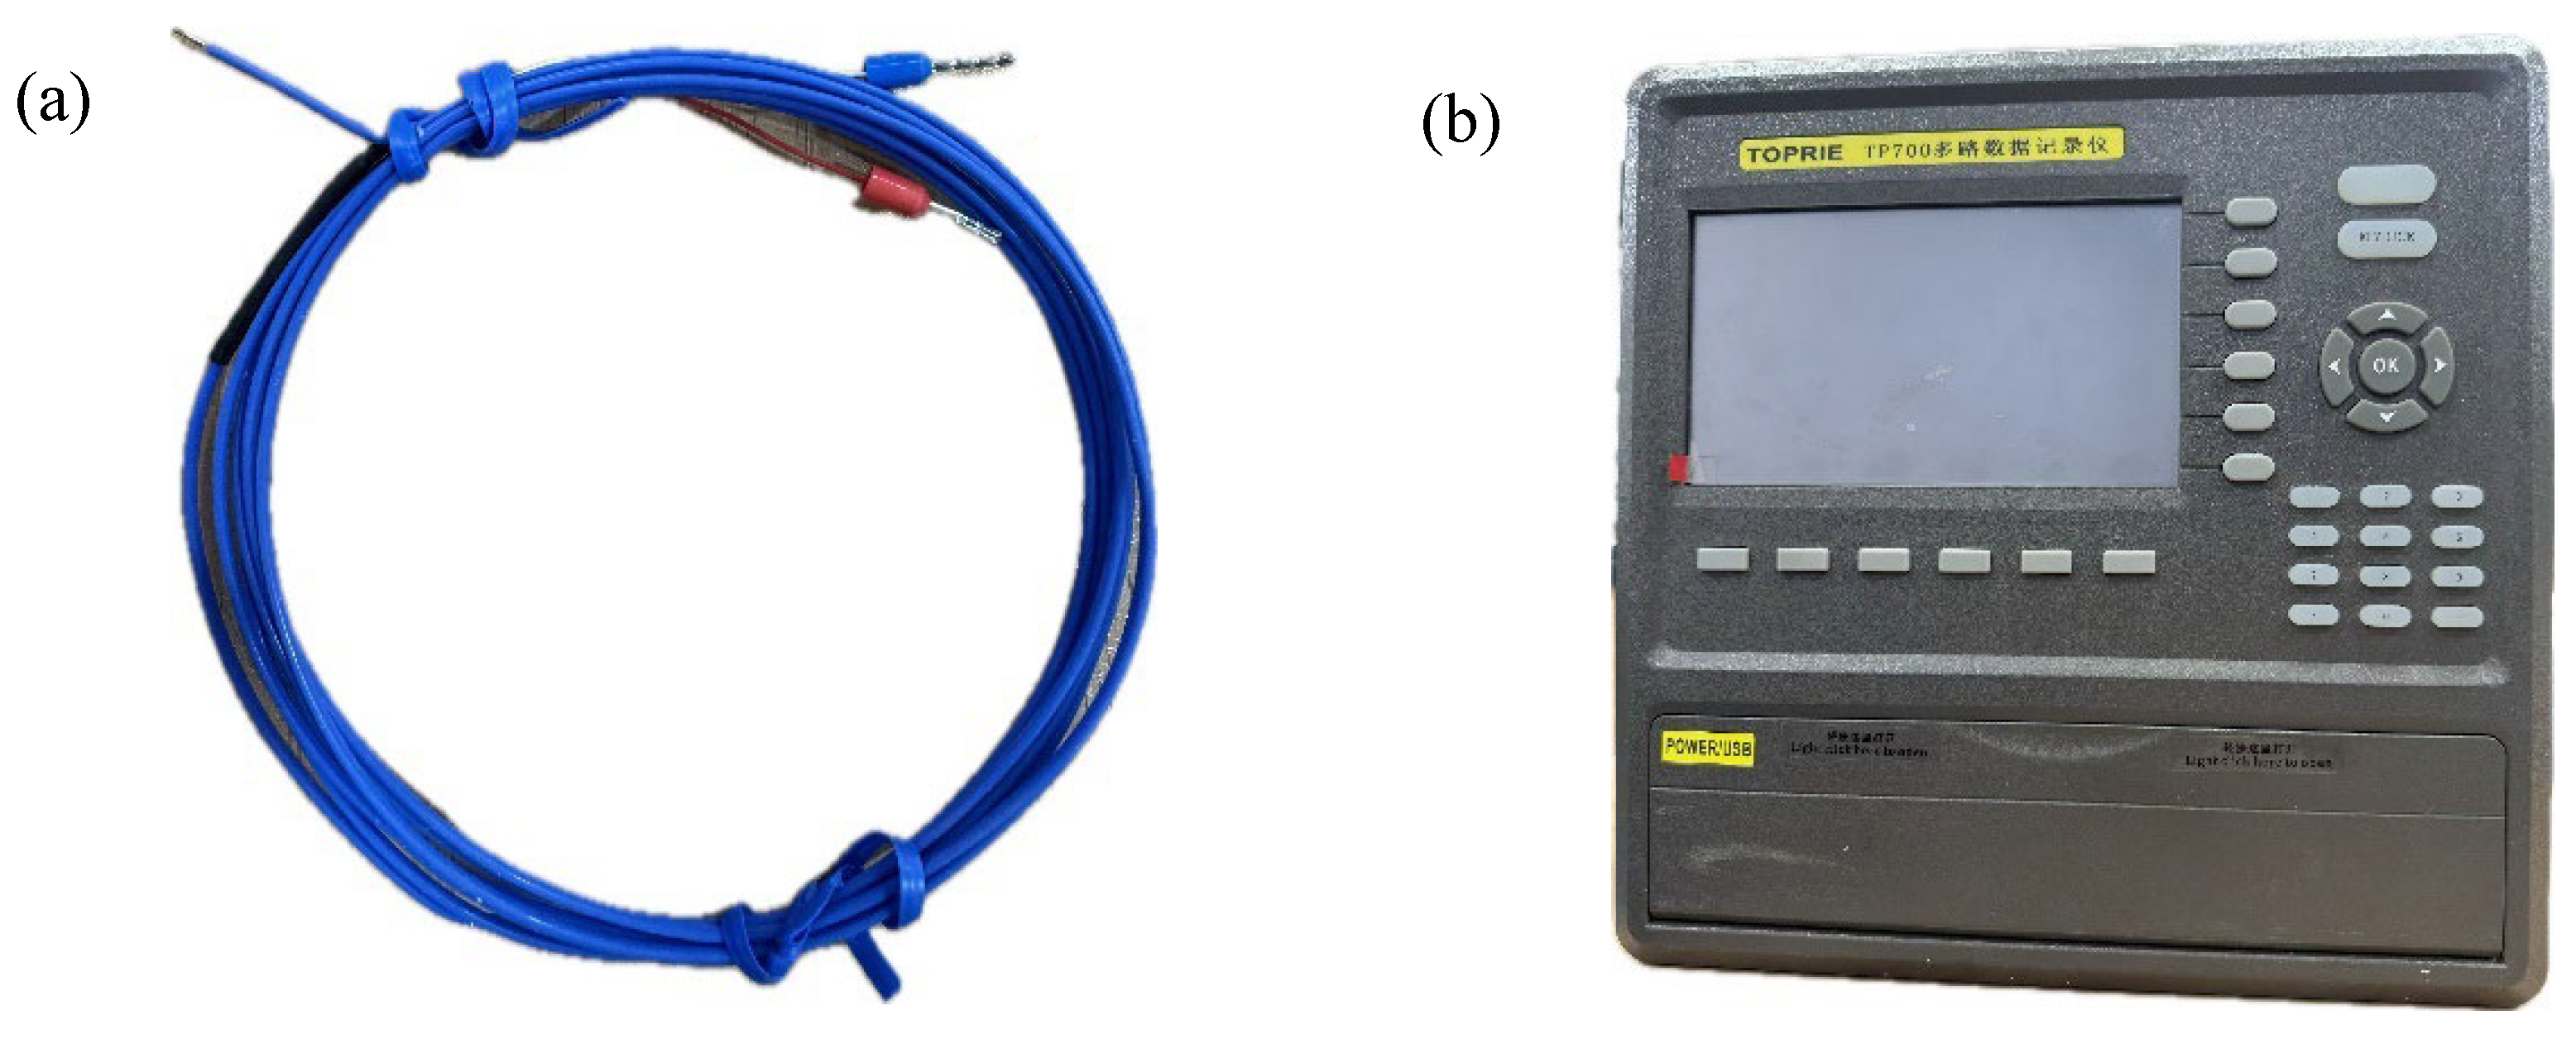
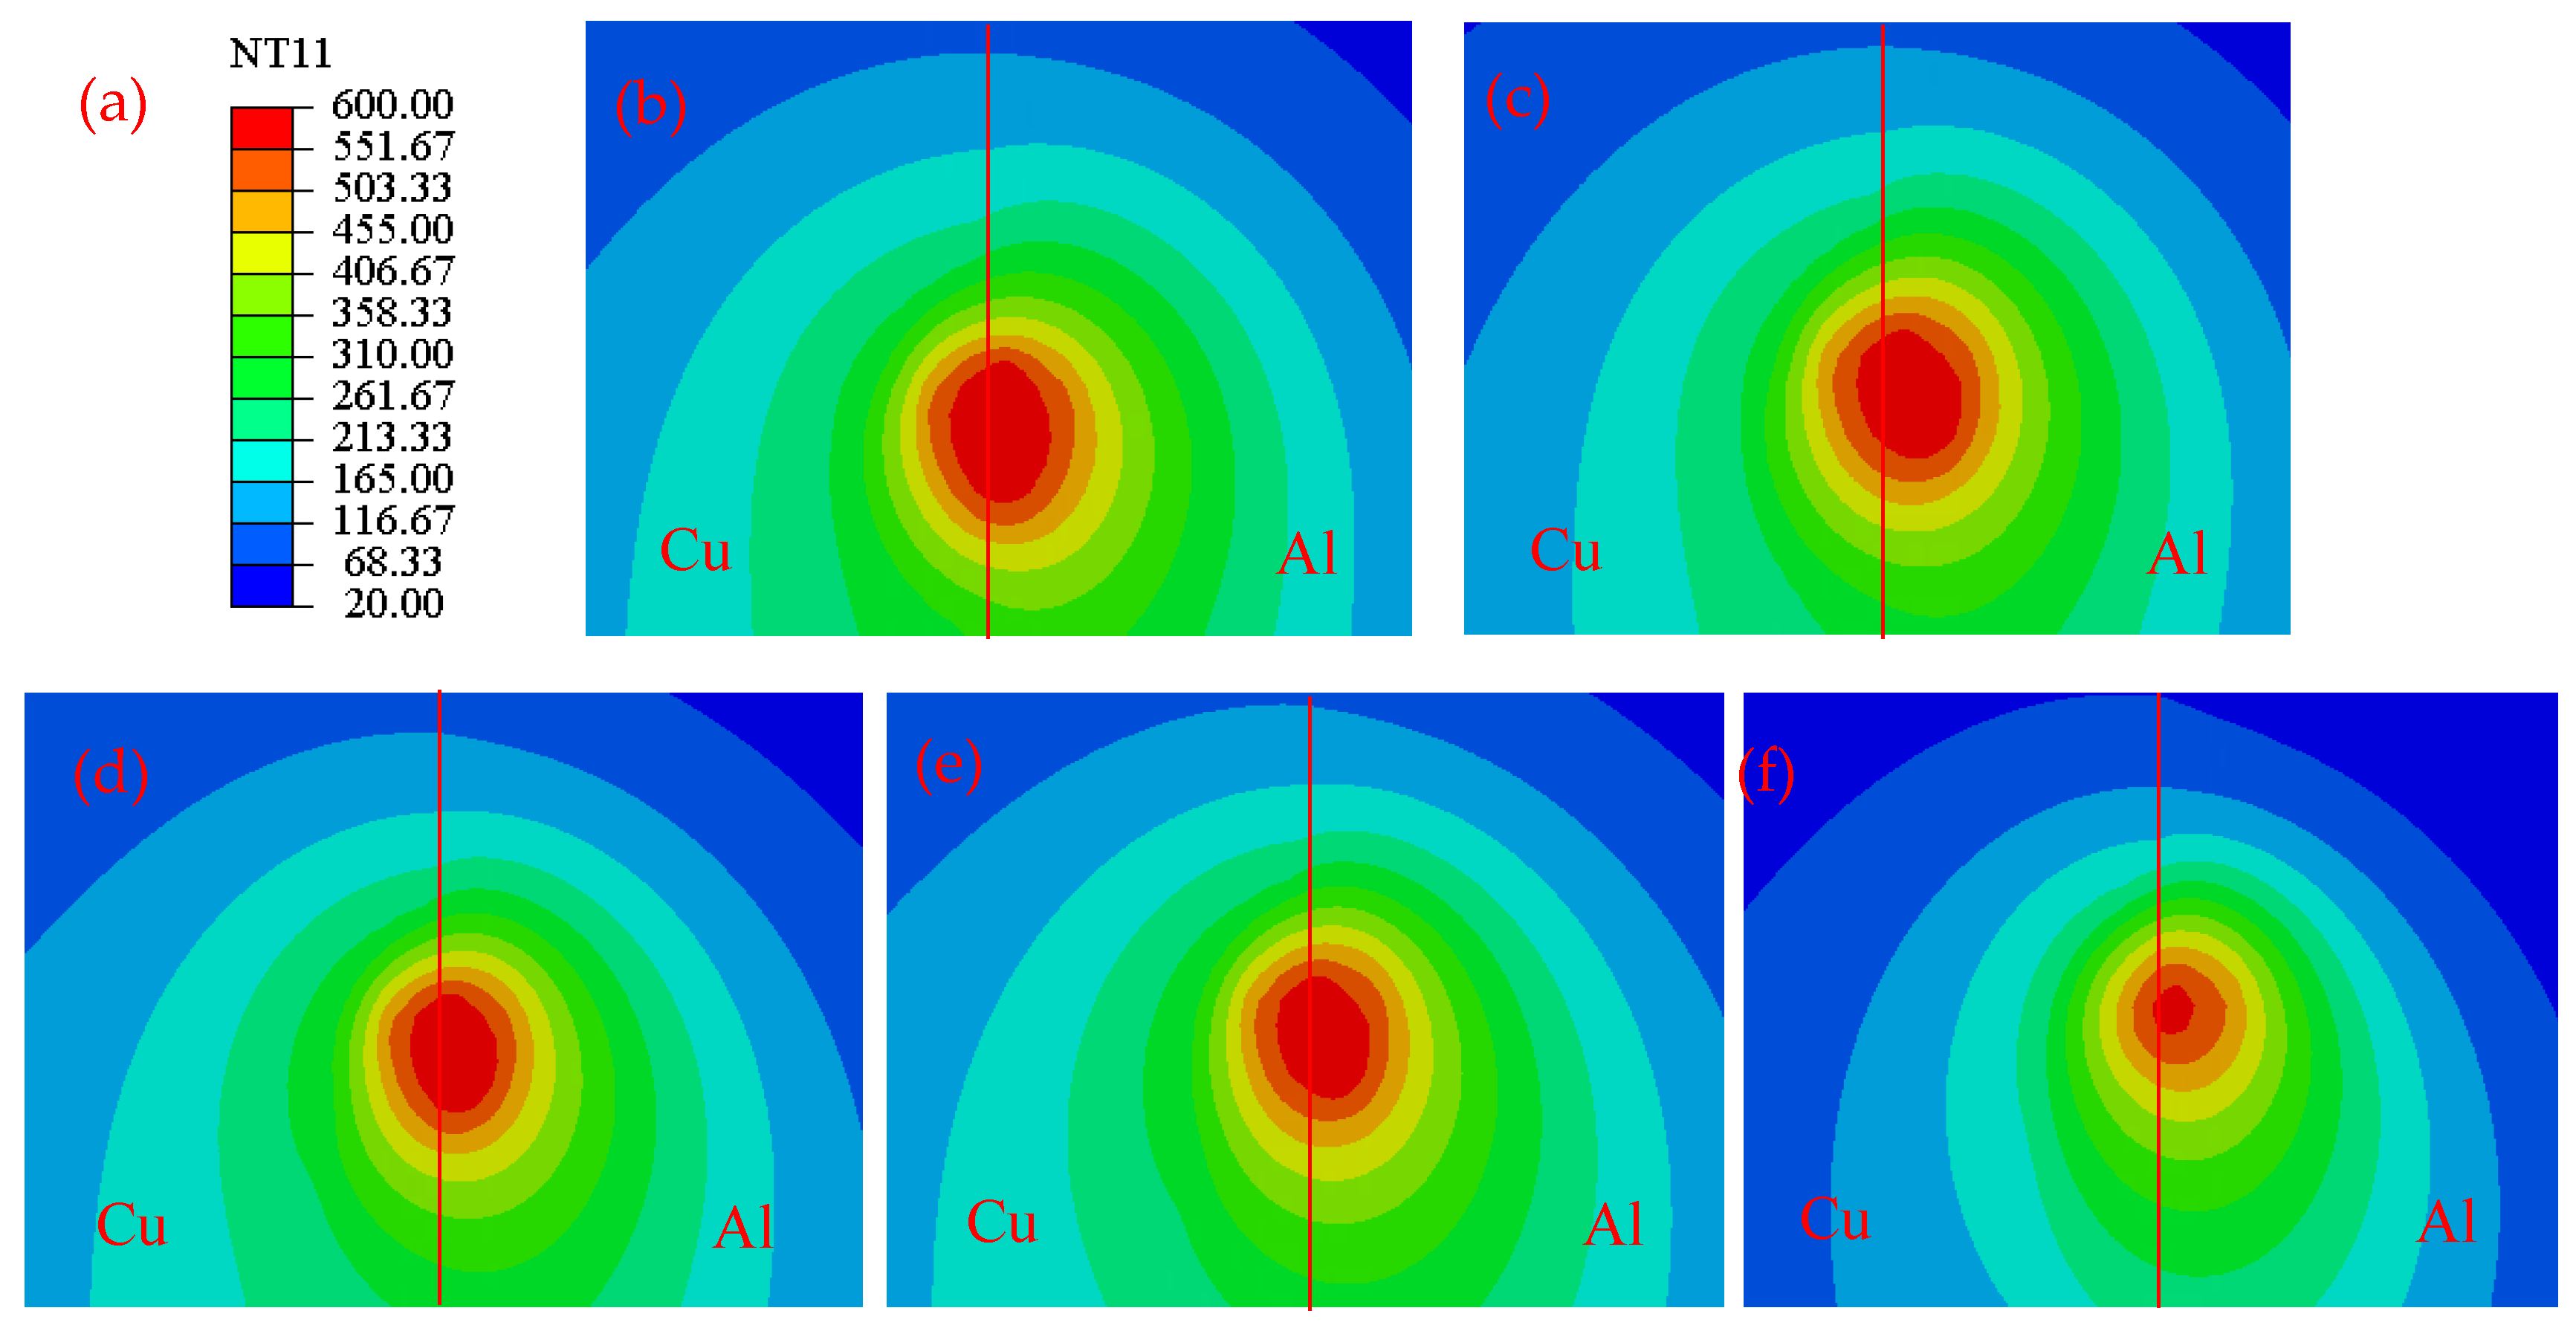
Metals 15 00193 g006
Figure 7. Temperature distributions on the weld surface with different tools ((a) temperature scale; (b) temperature contour map at a shoulder diameter of 10 mm; (c) temperature contour map at a shoulder diameter of 12 mm; (d) temperature contour map at a shoulder diameter of 14 mm; (e) temperature contour map at a shoulder diameter of 16 mm; (f) temperature contour map at a shoulder diameter of 16 mm with a threaded tool. All contour maps represent the temperature distribution at the 20th second of the stable welding stage).
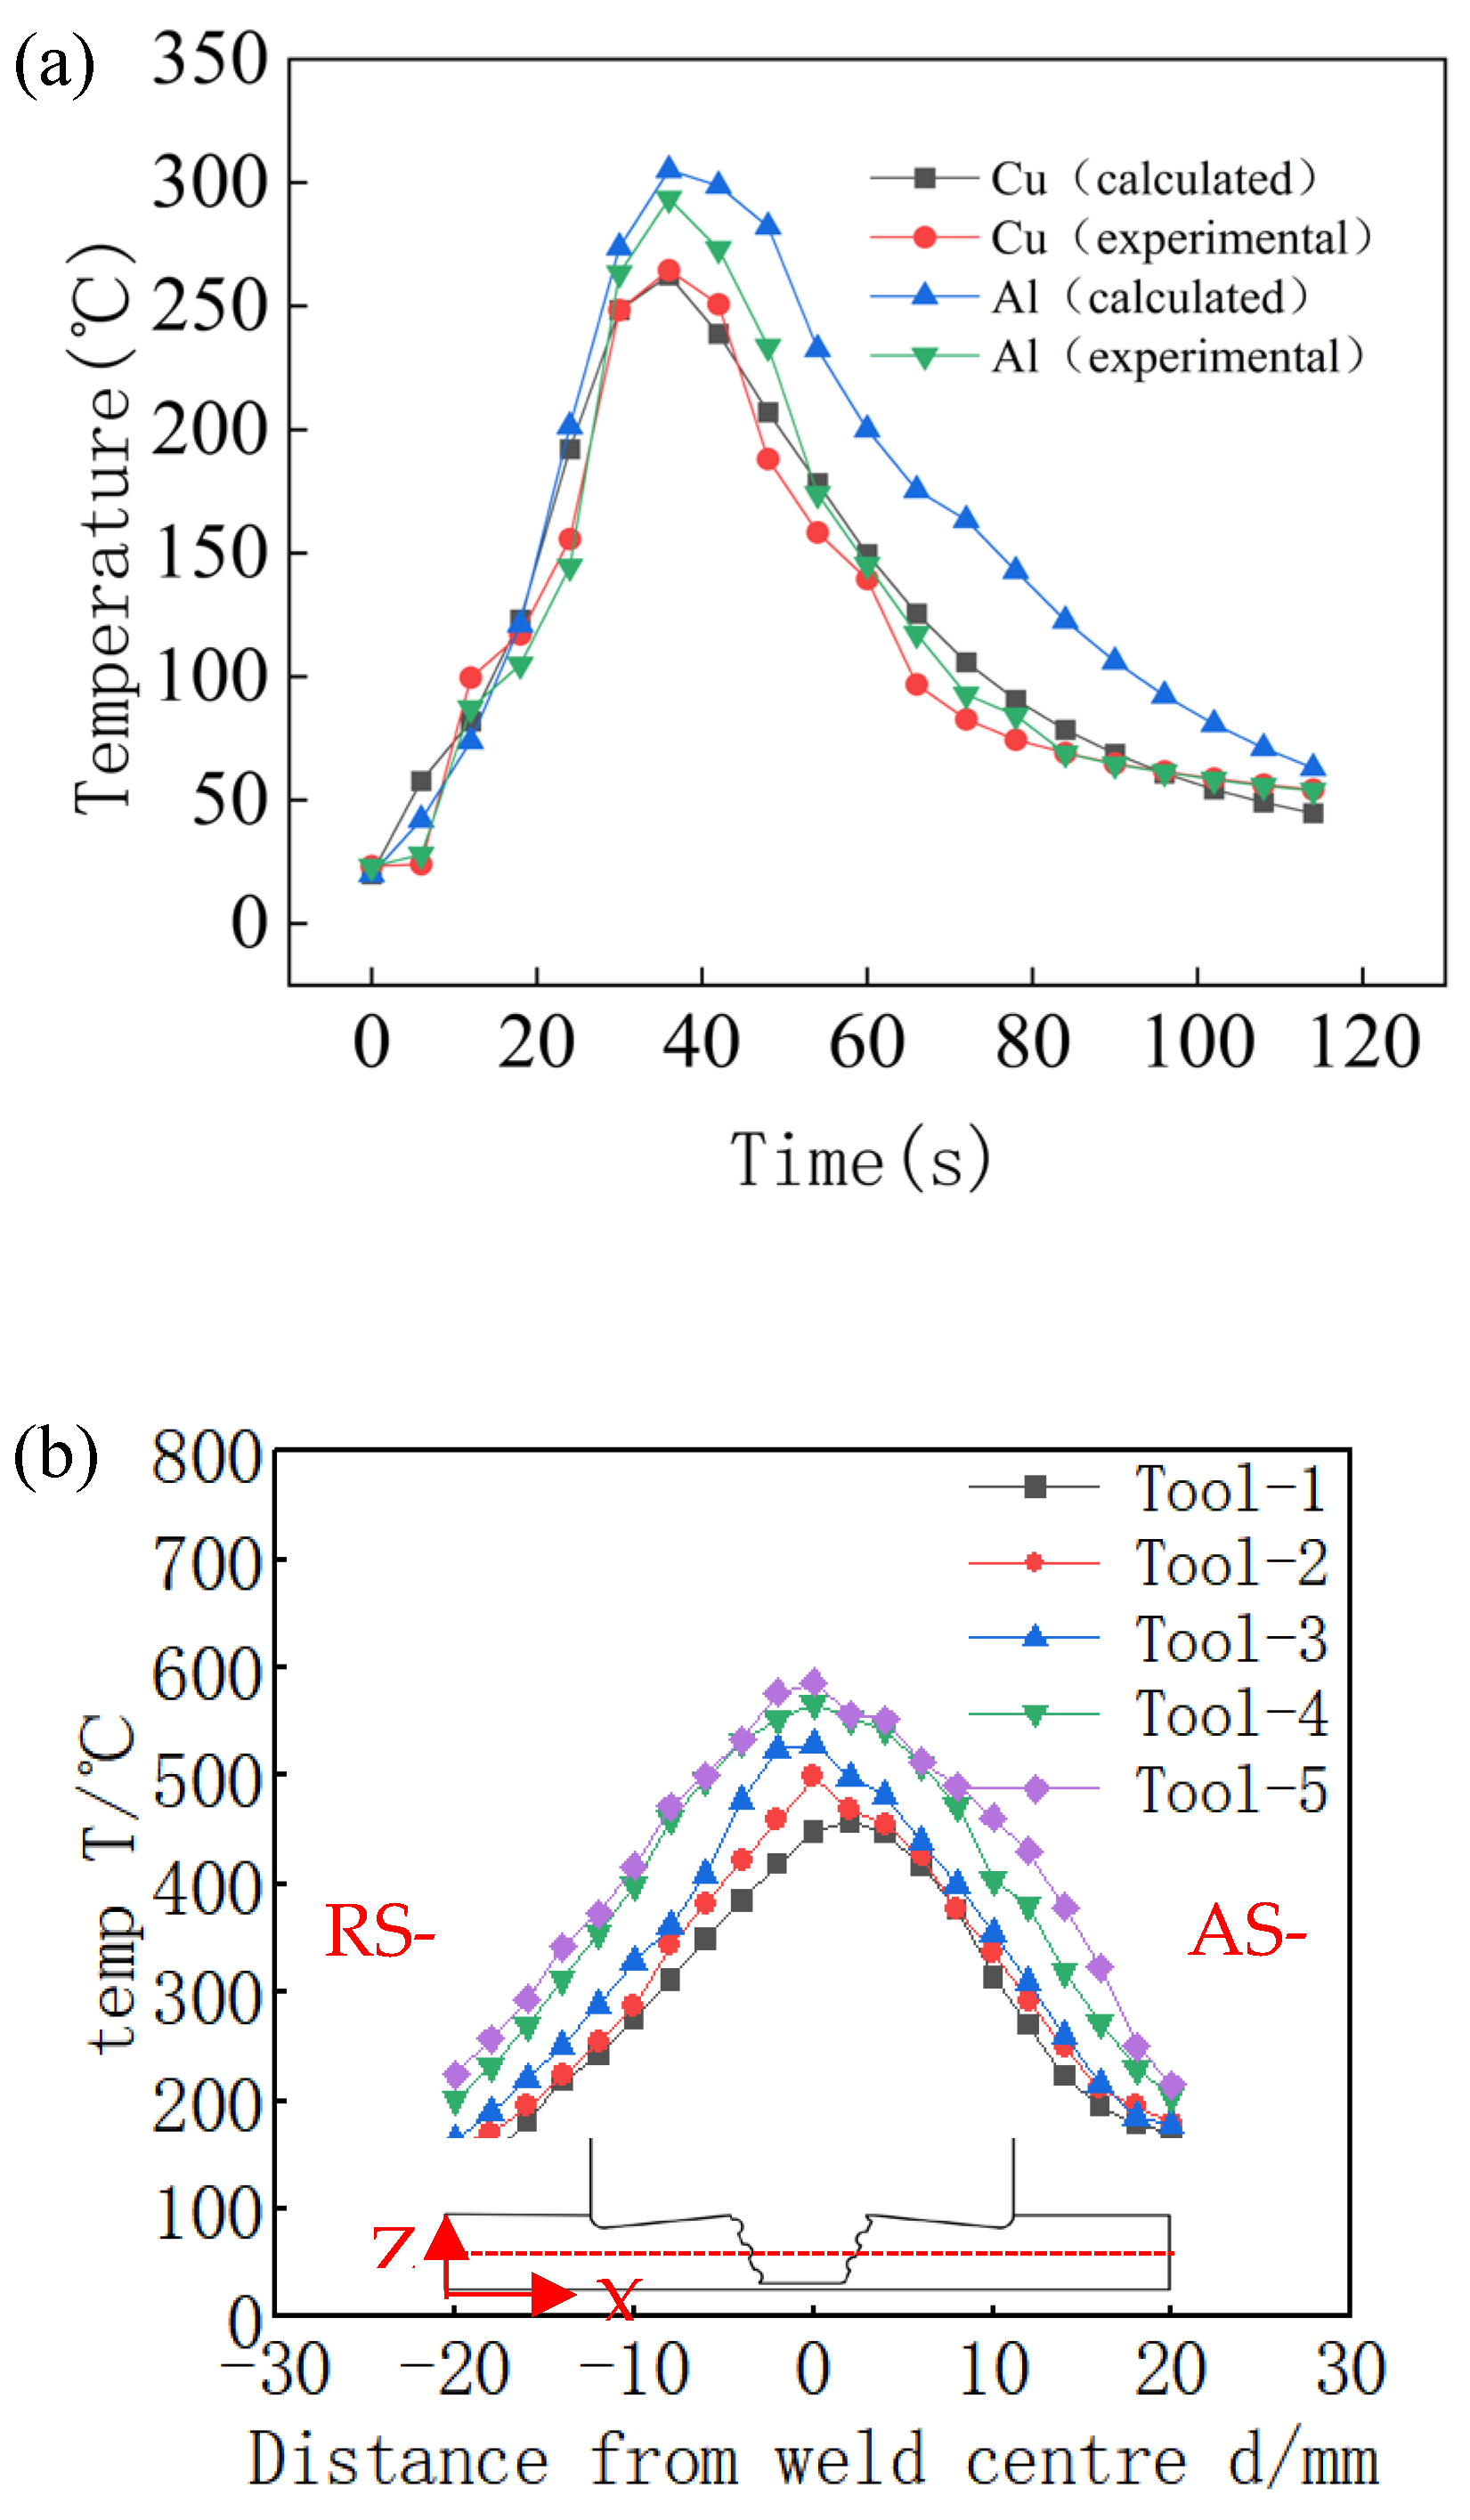
Metals 15 00193 g007
Figure 8. Temperature distribution ((a) simulated and experimental temperature curves at two characteristic points; (b) path simulation temperature distribution under five different tools).
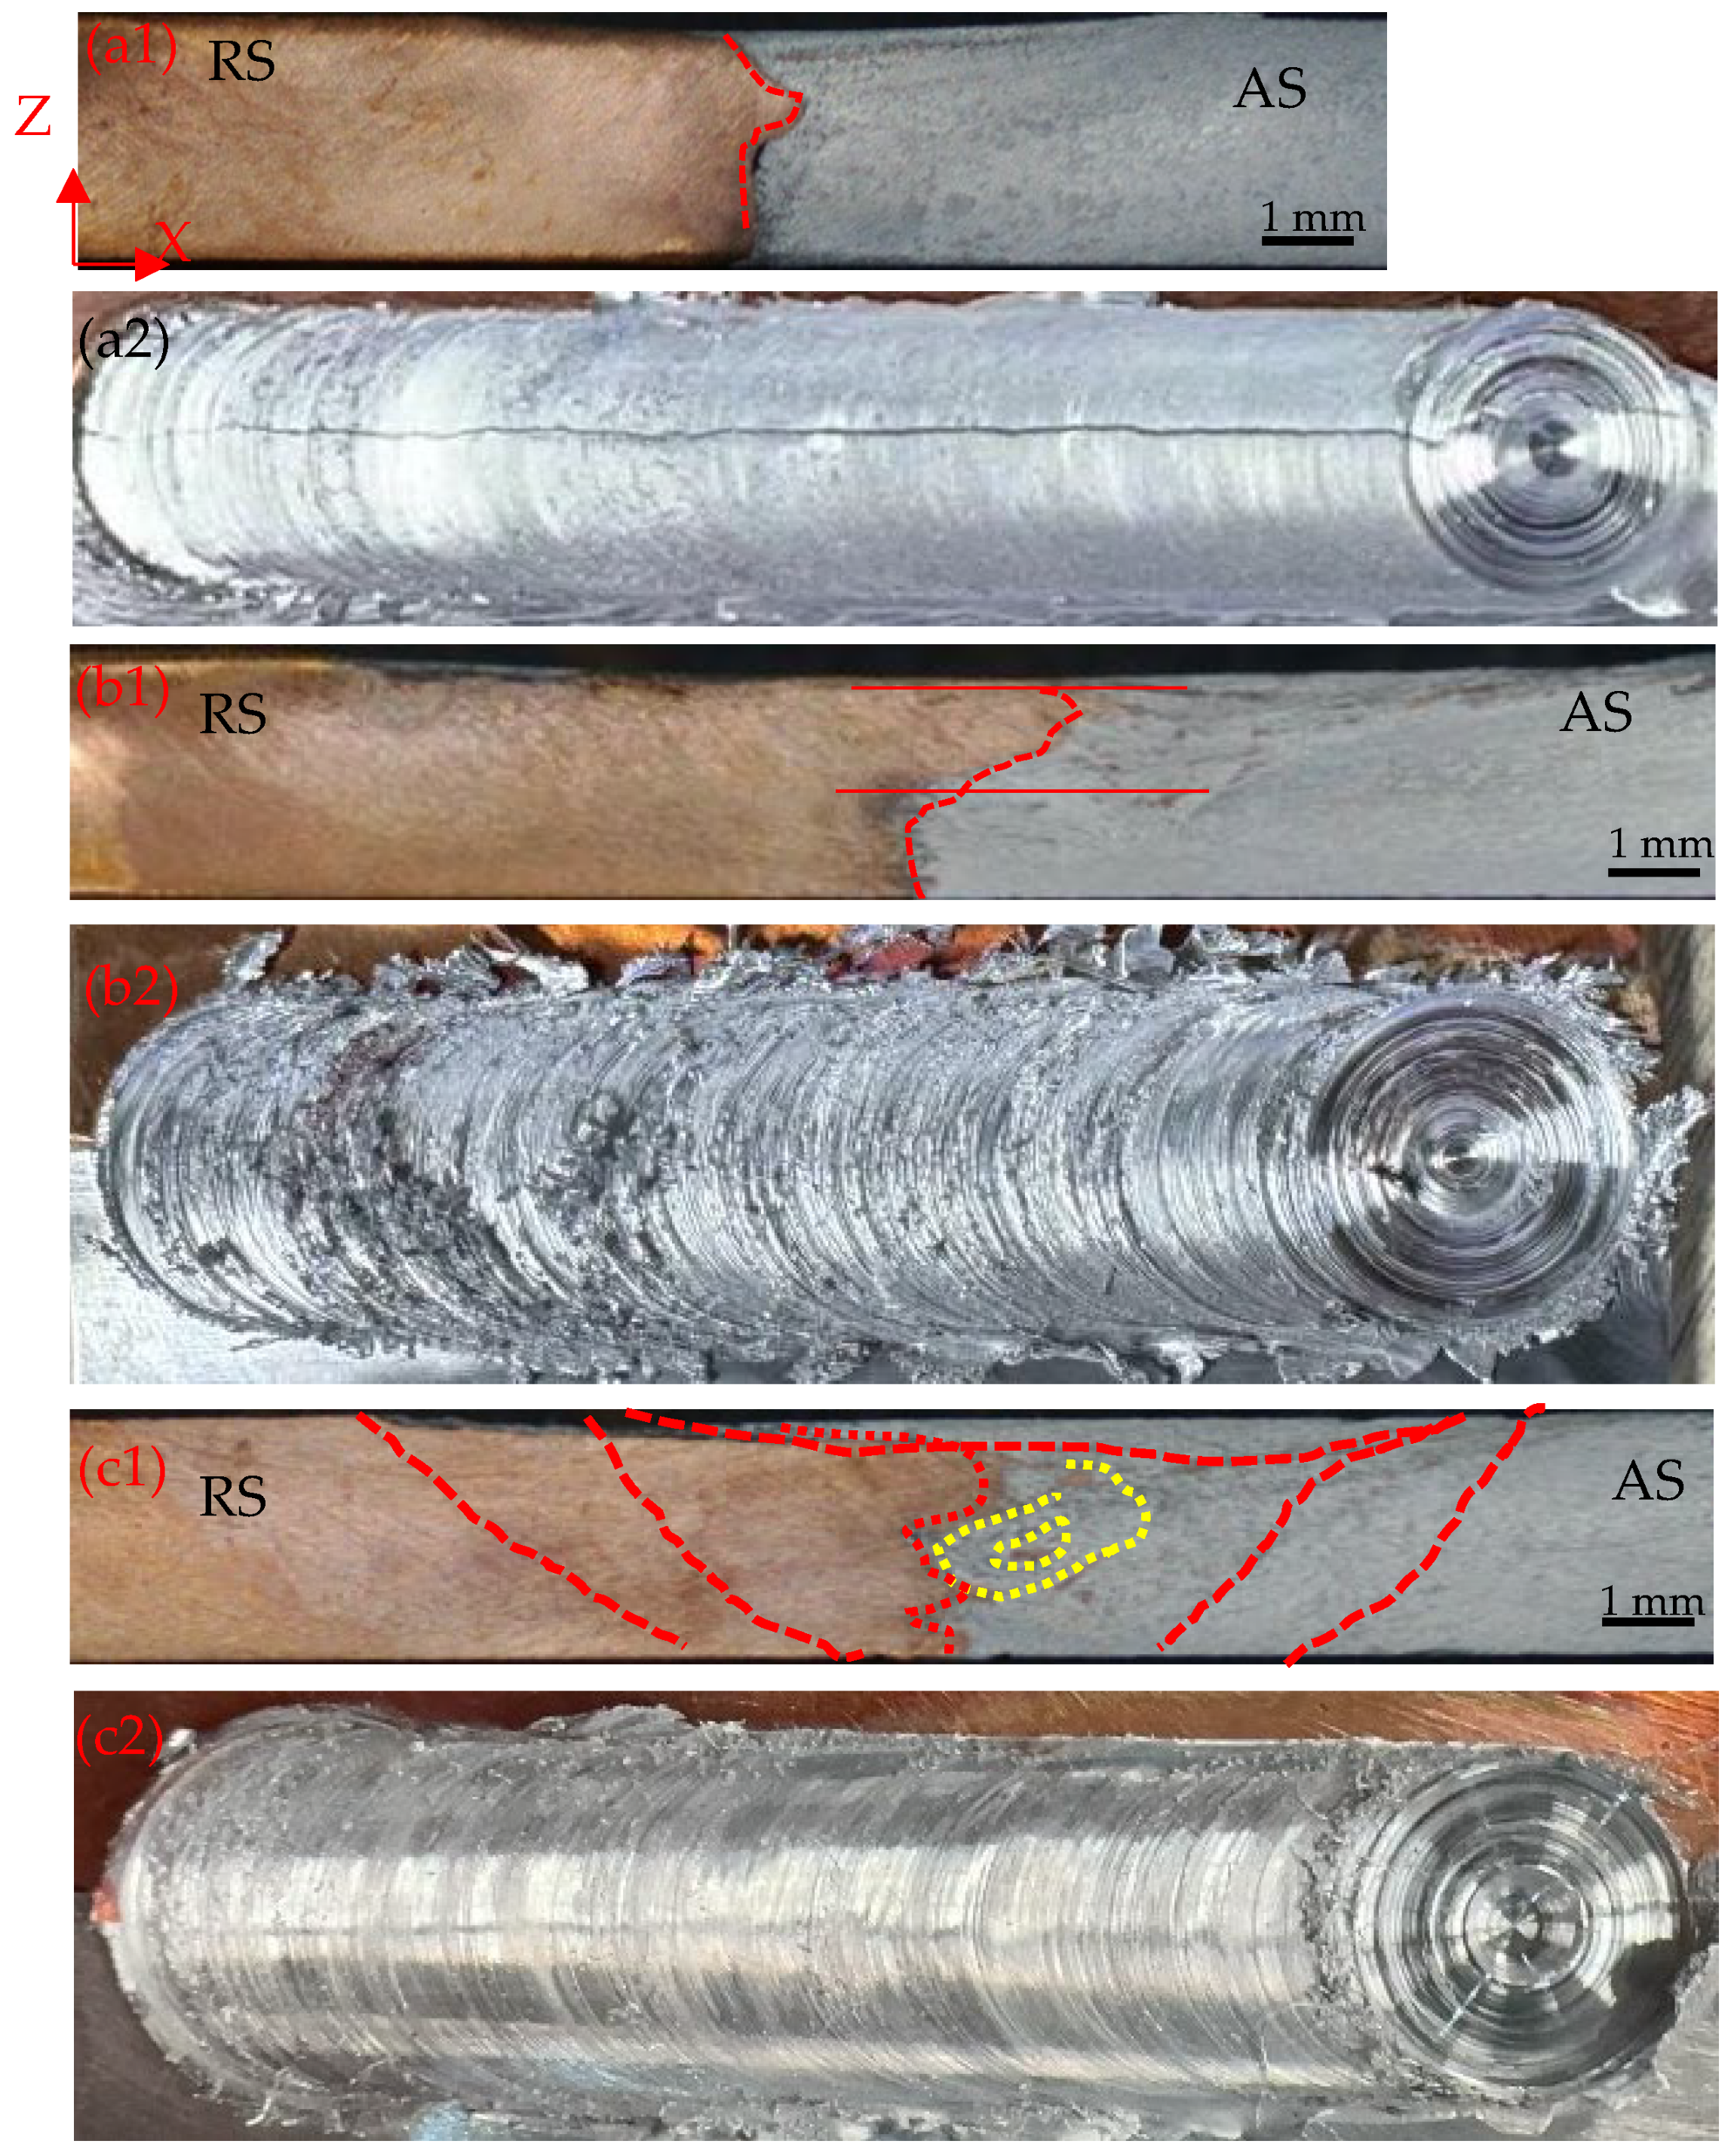
Metals 15 00193 g008
Figure 9. Surface morphology of joints welded using different shoulder diameters and speeds ((a1,a2) shoulder diameter 12 mm, unthreaded, rotational speed 1400 r/min, welding speed 80 mm/min; (b1,b2) shoulder diameter 16 mm, unthreaded, rotational speed 1400 r/min, welding speed 80 mm/min; (c1,c2) shoulder diameter 16 mm, threaded, rotational speed 1400 r/min, welding speed 80 mm/min).
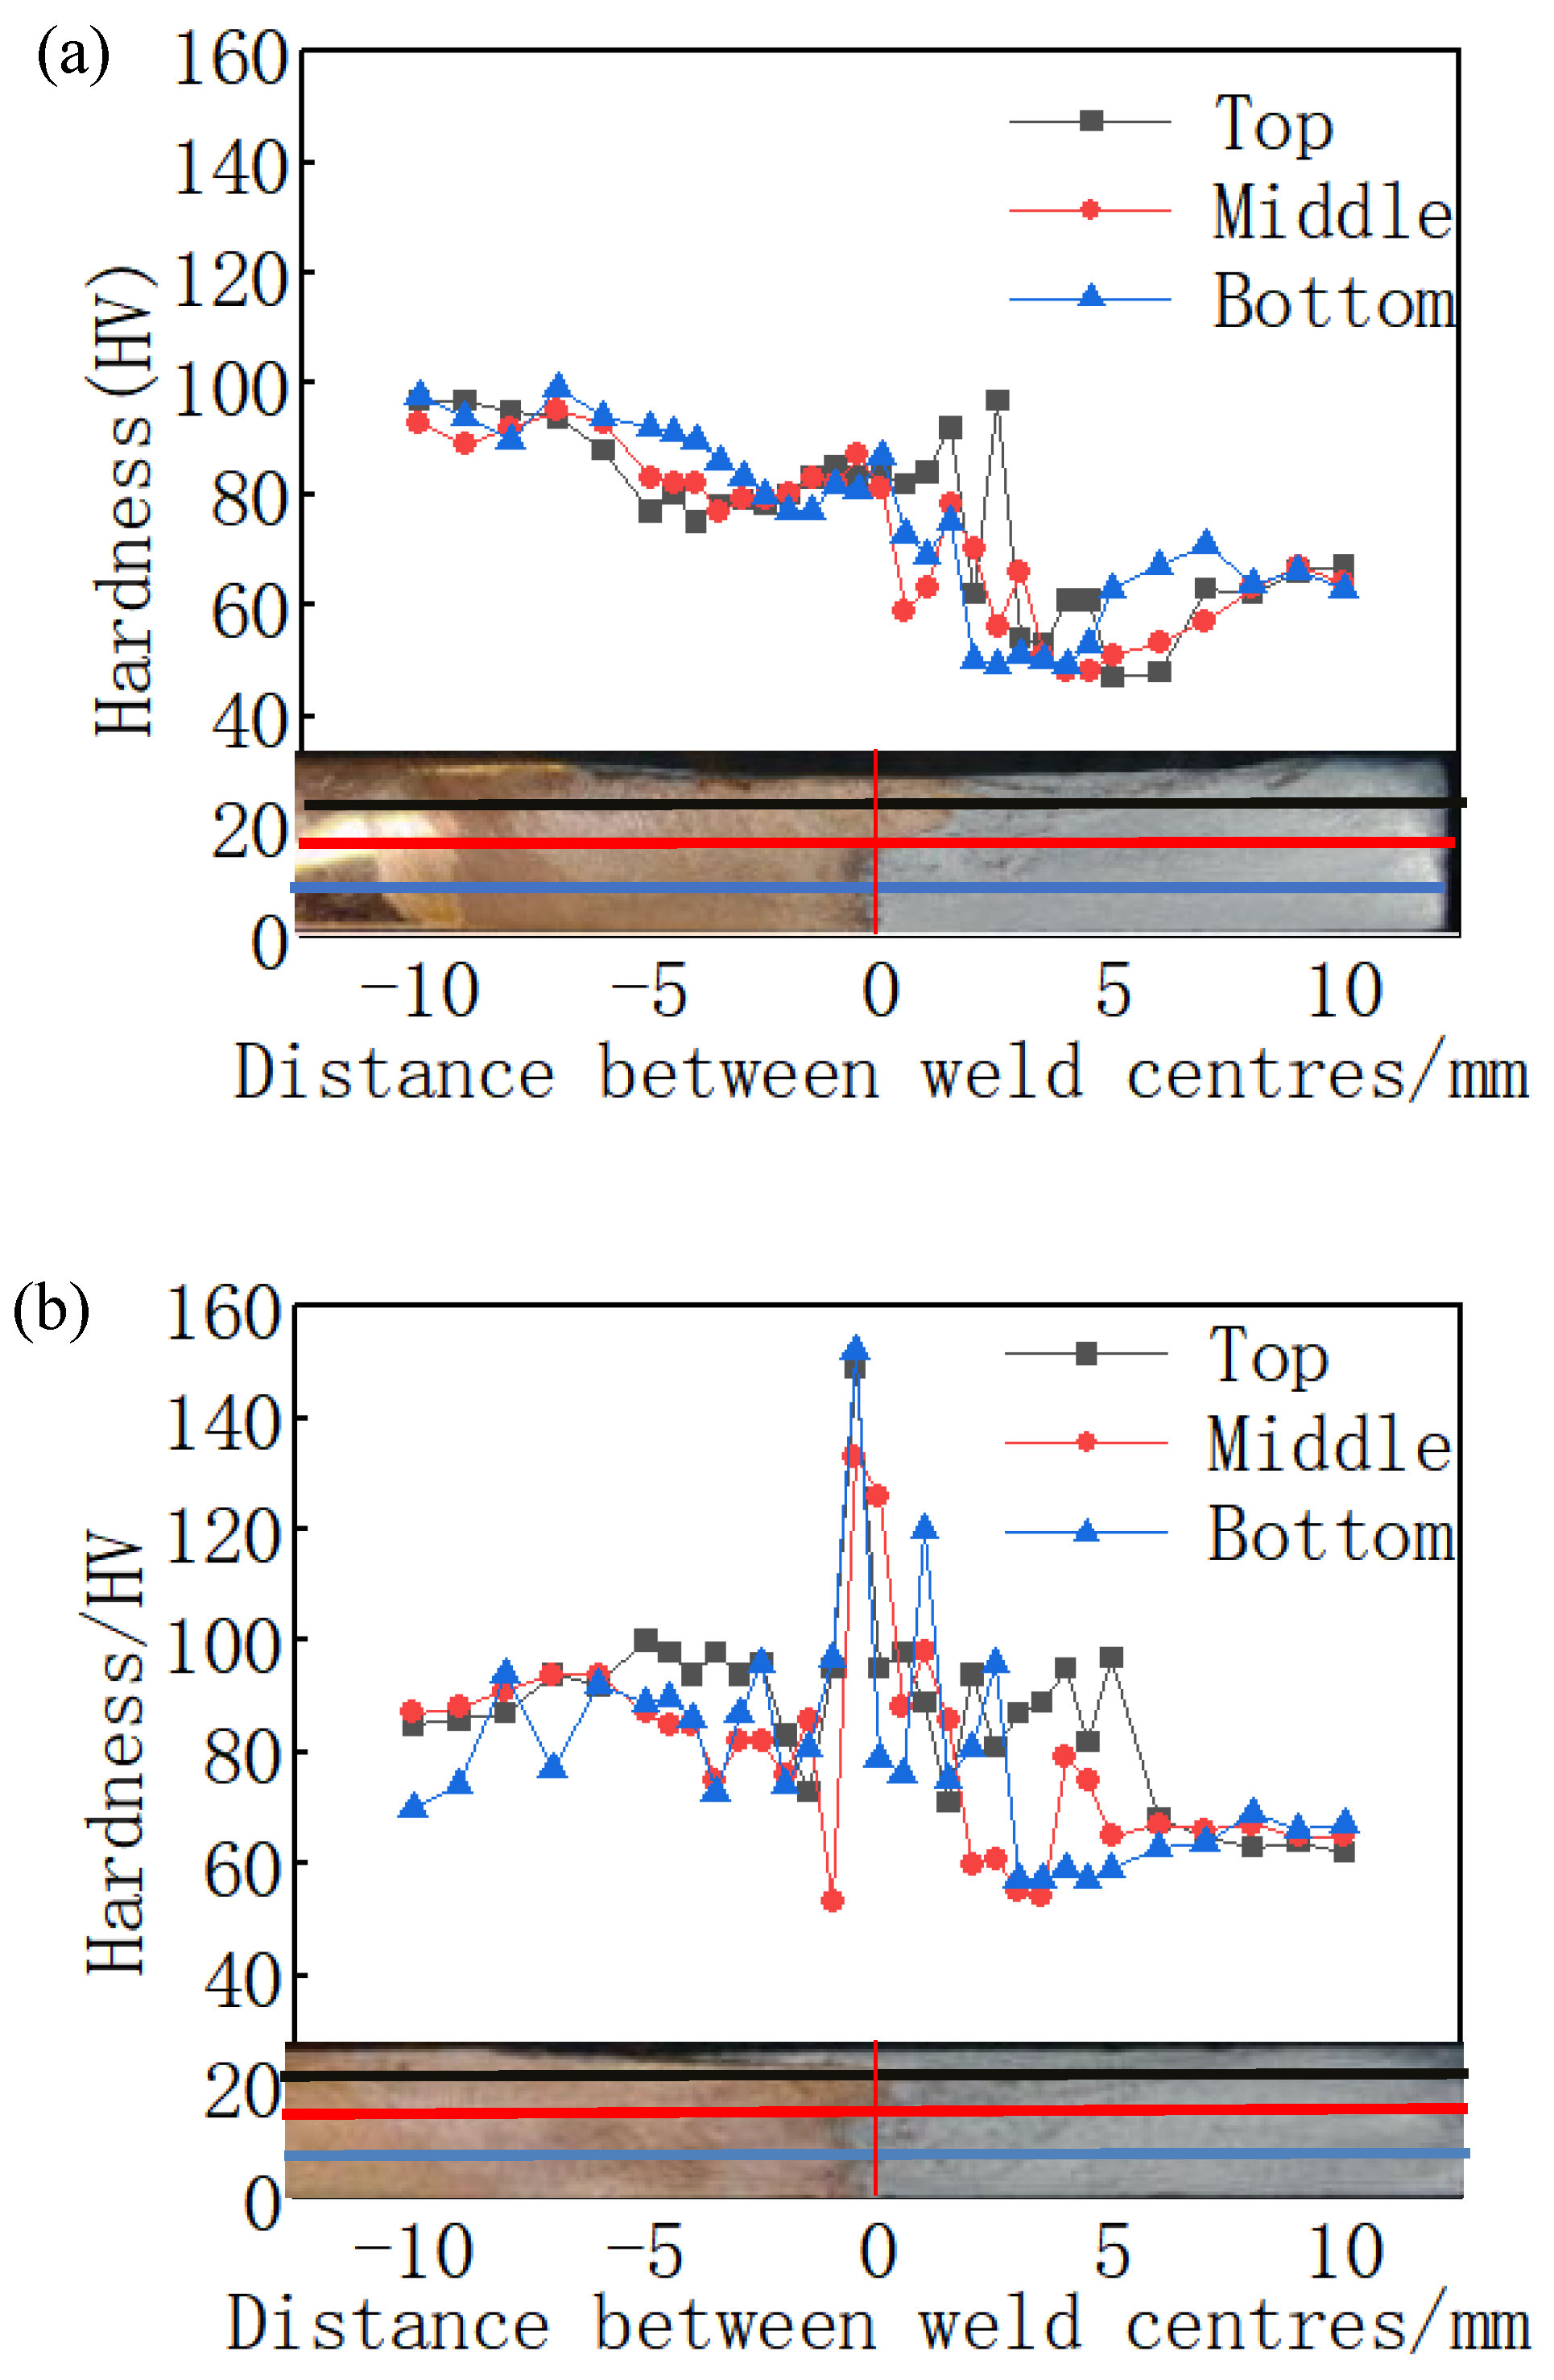
Metals 15 00193 g009
Figure 10. Hardness distribution curves with different tools (a) hardness distribution of the joint welded using a non-threaded tool; (b) hardness distribution of the joint welded using a threaded tool).
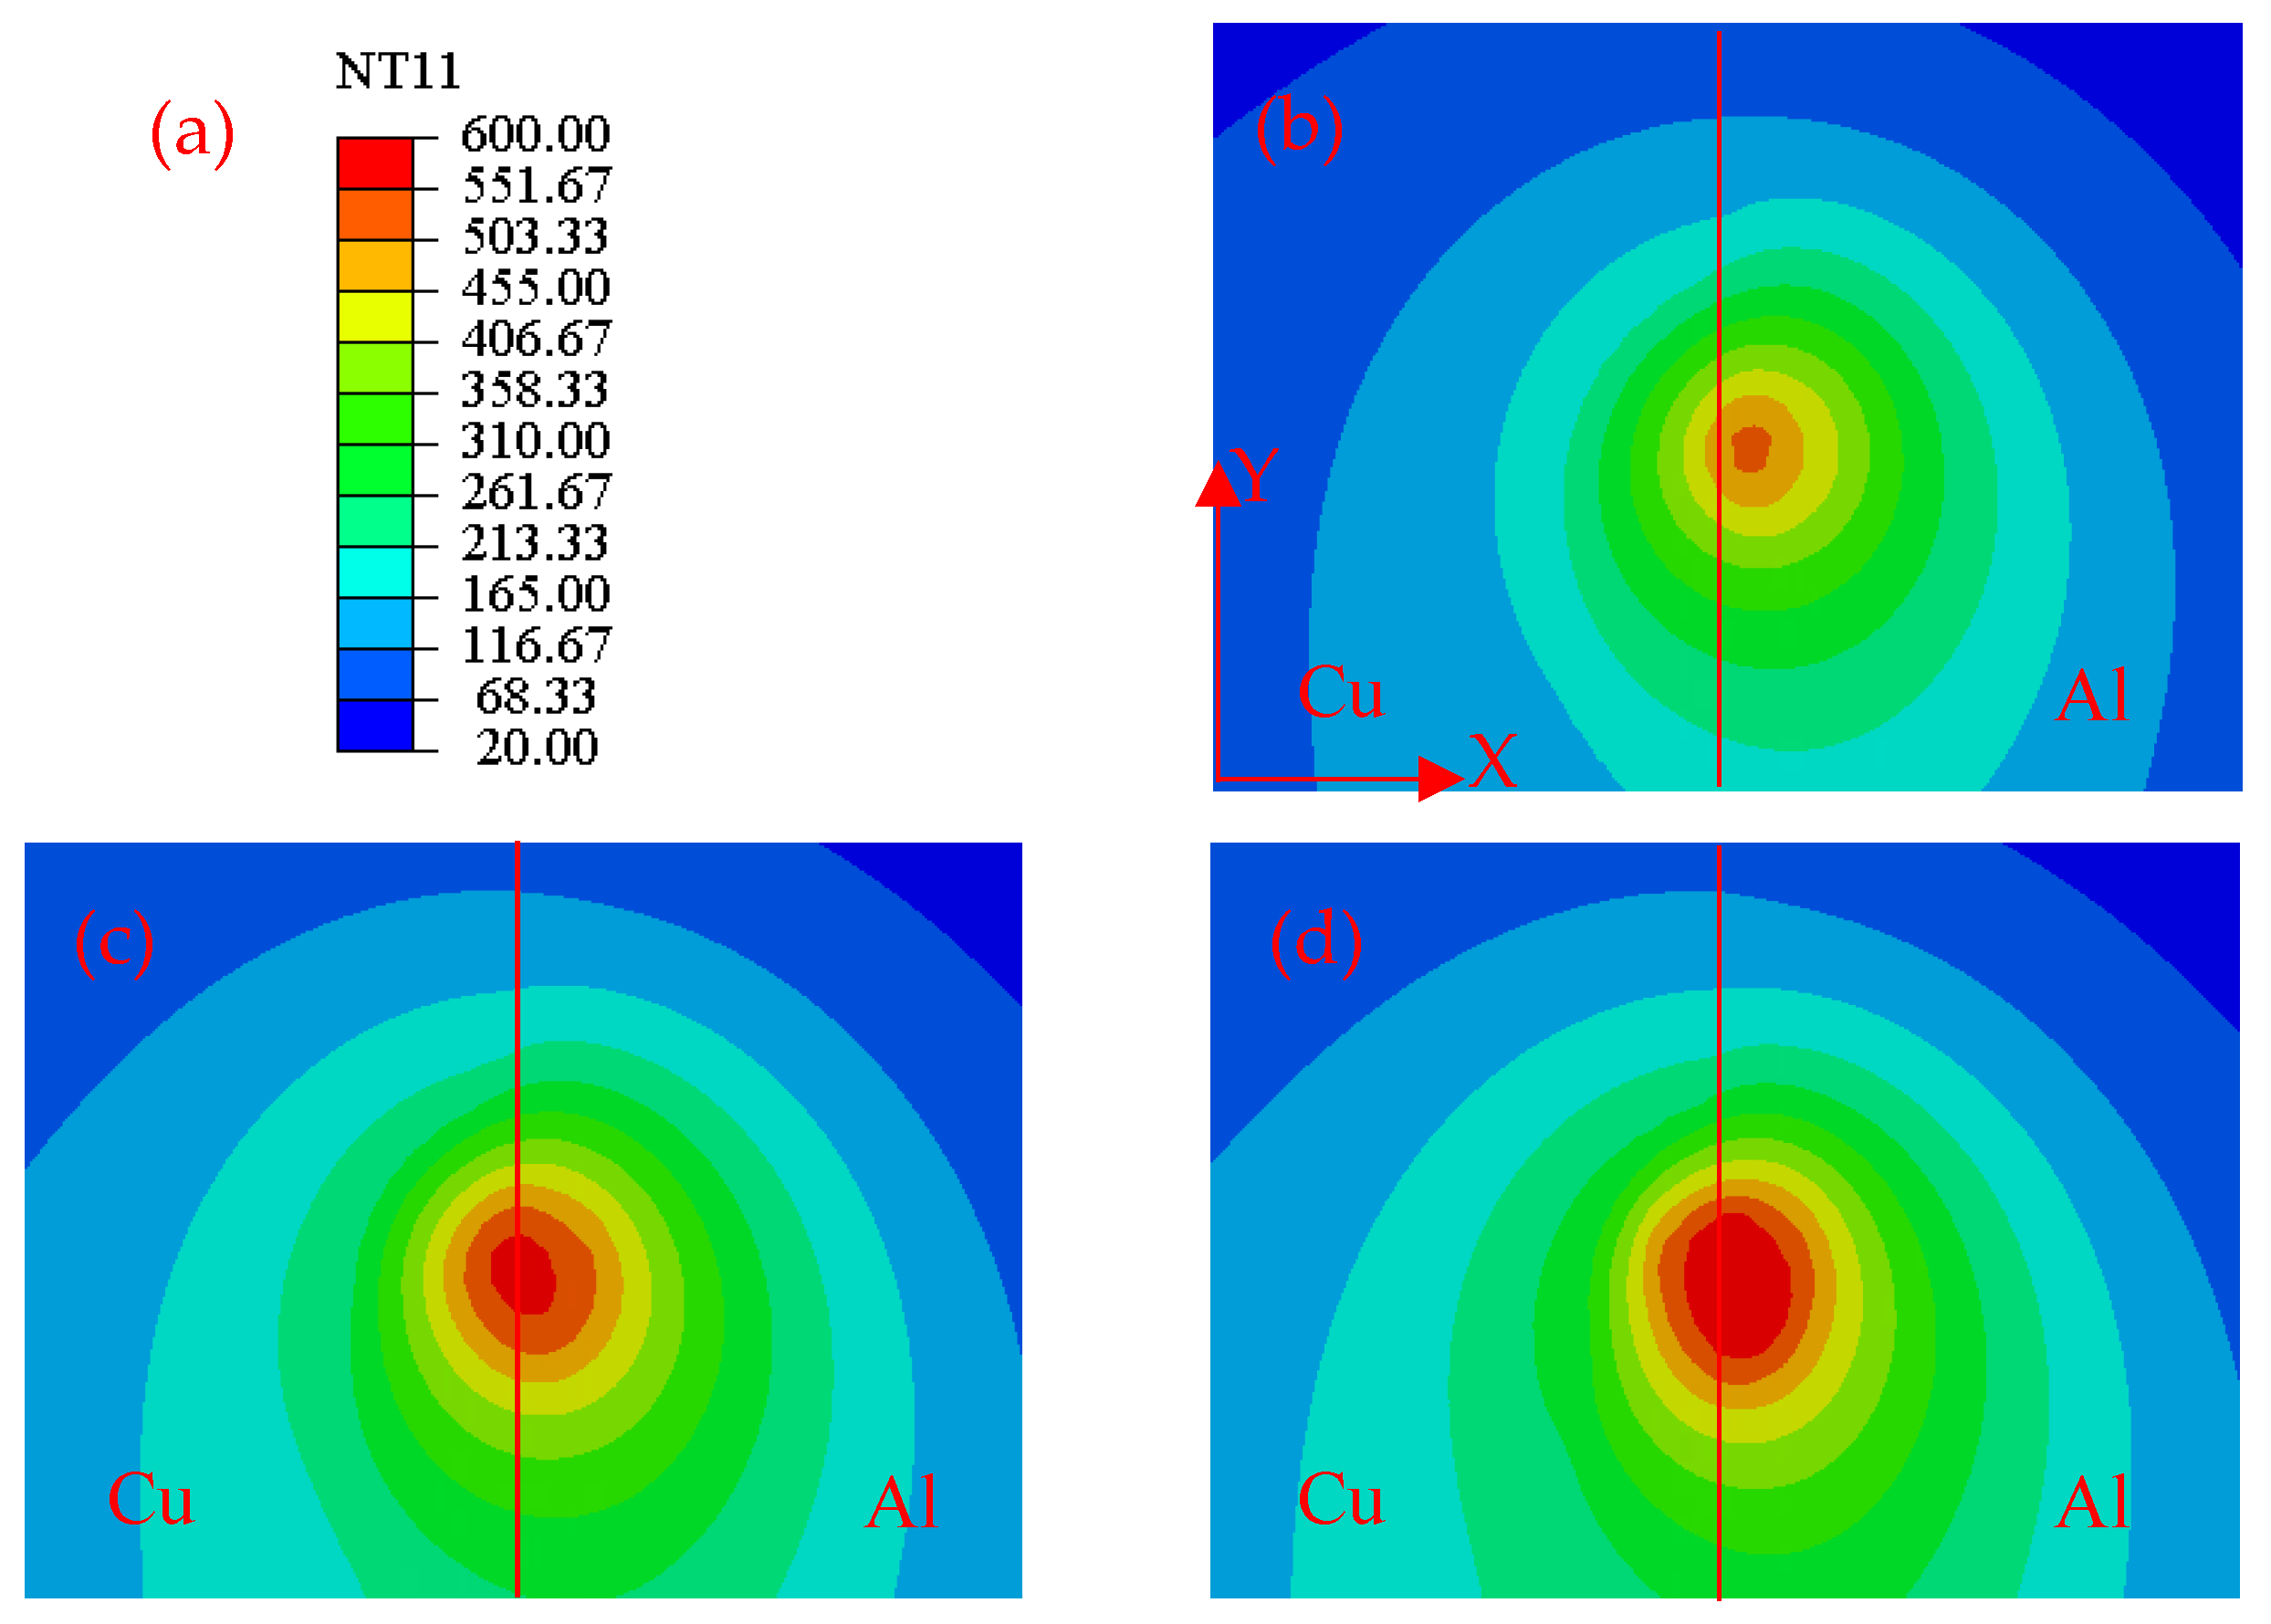
Metals 15 00193 g010
Figure 11. Temperature distributions at different rotational speeds ((a) temperature scale; (b) rotational speed 1000 r/min, welding speed 80 mm/min; (c) rotational speed 1200 r/min, welding speed 80 mm/min; (d) rotational speed 1400 r/min, welding speed 80 mm/min).
Metals 15 00193 g011
Figure 12. Temperature distributions at different welding speeds ((a) temperature scale; (b) rotational speed 1400 r/min, welding speed 40 mm/min; (c) rotational speed 1400 r/min, welding speed 70 mm/min; (d) rotational speed 1400 r/min, welding speed 80 mm/min; (e) rotational speed 1400 r/min, welding speed 90 mm/min; (f) rotational speed 1400 r/min, welding speed 200 mm/min;).
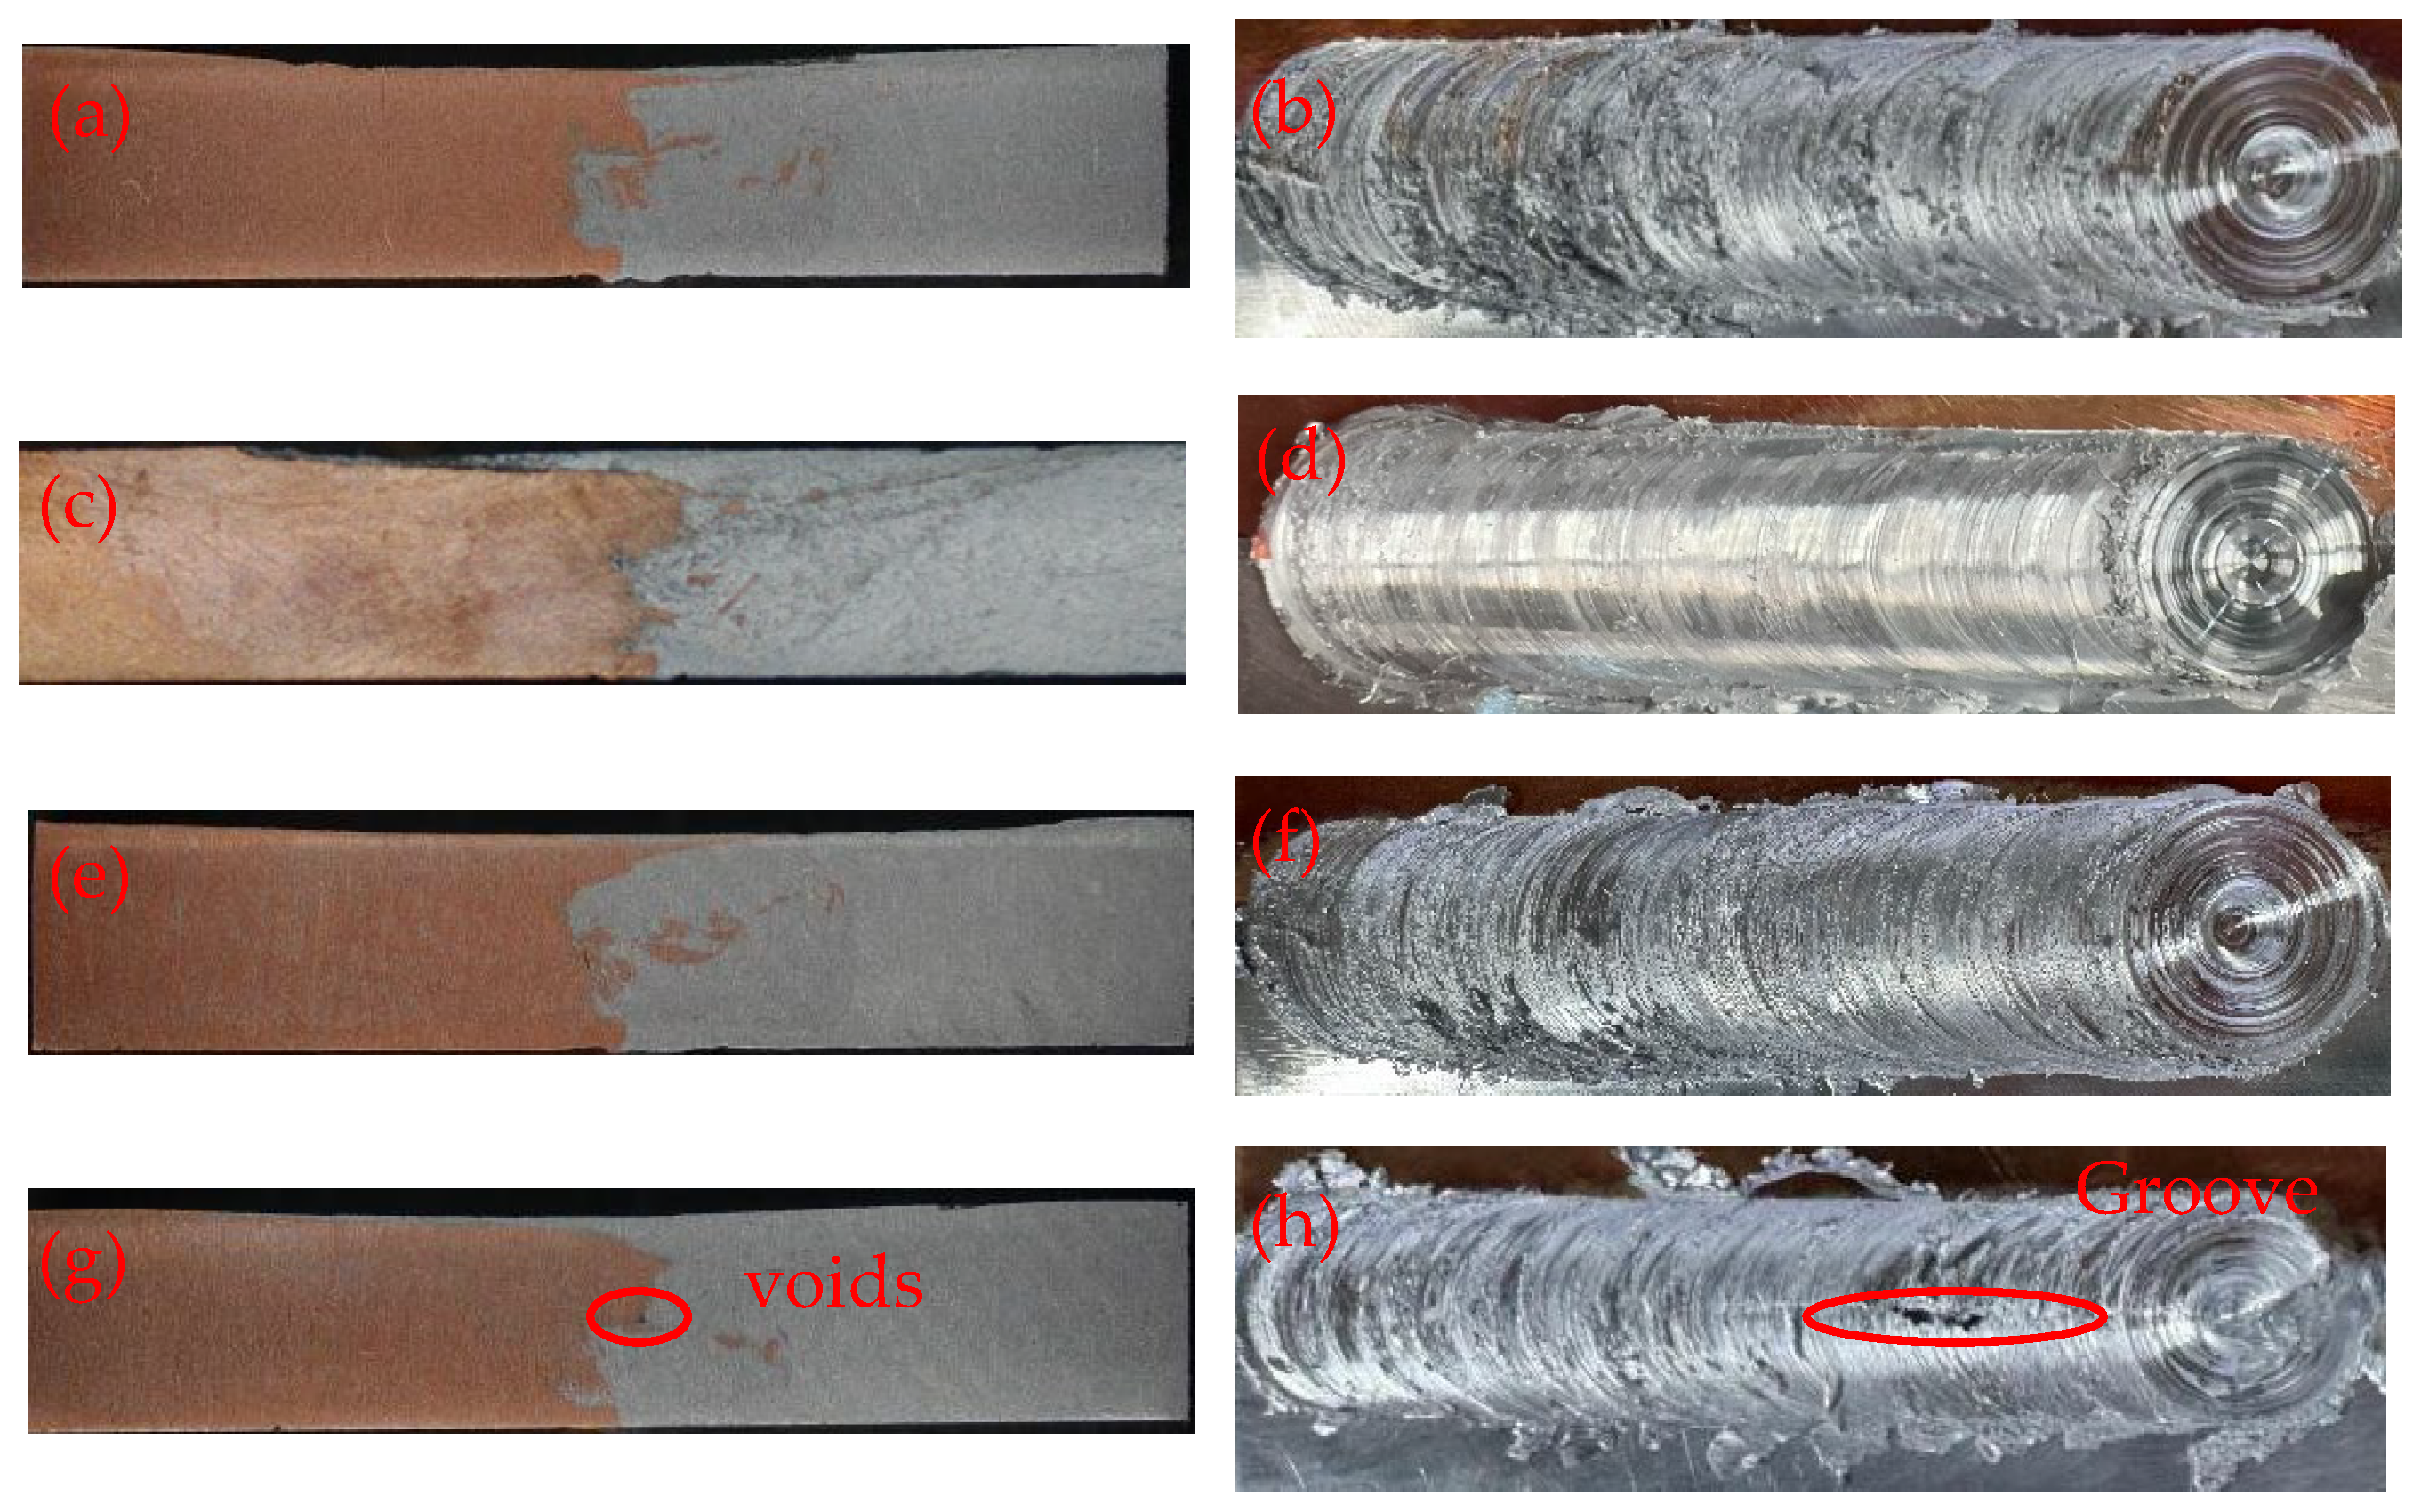
Metals 15 00193 g012
Figure 13. Macroscopic morphologies of joints welded using conical threaded tools at different welding speeds ((a,b), rotational speed 1400 r/min, welding speed 70 mm/min, cross-sectional morphology, surface morphology; (c,d), rotational speed 1400 r/min, welding speed 80 mm/min, cross-sectional morphology, surface morphology; (e,f), rotational speed 1400 r/min, welding speed 90 mm/min, cross-sectional morphology, surface morphology; (g,h), rotational speed 1400 r/min, welding speed 100 mm/min, cross-sectional morphology, surface morphology).
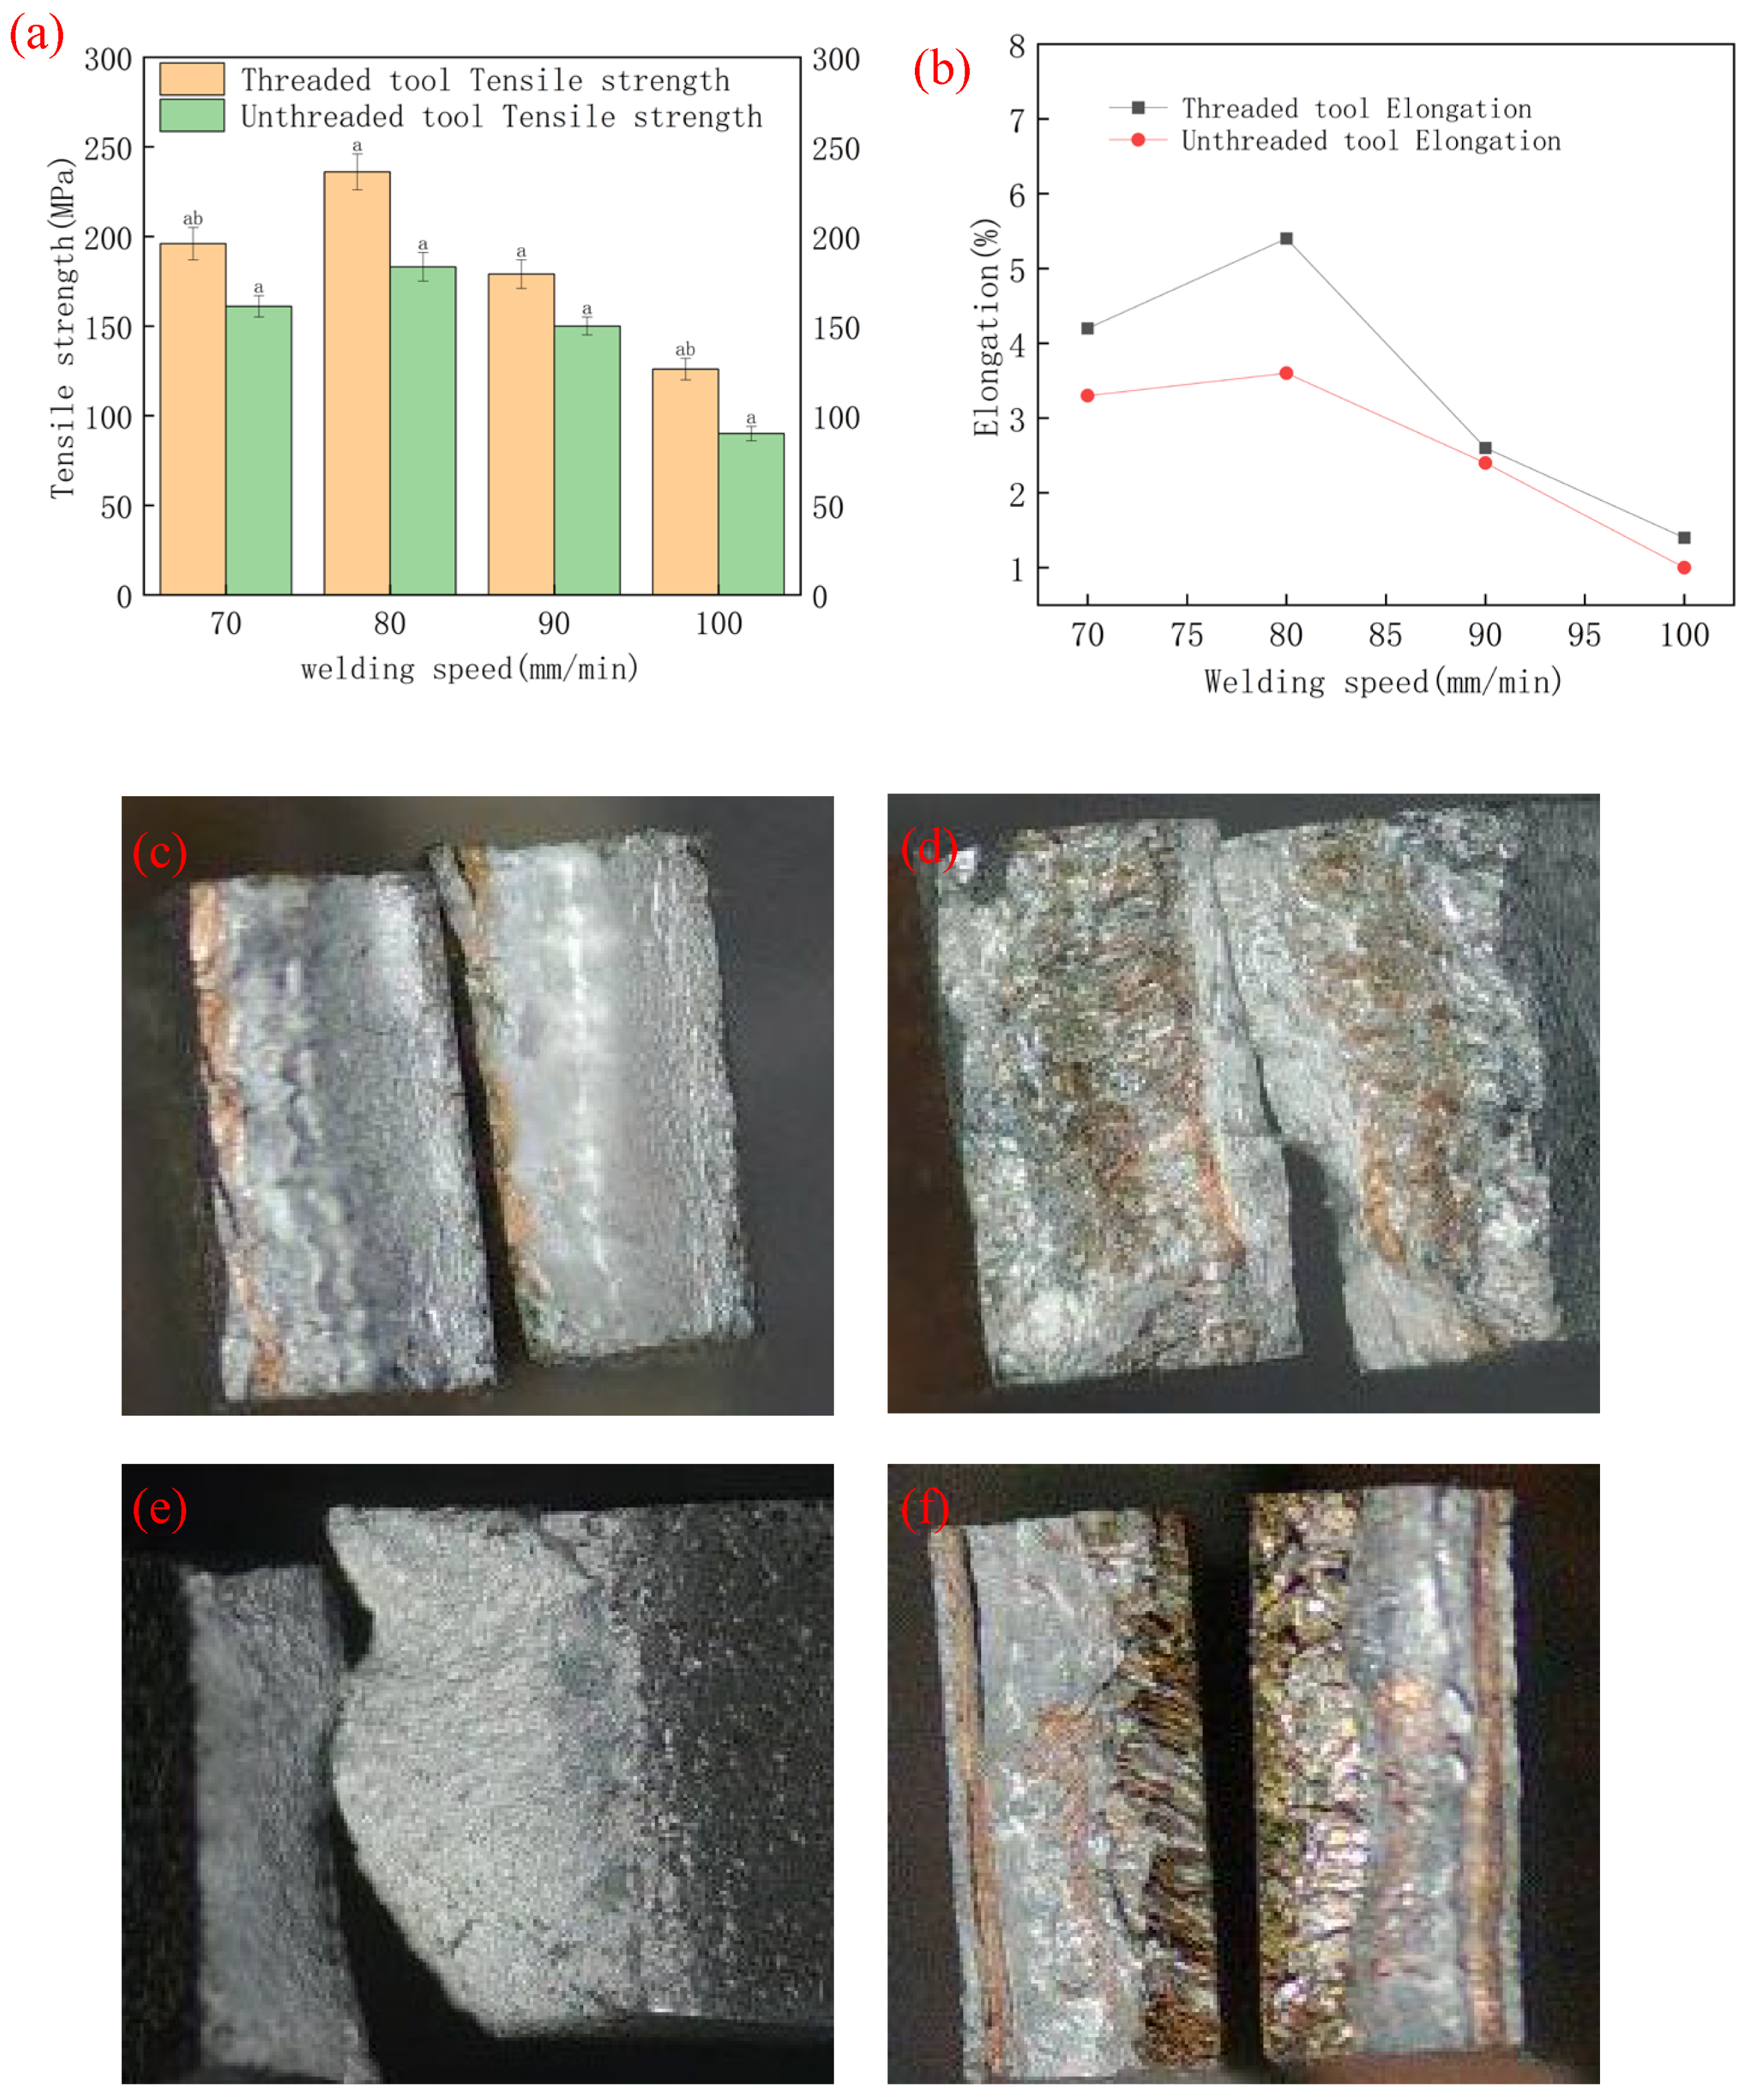
Metals 15 00193 g013
Figure 14. Tensile strength and elongation of joints welded using different tools and parameters, fracture morphology ((a) tensile strength of joints welded using different tools; (b) elongation of joints welded using different tools; (c,d) 16 mm unthreaded tool, rotational speed 1400 r/min, welding speed 80 mm/min; (e,f) 16 mm threaded tool, rotational speed 1400 r/min, welding speed 80 mm/min).
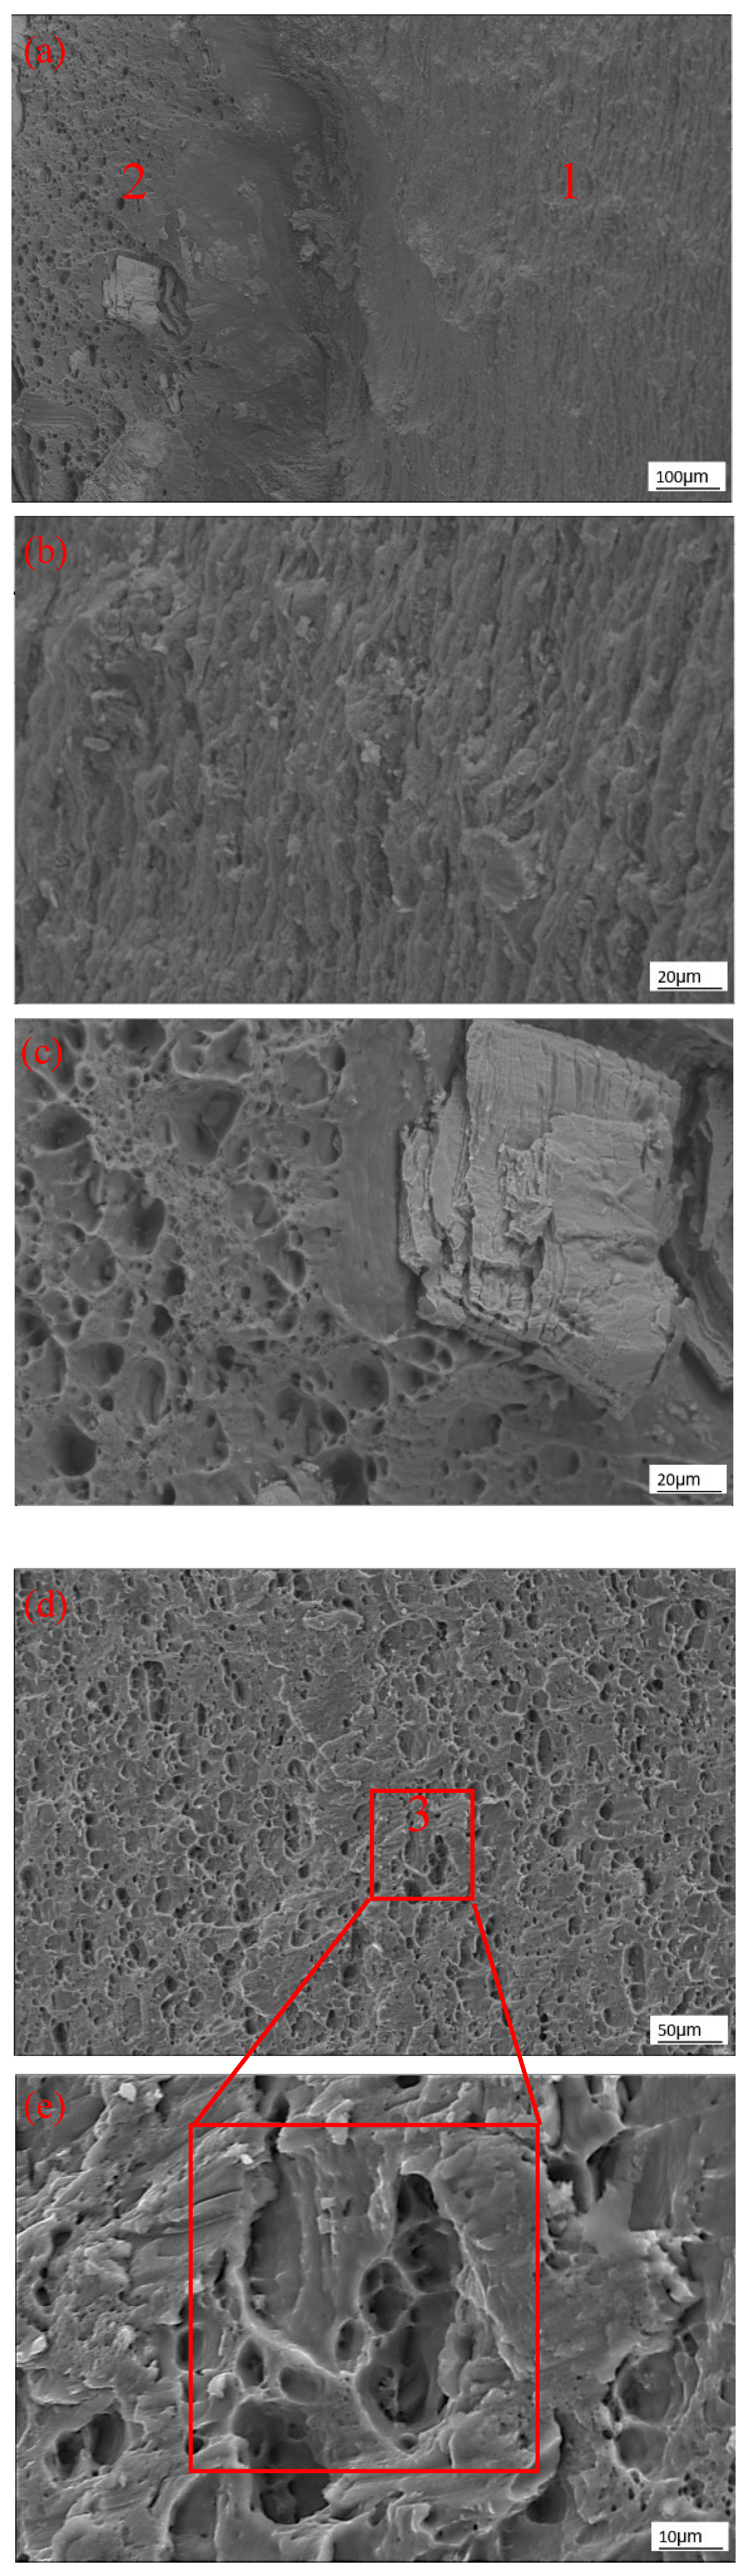
Metals 15 00193 g014
Figure 15. SEM of fracture surface of joints welded using different tools ((a) unthreaded tool, rotational speed 1400 r/min, welding speed 80 mm/min; (b) magnified image of Position 1; (c) magnified image of Position 2; (d) threaded tool, rotational speed 1400 r/min, welding speed 80 mm/min; (e) magnified image of Position 3).
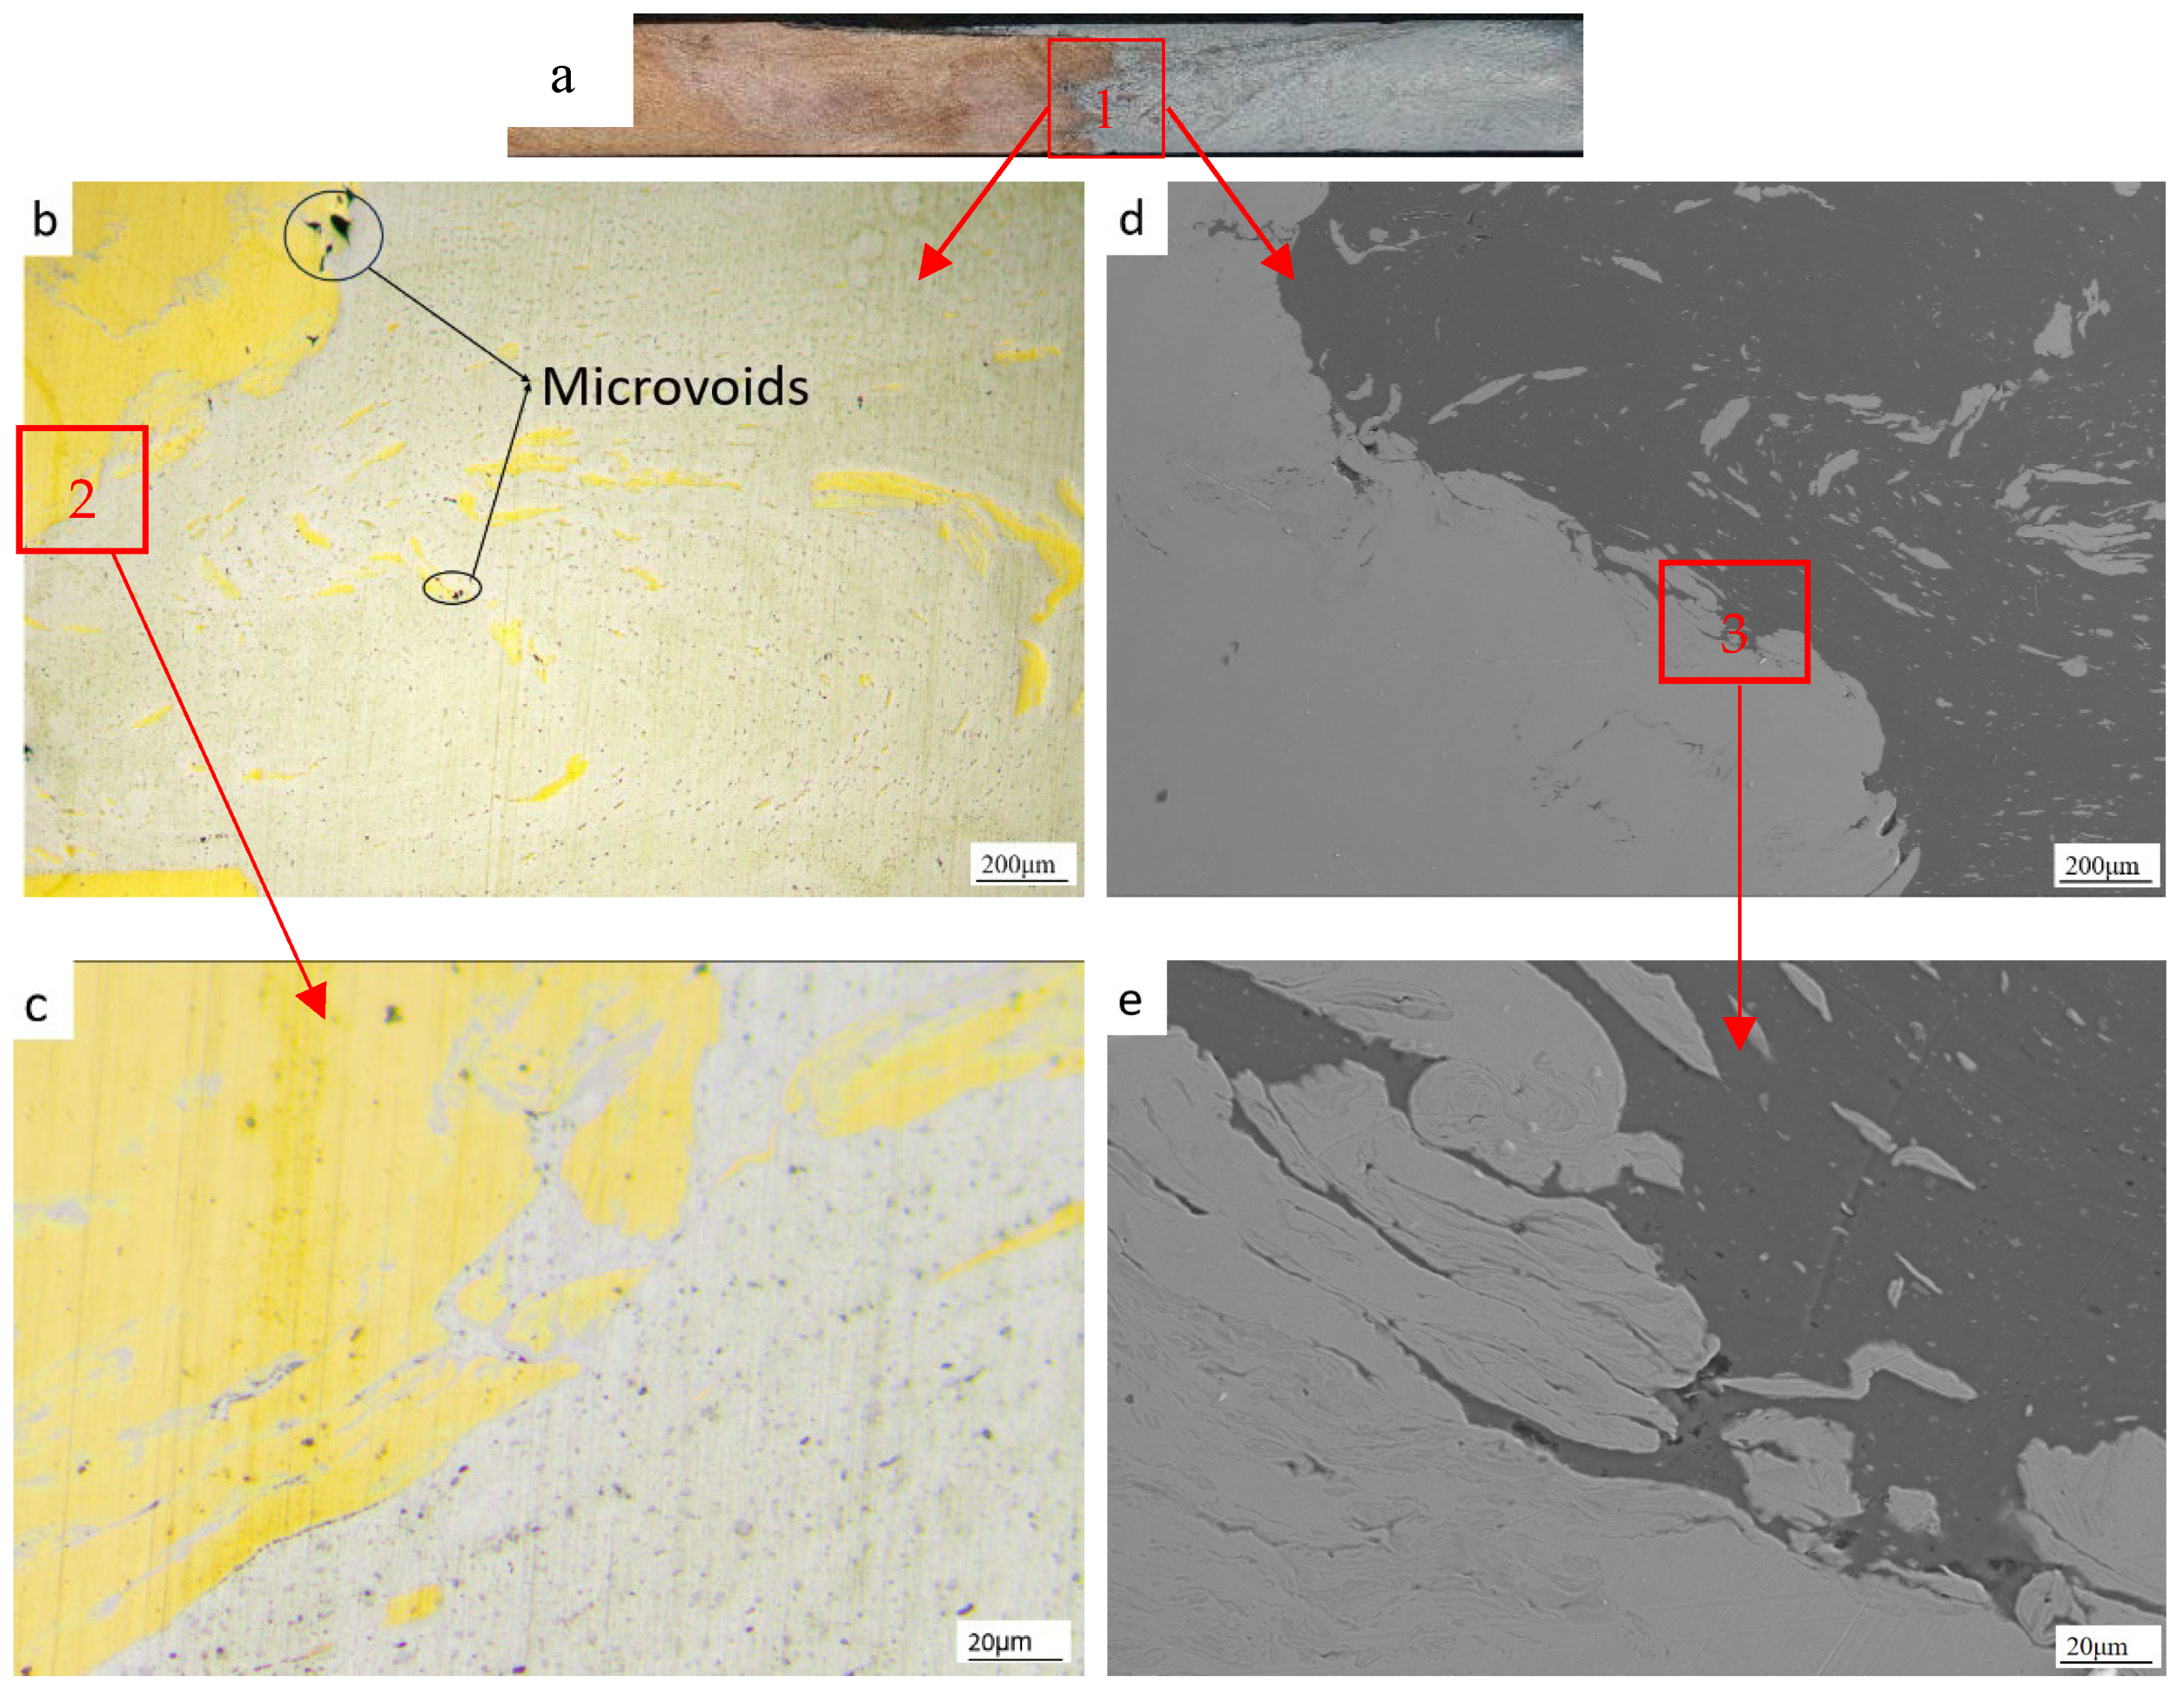
Metals 15 00193 g015
Figure 16. Microstructural images (using OM and SEM) of the welded joint using a threaded tool ((a) cross-sectional morphology, rotational speed 1400 r/min, welding speed 80 mm/min; (b) OM image of Region 1; (c) OM image of Region 2; (d) SEM image of Region 1; (e) SEM image of Region 3).
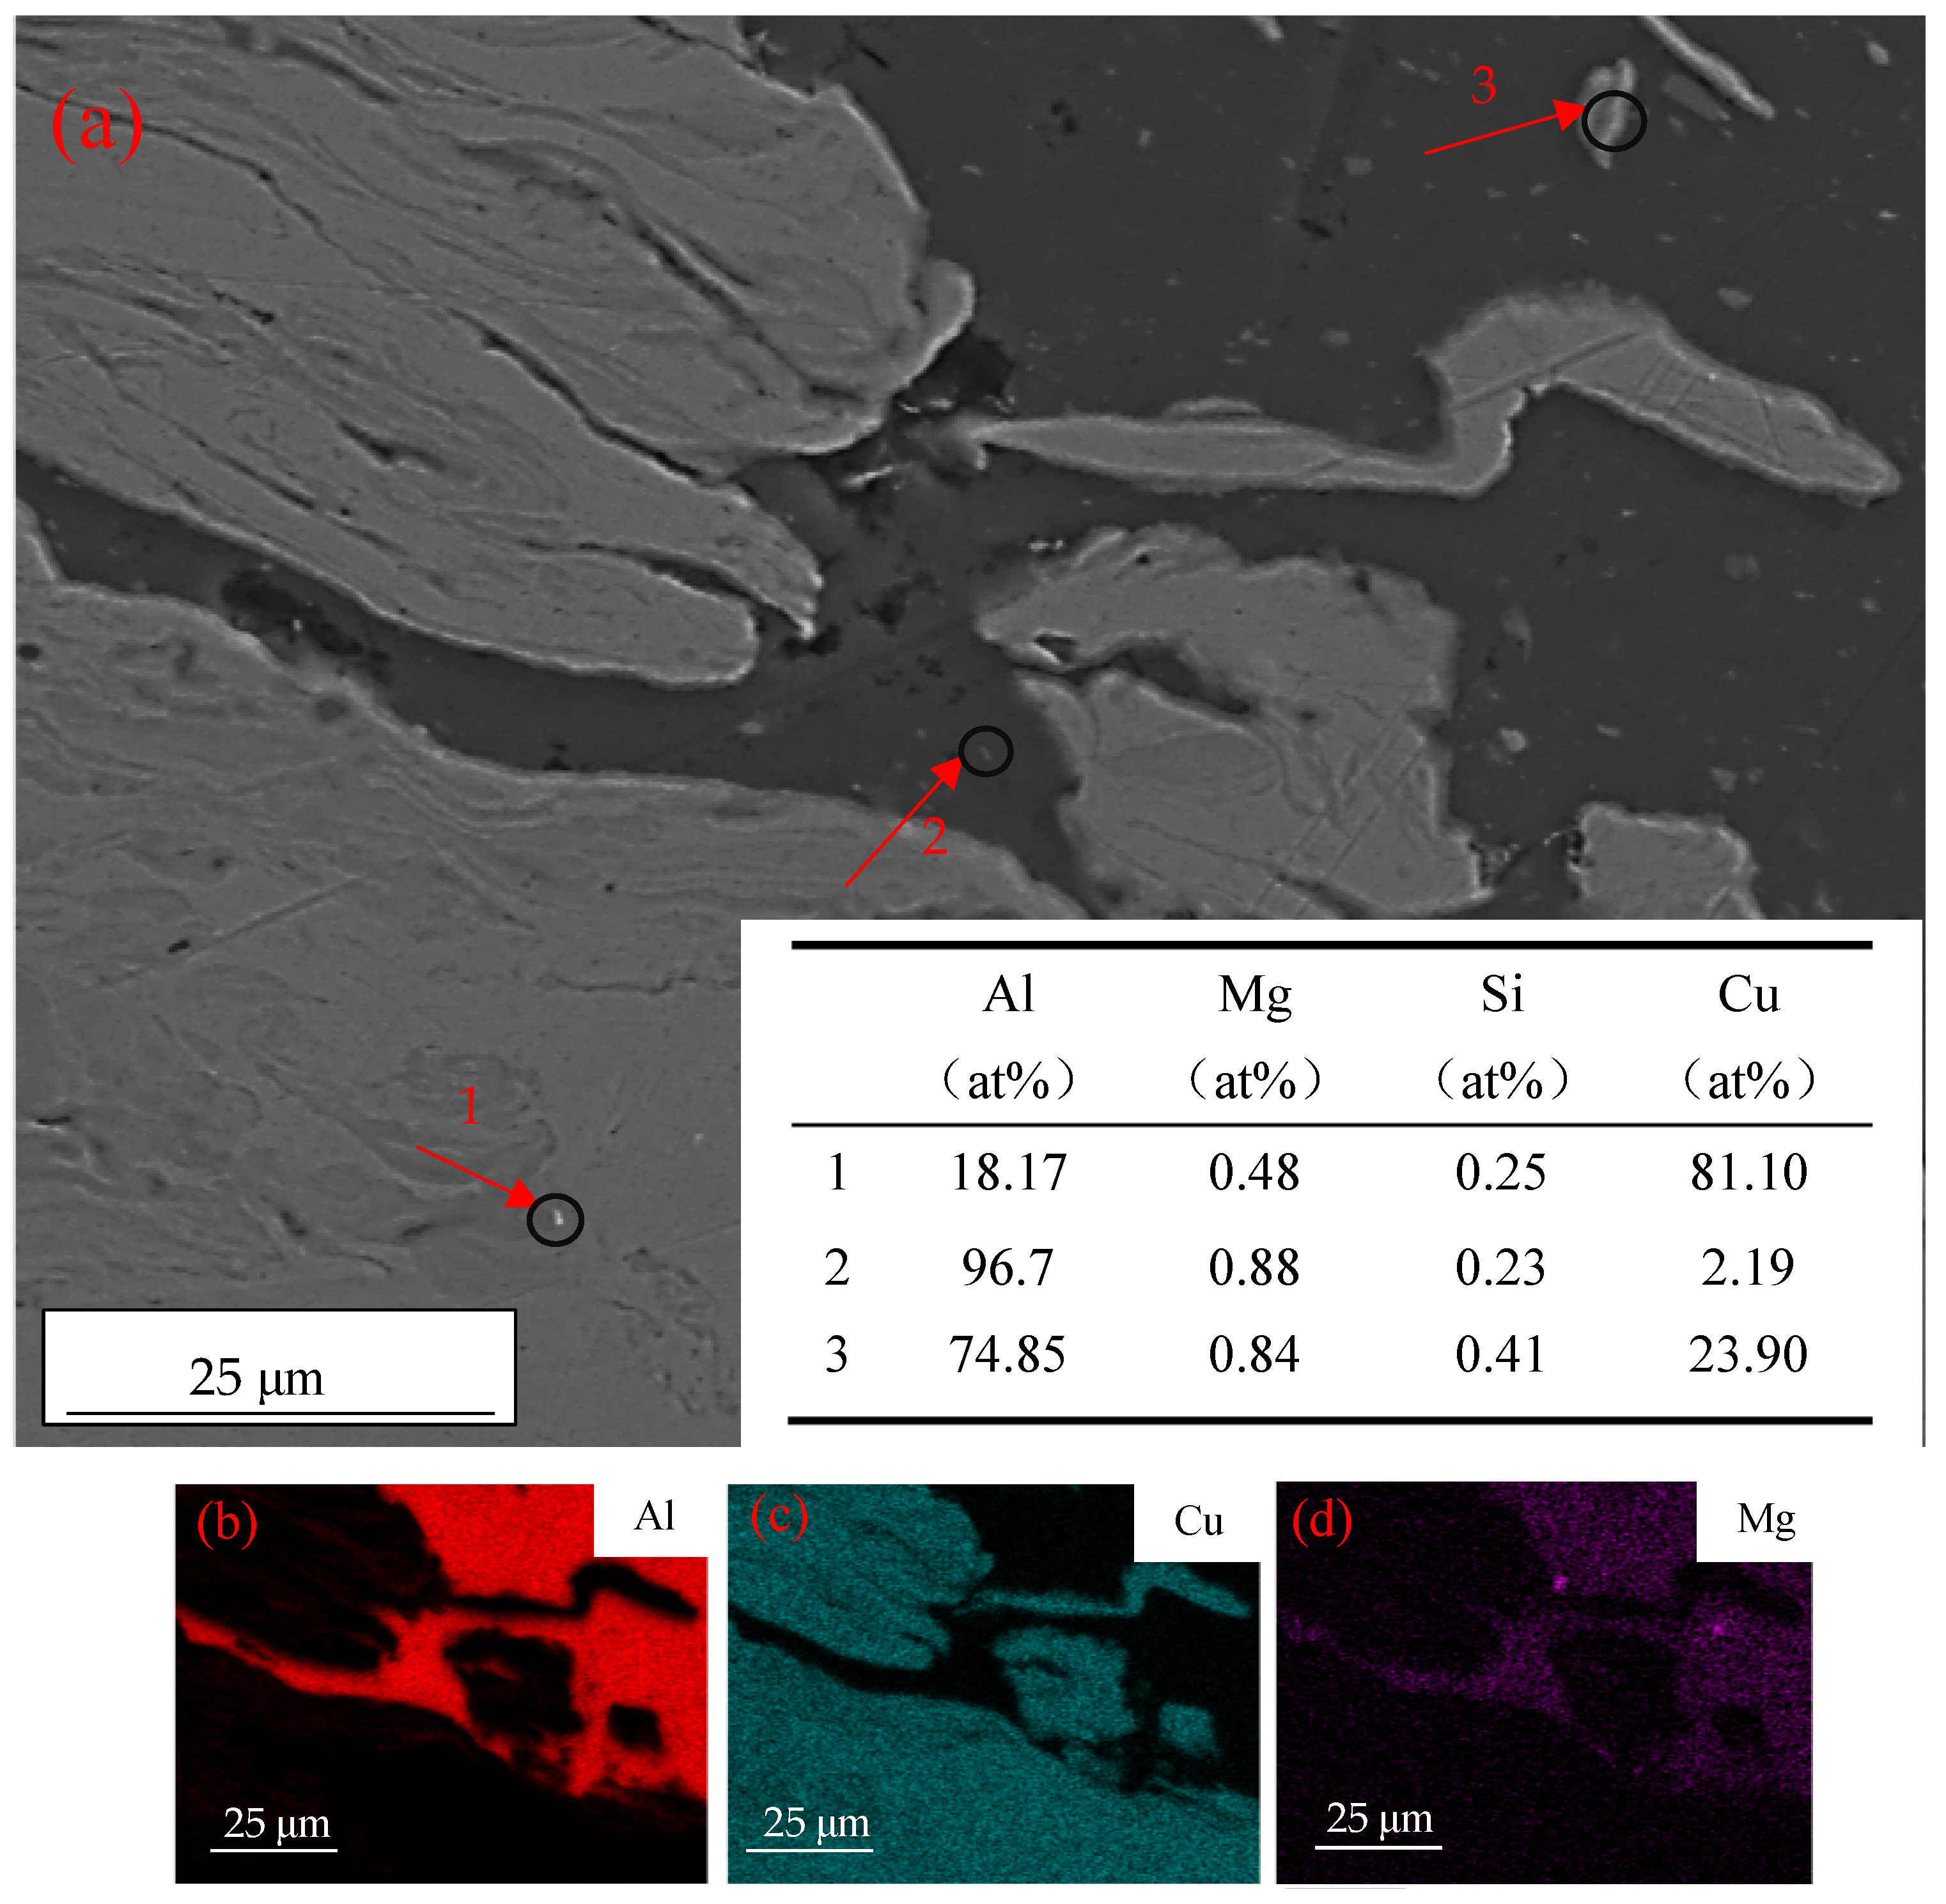
Metals 15 00193 g016
Figure 17. SEM images of the joint welded using a threaded tool and the corresponding EDS results ((a) SEM image of the joint and corresponding EDS results; (b) distribution of Al; (c) distribution of Cu; (d) distribution of Mg).
Metals 15 00193 g017
Table 1. Composition of the T2 pure copper.
ElementalCuZnSnPFeAl
Cu99.9570.0030.0010.0020.0020.024
Table 2. Composition of the 6061-T6 aluminium alloy.
ElementalAlSiFeCuMgCrZn
Al96.8150.6970.4950.3471.2620.1510.059
Table 3. Raw material properties.
MaterialTensile Strength (MPa)Melt (°C)Elongation (%)
Cu251.6108331.76
Al273.65839.36
Table 4. Tool dimensions and process parameters.
Process ParameterNumerical Value(s)
Shoulder diameter (mm)12, 16
Tool length (mm)2.7
Pitch (mm)1
Stir pin radius (mm)5.4 (root), 3.2 (top)
Rotation speed (rpm)1000, 1200, 1400
Welding speed (mm/min)70, 80, 90, 100
Table 5. Parameters of tools for simulations.
NumberShoulder DiameterTool Shape
Tool-110 mmUnthreaded
Tool-212 mmUnthreaded
Tool-314 mmUnthreaded
Tool-416 mmUnthreaded
Tool-516 mmThreaded
Table 6. Parameters in the Johnson–Cook constructive model for the 6061 aluminium alloy material and T2 pure copper.
MaterialA (MPa)B (MPa)Cnm T r e f
(°C)
T m e l t
(°C)
Al3241140.0020.421.3425583
Cu1125050.0090.421.68201083.4
Table 7. Temperature-dependent material properties of Al6061-T6.
T (°C)ρ (kg/m3) E (GPa)vα (10−6/°C) CJ/(kg∙°C)KW/(m∙°C)
25269066.940.3323.5945167
100269063.210.33424.6978177
149267061.320.33525.71000184
204266056.80.33626.61030192
260266051.150.33827.61052201
316263047.170.3628.51080207
371263043.510.429.61100217
427260028.770.4130.71130223
482-20.20.42-1276-
Table 8. Temperature-dependent material properties of the T2 pure copper.
T (°C)ρ (kg/m3) E (GPa)vα (10−6/°C) C J/(kg∙°C)KW/(m∙°C)
2089701190.3514385.2390
9389401170.3515397.74377.3
20489301000.3516401.93366.92
316893096.50.3517.1414.49358.26
4278930950.3518.1422.86349.61
5388920-0.3519.2439.61340.96
6498920-0.3520.1452.17334.03
7608920-0.3520.8473.10330.57
8718920-0.3521.4494.04325.38
9828910-0.3521.9519.16318.46
Table 9. Fracture characteristics of tensile specimens with different tool designs and base material placements.
No.Process ParameterFacture LocationFracture Mode
c16 mm Unthreaded ToolCopper–Aluminium Bonding SurfaceBrittle Fracture
dAl TMAZTough-Brittle Fracture
e16 mm Threaded ToolAl HAZToughness Fracture
fAl TMAZDuctile–Brittle Fracture
Disclaimer/Publisher’s Note: The statements, opinions and data contained in all publications are solely those of the individual author(s) and contributor(s) and not of MDPI and/or the editor(s). MDPI and/or the editor(s) disclaim responsibility for any injury to people or property resulting from any ideas, methods, instructions or products referred to in the content.

