1. Introduction
The fast growth in the wind energy market has increased the demand for stronger high-performance induction-hardened bearings due to the increasingly large mechanical loads on power transmission components. However, when high-carbon steels are quenched from austenite to martensite, microcracks have been observed in or around the martensitic structures [
1]. This phenomenon is known as “quench cracking”, which is mainly attributed to internal stress development during the phase transformation.
Quench cracking is most commonly believed to result from the impingement of two martensite plates [
2]. Larger strain fields at the tip of the impinging plates have been considered to be a key reason. Excessive quenching stresses due to improper heat treatments create undesired bearing parts with microcracks. Hence, the relationship between martensite and microcracks should be examined in more detail to identify how to avoid manufacturing-related defects.
Various factors, including martensite volume fraction, carbon content, prior austenite grain size, the morphology of martensite plates, and tempering treatment have been studied. Several works found the same correlation between the martensite volume fraction and the crack density [
3,
4,
5]. Davies et al. [
3] observed a drastic increase in crack frequency when the martensite volume fraction exceeds 70%. This was attributed to having more plates impacting one another due to a lack of austenite area available for growth, which can lead to significant stress accumulation at the interface.
The effect of carbon content on alloy susceptibility to quench cracking has drawn the attention of several researchers [
3,
4,
6,
7,
8]. While some works focused on exploring the effect of steel composition and carbon content [
3,
4], others fixed the composition and changed the heat treatment temperatures, which resulted in a variety of carbon contents in the matrix owing to carbide precipitation [
6,
7]. The studies found that increasing carbon content causes the crack area per martensite volume to increase up to 1.5 wt.% C. Since the carbon content is directly related to the tetragonality of the BCT martensite phase, it impacts the lattice compatibility of the parent and product phases. Plastic relaxation, therefore, becomes harder with increasing carbon content, which leads to microcracking. Dorofeyev et al. argued that microalloying of Al and V can decrease steel’s susceptibility to quench cracking [
9]; however, Davies et al. [
3] showed that the influence of carbon is more crucial than other substitutional elements such as Cr, Mn, and Ni. Studies on changing austenisation temperatures [
6,
7], on the other hand, are slightly more complex because of the combined effect of changing the austenite carbon content and austenite grain size. Higher heat treatment temperatures result in larger prior austenite grains. Additionally, the carbon content of the matrix increased with increasing heat treatment temperatures due to carbide dissolution. These studies [
6,
7] showed that the crack severity rises with increasing austenitising temperature. However, the main reason, whether the higher carbon content or the larger prior austenite grains, is unclear.
Regarding the effect of prior austenite grain size, researchers have reported contradicting effects. Whilst the works by Davies et al. [
3] and Apple et al. [
10] indicated that the prior austenite grain size and crack area per martensite volume are positively correlated, Marder et al. [
4] could not find any obvious relationship. It should be noted that the linear intercept method was used to find the crack severity, which involves crack area measurements being restricted to one dimension, i.e., where a randomly oriented line overlaps with a crack. Thus, the full length of the crack was not included in the calculations. Nevertheless, both studies share a common conclusion: the crack density should depend on the martensite plate length distribution.
This conclusion sounds logical, considering that larger plates should induce larger strain fields and regions for a crack to propagate. It explains the conflict among the works by suggesting that an increase in martensite plate size primarily increases crack length rather than the crack number density. Jena and Heich’s study [
11] showed consistent results for this phenomenon. The detailed works of Probst and Krauss [
12] demonstrated that the number density of intragranular microcracks, in particular, increased as the mean grain diameter increased by comparing samples with different grain sizes and identical carbon content.
Another factor controlling quench cracking is the morphology of the martensite plates. Firstly, the plates’ aspect ratio and length were considered to be crucial. The crack severity was found to be correlated with the length-to-thickness ratio of the martensite plates [
3]. Additionally, Chatterjee and Bhadeshia [
13] showed that the plate size distribution affects microcracking. Samples in which smaller plates outnumbered larger plates were found to be less prone to microcracking. The reason behind this is not clear and should be examined further.
Lastly, the impact angle between the plates that leads to cracking was suggested to be important in determining the location of the microcracks. Bai et al. [
1] claimed that microcracks tend to be located at the plate interface if the impingement angle is close to perpendicular. Otherwise, microcracks may propagate along the plate. They also suggested that the aspect ratio of the plates affects the location of the cracks. They proposed that while thinner plates are prone to internal cracking, thicker ones are more susceptible to forming interfacial cracks. However, more observations are needed to prove this theory.
Samuel et al. discussed that a large cooling rate difference between the surface and core of the material can induce significant residual stresses, which leads to unavoidable cracking. Nevertheless, residual stresses can be minimised by adopting careful quenching methods [
14]. Similar works [
15,
16] found that cracking behaviour decreased with slower cooling rates due to decreasing residual stress; however, it should be noted that both works reported a concomitant decrease in the martensite fraction, indicating close links between martensite evolution and the extent of cracking.
Finally, martensite tempering was also found to be important for quench cracking. Marder and Benscoter [
17] realised that the number of cracks severely decreases in tempered samples compared to as-quenched ones. Further increasing the tempering temperature above 200 °C, however, did not cause any improvements in crack severity up to 600 °C. The crack density started to decline after this temperature again. The decrease was attributed to the stress relaxation due to tempering in highly stressed regions, where cracks can form otherwise during the grinding and polishing steps. A second decrease at elevated temperatures was thought to be a result of the increasing carbon diffusivity that creates new carbides around existing cracks.
Balliett and Kraus [
18] focused particularly on the influence of the tempering time instead of the temperature. They found a significant reduction in the crack severity within the first ten minutes of tempering. After that, the crack density decreased at a slower rate with time. They claimed that the existing cracks may be healed due to austenite decomposition and the following plastic flow in the initial stage of tempering.
Even though the previous works provide significant information about the factors that influence quench cracking, there are several drawbacks to the characterisation methods that were utilised. The works concentrated on studying a single effect at a time, but the aforementioned factors are not independent; e.g., thermal processing simultaneously affecting the prior austenite grain size and carbon content in the matrix. This resulted in inconsistencies between different studies. Therefore, examining martensite morphology in more detail would give insights into the combined effect of these factors and would explain the reasons of contradicting results.
Also, most of the previous works focused only on quantifying the crack area density, which does not provide enough information about the physics behind quench cracking. This quantification method is inadequate for identifying where cracking is more likely to occur, how cracking is related to martensite transformation, or how the material and process design affect quench cracking.
In conclusion, previous studies incentivise investigating the fundamental relationships between microcracks and martensite plate structure; however, to avoid the shortcomings of the conventional methods, a new detailed analysis must be done to combine the aforementioned knowledge and develop an accurate theory to describe the physics behind quench cracking in plate martensite.
To accomplish that, this study introduces a new microcrack quantification technique that examines microcracking in terms of crack size, location within a martensite plate, crack alignment relative to the plate midrib, distance from the induction-hardened surface, and corresponding martensite plate size. The collected data is used to establish a relation between the martensite microstructure and microcracking in order to provide more detailed physical insights into the factors affecting and leading to quench cracking.
3. Microcrack Quantification Method
The most commonly adopted method for assessing crack severity in the literature is the lineal intercept analysis, which measures the number of cracks intercepting randomly oriented lines [
3,
4,
10]. The lineal intercept analysis can be performed relatively rapidly, but despite the convenience this provides, it has several drawbacks.
Firstly, the so-called “random lines” can lead to inaccuracies and skewed measurements if the line drawing process is not done carefully or if the line count is not high enough. Secondly, the amount of information obtained through lineal analysis is limited. It only gives the crack frequency (severity) per unit area. However, more comprehensive data are necessary to correlate the size and distribution of individual martensite plates and microcracking. Using optical microscopy allows for the gathering of significant information on microcrack distribution, size, and location. As a result, a new microcrack quantification method that aids in building relationships between martensite plates and microcracks is introduced in the current work.
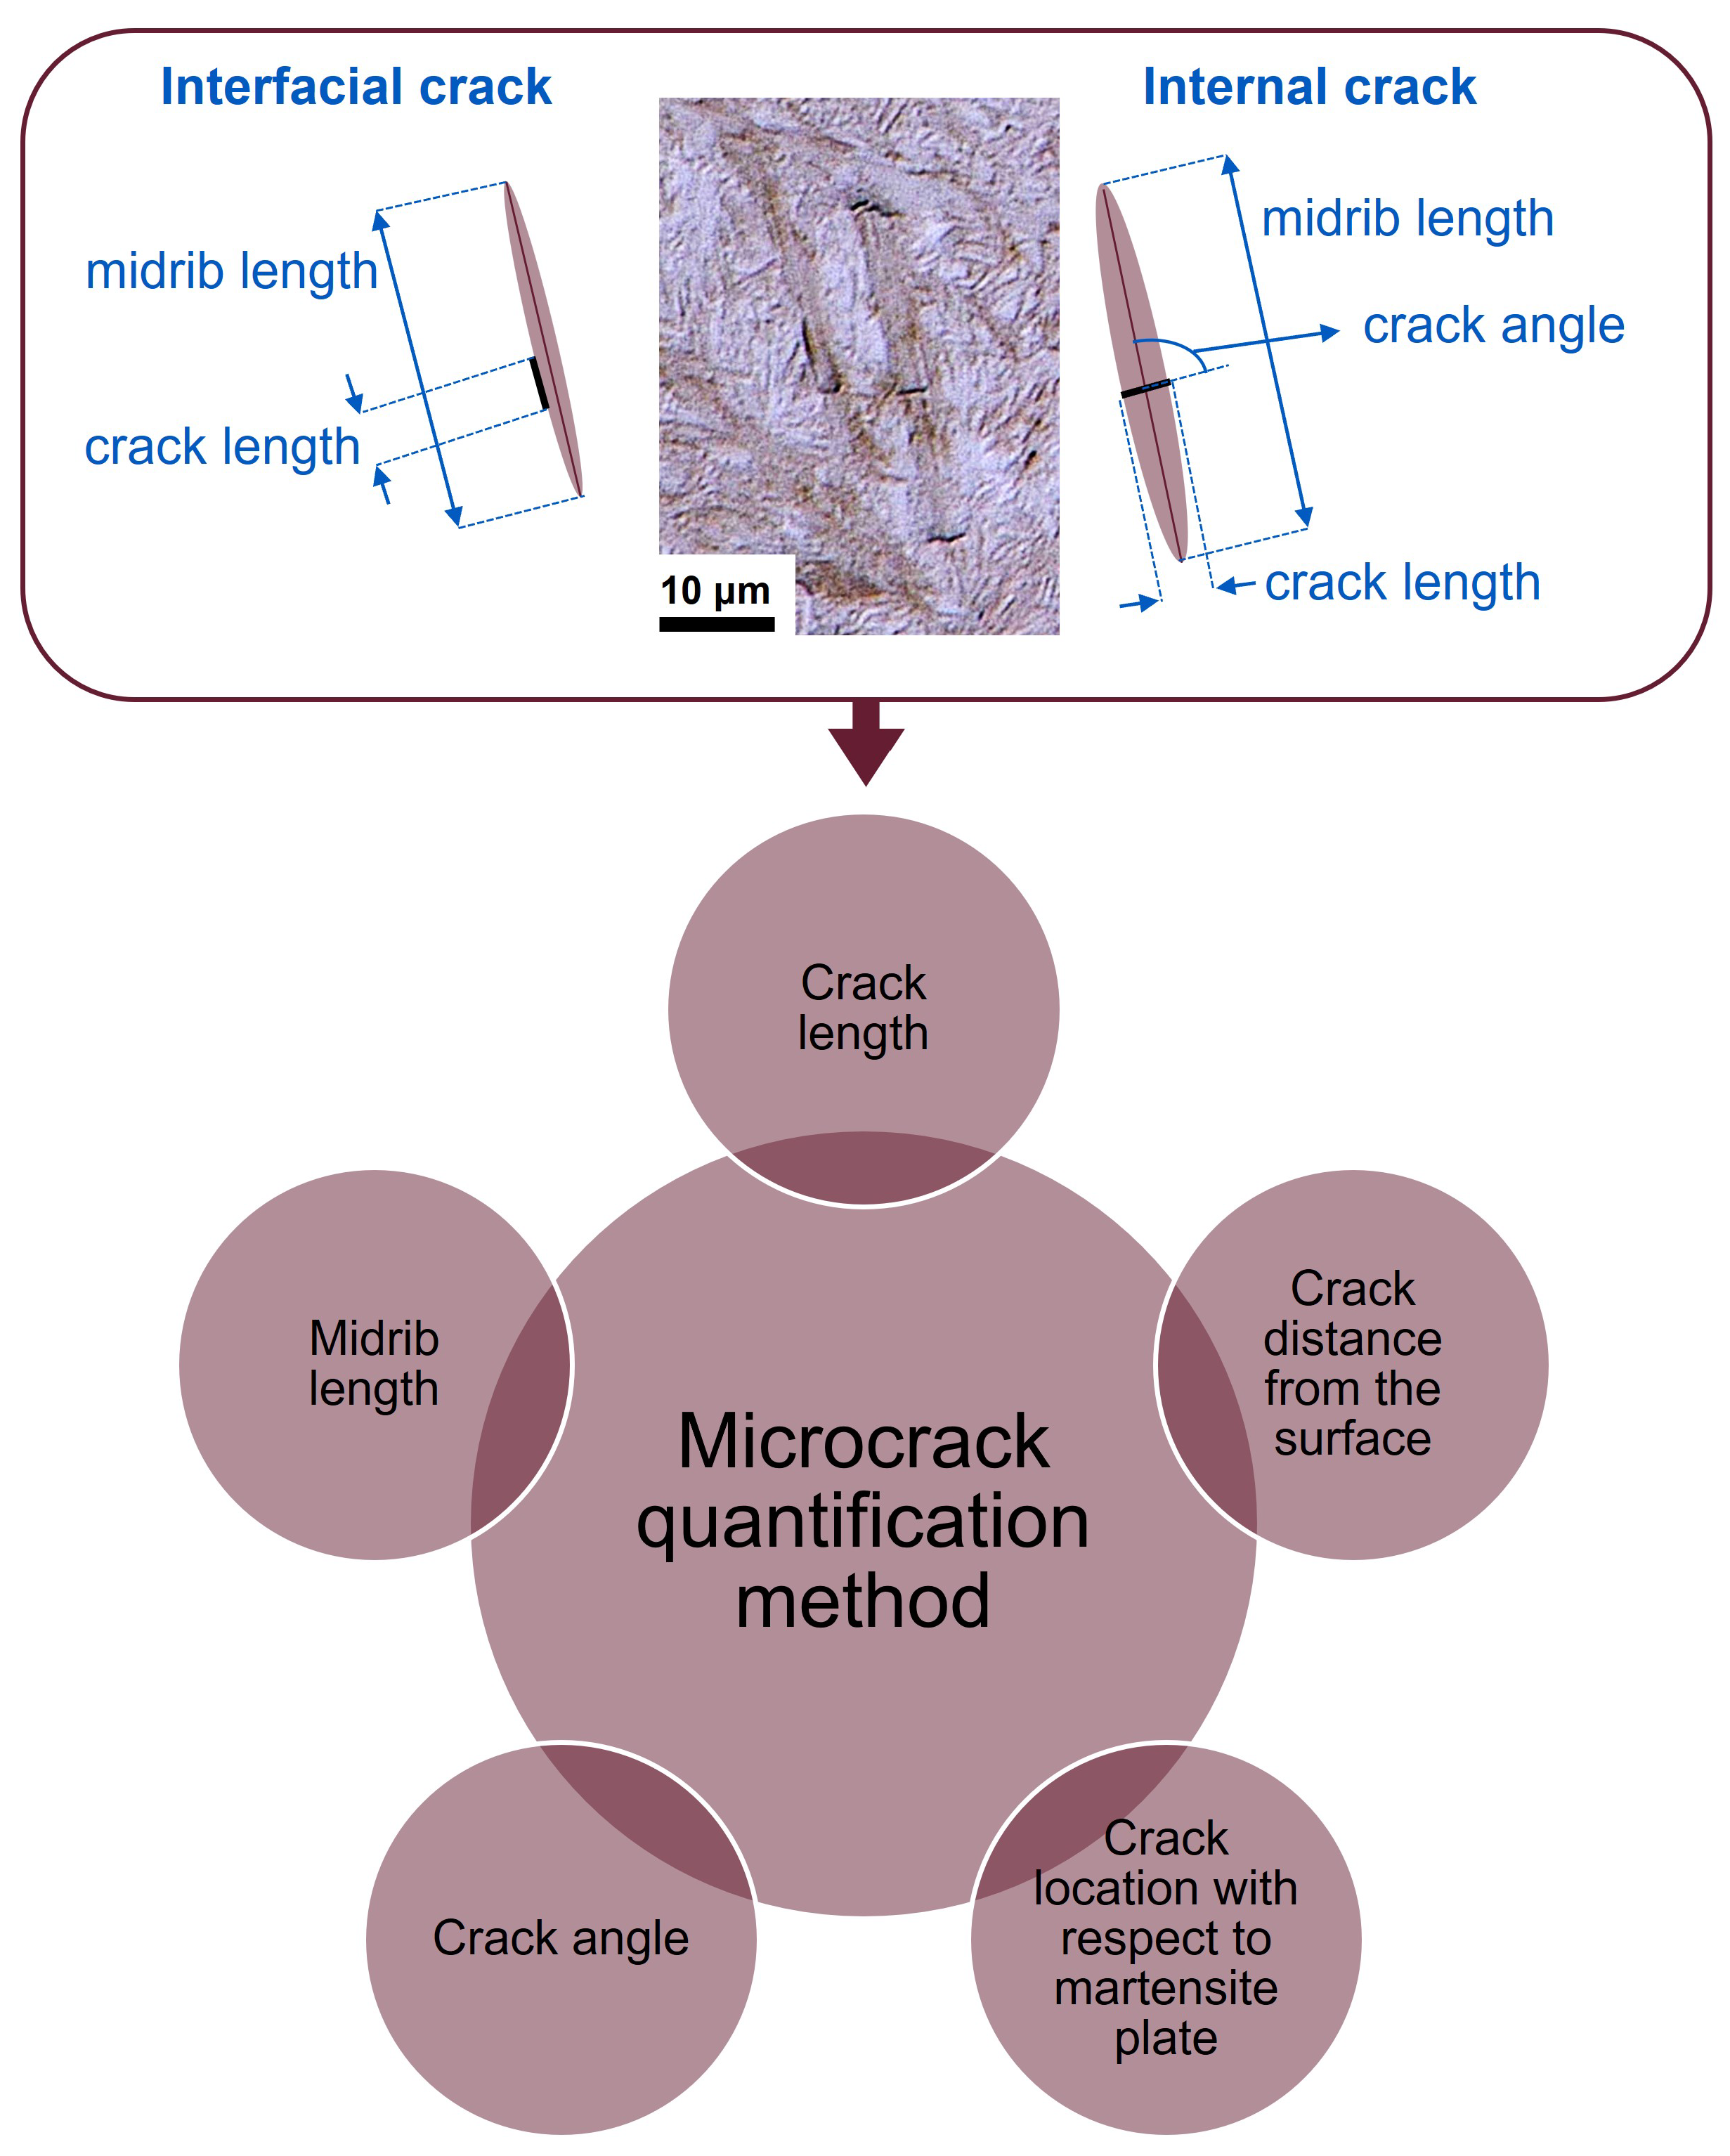
In the new method, instead of measuring the cracks that intersect pre-defined lines, all visible cracks in the image are analysed individually and thoroughly. In addition to the crack size, several crack features are included in the analysis, as indicated in
Figure 1.
Initially, the depth of the induction layer of the martensite plates from the sample surface is determined. Local temperature gradients can impact microcrack occurrence because martensite formation behaviour is different. Relating quench cracking with the local microstructure at various distances can lead to significant information about the possible relationships between microcracking and martensite plate morphology. Moreover, the location and position of a crack with respect to the impinging plates are gathered in this new quantification method.
According to Bai et al. [
1], the crack locations can be linked to plate size and impingement angle. Cracks are classified under two main groups, namely internal and interfacial cracks; the former appear inside martensite plates and the latter at the plate interface. Also, the angle between the microcrack and the midrib of the corresponding martensite plate is measured to study the possible origins of crack nucleation, and the dominant cracking direction is used to measure the angle.
Finally, the length of the plates that contain microcracks is also obtained through this analysis to assess the correlation between the microcracking behaviour and the prior austenite grain size. Previous studies have found a positive correlation between prior austenite grain size and crack density, and they attributed this phenomenon to the formation of larger martensite plates with coarser prior austenite grains and, thus, larger strain fields [
3,
10]. It also provides a comparison of the mean plate length for different microcrack types.
Due to the relatively low contrast between the martensite plates and retained austenite (compared to the high contrast of microcracks), as shown in
Figure 2, the microcrack area fraction and crack-plate relationship analysis have been done manually. Although the quantification in this work is conducted manually with the assistance of ImageJ software (version 1.54g), automation of this method is possible with further image processing and high-resolution experimentation.
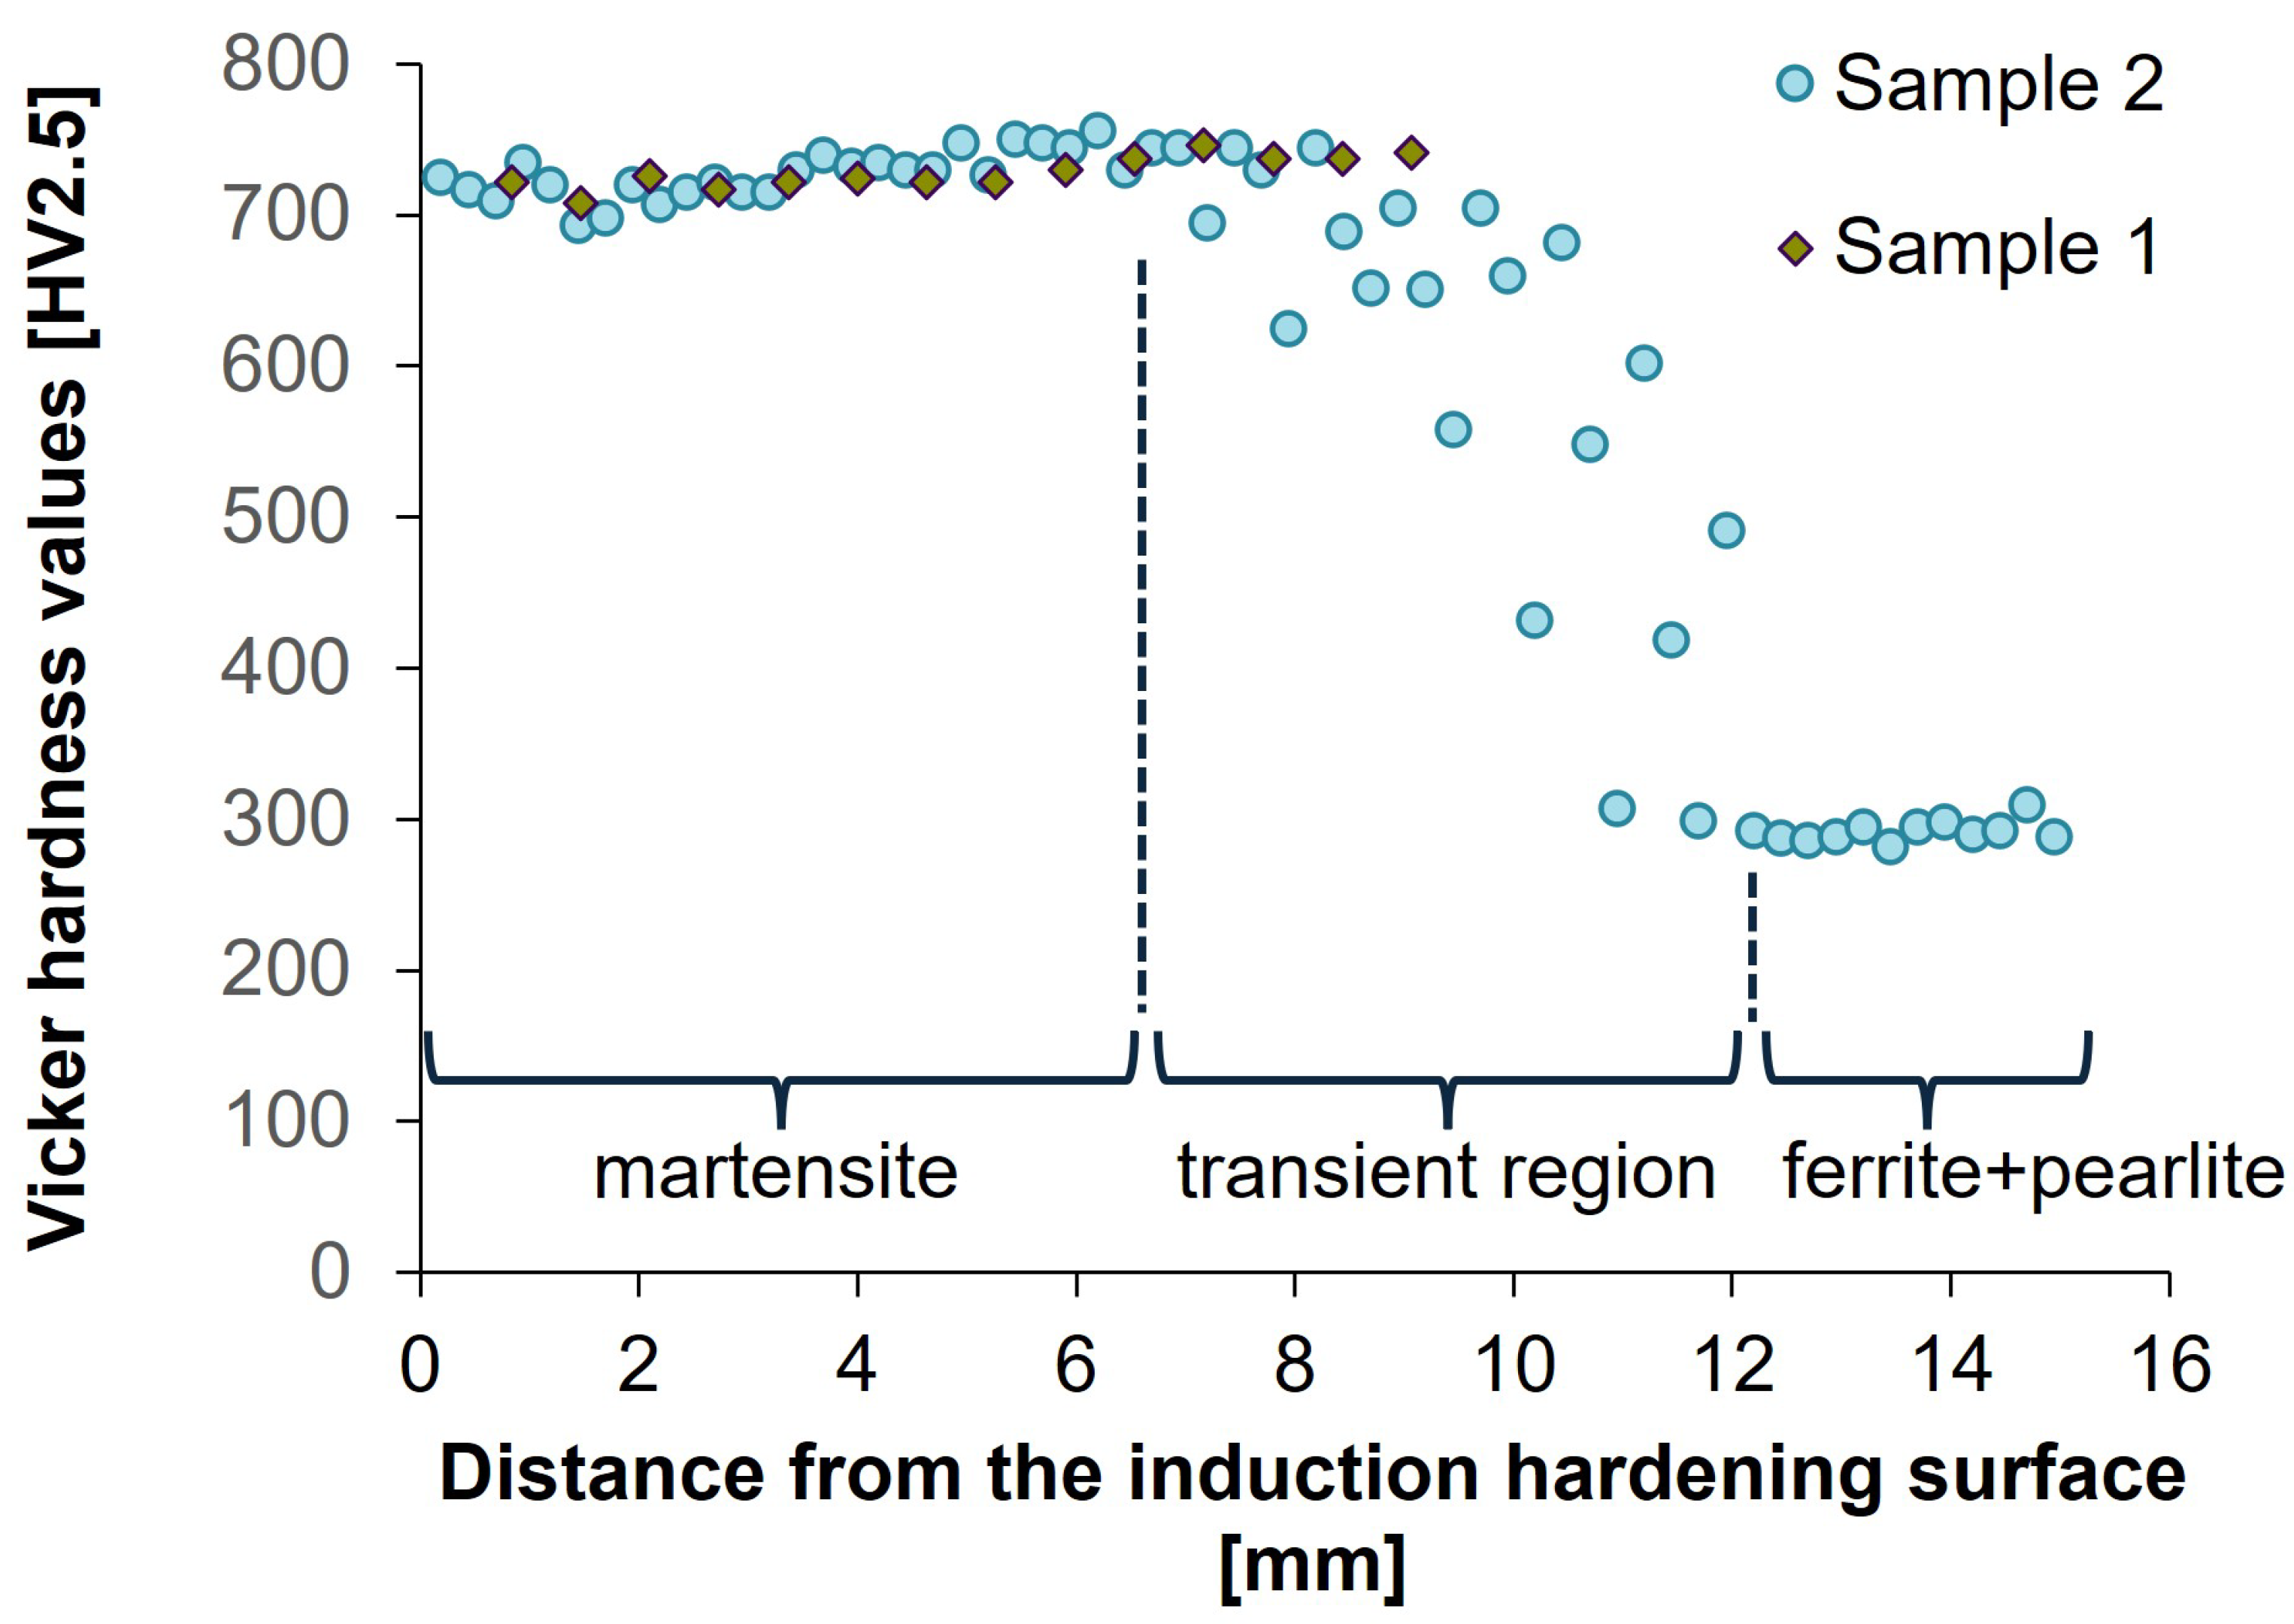
Several features of the microcracks and martensite plates were documented relative to the distance from the induction-hardening surface. Continuous images of two regions were scanned up to a 10 mm distance from the surface. Vickers hardness tests were conducted from the case-to-core region of both samples to determine this distance, as schematically shown in
Figure 3. At around the 10 mm depth from the surface, the microstructure changes, most likely into ferrite, and no evident martensite plates were visible.
4. Results
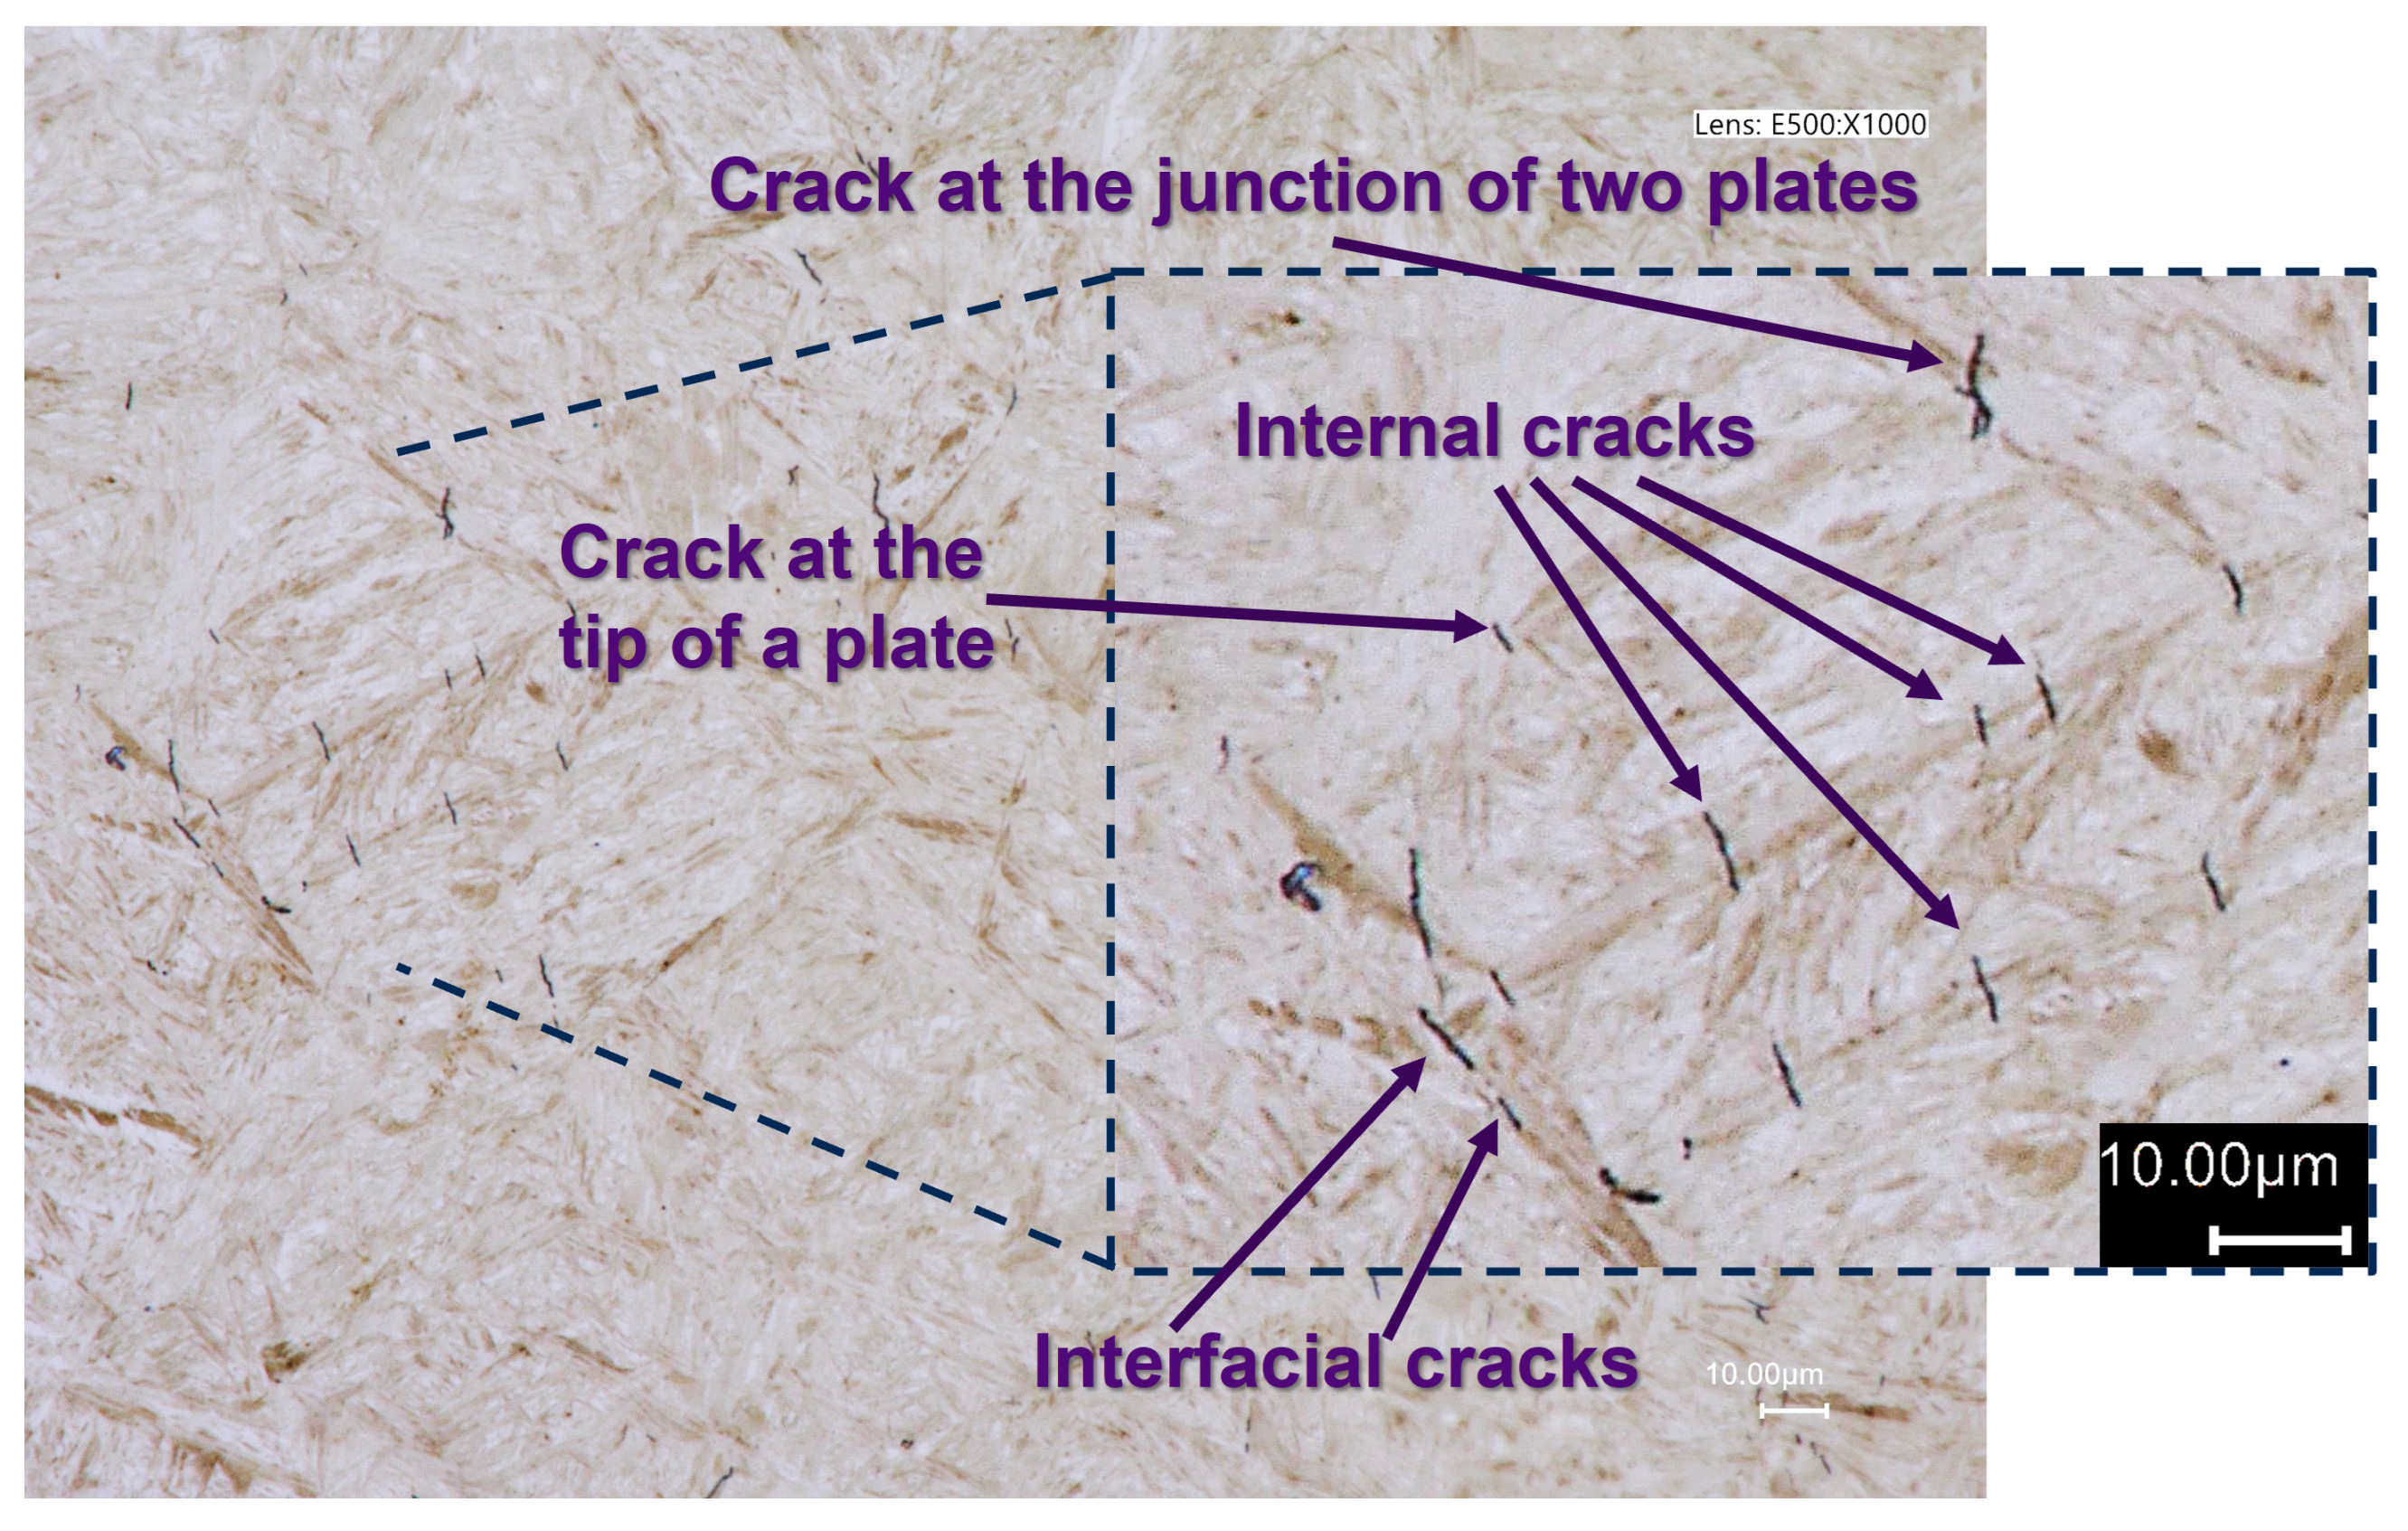
From the optical images, several locations where a crack appeared within martensite plates were identified, as shown in
Figure 4. First, it was observed a relatively low number of cracks forming at the junction of two martensite plates, this location is consistent with the impingement theory commonly accepted in literature [
1]. One can attribute the low frequency to the fact that the images were taken in two dimensions, which restricts the possibility of capturing an impingement plane in 3D. As a result, the second martensite plate could be appearing the third dimension, but is not visible in the image. Furthermore, the cracks at the plate intersections were observed to grow at specific locations, either inside of martensite plates or at the interface between the martensite plate and the retained austenite. These features also support the impingement theory and allow one to classify microcracks more effectively. Consequently, plate intersection cracks were thought to cover all cracks and were not used as a specific group in this work.
Another less common location for crack formation is at the tip of a plate. Although only one plate is visible in this group, it can reasonably be assumed to be identical to the cracks at the intersection points. All of the cracks at the tip of a plate were perpendicular to the midrib of the corresponding plate. Based on this observation, one may conclude that the crack nucleated at the intersection of two plates grew through the interface of a plate, which was not visible in the plane in which the image was taken.
The third group, which covers a large proportion of the observed cracks, is defined as the cracks that develop inside a martensite plate and intercept its midrib. This group is referred to as internal cracks for the rest of this work. Even though the impingement theory suggests that this type of crack occurs due to a large impingement angle forming between two martensite plates, our observations do not support this notion. In most cases, either the second plate was not visible or the impingement angle was relatively lower. However, it should be emphasised that our analysis has been done in two dimensions, and there can possibly be an impinging plane with a larger angle in the third dimension.
The final group, which is referred to as interfacial cracks, includes the cracks propagating throughout the interface between the martensite plate and the retained austenite. The only difference between the tip cracks and interfacial cracks is that the interface of the plate is visible in the latter. The former, on the other hand, shows an impinging plate. Therefore, the former group is part of the interfacial crack group. In this work, internal cracks and interfacial cracks were selected as the main crack groups since they effectively represent distinct locations of the microcracks’ appearance.
The microstructures were observed under the optical microscope at a given depth from the induction-hardening surface in a 1200 mm
2 area of Sample 1, and cracks were examined in detail in five randomly selected regions of Sample 1. Three of them are only examined in terms of crack length; locations 1 and 2 are quantified in more detail. Optical images taken from approximately a depth of 1000 μm from the surface are provided in
Figure 5. Four different locations in
Figure 5 exhibit similar microstructures when examined at the same distance from the surface, corroborating the consistency of the measurements. The crack length distributions of locations 1 to 5 are shown in
Figure 6. The mean crack length in a 435,000 μm
2 total area of the four regions varies between 3 and 5 μm. Although the number density of cracks and average crack length changes in different regions, the crack length distribution demonstrated a similar trend. The majority of the cracks have length smaller than 3 μm, and only a few cracks are longer than 8 μm.
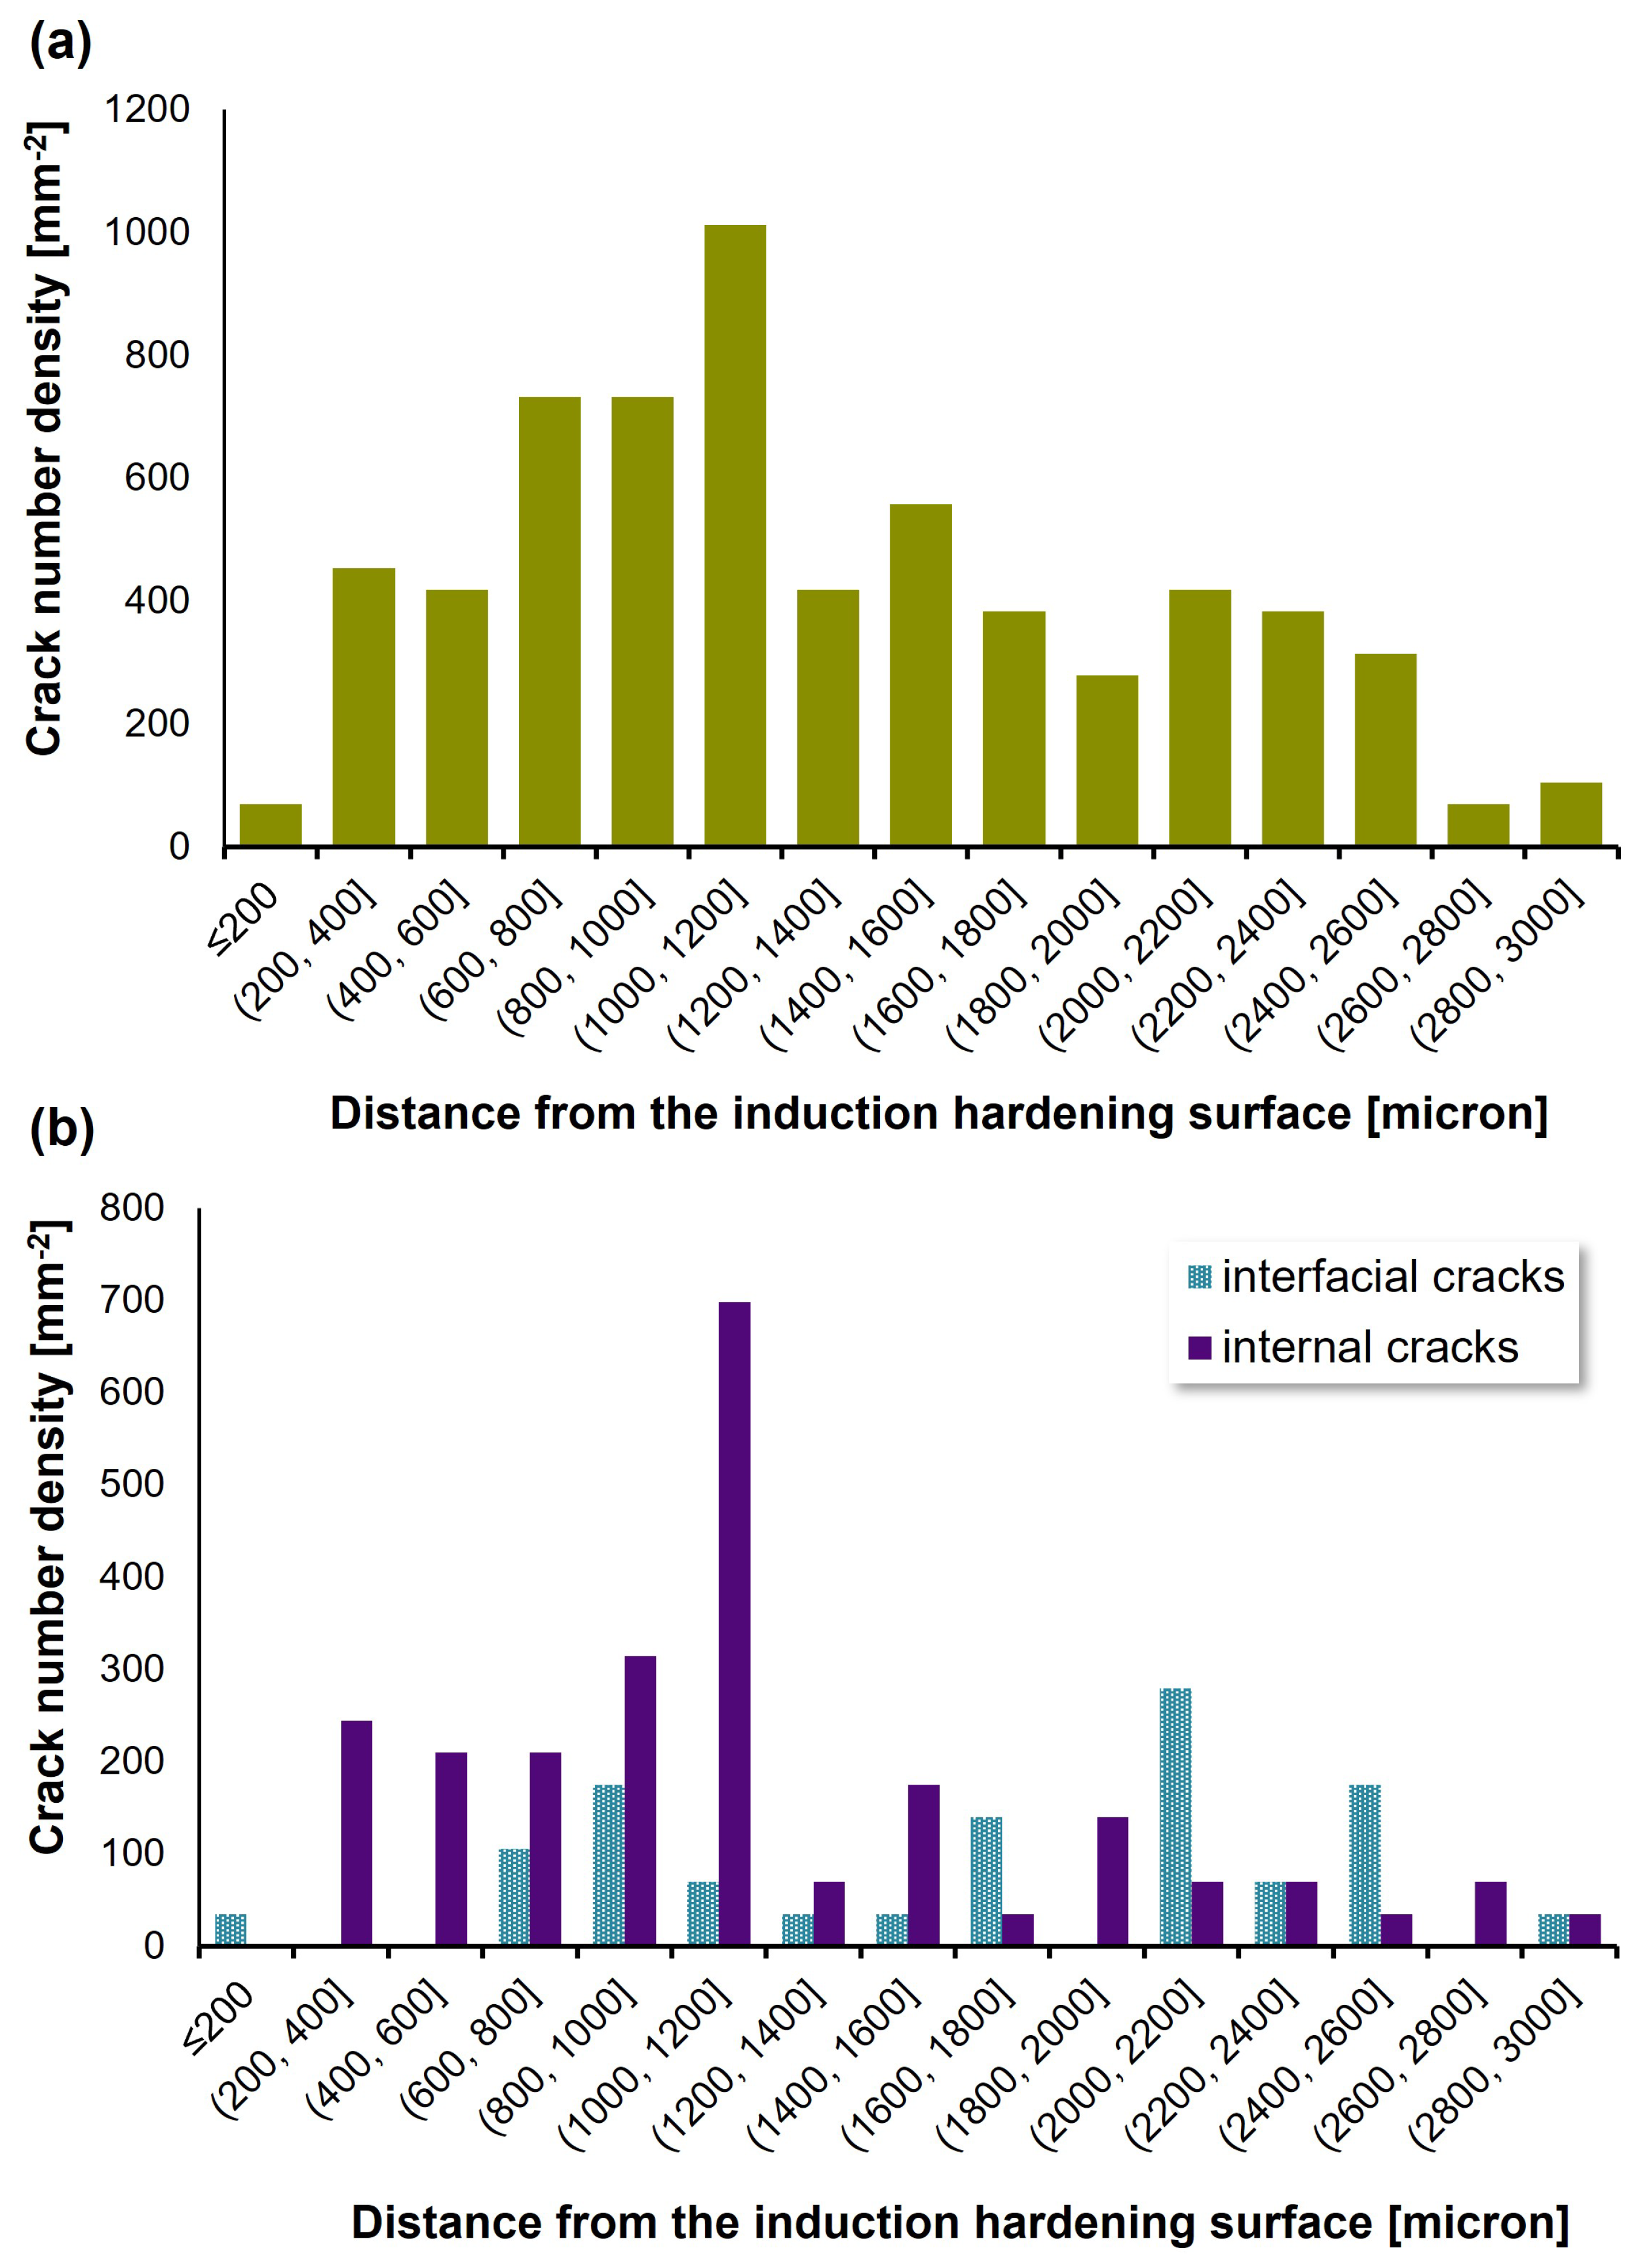
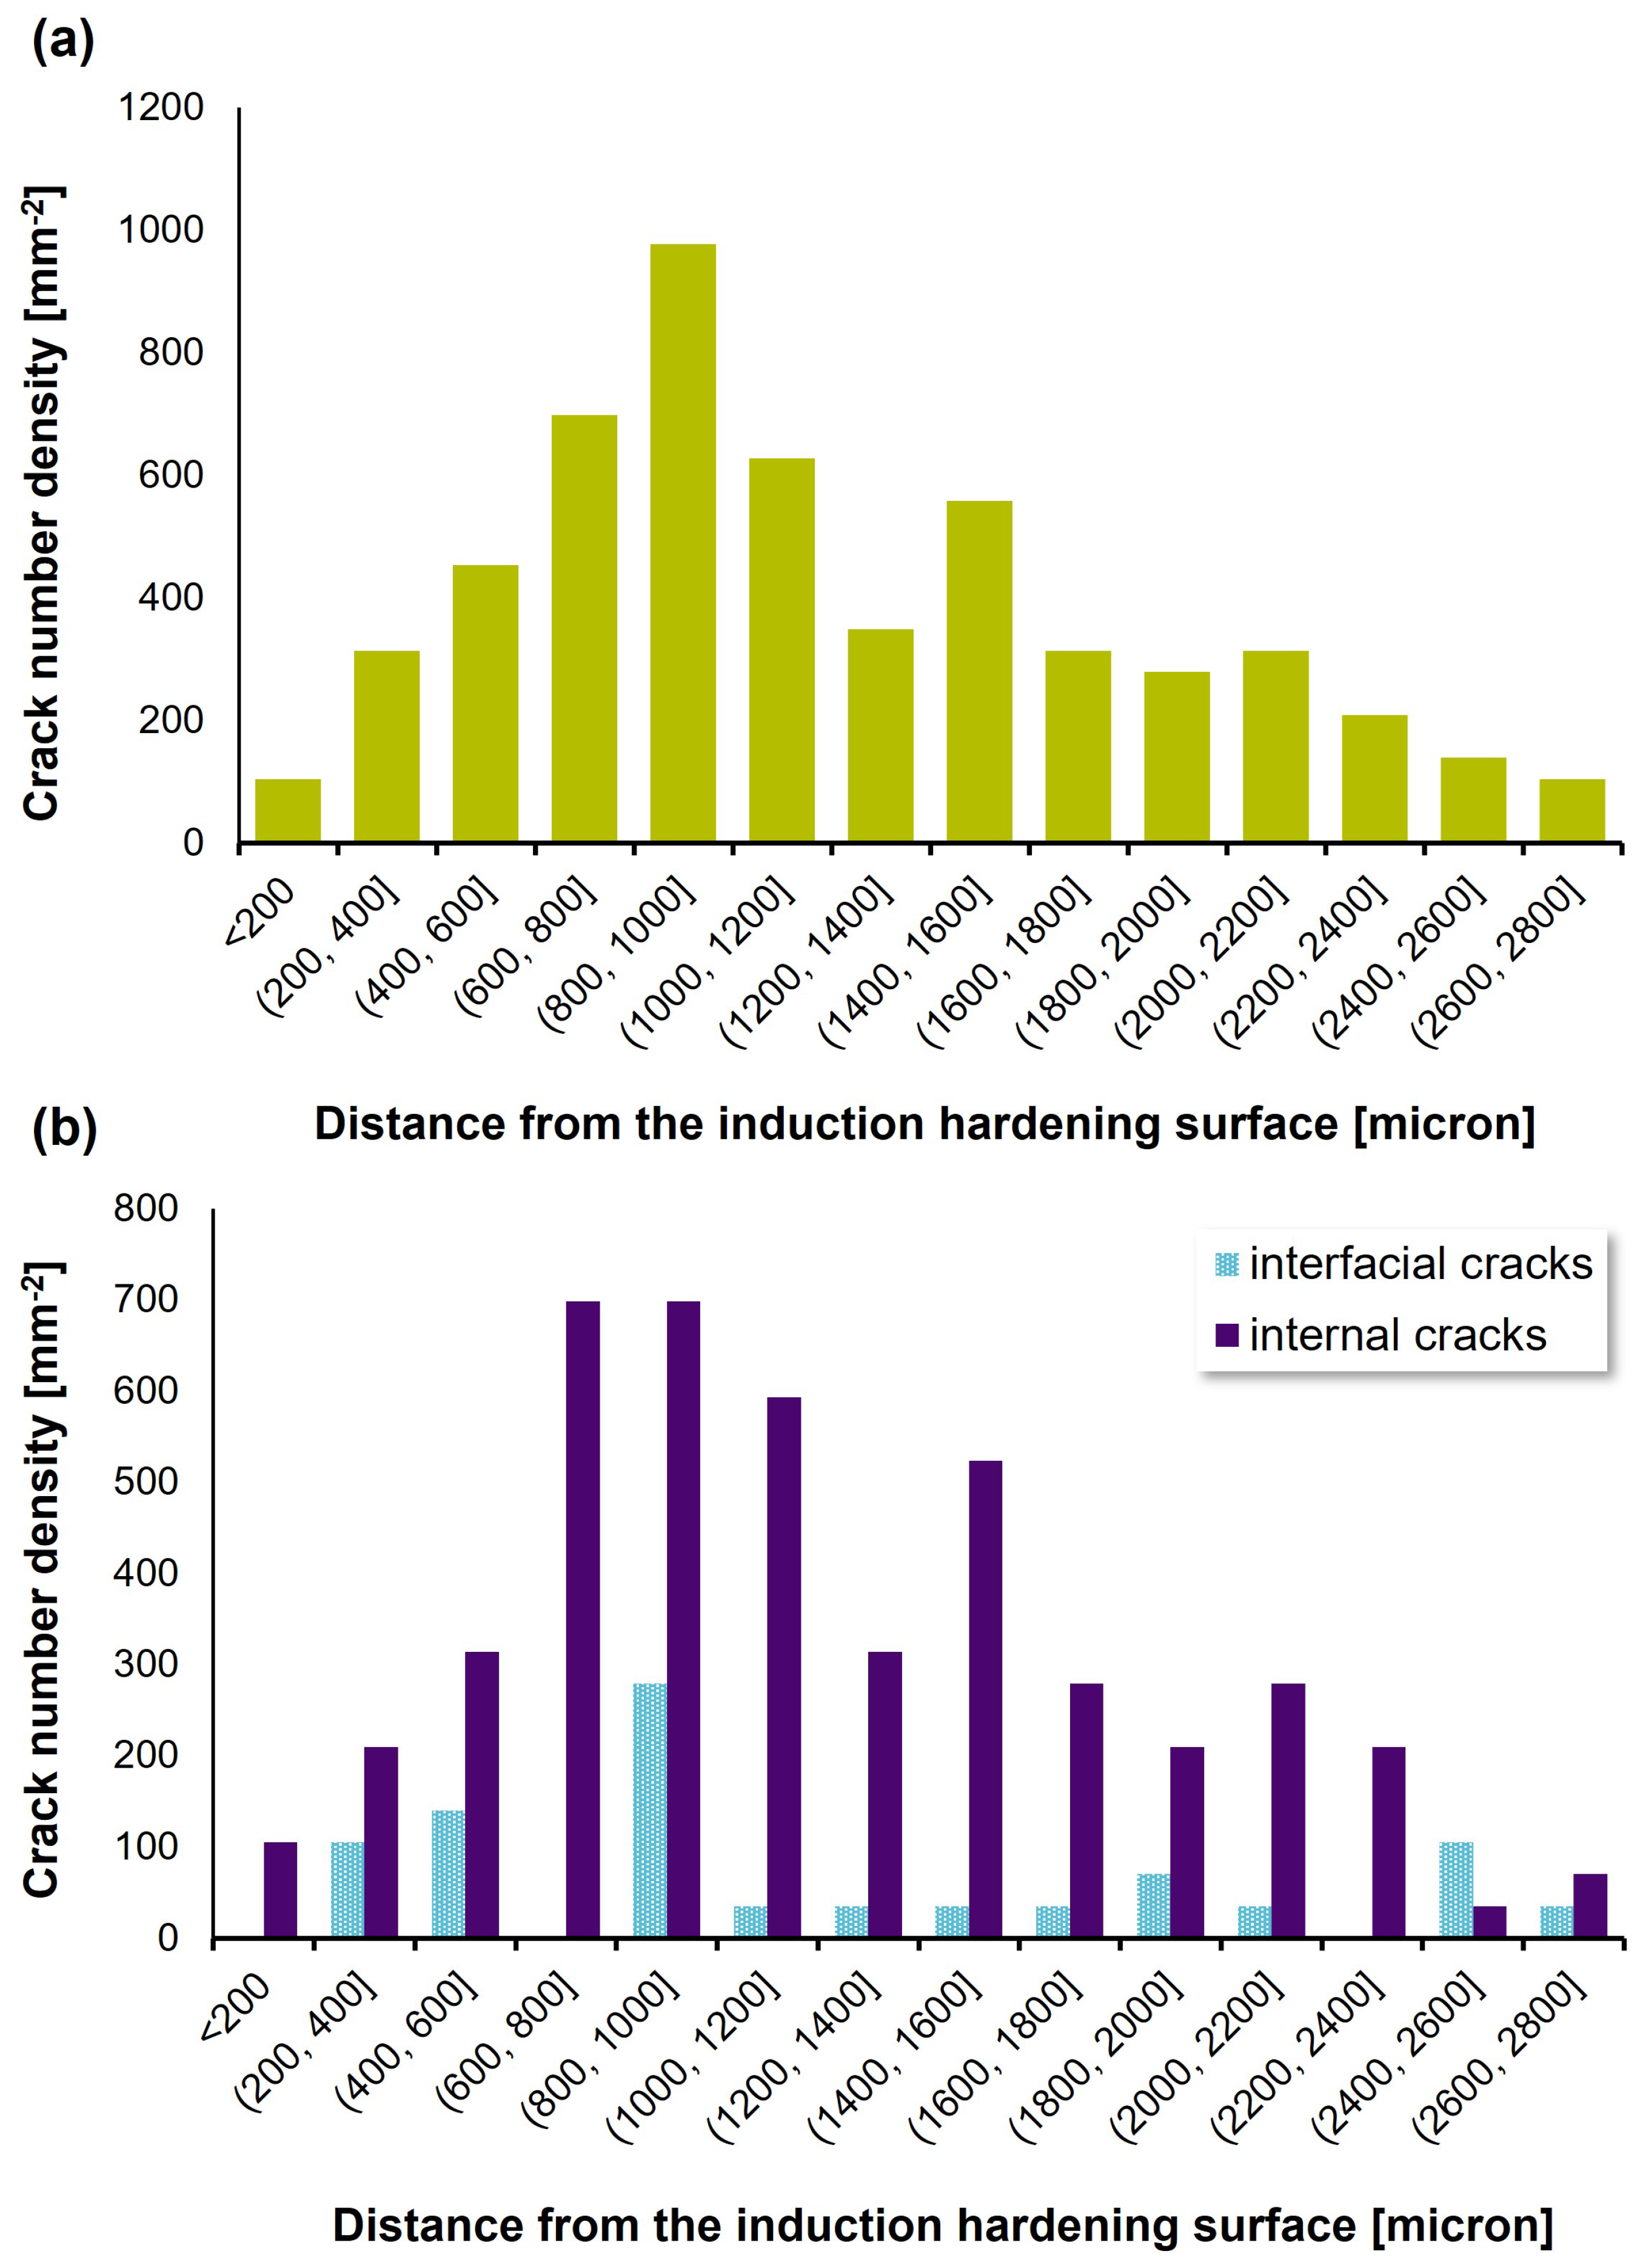
The crack distribution with respect to the distance from the induction surface is plotted in
Figure 7. The figures include the distribution of all cracks (a), as well as the distribution of the interfacial and internal cracks separately (b). The most remarkable finding of this analysis is that the highest amount of microcracks was found around ∼1 mm below the steel surface in both cases. Below this depth, the number of cracks decreased significantly reaching a minimum number density at ∼1.3 mm below the induction-hardening surface. As shown in
Figure 7b, below 1.3 mm depth most cracks are interfacial. Conversely, for the second region, most cracks are internal cracks below the same depth, as depicted in
Figure 8b. For both regions, the farthest microcracks were identified at ∼3 mm below the induction-hardening surface; nevertheless, the martensitic structures were found up to 10 mm away from the induction surface. According to
Figure 3, the microcracked regions are within the martensitic microstructure zones and far from the martensite–ferrite transient zone. This observation confirms that quench cracking occurs at the martensitic regions and likely depends on changing the local thermal history with the distance from the induction-hardened surface.
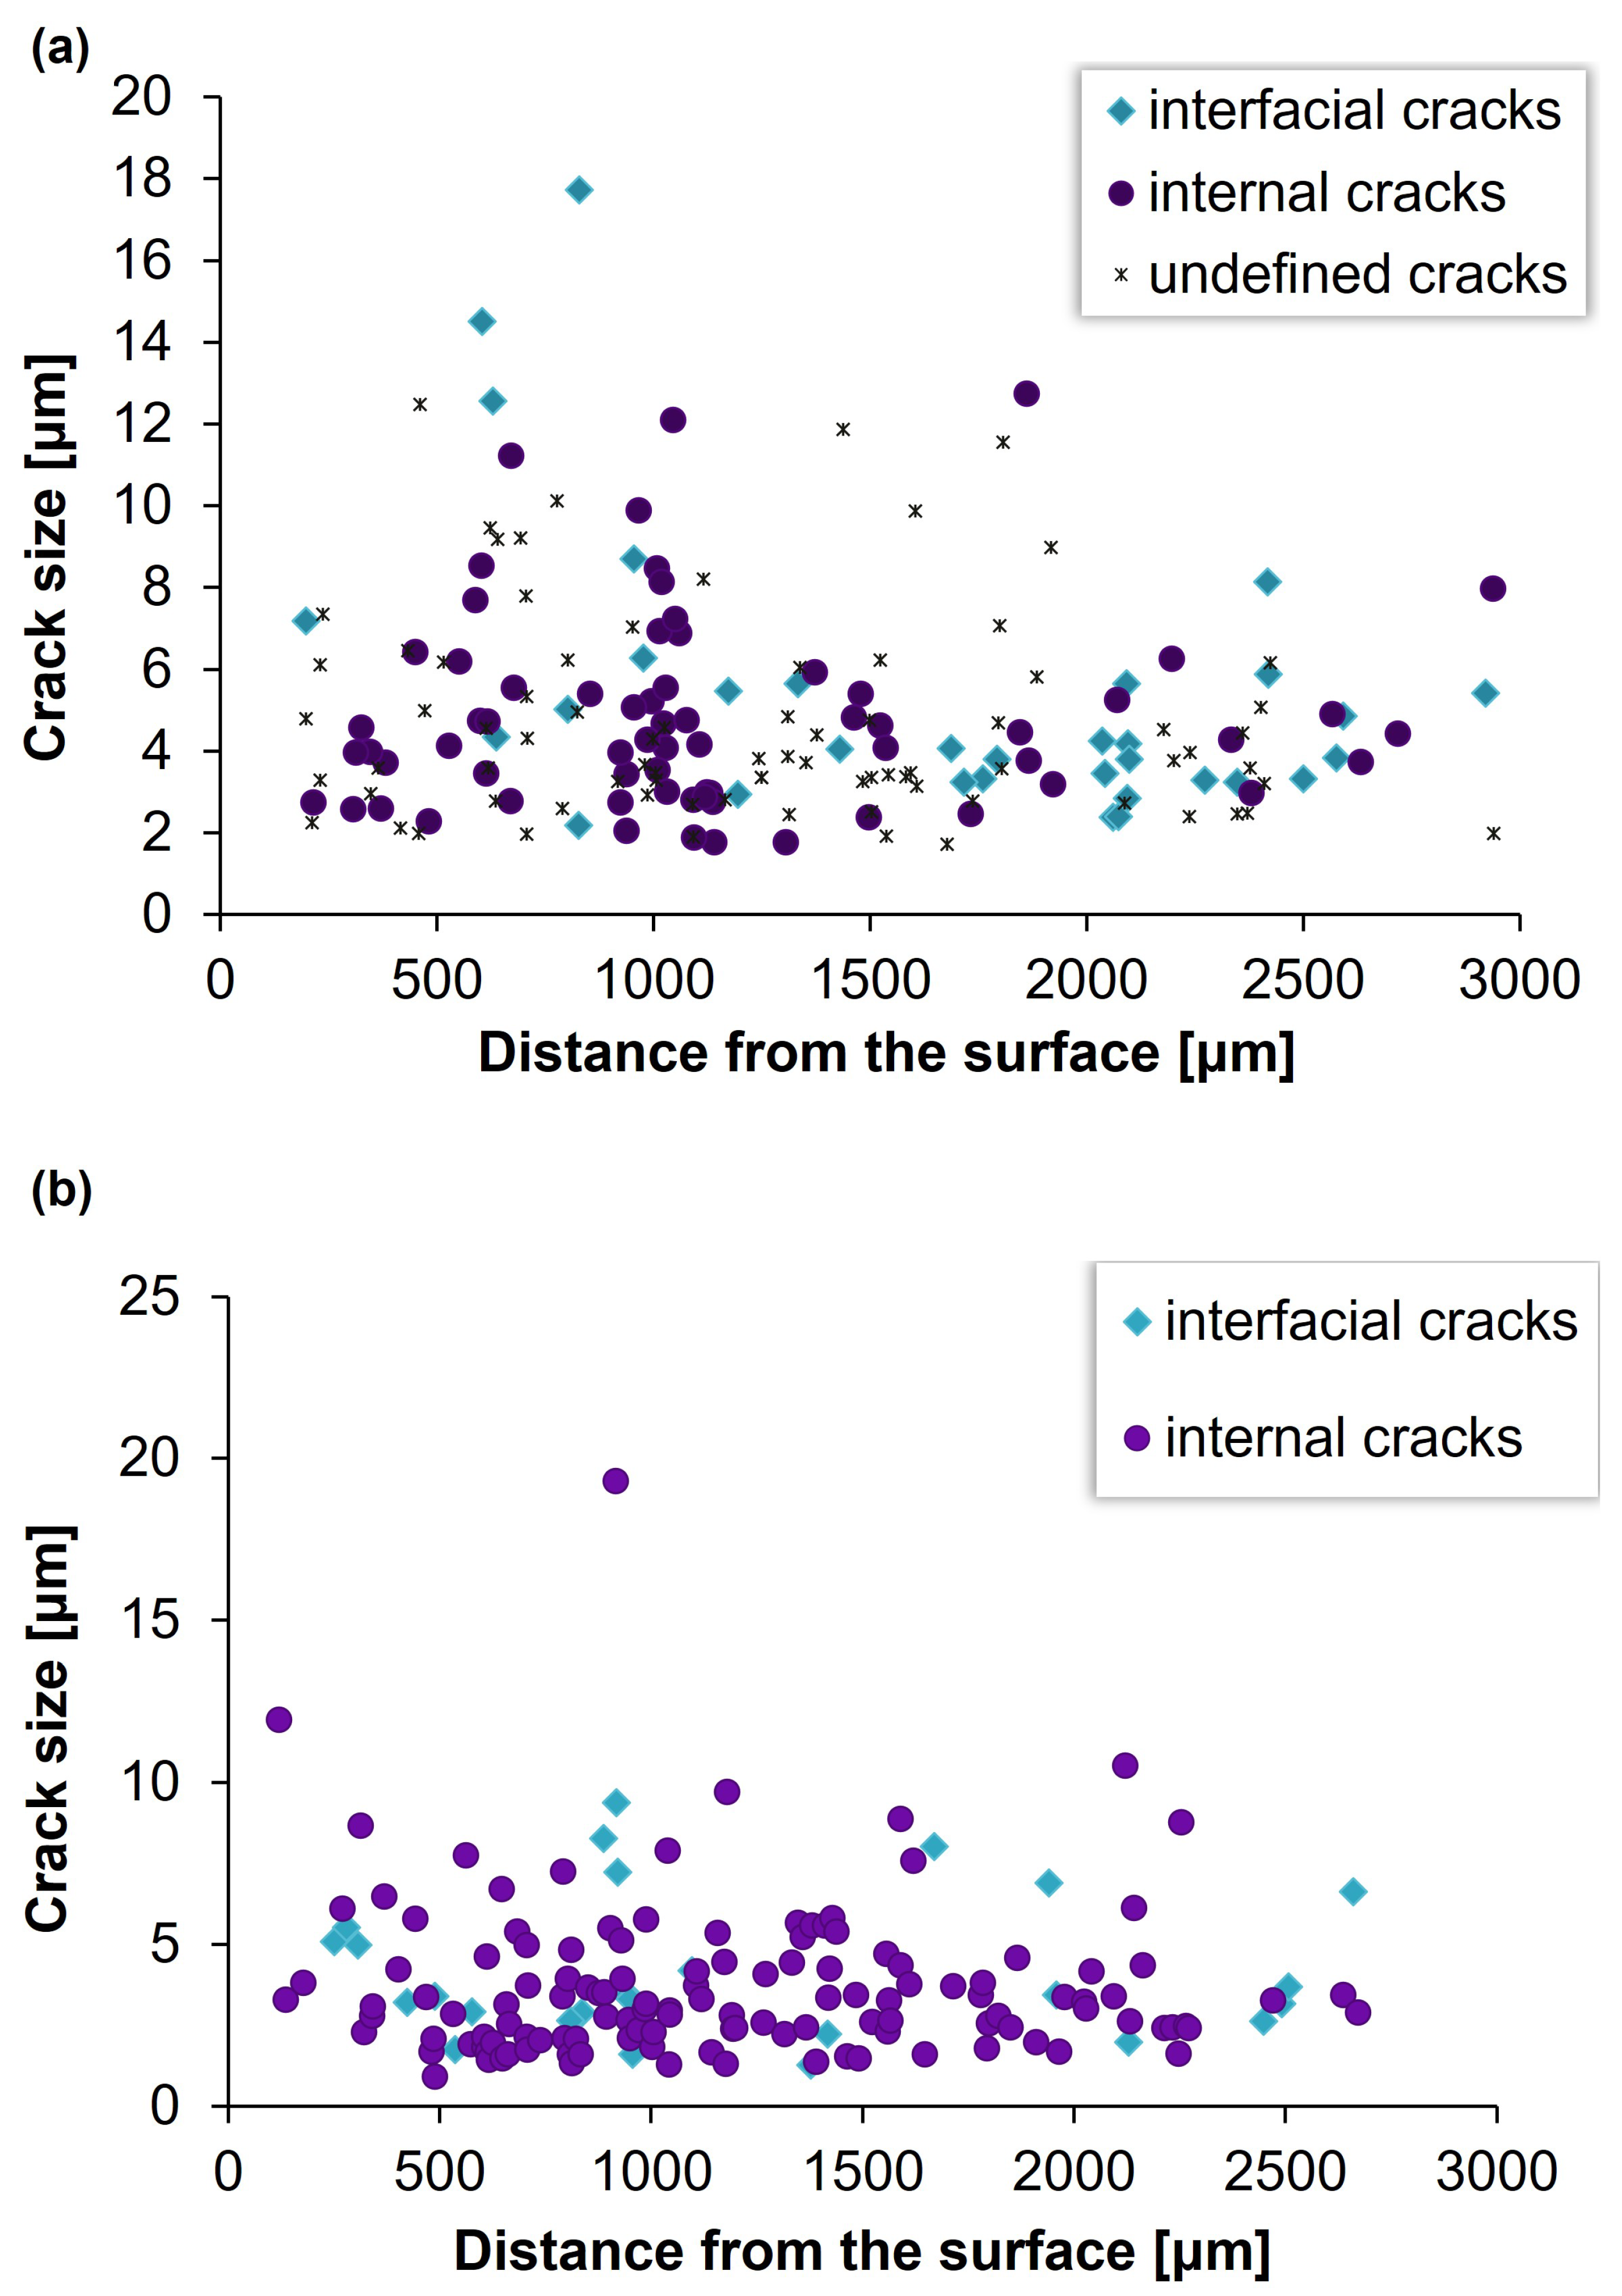
Figure 9 shows the crack size distribution for the first and second selected locations in Sample 1. The longest cracks were observed between 0.8 and 1 mm away from the induction-hardening surface in both cases. While the longest crack was approximately 18 μm in the first location, it was measured to be as large as 19.3 μm for the second region. The average microcrack sizes for the first and second regions in Sample 1 were 4.9 and 3.8 μm, respectively. The smallest crack detected with optical microscopy is 0.91 μm; higher resolution can be achieved through SEM. Also, high-resolution techniques can lead to more detailed analysis related to the nature of crack initiation, which is beyond the scope of the current study, but can be addressed in future work.
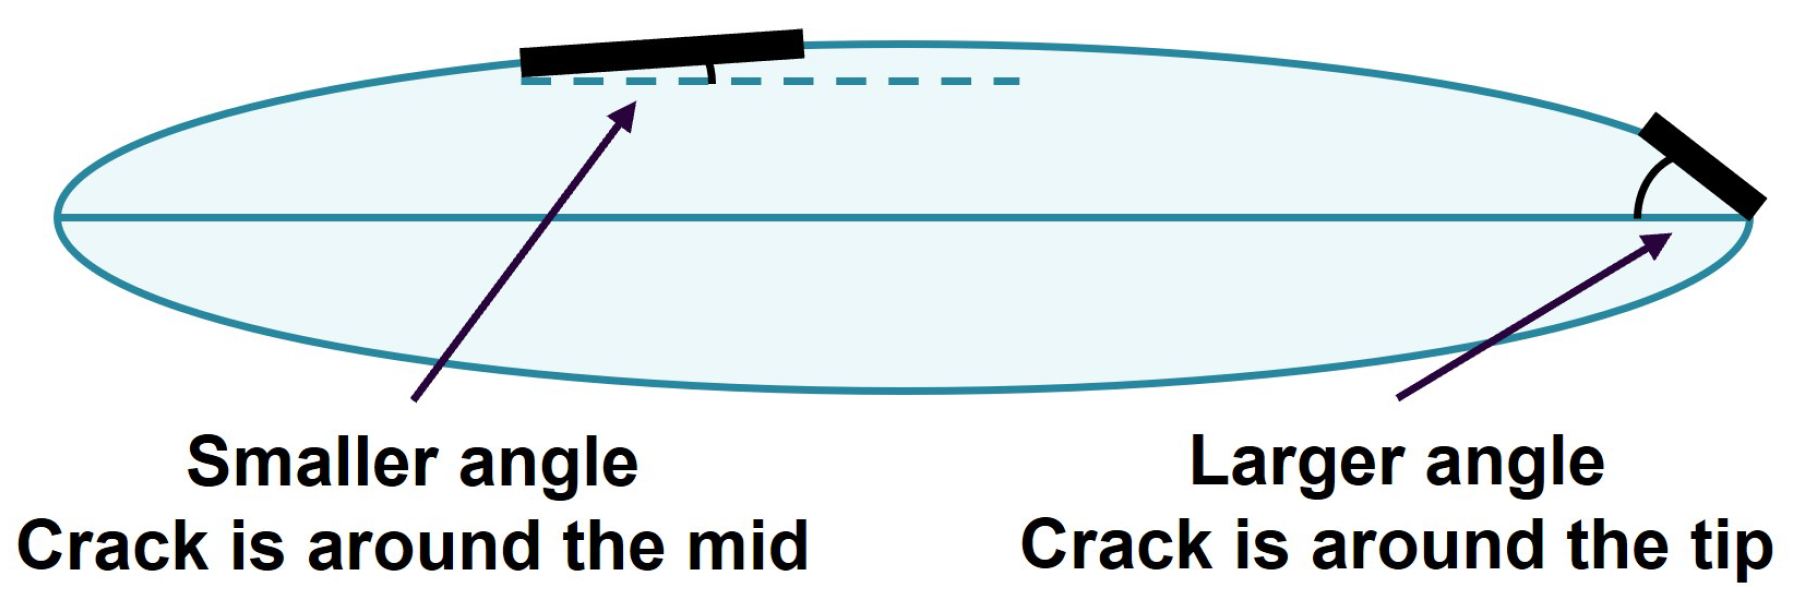
The last information gathered about the microcracks was the angle between the crack and the midrib of the corresponding martensite plate. These data were classified as internal and interfacial cracks to accomplish reasonable quantification of the data. While a larger acute angle indicates a crack being closer to the tip of a martensite plate, a smaller angle represents a crack closer to the midpoint of the interface, as illustrated in
Figure 10.
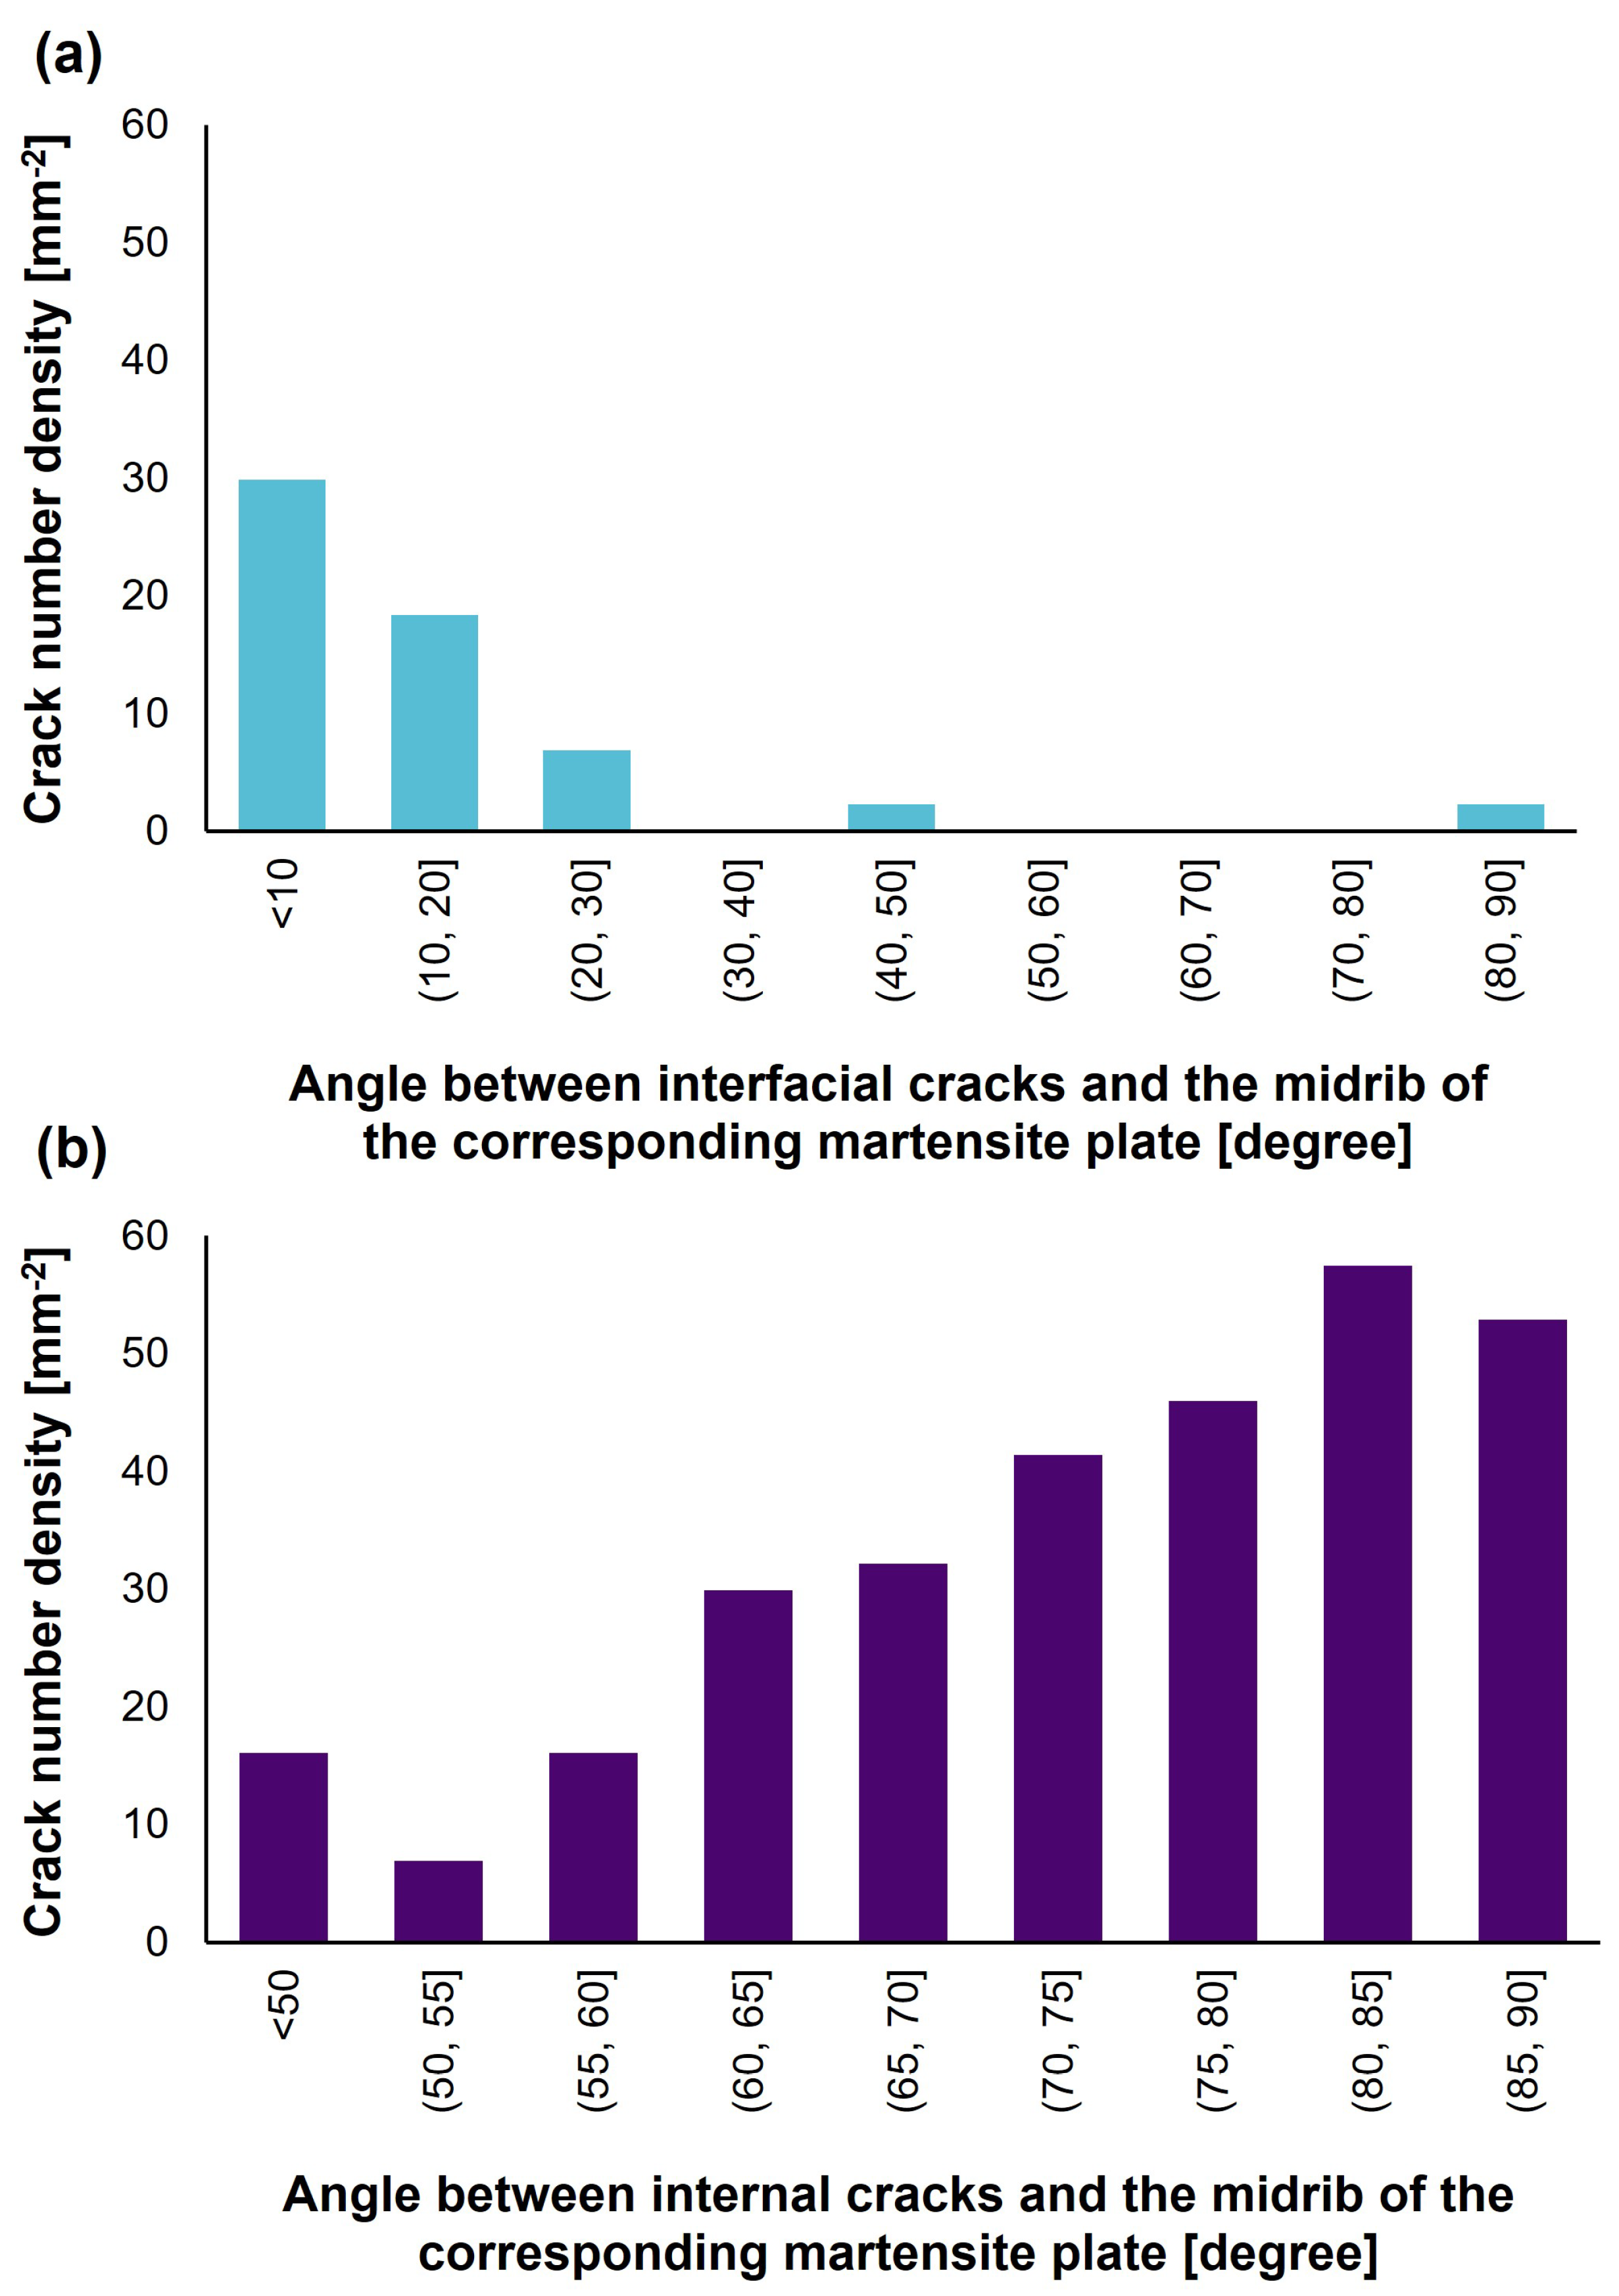
The highest number of interfacial cracks was found to have an acute angle of less than 10 °C for both regions of Sample 1, which means that interfacial cracks form primarily around the midpoint of the martensite–austenite interface. It should be noted that the few cracks with an angle around 90 °C in
Figure 11a and
Figure 12a represent the aforementioned tip cracks that elongated through the interface of another martensite plate, which may not be visible in the current plane. Therefore, they may have lower acute angles with the midrib of the invisible martensite plate. Both figures contain information of cracks distributed in selected 3 mm sections, regardless of their distance from the induction-hardening surface. On the other hand, a few cracks with an acute angle of around 50 °C represent the interfacial cracks at the tip of the martensite plate visible in the image. As a result, the interfacial cracks at the midpoint of the interface significantly outnumbered the interfacial cracks closer to the tip.
Unlike interfacial cracks, the disorientation angles between the internal cracks and the midrib were rarely found to be less than 50 °C. For both regions, the highest number of internal cracks was observed to be almost perpendicular to the martensite midrib, as depicted in
Figure 11b and
Figure 12b. While there is a significant increase in the number of internal cracks at ∼85 °C for the first region, it increases gradually for the second region. A common feature in both experiments is that the crack angles are distributed mainly between 50 °C and 90 °C. This feature should be emphasised by considering that twins at the midrib also have a similar orientation alignment [
25], indicating a possible link between the crack angle and twin alignment. To be able to build a more concrete hypothesis about the crack initiation and propagation mechanisms around plate midribs, experimentes with higher resolution should be conducted. Transmission Kikuchi diffraction, in particular, an SEM method in which electron beams transmit through thin samples, is a great option due to its high resolution in the order of 10 nm [
26,
27].
Figure 13 shows the length distribution of plates that contain one or more cracks for Sample 1 in the selected 0.43 mm
2 area (location 1). Most plates with interfacial cracks have a length between 10 and 20 μm, while the lengths vary between 20 and 30 μm for internal cracks. This indicates that interfacial cracks are distributed at the interface of smaller plates whilst internal cracks propagate along larger plates. Additionally,
Figure 14 shows various OM images on location 1 at different depths from the surface.
Figure 14b contains parallel microcracks on large plates, and
Figure 14d has a small martensite plate with interfacial cracks.
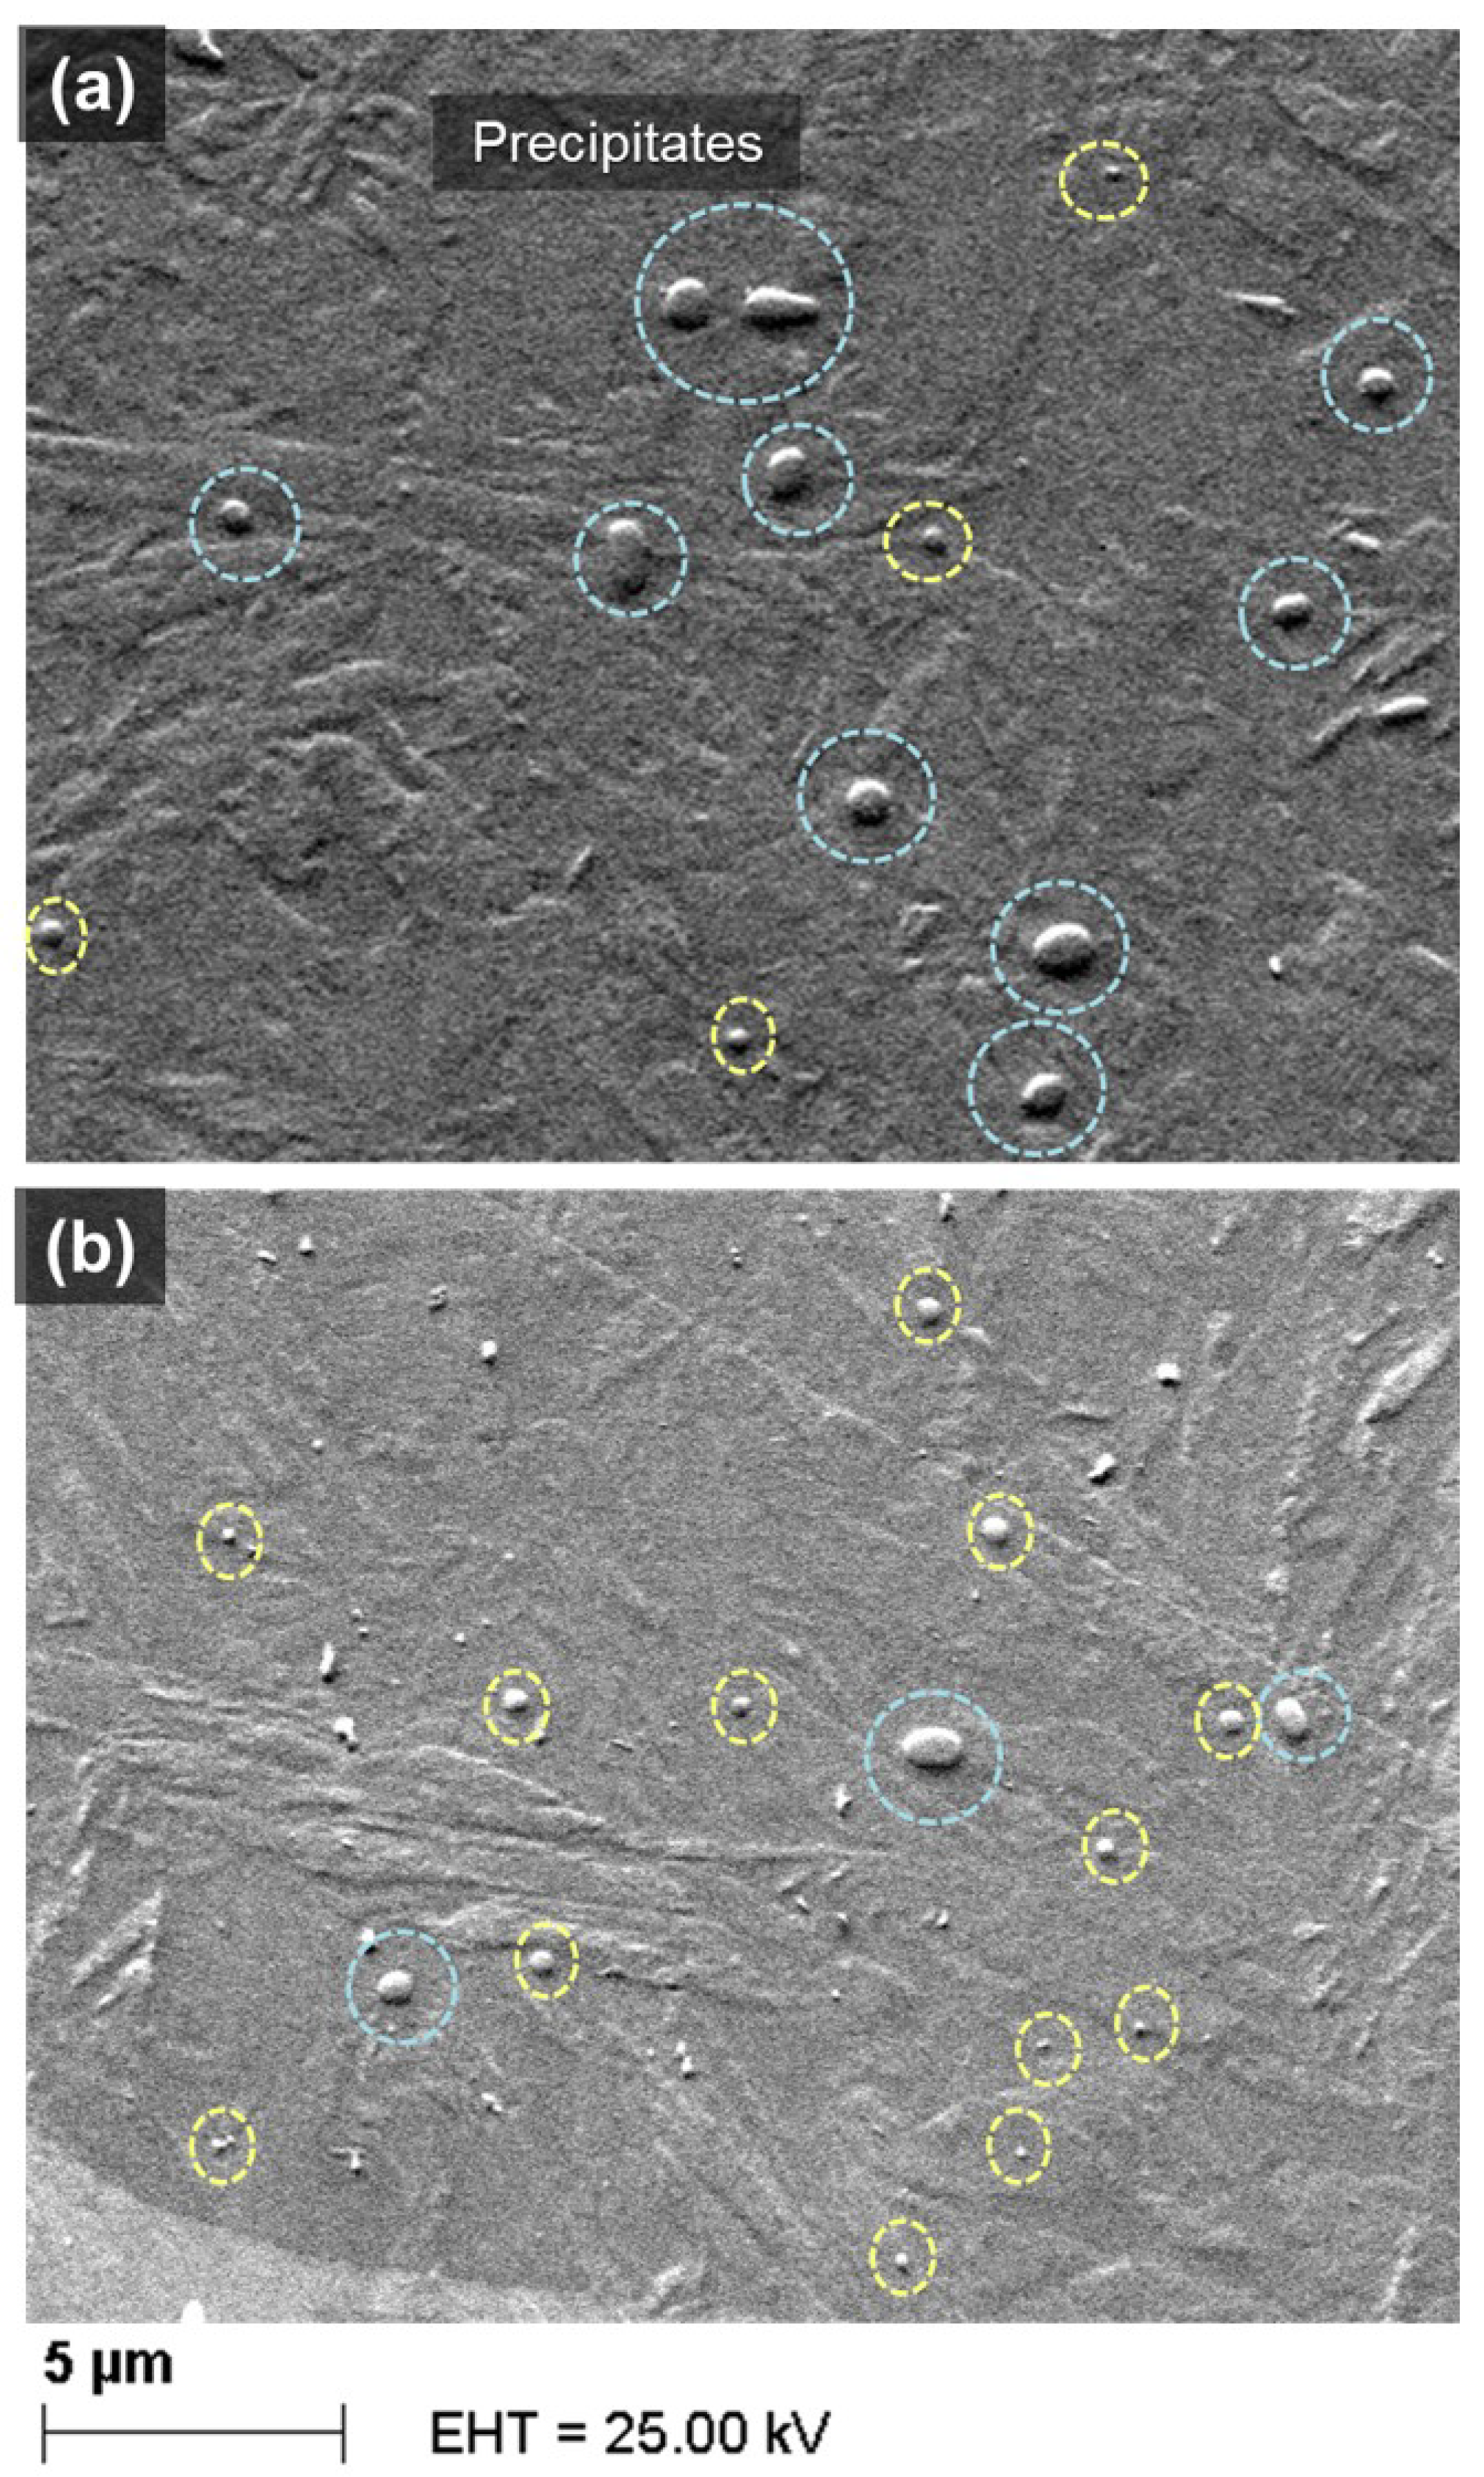
Figure 15 shows two SEM images of Sample 2. The first image is at a depth of 1127 μm from the induction-hardening surface. This distance corresponds to a location of high crack severity found in OM analysis. The second image is at a 2298 μm depth from the induction-hardening surface, which has less cracks by half than the former location. Evenly distributed large precipitates of ∼1 μm diameter are visible in the former. The latter image, on the other hand, contains finer precipitates around 0.3 μm diameter. The results indicate the possibility of carbide precipitation being a critical factor in quench cracking, which will be discussed in more detail in the following section.
5. Discussion
The present crack quantification method using optical microscope images revealed several new and remarkable relationships between microcracks and martensite distribution. Higher number densities and larger size of microcracks were found around the same distance from the induction-hardening surface; this suggests that microcracking is likely sensitive to the local heat treatment and cooling temperatures. However, previous quantification methods have neglected the possible effect of the induction-hardening distance. Also, we rule out a possible effect of the martensite–ferrite transition zone on quench cracking by showing that microcracking happens far from the martensite–ferrite transition zone, as shown in
Figure 3.
This work has also shown that a trivial correlation between subsurface distance and microcracks cannot be claimed. Instead, there should be a certain range of local temperature profiles inducing a high amount of microcracks. We discuss possible microstructural features that could affect cracking based on the present observations. The change in the fraction of the precipitates relative to the heat treatment temperature can impact several physical phenomena associated to martensite evolution and quench cracking. To begin with, carbide precipitation could cause a local decrease in the carbon content in the matrix. However, previous works [
6,
7] showed contradicting results in which quench cracking increases with the carbon content in the matrix. A change in carbon content in the matrix also influences the tetragonality of the martensite. A lower tetragonality requires a smaller transformation strain from austenite to martensite, which results in a local higher
temperature. However, carbides can induce dislocation emission around them as possible nucleation sites for martensite plates, and they can create local plastic relaxation zones.
Therefore, focusing solely on a specific mechanism when examining the role of carbides in microcracking can be misleading. Instead, one should examine how precipitation changes the martensite microstructure and crystallography, considering that microcracking is a result of the interaction between martensite plates. Higher
temperatures cause a wider growth window for martensite, and carbide boundaries create new nucleation sites. The former is in favour of larger martensite plates; however, the latter leads to a higher number of martensite plates with possibly smaller sizes due to geometrical (growth) constraints. Although similar precipitation trends were observed in
Figure 15 throughout the sample, a systematic SEM analysis at various locations is necessary for a more accurate conclusion. This highlights the complexity of how precipitation could effect quench cracking, however, further analysis is beyond the scope of the current work.
Several studies have already argued the martensite plate size dependence of microcracking, as discussed in the introduction. Previous studies mainly measured the prior austenite grain size and assumed a positive relationship with the martensite plate size. Nevertheless, confirming this reasoning using a more detailed characterisation method was absent. The current method, which collects the properties of the associated plate in addition to the microcrack itself, allows to analyse systematically large data of plate-crack interlinks. This is crucial to understand the role of martensite nucleation and growth in quench cracking.
The current work characterised cracks in terms of their location on martensite plates, which provides new scientific evidence about internal and interfacial cracks. The fact that almost all of the microcracks were observed in or at the interface of a martensite plate also proves the importance of the evolving martensite morphology in steel’s quench cracking susceptibility. According to the impingement theory, microcracking occurs as a result of martensite plates impacting each other. Another work [
1] claimed that the location of the microcrack depends on the impingement angle. However, our observations did not show this because we observed several internal cracks in the microstructure, despite the presence of a lower impingement angle. It leads one to question the actual physical processes controlling internal cracking, especially considering that the internal cracks noticeably outnumber interfacial cracks. Instead of the impingement angle, the presence of the internal cracks can be attributed to the crystallography of the martensitic structure itself; in particular, the distribution of the angle between the internal cracks and the plate midrib attracts attention to the twinning structure at the midrib.
A widely observed aspect of lenticular martensite is the parallel twinning planes throughout the midrib [
25]. Since the alignment of the cracks is similar to twinning planes, a twinning plane could act as either a crack initiation site or a crack propagation facilitator. We can expect the twin plane, acting as grain boundary, to be a preferential site for crack initiation. Besides, twin boundaries act as obstacles for dislocations. If a dislocation due to impingement of the plates is piled up at the twin boundary, it results in a large local distortion, hence possibly leading to microcracking. Nevertheless, a concrete understanding of the influence of twin boundaries in quench cracking requires further high-resolution analysis. Considering the nanoscale size of twinnings at the midrib, high-resolution microscopy methods like Transmission Electron Microscopy and Transmission Kikuchi Diffraction are necessary but beyond the scope of the current work.
This work also focused on studying the forming angle between the microcracks and midrib, which has not been covered previously. Considering the crack angle histograms of interfacial cracks shown in
Figure 11a and
Figure 12a, one can argue that most interfacial cracks are located around the middle point of the interface. Failure is inevitable if the plastic strain due to the martensitic transformation cannot be accommodated by the surrounding retained austenite. Therefore, this observation can be attributed to a higher local strain induced at the mid-interface because of its thicker cross section. However, further microstructure and strain analysis is required to understand if the middle point of the interface is more prone to interfacial cracks, while martensite plate impingement can be equally possible throughout the interface. Another explanation may be that this large strain-accommodated zone could be a preferable nucleation site for a second martensite plate to propagate, and the interaction between the original plate and a second (growing) one could lead to crack nucleation. The outcomes emphasise how important it is to understand the physics behind martensite nucleation and growth to determine how they affect microcracking.
Another interesting outcome was that the plates with interfacial cracks are smaller than those with internal cracks, as demonstrated in
Figure 13. This can be attributed to the fact that the volume-to-surface-area ratio increases with the size of a plate. Also, large martensite plates with parallel internal cracks were found around 1020 μm away from the induction surface, as shown in
Figure 14b. This observation is important since these large martensite plates are at the same location where most cracks have been found, and this finding supports the plate size and crack severity correlation suggested in other works [
1,
3,
13]. Further quantification of the plate aspect ratio should be done to unveil plate size influence on microcrack location since the thickness of the plate is crucial to determine plastic accommodation in and around a martensite plate. Such analysis would reveal whether interfacial cracking tends to occur in small or thin martensite plates.
Another factor that affects microcrack location can be the curvature of the plate interface. Our observations showed that large, thin martensite plates, which have small curvature values, are more susceptible to internal cracks than interfacial cracks. Since the aspect ratio is also an indicator of the curvature, it should be focused on in future work.
This novel method characterised various features of quench cracking, including the crack distance from the surface, the length of the plate with microcracks, crack size, type, and angle to the martensite midrib, unlike traditional crack characterisation techniques. The new image quantification in the optical microscope showed consistent results with the literature: The morphology of the plates and the crystallography of martensite are the main factors that determine the properties of quench cracking. The large and detailed data produced by this method will be crucial in linking martensite nucleation to quench cracking. The methodology introduced here can be applied to samples with various thermal histories in future works to draw more accurate conclusions. It should be noted that the methodology described in this work can also be used in other imaging techniques, like in SEM. Optical microscopy was preferred due to its efficiency in providing statistically significant data over large areas of the links between microstructure, extent of cracking and induction hardening surface. This work aimed to propose a crack quantification technique to connect quench cracking to changing the martensite microstructure due to varying local temperature and cooling rates as a result of the induction hardening process. Therefore, imaging large areas (approximately ∼430,000 mm
2 per sample) from the surface to the core region was necessary. However, higher resolution techniques, including transmission electron microscopy, focused ion beam/SEM, can be employed to study smaller regions in steel samples with more homogeneous microstructures [
28,
29,
30] and unveil 3D features between cracks and martensite plates with more detail.
Author Contributions
Conceptualisation, A.A.C.-I., L.J.S., V.B. and E.I.G.-N.; Methodology, A.A.C.-I., L.J.S., M.P., V.B. and E.I.G.-N.; Validation, A.A.C.-I.; Formal analysis, A.A.C.-I. and E.I.G.-N.; Investigation, A.A.C.-I., L.J.S. and V.B.; Resources, V.B. and E.I.G.-N.; Data curation, A.A.C.-I.; Writing—original draft, A.A.C.-I. and E.I.G.-N.; Writing—review & editing, A.A.C.-I., L.J.S., M.P., V.B. and E.I.G.-N.; Visualisation, A.A.C.-I.; Supervision, L.J.S., M.P., V.B. and E.I.G.-N.; Project administration, L.J.S., V.B. and E.I.G.-N.; Funding acquisition, V.B. and E.I.G.-N. All authors have read and agreed to the published version of the manuscript.
Funding
This research was funded by The Timken Company.
Data Availability Statement
The original contributions presented in this study are included in the article. Further inquiries can be directed to the corresponding author.
Acknowledgments
The authors acknowledge the financial support provided by The Timken Company.
Conflicts of Interest
Authors L.J. Sanchez, M.V. Pantawane and V. Bedekar were employed by The Timken Company. The remaining authors declare that the research was conducted in the absence of any commercial or financial relationships that could be construed as a potential conflict of interest. The authors declare that this study received funding from The Timken Company. The funder was not involved in the study design, collection, analysis, interpretation of data, the writing of this article or the decision to submit it for publication.
References
- Bai, M.; Pang, J.; Wang, G.; Yi, H. Martensitic transformation cracking in high carbon steels for bearings. Mater. Sci. Technol. 2016, 32, 1179–1183. [Google Scholar] [CrossRef]
- Marder, A.; Benscoter, A. Microcracking in Fe-C acicular martensite. ASM Trans. Quart. 1968, 61, 293–299. [Google Scholar]
- Davies, R.; Magee, C. Microcracking in ferrous martensites. Metall. Mater. Trans. B 1972, 3, 307–313. [Google Scholar] [CrossRef]
- Marder, A.; Benscoter, A.; Krauss, G. Microcracking sensitivity in Fe-C plate martensite. Metall. Trans. 1970, 1, 1545–1549. [Google Scholar] [CrossRef]
- Mendiratta, M.; Krauss, G. The development of martensitic microstructure and microcracking in an Fe-1.86 C alloy. Metall. Mater. Trans. B 1972, 3, 1755–1760. [Google Scholar] [CrossRef]
- Šolić, S.; Podgornik, B.; Leskovšek, V. The occurrence of quenching cracks in high-carbon tool steel depending on the austenitizing temperature. Eng. Fail. Anal. 2018, 92, 140–148. [Google Scholar] [CrossRef]
- Mendiratta, M.; Sasser, J.; Krauss, G. Effect of dissolved carbon on microcracking in martensite of an Fe-1.39 C alloy. Metall. Mater. Trans. B 1972, 3, 351–353. [Google Scholar] [CrossRef]
- Hwang, E.H.; Park, J.S.; Kim, S.O.; Seong, H.G.; Kim, S.J. Study on the controlling factors for the quenching crack sensitivity of ultra-strong automotive steel. J. Mater. Sci. 2020, 55, 3605–3617. [Google Scholar] [CrossRef]
- Dorofeyev, V.; Sviridova, A.; Berezhnoy, Y.; Bessarabov, E.; Sviridova, S.; Pustovoit, V.; Svistun, L. Effect of microadditions of aluminum and vanadium on the susceptibility to quench cracking in powder steels. AIP Conf. Proc. 2022, 2467, 020048. [Google Scholar] [CrossRef]
- Apple, C.; Krauss, G. Microcracking and fatigue in a carburized steel. Metall. Trans. 1973, 4, 1195–1200. [Google Scholar] [CrossRef]
- Jena, L.; Heich, P. Microcracks in carburized and hardened steel. Metall. Mater. Trans. B 1972, 3, 592–594. [Google Scholar] [CrossRef]
- Brobst, R.; Krauss, G. The effect of austenite grain size on microcracking in martensite of an Fe-1.22 C alloy. Metall. Mater. Trans. B 1974, 5, 457–462. [Google Scholar] [CrossRef]
- Chatterjee, S.; Bhadeshia, H. TRIP-assisted steels: Cracking of high-carbon martensite. Mater. Sci. Technol. 2006, 22, 645–649. [Google Scholar] [CrossRef]
- Samuel, A.; Prabhu, K.N. Residual stress and distortion during quench hardening of steels: A review. J. Mater. Eng. Perform. 2022, 31, 5161–5188. [Google Scholar] [CrossRef]
- Tran, T.X.; Nguyen, X.P.; Nguyen, D.N.; Vu, D.T.; Chau, M.Q.; Hoang, A.T. Effect of Poly-Alkylene-Glycol Quenchant on the Distortion, Hardness, and Microstructure of 65Mn Steel. Comput. Mater. Contin. 2021, 67, 3249. [Google Scholar] [CrossRef]
- Ma, M.; Liu, X.; Li, T.; Hu, M.; Wang, X. Investigating quench crack susceptibility in disc springs: A microstructural analysis of martensitic evolution and its implications. Appl. Phys. A 2024, 130, 296. [Google Scholar] [CrossRef]
- Marder, A.; Benscoter, A. Microcracking in tempered plate martensite. Metall. Mater. Trans. B 1974, 5, 778–780. [Google Scholar] [CrossRef]
- Balliett, T.A.; Krauss, G. The effect of the first and second stages of tempering on microcracking in martensite of an Fe-1.22 C alloy. Metall. Trans. A 1976, 7, 81–86. [Google Scholar] [CrossRef]
- ASTM A485-17; Standard Specification for High Hardenability Antifriction Bearing Steel. ASTM International: West Conshohocken, PA, USA, 2022.
- Pchelkina, V. Increasing the quality and properties of bearing parts by surface hardening with the use of induction heating. Met. Sci. Heat Treat. 1988, 30, 168–172. [Google Scholar] [CrossRef]
- Sherman, D.H.; Cross, S.M.; Kim, S.; Grandjean, F.; Long, G.J.; Miller, M.K. Characterization of the carbon and retained austenite distributions in martensitic medium carbon, high silicon steel. Metall. Mater. Trans. A 2007, 38, 1698–1711. [Google Scholar] [CrossRef]
- Wang, J.; Tao, Q.; Fan, J.; Fu, L.; Shan, A. Enhanced mechanical properties of a high-carbon martensite steel processed by heavy warm rolling and tempering. Mater. Sci. Eng. A 2023, 872, 144958. [Google Scholar] [CrossRef]
- Bertolini, R.; Bedekar, V.; Ghiotti, A.; Savio, E.; Shivpuri, R.; Bruschi, S. Surface integrity and corrosion performances of hardened bearing steel after hard turning. Int. J. Adv. Manuf. Technol. 2020, 108, 1983–1995. [Google Scholar] [CrossRef]
- Samuel, F.; Hussein, A. Tempering of medium- and high-carbon martensites. Metallography 1982, 15, 391–408. [Google Scholar] [CrossRef]
- Shibata, A.; Murakami, T.; Morito, S.; Furuhara, T.; Maki, T. The origin of midrib in lenticular martensite. Mater. Trans. 2008, 49, 1242–1248. [Google Scholar] [CrossRef]
- Trimby, P.W. Orientation mapping of nanostructured materials using transmission Kikuchi diffraction in the scanning electron microscope. Ultramicroscopy 2012, 120, 16–24. [Google Scholar] [CrossRef] [PubMed]
- Bedekar, V.; Shivpuri, R.; Avishai, A.; Hyde, R.S. Transmission Kikuchi Diffraction study of texture and orientation development in nanostructured hard turning layers. CIRP Ann. 2015, 64, 73–76. [Google Scholar] [CrossRef]
- Shibata, A.; Gutierrez-Urrutia, I.; Nakamura, A.; Okada, K.; Miyamoto, G.; Madi, Y.; Besson, J.; Hara, T.; Tsuzaki, K. Three-dimensional propagation behavior of hydrogen-related intergranular cracks in high-strength martensitic steel. Int. J. Hydrogen Energy 2023, 48, 34565–34574. [Google Scholar] [CrossRef]
- Tian, L.; Borchers, C.; Kubota, M.; Sofronis, P.; Kirchheim, R.; Volkert, C.A. A study of crack initiation in a low alloy steel. Acta Mater. 2022, 223, 117474. [Google Scholar] [CrossRef]
- Zhong, X.L.; Haigh, S.J.; Zhou, X.; Withers, P.J. An in-situ method for protecting internal cracks/pores from ion beam damage and reducing curtaining for TEM sample preparation using FIB. Ultramicroscopy 2020, 219, 113135. [Google Scholar] [CrossRef]
Figure 1.
Schematic highlighting main features captured by the microcrack quantification method.
Figure 2.
Optical microscope image on Sample 1, where microcracks have high contrast with martensite plates and retained austenite.
Figure 3.
Vicker hardness values of Samples 1 and 2 (with loads of 5 and 2.5 kg, respectively) with respect to distance from the induction-hardened surface.
Figure 4.
Crack locations shown on optical microscope image of Sample 1 at approximately 600 μm depth from the surface.
Figure 5.
Optical images at different randomly selected 4 line segments on Sample 1 at approximately 1000 μm depth from the surface; location (a) 2, (b) 3, (c) 4, and (d) 5.
Figure 6.
Crack size histograms obtained through scanning 5 locations on Sample 1; location (a) 1, (b) 2, (c) 3, (d) 4, and (e) 5.
Figure 7.
Crack distance histogram of Sample 1 on location 1 for (a) all cracks and (b) internal and interfacial cracks separately.
Figure 8.
Crack number density distribution of Sample 1 with respect to distance from the induction hardening surface on location 2 for (a) all cracks and (b) internal and interfacial cracks separately.
Figure 9.
Crack size distribution graph of Sample 1 on (a) location 1, (b) location 2.
Figure 10.
An illustration of crack position and its angle from midrib.
Figure 11.
Crack angle histogram of Sample 1 on location 1 for (a) interfacial, and (b) internal cracks.
Figure 12.
Crack angle histogram of Sample 1 on location 2 for (a) interfacial, and (b) internal cracks.
Figure 13.
Midrib length histogram of Sample 1 on location 1.
Figure 14.
Optical microscope images of Sample 1 on location 1 at approximately (a) 500 μm, (b) 1000 μm, (c) 1500 μm, and (d) 2000 μm away from the sample surface.
Figure 15.
SEM images at (a) 1127 μm and (b) 2298 μm away from induction-hardening surface of Sample 2. Precipitates with a diameter larger than 0.5 μm are circled in blue, and those smaller than 0.5 μm are circled in green.
Table 1.
The standard alloy composition used in current work, given in wt.% and balanced with Fe.
| Alloy | C | Mn | Si | Cr |
|---|
| ASTM A485-2 [19] | 0.85–1.00 | 1.40–1.70 | 0.50–0.80 | 1.40–1.80 |
| Disclaimer/Publisher’s Note: The statements, opinions and data contained in all publications are solely those of the individual author(s) and contributor(s) and not of MDPI and/or the editor(s). MDPI and/or the editor(s) disclaim responsibility for any injury to people or property resulting from any ideas, methods, instructions or products referred to in the content. |
© 2025 by the authors. Licensee MDPI, Basel, Switzerland. This article is an open access article distributed under the terms and conditions of the Creative Commons Attribution (CC BY) license (https://creativecommons.org/licenses/by/4.0/).
