Article

CAFE Simulation of Solidification Microstructure of Cast WE54 Alloy: Influences of Simulation Parameters and Experimental Verification

1
School of Materials Science and Engineering, North Minzu University, Yinchuan 750021, China
2
Key Laboratory of Powder Material and Advanced Ceramics, North Minzu University, Yinchuan 750021, China
*
Author to whom correspondence should be addressed.
Metals 2025, 15(11), 1268; https://doi.org/10.3390/met15111268
Submission received: 12 October 2025 / Revised: 12 November 2025 / Accepted: 17 November 2025 / Published: 20 November 2025

Abstract

The simulation of solidification microstructures of cast alloys is crucial to the integrated “process–microstructure–property” numerical simulation. In order to verify the accuracy of the solidification microstructure simulation results, the solidification microstructures of WE54 alloy under both metal mold casting (MMC) and sand mold casting (SMC) conditions were simulated using the CAFE (Cellular Automaton–Finite Element) method, and the simulation results were validated experimentally. First, the effects of microstructure simulation parameters on the results were investigated, including nucleation density (n), nucleation undercooling (ΔT), and dendrite tip growth kinetics parameters (a2, a3). The results showed that, with the maximum surface nucleation undercooling (ΔTs,max) kept constant, increasing the maximum volume nucleation undercooling (ΔTv,max) significantly increases the proportion of columnar grains in the ingot structure. Moreover, when nucleation parameters remain constant, increasing a2 and a3 leads to expansion of the columnar grain zone. Secondly, numerical simulations of the solidification microstructure of WE54 alloy under different solidification conditions were carried out. The results indicated that as the cooling rate increases, the grain structure of the ingot becomes significantly refined, and the proportion of columnar grains decreases notably. Based on these findings, the simulation parameters suitable for simulating the solidification process and microstructure of MMC and SMC WE54 alloy were determined. Simulations of the temperature field and solidification microstructure were performed and compared with experimental results.

1. Introduction

WE54 alloy has broad application prospects in industries such as aerospace and transportation due to its excellent properties, including high strength and heat resistance [1,2]. To date, numerical simulations of fluid flow and temperature fields have become standard practice in the casting processes of magnesium alloys [3]. However, the application of simulation methods to microstructure prediction remains relatively limited. Since the mechanical properties of cast alloys are closely related to their microstructures [4,5], considerable efforts have been devoted to simulating the solidification microstructure of castings to enable an integrated ‘process–microstructure–performance’ numerical simulation framework for cast alloys. Nevertheless, research and practical applications of microstructure simulation remain limited due to the difficulty in determining simulation parameters and the lack of necessary experimental validation. This limitation has become the main bottleneck in achieving fully integrated ‘process–microstructure–performance’ simulations.
Several effective methods have been proposed for microstructure simulation, including the phase-field method, the Monte Carlo method and the cellular automaton (CA) method. Among these methods, the phase-field approach aligns well with classical solidification theory and offers strong capabilities for describing dendrite tip morphology evolution, interface curvature, and solute redistribution. However, its computational cost increases sharply with simulation size. So it is typically used only at the microscopic scale, with domains on the order of several tens of micrometers, making it difficult to meet the requirements of three-dimensional and multiphase simulations [6,7]. The Monte Carlo method, on the other hand, determines grain growth probability based on the principle of energy minimization. It lacks consideration of the physical mechanisms of nucleation and growth. Although it is computationally efficient, it struggles to accurately capture real interface kinetics and diffusion processes [6]. The CA method is built on nucleation theory and crystal growth kinetics, incorporating dendrite tip growth dynamics into the mathematical model. The predicted microstructure does not depend on the mesh structure, and the method features high computational efficiency and suitability for large simulation domains. It can be used to model nucleation and grain growth at the microscopic scale as well as solidification microstructure evolution at the mesoscopic scale [8,9]. Additionally, the CA method can be easily coupled with the finite element method (FEM), facilitating the coupling of solute and temperature field calculations during the solidification microstructure simulation process [10,11].
Since it was proposed by Gandin and Rappaz in 1994 [12], the CAFE (Cellular Automaton–Finite Element) method has become one of the most promising approaches for solidification microstructure simulation, showing strong potential for engineering applications. To date, researchers have conducted extensive studies using the CAFE method to simulate the solidification microstructures of steels, aluminum alloys [13], Ni-based superalloys [14,15], and titanium alloys [7,16]. These works have confirmed the effectiveness of CAFE in accurately reproducing alloy solidification microstructures. Although studies on microstructure prediction for magnesium alloys have been carried out for AZ series alloys [17], simulation and prediction for Mg–RE alloys remain challenging. This is due to the complex solute diffusion behavior of rare-earth elements and the limited availability of reliable data on interfacial energy and dendrite growth kinetics [18]. Extensive studies have demonstrated that the accurate determination of simulation parameters is crucial for obtaining reliable and precise simulation results [19,20,21,22]. Unfortunately, the parameters involved in solidification microstructure simulation, such as grain nucleation undercooling and dendrite tip growth velocity, are difficult to determine directly through experiments. Additionally, literature reports on the correlation between simulation parameters and simulation results remain relatively scarce. Consequently, researchers often spend considerable time identifying appropriate simulation parameters through “trial-and-error” practices.
In the present study, the solidification microstructure of cast WE54 alloy was simulated using different parameter sets to clarify the influence of microstructure simulation parameters on the simulation results. Then the solidification microstructures of the WE54 alloy under different solidification conditions were simulated to verify the accuracy of the model. Based on these results, parameters suitable for simulating the solidification microstructure of the WE54 alloy under metal mold casting (MMC) and sand mold casting (SMC) conditions were determined. The solidification process and microstructure of both MMC and SMC WE54 alloys were then simulated and compared with experimental data. The results indicate that, with appropriately determined parameters, the CAFE method can accurately reproduce the solidification process and microstructure of the WE54 alloy.

2. Materials and Experiments

The investigated WE54 alloy ingots with identical shapes and dimensions were prepared using both MMC and SMC casting processes. The shape and dimensions of the ingots are shown in Figure 1. The raw materials used for alloy smelting included high-purity magnesium ingots (Mg ≥ 99.95%), pure yttrium (Y > 99%), pure gadolinium (Gd > 99%), pure neodymium (Nd > 99%), and a Mg-30 wt.% Zr master alloy. First, a low-carbon steel crucible was cleaned and placed into an electric resistance furnace. After preheating the crucible to 500 °C, magnesium ingots were added. Once the pure magnesium was completely melted, the temperature was raised to 780 °C, and preheated pure Y, Gd, and Nd were added in batches, followed by the Mg-30 wt.% Zr master alloy. After all alloying elements had melted, the melt was stirred for 5 min to ensure compositional uniformity. During alloy melting, RJ6 flux (containing 55 wt.% KCl, 15 wt.% BaCl2, 2 wt.% NaCl and 28 wt.% CaCl2) was applied to the melt surface throughout the entire process to prevent oxidation. The temperature was then increased to 760 °C for refining with RJ6 flux, which lasted for 5–10 min. During refining, the melt was stirred while the RJ6 flux was evenly added into the molten metal, ensuring that the melt surface remained fully covered. After refining, the melt was held at 760 °C for 30 min in the crucible before it was poured into a preheated metal mold (300 °C) and a resin sand mold to produce the ingots.
After pouring, the temperature of the ingot was monitored and recorded using a thermocouple placed at the center of the ingot, with a data acquisition interval of 0.05 s. The chemical composition of the prepared WE54 alloy ingots was determined using the Agilent-5110 inductively coupled plasma atomic emission spectrometer (ICP-AES, Agilent, Santa Clara, CA, USA) and is listed in Table 1. Samples for microstructure observation were cut from the bottom of the ingot as shown in Figure 1. The samples were ground and polished, then etched with a 5 vol.% nitric acid–alcohol solution to reveal the grain boundaries. The microstructures were examined using the ZEISS AXIOvert. A1 optical metallographic microscope (Jena, Germany).

3. Numerical Simulation Methods

3.1. Numerical Calculation of Solidification Temperature Field

Accurate calculation of the temperature field during solidification is the foundation for simulating the solidification microstructure. Therefore, before conducting the microstructure simulation, the numerical calculation of the temperature field during ingot solidification was first performed. Three-dimensional models of the ingot and mold were imported into ProCAST 17.5 software for mesh generation. A tetrahedral type of mesh consisting of 930,538 elements was generated. And the initial and boundary conditions were defined to calculate the temperature field during solidification. The alloy material used in the simulation was WE54, with a composition consistent with that listed in Table 1. The liquidus and solidus temperatures of the alloy were 631 °C and 524 °C, respectively. In the metal mold casting process, the mold material was AISI 1008 low-carbon steel, while in the sand mold casting process, silica sand was used. The thermophysical properties of the mold materials were taken from the ProCAST material database. The interfacial heat transfer coefficients (HTC) between the casting and mold surfaces were determined separately for each simulation case and are described in the corresponding sections below. The simulations were performed on a 64-core 2.9 GHz workstation equipped with 256 GB of RAM.

3.2. Numerical Simulation of Solidification Microstructure

3.2.1. Continuous Nucleation Model

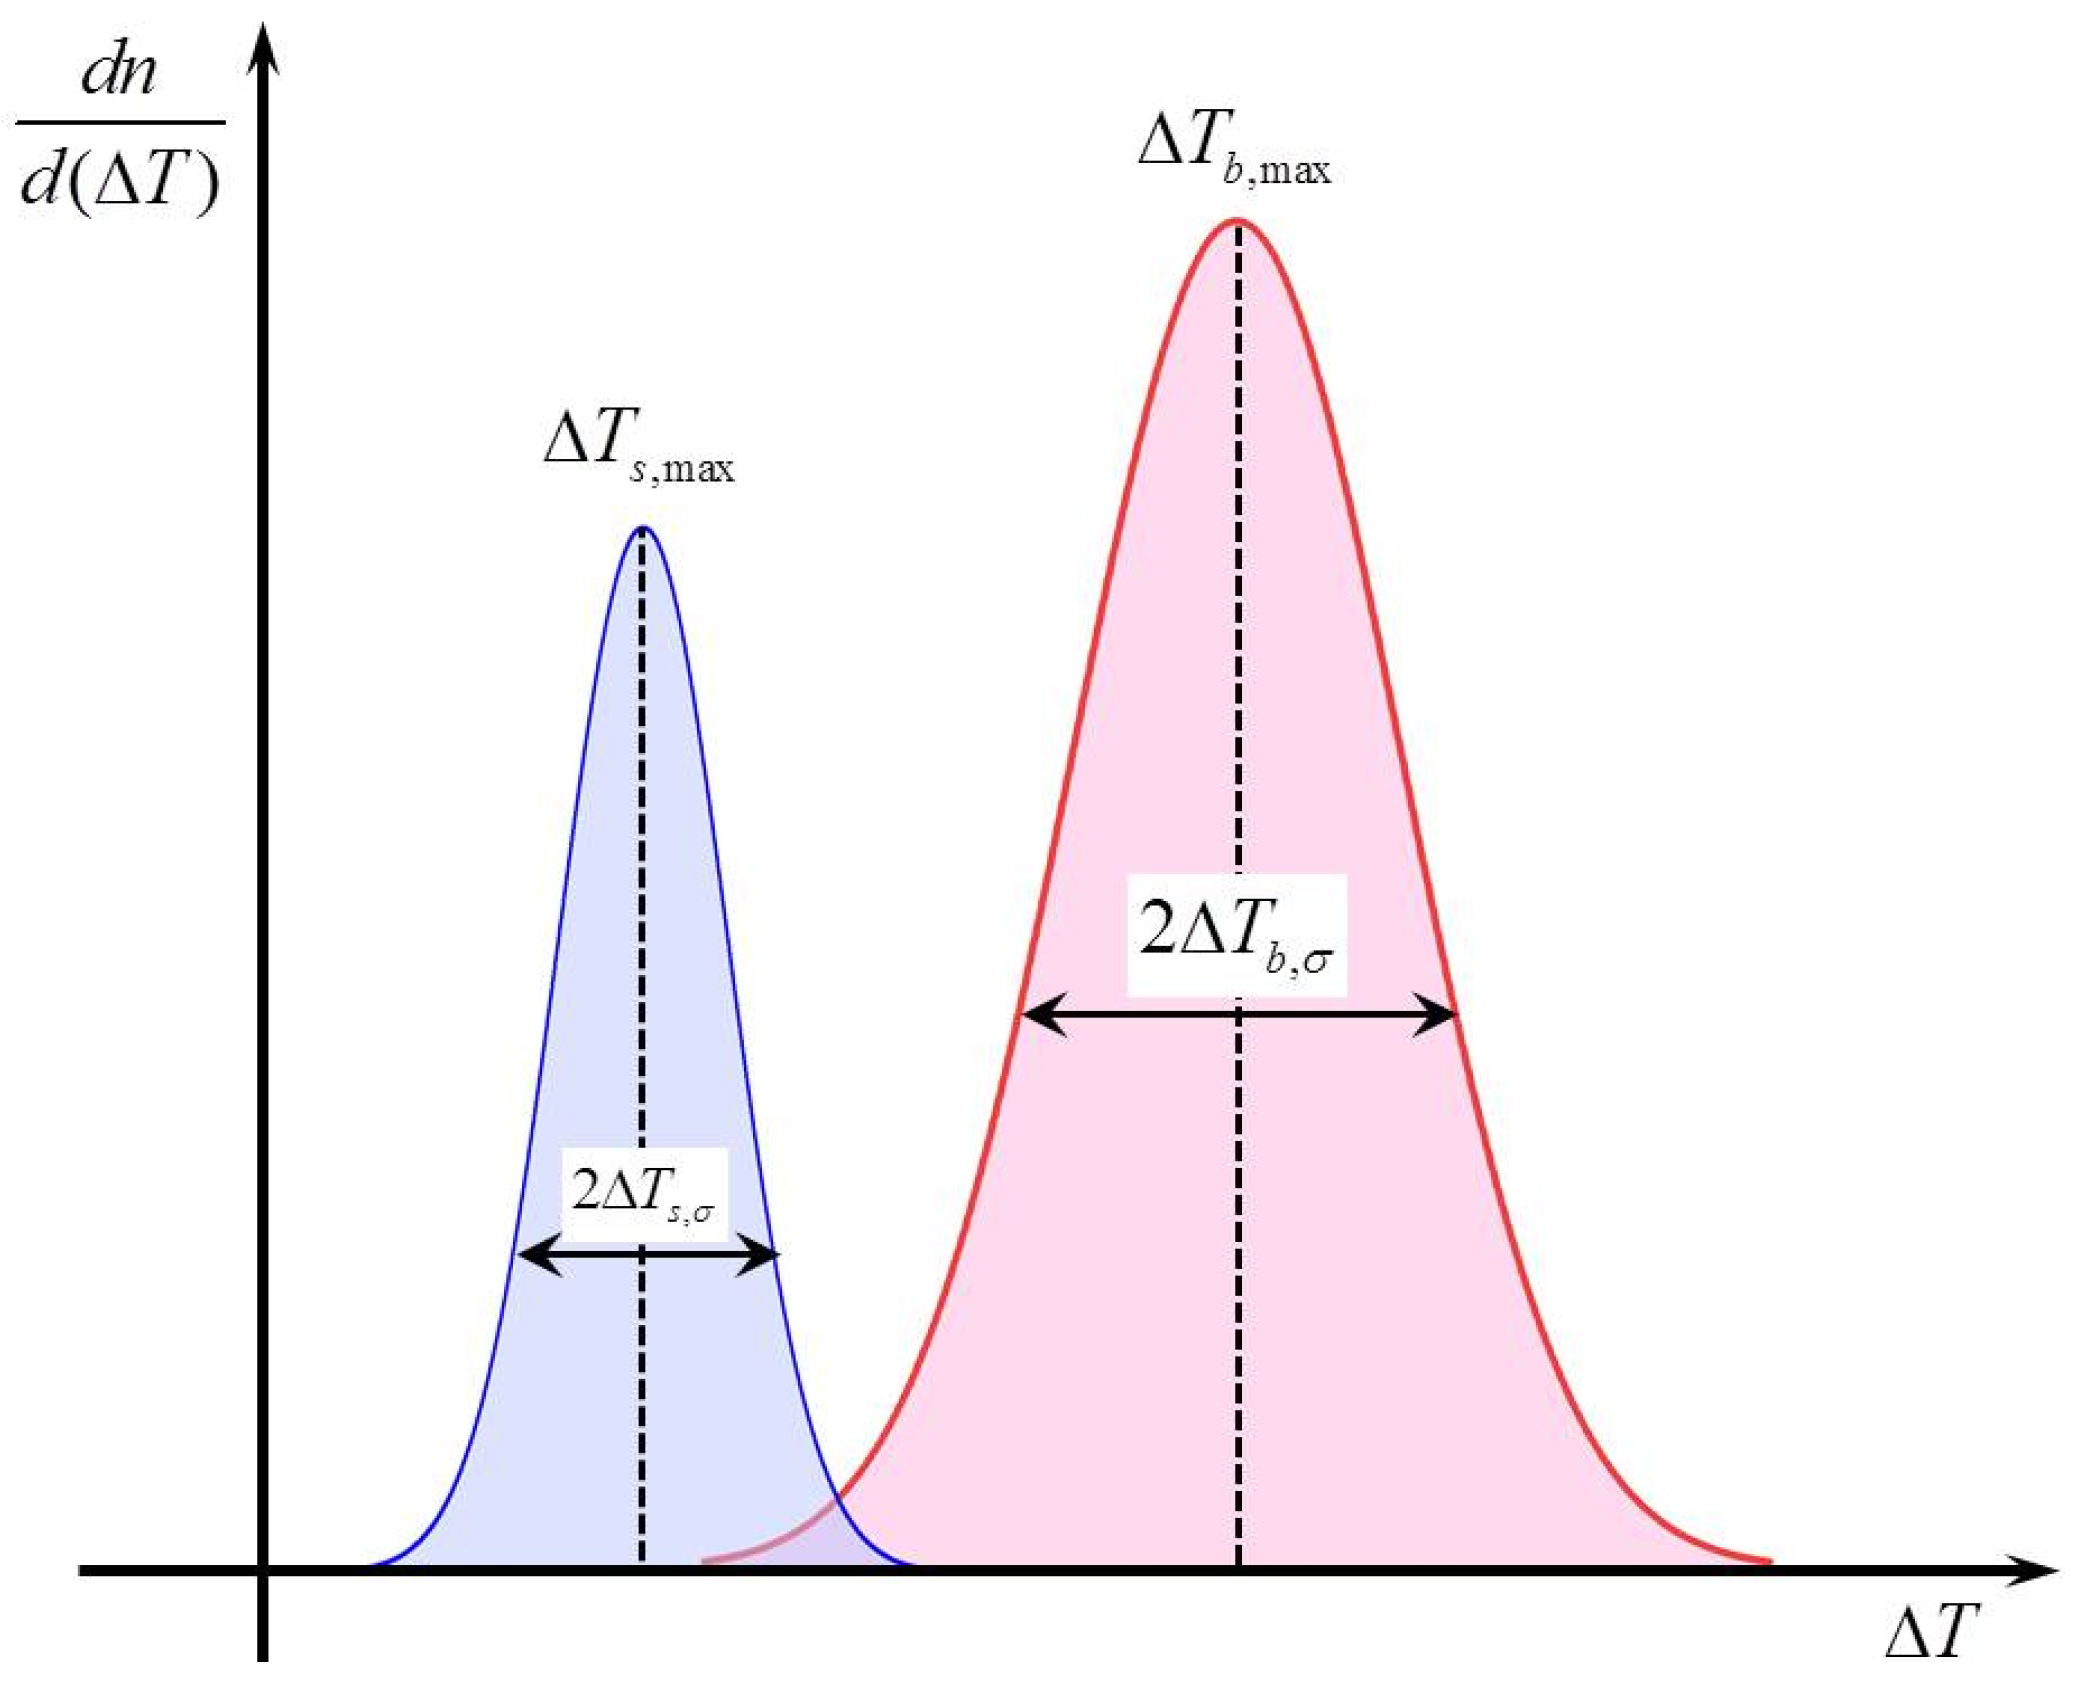
To simulate the nucleation process during alloy solidification, it is necessary to establish the relationship between the nucleation rate and the undercooling degree. In the CAFE model, the relationship between nucleation density (n) and undercooling degree (ΔT) can be expressed as:
dn d ( Δ T ) = n max 2 π Δ T σ exp 1 2 Δ T Δ T max Δ T σ 2
According to Equation (1), the nucleation density first increases and then decreases as undercooling increases, as shown by the dn/d(ΔT)–ΔT curve shown in Figure 2. Considering the differences between nucleation on the casting surface and inside the casting, the dn/d(ΔT)–ΔT curves should be determined separately for surface nucleation and interior volume nucleation. To define these curves, the main parameters required are ΔTmax, ΔTσ and nmax (i.e., the area enclosed by the dn/d(ΔT)–ΔT curve). Compared with surface nucleation, volume nucleation inside the ingot typically requires a higher undercooling, so the maximum volume nucleation undercooling ΔTv,max is higher than the maximum surface nucleation undercooling ΔTs,max. The values of ns,max and nv,max are generally determined from the grain size of the alloy—the smaller the grain size, the larger ns,max and nv,max.
In addition, when the grain size is fixed, a certain relationship exists between ns,max and nv,max, as shown in Equation (2) [19,23], which helps to determine the ns,max and nv,max more reasonably.
n v , max = π 6 ( n s , max ) 3 / 2

3.2.2. Grain Growth Model

The grain growth process is another key factor influencing the solidification microstructure of alloys. In the CAFE model, the relationship between the dendrite tip growth velocity and undercooling is commonly described by the KGT (Kurz–Giovanola–Trivedi) model. Calculation results based on the KGT model have shown that the relationship between dendrite tip growth velocity and undercooling can be approximated by a polynomial function [24]. The KGT model is fitted using the following polynomial expression (Equation (3)) when applying the CAFE method to simulate the alloy solidification microstructure.
v = a 2 Δ T 2 + a 3 Δ T 3
In this equation, v represents dendrite tip growth velocity (m/s), ΔT is undercooling degree (K), a2 (m/(s·K2)) and a3 (m/(s·K3)) are the dendrite tip growth kinetic parameters.

4. Influences of Simulation Parameters

4.1. Influences of Nucleation Parameters

As mentioned above, the parameters related to the nucleation process mainly include the nucleation density and nucleation undercooling. A higher nucleation density obviously leads to finer grain structures. However, the morphology and size of alloy grains are also influenced by the nucleation undercooling and the grain growth rate. This section focuses on investigating the effect of nucleation undercooling on the simulated solidification microstructure. A total of six simulation cases were conducted under different conditions to analyze this influence. All simulation cases were carried out with the following fixed parameters: ns,max = 5 × 10⁸/m2, nv,max = 8 × 10¹²/m3, a2 = 0 m/(s·K2), a3 = 6 × 10⁻⁶ m/(s·K3). Meanwhile, the nucleation undercooling parameters were listed in Table 2.
Figure 3 shows the simulated solidification microstructures for cases 01–06. With the surface nucleation parameters kept constant, as the ΔTv,max increases from 5 K to 8 K, the ingot structure gradually transitioned from a fully equiaxed grain structure to a fully columnar grain structure. It is evident that nucleation undercooling strongly affects the grain morphology and the distribution of grain zones within the ingot. When the ΔTs,max is kept constant, a higher ΔTv,max means that a greater undercooling is required for the nucleation of equiaxed grains within the ingot. Consequently, equiaxed grain nucleation and growth become more difficult to occur, and grains nucleated at the surface continue to grow inward, forming columnar grains. Conversely, as the ΔTv,max decreases, the undercooling required for equiaxed nucleation decreases, making it easier for equiaxed grains to nucleate and grow. As a result, the columnar grain zone became narrower, while the equiaxed grain zone progressively expanded.
Figure 4 shows the simulated solidification microstructures within a selected region of 5 mm × 5 mm × 20 mm near the ingot surface, as indicated by the white dashed lines in Figure 3a,c. Figure 4a presents the simulation result for Case 01, in which the solidification structure consisted entirely of equiaxed grains, while Figure 4b shows the result for Case 03, where both equiaxed and columnar grains coexisted. As seen in Figure 4a, a fine-grained zone approximately 2–3 mm thick was present near the ingot surface. As the solid–liquid interface advanced, the grain size within the ingot became coarser, and the grain morphology became irregular. This indicates that, in this region, partial preferential growth of columnar grains and volume nucleation and growth of equiaxed grains occur simultaneously. The competition between these two processes resulted in a relatively disordered grain morphology. Toward the center of the ingot, the solidification structure transitioned into a fully equiaxed grain zone with more uniform and regular grain morphology. In Figure 4b, at the beginning of solidification, a large number of fine and uniformly distributed grains formed on the ingot surface. As solidification proceeded, some favorably oriented grains began to grow along the temperature gradient, forming the columnar grains and developing the columnar grain zone, which is approximately 15 mm thick. Eventually, the central region of the ingot solidified into an equiaxed grain zone, resulting in a solidification structure composed of three distinct regions: a fine-grained surface zone, a columnar grain zone, and a central equiaxed grain zone. These simulation results are consistent with solidification theory and experimental observations, demonstrating that, with appropriate selection of simulation parameters, the CAFE method can accurately reproduce the solidification microstructure of the ingot.

4.2. Influences of Dendrite Tip Growth Kinetic Parameters

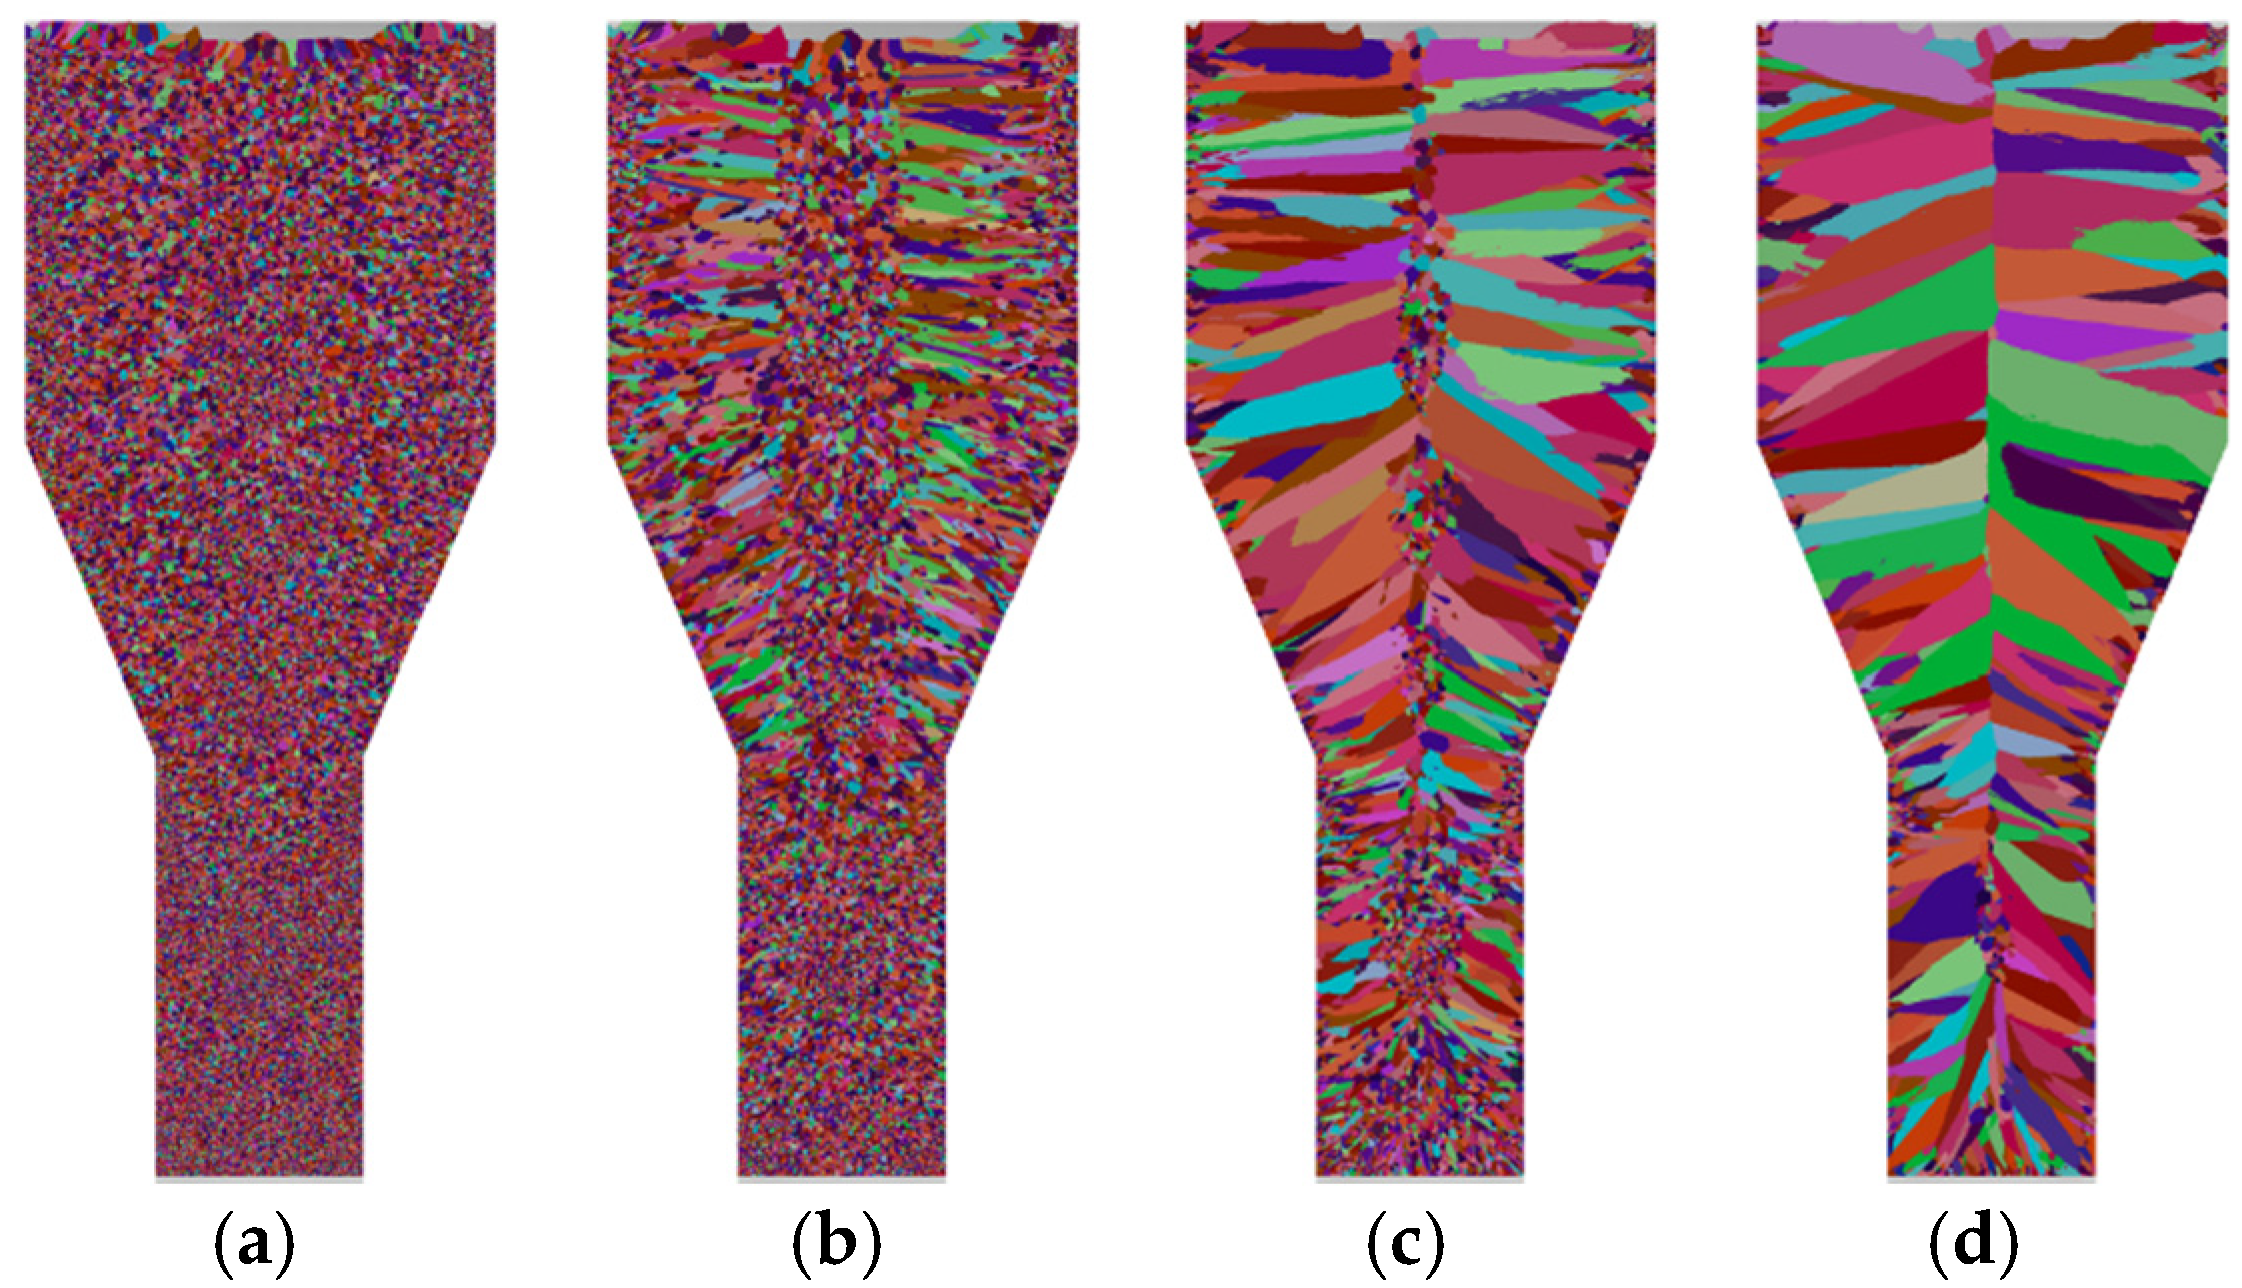
To analyze the effect of dendrite tip growth kinetic parameters on the simulation results, this section varied the values of a2 and a3, while keeping all other parameters constant. Simulation cases 07–10 were carried out with the following fixed parameters: ns,max = 5 × 10⁸/m2, nv,max = 8 × 10¹²/m3, ΔTs,max = 1.0 K, ΔTs,σ = 0.1 K, ΔTv,max = 6.5 K, ΔTv,σ = 0.5 K. The dendrite tip growth kinetic parameters used for each simulation case are listed in Table 3.
Figure 5 shows the simulation results for cases 07–10. It can be seen that the dendrite growth kinetic parameters also had a strong influence on the simulated solidification microstructure. As the value of a3 increased, the proportion of columnar grains in the ingot increased significantly. Since the undercooling required for grain growth is generally lower than that required for nucleation, the grains nucleated at the ingot surface began to grow immediately after nucleation. When the values of a2 and a3 were relatively large, the grain growth rate became faster. Consequently, the surface grains grew rapidly along the temperature gradient before new grains could nucleate inside the ingot, forming columnar grains and expanding the columnar grain zone. It should be noted that although the dendrite growth kinetic parameters a2 and a3 can be calculated based on the alloy composition and phase diagram, their values may vary under certain conditions. For instance, in alloys subjected to grain refinement or modification treatments, elements that inhibit grain growth are often added to improve the solidification structure. In such cases, the parameters a2 and a3 should be adjusted according to experimental results to ensure consistency between the simulation and actual solidification microstructures.

4.3. Influences of Solidification Conditions

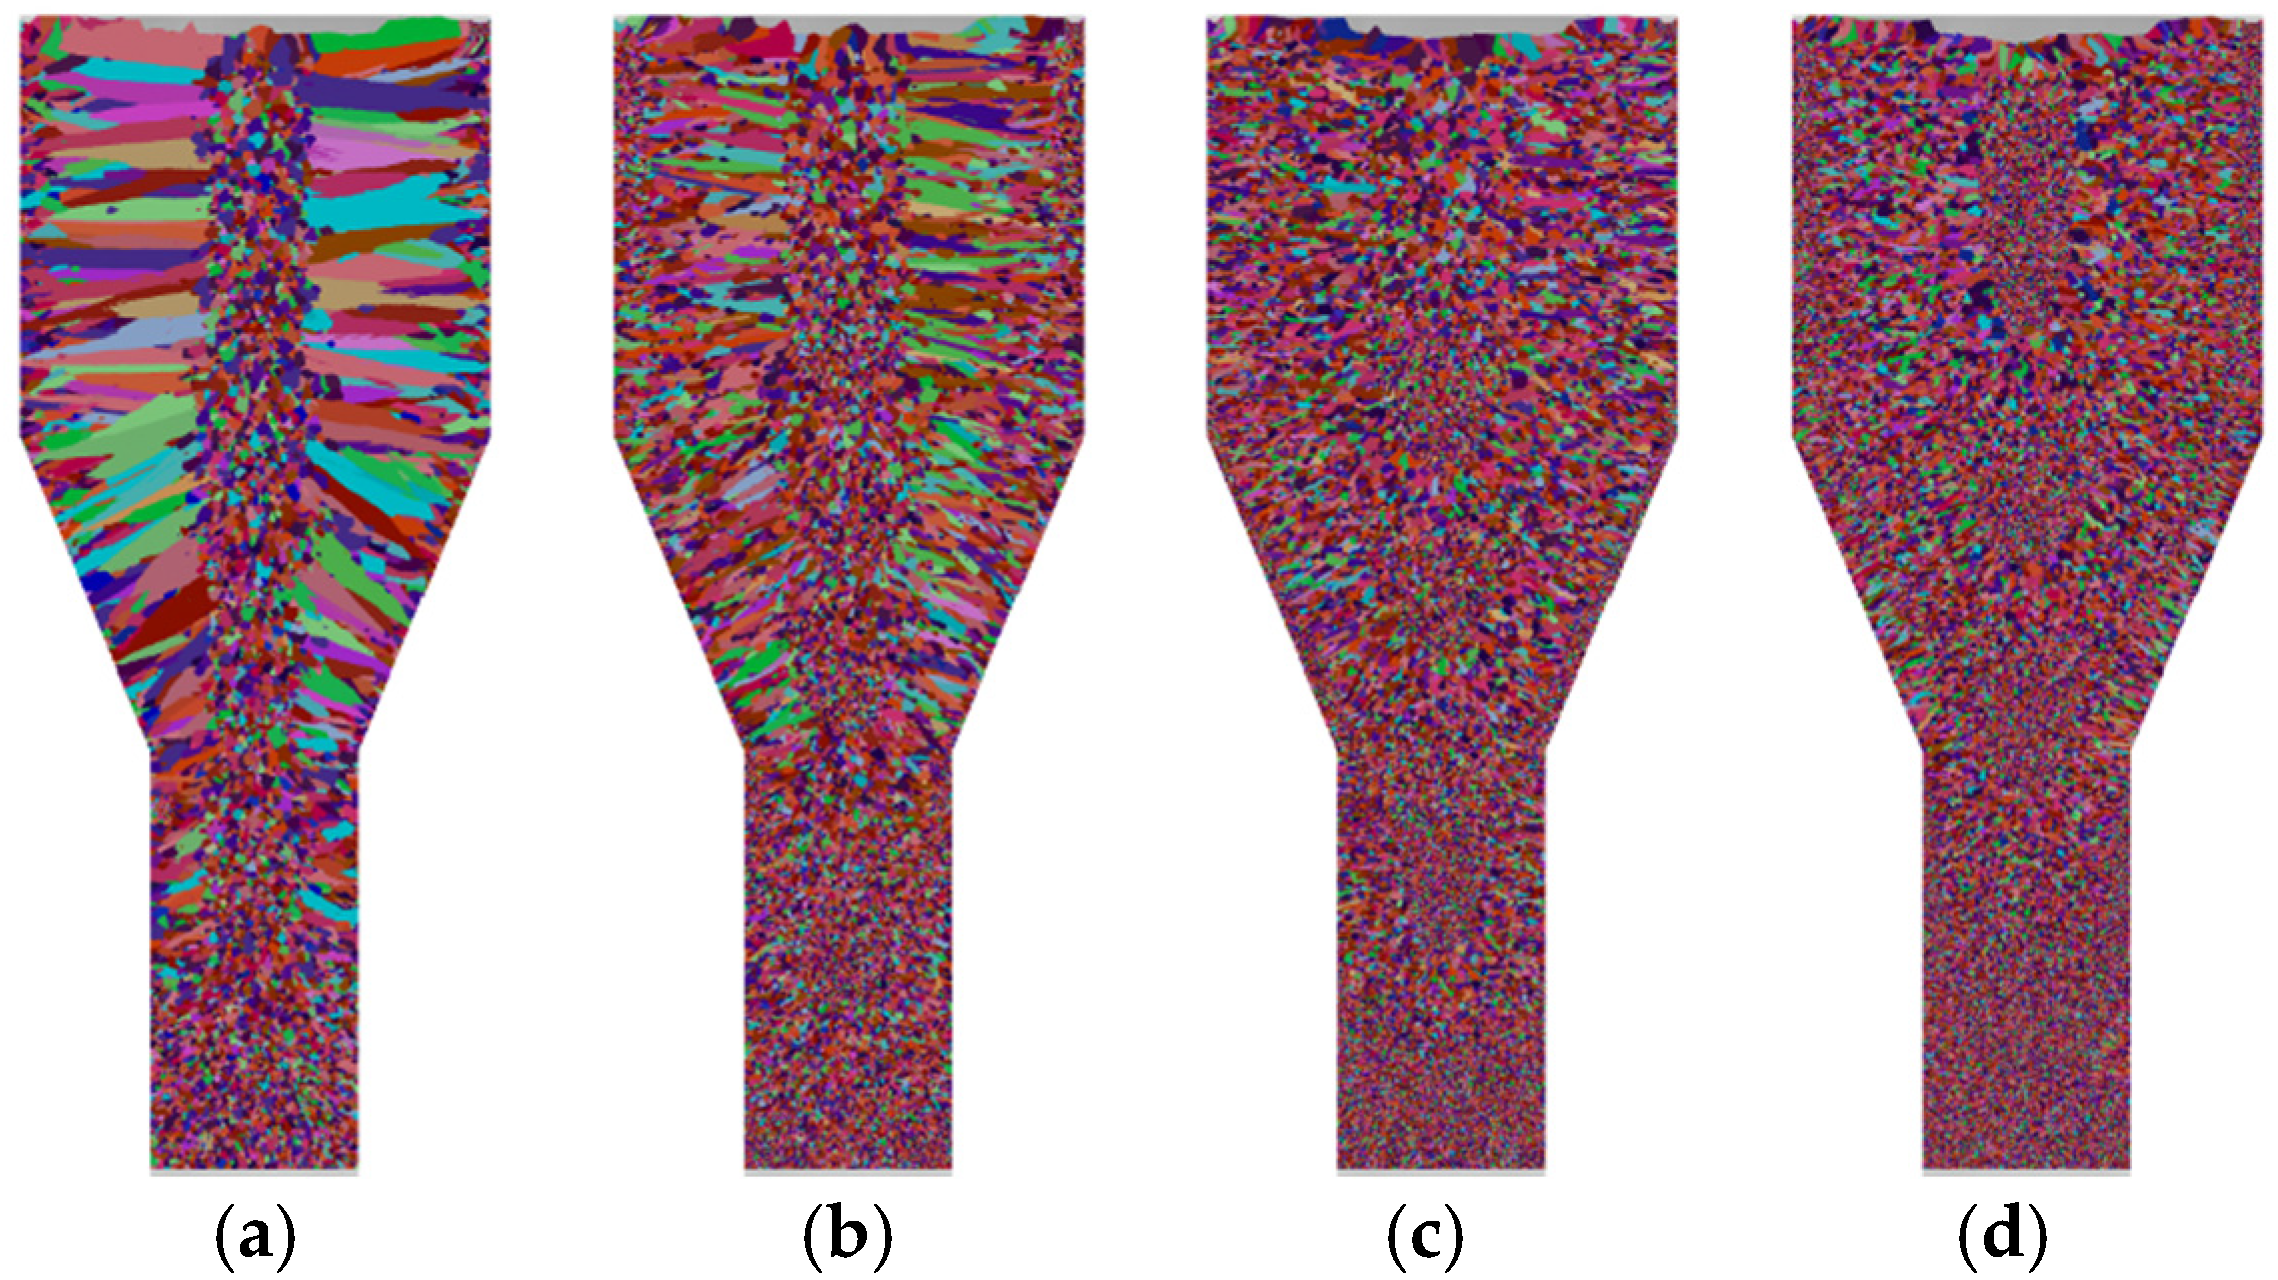
The cooling rate is a key factor influencing the solidification microstructure of cast alloys. To achieve accurate simulation of alloy solidification microstructures, it is essential to correctly reproduce the effects of different cooling rates. To verify the capability of the CAFE method in reasonably simulating the solidification microstructure of alloys under various cooling rates, this section adjusted the ingot cooling rate by modifying the heat transfer coefficient (HTC) parameters. Based on these adjustments, the solidification microstructures of ingots under different cooling rates were simulated and analyzed. The simulation cases 11–14 were carried out with the following fixed parameters: ns,max = 5 × 10⁸/m2, nv,max = 8 × 10¹²/m3, ΔTs,max = 1.0 K, ΔTs,σ = 0.1 K, ΔTv,max = 6.5 K, ΔTv,σ = 0.5 K, a2 = 0, a3 = 6 × 10⁻⁶. The parameters related to cooling rate used in the simulation cases for this section are listed in Table 4.
As shown in Figure 6, the simulated results of Cases 11–14 indicate that with increasing cooling rate, the grain structure of the ingot became significantly refined, which was consistent with the experimental observations. At the same time, the proportion and extent of the columnar grain zone within the ingot also changed markedly, as the cooling rate increased, the fraction of columnar grains decreased notably. However, it should be noted that variations in cooling rate can alter the parameters governing nucleation and grain growth processes [10], while these effects were not considered in the present simulations. To obtain more accurate simulation results, it is necessary to establish the relationships between cooling rate and key parameters such as nucleation undercooling, grain growth kinetics, and nucleation density. However, at the current stage, several fundamental limitations prevent a reliable formulation of such relations for most alloys. Although the qualitative influence of cooling rate on nucleation undercooling has been well understood, the quantitative relationships among these parameters have not yet been precisely determined [23,25]. Consequently, in current numerical simulations, these parameters are generally obtained indirectly through trial-and-error adjustments. A proper combination of these parameters may lead to accurate simulation of the solidification microstructure of alloys under actual casting conditions.

5. Experimental Verification

5.1. Calculation of Solidification Temperature Field

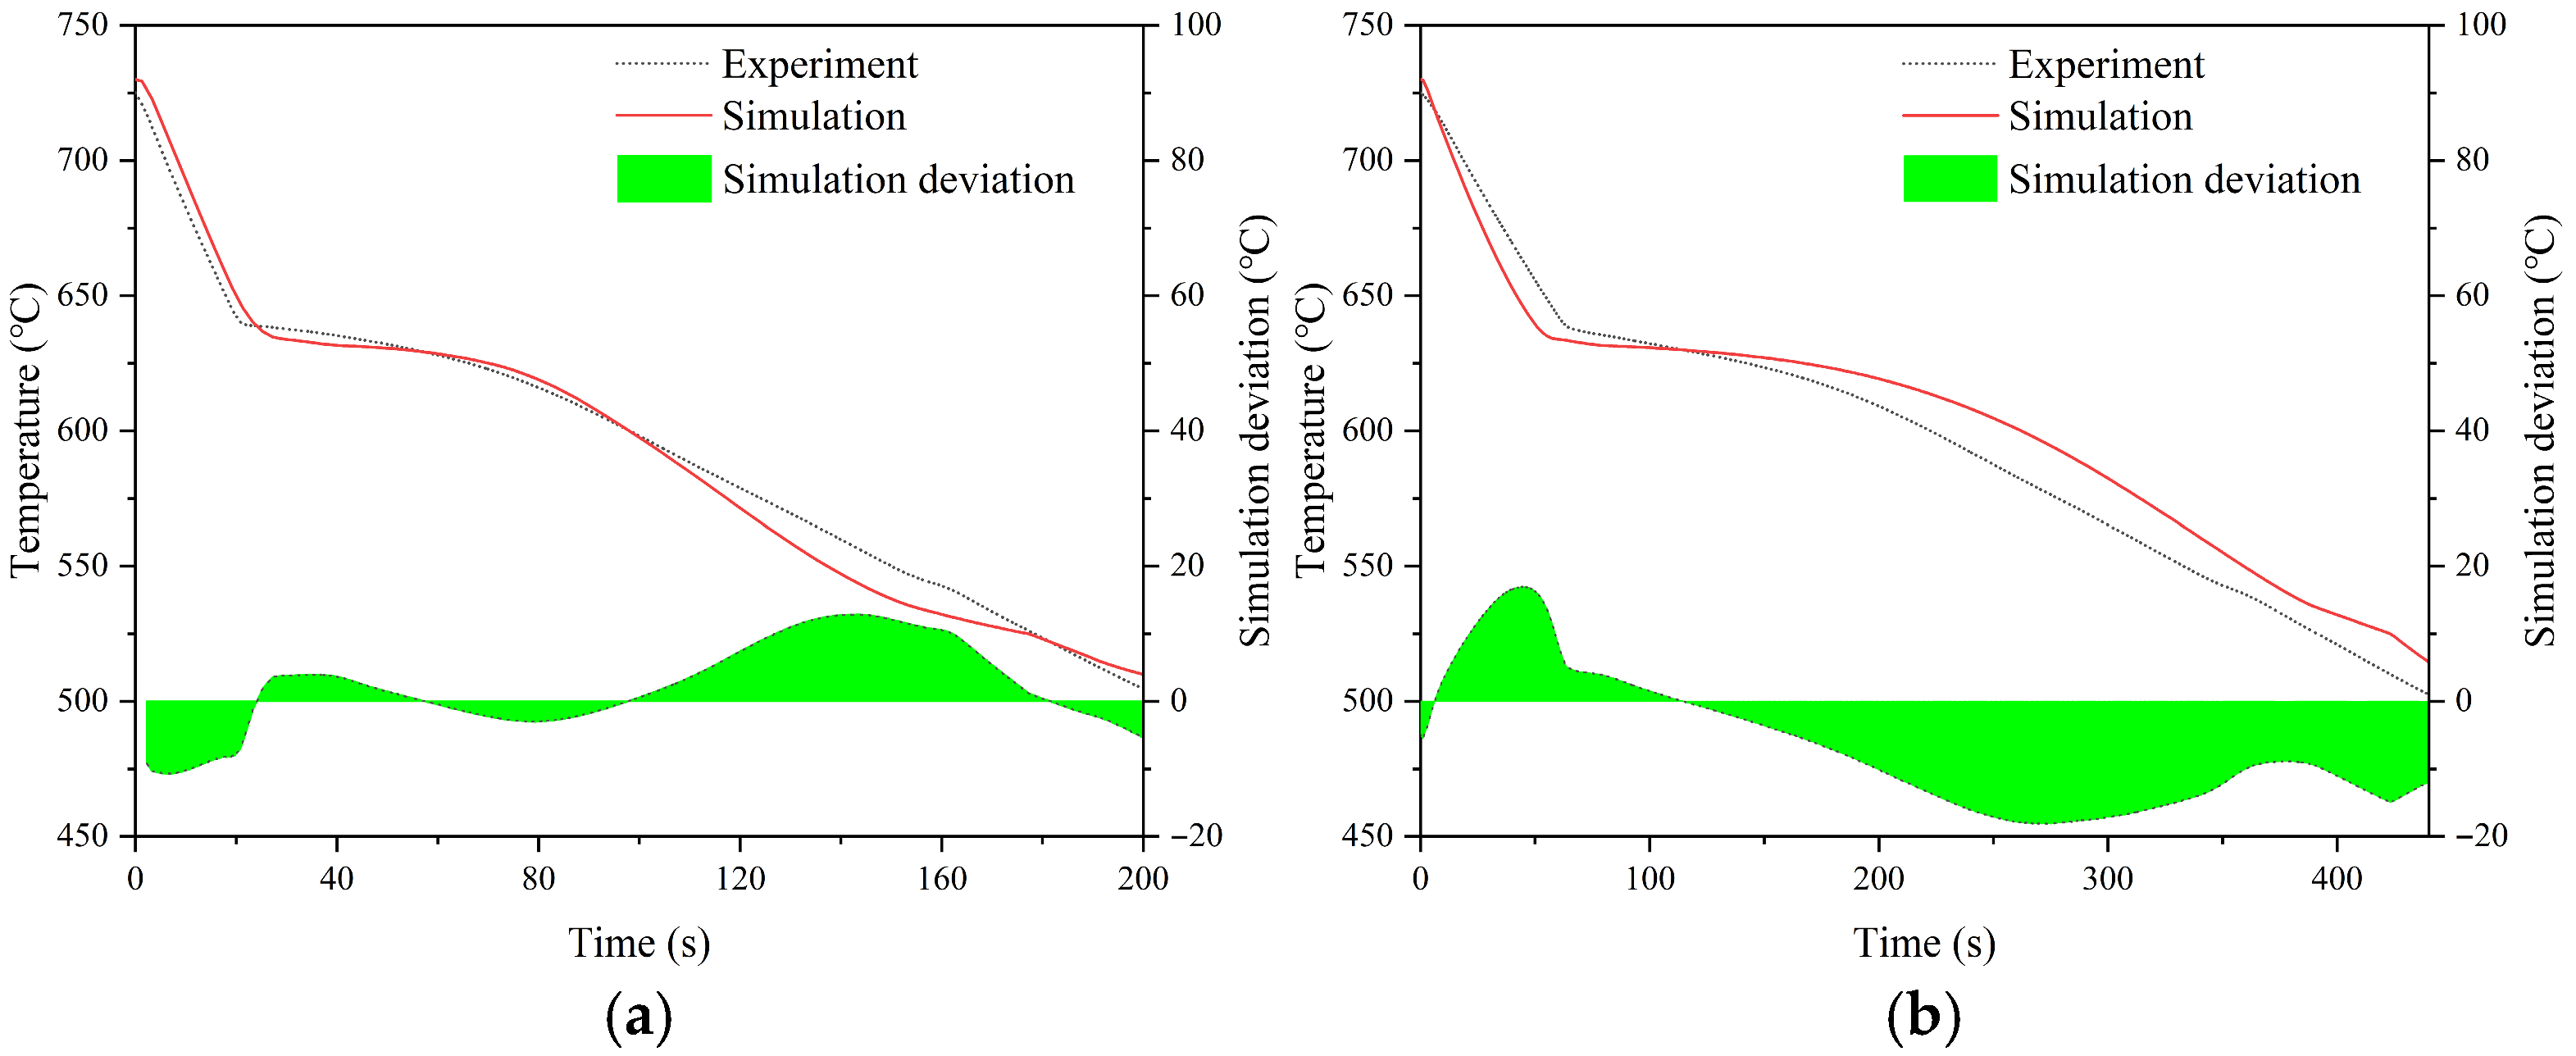
As discussed earlier, the simulated solidification microstructure of the ingot is strongly influenced by the cooling rate during solidification. Therefore, an accurate calculation of the temperature field during the solidification process is essential to ensure reliable simulation results. In this section, the solidification process of the WE54 alloy ingot was numerically simulated, and the results were validated using experimental data to ensure the accuracy of the calculated temperature field. The parameters used for calculating the solidification temperature field are listed in Table 5. The heat-transfer coefficients (HTCs) were determined using an inverse calculation method [26,27] based on the experimentally measured cooling curves shown in Figure 7. After 20 iterations of inverse calculations, the HTCs for the MMC and SMC processes were determined to be 500 W·m−2·K−1 and 250 W·m−2·K−1, respectively. Figure 7 presents a comparison between the simulated and experimental cooling curves for the ingots produced by MMC and SMC. The simulated curves show good agreement with the experimental results, with the average deviation being within 10 °C. Although the deviation increased during the later stage of solidification (below 600 °C), it should be noted that grain nucleation and growth primarily occur during the earlier stage (between 600 °C and 650 °C). In this temperature range, the simulation and experimental curves exhibited a high level of consistency, providing the necessary temperature-field accuracy for determining nucleation density and dendrite growth rate in the solidification microstructure simulation.
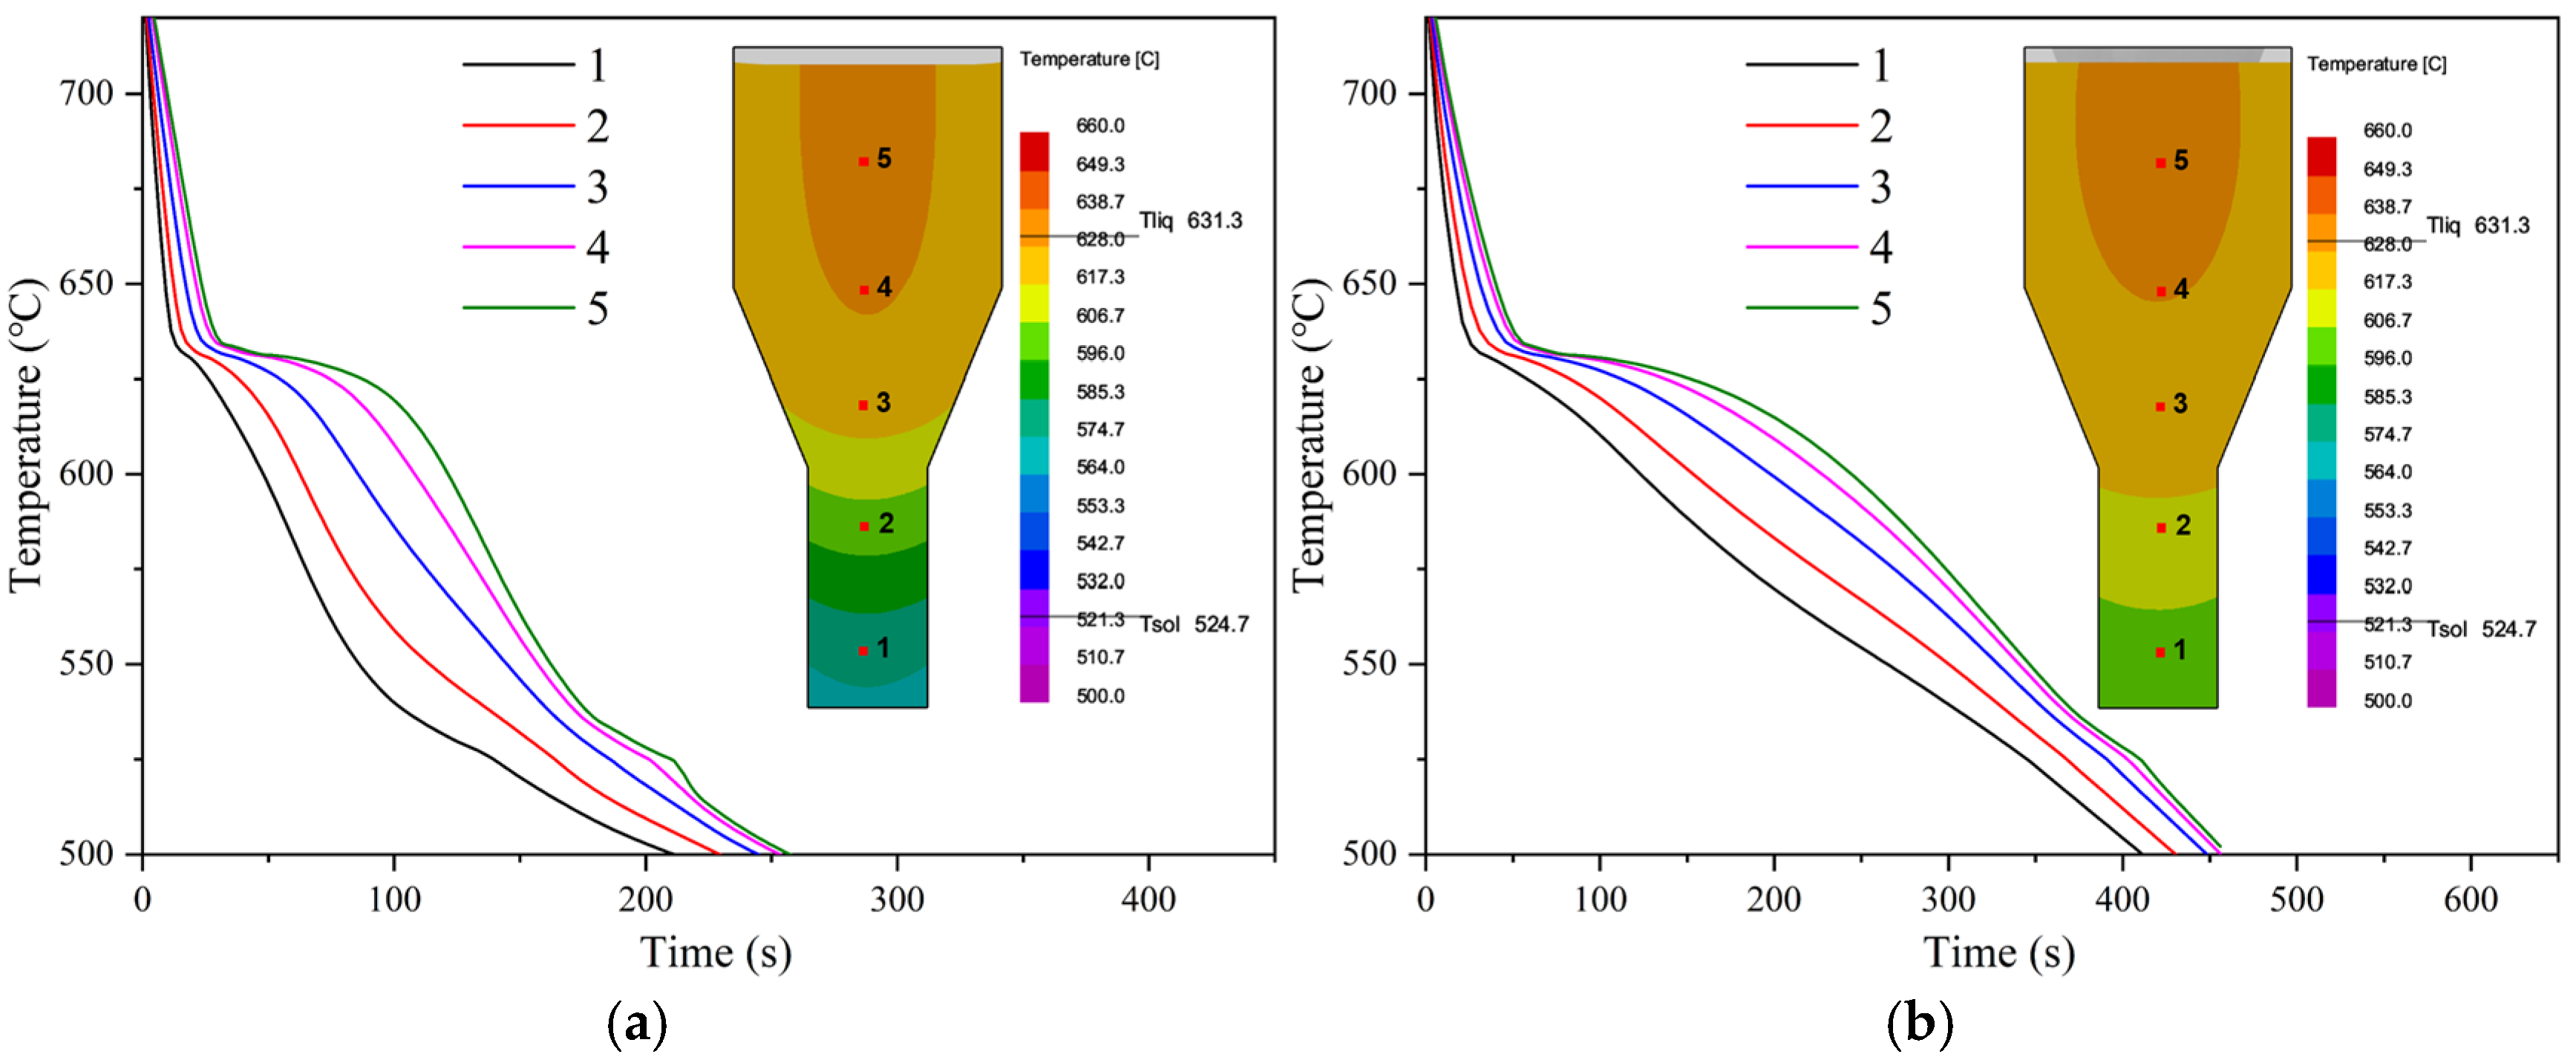
Figure 8 shows the simulated temperature field at the final stage of solidification and the cooling curves at different positions within the ingot. The calculated temperature field indicates that the ingot exhibits distinct directional solidification behavior. The overall solidification sequence progresses from the bottom to the top. The calculated cooling curves reveal that, within the temperature range between the liquidus (631 °C) and solidus (524 °C), the average cooling rate of the metal mold cast alloy was approximately 1 K/s, while that of the sand mold cast alloy was about 0.3 K/s. The temperature field data obtained from these simulations serve as the basis for subsequent numerical simulations of the solidification microstructure.

5.2. Solidification Microstructure Simulation

As indicated in Section 4, the nucleation undercooling, dendrite tip growth kinetics parameters, and solidification conditions all have a direct influence on the simulated solidification microstructure. Although both the nucleation undercooling and the dendrite tip growth kinetics parameters are closely related to the cooling rate of the alloy [18], their quantitative relationships are still difficult to establish. To achieve accurate simulation of alloy solidification microstructures, the widely adopted practice is to determine the nucleation undercooling and dendrite tip growth kinetics parameters through experimental calibration combined with trial simulations.
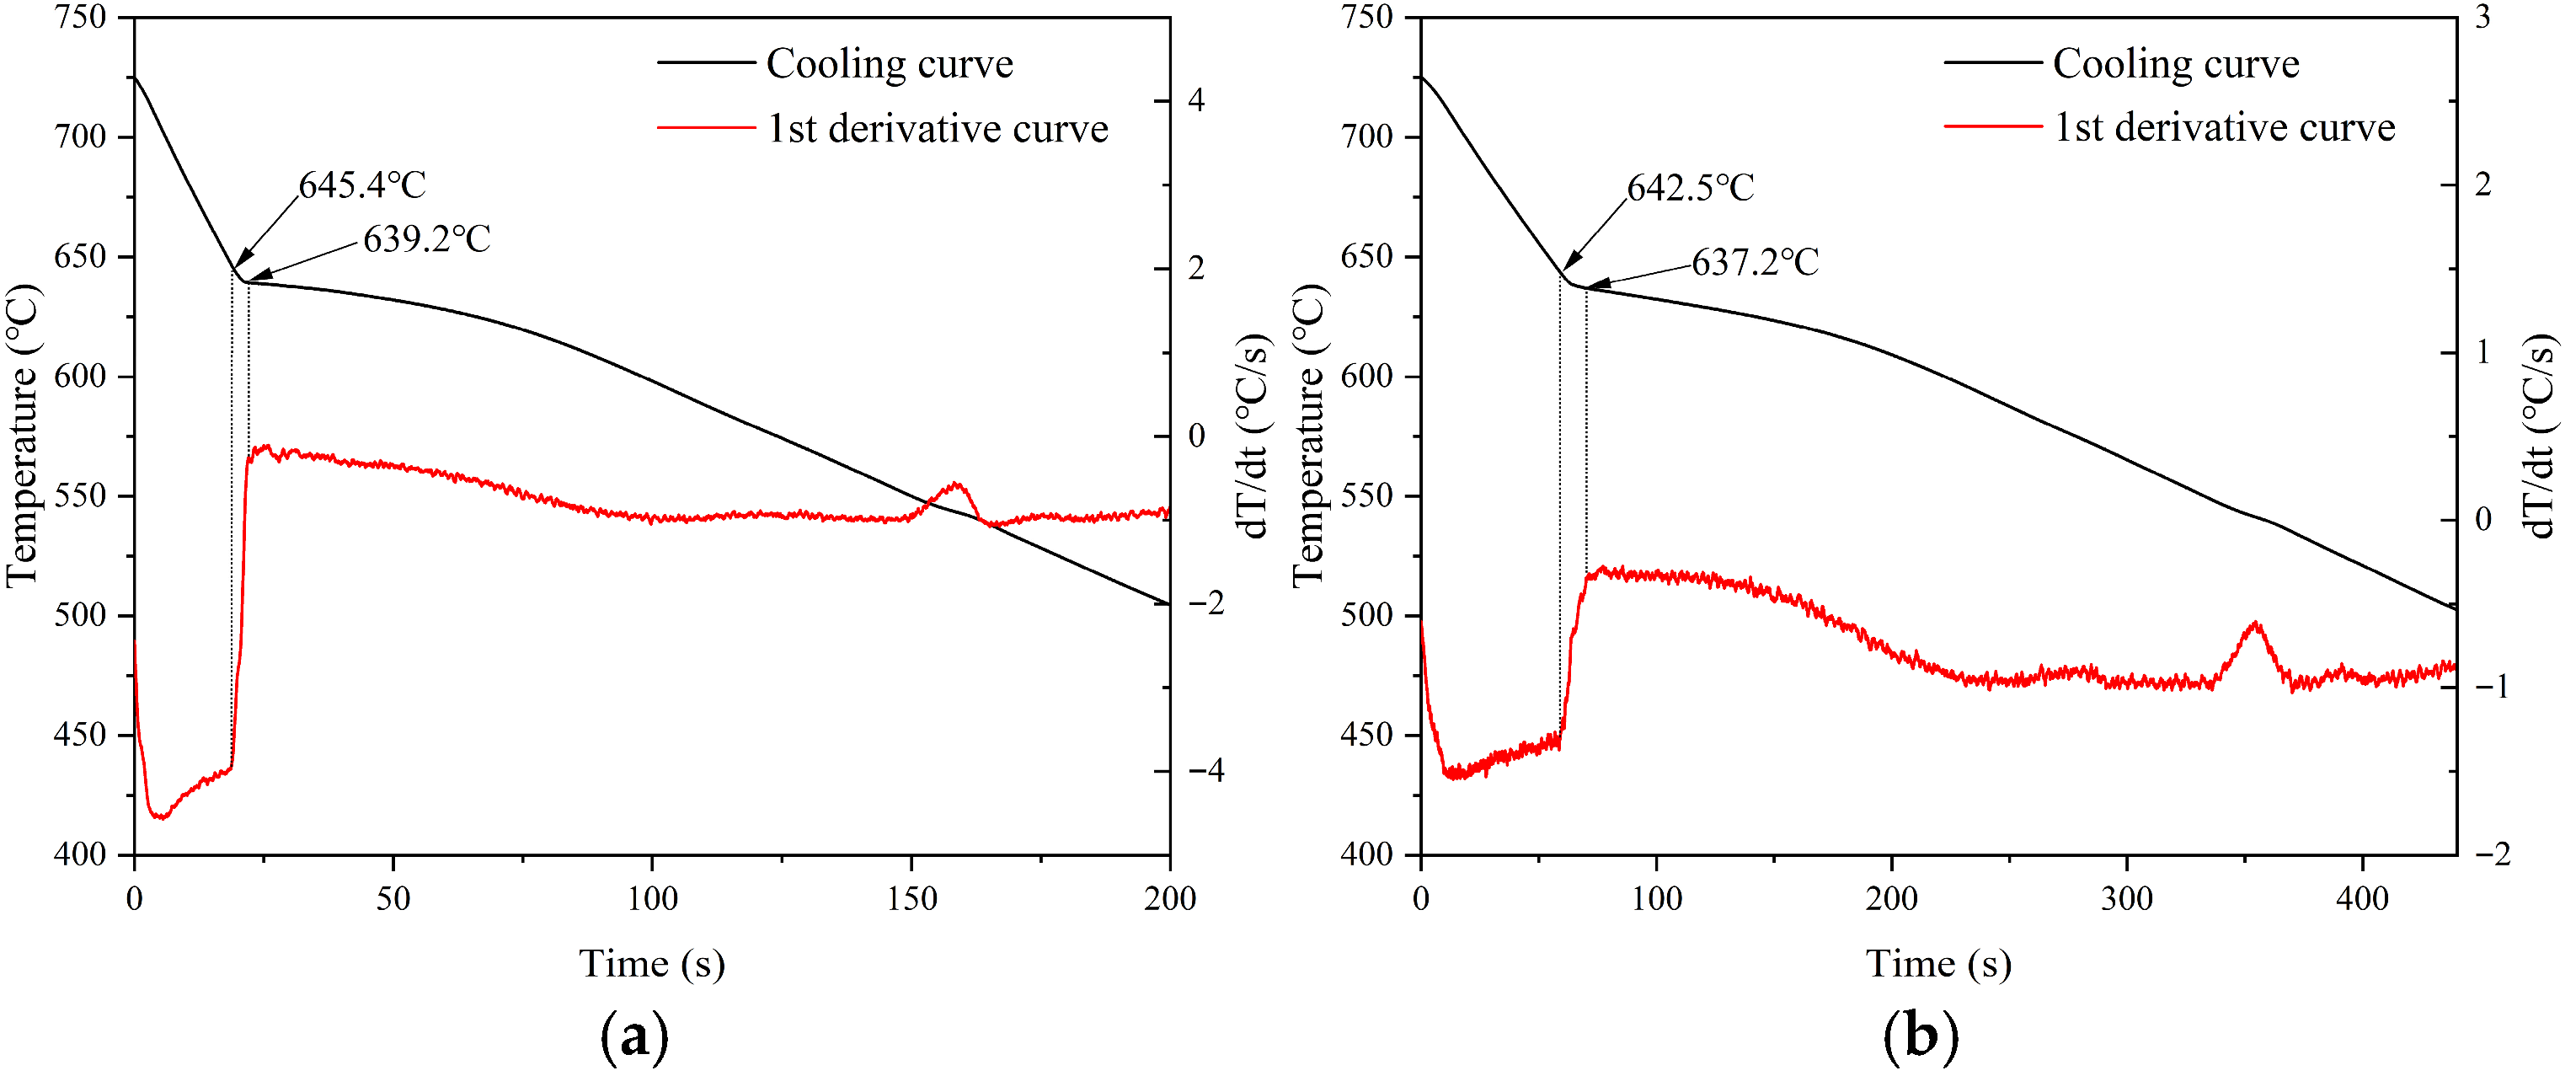
For the determination of nucleation undercooling, the commonly used approach is to extract it from the cooling curve of the alloy and its first derivative [18,28]. Figure 9 shows the cooling curves and their first derivative curves for the WE54 alloys produced by MMC and SMC. As shown in Figure 9a, during MMC, grain nucleation began at 645.4 °C and reached its maximum nucleation rate at 639.2 °C. Accordingly, the maximum nucleation undercooling can be determined to be approximately 6 °C. For the SMC alloy, the maximum nucleation undercooling was about 5 °C, slightly lower than that of the MMC alloy, as shown in Figure 9b. This is consistent with the commonly reported conclusion that the ΔTv,max of cast alloys increases with increasing cooling rate [18]. Compared with Fe–C alloys, whose ΔTv,max is approximately 10 K at a cooling rate of 0.3 K/s [23], the ΔTv,max values determined for the WE54 alloys are reasonable, considering that the melting point of WE54 alloy is much lower than that of Fe–C alloys. In this section, ΔTv,max was set to 6 K for the MMC alloy and 5 K for the SMC alloy. Since the nucleation undercooling required for surface nucleation is much lower than that for volumetric nucleation, ΔTs,max was set to 1 K for both MMC and SMC alloys. Meanwhile, ΔTv,σ and ΔTs,σ were set to 0.5 K and 0.1 K, respectively.
The dendrite tip growth kinetics parameters were calculated based on the alloy phase diagram and composition using the ProCAST 17.5 software, yielding values of a2 = 0 and a3 = 1 × 10⁻⁷. As the alloy composition of both MMC and SMC samples is identical, the same growth kinetics parameters were used for both processes. On this basis, the nucleation densities for the MMC and SMC alloys were determined through trial simulations and comparison with the experimental results. In summary, the parameters used for the solidification microstructure simulation of MMC and SMC WE54 alloys are listed in Table 6.
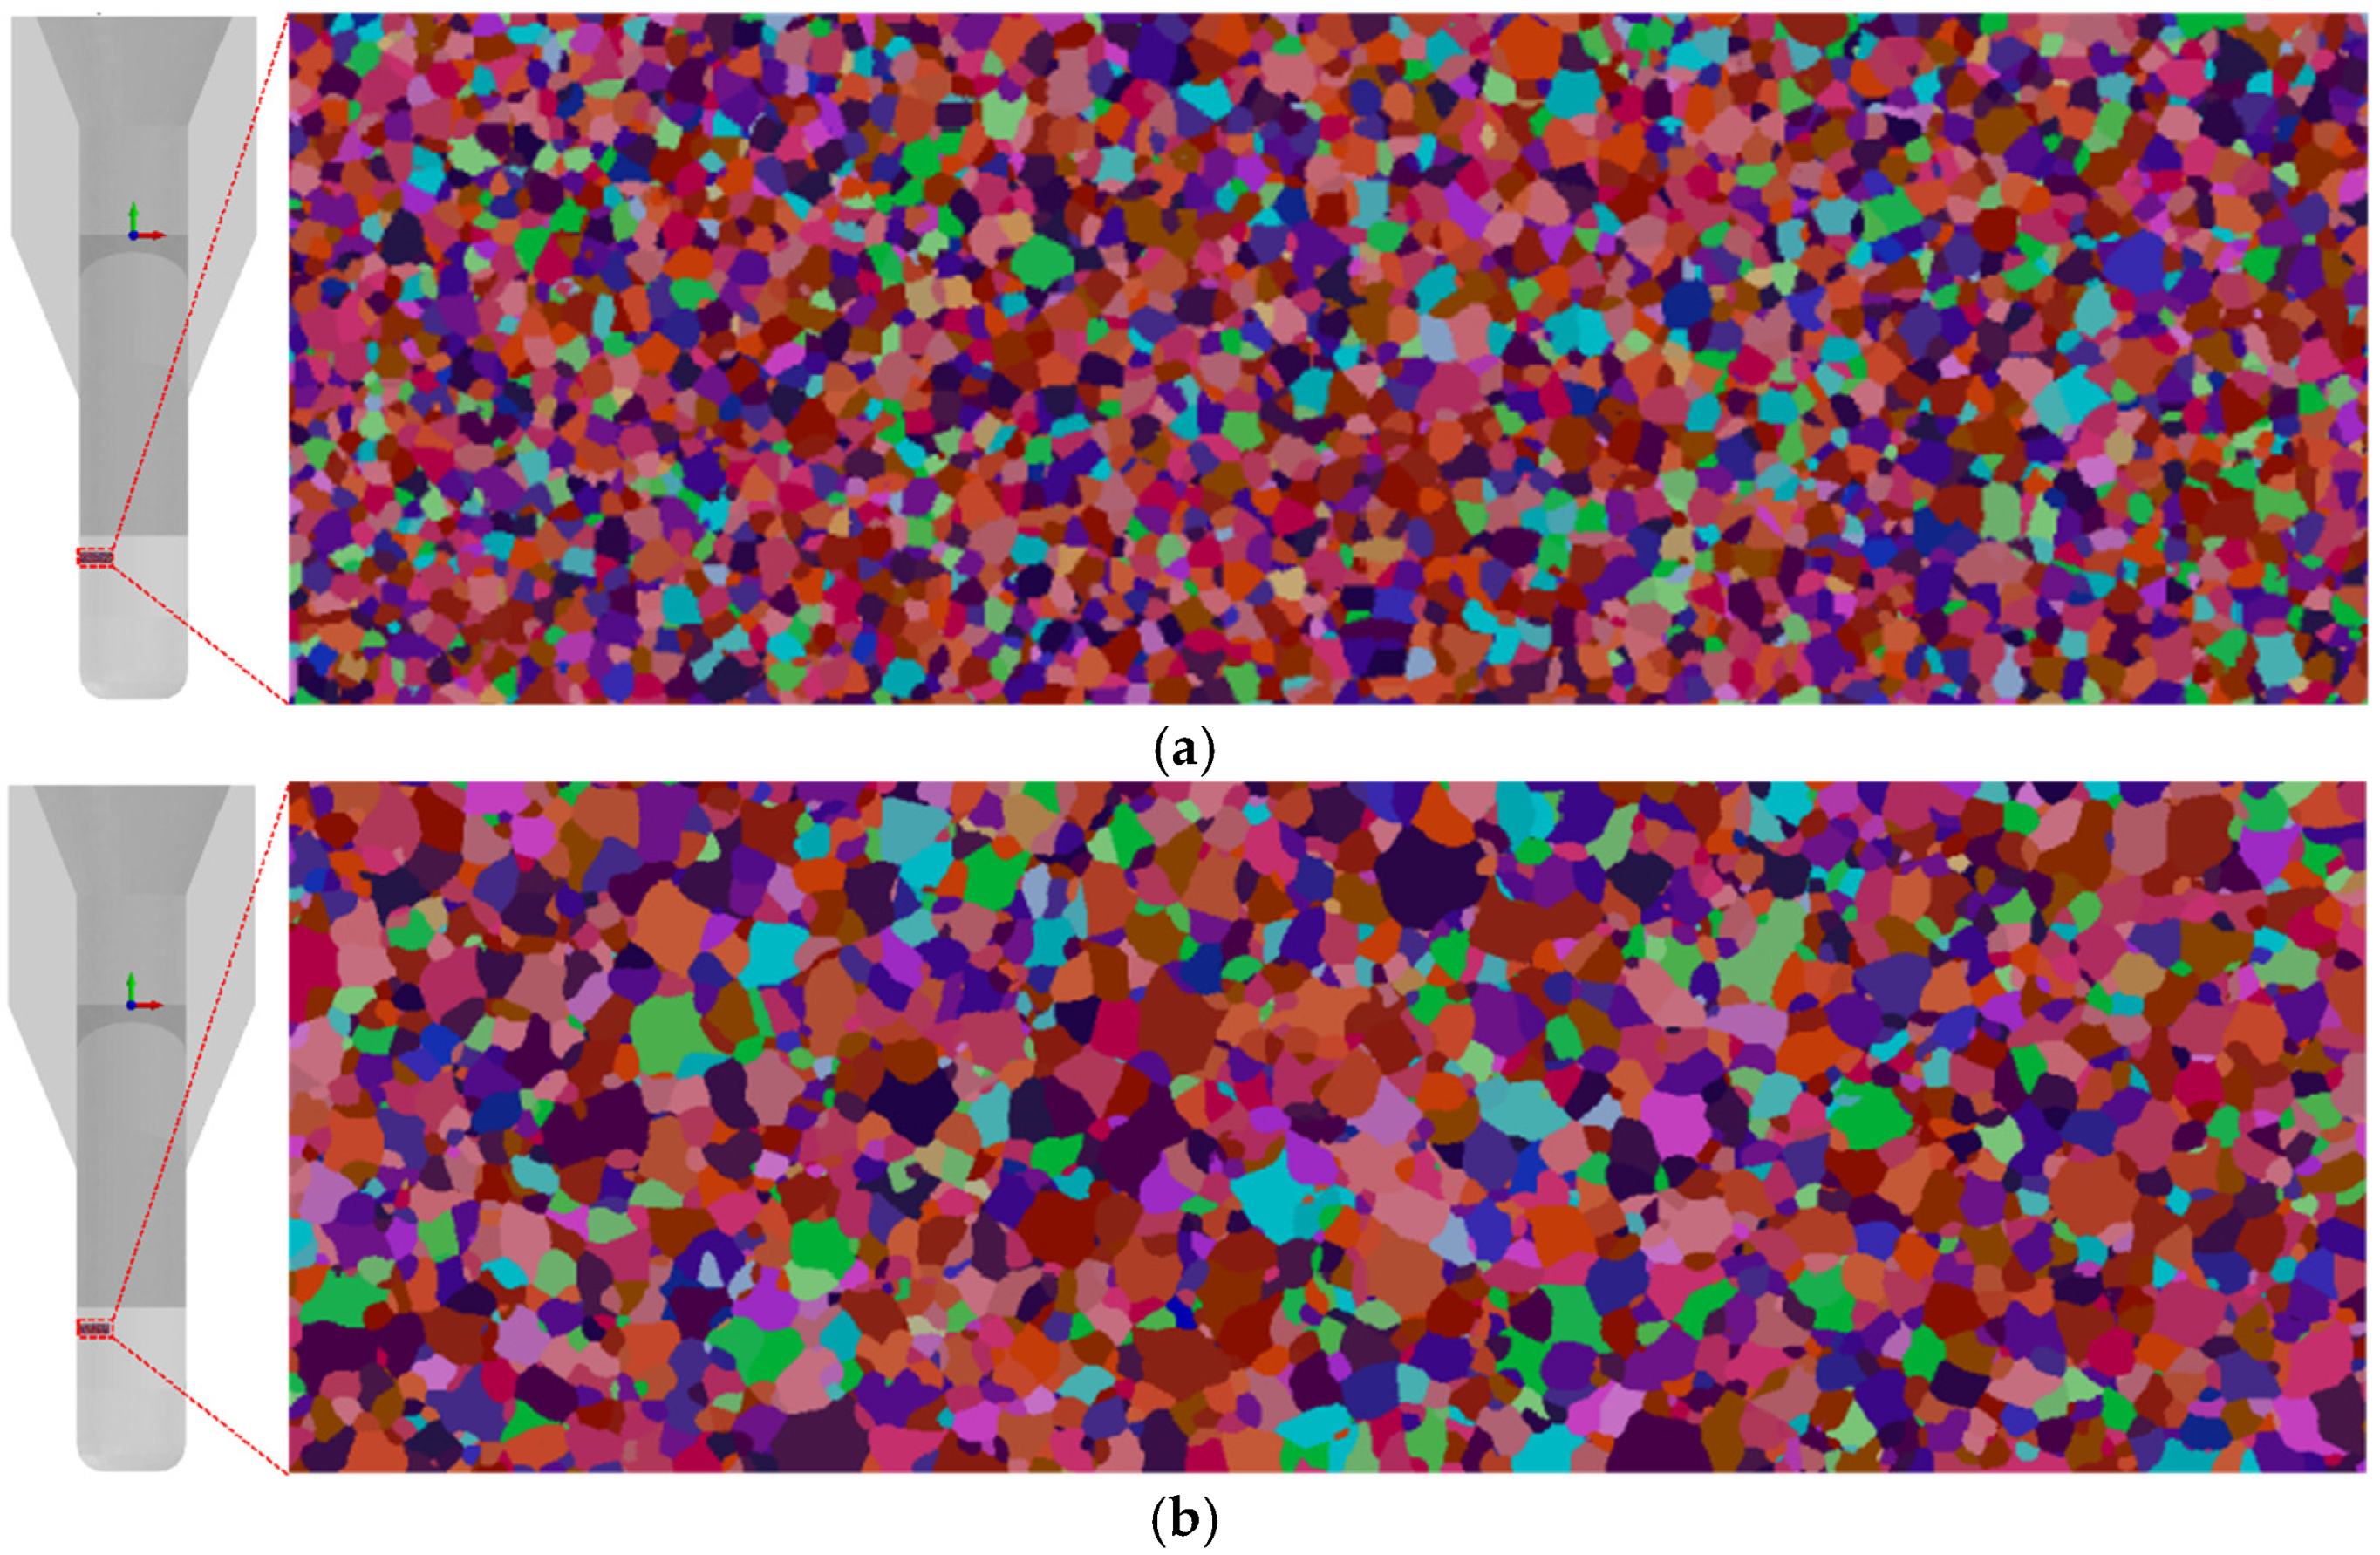
To achieve a more accurate simulation of the alloy’s grain size, a calculation zone with dimensions of 2 mm × 2 mm × 6 mm within the ingot (including the ingot surface, as shown in Figure 10) was selected for detailed solidification structure simulation, using the parameters listed in Table 6. The simulation results are presented in Figure 10, showing that both the MMC and SMC WE54 alloys exhibited a fully equiaxed grain structure. However, the grain size of the metal-mold-cast alloy was significantly smaller than that of the sand-mold-cast alloy, consistent with the higher cooling rate in the metal mold casting process.
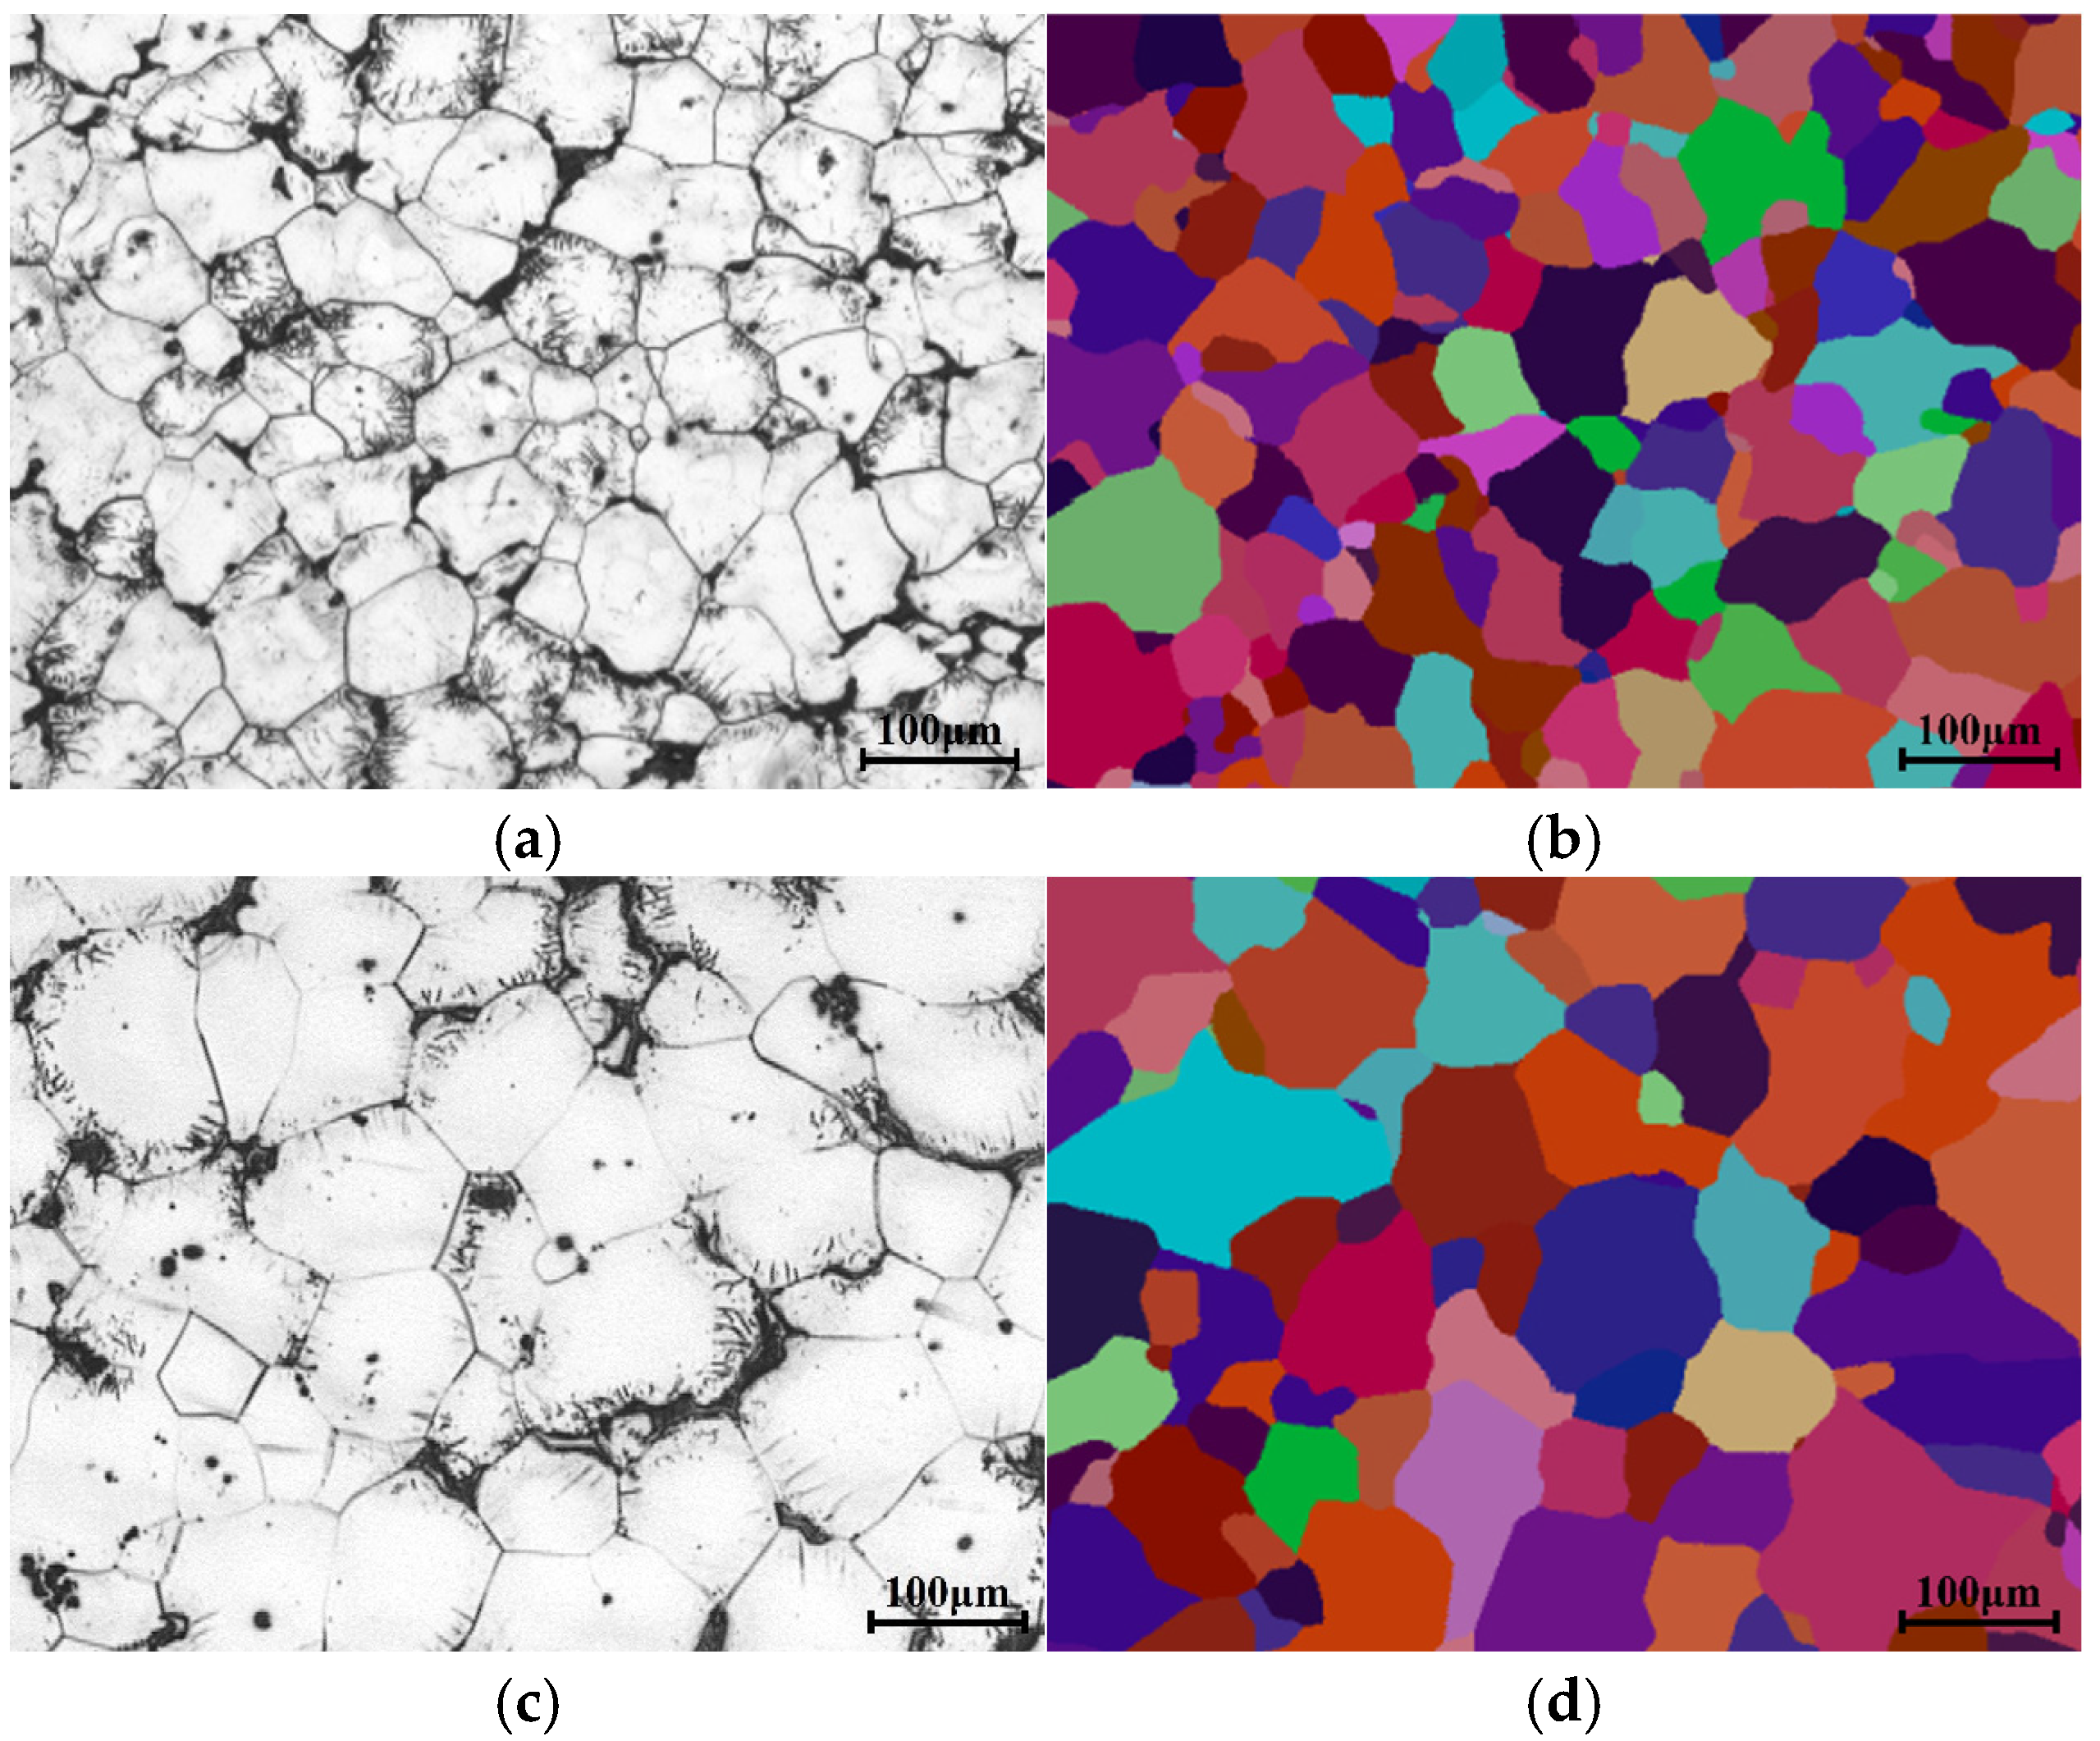
Figure 11 presents a detailed comparison between the simulated solidification microstructure and that observed experimentally. As shown in the figure, both the metal mold cast and sand mold cast WE54 alloys exhibited equiaxed grains along with a small amount of secondary phase distributed discontinuously along the grain boundaries. Due to the difference in cooling rates between the two casting processes, the grain size of the WE54 alloy varied significantly. Using the line-intercept method, the average grain size of the MMC WE54 alloy was determined to be approximately 92 μm, while that of the SMC WE54 alloy was about 150 μm. The simulated grain size and morphology agree well with the experimental observations, with average grain sizes of 86 μm and 143 μm, respectively, indicating that the simulation results accurately reflect the differences in grain size of WE54 alloy under different casting conditions. Since extensive studies have demonstrated that the mechanical properties of WE54 alloy are directly related to its grain size, and this relationship can be described by the Hall–Petch equation [29]. Once the solidification microstructure and grain size of the WE54 alloy are accurately simulated, its mechanical properties can be conveniently predicted. This enables integrated “process–microstructure–property” numerical simulation and prediction for the WE54 alloy.

6. Conclusions

(1)
The effects of nucleation undercooling and dendrite tip growth kinetic parameters on the CAFE simulation results of the solidification microstructure were investigated. When the surface nucleation undercooling is kept constant, increasing the volume nucleation undercooling significantly increases the proportion of columnar grains in the ingot. Under constant nucleation parameters, increasing the dendrite tip growth rate also expands the columnar grain region.
(2)
The influence of cooling rate on simulation results was investigated. As the cooling rate increases, the solidified microstructure becomes markedly refined, indicating that the CAFE model can reasonably capture the effects of cooling conditions and other process parameters on the solidification structure of cast alloys. The CAFE method effectively simulates the solidification microstructure of alloys under different cooling conditions.
(3)
Based on experimentally measured cooling curves, inverse heat-transfer analysis was performed to determine the interfacial heat-transfer coefficients for MMC and SMC processes, which were found to be 500 W·m−2·K−1 and 250 W·m−2·K−1, respectively. Using these values, numerical simulations were carried out to obtain the corresponding cooling curves, which showed a high degree of agreement with the experimental results, with a maximum deviation of less than 10 °C. The calculated temperature fields indicate that the average cooling rates of the MMC and SMC WE54 alloys are approximately 1 °C/s and 0.3 °C/s, respectively.
(4)
By analyzing the alloy cooling curves and their first-derivative curves, the nucleation undercooling of WE54 alloy was determined. Under MMC and SMC conditions, the maximum nucleation undercooling is approximately 6 °C and 5 °C, respectively. The dendrite tip growth kinetic parameters were determined using software calculations. Based on these parameters, the simulated solidification microstructures of MMC and SMC WE54 alloys consist entirely of equiaxed grains, consistent with experimental observations. The numerically predicted grain sizes for MMC and SMC WE54 alloys are 86 μm and 143 μm, respectively, whereas the experimentally measured grain sizes are 92 μm and 150 μm. These results demonstrate that the numerical simulation can accurately predict the grain size and thereby provide a reliable basis for predicting the alloy’s mechanical properties.

Author Contributions

Conceptualization, J.L. and J.F.; methodology, J.L.; validation, J.L. and J.F.; formal analysis, J.L. and R.Z.; investigation, J.L. and R.Z.; resources, J.L.; data curation, J.L.; writing—original draft preparation, J.L.; writing—review and editing, J.F.; visualization, J.L.; supervision, J.L. and J.F.; funding acquisition, J.F. All authors have read and agreed to the published version of the manuscript.

Funding

This research was funded by Natural Science Foundation of Ningxia, China (2024AAC03148) and the Fundamental Research Funds for the Central Universities Research Project North Minzu University (2021XYZCL01).

Data Availability Statement

The original contributions presented in this study are included in the article. Further inquiries can be directed to the corresponding author.

Conflicts of Interest

The authors declare no conflicts of interest.

References

  1. He, L.; Zheng, J.; He, Q.; Li, T.; Shou, H.; Yin, D.; Bai, S.; Jiang, B.; Pan, F. Achieving superior strength and ductility synergy of WE54 alloy via combined dislocation introduction and twinning. J. Mater. Sci. Technol. 2025, 227, 174–191. [Google Scholar] [CrossRef]
  2. Saravanan, S.; Hattimare, A.R.; Mahadik, A.B.; Singh, A.; Kumar, U.N.; Annamalai, A.R. Effect of Heat Treatment on High-Temperature Tribological Behavior of WE54 Alloy: An Experimental Study. J. Manuf. Mater. Process. 2025, 9, 304. [Google Scholar] [CrossRef]
  3. Song, J.; She, J.; Chen, D.; Pan, F. Latest research advances on magnesium and magnesium alloys worldwide. J. Magnes. Alloys 2020, 8, 1–41. [Google Scholar] [CrossRef]
  4. Yang, Y.; Xiong, X.; Chen, J.; Peng, X.; Chen, D.; Pan, F. Research advances of magnesium and magnesium alloys worldwide in 2022. J. Magnes. Alloys 2023, 11, 2611–2654. [Google Scholar] [CrossRef]
  5. Bai, J.; Yang, Y.; Wen, C.; Chen, J.; Zhou, G.; Jiang, B.; Peng, X.; Pan, F. Applications of magnesium alloys for aerospace: A review. J. Magnes. Alloys 2023, 11, 3609–3619. [Google Scholar] [CrossRef]
  6. Meng, X.; Cui, L.; Zhu, M. Research progress of cellular automaton simulation on microstructure evolution of steel solidification. J. Cent. South Univ. 2022, 53, 387–397. [Google Scholar] [CrossRef]
  7. Zhang, J.; Li, X.; Xu, D.; Yang, R. Recent progress in the simulation of microstructure evolution in titanium alloys. Prog. Nat. Sci. 2019, 29, 295–304. [Google Scholar] [CrossRef]
  8. Wu, M.W.; Xiong, S.M. Microstructure simulation of high pressure die cast magnesium alloy based on modified CA method. Acta Metall. Sin. 2010, 46, 1534–1542. [Google Scholar]
  9. Teferra, K.; Rowenhorst, D.J. Optimizing the cellular automata finite element model for additive manufacturing to simulate large microstructures. Acta Mater. 2021, 213, 116930. [Google Scholar] [CrossRef]
  10. Rappaz, M.; Gandin, C.A. Probabilistic modelling of microstructure formation in solidification processes. Acta Metall. Mater. 1993, 41, 345–360. [Google Scholar] [CrossRef]
  11. Gandin, C.A.; Desbiolles, J.L.; Rappaz, M.; Thévoz, P. A three-dimensional cellular automaton-finite element model for the prediction of solidification grain structures. Metall. Mater. Trans. A-Phys. Metall. Mater. Sci. 1999, 30, 3153–3165. [Google Scholar] [CrossRef]
  12. Gandin, C.-A.; Rappaz, M. A coupled finite element-cellular automaton model for the prediction of dendritic grain structures in solidification processes. Acta Metall. Mater. 1994, 42, 2233–2246. [Google Scholar] [CrossRef]
  13. Pan, Q.; Jin, W.; Huang, S.; Guo, Y.; Jiang, M.; Li, X. Simulation and Study of Influencing Factors on the Solidification Microstructure of Hazelett Continuous Casting Slabs Using CAFE Model. Materials 2024, 17, 1869. [Google Scholar] [CrossRef]
  14. Yang, W.; Sa, S.; Hao, W.; Qin, J.; Zhang, J.; Liu, L. Temperature Field and Microstructure Simulation of Directional Solidification Process of Single Crystal Blade Prepared Efficiently with Different Module Structures. Rare Metal Mat. Eng. 2023, 52, 3847–3856. [Google Scholar]
  15. Sui, D.; Zhou, D.; Liu, Y.; Shan, Y.; Dong, A. Microstructure evolution of K439B Ni-based superalloy casting with varying cross-sections by experiments and simulations. Trans. Nonferr. Met. Soc. China 2025, 35, 1182–1196. [Google Scholar] [CrossRef]
  16. Peng, B.; Li, X.; Wang, X.; Mo, J.; Luo, L. Simulation study on temperature field and microstructure of Ti-6Al-4V alloy round ingot during EBCHM. Mater. Res. Express 2021, 8, 046505. [Google Scholar] [CrossRef]
  17. Khosroaghayani, M.; Khorasanian, M.; Zaree, S.R.A.; Eskandari, M. Investigation of Microstructure and Mechanical Properties of AZ91 Magnesium Alloy Produced by Directional Solidification Method in Different Angles Using CAFE Simulation. Int. J. Met. 2023, 17, 195–209. [Google Scholar] [CrossRef]
  18. Wang, X.Y.; Wang, F.F.; Wu, K.Y.; Wang, X.F.; Xiao, L.; Li, Z.Q.; Han, Z.Q. Experimental study and cellular automaton simulation on solidification microstructure of Mg-Gd-Y-Zr alloy. Rare Metals 2021, 40, 128–136. [Google Scholar] [CrossRef]
  19. Shi, H.; Chen, Q.P.; Li, K.Y.; Shen, H.F. Numerical Simulation of Grain Structure and Macrosegregation of Electroslag Remelting Process Based on Cellular Automaton-Finite Element Method. Metall. Mater. Trans. B-Proc. Metall. Mater. Proc. Sci. 2022, 53, 107–120. [Google Scholar] [CrossRef]
  20. Yuan, W.; Zhao, H.; Shen, X.; Zou, C.; Liu, Y.; Xu, Q. Numerical simulation of microstructure and microporosity morphology in directional solidification of aluminum-copper alloys: Effect of copper content and withdrawal rate. China Foundry 2025, 22, 33–44. [Google Scholar] [CrossRef]
  21. Wang, Z.; Chen, Z.; Zhang, Q.; Wang, X. A modified microscopic cellular automaton model for the simulation of microstructure evolution during solidification/melting of nickel-based superalloys. J. Cryst. Growth 2025, 652, 128052. [Google Scholar] [CrossRef]
  22. Zhou, R.Y.; Feng, X.H.; Zheng, C.; Huang, Q.Y.; Li, Y.J.; Yang, Y.S. Numerical Simulation of Microstructure Evolution of Directionally Annealed Pure Iron by Cellular Automata. Metals 2023, 13, 2. [Google Scholar] [CrossRef]
  23. Rappaz, M. Modelling of microstructure formation in solidification processes. Int. Mater. Rev. 1989, 34, 93–124. [Google Scholar] [CrossRef]
  24. Jia, Y.; Zhao, D.; Li, C.; Bao, L.; Le, Q.; Wang, H.; Wang, X. Study on Solidification Structure Evolution of Direct-Chill Casting High Purity Copper Billet Using Cellular Automaton-Finite Element Method. Metals 2020, 10, 8. [Google Scholar] [CrossRef]
  25. Perepezko, J.H.; Wilde, G. Melt undercooling and nucleation kinetics. Curr. Opin. Solid State Mat. Sci. 2016, 20, 3–12. [Google Scholar] [CrossRef]
  26. Liu, X.; Wang, Y.; Zheng, H.; Guo, Z.; Liu, G.; Wang, Z. Investigation and Application of Inverse Determination of Interfacial Heat Transfer Coefficient in Vacuum Investment Casting. Int. J. Met. 2024, 18, 3210–3220. [Google Scholar] [CrossRef]
  27. Motoyama, Y.; Tokunaga, H.; Matsushita, A.; Sakamoto, T.; Okane, T. A Combined Experimental-Numerical Method for Determining the Heat Transfer Coefficient at a Fluid Flowing Molten Copper-Casting Mold Interface. Int. J. Met. 2023, 17, 158–169. [Google Scholar] [CrossRef]
  28. Li, J.; Feng, J.; Li, Y.; Dong, F.; Geng, G. Cooling curve thermal analysis, phase constitution, and solidification characteristics of cast Mg-5Gd-2Y-xNd-Zr alloys. J. Therm. Anal. Calorim. 2020, 142, 1429–1435. [Google Scholar] [CrossRef]
  29. Yu, H.H.; Xin, Y.C.; Wang, M.Y.; Liu, Q. Hall-Petch relationship in Mg alloys: A review. J. Mater. Sci. Technol. 2018, 34, 248–256. [Google Scholar] [CrossRef]
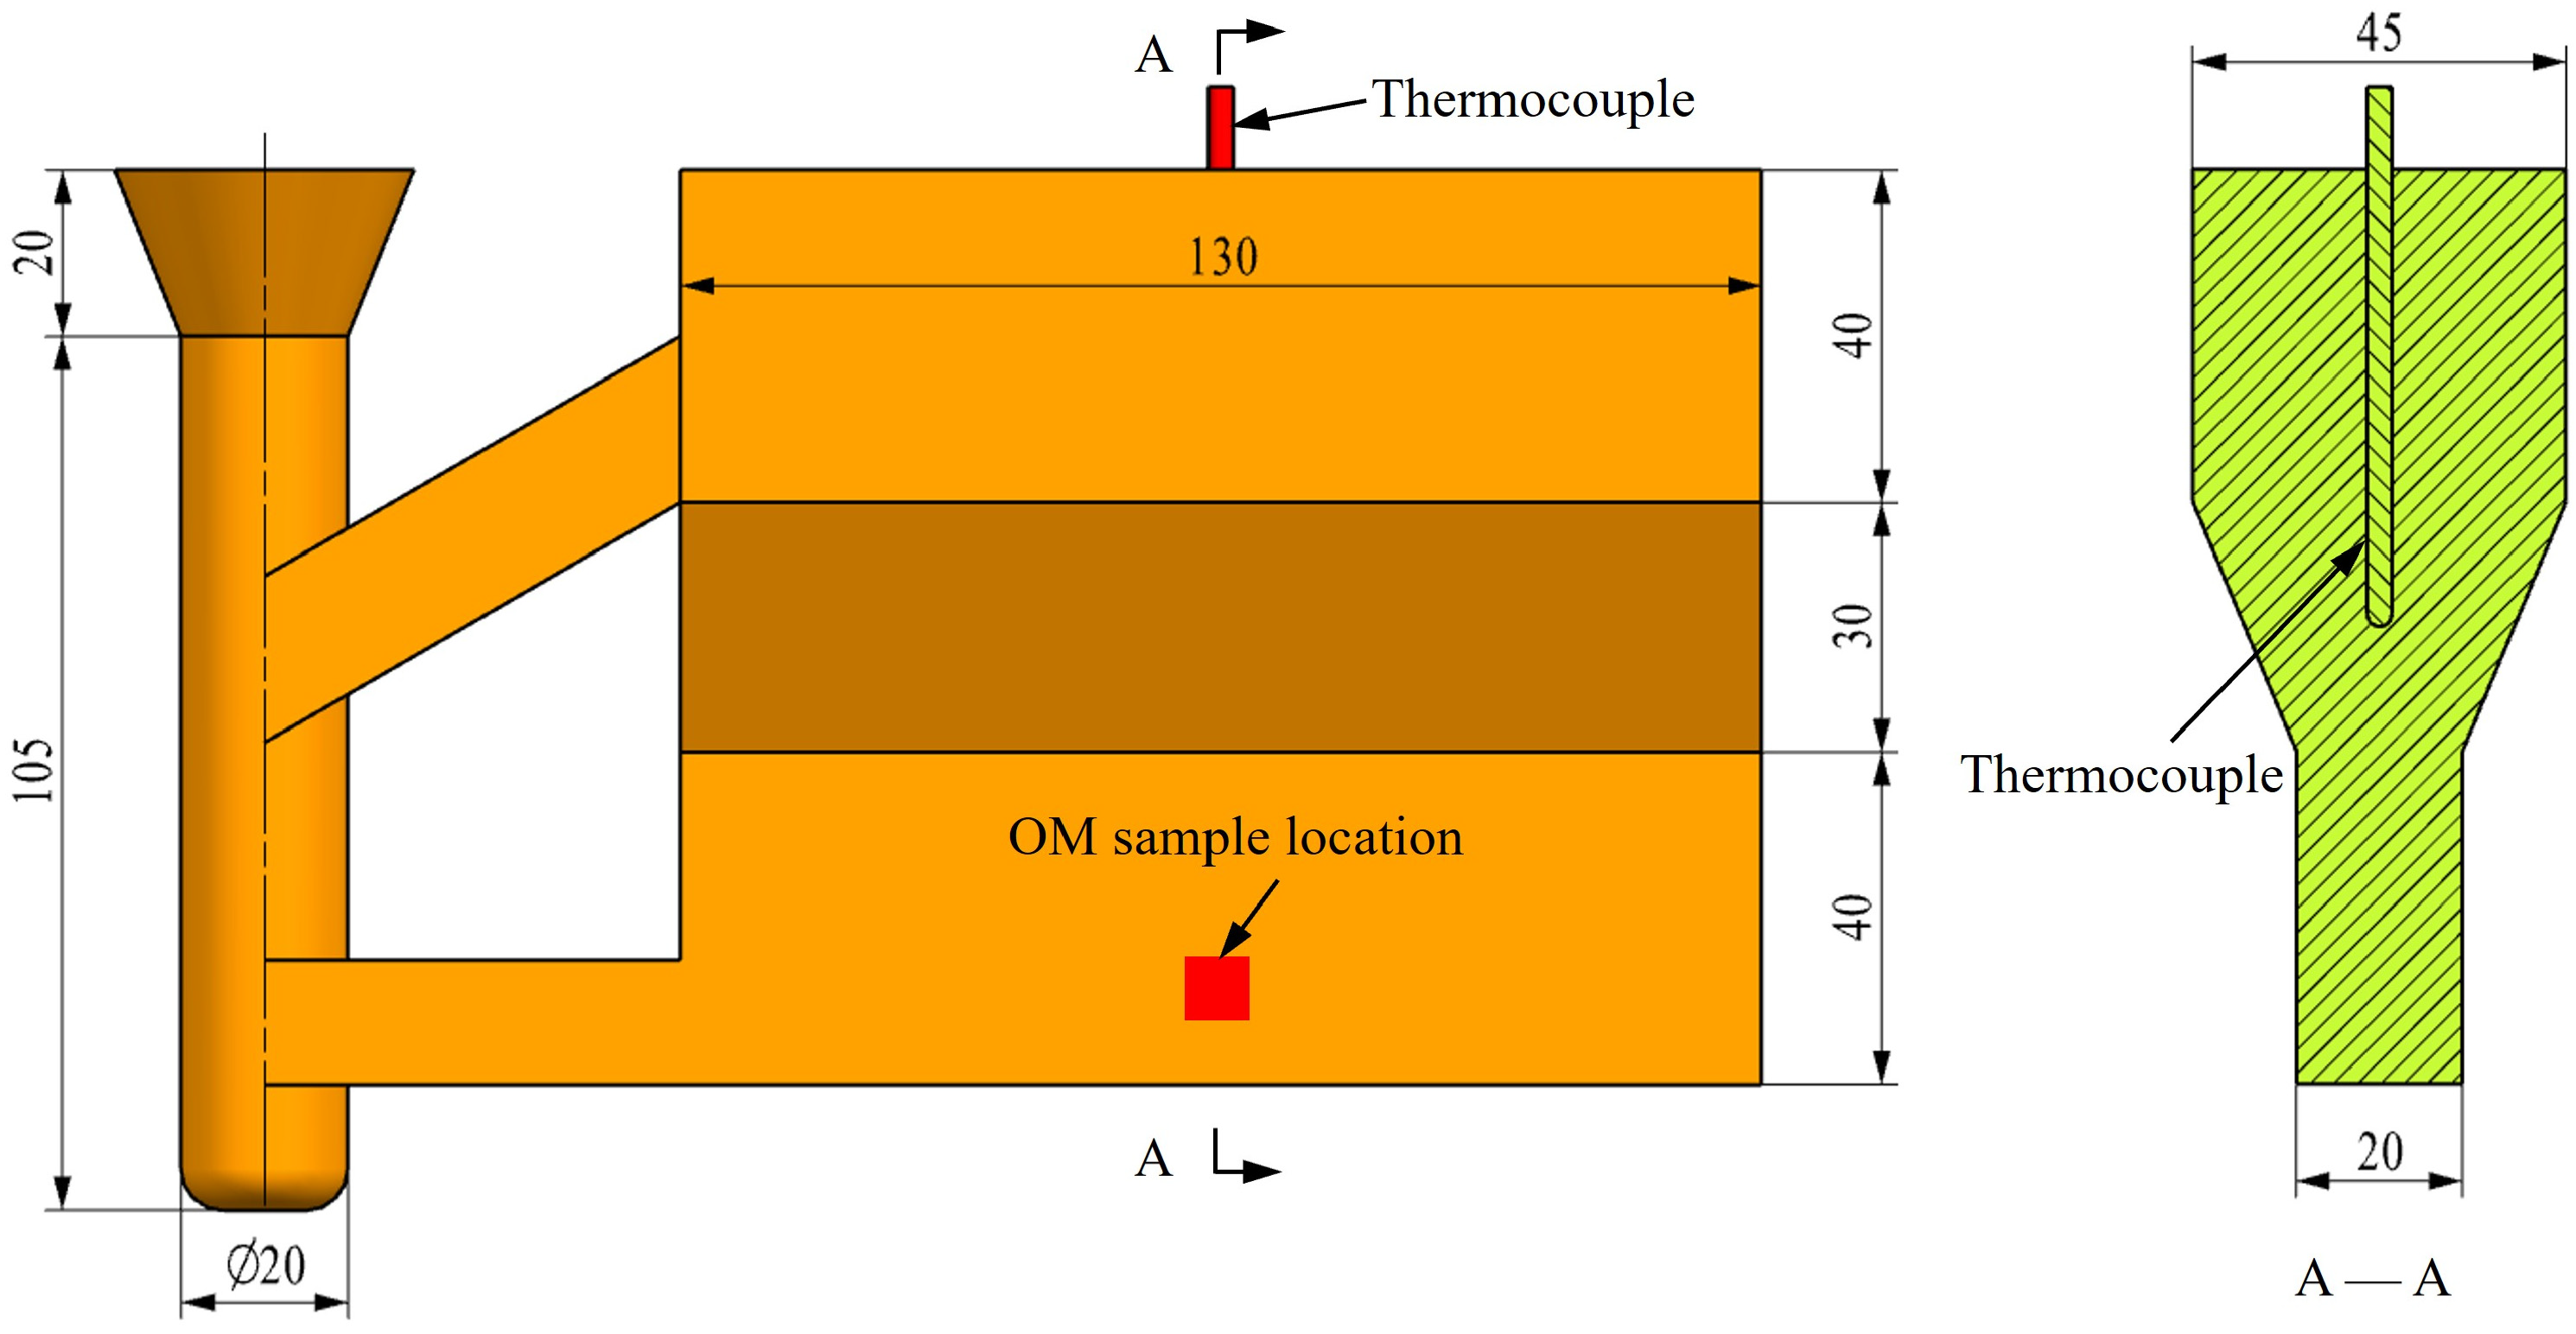
Figure 1. Shape and dimensions of the WE54 alloy ingot.
Metals 15 01268 g001
Figure 2. Relationship between nucleation density and undercooling degree for surface nucleation and volume nucleation of the continuous nucleation model.
Metals 15 01268 g002
Figure 3. Simulation results of the microstructure of sand cast steel ingot with different ΔTv,max: (a) Case 01, ΔTv,max = 5 K; (b) Case 02, ΔTv,max = 6 K; (c) Case 03, ΔTv,max = 6.5 K; (d) Case 04, ΔTv,max = 7 K; (e) Case 05, ΔTv,max = 7.5 K; (f) Case 06, ΔTv,max = 8 K.
Metals 15 01268 g003
Figure 4. Simulation results of the surface layer microstructure (the arrows point to the center of the ingot): (a) case 01; (b) case 03.
Metals 15 01268 g004
Figure 5. Simulation results of the microstructure of WE54 alloy with different dendrite tip growth kinetic parameters: (a) Case 07, a3 = 3 × 10⁻⁶ m/(s·K3); (b) Case 08, a3 = 6 × 10⁻⁶ m/(s·K3); (c) Case 09, a3 = 1.2 × 10⁻⁵ m/(s·K3); (d) Case 10, a3 = 2.4 × 10⁻⁵ m/(s·K3).
Metals 15 01268 g005
Figure 6. Simulation results of the microstructure of WE54 alloy under different cooling rates: (a) Case 11, 0.5 °C/s; (b) Case 12, 1 °C/s; (c) Case 13, 2 °C/s; (d) Case 14, 3 °C/s.
Metals 15 01268 g006
Figure 7. Simulation and experimental results of cooling curves for MMC and SMC WE54 alloy ingots: (a) MMC; (b) SMC.
Metals 15 01268 g007
Figure 8. Simulation results of temperature field and cooling curves of MMC and SMC WE54 alloy ingots: (a) MMC; (b) SMC.
Metals 15 01268 g008
Figure 9. Cooling curves and corresponding first derivative curves for WE54 alloy casting ingots: (a) MMC; (b) SMC.
Metals 15 01268 g009
Figure 10. Simulation results of a 2 mm × 2 mm × 6 mm zone within the ingot: (a) MMC WE54 alloy; (b) SMC WE54 alloy.
Metals 15 01268 g010
Figure 11. Solidification microstructure of WE54 alloy: (a) MMC, experimental observation; (b) MMC, simulation results; (c) SMC, experimental observation; (d) SMC, simulation results.
Metals 15 01268 g011
Table 1. Chemical composition of the WE54 alloy (wt.%).
YGdNdZrMg
4.552.132.250.45Bal.
Table 2. Nucleation undercooling parameters used for the microstructure simulation cases 01–06.
Case No.ΔTs,max (K)ΔTs,σ (K)ΔTv,max (K)ΔTv,σ (K)
0110.150.5
0210.160.5
0310.16.50.5
0410.170.5
0510.17.50.5
0610.180.5
Table 3. Dendrite tip growth kinetic parameters used for simulation cases 07–10.
Case No.a2 (m/(s·K2))a3 (m/(s·K3))
0703 × 10−6
0806 × 10−6
0901.2 × 10−5
1002.4 × 10−5
Table 4. Parameters related to cooling rate used for simulation cases 11–14.
Case No.Mold MaterialHTC (W/(m2·K))Cooling Rate (°C/s)
11AISI 10083000.5
12AISI 10085001
13AISI 10087502
14AISI 100810003
Table 5. Parameters used for solidification temperature field calculation of MMC and SMC WE54 alloy.
Casting ProcessCast AlloyMold Material 1HTC (W/(m2·K))Pouring Temperature
(°C)
MMCWE54AISI 1008500760
SMCWE54Silica sand250760
1 The thermophysical parameters of the mold materials were selected from the material database of the ProCAST 17.5 software.
Table 6. Parameters used for solidification microstructure simulation of MMC and SMC WE54 alloy.
Casting Processns,max
(m−2)
nv,max
(m−3)
ΔTs,max
(K)
ΔTs,σ
(K)
ΔTv,max
(K)
ΔTv,σ
(K)
a2 (m/(s·K2))a3 (m/(s·K2))
MMC2 × 1096.5 × 101310.160.501 × 10−7
SMC1.5 × 1094 × 101310.150.501 × 10−7
Disclaimer/Publisher’s Note: The statements, opinions and data contained in all publications are solely those of the individual author(s) and contributor(s) and not of MDPI and/or the editor(s). MDPI and/or the editor(s) disclaim responsibility for any injury to people or property resulting from any ideas, methods, instructions or products referred to in the content.