Article

Numerical Simulation of the Differential Influence of Work Roll and Intermediate Roll Profiles on Strip Shape

1
School of Mechanical Engineering, University of Science and Technology Beijing, Beijing 100083, China
2
Shougang Zhixin Electromagnetic Materials (Qian’an) Co., Ltd., Qian’an 064400, China
*
Author to whom correspondence should be addressed.
Metals 2025, 15(11), 1226; https://doi.org/10.3390/met15111226
Submission received: 21 September 2025 / Revised: 23 October 2025 / Accepted: 3 November 2025 / Published: 6 November 2025

Abstract

This study employs the UCMW (Universal crown mill with work roll shifting) cold rolling mill as the research object, focusing on the critical process parameter of single-taper profiles for both the work roll and intermediate roll. By establishing an integrated finite element model of the roll-strip system, this analysis examines the influence patterns of single-taper profiles applied to the work roll, the intermediate roll, and their combined configuration on strip shape. The research demonstrates that when the work roll utilizes a single-taper profile, the strip shape approximates a rectangular profile at a shift amount of −75 mm and exhibits a concave profile at −95 mm. For the intermediate roll employing a single-taper profile, the strip shape manifests a convex profile within the shift range of −150 mm and transitions to an M-shape at −180 mm. Utilizing the combined roll profiles induces a gradual transition in strip shape from convex to concave within the shift range of −50 mm to −95 mm. Comparative analysis indicates that at a shift of −50 mm, the combined roll profiles yield a shape closer to rectangular; at −75 mm, the work roll profile produces superior results; at −95 mm, both the work roll profile and the combined profiles result in concave shapes, with the combined configuration exerting the most pronounced effect. This investigation furnishes a theoretical foundation for roll profile optimization in rolling mills and the enhancement of strip dimensional precision.

Graphical Abstract

1. Introduction

In modern rolling production, the shape accuracy of the strip profile is one of the core indicators for measuring the quality of strip products. Its uniformity and stability directly affect the yield rate, production efficiency, and the fatigue life and structural reliability of end products in complex service environments [1,2,3]. As key controllable parameters in the rolling process, work roll and intermediate roll profiles significantly influence the strip profile by altering the contact stress distribution between rolls, elastic flattening morphology, and metal flow patterns [4,5].
The core quality indicator of cold-rolled strip shape mainly includes the strip crown, edge drop, transverse thickness uniformity and so on. Given that the mill type is known, the roll profile is an important aspect to influence the strip shape [1], particularly, the roll shape can be adjusted without changing the structure of the existing rolling mill, which is the most economical method for improving the control ability of strip shape [6,7], as demonstrated by Ginzburg, Lenard, Halmos et al., researchers have systematically elucidated the impact mechanisms of various roll profile designs on the strip shape by integrating advanced methodologies such as numerical simulation, finite element analysis, and industrial-scale experimentation [8,9]. Among this, the UCMW mill is the main stream mill because of its abundant profile control methods of the work roll bending (WRB), the work roll shifting (WRS), the intermediate roll bending (IMRB) and the intermediate roll shifting (IMRS); therefore, it is necessary to study the action mechanism of roll profile on the strip shape in the specific UCMW cold rolling mill. Tao et al. analyzed the flatness control characteristics of roll shifting and profile for the non-oriented silicon steel strip in the UCMW cold rolling mill [10], Wang et al. analyzed the control characteristics of intermediate roll shifting on strip edge drop in the UCM (Universal crown mill) cold rolling mills [11,12,13], Li et al. proposed a segmented CVC (Continuously variable crown) contour for the intermediate roll to enhance the strip shape control capability in a 6-high cold rolling mill [14].
There are many methods to calculate the strip deformation in cold rolling, such as the analytical method, the finite element method and intelligent algorithm. Nowadays, Wang et al. through three-dimensional finite element modeling and proposed an analysis method for the flatness actuator efficiency [11,12,13], Li et al. integrated a three-dimensional elastic-plastic finite element model with production data to reduce the proportions of edge wave and center wave in the strip steel [14], Han et al. established a full-process cold tandem rolling strip profile prediction model based on the PSO-BP algorithm [15], Song et al. constructed a transverse thickness difference prediction model based on the GA-PSO-SVR algorithm, improving prediction accuracy [16,17,18], Jin et al. optimized the intermediate roll contour and work roll contour of six-high cold rolling mills using multi-objective optimization methods [19], Wang et al. enhanced the accuracy and control effectiveness of actuator efficiency by employing online optimization models and data-driven methods [20,21].
However, in actual production processes, significant coupling effects exist between the work roll and intermediate roll, and the differential influence mechanisms of their profiles on the strip profile remain unclear. Roll shift adjustments may induce nonlinear fluctuations in the strip profile, leading to defects such as waves, ridges, and wrinkles, thereby constraining the precise control level of the rolling process.
This study focuses on the UCMW cold rolling mill, emphasizing the critical process parameter of single-taper profiles for both the work roll and intermediate roll. By constructing a three-dimensional dynamic finite element model that considers the coupling effects of roll elastic deformation and metal plastic flow, this research systematically simulates the rolling process under various roll profile configurations. It quantitatively characterizes the variations in stress, crown, edge drop, and transverse thickness difference of the strip under different roll profile configurations, analyzing the differential influence patterns of single-taper work roll and intermediate roll profiles on the strip profile. This provides a theoretical basis and technical support for optimizing roll profile configurations and enhancing product dimensional accuracy.

2. Strip Profile Evaluation

The quality evaluation of strip profiles primarily focuses on edge drop (ED), crown (C), and transverse thickness difference (Δh), which together characterize the overall strip flatness and thickness uniformity [22]. As illustrated in Figure 1, the definitions of these indicators are given as follows:
Edge Drop (ED): The difference between the thickness at 100 mm from the edge and the thickness at 20 mm from the edge.
E D = h 100 h 20
C = h c h 100
Δ h = max ( h e 0 , h e 1 , , h e d ) min ( h e 0 , h e 1 , , h e d )
Here, h_c represents the strip thickness at the center,
h 100 and h 20 denote the thicknesses measured at 100 mm and 20 mm from the strip edge, respectively,
h e 0 h e d are the thickness values sampled at multiple positions across the strip width, perpendicular to the rolling direction.
Edge Drop (ED) indicates the difference between the inner region and the edge thickness, reflecting the degree of edge thinning.
Crown (C) describes the thickness difference between the strip center and quarter-width zone, characterizing the convex or concave profile shape.
Transverse Thickness Difference (Δh) quantifies the maximum thickness deviation across the entire width, measuring the global uniformity of the strip.
The coordinate system shown in Figure 1 defines the sampling direction along the strip width, with the origin at the strip center and positive distance measured toward the edge.
The measurement points for h 20 and h 100 are located 20 mm and 100 mm from the strip edge, respectively.
These three indicators (ED, C, and Δh) are used throughout this study to quantitatively evaluate the strip shape under different roll profile configurations and rolling conditions.

3. Establishment of the Integrated Finite Element Model for Rolls and Strip

3.1. Roll Profile Curve

The single-taper chamfer roll profile optimizes the roll gap edge contact state by designing a specific chamfer structure at the ends of the work roll or intermediate roll, reducing metal flow resistance at the edges and effectively decreasing transverse thickness difference while suppressing edge drop.
The sine-function-based chamfer profile was selected for its C1 continuity (i.e., continuous first-order derivative), which promotes a smooth transition in contact pressure at the junction between the flat and chamfered sections, thereby reducing the risk of local stress concentrations and numerical instability.
The single-taper roll profile consists of a flat roll section and a chamfer section, as depicted in Figure 2. The chamfer starts at the position aligned with the strip edge (0 mm), and negative roll shift occurs when the strip edge enters the chamfer.
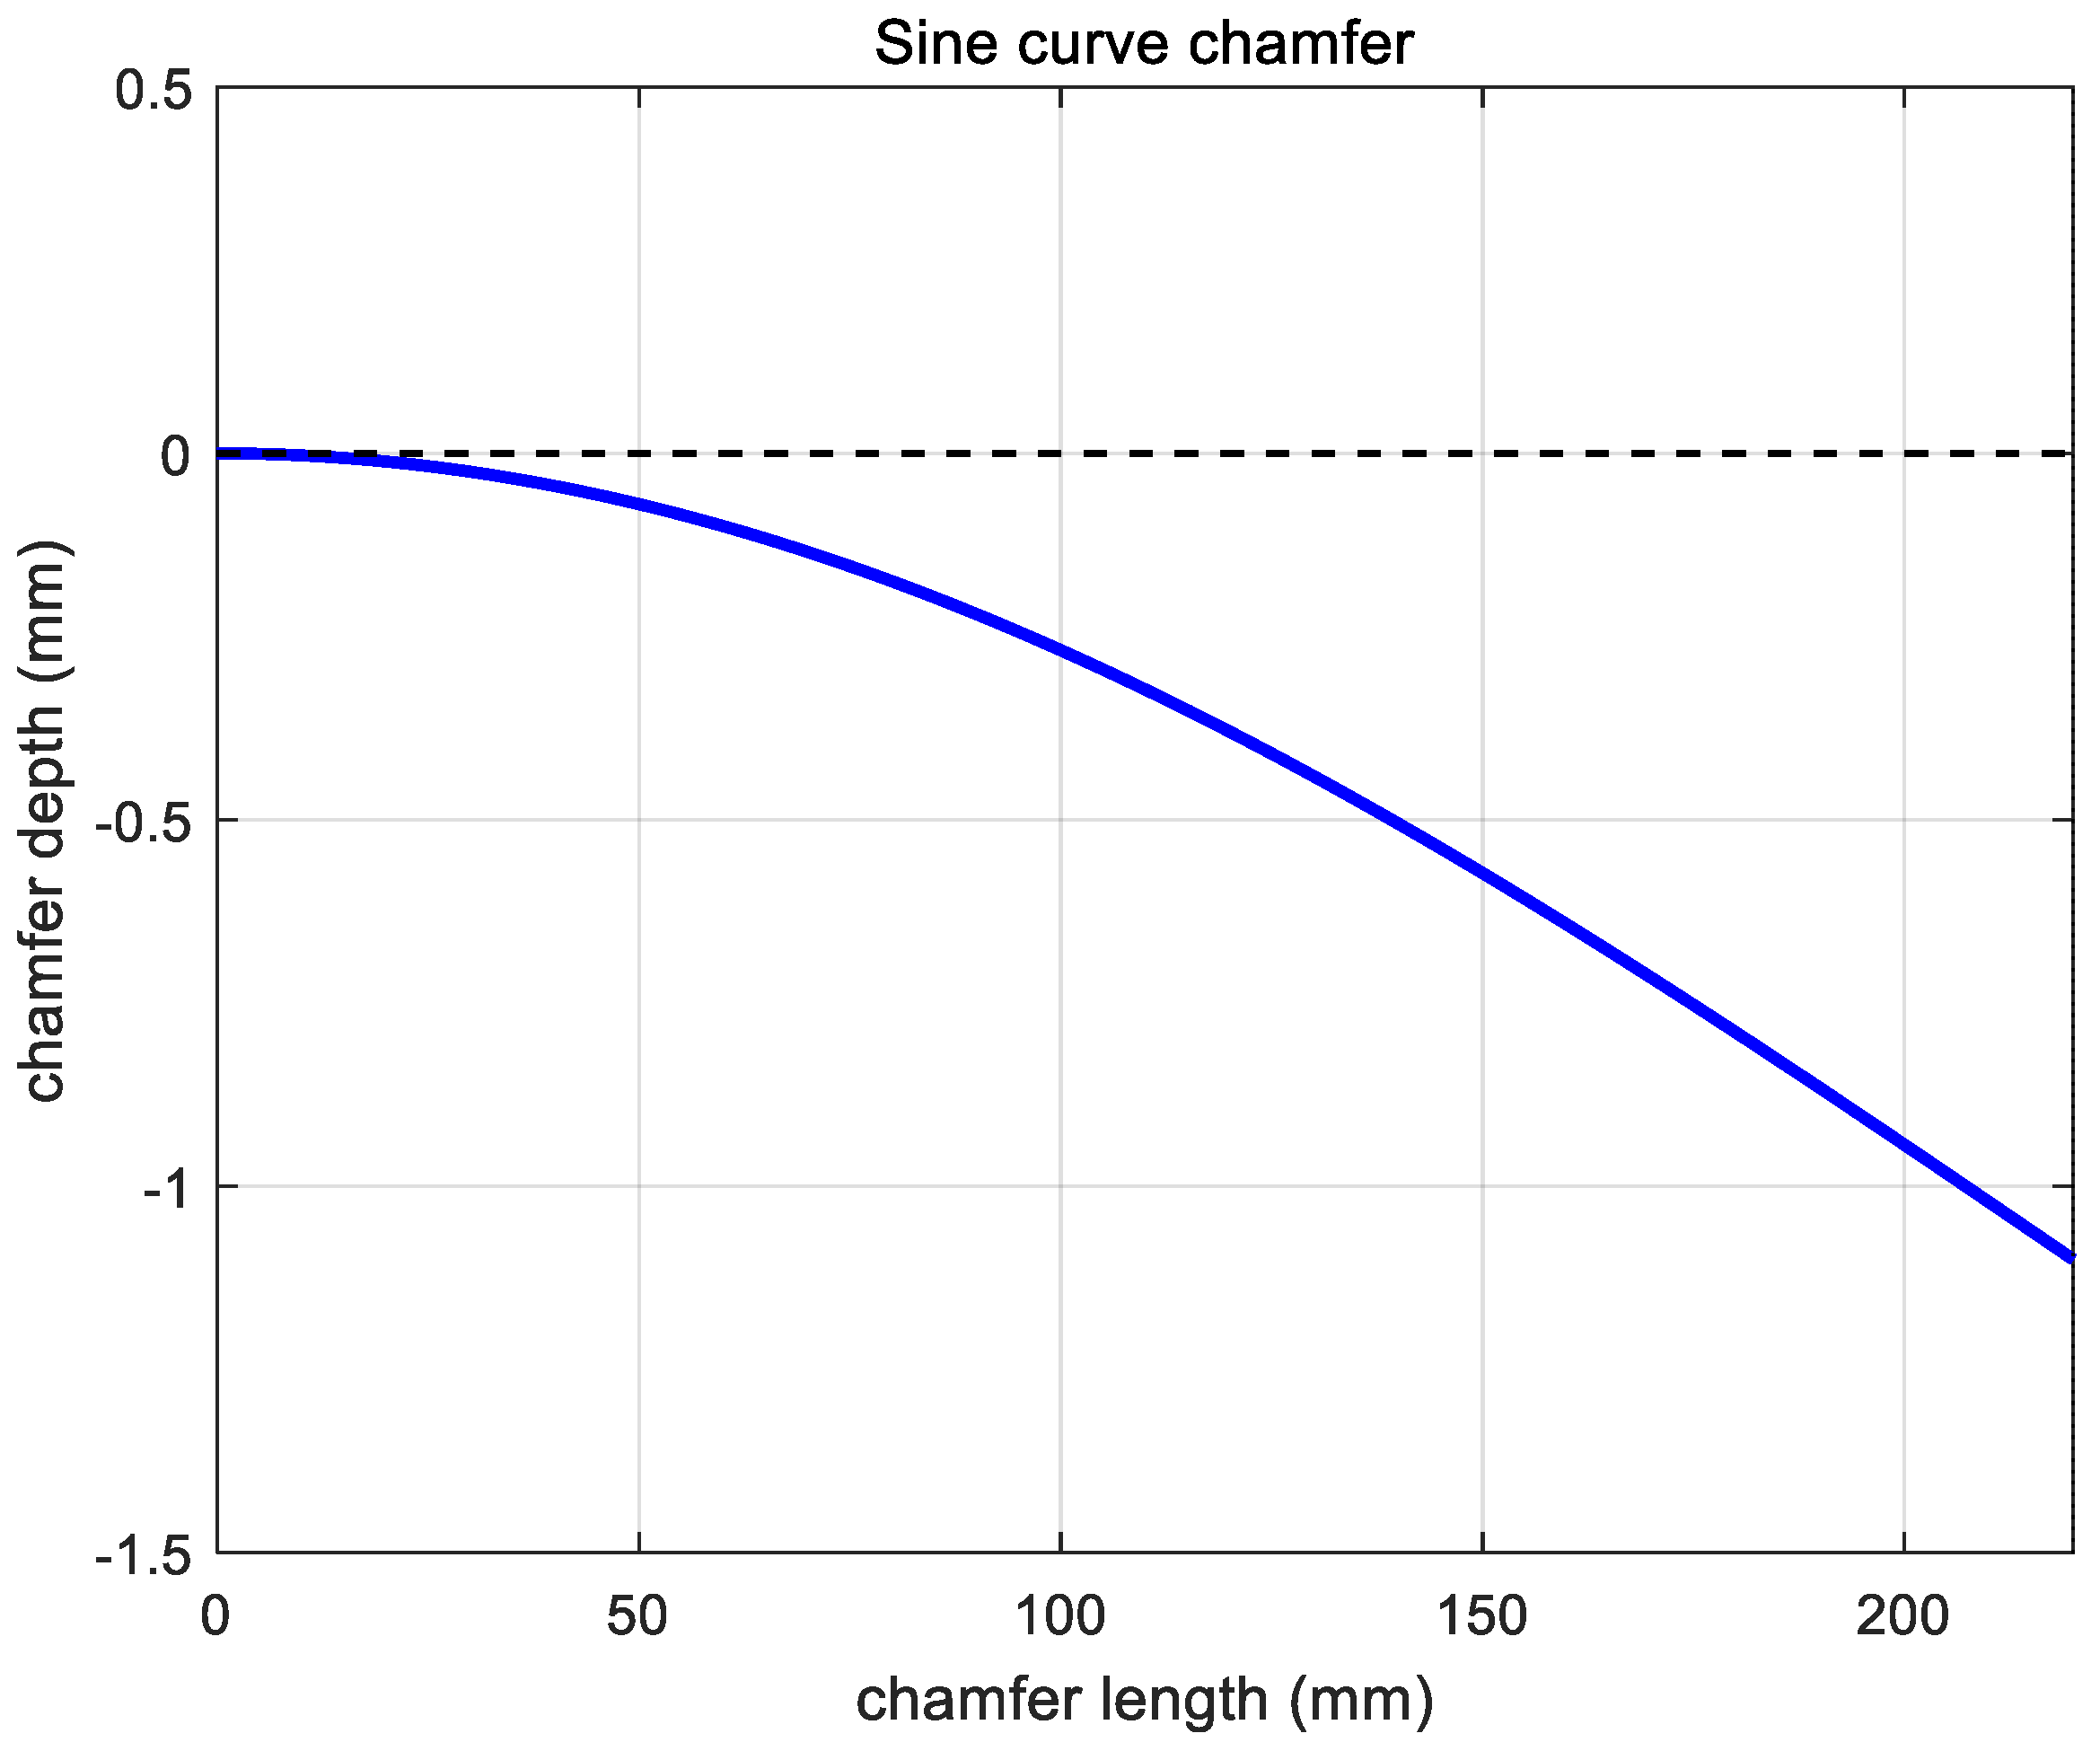
In this study, the chamfer section roll profile is designed as a sine curve with a chamfer length (L) of 220 mm and a chamfer slope (k) of 1/200, as expressed in Equations (4):
y = L k sin ( π 2 × x L π 2 ) + L k
The chamfer curve is illustrated in Figure 3, with a roll end chamfer depth of 1.08 mm.

3.2. Modeling Parameters

The finite element model is grounded in the theory of elastoplasticity. The rolls are modeled as linear elastic isotropic bodies, obeying Hooke’s law. The plastic deformation of the strip is governed by the von Mises yield criterion and an isotropic hardening rule. The contact between components is solved using a penalty method, which enforces mechanical contact constraints, making the simulation a strongly coupled elastoplastic boundary value problem.
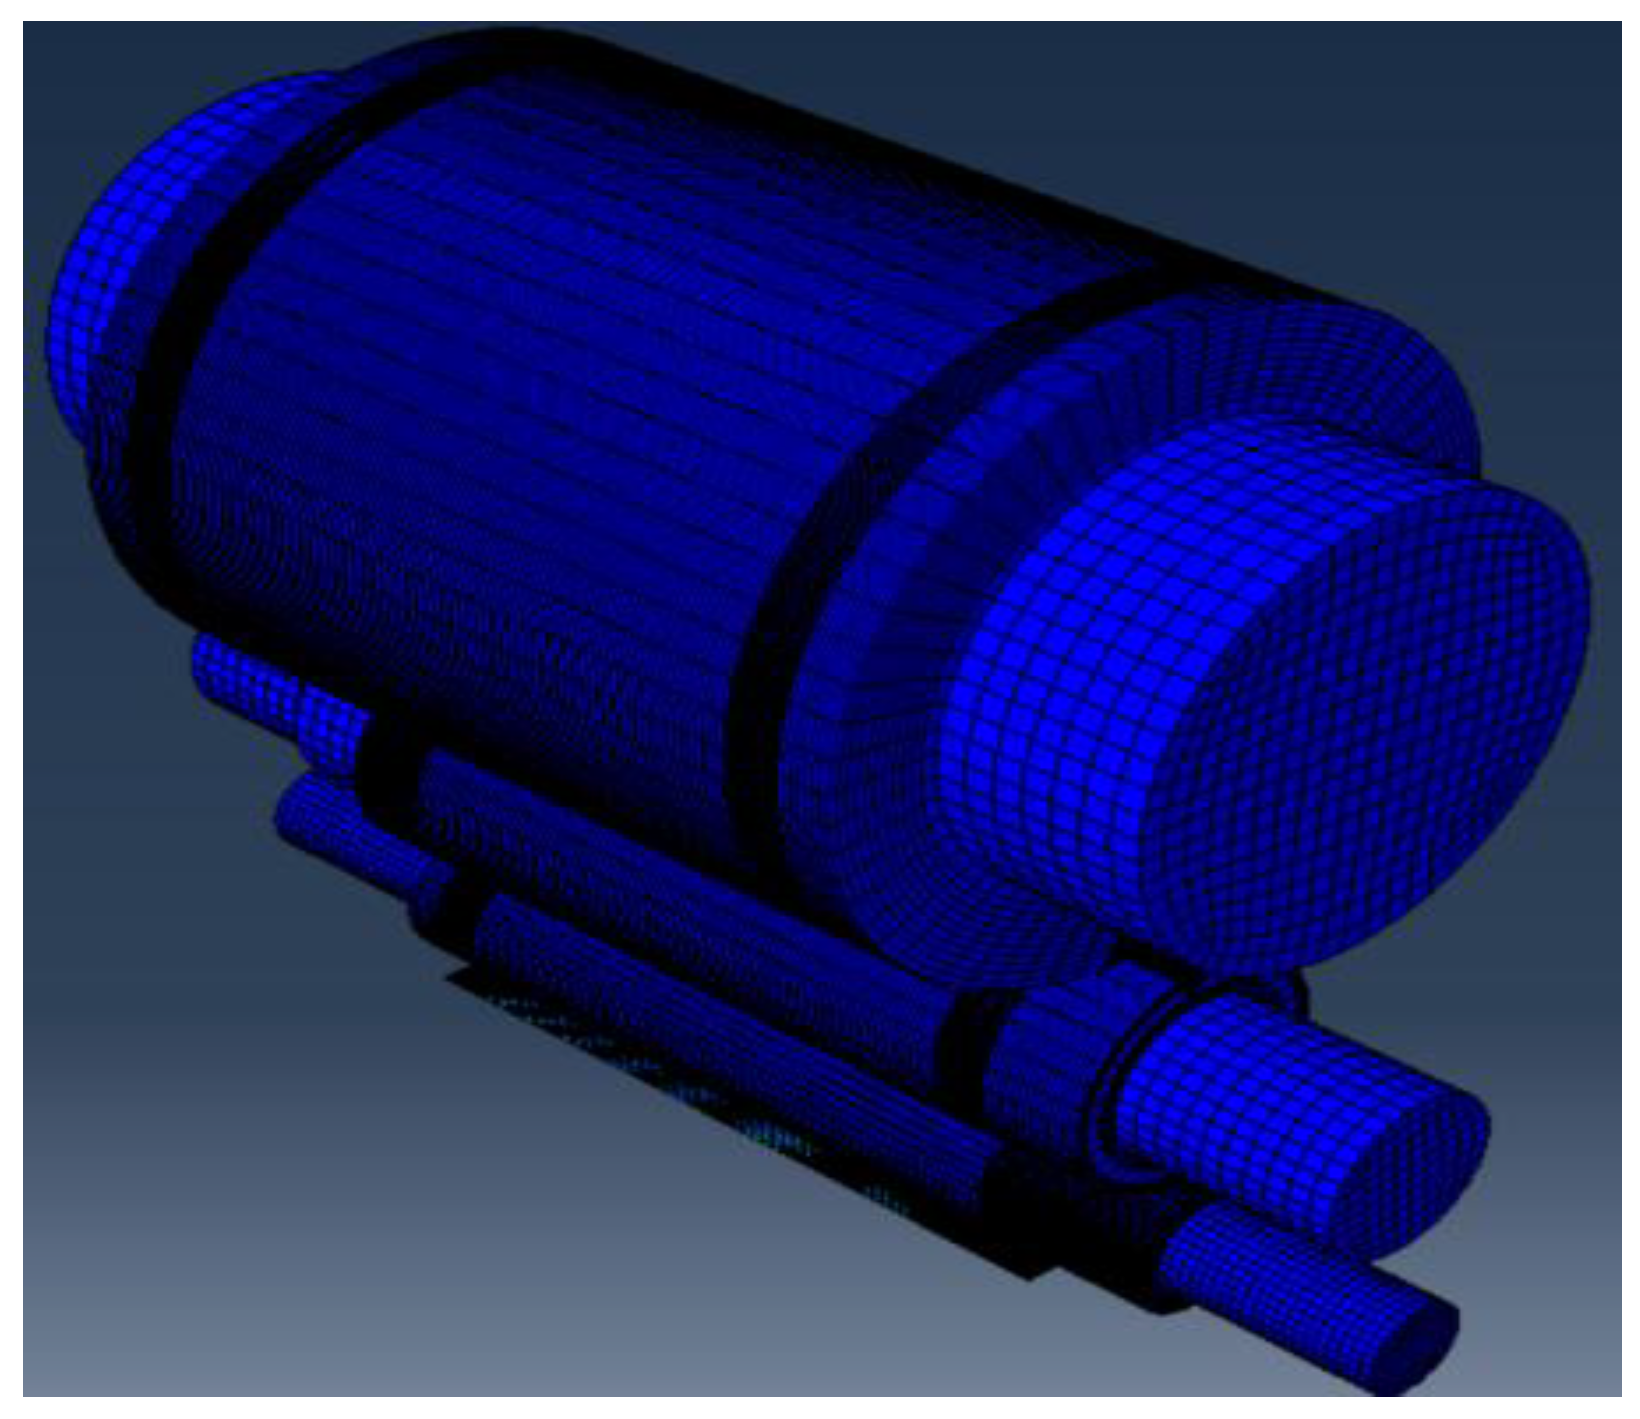
The finite element (FE) model was established in ABAQUS based on the parameters of a UCMW cold rolling mill from an industrial plant (Table 1). To improve computational efficiency, a half-model was adopted with symmetric boundary conditions applied to the strip mid-plane and fully constrained at the outer end face. The model setup is shown in Figure 4, where the geometric dimensions and mesh distribution are illustrated.

3.2.1. Geometric Model and Boundary Conditions

According to the actual engineering drawings, three-dimensional solid models of the strip, work roll, intermediate roll, and backup roll were built using the Part module of ABAQUS 2018. The work roll, intermediate roll, and backup roll have diameters of 300 mm, 500 mm, and 1300 mm, and barrel lengths of 1600 mm, 1500 mm, and 1400 mm, respectively.
The initial dimensions of the strip are 2.6 mm (thickness) × 1320 mm (width) × 400 mm (length).
Roll shifting is realized by axially translating the rolls to vary the contact width between the rolls and the strip. All components are assembled following the roll-shifting parameters listed in Table 1, covering shift ranges of −50 mm to −100 mm for both work and intermediate rolls.

3.2.2. Material Properties

The strip material is non-oriented silicon steel, whose mechanical properties were determined by inverse identification from industrial rolling data. The yield strength is 450 MPa, elastic modulus 210 GPa, Poisson’s ratio 0.3, and strain-hardening exponent n = 0.17.
All rolls are assumed as elastic bodies made of 42CrMo steel (E = 210 GPa, ν = 0.3). These values are consistent with typical data from cold-rolling practice and literature [ref].

3.2.3. Contact and Friction Modeling

Surface-to-surface contact pairs were defined between (i) work roll—intermediate roll, (ii) intermediate roll—backup roll, and (iii) work roll—strip.
For normal behavior, the hard contact algorithm was used to ensure accurate pressure transmission, while tangential behavior was described by a penalty formulation.
A friction coefficient of 0.1 was assigned between the rolls, and 0.05 between the work roll and the strip, based on experimental measurements from industrial rolling tests. The penalty method guarantees stable convergence under large contact pressure variation.

3.2.4. Meshing and Independence Study

The mesh density strongly affects the accuracy of the contact pressure and edge-drop prediction.
Therefore, refined meshes were applied in three regions:
(i) the contact zones between rolls,
(ii) the roll–strip interface, and
(iii) the strip edges where deformation gradients are highest.
The total element number is approximately 7.7 × 10⁵.
To ensure numerical reliability, a mesh-independence study was performed using three mesh densities (coarse, medium, fine). The variations in edge drop (ED) and crown (C) between the medium and fine meshes were less than 5%, confirming that the selected mesh provides a good balance between accuracy and computational cost.

3.2.5. Simulation Procedure

The simulation process includes three sequential steps: (1) reduction, (2) loading, and (3) steady-state rolling. All boundary and contact conditions were activated gradually to ensure stable convergence. The predicted strip profile and contact pressure distributions obtained from the model were later compared with experimental data to validate the model performance (see Section 3.3).

3.3. Finite Element Model Accuracy Verification

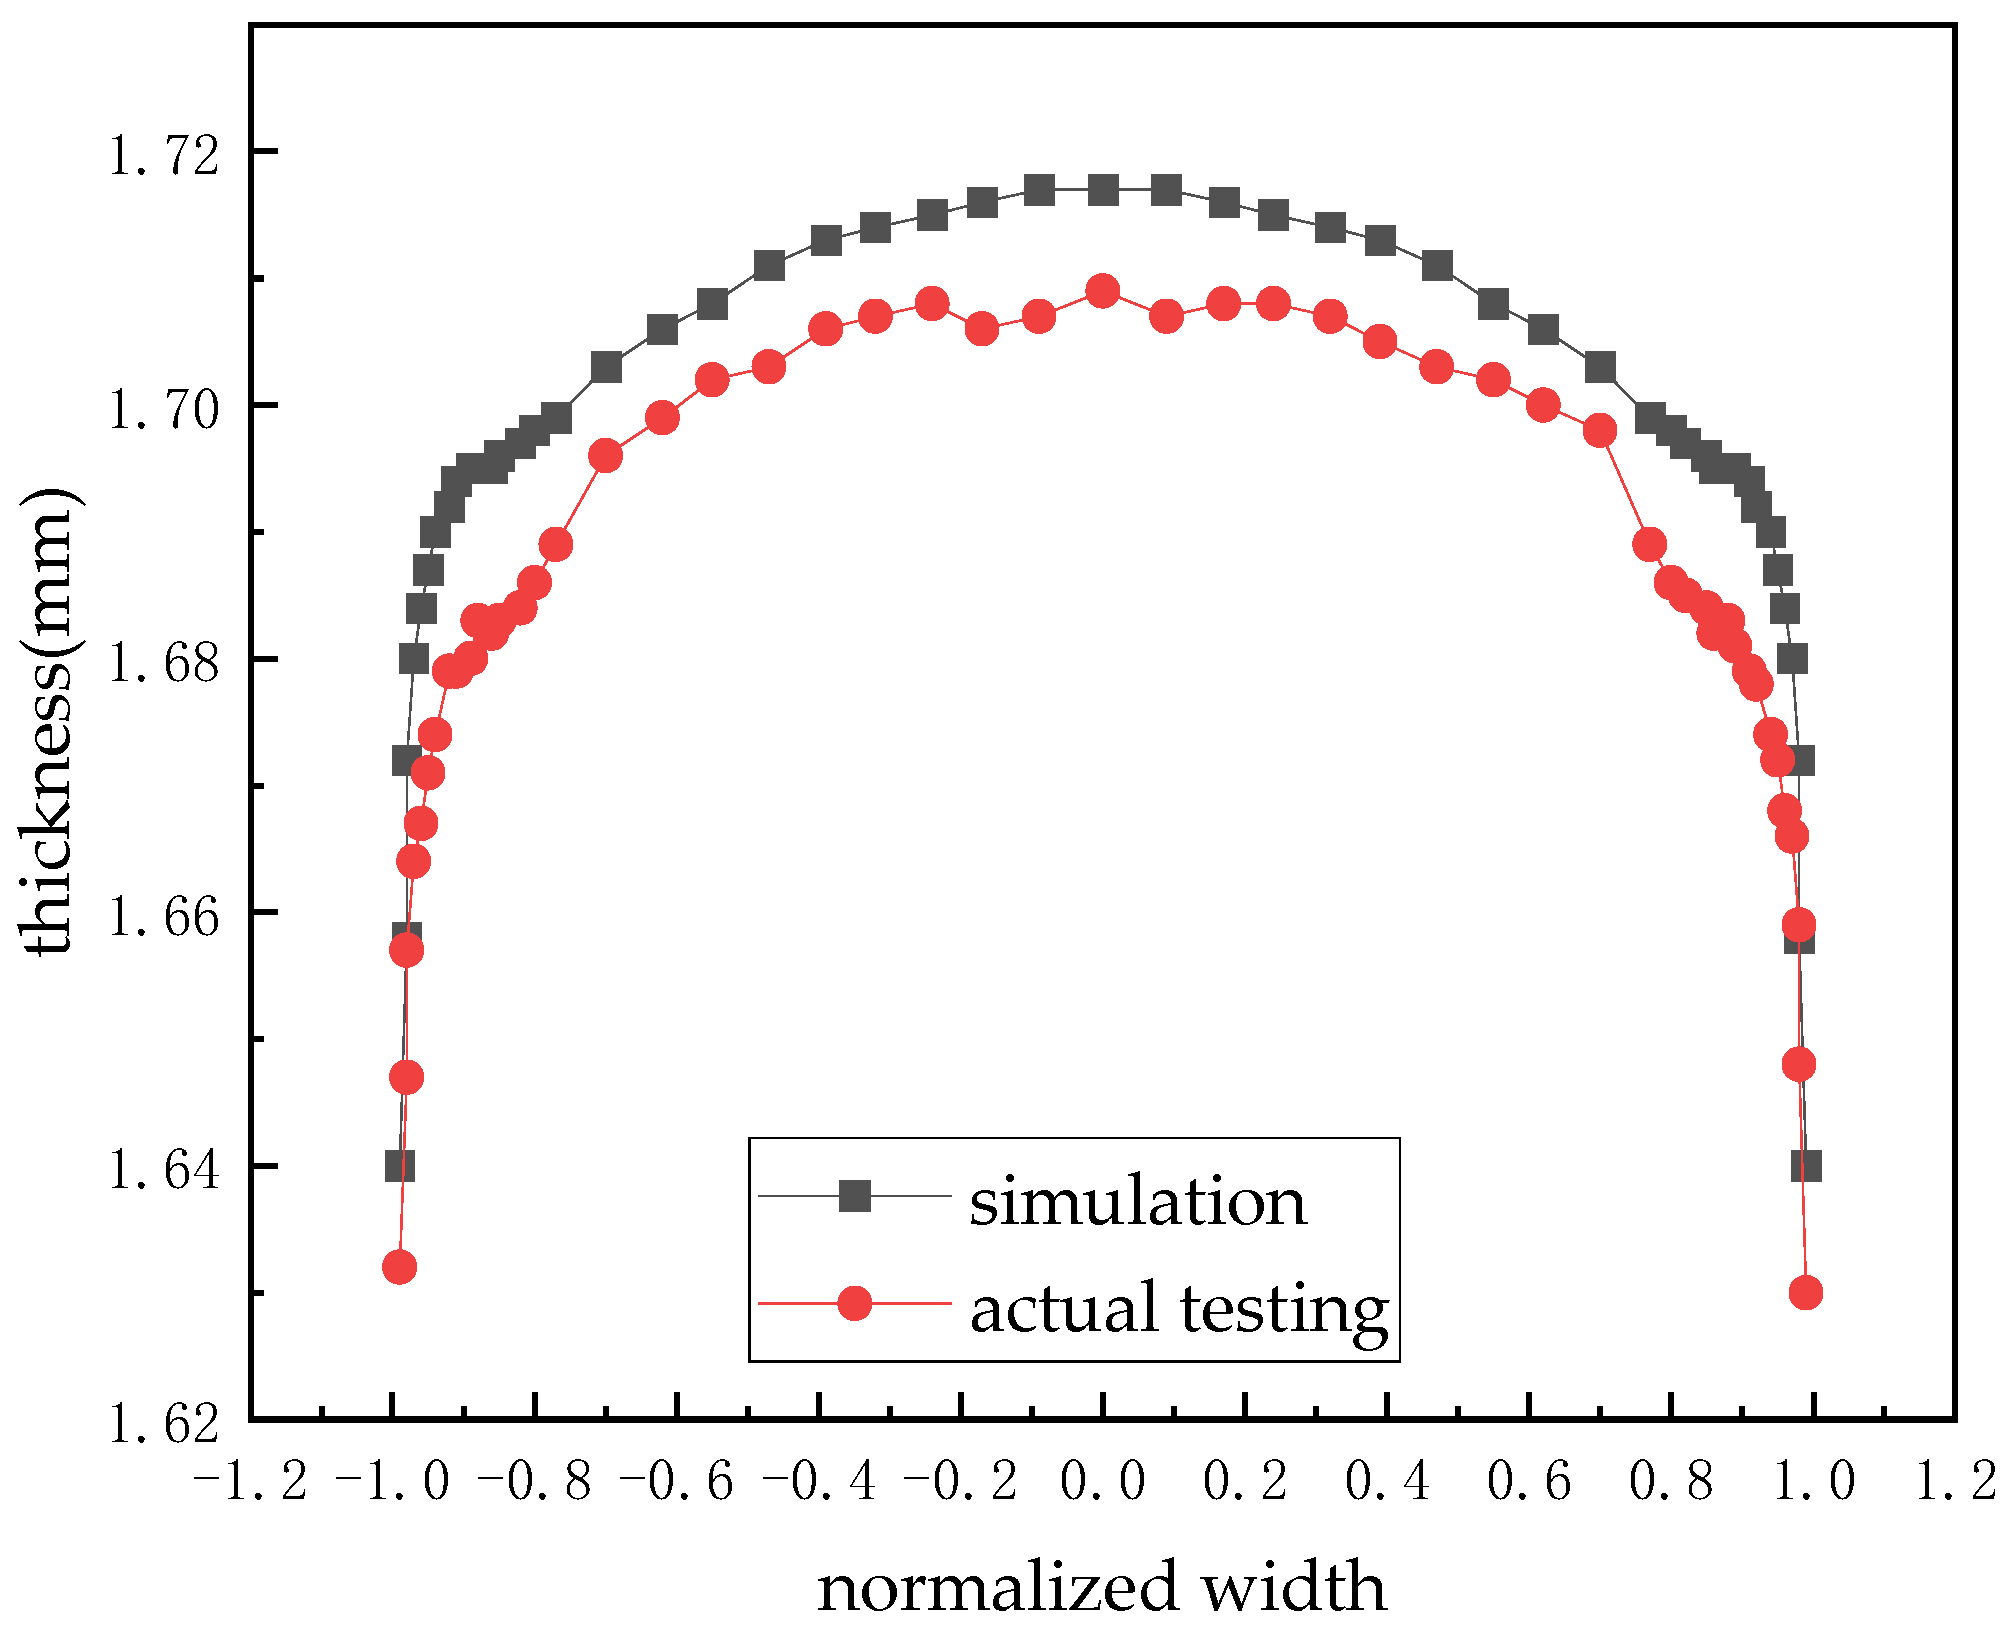
To establish the fundamental accuracy of the finite element model, a critical first step was to compare its predictions against actual industrial production data under baseline conditions. Standard industrial rolling parameters were input into the simulation, and the resulting strip profile was compared with the measured profile obtained from the plant, as shown in Figure 5.
The simulated and experimental profiles exhibit excellent agreement in both overall shape and trend across the entire strip width. The maximum deviation in strip thickness between simulation and measurement is approximately 17.3 μm, which corresponds to less than 1.0% of the nominal strip thickness. This high level of accuracy confirms that the model correctly captures the primary elastoplastic mechanics of the rolling process.
The simulated values are marginally higher than the measured data, a discrepancy that can be primarily attributed to multifactorial coupling effects in the actual rolling process—such as thermal expansion of rolls, variations in lubrication, and dynamic mill stiffness—which are not explicitly included in the current isothermal model. Nevertheless, the overall consistency demonstrates that the proposed FE model reliably reproduces the essential strip-shape characteristics. Therefore, the model is considered sufficiently validated and serves as a credible basis for the subsequent parametric investigation and mechanism analysis presented in the following sections. The model’s performance under a wider range of conditions is further explored in Section 3.4.

3.4. Model Robustness and Generality Analysis

To verify the robustness and generality of the proposed finite element model beyond the single case presented in Section 3.3, two additional rolling cases with different parameters were simulated. Case A involved a narrower strip (1200 mm width), and Case B involved a higher rolling force (17 MN). The simulated strip profiles for these cases were compared with corresponding industrial measurements, as summarized in Table 2. The root-mean-square error (RMSE) for both cases remained below 9 μm, and the crown prediction error was within 5 μm, demonstrating the model’s consistent accuracy under varying conditions.
Furthermore, a sensitivity analysis was conducted by varying key input parameters, namely the strip’s yield strength (±5%) and the work roll-strip friction coefficient (±0.02). The results indicated that while the absolute values of edge drop and crown were sensitive to these changes, the fundamental trends and the identification of critical shift positions (e.g., the optimal work roll shift of −75 mm) remained robust. This confirms that the conclusions drawn from the model regarding the influence patterns of roll profiles are generalizable and not artifacts of a specific parameter set.

4. Analysis of the Influence of Single-Taper Roll Profile

4.1. Influence of Work Roll Profile

When the work roll has a single-taper profile and the intermediate roll has a flat profile (with an R1000 chamfer at one end aligned with the strip edge), the simulation results, as shown in Figure 6, indicate that during the rolling process, when the work roll shift amount ranges from 0 to −75 mm, the stress on the rolled strip significantly decreases as the negative shift amount increases. The strip profile gradually transitions from an initially convex cross-section to an approximately rectangular cross-section. Simultaneously, the crown, edge drop, and transverse thickness difference of the strip exhibit a marked decreasing trend. Specifically, as the shift amount increases from 0 mm to −75 mm, the maximum stress decreases from 1148.8 MPa to 980.6 MPa (a 14.6% reduction); the edge stress decreases from 667.2 MPa to 285.3 MPa (a 57.2% reduction); the edge drop decreases from 40.7 μm to 3.6 μm (a 91.2% reduction); the crown decreases from 60.8 μm to 5.1 μm (a 91.6% reduction); and the transverse thickness difference decreases from 101.5 μm to 8.6 μm (a 91.5% reduction). These data indicate that the strip profile tends toward a rectangular cross-section.
Critically, at the −75 mm shift position, the profile lies entirely within the industrial tolerance band, and the predicted crown value of 5.1 μm shows excellent agreement with the measured plant average of 4.8 μm, confirming the model’s precision at this optimal configuration.
However, when the work roll negative shift amount increases from −75 mm to −95 mm, the maximum stress on the rolled strip increases from 980.6 MPa to 1042.9 MPa (a 6.4% increase); the edge stress continues to decrease from 285.3 MPa to 163.3 MPa (a 42.8% reduction); the strip profile reverses, transitioning from an approximately rectangular cross-section to a concave cross-section, with negative crown and edge thickening phenomena, and the transverse thickness difference increases in the opposite direction, reflecting an excessive regulatory effect of the work roll shift on the profile. The single-taper chamfer work roll profile significantly influences the strip profile.
This behavior highlights the dual-regulation effect of the single-taper work roll: beneficial flattening within 0 to −75 mm, and profile deterioration beyond −90 mm. This phenomenon, consistent with prior FEM-based analyses, underscores the profound and nonlinear influence of the work roll profile on strip shape.
This dual-regulation behavior is consistent with the FEM-based analyses of roll-shift optimization reported by Zhang et al. and Liu et al. [23,24].
The observed turning point at a roll-shift amount of −75 mm represents a critical transition. At this position, the contact pressure distribution along the roll width becomes nearly uniform, forming a rectangular strip profile that corresponds to the optimum flatness window observed in practice. Beyond this shift, the edge contact pressure reverses due to excessive lateral roll movement, producing localized edge thickening and negative crown. This behavior highlights the dual-regulation effect of the single-taper work roll: beneficial flattening within the range 0 to −75 mm, but profile deterioration when the shift exceeds −90 mm.

4.2. Influence of Intermediate Roll Profile

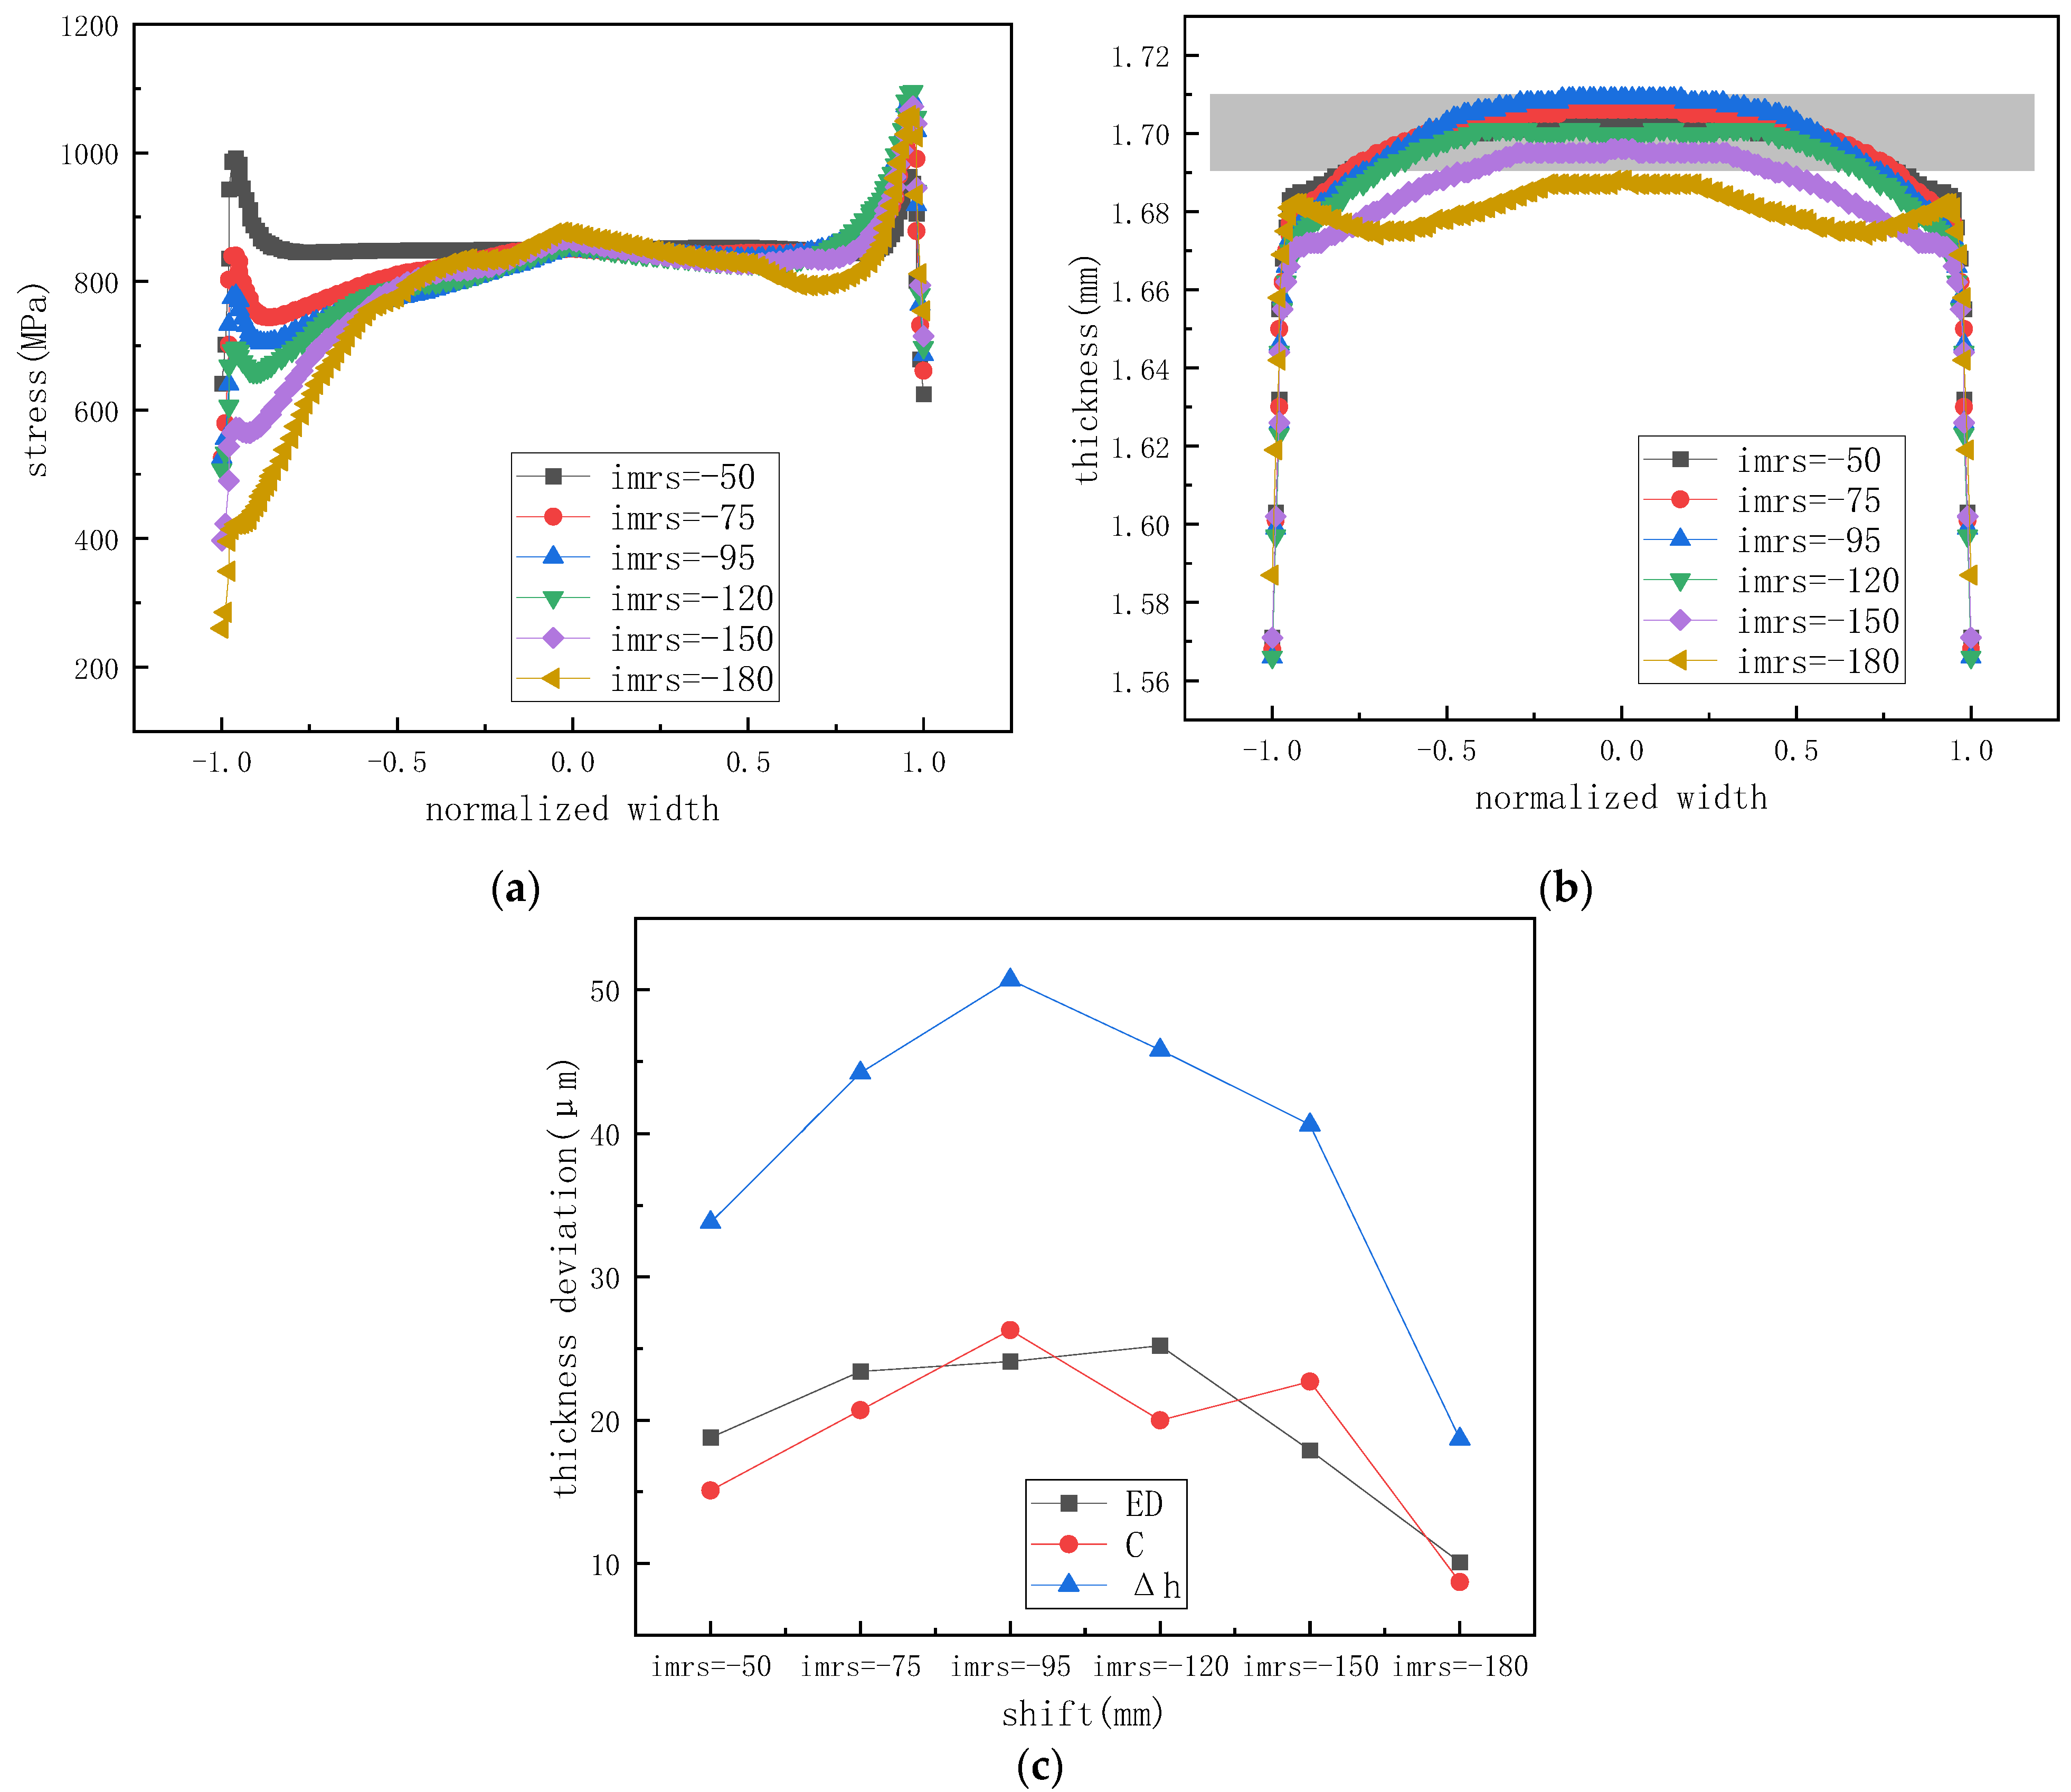
When the work roll has a flat profile and the intermediate roll has a single-taper chamfer profile (comprising a flat roll section and a chamfer section), the simulation results, as shown in Figure 7, indicate that during the rolling process, when the intermediate roll shift amount ranges from −50 mm to −150 mm, the stress in the rolled area on the intermediate roll profile side decreases from the center to the edges of the strip width, resulting in a convex strip profile. When the intermediate roll negative shift amount increases from −150 mm to −180 mm, the strip profile shape reverses, transitioning from a convex cross-section to an M-shaped cross-section, with localized edge thickening at ±0.94 normalized strip width positions. The crown, edge drop, and transverse thickness difference of the strip generally exhibit an initial increase followed by a decrease. Specifically, as the shift amount increases from −50 mm to −180 mm, the edge stress decreases from 640.9 MPa to 260.4 MPa (a 59.4% reduction); the edge drop increases from 18.8 μm to 25.2 μm and then decreases to 10.1 μm (a 59.9% variation); the crown increases from 15.1 μm to 26.3 μm and then decreases to 8.7 μm (a 66.9% variation); and the transverse thickness difference increases from 33.8 μm to 50.7 μm and then decreases to 18.7 μm (a 63.1% variation). When the single-taper intermediate roll profile penetrates more than 150 mm into the strip, its influence on the strip profile becomes particularly significant.
Similar edge-thickening characteristics and shift-dependent shape reversal were also observed in tandem cold-rolling simulations by Wang et al. [25].
When the intermediate roll shift exceeds −150 mm, the chamfer zone penetrates deeply into the loaded area. The contact length between the intermediate and work rolls decreases rapidly, while the bending rigidity on both edges becomes asymmetric. This causes the M-shaped deformation shown in Figure 7b, characterized by edge thickening near the normalized width ±0.9. Such edge deformation suggests that excessive intermediate-roll penetration deteriorates edge-drop control and induces local edge bulging. Therefore, the optimal intermediate roll shift should remain within −50 to −150 mm to maintain uniform flatness without overcorrection.

4.3. Influence of Combined Work Roll and Intermediate Roll Profiles

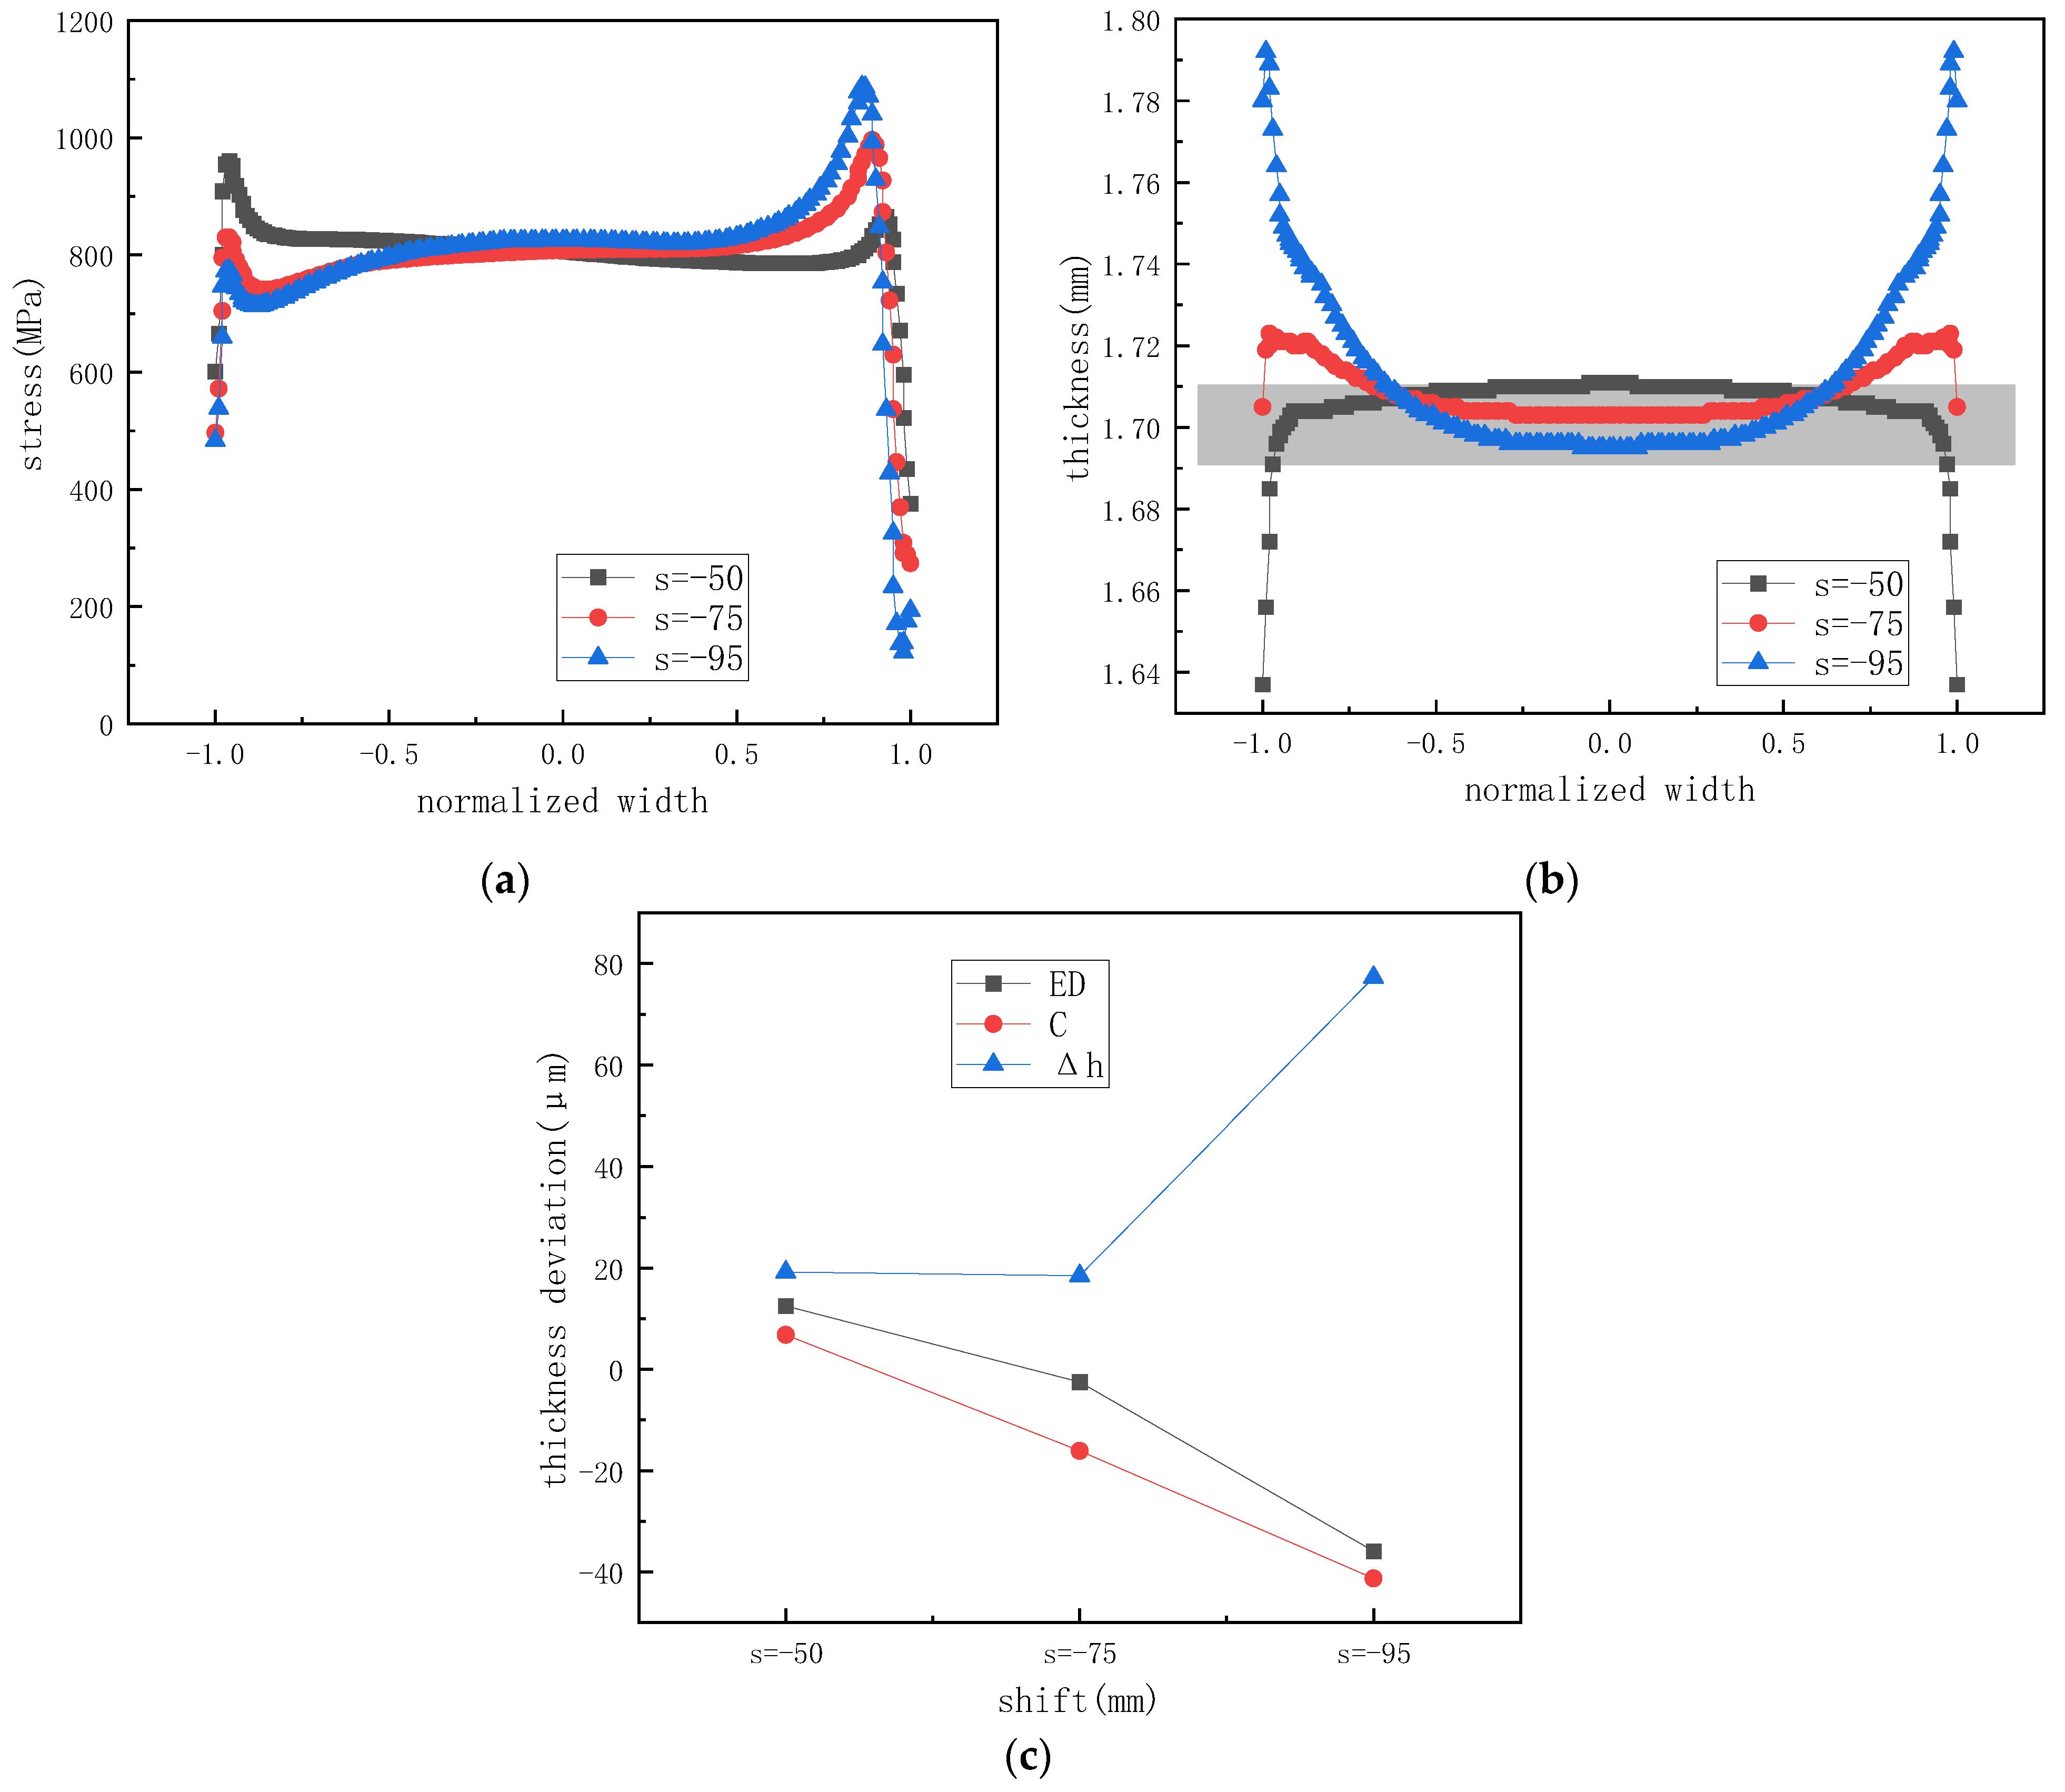
When both the work roll and intermediate roll have single-taper profiles, the simulation results, as shown in Figure 8, indicate that during the rolling process, when the intermediate roll shift amount ranges from −50 mm to −95 mm, the stress on both edges of the strip decreases as the negative shift amount increases. The stress on the work roll profile side decreases from 376.0 MPa to 193.1 MPa (a 48.6% reduction), while the stress on the intermediate roll profile side decreases from 600.5 MPa to 483.6 MPa (a 19.5% reduction). The stress reduction on the work roll profile side is more pronounced. The strip profile transitions from a convex cross-section to a concave cross-section, with the crown changing from positive to negative, resulting in edge thickening and a significant increase in transverse thickness difference. This nonlinear coupling behavior is consistent with recent machine-learning-based flatness prediction and detailed FEM residual-stress analyses reported by Li et al. and Huang et al. [26,27].
When both rolls have single-taper profiles, the superposition of roll bending and chamfer contact effects produces a complex interaction. As the shift increases to −95 mm, the two effects couple destructively, leading to negative crown and edge bulging. The work-roll chamfer mainly controls central flatness, whereas the intermediate-roll taper dominates edge-stress redistribution. As the shift increases to −95 mm, these two effects couple destructively, leading to negative crown and edge bulging. The results indicate that the combined-taper configuration is highly sensitive to shift position and must be carefully optimized to avoid over-correction.

4.4. Comparison of Roll Profile Configurations

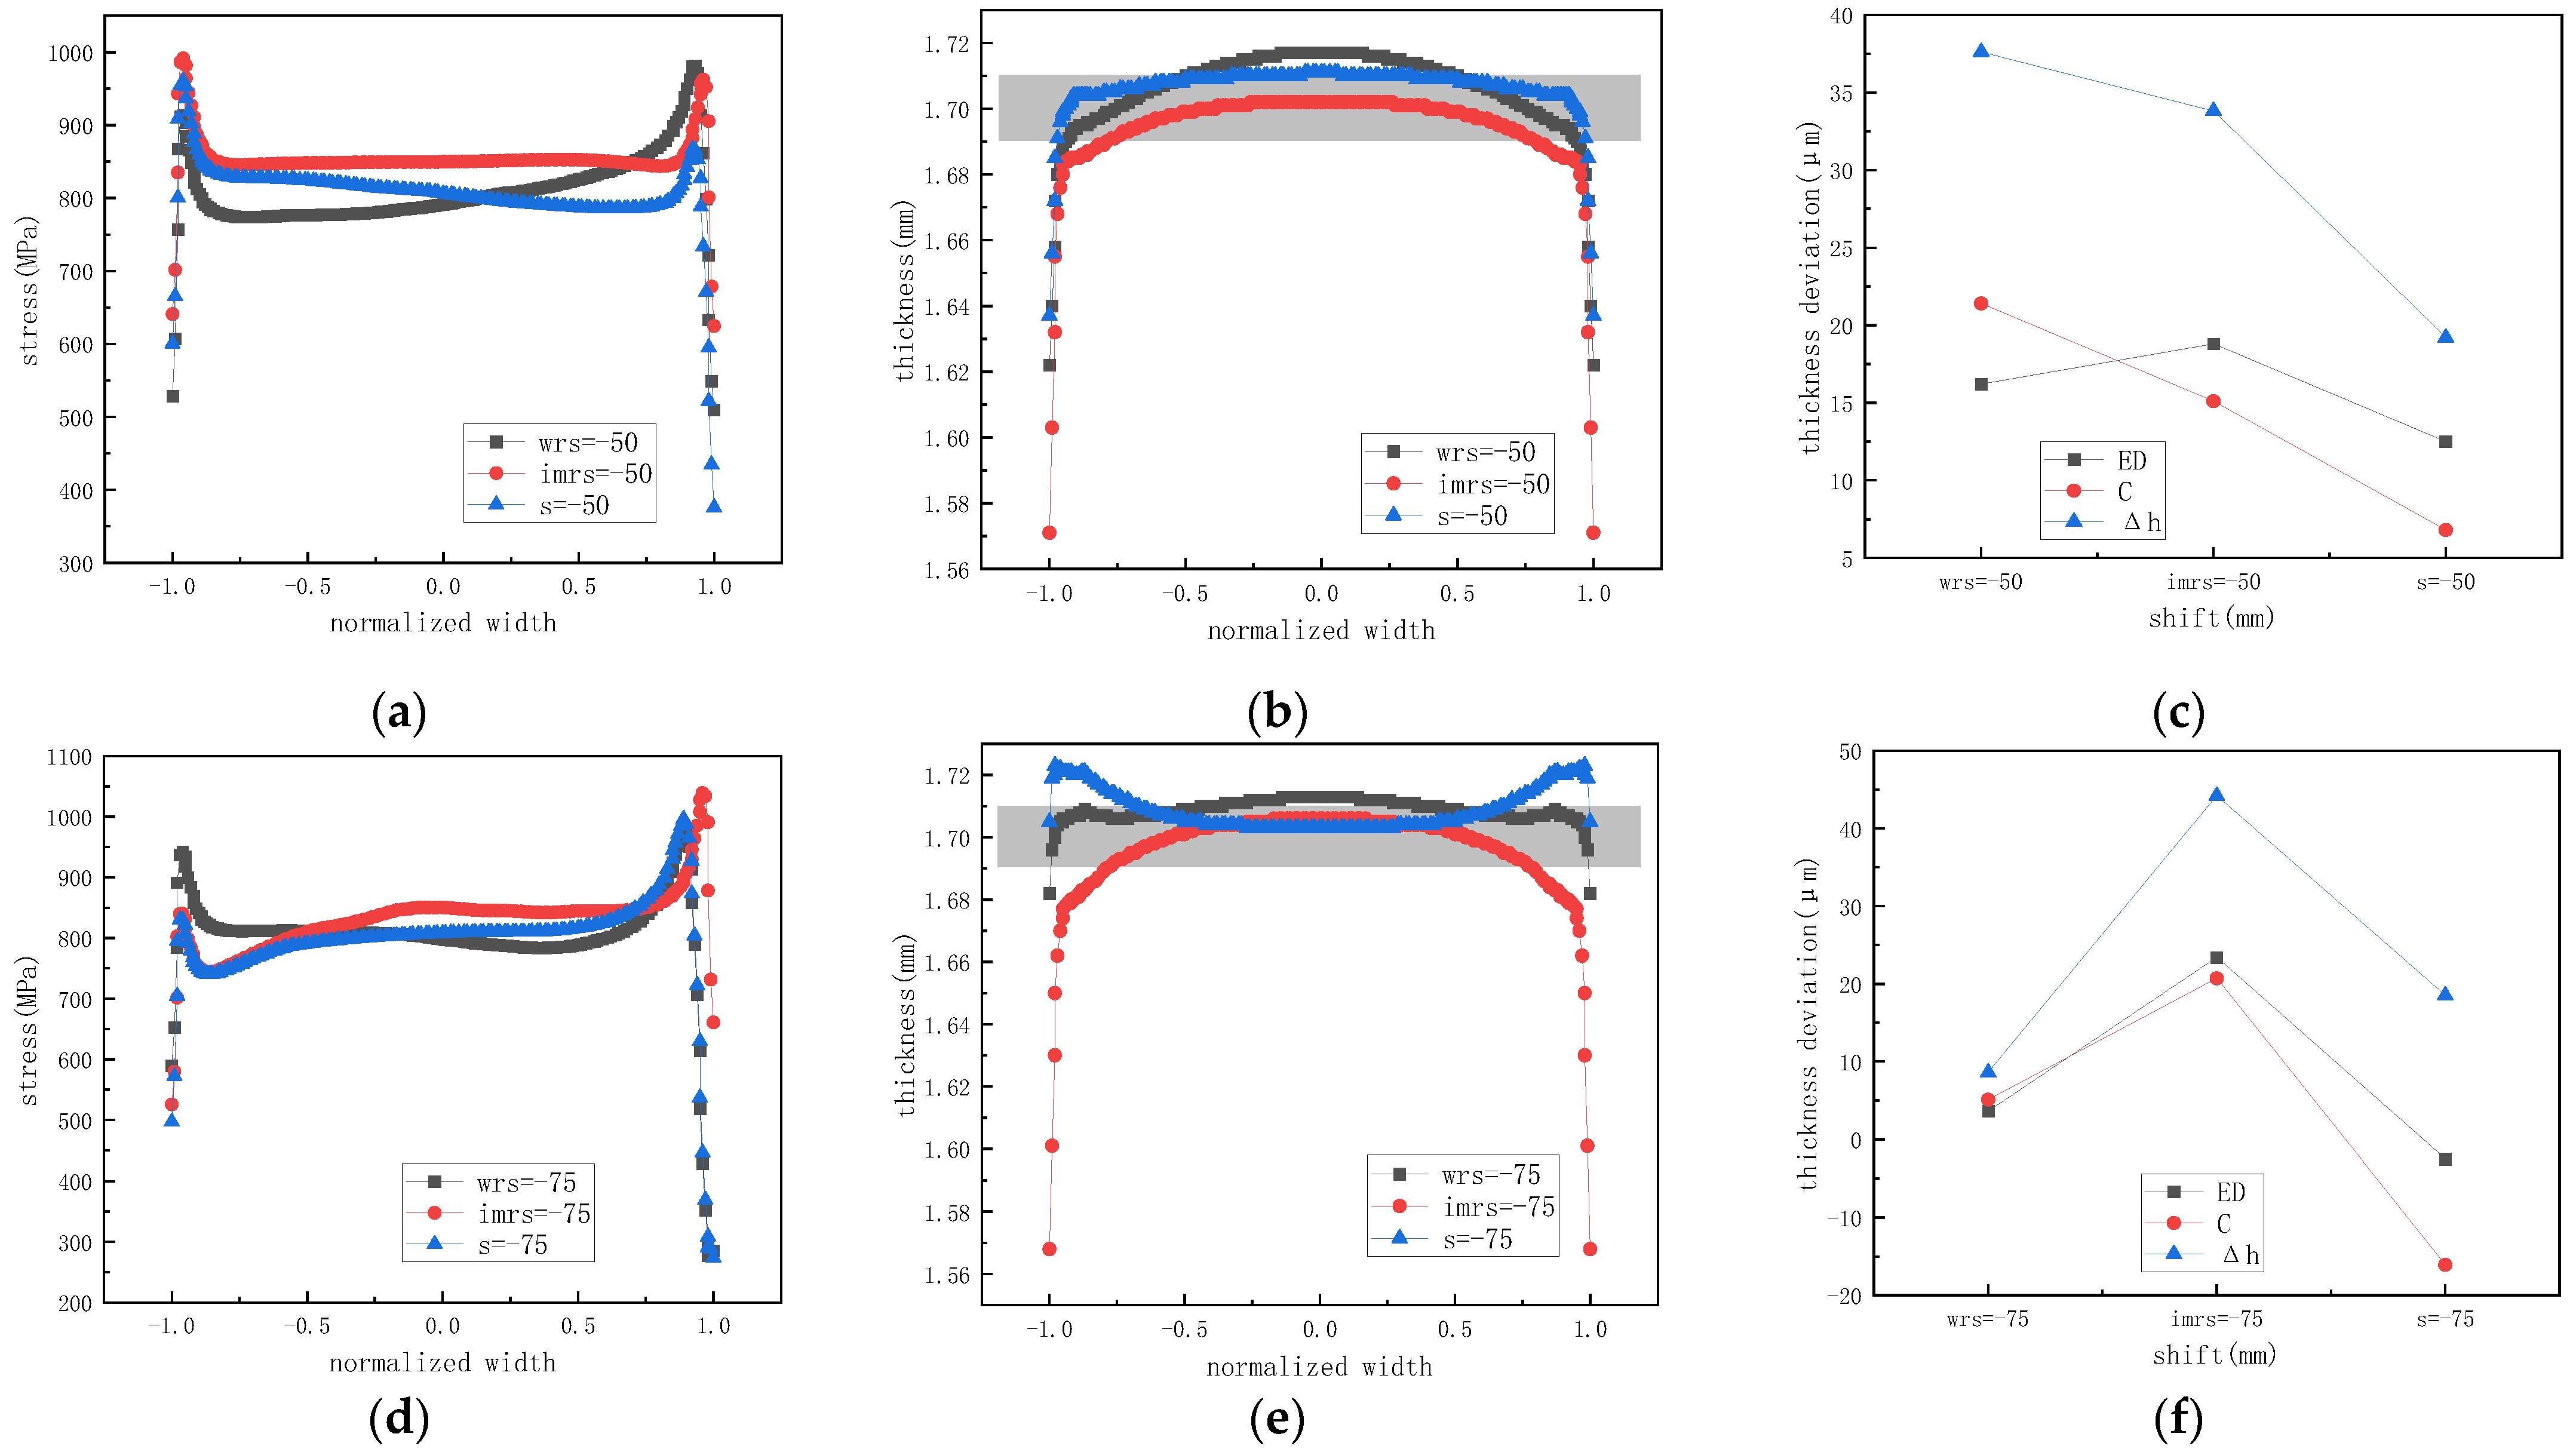
A comparison of the effects of three roll profile configurations—single-taper work roll profile, single-taper intermediate roll profile, and combined work roll and intermediate roll profiles—on stress, strip profile, crown, edge drop, and transverse thickness difference under the same shift amounts is shown in Figure 9.
At a shift of −50 mm, the strip profile with the combined work roll and intermediate roll profiles is closer to rectangular, with the smallest crown, edge drop, and transverse thickness difference. At a shift of −75 mm, the strip profile with the work roll profile is closer to rectangular, with the smallest crown, edge drop, and transverse thickness difference, while the strip profile with the combined profiles is concave, exhibiting negative crown, edge rise, and a large transverse thickness difference. At a shift of −95 mm, except for the strip profile with the single-taper intermediate roll profile, which is convex, the other two configurations result in concave strip profiles with negative crown, edge rise, and large transverse thickness differences. The combined work roll and intermediate roll profiles have a more significant impact on the strip profile than single roll profiles.
These findings are consistent with the real-time industrial monitoring and IoT-enabled prediction results reported by Chen et al. [28].
The combined work roll and intermediate roll profiles exhibit stronger coupling sensitivity than single-taper configurations, emphasizing the need for optimized shift ranges. Overall, the comparison shown in Figure 9 demonstrates that the optimal flatness occurs when the work-roll taper is active within a shift range of −50 to −75 mm, and the intermediate-roll shift remains below −150 mm. Beyond these ranges, profile reversal and edge thickening appear. Therefore, the combined configuration should operate within this window to achieve balanced stress distribution and minimal transverse thickness difference.

5. Conclusions

This study focuses on the UCMW cold rolling mill and establishes an integrated finite element model of the roll–strip system to investigate the differential effects of single-taper work roll and intermediate roll profiles and their combinations on strip shape. The results provide both a theoretical foundation and practical guidance for optimizing roll profile configurations and improving the dimensional accuracy of cold-rolled products.

5.1. Summary of Findings

The single-taper work roll primarily regulates the central region of the strip, while the single-taper intermediate roll governs the edge stress and profile. When applied independently, both profiles exhibit distinct and nonlinear effects with respect to roll shift. For the work roll, within the negative shift range of 0 to −75 mm, the stress and crown decrease markedly, and the strip profile tends toward a rectangular cross-section. When the shift exceeds −90 mm, overcompensation occurs, producing negative crown and edge rise. For the intermediate roll, within −50 to −150 mm, the profile remains convex; beyond −150 mm, excessive penetration of the chamfer zone leads to an M-shaped deformation, indicating that roll asymmetry significantly affects stress distribution and edge drop. Utilizing the combined roll profiles induces a gradual transition in strip shape from convex to concave within the shift range of −50 mm to −95 mm. Comparative analysis indicates that at a shift of −50 mm, the combined roll profiles yield a shape closer to rectangular; at −75 mm, the work roll profile produces superior results; at −95 mm, both the work roll profile and the combined profiles result in concave shapes, with the combined configuration exerting the most pronounced effect.

5.2. Engineering Guidance

The findings provide clear operational windows for industrial practice. When both the work roll and intermediate roll adopt single-taper profiles, their coupling effects become highly sensitive to shift position. The work-roll chamfer enhances central flatness, whereas the intermediate-roll taper redistributes edge stress. Optimal shape control is achieved when the work-roll shift is maintained within −50 to −75 mm and the intermediate-roll shift below −150 mm. Operating beyond these limits results in negative crown and edge thickening. These results provide a direct guide for minimizing transverse thickness deviation and maintaining uniform flatness in production.

5.3. Limitations and Future Work

While the proposed model demonstrates high accuracy and robustness across the validated cases, certain limitations should be acknowledged. The current simulations assume isothermal conditions and a constant friction coefficient, whereas in reality, thermal expansion of rolls and variations in lubrication can influence the roll gap geometry. Furthermore, the model does not account for dynamic effects such as mill stand vibration or gradual roll wear.
Future work will focus on developing a fully coupled thermo-mechanical model to capture rolling temperature effects [29]. Additionally, we plan to integrate the current FEM framework into a digital twin system, enabling real-time profile prediction and adaptive control strategy optimization based on actual mill data. This represents a promising direction for achieving next-generation intelligent rolling processes.

Author Contributions

Conceptualization, H.L.; methodology, Y.L. and X.Y.; software, Y.L. and X.Y.; validation, Y.L. and X.Y.; formal analysis, X.Y.; data curation, Y.L.; writing—original draft preparation, Y.L.; writing—review and editing, H.L. and H.Z.; supervision, H.L. and H.Z.; project administration, H.L.; funding acquisition, H.Z. All authors have read and agreed to the published version of the manuscript.

Funding

This research received no external funding.

Data Availability Statement

The data presented in this study are available on request from the corresponding author. The data are not publicly available due to privacy or ethical restrictions.

Acknowledgments

We would like to express our sincere gratitude to Zhiyuan Hu, Houjun Xu, Lei Liu, and Guomin Han for their valuable contributions to data curation during the course of this research.

Conflicts of Interest

Authors Yujin Liu, Xuechang You and Hairui Zhao were employed by the company Shougang Zhixin Electromagnetic Materials (Qian’an) Co., Ltd. The remaining authors declare that the research was conducted in the absence of any commercial or financial relationships that could be construed as a potential conflict of interest.

References

  1. Wei, Z.; Wang, G.Q.; Sun, J.; Peng, W.; Zhang, D.H. Development of Cold-Rolling Edge-Drop Control Technology for Electrical Steel: A Review. Steel Res. Int. 2023, 94, 2200919. [Google Scholar] [CrossRef]
  2. Li, H.B.; Zhao, Z.W.; Dong, D.W.; Han, G.M.; Zhang, J.; Liu, H.C.; You, X.C. Edge-Drop Control Behavior for Silicon Strip Cold Rolling with a Sendzimir Mill. Metals 2018, 8, 783. [Google Scholar] [CrossRef]
  3. Wang, X.C.; Yang, Q.; Sun, Y.Z. Rectangular Section Control Technology for Silicon Steel Rolling. J. Iron Steel Res. Int. 2015, 22, 185–191. [Google Scholar] [CrossRef]
  4. He, H.N.; Dai, Z.H.; Wang, X.C.; Yang, Q.; Shao, J.; Li, J.D.; Zhang, Z.H. Whole Process Prediction Model of Silicon Steel Strip on Transverse Thickness Difference Based on Takagi-Sugeno Fuzzy Network. J. Iron Steel Res. Int. 2023, 30, 2448–2458. [Google Scholar] [CrossRef]
  5. Cao, J.G.; Chai, X.T.; Li, Y.L.; Kong, N.; Jia, S.H.; Zeng, W. Integrated Design of Roll Contours for Strip Edge Drop and Crown Control in Tandem Cold Rolling Mills. J. Mater. Process. Technol. 2018, 252, 432–439. [Google Scholar] [CrossRef]
  6. Ginzburg, V.B. Steel-Rolling Technology: Theory and Practice, 1st ed.; CRC Press: Boca Raton, FL, USA, 1989. [Google Scholar]
  7. Karagiozis, A.; Lenard, J. Temperature distribution in a slab during hot rolling. ASME J. Eng. Mater. Technol. 1988, 110, 17–21. [Google Scholar] [CrossRef]
  8. He, H.N.; Shao, J.; Wang, X.C.; Yang, Q.; Feng, X.W. Silicon Steel Strip Profile Control Technology for Six-High Cold Rolling Mill with Small Work Roll Radius. Metals 2020, 10, 401. [Google Scholar] [CrossRef]
  9. He, H.N.; Shao, J.; Wang, X.C.; Yang, Q.; Liu, Y.; Xu, D.; Sun, Y.Z. Research and Application of Approximate Rectangular Section Control Technology in Hot Strip Mills. J. Iron Steel Res. Int. 2021, 28, 279–290. [Google Scholar] [CrossRef]
  10. Tao, H.; Li, H.B.; Shao, J.; Zhang, J.; Liu, Y.J.; You, X.C. Research on Shape Control Characteristics of Non-Oriented Silicon Steel for UCMW Cold Rolling Mill. Metals 2020, 10, 1066. [Google Scholar] [CrossRef]
  11. Wang, Q.L.; Sun, J.; Liu, Y.M.; Wang, P.F.; Zhang, D.H. Numerical and Experimental Analysis of Strip Cross-Directional Control and Flatness Prediction for UCM Cold Rolling Mill. Int. J. Adv. Manuf. Technol. 2018, 94, 1371–1389. [Google Scholar] [CrossRef]
  12. Wang, Q.L.; Sun, J.; Liu, Y.M.; Wang, P.F.; Zhang, D.H. Analysis of Symmetrical Flatness Actuator Efficiencies for UCM Cold Rolling Mill by 3D Elastic-Plastic FEM. Int. J. Adv. Manuf. Technol. 2017, 92, 1371–1389. [Google Scholar] [CrossRef]
  13. Wang, Q.L.; Sun, J.; Liu, Y.M.; Wang, P.F.; Zhang, D.H. Optimization of Flatness Actuator Efficiency in Cold Rolling Process Based on Finite Element Simulation and Process Data Processing. Steel Res. Int. 2022, 93, 2100314. [Google Scholar] [CrossRef]
  14. Li, H.B.; Zhao, Z.W.; Zhang, J.; Kong, N.; Bao, R.R.; Jia, S.H.; He, F. Analysis of Flatness Control Capability Based on the Effect Function and Roll Contour Optimization for 6-h CVC Cold Rolling Mill. Int. J. Adv. Manuf. Technol. 2019, 100, 2387–2399. [Google Scholar] [CrossRef]
  15. Han, G.M.; Li, H.B.; Wang, G.; Liu, Y.J.; Zhang, J.; Hu, Z.Y.; You, X.C.; Xie, Y. Prediction and Control of Profile for Silicon Steel Strip in the Whole Tandem Cold Rolling Based on PSO-BP Algorithm. J. Manuf. Process. 2024, 120, 250–259. [Google Scholar] [CrossRef]
  16. Song, C.N.; Cao, J.G.; Wang, L.L.; Xiao, J.; Zhao, Q.F. The Prediction of Transverse Thickness Difference for 6-High Tandem Cold Rolling Mills Based on GA-PSO-SVR. Steel Res. Int. 2022, 93, 2200302. [Google Scholar] [CrossRef]
  17. Song, C.N.; Cao, J.G.; Li, Y.L.; Kong, N.; Jia, S.H.; Zeng, W. Control Strategy of Multi-Stand Work Roll Bending and Shifting on the Crown for UVC Hot Rolling Mill Based on MOGPR Approach. J. Manuf. Process. 2023, 85, 832–843. [Google Scholar] [CrossRef]
  18. Song, C.N.; Cao, J.G.; Wang, L.L.; Xiao, J.; Zhao, Q.F. Transverse Thickness Profile Control of Electrical Steel in 6-High Cold Rolling Mills Based on the GA-PSO Hybrid Algorithm. Int. J. Adv. Manuf. Technol. 2022, 121, 295–308. [Google Scholar] [CrossRef]
  19. Wang, Z.; Jin, X.; Li, C.S.; Wang, Y.; Li, X.G.; Guo, T.; Xiang, Y.G. Multi-Objective Optimization of Intermediate Roll Profile for a 6-High Cold Rolling Mill. Metals 2020, 10, 287. [Google Scholar] [CrossRef]
  20. Wang, Q.L.; Sun, J.; Peng, W.; Zhang, D.H. Edge Drop Control Characteristics of the Taper-Work Roll Contour for Six-High Cold Mill. Steel Res. Int. 2023, 94, 2300077. [Google Scholar]
  21. Chen, Y.F.; Peng, L.G.; Feng, P.J.; Zhou, Y.L.; Li, C.S. Optimization of Multi-Segment Work Roll Profile for 1340mm HC Tandem Cold-Rolling Mills Based on DBSCAN and NSGA-II Algorithms. Steel Res. Int. 2023, 94, 2300077. [Google Scholar] [CrossRef]
  22. Wang, X.C.; Yang, Q.; He, H.N.; Sun, Y.Z.; Xu, D.; Liu, Y. Effect of Work Roll Shifting Control on Edge Drop for 6-Hi Tandem Cold Mills Based on Finite Element Method Model. Int. J. Adv. Manuf. Technol. 2020, 107, 2497–2511. [Google Scholar] [CrossRef]
  23. Zhang, H.; Li, Z.; Chen, S.; Wang, X. Finite Element Analysis of Strip Shape Regulation Ability of Work Roll Shifting. J. Manuf. Process. 2023, 104, 512–523. [Google Scholar]
  24. Liu, X.; Zhao, T.; Peng, Y.; Zhang, D. Roll Profile and Roll Shifting Strategy for Silicon Steel Edge Drop. J. Manuf. Process. 2024, 107, 586–598. [Google Scholar]
  25. Wang, R.; Xu, J.; Tang, C.; Zhou, Y. Prediction and Control of Profile for Silicon Steel Strip in Whole Tandem Cold Rolling. J. Manuf. Process. 2024, 106, 409–421. [Google Scholar]
  26. Li, C.; Sun, Y.; Feng, J.; Yang, Q. A Novel Paradigm of Flatness Prediction and Optimization for Strip Using Machine Learning-Based Models. J. Mater. Process. Technol. 2023, 321, 118016. [Google Scholar]
  27. Huang, S.; Wu, Y.; Li, M.; Zhou, F. Careful Finite Element Simulations of Cold Rolling with Accurate Through-Thickness Resolution and Prediction of Residual Stress. Steel Res. Int. 2024, 95, 2301004. [Google Scholar]
  28. Chen, L.; Gao, Y.; Liu, R.; Xu, Q. Industrial IoT-Enabled Real-Time Prediction of Strip Cross-Section Shape for Hot-Rolling Steel. Int. J. Adv. Manuf. Technol. 2023, 128, 4721–4735. [Google Scholar]
  29. Zhao, W.; Han, B.; Zhang, L.; Chen, J. Modeling and Simulation of Shape Control Based on Digital Twin Technology in Hot Strip Rolling. Sensors 2024, 24, 614. [Google Scholar] [CrossRef]
Figure 1. Schematic Diagram of Strip Profile.
Metals 15 01226 g001
Figure 2. Layout Diagram of Rolls and Strip.
Metals 15 01226 g002
Figure 3. Chamfer Curve.
Metals 15 01226 g003
Figure 4. Finite element model of the UCMW cold rolling mill (half model) with refined meshing near the contact and strip-edge regions.
Metals 15 01226 g004
Figure 5. Comparison between simulated and measured strip profiles under industrial rolling conditions.
Metals 15 01226 g005
Figure 6. Effect of Single-Taper Chamfer Work Roll Profile on Strip Profile. (a) Effect of Work Roll Shifting on Stress Distribution. (b) Effect of Work Roll Shifting on Thickness Profile. (c) Effect of Work Roll Shifting on Strip Profile Metrics. The gray band represents the industrial flatness tolerance range of ±10 μm.
Metals 15 01226 g006
Figure 7. Effect of Single-Taper Intermediate Roll Profile. (a) Effect of Intermediate Roll Shifting on Stress Distribution. (b) Effect of Intermediate Roll Shifting on Thickness Profile. (c) Effect of Intermediate Roll Shifting on Strip Profile Metrics. The gray band represents the industrial flatness tolerance range of ±10 μm.
Metals 15 01226 g007
Figure 8. Combined Effect of Work Roll and Intermediate Roll Single-Taper Profiles. (a) Effect on Stress Distribution. (b) Effect on Thickness Profile. (c) Effect on Strip Profile Metrics. The gray band represents the industrial flatness tolerance range of ±10 μm.
Metals 15 01226 g008
Figure 9. Comparison of stress distribution (a,d,h), thickness profile (b,e,i), and strip profile metrics (c,f,j) for work roll, intermediate roll, and combined profiles at shifting positions of −50 mm (ac), −75 mm (df), and −95 mm (hj). The gray band represents the industrial flatness tolerance range of ±10 μm.
Metals 15 01226 g009aMetals 15 01226 g009b
Table 1. Modeling parameters of the UCMW cold rolling mill used in the finite element simulation.
ParameterValue
Work Roll Body × Length (mm) ϕ   300 × 1600
Work Roll Diameter × Length (mm) ϕ   200 × 400
Intermediate Roll Body × Length (mm) ϕ   500 × 1500
Intermediate Roll Diameter × Length (mm) ϕ   340 × 460
Backup Roll Body × Length (mm) ϕ   1300 × 1400
Backup Roll Diameter × Length (mm) ϕ   900 × 350
Strip Thickness × Width × Length (mm) 2.6 × 1320 × 400
Strip Yield Strength (MPa)520
Rolling Force (kN)15,500
Front Tension (MPa)180
Rear Tension (MPa)60
Work Roll Bend Force (kN)50
Intermediate Roll Bend Force (kN)200
Work Roll Shift Range (mm)−50~−100
Intermediate Roll Shift Range (mm)−50~−100
Roll Friction Coefficient0.1
Work Roll-Strip Friction Coefficient0.05
Table 2. Additional model validation under different rolling conditions.
CaseStrip Width (mm)Rolling Force (kN)RMSE (μm)Crown Error (μm)
A120015,5008.2+3.8
B132017,0007.1−3.5
Disclaimer/Publisher’s Note: The statements, opinions and data contained in all publications are solely those of the individual author(s) and contributor(s) and not of MDPI and/or the editor(s). MDPI and/or the editor(s) disclaim responsibility for any injury to people or property resulting from any ideas, methods, instructions or products referred to in the content.