Article

Optimizing the Leaching Parameters of Asbestos Tailings for Maximizing the Recovery of Critical Metals

1
Department of Chemical Engineering, Université Laval, 1065 Avenue de la Médecine, Quebec, QC G1V 0A6, Canada
2
Centre Technologique des Résidus Industriels (CTRI), 433 Boulevard du Collège, Rouyn-Noranda, QC J9X 0E1, Canada
3
Physics Department, McGill University, Montreal, QC H9X 2V2, Canada
4
Impact Global Solutions (IGS), 70 Goodfellow, Delson, QC J5B 1V4, Canada
*
Author to whom correspondence should be addressed.
Metals 2025, 15(11), 1215; https://doi.org/10.3390/met15111215
Submission received: 30 August 2025 / Revised: 2 October 2025 / Accepted: 16 October 2025 / Published: 1 November 2025

Abstract

Asbestos tailings represent a historical liability in many countries. Canada aims at transforming this industrial legacy into an opportunity to both mitigate the environmental footprint and recover critical (such as magnesium, nickel, chromium, and cobalt) and strategic metals, which represent significant economic development potential. This study aimed to investigate the recovery of critical and strategic metals (CSMs) from asbestos tailings using hydrochloric (HCl) acid leaching, with acid concentration (2–12 mol/L), leaching temperature (20–90 °C), and solid–liquid ratio (10–40%) as key process parameters. The tailing samples studied is composed mostly of chrysotile and lizardite. It contains about 40% magnesium (as its oxide MgO) and nickel and chromium showing contents 52 and 60 times higher than their respective average crustal abundances (Clarke values). Iron content is 8.7% (expressed as its ferric oxide Fe2O3). To optimize key factors influencing the leaching process, a statistical experimental design was employed. The designed leaching experiments were subsequently performed, and results were used to define leaching conditions aiming at maximizing Mg and Ni recoveries while minimizing iron contamination using response surface methodology (RSM) based on the central composite design (CCD). A quadratic polynomial model was developed to describe the relationship between the process parameters and metal recoveries. Among the tested effects of acid concentration, temperature, and pulp density on magnesium recovery, the modeling indicated that both hydrochloric acid concentration and leaching temperature significantly enhanced metal recovery, whereas increasing pulp density had a negative effect at low temperature. The empirical mathematical model derived from the experimental data, accounting for the uncertainties on chemical data, indicated that high magnesium recovery was achieved at 90 °C, with 10–12 N hydrochloric acid and a solid-to-liquid ratio of 33.6–40%. These findings reveal the potential for the recovery of critical and strategic metals, both in terms of efficiency and economic viability.

1. Introduction

Asbestos has been widely used in various industries, including thermal and electrical insulation, roofing, ceramics, cement, textiles, flooring, and coatings [1,2]. It is still produced in China, Kazakhstan, and Brazil [3]. Its widespread use is due to its desirable properties, such as heat resistance, incombustibility, insulation capabilities, durability, and high tensile strength [1,4]. From 1881 to 1950, Québec was the only producer of asbestos in Canada [5]. The province of Québec dominated the asbestos global market until the end of the eighties [2]. In 1989, the US banned the use of asbestos for health and safety reasons. Progressively, asbestos use decreased all around the world. The last mining sites in Québec were finally closed in 2012. The health hazards associated with asbestos include serious respiratory diseases and cancers and have led to stringent regulations and a substantial decline in its use [4,6,7]. “The sale, import and use of asbestos and asbestos-containing products has been prohibited—in Canada—since 30 December 2018. The federal regulations do not apply to tailings that contain asbestos, with some exceptions” [8]. Between 800 million tons and two billion tons of asbestos tailings over about 2000 ha according to different public sources [9,10] remain as huge stockpiles in the Thetford Mine-Val-des-Sources (former Asbestos City) geological corridor, located in south-central Québec, Canada. Huge amounts of asbestos tailings also remain in many other places in Canada [11,12] and in the world [13].
The host rock of asbestos ores is serpentinite, a rock resulting from the alteration of ultramafic rocks by saline water under low-temperature metamorphism. In the Thetford region (Southern Québec, Canada), asbestos host-rocks had a variety of compositions as illustrated by the geology synthesis of Riordon [14] and more recently by that of Schroetter et al. [15]. The serpentine group of minerals is a wide group which includes the chrysotile sub-group according to the Dana Classification [16]. Main minerals of the serpentine group are antigorite which is not asbestos and chrysotile which is asbestiform [17]. The serpentine group also includes other phyllosilicates like the lizardite sub-group of minerals [18]. These phyllosilicates are composed of iron (Fe) and magnesium (Mg), with various contents of nickel (Ni) and other potential strategic metals (chromium, manganese, cobalt) in their crystal structure. Such critical and strategic metals (CSM) are essential for the development of green energy and the electrification of transportation in many jurisdictions [19]. Chrysotile is the main fibrous asbestos mineral found in Québec asbestos tails [2]. Chrysotile, also commonly called asbestos or serpentine (which leads to some confusion), is represented by several polymorphs which are clinochrysotile (the most common) or orthochrysotile or parachrysotile [20] from the phyllosilicate family (in the serpentine group and chrysotile subgroup). Other regulated asbestos minerals are amphiboles and include crocidolite, also called riebeckite [21], amosite, also called grunerite [22], actinolite, also called hexagonite, nephrite jade, smaragdite or emerald green [23], anthophyllite [24] and tremolite [25] from the amphibole family. The basic structural units of amphiboles consist of tetrahedral (T) layers of silica oxide ions [Si4O11]6− arranged in double chains [26]. Chrysotile also contains these tetrahedra organized into six-membered rings that extend into virtually infinite sheets, interlayered with an octahedral (O) brucite-like layer of magnesium oxyhydroxide ions [Mg6O4(OH)8]−4 [26]. Through the serpentinization of peridotite rocks, a natural metamorphism geological process, chrysotile is expected to be accompanied by residual olivine (possibly depending on the level of geological metamorphism and alteration), pyroxenes and other serpentine minerals, as well as by magnetite and brucite [27].
The asbestos tailings, which are residues from the mining and mineral processing of asbestos ore [14,28], still contain high content of chrysotile, the main asbestos mineral in this region, and can still contribute to public health concerns and environmental contamination, if not handled properly [29]. The persistence of these tailings in soil and water systems [30] presents challenges for remediation and poses potential health risks to nearby communities. Aside from the environmental management of stockpiles, many projects have been launched in the last decades, to transform this industrial legacy into valuable opportunities [31]. The degradation of asbestos by various processes may lead to final tailings being recycled or reused [32,33]. For example, this is the case of the commercial transformation of asbestos by “Les Sables Olimag” [34]. Such processes enhance metal extraction while reducing both operational costs and environmental impacts [35]. Other processes under development aim at the destruction of fibers, or at the carbonation of Mg primary minerals, or both. Magnesium-rich minerals, which are abundant in ultramafic mining waste, if not leached during the process, offer a safe and cost-effective solution for carbon dioxide (CO2) sequestration [36,37,38,39,40]. Such technological solutions are encouraged in Québec and Canada as exemplified by the development of compagnies like Exterra Carbon Solutions [41].
On the other hand, the recovery of metals through hydrometallurgical processes is a promising area of research due to both their effectiveness in processing low-grade ores and their potential to render leached chrysotile fibers harmless. The treatment of asbestos tailings has been conducted by leaching methods with strong mineral acids, including hydrochloric acid, sulfuric acid, nitric acid, oxalic acid, and phosphoric acid [1,42,43,44,45,46,47,48,49,50,51]. Quite recent reviews are provided in [4,33,51].
Magnesium metal can be commercially recovered from pure MgCl2 solutions via molten salt electrolysis, a high-temperature process [52,53]. In contrast, precipitation methods are typically used to recover other metals from leach solutions, where metals like nickel, cobalt, and chromium are extracted through chemical reactions that allow the formation of solid metal compounds for further recovery [47]. In addition, hydrochloric acid (HCl) can be recovered and reused in the process [54]. For these reasons, extensive research has focused on using HCl as a leaching agent to extract magnesium from asbestos tailings. Several studies and patents have reported on and summarized this approach over the years [43,47,49,54,55]. In the academic literature, Shayakhmetova et al. optimized the leaching process of chrysotile asbestos waste using hydrochloric acid, the results showed that, under the optimal conditions hydrochloric acid concentration of 18%, temperature of ~85–90 °C, pressure of 1 atmosphere, and duration of 2 h, the leached percentages of Mg and Ni, reached, respectively, 96.0% and 81.3% [47].
Baigenzhenov et al. improved the production of magnesium chloride from wastes generated in chrysotile asbestos production. The leaching process with 25% concentrated hydrochloric acid at a temperature of 80–85 °C resulted in 92% of the magnesium passing into solution [56]. Abdel-Aal et al. [57] determined the optimum conditions for the decomposition of serpentine ore with hydrochloric acid. The results showed that under the optimal conditions—hydrochloric acid concentration of 12%, temperature of 95 °C, and duration of 4 h—the maximum MgO recovery achieved was 96.5%. Cheng and Lamy-Morissette [49] who also leached asbestos from the Thetford region emphasized the need to use high strength HCl (10 M) to obtain an extraction yield higher than 90% Mg. Their sample was composed mostly of lizardite, although other minor minerals were present. Unfortunately, the content of chrysotile is not clearly given for that sample but described to be broadly between 1% and 38% by volume. They also show that very little silica is released during acid leaching, as expected [49]. Aside the optimization of leaching, an interesting study was led by Morgan [58], describing the effect of various chrysotile mineralogical features on the dissolution rates. Currently, different methods are available for magnesium extraction, including pyrometallurgical, hydrometallurgical, and electrometallurgical processes as reviewed recently by Taheri and Larachi [51].
In the present study, the focus is on the complete recovery of valuable metals, including magnesium, by using HCl, towards a zero-waste strategy of asbestos tailings. There are many factors that influence the dissolution of the minerals present and the subsequent retention in solution of the metals to be recovered:
  • The nature of the minerals to be dissolved;
  • The mineralogical site to which the value (or non-desired) metals are associated with, and their readiness to be leached or not;
  • Their size, and the grain size distribution of the powder;
  • The proportion of solid to acid (solid percentage in % by mass, or L/S ratio in g/mL);
  • Acid concentration;
  • Leachate washing intensity;
  • Physico-chemical conditions such as temperature, pressure, oxidation–reduction state, acidity, saturation index regarding secondary phases;
  • Contact conditions between solid and acid: agitation mode, agitation duration.
Thus, the outcome of the leaching process depends on several factors and on significant interactions between them.
From previous research work, optimal leaching conditions appear to differ widely from one site to another. It is thus important to optimize leaching conditions for a complete recovery of values (CSM and silica) for the sample under study, knowing that interactions between leaching factors are significant in this kind of material under HCl acid leaching. Many of the already published data do not report all of their parameters and operating conditions to the specific composition of their feed and simply refer to it generically as asbestos. However, it is deemed critical to have mineralogical knowledge and a scientific perspective of the feed (mineralogical, geochemical, and crystal structure) when elaborating and discussing the mechanisms involved during leaching of complex ore matrices. The present study included a mineralogical approach on the feed material.
Although previous studies have demonstrated the feasibility of extracting magnesium and nickel from asbestos tailings using hydrochloric acid, most lacked systematic optimization and did not account for the influence of mineralogical composition on leaching performance. The interaction effects between key parameters such as acid concentration, temperature, and solid-to-liquid ratio also remain underexplored. This study addresses these gaps by integrating detailed mineralogical characterization with a statistical optimization approach RSM to maximize CSM recovery while minimizing iron contamination.
The optimization was performed through a minimal set of experiments thanks to using a statistical design of experiments (DOE) method. The effects of three factors—acid concentration, temperature, and solid-to-liquid ratio-on the leaching process of asbestos tailings were investigated. In this first attempt, the duration and the particle size distribution of the feed were kept constant. Based on this, the recovery response for magnesium and other elements from the acid leaching process was optimized using a standard response surface model (RSM) design involving a central composite design (CCD). It is known that when the expected response is affected by the combination of several independent factors and their interactions, the response surface method (RSM) is an effective tool proposed for the optimization process [59]. The central composite design (CCD) method is a commonly applied approach within the response surface model (RSM) to optimize the leaching of valuable metals from solid wastes [60,61,62]. RSM is an optimization method combining experiments with statistics [62,63]. It is well suited to fit a quadratic surface. In parallel, the mineralogical and geochemical characterizations of the feed sample was approached by coupling X-ray diffraction, Mössbauer spectroscopy and microprobe analyses on hand-picked typical grains of the samples, in addition to the whole sample geochemistry by major and Ni, Co, Cr trace elements quantifications.

2. Materials and Methods

2.1. Collection and Preparation of Homogeneous Head-Samples

About 60 kg of asbestos tailings from the Thetford region were provided for the project by the industrial partner and his collaborators. The material was wet. The totality of this material was sieved wet, for safety reasons, to keep only the fraction finer than 2.36 mm as the head-sample for this study. The head-sample moisture content was estimated at 21% (dry sample of about 47 kg).

2.1.1. Preparation of Homogeneous Head-Samples

  • Wet method preparation for the first series (W-series);
After chunks larger than 2.36 mm were removed from the collected material, the undersized head material was quartered manually into a final set of about 1 kilo samples, using a shovel according to a rigorous quartering plan. On about 0.5 kg of sub-sample, also collected by quartering, the characterization of the particle size distribution was performed by wet sieving. Then 3 aliquots of 10 to 20 g, collected by core-drilling along the whole depth of 2 different samples bags using a soil micro-coring tool. These were used for the estimation of moisture, for the asbestos content estimation or safety risk analysis and for the geochemical analysis (selected metals) of head-samples used for the leaching study. Sub-samples were stored in sealed plastic bags before use, as about 1 kg samples.
  • Dry method preparation for the second series (D-series);
Approximately 7.7 kg of the initial head-sample (−2.36 mm) was dried. Batches of 320 g of this residue were prepared to obtain a representative particle size distribution for leaching. For sample homogenization, the asbestos residue was divided into 12 batches by a carousel-type divider. Using a rifle, the 12 batches were mixed so that 2 opposite batches from the carousel were intertwined to form 24 batches of 320 g each. Twenty batches out of 24 were then divided into 8 smaller 40 g batches using a rotary divider. Granulometric and chemical analyses of the samples were carried out to verify the homogeneity and representativeness of each batch during all leaching operations.

2.1.2. Preparation of Fibers, Magnetic, Non-Magnetic Fractions and Hand-Picked Grains for the Mineralogical Study

Finally, to get more information about the iron-containing phases, magnetic or not, a sample was prepared in the following way: the asbestos fibers fraction (30–35%) was removed from two sub-samples by using its natural floatability. On the sink fraction, the magnetic fraction (40–50%) was separated from the non-magnetic one (50–60%) by using a handheld magnet. The magnetic and the non-magnetic fractions were further classified by handpicking under a microscope [64]. An aliquot of each mineral class was characterized by X-ray diffraction (XRD) and Mössbauer spectroscopy. Electron probe microanalysis (EPMA) was used to quantify Ni, Cr (chromium), Fe, Mg, Al (aluminum), Si (silica) of some grains as a complement to this study [64].

2.2. Methods of Characterization of Samples

The head-sample was characterized in more details (particle size distribution—PSD, moisture, mineralogy, geochemistry) than leached products for several practical reasons, while only chemistry was determined for leaching head-samples and products (solid tails, leachates and wash waters alike). The characterization of the head-samples allowed to evaluate occupational safety and health risks and the level of preventive measures to be taken to work with that dangerous material in the laboratory, to evaluate hydrometallurgical risks and opportunities, and evaluate how risks could be minimized or avoided in a sustainable way, to assess how mineral concentration processes prior to leaching could benefit the whole sustainability of the process, to determine the content of the various CSMs, and of value minerals, to evaluate the level of recovery effort to be put on each of them. For each sample, the geochemical analysis aims at balancing the mass of chemical elements (or their oxides) between the leaching feed and products.

2.2.1. Solid Samples

  • Particle sizes distribution
The PSD was determined by wet sieving on the 8, 12, 20, 35, 60, 140, 400 U.S. mesh screens on the W-series. This analysis was duplicated. From the resulting curves, particle size distribution criteria of interest for the process (passing sizes: D80, D50, D38 and top size) were estimated. On the D-series, to verify the homogeneity of the sample, dry sieving of the 5 random batches of the (head sample) asbestos residue was also carried out.
For both W and D series, PSD results were used to get the specifications of studied samples but also to validate the homogeneity of samples quartered from the head material.
  • Moisture
Moisture was determined by weighing a known wet mass of sub-sample before and after full drying at 105 °C. The stable weights were taken after the sample was brought back to room temperature and humidity. This latter value was first used to estimate the dry mass but led to major uncertainties. Therefore, the following samples were dried immediately prior to use in the leaching tests. The first leaching series was conducted on the W-series. It was performed under the following conditions: leaching temperature was maintained between 25–90 °C, hydrochloric acid concentration ranged from 2–12 mol/L, and the solid–liquid ratio varied between 10–40% (Table 1, Section 2.4).
  • Mineralogy
The minerals inventory was approached by various techniques. First, the whole sample was analyzed to evaluate the safety risk while working with asbestos tailings. This is commonly performed by polarized microscopy, although near infrared/shortwave infrared (NIR-SWIR) hyperspectral scan imaging [65] or Raman spectroscopy could be more accurate [66,67,68,69]. The semi-quantitative volume content of fibers in the head-sample was achieved by a commercially certified laboratory (Laboratoire Silica, Montréal) to evaluate the risk and how samples will be handled during the project [70]. Then the crystalline fraction of the pulverized sample was determined by XRD followed by Rietveld data treatment at a commercial laboratory (Actlabs, Activation Laboratories Ltd., Ancaster, ON, Canada) [71]. “The X-ray diffraction analysis was performed on a Bruker D8 Endeavour diffractometer equipped with Cu X-ray source and operating at the following conditions: 40 kV and 40 mA; range 4–70 deg 2-theta; step size 0.02 deg 2-theta; time per step 0.5 s; fixed divergence slit, angle 0.30; sample rotation 15 rotation per minute (rpm). The PDF4/Minerals ICDD database was used for mineral identification. The quantities of the crystalline mineral phases were determined using Rietveld method. The Rietveld method is based on the calculation of the full diffraction pattern from crystal structure data.” Corundum was added to the sample as an internal standard [71].
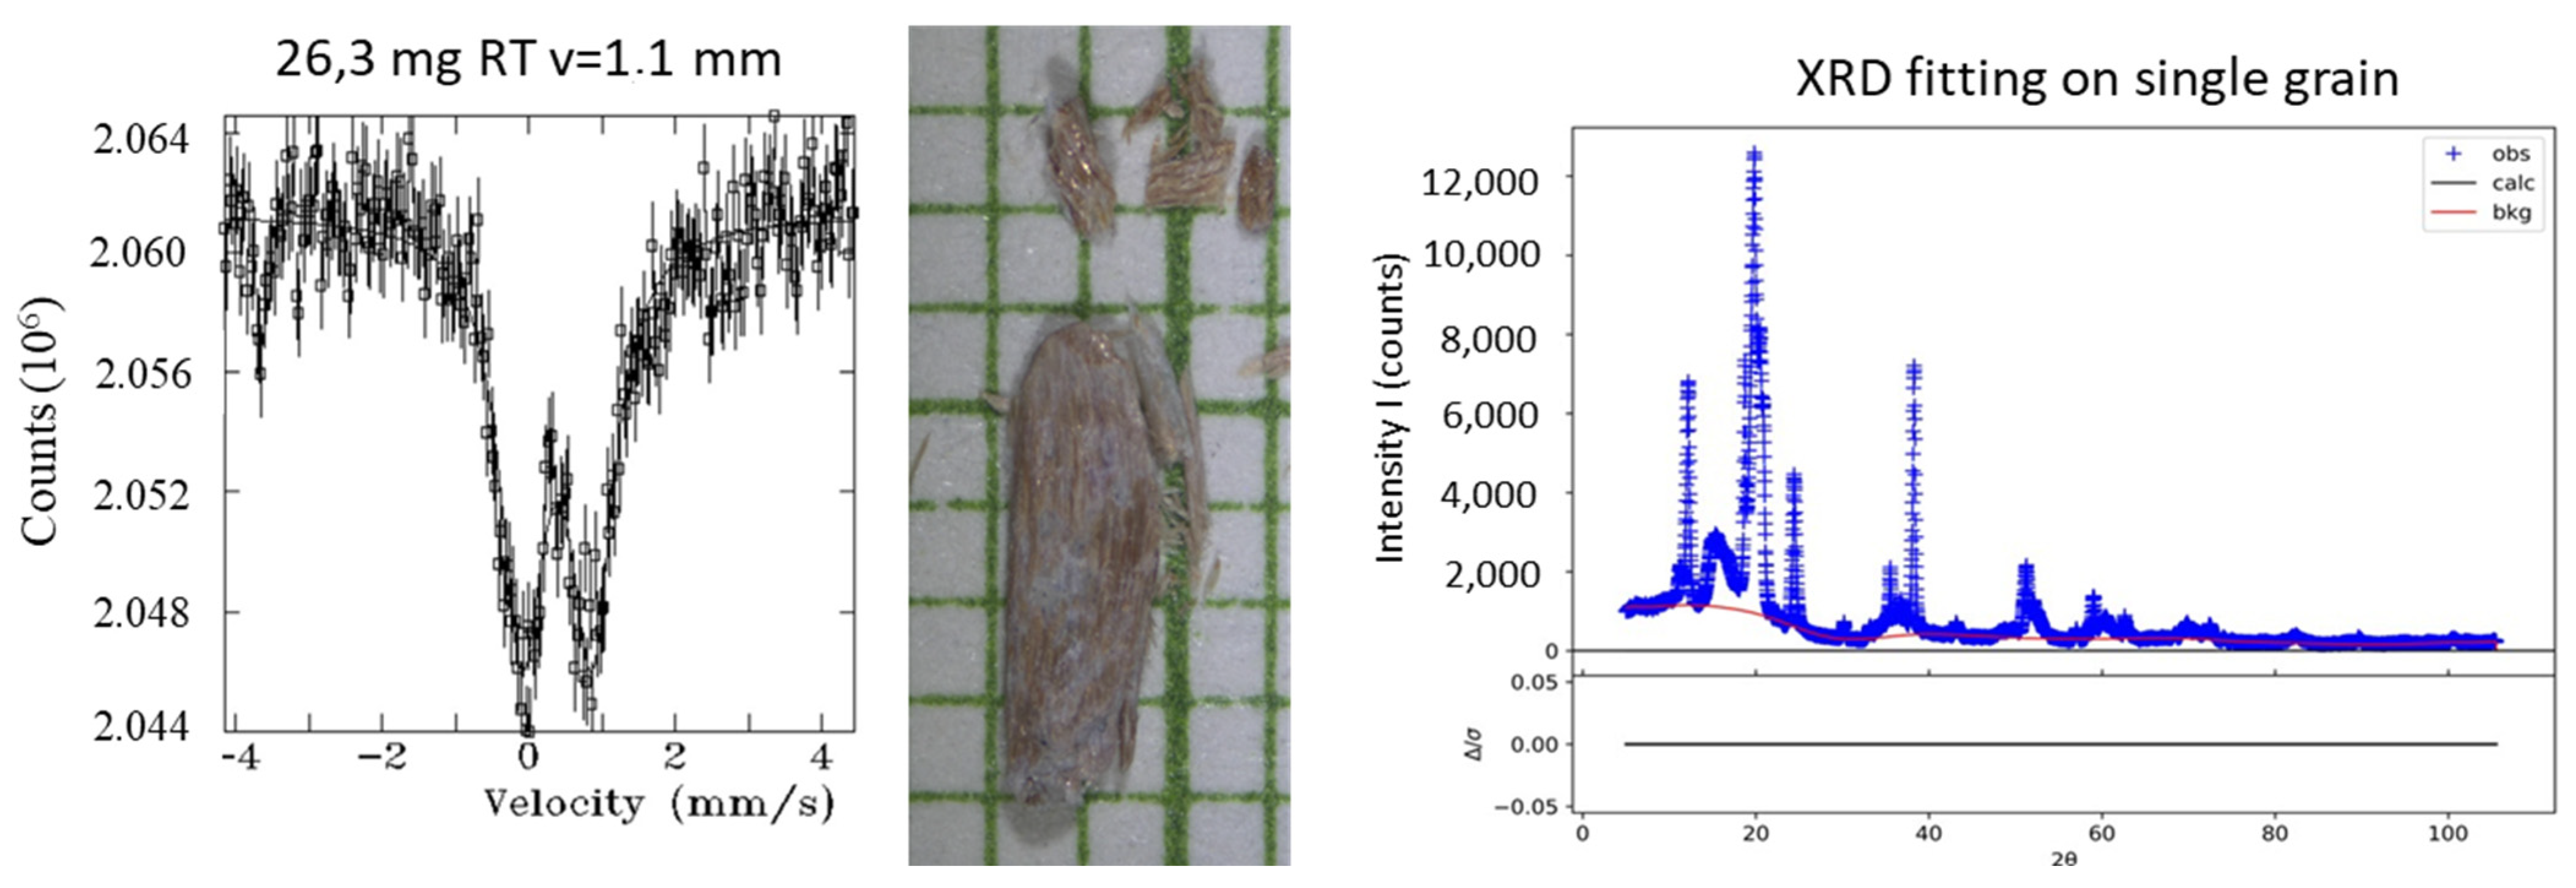
To complete the mineralogical composition of the head-sample, a Mössbauer spectroscopy study, coupled with XRD and EPMA on hand-picked grains, was performed. Grains specimens were hand-picked under a microscope. They were hand-ground and mounted on a zero-background single-crystal silicon plate using a small amount of vacuum grease [64].
The 57Fe Mössbauer measurements were made on a conventional spectrometer operated in constant-acceleration mode using a 50mCi 57Co(Rh) source. All spectra were acquired at ambient temperature. The instrument was calibrated using a thin alpha-Fe foil and isomer shifts are quoted relative to the centre of the calibration spectrum. Samples were hand ground and mixed with boron nitride powder to form a uniform absorber and then mounted in acetal holders with thin windows. A technical challenge for natural fibers and micaceous minerals, side the fact that they may be far from stoichiometric composition, is that they are uneasy to break down in a homogeneous powder: such textured samples result in less precise Mössbauer spectra than synthetic minerals. A summary of the principle of Mössbauer Spectroscopy (MS) with a reference to measured features (δ, Δ, data referred to in the MS detailed table results) is given in Appendix A (Appendix A.2.1).
The EPMA used was a Cameca SX 100 FIVE FE having 5 wavelengths dispersive X-rays spectrometers. This field emission microprobe has large dispersive crystals which make it easier to measure trace elements [72]. Analyses were obtained on separated grains mounted in polished thick sections. Data acquisition conditions were 15 kV accelerating voltage, 20 nA beam current (10 µm beam size), 10 s counting time for each element (Mg, Fe, Si, Ni, Co, Cr). Standards used for the calibration of the wavelength dispersive spectroscopy (WDS) detector were olivine (with the TAP crystal, hematite (with the LLiF crystal), olivine (with LTAP crystal), NiO (with the LLiF crystal), co-metal (with the LLiF crystal), chromite (with the LPET crystal) for Mg, Fe, Si, Ni, Co, Cr respectively. Detection limits were defined according to Ancey et al. method [73].
  • Geochemistry
    Wet chemistry quantification of selected elements and CSM
The geochemistry of the head sample and the leached solid residues of the W-series were analyzed using a conventional digestion method involving dissolution in a mixture of three acids (HNO3, HCl, and HF) at 95 °C and atmospheric pressure overnight. To enhance this approach and reduce uncertainty in the elemental mass balance, an improved protocol was developed. Subsequent post-leaching solid residue leftover from the W- and D-series were digested using a more comprehensive acid blend (HNO3, HCl, HF, and H3BO3) under the same conditions. After completely evaporating the digestate, the residue was redissolved in HNO3, filtered through a 0.45 µm membrane (acquired from Avantor/VWR International, Mississauga, ON, Canada), and analyzed in the same manner as the aqueous leachates (see Section 2.2.2). This method (Method #9 HP 0.5 g H3BO3) was performed in triplicate and validated for Mg, Ni, Co, Cr, Fe, and Mn. The standard deviation among replicates was below 5% for Mg, Ni, Co, Fe, and Mn, and 8% for Cr.
  • Whole-rock geochemistry by wavelength-dispersive X-ray fluorescence (XRF)
Furthermore, and to get a better knowledge of the composition of major elements of the head-sample, the whole-rock geochemistry was assessed by Wavelength Dispersive X-ray Fluorescence (WD-XRF, PANanytical AxiosmAX), on glass disks prepared by borated fusion (Method 50/50 de Li2B4O7 et LiBO2) using a Katanax fusion fluxer (model K1 Prime). The certified reference material (CRM) Andesite JA-1 [74] was used to countercheck the analytical response for major and trace elements. It was supplied by Brammer Standard Company, Inc., Houston, TX, USA. In complement to that whole-rock analysis approach, the loss of ignition (LOI) was determined at 1050 °C.
  • Validation of head-subsamples homogeneity
The validation of head-subsamples homogeneity was also performed by geochemical analysis of important elements for the process development. For the W-series, the content in Mg, Ni, Cr, Co, Fe, and Mn in a total of six sub-samples drilled into two different 1 kg bags were determined. The standard deviation on the five sub-samples is equal or better than 5% for Mg, Ni, Co, Fe, Mn and equal to 8% for Cr. For the D-series, XRF and wet-chemical analysis were run on 5 sub-samples (certificates 30801_A1 to 30810_A1) and validated by the analysis of the CRM.

2.2.2. Aqueous Samples

Leachates and wash waters (after acid full digestion and having been brought back to a dilute HNO3 aqueous matrix) were filtered (0.45 µm porosity) and analyzed by microwave induced plasma interfaced to an atomic emission spectrophotometer (Agilent MP-AES 4200 acquired from Agilent Technologies Canada Inc., Toronto, ON, Canada with its software MP Expert) for major and minor elements, and by inductively coupled plasma mass spectrometry (Agilent ICP-MS 7800 acquired from Agilent Technologies Canada Inc., Toronto, ON, Canada with its software MS Hunter) for trace elements. The analytical results obtained were used to calculate metal recovery percentages.

2.3. Leaching Methods

There were two series of experiments, the first to optimize the leaching process and study the parameters (W-series), and second (D-series) to confirm first results and conduct a sensitivity study around the designed optimal set of conditions.

2.3.1. Experimental Protocols

Using the W-series samples, twenty-three experiments were conducted under various conditions as designed by the Stat-Ease Design of Experiment software. Using the W-series samples, twenty-three leaching tests were performed under variable conditions of acid concentration, temperature and solid to liquid ratios. Ranges for these parameters and conditions of each test are indicated in Table 1. The leaching time was set at 90 min.
Using the D-series samples, four leaching tests were run in triplicate with highly concentrated hydrochloric acid (HCl) at different concentrations (10 N and 12 N) were carried out in batch mode. The experimental protocol was about the same for both series: Acid temperature was maintained with a round-bottomed flask heater or with a water bath system, using a suitably sized metal bowl, and a hot plate with an electromagnetic stirrer. To avoid acid loss through evaporation, a condensation system was used to condense the vapor. Agitation rate was set between 300 and 360 rpm for the D-series and W-series respectively, high enough to keep the solid dispersed while avoiding a mixing vortex, using a magnetic bar. After the leaching process, hot vacuum filtration was carried out to separate the solid from the liquid, using a vacuum system and a silicone heating blanket to maintain the leaching temperature during filtration. The liquid fraction was analyzed by ICP to quantify the metals dissolved in the leachate, while the solid fraction was rinsed twice with a solution of 1 N hot HCl. The amount of rinse water was recovered separately (D-series) or not (W-series) and analyzed by ICP as well. The resulting residual solid was then dried at 105 °C in a conventional oven for 24 h. After drying, the mass of the resulting leached solid was determined and analyzed by ICP and XRF to assess the amount of metal dissolution in the residue versus leaching.
For each leaching run, a specific acid solution made from analytical grade commercial concentrated hydrochloric acid (37%) was used. The sequence of preparation of the leaching operation started by preparing the solution to the desired concentration, heating the solution to the targeted temperature, and then adding the prepared feed-sample to the reactor in respect to the solid–liquid ratio. At the end of the leaching process, solid and liquid were filtrated under vacuum, while maintaining the temperature of the filtration system at about 65 °C (D-series), using 0.45 µm pore size filter papers made from quartz fibers. The leached tails were washed using hot DI water and dried at approximately 105 °C.

2.3.2. Set-Ups

The experimental set-up to perform the leaching experiments is shown in Figure 1. It includes a 250 mL laboratory reactor connected to a reflux condenser (with water circulation) and equipped with a thermometer, positioned on top of a hotplate with magnetic stirrer. Temperature is controlled by placing the reactor on a heater in a water bath.

2.3.3. Reagents

The leaching agent used in all tests was hydrochloric acid (HCl, +37%). To determine the metal composition of the solid fraction, a three-acid digestion technique using hydrochloric acid (HCl 34–37% for trace metal analysis), nitric acid (HNO3 60–70% and hydrofluoric acid (HF 47–51%). These 3 acids are high purity grade used for trace metals analysis, followed by complexation with ACS grade boric acid (H3BO3 +99.5%). Reagents are from VWR International (VWR International, 2360 Argentia Road, Mississauga, ON, Canada).

2.3.4. Operating Variables and Conditions

The effects of three factors—acid concentration, temperature, and solid-to-liquid ratio-on the leaching process of asbestos tailings were investigated.

2.4. Design of Experiments (DOE): Modeling of Some Asbestos Tails Leaching Experiments to Optimise Leaching Conditions

The choice of parameters, their ranges (Table 1), and other operating conditions (Section 2.3) are based on preliminary experiments using the same kind of sample and based on the findings of other researchers about similar materials [60,75,76,77,78,79,80,81].
Table 1. Independent factors and their levels.
ParametersUnitLow LevelHigh Level
HCl concentrationmol/L (%)2 (6.1)12 (37)
Solid to liquid ratio% 1040
Temperature°C2090
The experimental tests for the leaching process were designed using the response surface methodology (RSM) with Design Expert software (version 23.0.0; Stat-Ease Inc., Minneapolis, MN, USA). Central composite design (CCD) was selected as the experimental design domain for leaching process optimization of the experimental parameters. In this design, several runs were suggested to cover low, high, and central data points in addition to the extra replicates so a model could be suggested to relate the parameters to the leaching efficiencies of Mg, Al, Cr, Mn, Fe, Co, and Ni (as responses of the model). A regression analysis of the data based on using a second-order polynomial equation was used by the model [80]:
Y = β 0 i = 1 k β i X i + i = 1 k β i i X i 2 + i = 1 k 1 j = 2 k β i j X i X j + ε
where Y denotes the value of the response variable, the regression coefficients (β); X are the independent parameters; k is the number of optimized variables; ε represents the random error.
Here, Fischer’s test value (F-value) and the probability value (p-value) in the analysis of variance (ANOVA) are the basis to evaluate the effects of coefficient (or parameter) in the above equation [76].

3. Results and Interpretations

3.1. Characterization of Samples

3.1.1. Particle Sizes Distribution (PSD)

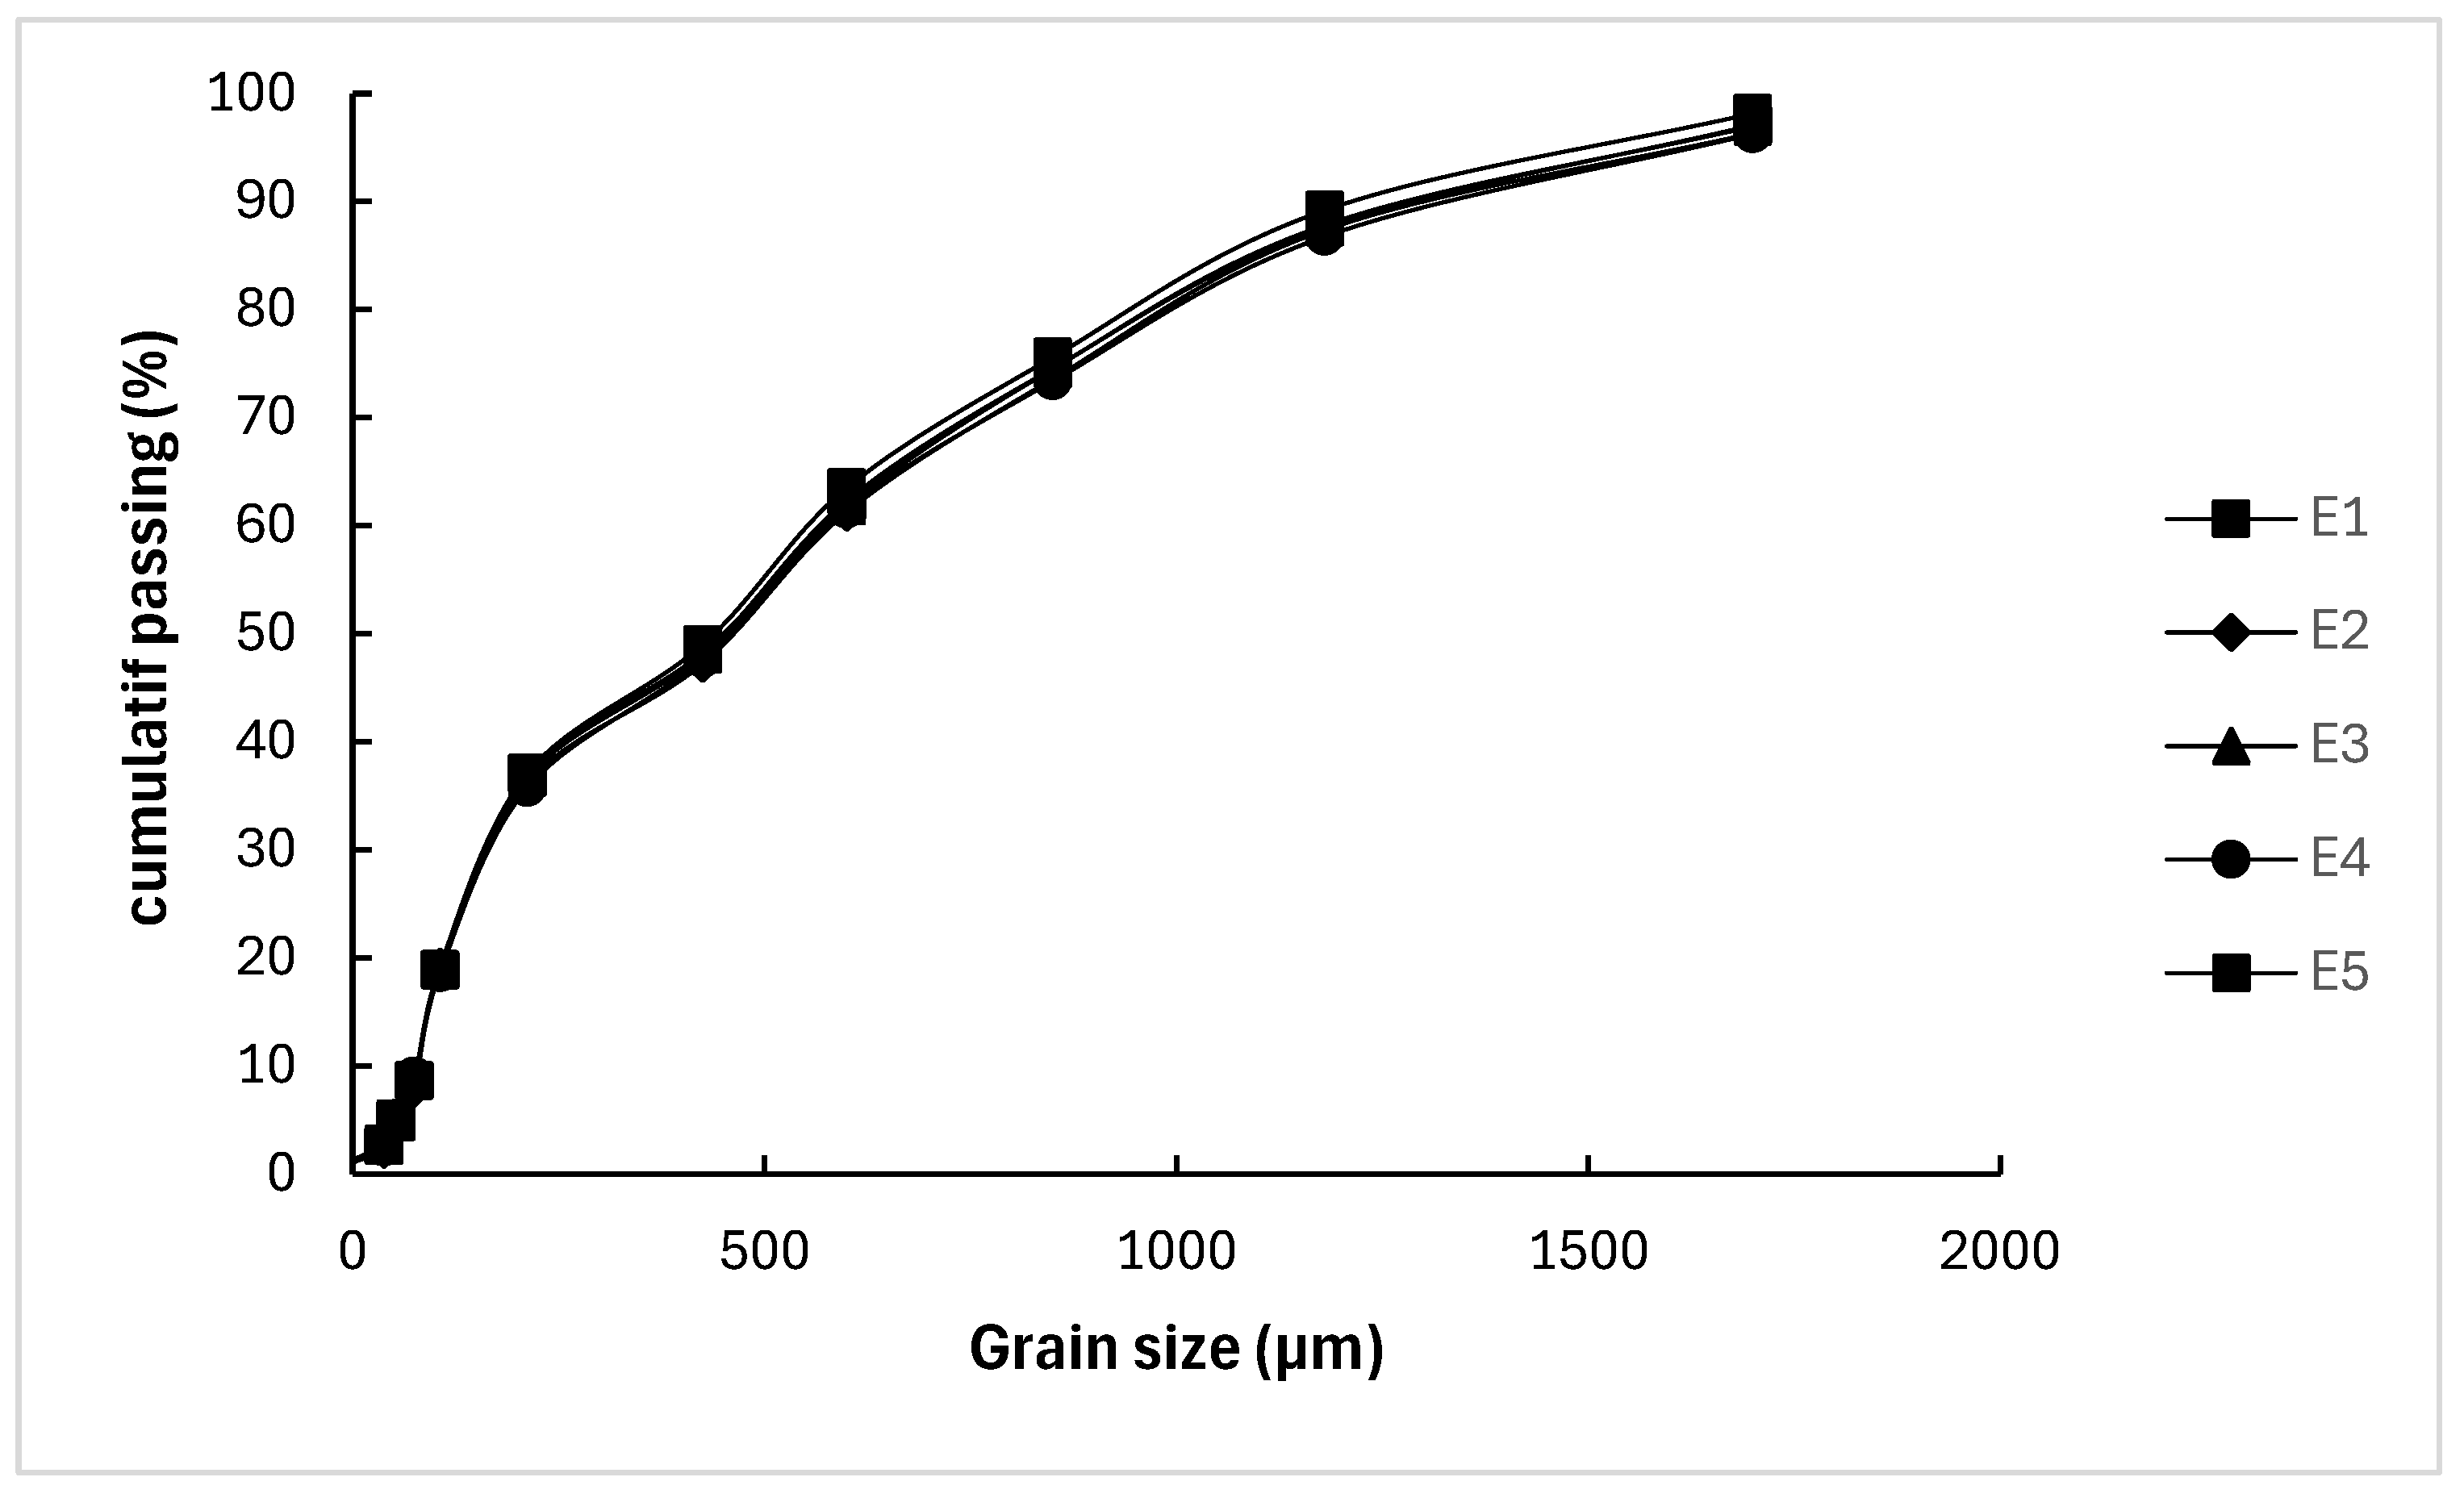
The particle size distribution shows that particles of samples to be leached are coarse, having 52% of the head sample over 425 µm and about 25% over 1 mm mesh sieves (Figure 2). The particle size distributions are similar with a D80 of 1000 µm for the 5 random batches of residues.
Using tailings as received as a feed of the hydrometallurgical process, without any re-grinding prior to leaching, is significantly eco-energetic for a mine. If value metals can be leached readily enough, the milling of such coarse particles will not be necessary. The economics and the greenhouse gas balance of the process might require a compromise between grinding and strong leaching conditions.

3.1.2. Mineralogy

  • Inventory of main minerals by X-ray diffraction (XRD) in the head-sample
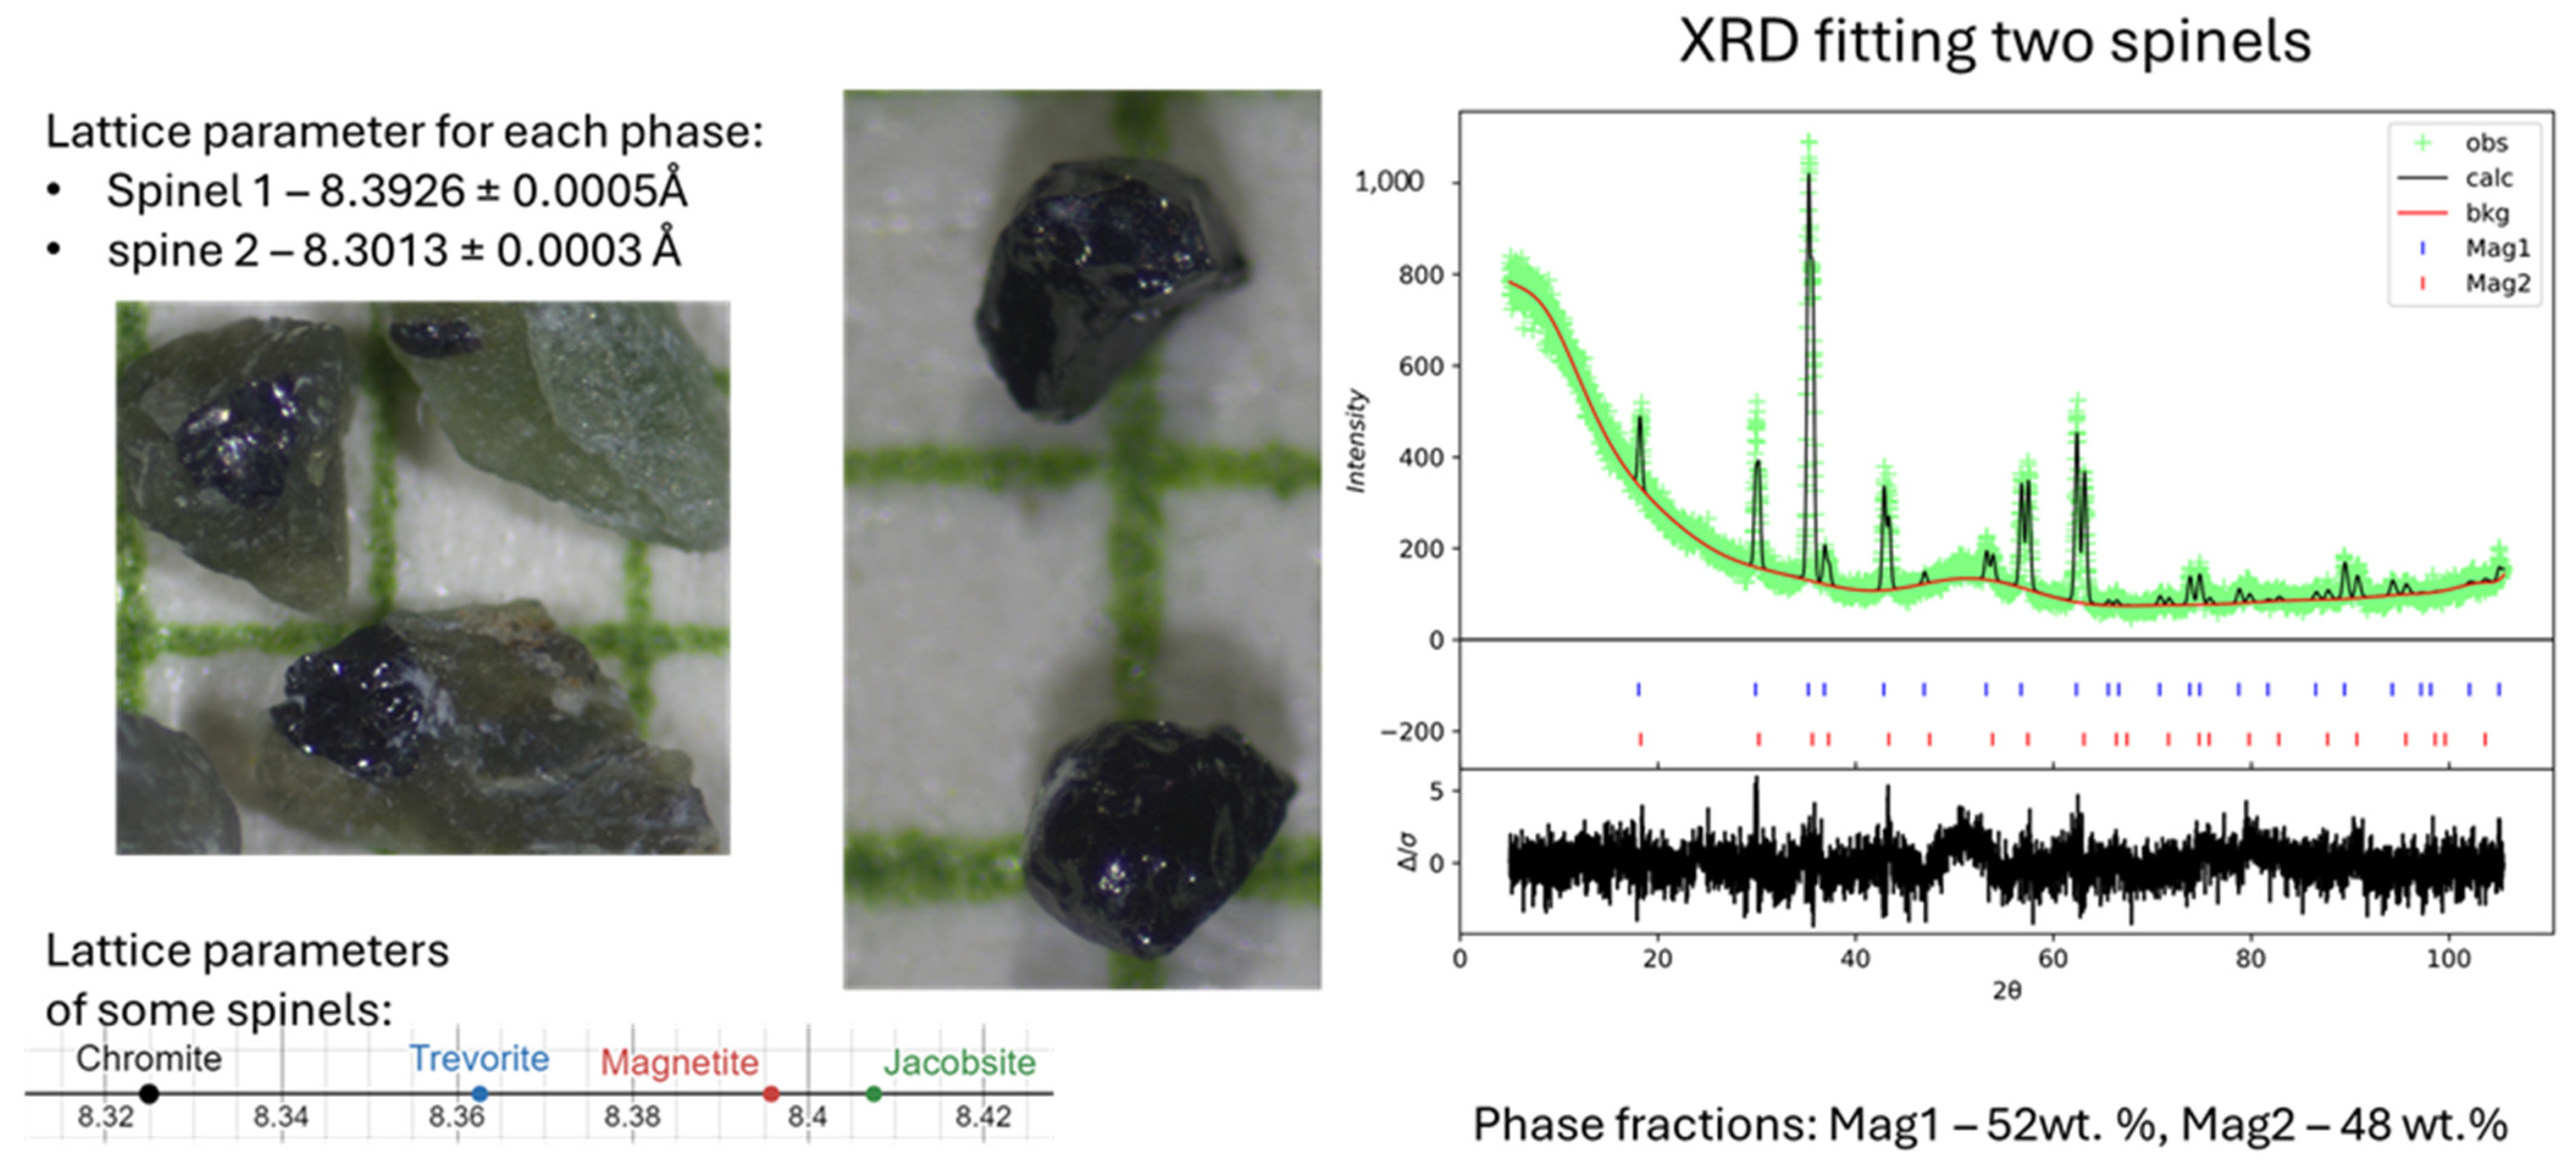
According to the mineralogy of the crystalline material provided by XRD [71], the main group of minerals is identified as being serpentine. The rest of the crystalline matter is represented by minor minerals such as chlorite, forsterite, brucite, spinel (including magnetite) and accessory quartz (Table 2; Figure A1 and Table A1; Appendix A.1). Forsterite is the magnesian pole of the olivine (Fe-Mg)-series. Chlorite is an iron-containing phyllosilicate. Half of the sample was identified as amorphous [71]. The nature of the amorphous fraction remains unknown.
Estimated amounts of crystalline material are thus only qualified according to all observations collected on samples (Table 2). The main serpentine minerals were identified by coupling several techniques as indicated) in next sections [64].
Asbestos crystals, as characterized by polarised microscopy, indicated the presence of mainly chrysotile fibers for 45 to 50% (by volume) [70]. This is consistent with the large volume of chrysotile fibers separated from the bulk by flotation in the present study.
Important mineralogical features for mineral processing and hydrometallurgical process developments were still missing at this stage as several of the identified minerals could contain Mg, Ni, Cr but also Fe and Mn which are considered undesirable companion elements in the leaching stage of the process.
Furthermore, hand-picking and classification of grains presenting similar visual features was also performed [64]. The mineralogy of the head-sample was thus further studied by combining optical microscopy observations, Mössbauer spectroscopy, XRD and EPMA on hand-picked minerals [64].
Thanks to this study, the inventory of serpentine minerals has been brought to a more advanced level of characterization. A compilation of data from the literature [82,83,84,85,86,87] for the main serpentine minerals observed is given in Figure A2 and Table A2 (Appendix A.2). Experimental data on chrysotile-free, magnetic and non-magnetic, fractions of the head-sample are partly presented in Appendix A.2. A synthesis of processed results is given below.
This study allowed us to separate a first class of grains without any particular geometric shape, with a wide diversity of colors (dark green, light green, yellow-brown and even pale greyish green) and transparency. They showed conchoidal to smooth fractures and greasy surfaces. They presented a variable chemical composition by EPMA but were closest to lizardite. The combined spectral features (EPMA, XRD, Mössbauer) led us to conclude it was mostly lizardite (Table 3 and Figure A3, Appendix A.2.2). Aside chrysotile fibers, the dark green, opaque grains of lizardite are abundant in the head sample. Light green (LG) crystals showed a similar composition in Mg and Si (EPMA) but variable contents of Fe, Ni, Cr, and a lower crystallinity (XRD). Some grains, showing the same EPMA features were more yellow brown (YB+LG). They were classified as altered lizardite. Indeed, they contain iron (and some traces of nickel and chromium) in low content (Table A3 in Appendix A.2.2).
Changes in colors and shapes are commonly interpreted as resulting from some alteration of the serpentine minerals [81,82,83,84]. The Mössbauer spectra on lizardite grains, altered or not, were fitted using three components, while antigorite and magnetite were fitted using two components, the hyperfine parameters of which are given in Table 3.
However, the identification of lizardite by Mössbauer analysis could not be fully satisfying when compared to literature data [81,82,83] as reported in Appendix A.2.2 (Table A2). This may be explained by the complexity of these natural minerals which, in addition to that, clearly contain some minerals inclusions and are not fully liberated (e.g., black dots on pale green grains seen on the lower picture of Figure A3; Appendix A.2.2). Lizardite was assigned after having confronted and combined all available data from this study.
A second class of serpentine mineral was represented by acicular green crystals of antigorite which were readily recognized (Figure A4, Appendix A.2.2). A third one was represented by platy, soft and fragile grains identified as being tremolite/actinolite with copperish tints (Figure A5, Appendix A.2.2). These crystals were also readily found in quite good abundance. A few conglomerates of mixed whitish silicates (optical observations and XRD) were also objectified. This study showed the presence of iron in each main serpentine minerals of the tailings sample studied.
Aside serpentine minerals, two spinel phases were identified with good confidence using Mössbauer spectroscopy in the sample: magnetite and chromite [84,85]. Magnetite is from far, the most abundant one and its Mössbauer response is characterized by typical sextets (Table 3 and Figure A6 in Appendix A.2.2). Room temperature hyperfine parameters obtained were consistent with data from the literature [85]. Trevorite (Ni, Fe-oxide) was also detected by EPMA on some spinel grains. Finally, it was noted that these oxides were often not liberated from silicates. This observation indicates that re-grinding of tailings prior to leaching could allow us to remove magnetite from the feed of the leaching stage as an efficient way to remove some of the iron. Chromite is non-magnetic and would remain in the feed of the hydrometallurgical process. As a conclusion, the variability of the spectral features of serpentine minerals reflects the complexity of the mineralogy of such environments, and this is consistent with what can be found in the literature [86,87]. Mössbauer and EPMA measurements indicate that some iron, chromium and nickel are distributed in many minerals, including magnesium bearing serpentine minerals.
  • Variable Fe2+/Fe3+ ratios in minerals:
Mössbauer spectroscopy allows us to quantify the distribution of ferrous and ferric iron in iron-bearing minerals from the various sets of sub-samples (magnetic, non-magnetic and fibers; cf. separation method explained in Section 2.2.1). In the magnetic sub-sample, oxide grains were hand-picked and analyzed. This study illustrates that up to 61% of iron reports to magnetite. The rest of the iron reports to non-magnetics iron-containing minerals which were not liberated from magnetite, or which were physically entrained with it. The feed subsample (159.4 mg) analyzed showed contents of 16% Fe3+ and 30% of Fe2+. A proportion of 53% of the iron is contained in magnetite and the rest is in serpentine minerals. A proportion of 61% of the iron is in magnetite in the magnetic fraction, with 14% of Fe3+ and 25% of Fe2+. In the sub-sample of the non-magnetic fraction, there was 30% Fe3+ and 70% Fe2+ and magnetite is absent. As a conclusion, although the sample shows some alteration in tailings stockpiles, the feed of leaching still shows reducing features with Fe2+ being systematically higher than Fe3+. This is consistent with what has been described in literature as well [82,83,86].

3.1.3. Geochemistry of the Head Sample

  • Major elements geochemistry by energy-dispersive X-ray fluorescence (XRF)
The major elements, expressed as oxides, are SiO2, MgO and Fe2O3, amounting to 36.1% ± 0.3%. and 40.4% ± 0.3% and 8.7% ± 0.3% respectively (Table 4). The LOI was found to be 12.96%. The whole-rock analysis ends up with total major oxide values between 98.53% and 98.87% (Appendix A.3, Table A5).
  • Geochemistry of metals followed during leaching by wet preparation and inductively coupled plasma mass spectrometry (ICP-MS)
Contents of the selected elements Mg, Al, Cr, Mn, Fe, Co, Ni in the head sample are reported in Table 5 and their contents will be tracked in the leaching products. Metals of interest were designated as magnesium (Mg), chromium (Cr) and nickel (Ni) with contents 9, 52 and 60 times higher than the Clarke levels [88], respectively. Iron (Fe), aluminum (Al), manganese (Mn) and cobalt (Co) were also recorded because Fe, Mn and Al secondary minerals (or precipitates) may have significant impacts on filterability and accompanying CSM hydrometallurgical extractions.
The analytical series (An. Series) refers to the certificates 29,400 A, B, C (Table A5 and Table A6) in Appendix A.3. These were first set of results. Aluminum analysis was particularly difficult to analyze quantitatively. After the analytical method has been improved, the relative mean deviation results on triplicates for the W-series, as compared to the analytical series (An. Series; Table 5), are 0.7% for Mg, 4% for Fe and Mn, 22% for Al, 5% for Cr, and 3% for Ni. For the D-series (Table 5) standard deviation results are 6.5% for Mg and Ni, 9.5% for Cr, 2% for Fe and Mn, and 0.3% for Al. These standard deviation values are indicative of an uncertainty level better than 10–20% on experimental results for most targeted elements.

3.1.4. Check of the Homogeneous Division Quality

For both W- and D-series of samples to be leached, the similarity of particle size distribution and the geochemistry of several sub-samples after the division of sub-samples indicated that divided batches were homogeneous and well mixed. The risk of having different batches during leaching tests is therefore low (see also PSD, Figure 2).

3.2. Leaching Experiments and DOE Treatment of Data

3.2.1. Metals Leached from the W-Series Feeds

The experimental conditions based on central composite design (CCD), as well as their corresponding metal recoveries, are presented in Table 6. Results show mass percentages of the leached metals and include Mg, Al, Cr, Mn, Fe, Co, and Ni. The range of recoveries is broad for each individual metal and covers from almost zero to a full recovery. This is a good indication that the test design and parameters ranges were well selected, hence the effect of each parameter could be observed.
Knowledge of the mineralogy of the feed and the applicable mechanisms in HCl acidic medium can help better understand the leaching recoveries, while statistical models offer a quantitative expression of the measured effects. Asbestos tailings consist of a structure formed by the alternate stacking of tetrahedral silica layers and octahedral brucite [Mg(OH)2] layers, which are linked into sheets. Under acidic conditions, the brucite layers of Mg(OH)2 dissolve from the asbestos, leaving behind the silica as a residual product. Leaching involves the dissolution of minerals using HCl. The dissolution reaction of Mg2+ ions leached from asbestos tailings in HCl solution can be expressed as follows (Equation (2)):
M g 3 S i 2 O 5 O H 4 + 6 H C l 3 M g C l 2 + 2 S i O 2 + 5 H 2 O
In this reaction, the magnesium silicate minerals react with hydrochloric acid to produce magnesium chloride, silica, and water. Hydrochloric acid also reacts with various impurities to produce different products, according to the following equations (Equations (3)–(5)):
F e 2 O 3 + 6 H C l 2 F e C l 3 + 3 H 2 O
C a O + 2 H C l C a C l 2 + H 2 O
A l 2 O 3 + 6 H C l 2 A l C l 3 + 3 H 2 O

3.2.2. Statistical Analysis of Leaching

An analysis of variance (ANOVA) was conducted to determine the effects of individual parameters and their interactions on metals recoveries. Table 7 and Table 8 present the results for magnesium (Mg), the most valuable component of the feedstock, and iron (Fe), the primary impurity (or co-product eventually, depending on the easiness of removal as a useful product downstream). The F-values, along with their associated p-values, indicate the strength and significance of each factor: p-values < 0.005, 0.01, and 0.05 correspond to confidence levels of at least 99.5%, 99%, and 95%, respectively [89]. These values suggest that the model constitutive terms are meaningful, and the residual errors are negligible. In this analysis, HCl concentration (A) and temperature (C) were identified as significant contributors. A strong interactive effect was observed between acid concentration (A) and the solid-to-liquid ratio (B), indicating that the influence of one depends on the level of the other. The overall model fit was sound, with no significant lack of fit. Despite varying levels of statistical confidence, acid concentration and temperature consistently played critical roles in Mg recovery. The smallest p-values for Mg and Fe highlight these two factors as the most influential. For Mg, the interactions AB (acid concentration × solid-to-liquid ratio) and AC (acid concentration × temperature) were important. For Fe, the same interactions were relevant, along with BC (solid-to-liquid ratio × temperature). A more detailed discussion of these interactive effects follows in the next subsections.
The following equation (Equation (6); Table A7 in Appendix B) was proposed to predict magnesium (Mg) recovery based on acid concentration, temperature, and the solid-to-liquid ratio. Since the coefficients in the equation reflect the importance of each parameter, temperature has the greatest impact.
M g   r e c o v e r y %     = 6.58 H C l   C o n c . 1.68 S o l i d   t o   l i q u i d   r a t i o   + 0.33 T e m p e r a t u r e + 0.19 H C l   C o n c . S o l i d   t o   l i q u i d   r a t i o   + 0.08 H C l   C o n c . T e m p e r a t u r e + 59.57

3.2.3. Effect of Individual Factors on Metal Recovery

Figure 3 shows how the concentration of acid, the solid-to-liquid ratio, and temperature affect the recovery of magnesium (Mg), the primary metal of interest, and iron (Fe), the main impurity. Increasing the HCl concentration positively affects the leaching of both metals, especially Fe recovery, up to approximately 8 M. Beyond this concentration, however, the effect plateaus. Increasing the HCl concentration from 2 M to 12 M improved Mg recovery from 40% to 65% and Fe recovery from 20% to 75%. This indicates that higher acid concentrations significantly enhance metal extraction. A similar pattern is observed with temperature: higher temperatures increase the leaching efficiency of both Mg and Fe, though the effect on Fe diminishes beyond 55 °C. In contrast, the influence of the solid-to-liquid ratio appears relatively minor and slightly negative. The observed trends in Mg recovery as a function of acid concentration and temperature align with the findings of Baigenzhenov et al. [56], who reported up to 92% Mg extraction from serpentine using 25% HCl (6.8 M), a solid-to-liquid mass ratio of 4:1, and three hours of leaching at 80 °C. Similarly, Shayakhmetova et al. [47] achieved maximum Mg and Fe recoveries of 96.0% and 87.8%, respectively, in a pilot-scale HCl leaching trial using 18% HCl (5.4 M) on chrysotile asbestos waste at 85 °C for two hours.
A significant factor in the leaching process is the concentration of reagents, as it affects both the rate and efficiency of metal extraction from the feed. The positive effect of acid concentration is explained by referring to Equations (2) and (3) and knowing the fact that the more the reagent is available, the better chance of pushing the leaching reaction forward. The impact of reagent concentration on the leaching efficiency in HCl system can be attributed to both H+ and Cl ions. The increase in hydrogen ions significantly influences the rate of metal extraction by making the system more acidic (improving the acidolysis leaching mechanism). However, the chloride anions are strong complexing reagents and can increase the solubility and mobility of the metals in the system. Therefore, Cl concentration is important when evaluating the behavior of dissolved elements. In addition to the thermodynamics of the system, it was suggested that kinetic limitations and the need for the reagents to diffuse through the unreacted core of the chrysotile particles are the other major role players [47]. Having more reagent volume available in the bulk of the system can potentially help with their diffusion into the particles and increase the metal recovery.
Although the impact of pulp density is limited, at higher ratios (e.g., 40%), the recovery of magnesium (Mg) and iron (Fe) decreases to approximately 50%. This is primarily due to reduced acid availability per unit mass of solids. The limited liquid phase restricts contact between the reagents and solid particles, hindering dissolution. Conversely, lower solid-to-liquid ratios increase the amount of available acid relative to the solids, promoting more efficient leaching. While this parameter’s influence seems modest compared to acid concentration or temperature, its importance becomes clearer in the context of parameter interactions, to be examined in the next subsection.
Increased temperatures from 20 °C to 90 °C prompted metal extraction and increased Mg recovery from 20% to 80%. This improvement is largely because of the increased reactivity of acids with the brucite serpentine moiety at higher temperatures. The greater abundance of magnesium relative to iron in the feedstock may also explain why temperature has a more pronounced effect on magnesium recovery. Baigenzhenov et al. [60] reported that the chemical interaction between hydrochloric acid and the silicate matrix is significantly promoted during chrysotile HCl leaching at elevated temperatures (40 °C to 100 °C). Their thermodynamic analysis revealed that the Gibbs free energy (ΔG) of the reactions governing SiO2 dissolution and chrysotile decomposition becomes increasingly negative with rising temperatures, thereby enhancing metal liberation, especially magnesium. In contrast, iron (Fe) recovery showed only modest improvement beyond 70 °C. This plateau may be due to the accumulation of FeCl3 in the solution approaching saturation, as described by Equation (3), thereby limiting further dissolution.

3.2.4. Analysis of Interactive Factors on Metal Recovery

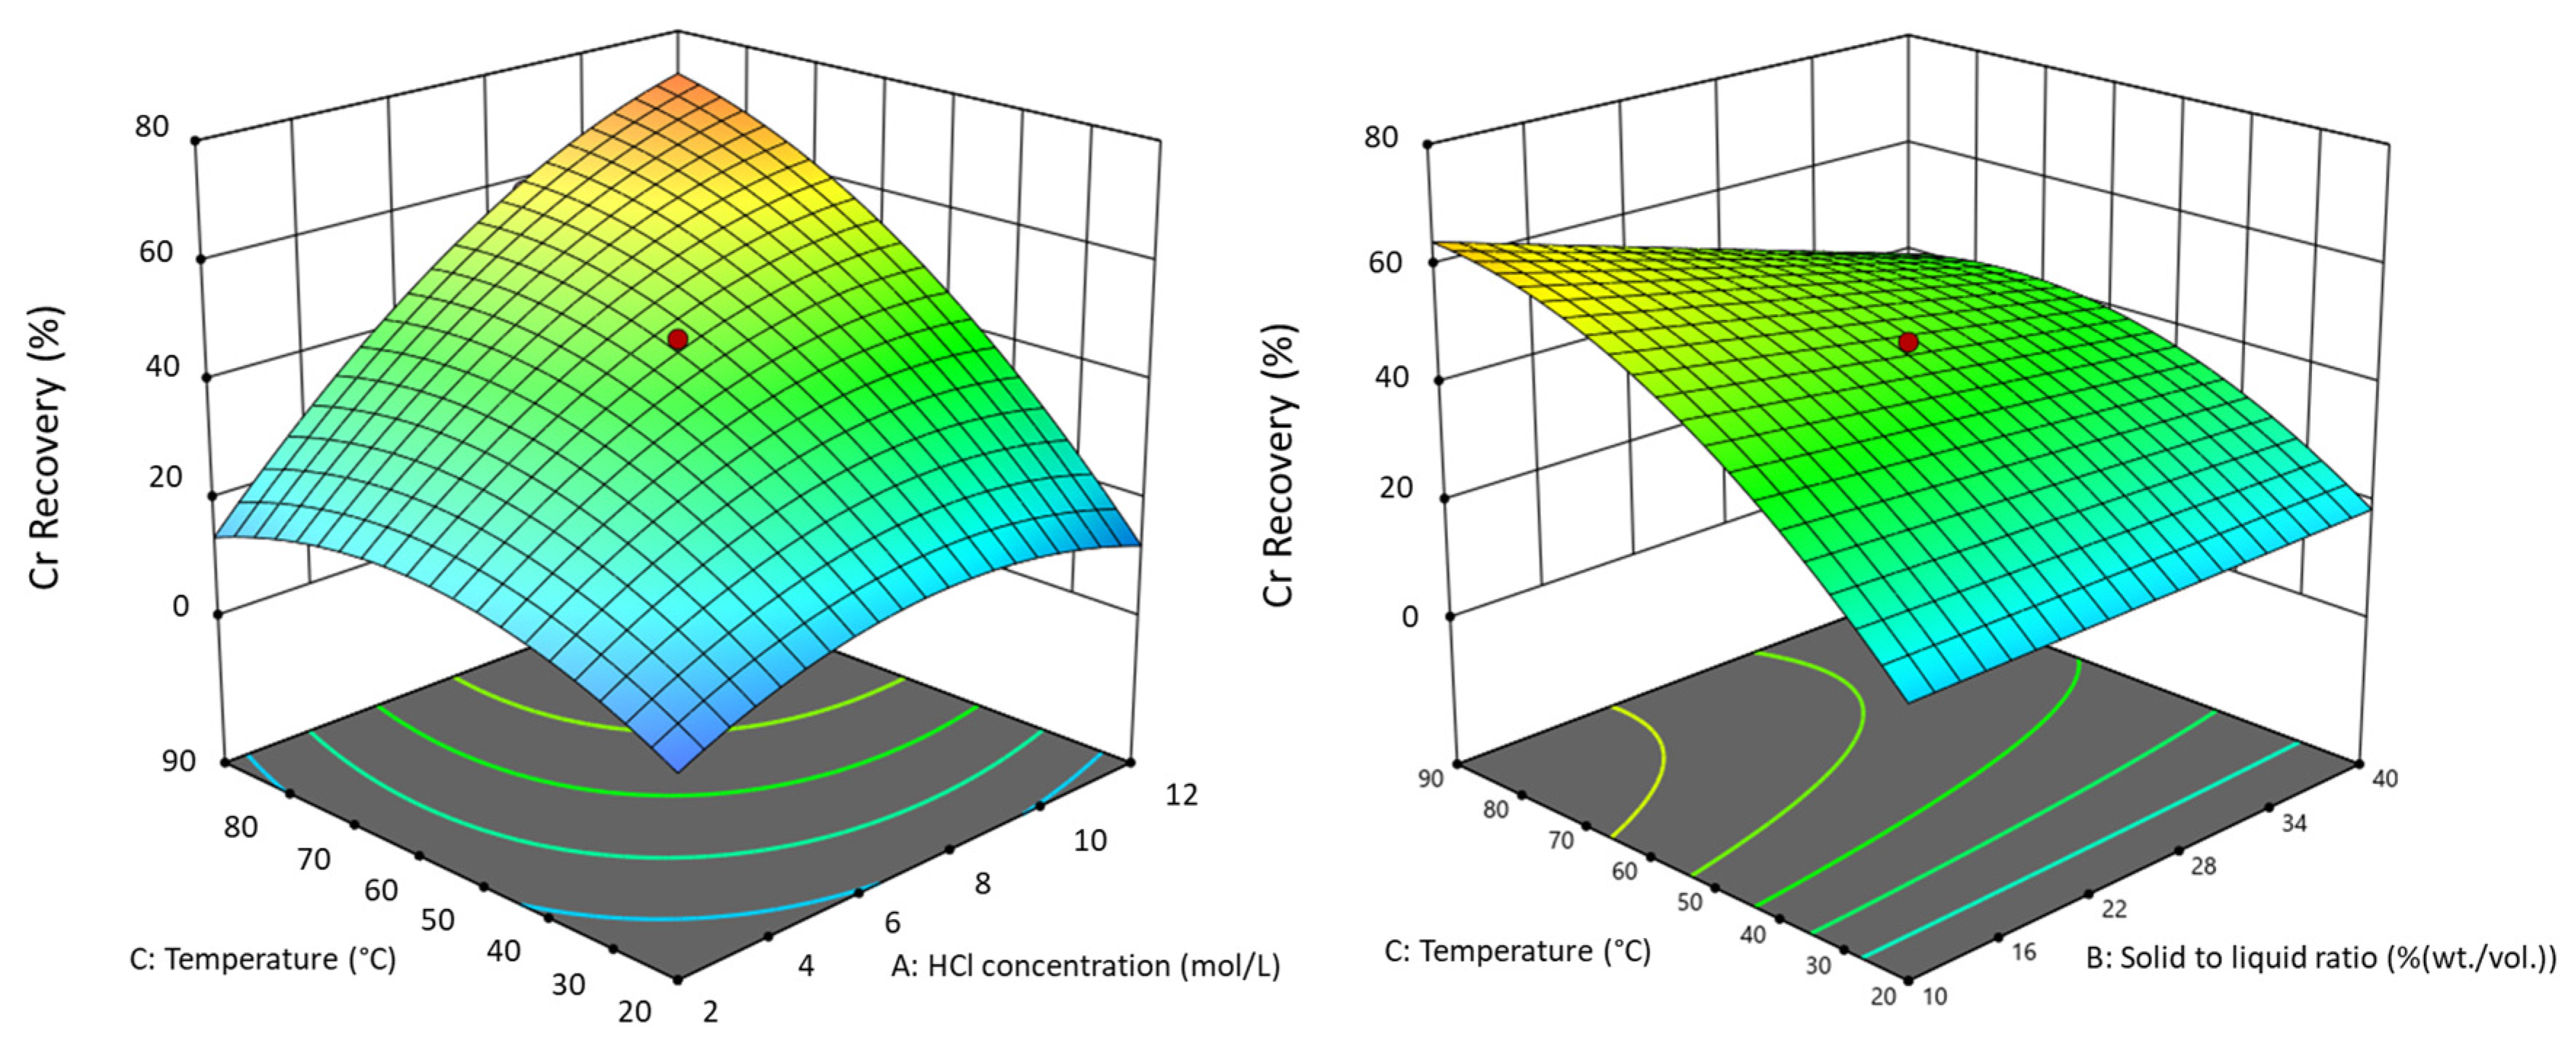
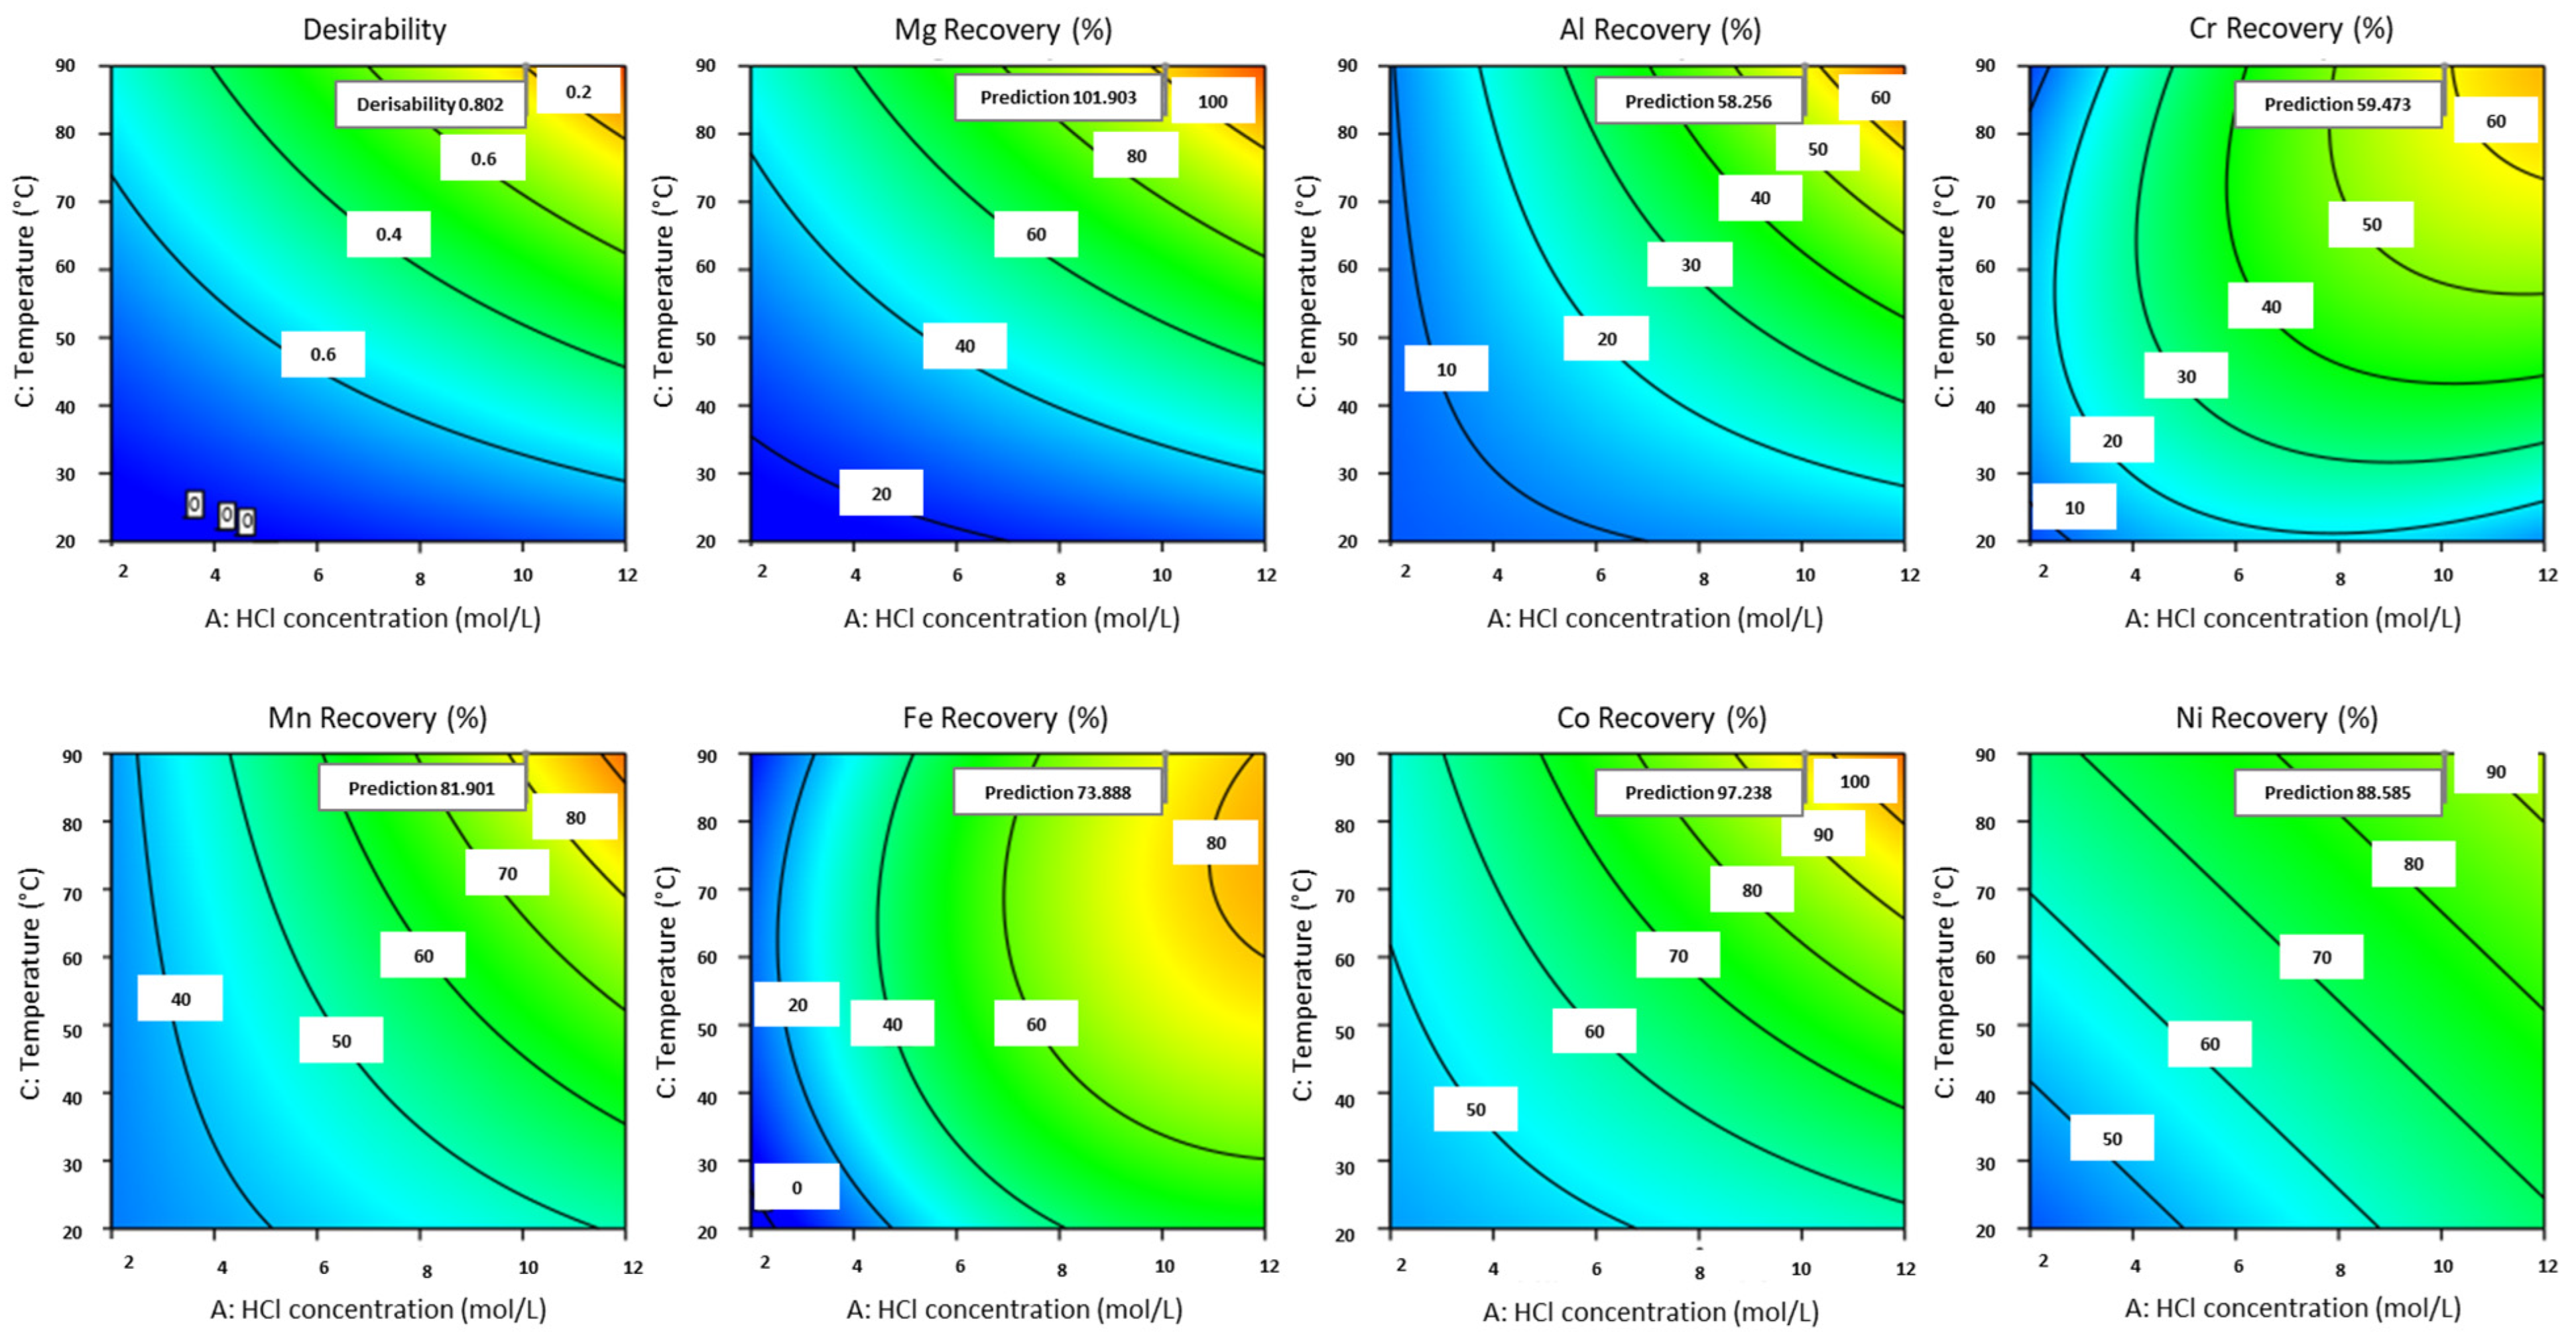
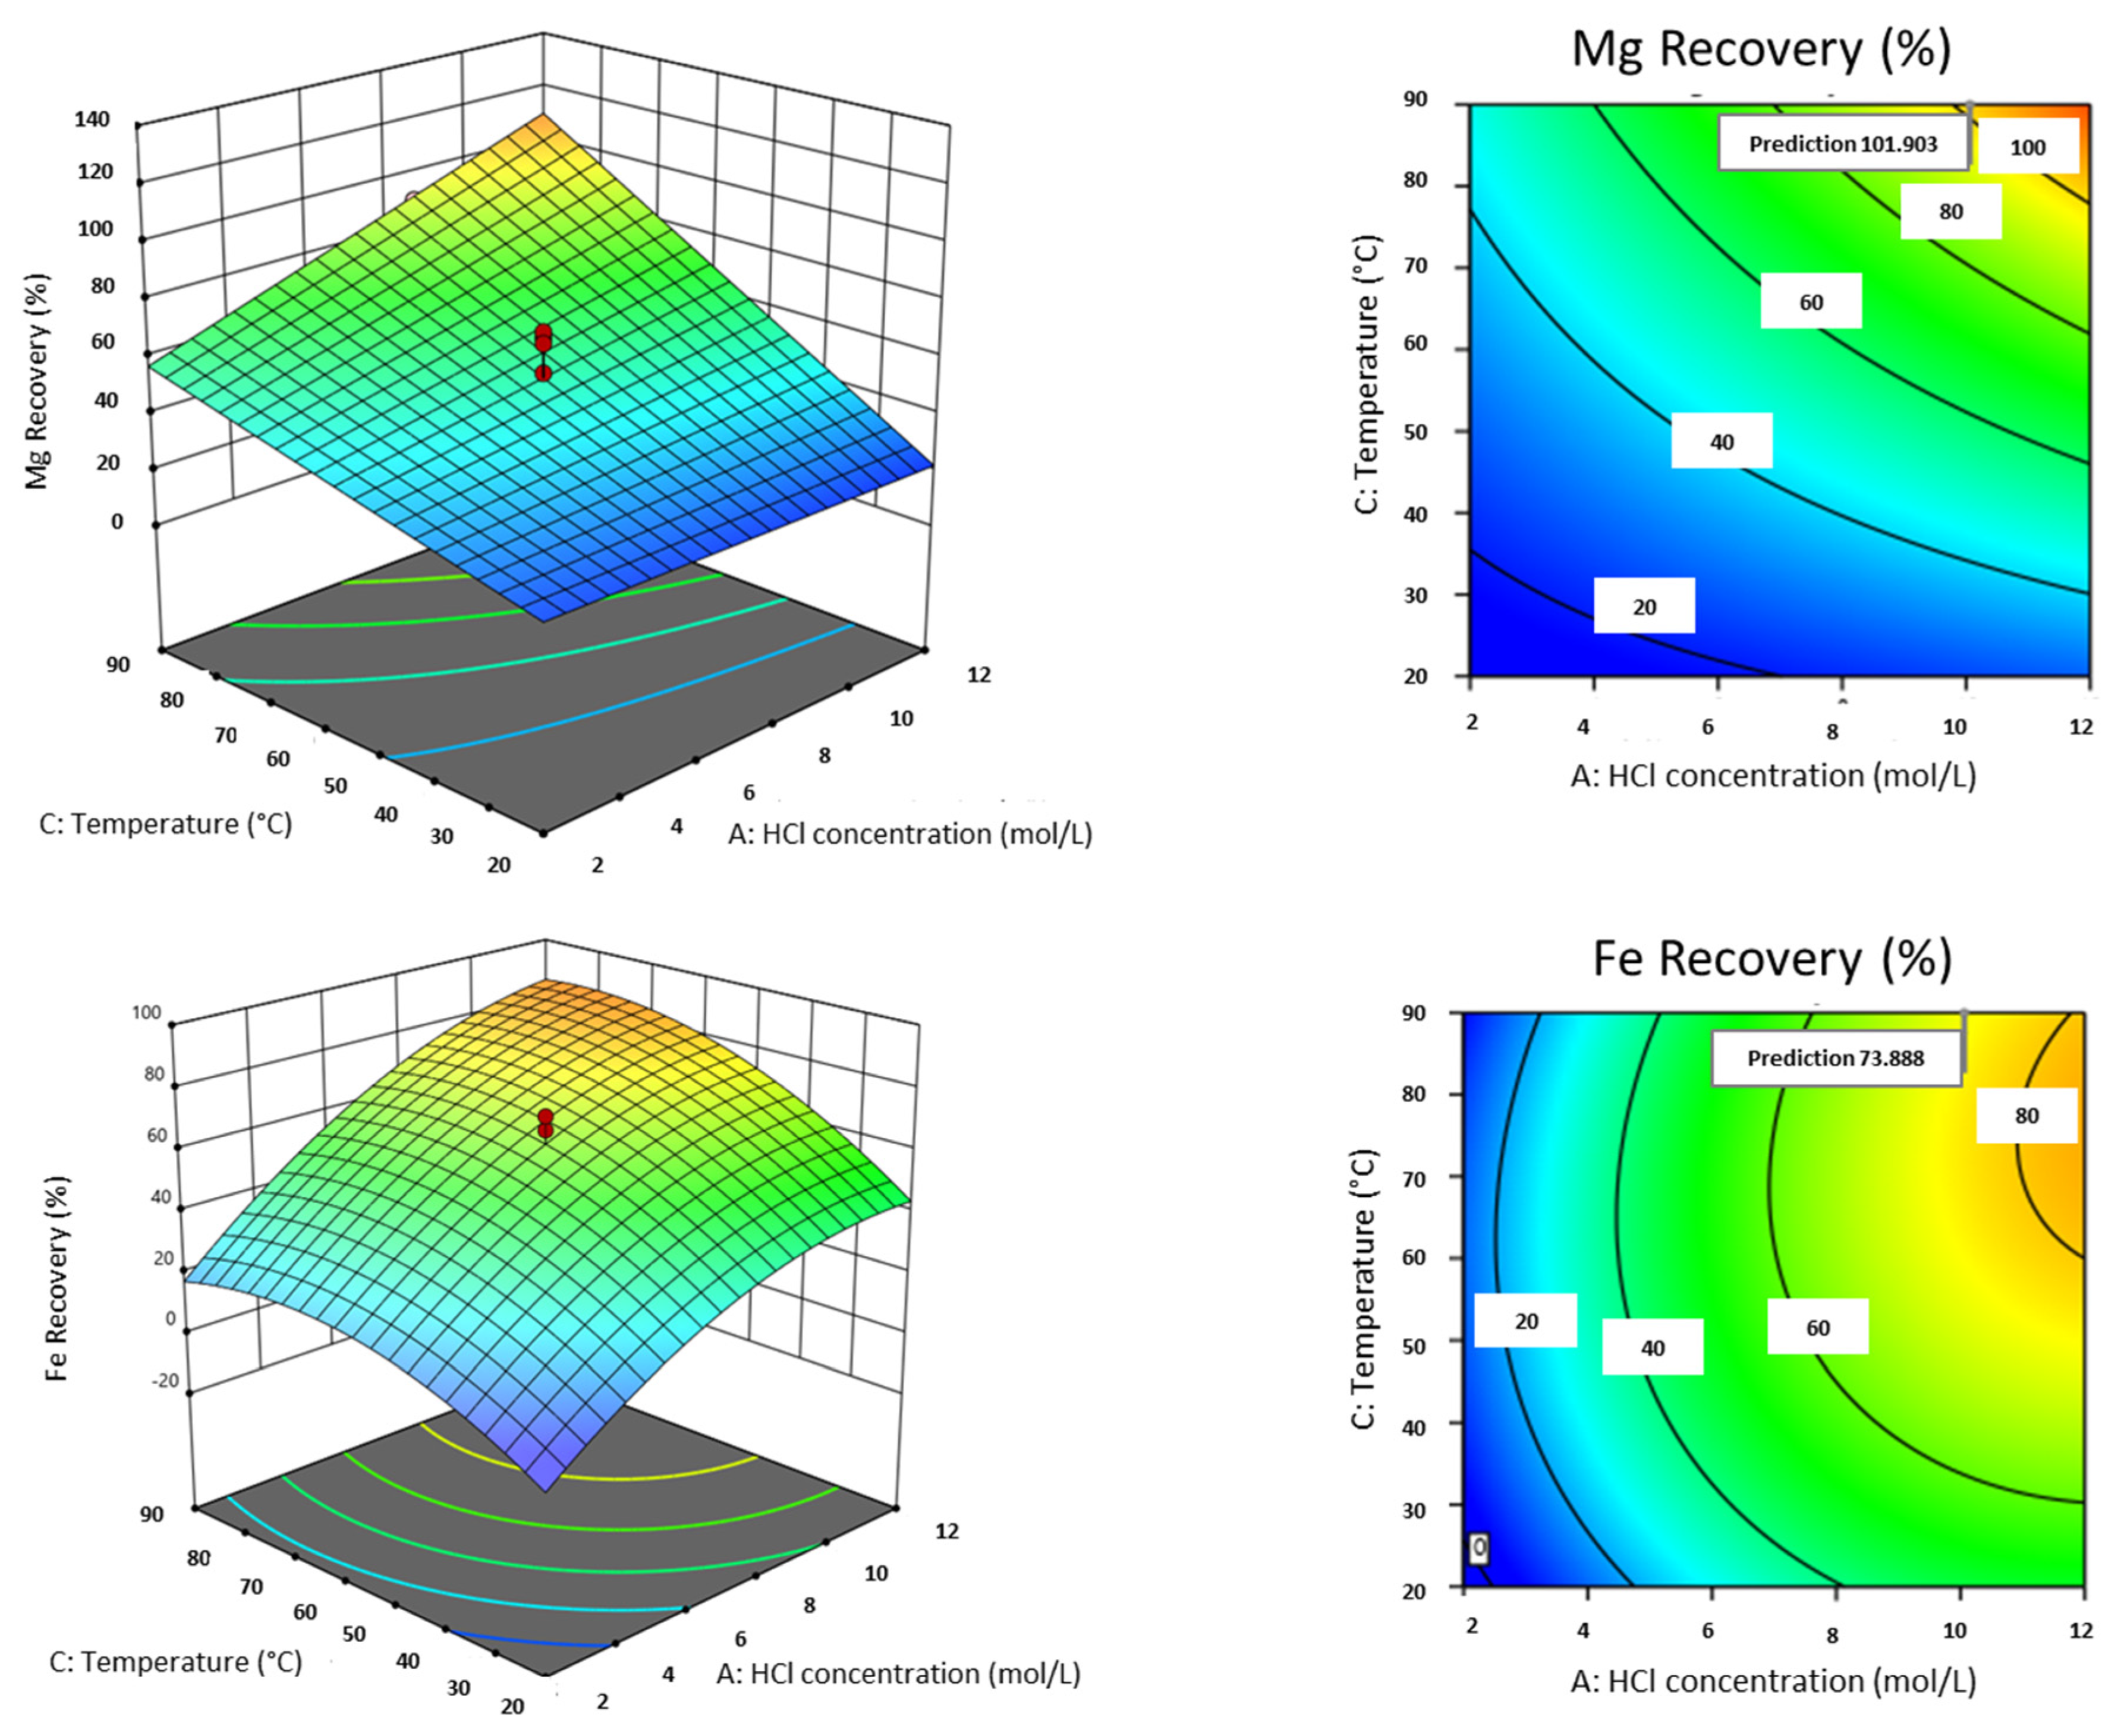
The efficiency of metal recovery can be affected by more than a single factor effects. Interactions between factors like acid concentration and solid to liquid ratio (AB), acid concentration and temperature (AC), and solid-to-liquid ratio and temperature (BC) were studied here. Figure 4 illustrates the interactive influence of acid concentration and temperature on Mg and Fe recovery in both 2D and 3D view when solid-to-liquid ratio is held constant. The results clearly indicate that the interaction effect of these factors is significant and positive. This means that the effect of temperature increases with rising acid concentration, suggesting that both higher acid concentration and elevated temperature enhance metal recovery. On the other hand, at lower temperatures, HCl concentration did not affect Mg recovery significantly, where this effect of acid concentration on Mg recovery was almost 50% greater when temperature was higher, which agrees with the findings of other researchers in literature [75,76]. A similar behavior, but less intense, was observed for Fe leaching. Both parameters of acid concentration and temperature, up to 70 °C, increase Fe leaching efficiency and temperature seems to have no influence on Fe leaching when acid concentration is lower than 4 M. To see the effect of parameters on the recovery of other metals, refer to Appendix B.
Higher acid concentrations and elevated temperatures enhance metal dissolution by increasing proton activity, accelerating metal dissolution kinetics, as well as making thermodynamics more favorable [47,56]. While these conditions favor the release of Mg2+, they also lead to greater acid consumption and higher neutralization demands [75].
The dual effect of acid concentration and solid-to-liquid ratio at a constant temperature on Mg and Fe recovery is presented in Figure 5. Changing the solid-to-liquid ratio from 10% to 40% has little negative effect on magnesium recovery when acid concentration is at the lowest level. This influence was slightly different when a high solid to liquid ratio of 40% was used. In this condition, an increase in the molarity of acid could meaningfully influence the Mg recovery: the increase was from about 50% at 2 M to almost 100% at 10 M. At higher solid to liquid ratio, more solid is available to be leached therefore there is higher concentration of dissolved metals in the system compared to when there is less feed available to be leached. The behavior for iron in response to the interactions between acid concentration and solid to liquid ratio is as expected. In the graph related to Fe leaching, both parameters of solid-to-liquid ratio and acid concentration have an influence on metal recovery. The graph reveals that as acid concentration increases and solid-to–liquid ratio goes down, iron recovery increases significantly.
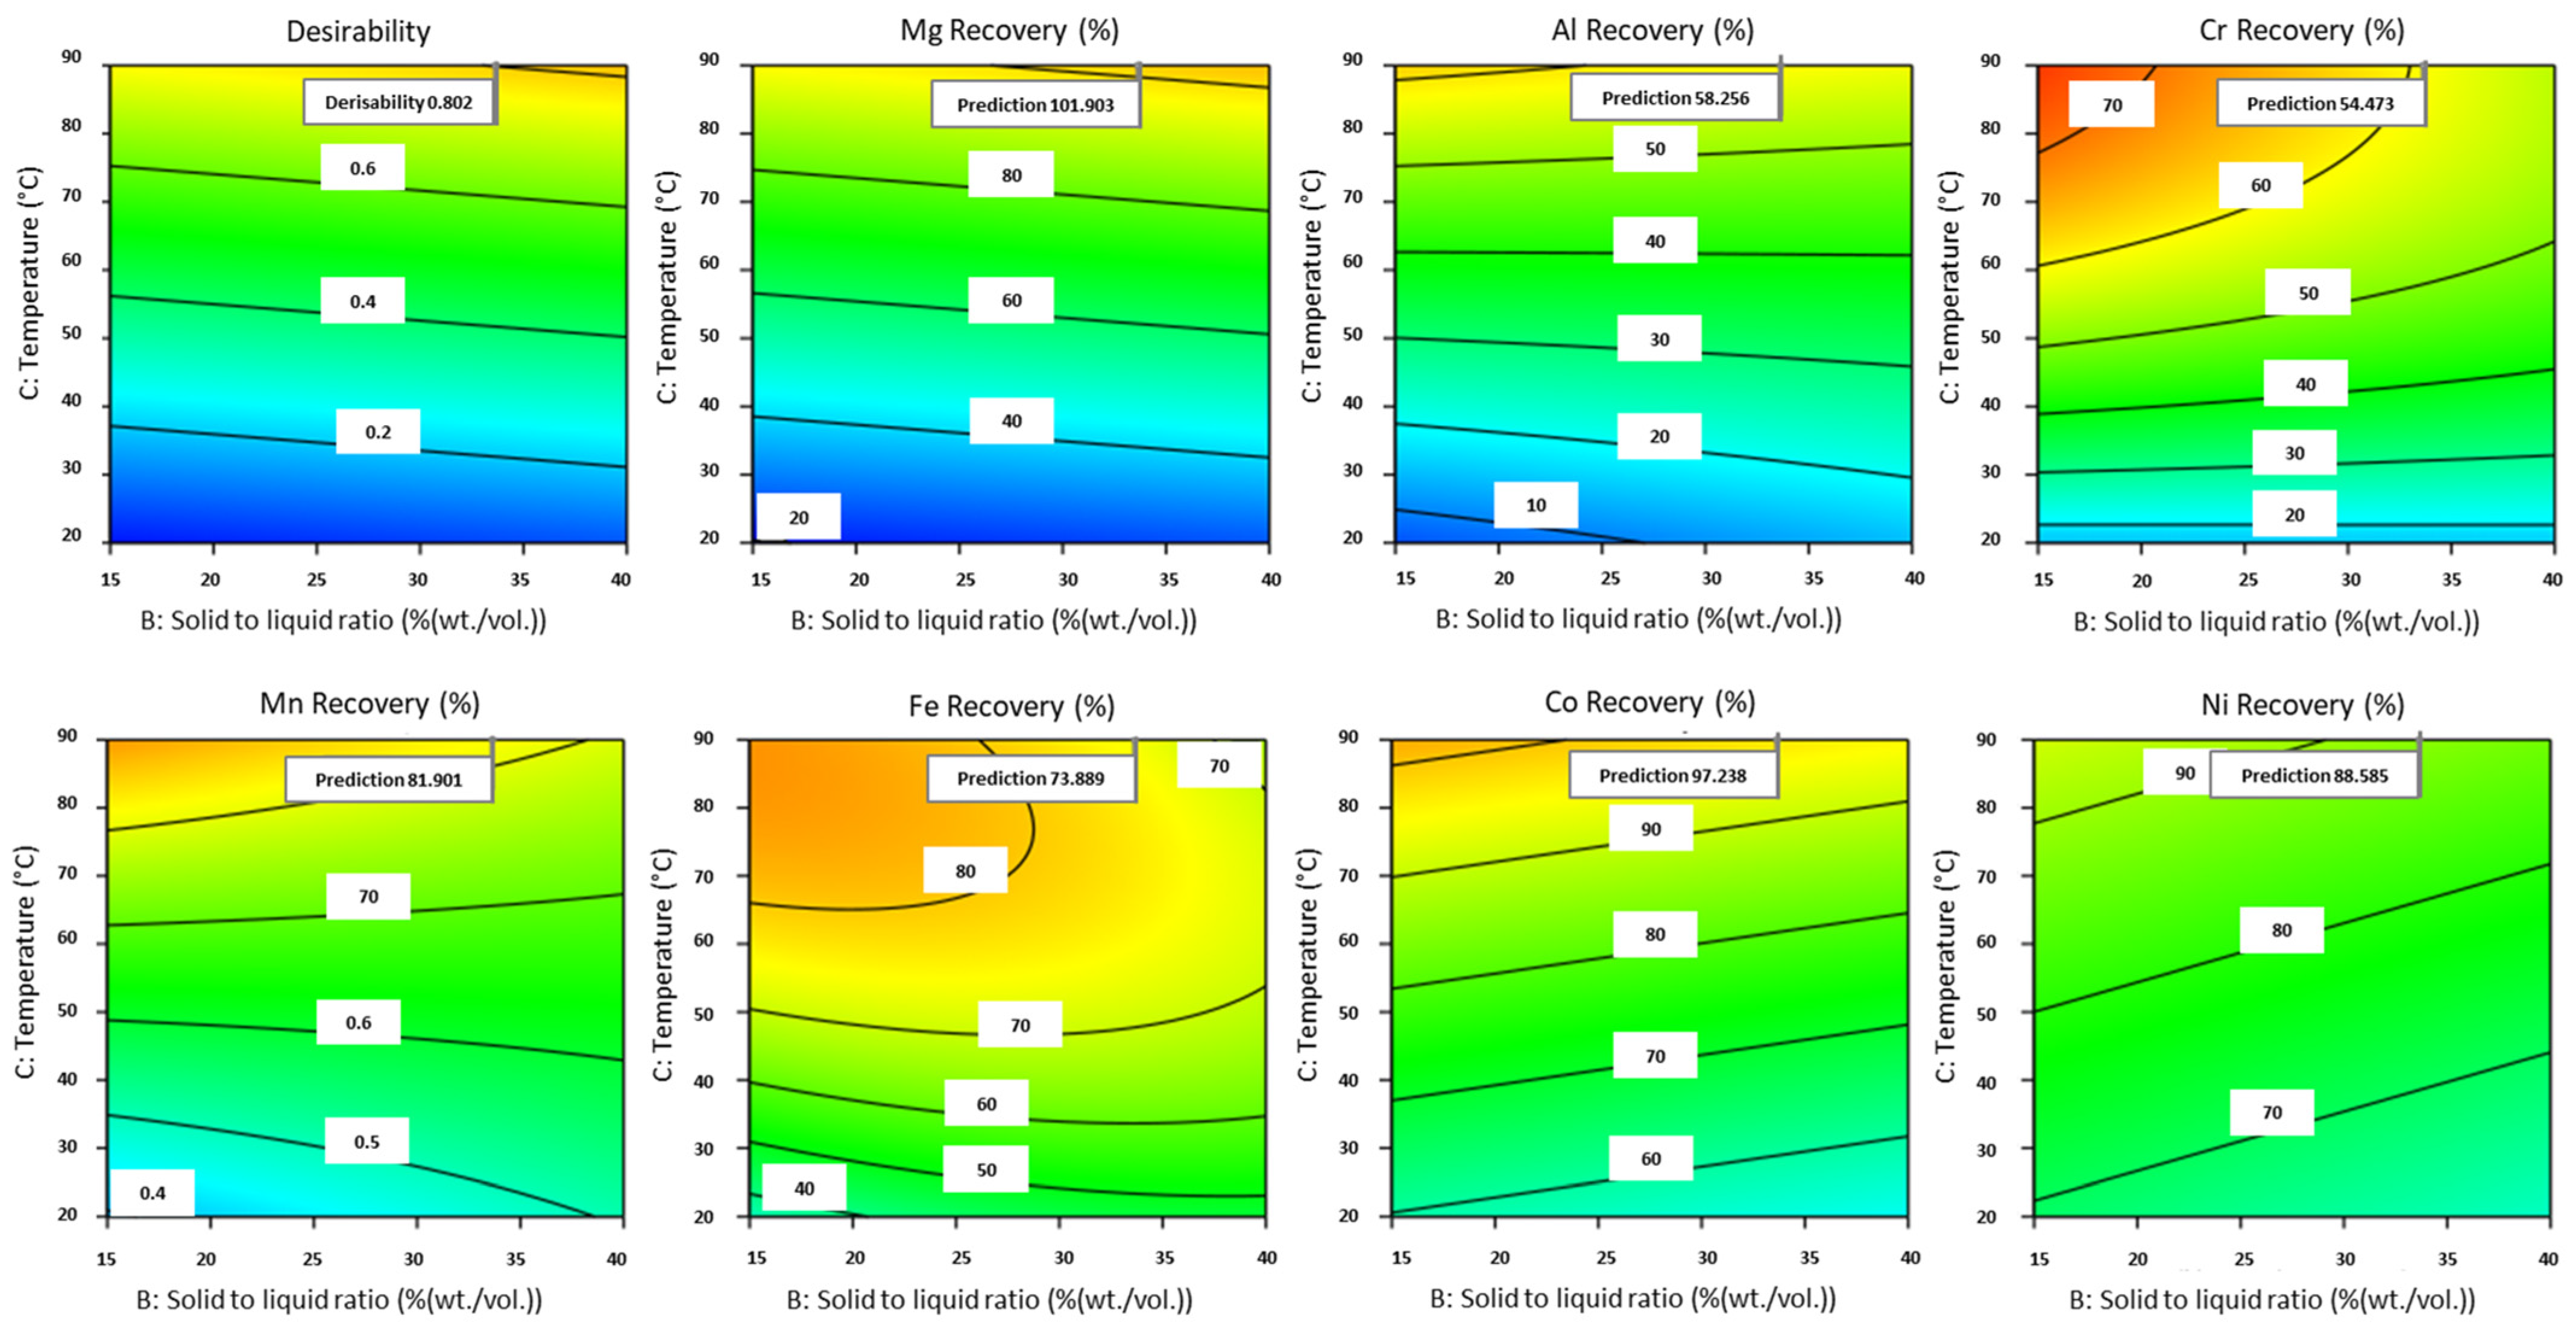
The effect of the interaction between temperature and solid to liquid ratio on leaching behavior is shown in Figure 6. The graphs reveal that elevated temperatures and higher solid to liquid ratios lead to greater Mg recovery. However, the parameters do not seem to have any interactions (as BC was not selected as a significant interaction in the ANOVA Table 6). The effect of temperature suggests that Mg release in leachate is controlled by the activation energy of the reaction. As temperature increases, the thermal excitation of many more species drives the reaction to overcome the activation barrier, and the reagent becomes more mobile (diffusion and transport of the lixiviant and ions become faster). The positive effect of a higher solid-to-liquid ratio on Mg recovery may indicate that the particle-particle interactions stimulate further the interparticle mass transfer of secondary Mg-products out of the particle surface and result in a new fresh surface ready to react with the leaching acid. In the case of Fe, solid-to-liquid ratio has no meaningful effect on metal recovery if temperature is less than about 50 °C; however, as temperature increases, a negative effect of solid-to-liquid ratio becomes evident. This may be due to reduced reagent availability at higher solid-to-liquid ratios, limited reagent access to reactive sites, and/or the formation of stable, non-friable, iron-rich precipitates on leached particle surfaces. This indicates that a significant fraction of the iron present in the feed sample is occurring in minerals that do not contain Mg. The mineralogy shows a significant amount of magnetite which could explain that.
The graphs also show that an increase in the solid to liquid ratio leads to lower recovery of Fe while the recovery of Mg is not significantly affected by this factor. Noteworthy, applying both a high temperature and a high solid-to-liquid ratio (Figure 6) is even more favorable to high recovery of Mg and a lower recovery of Fe. This suggests the possibility to optimize the leaching of Mg in a selective way regarding Fe.

3.2.5. Behavior of CSM (Cr, Ni, Co, Mn) and Al

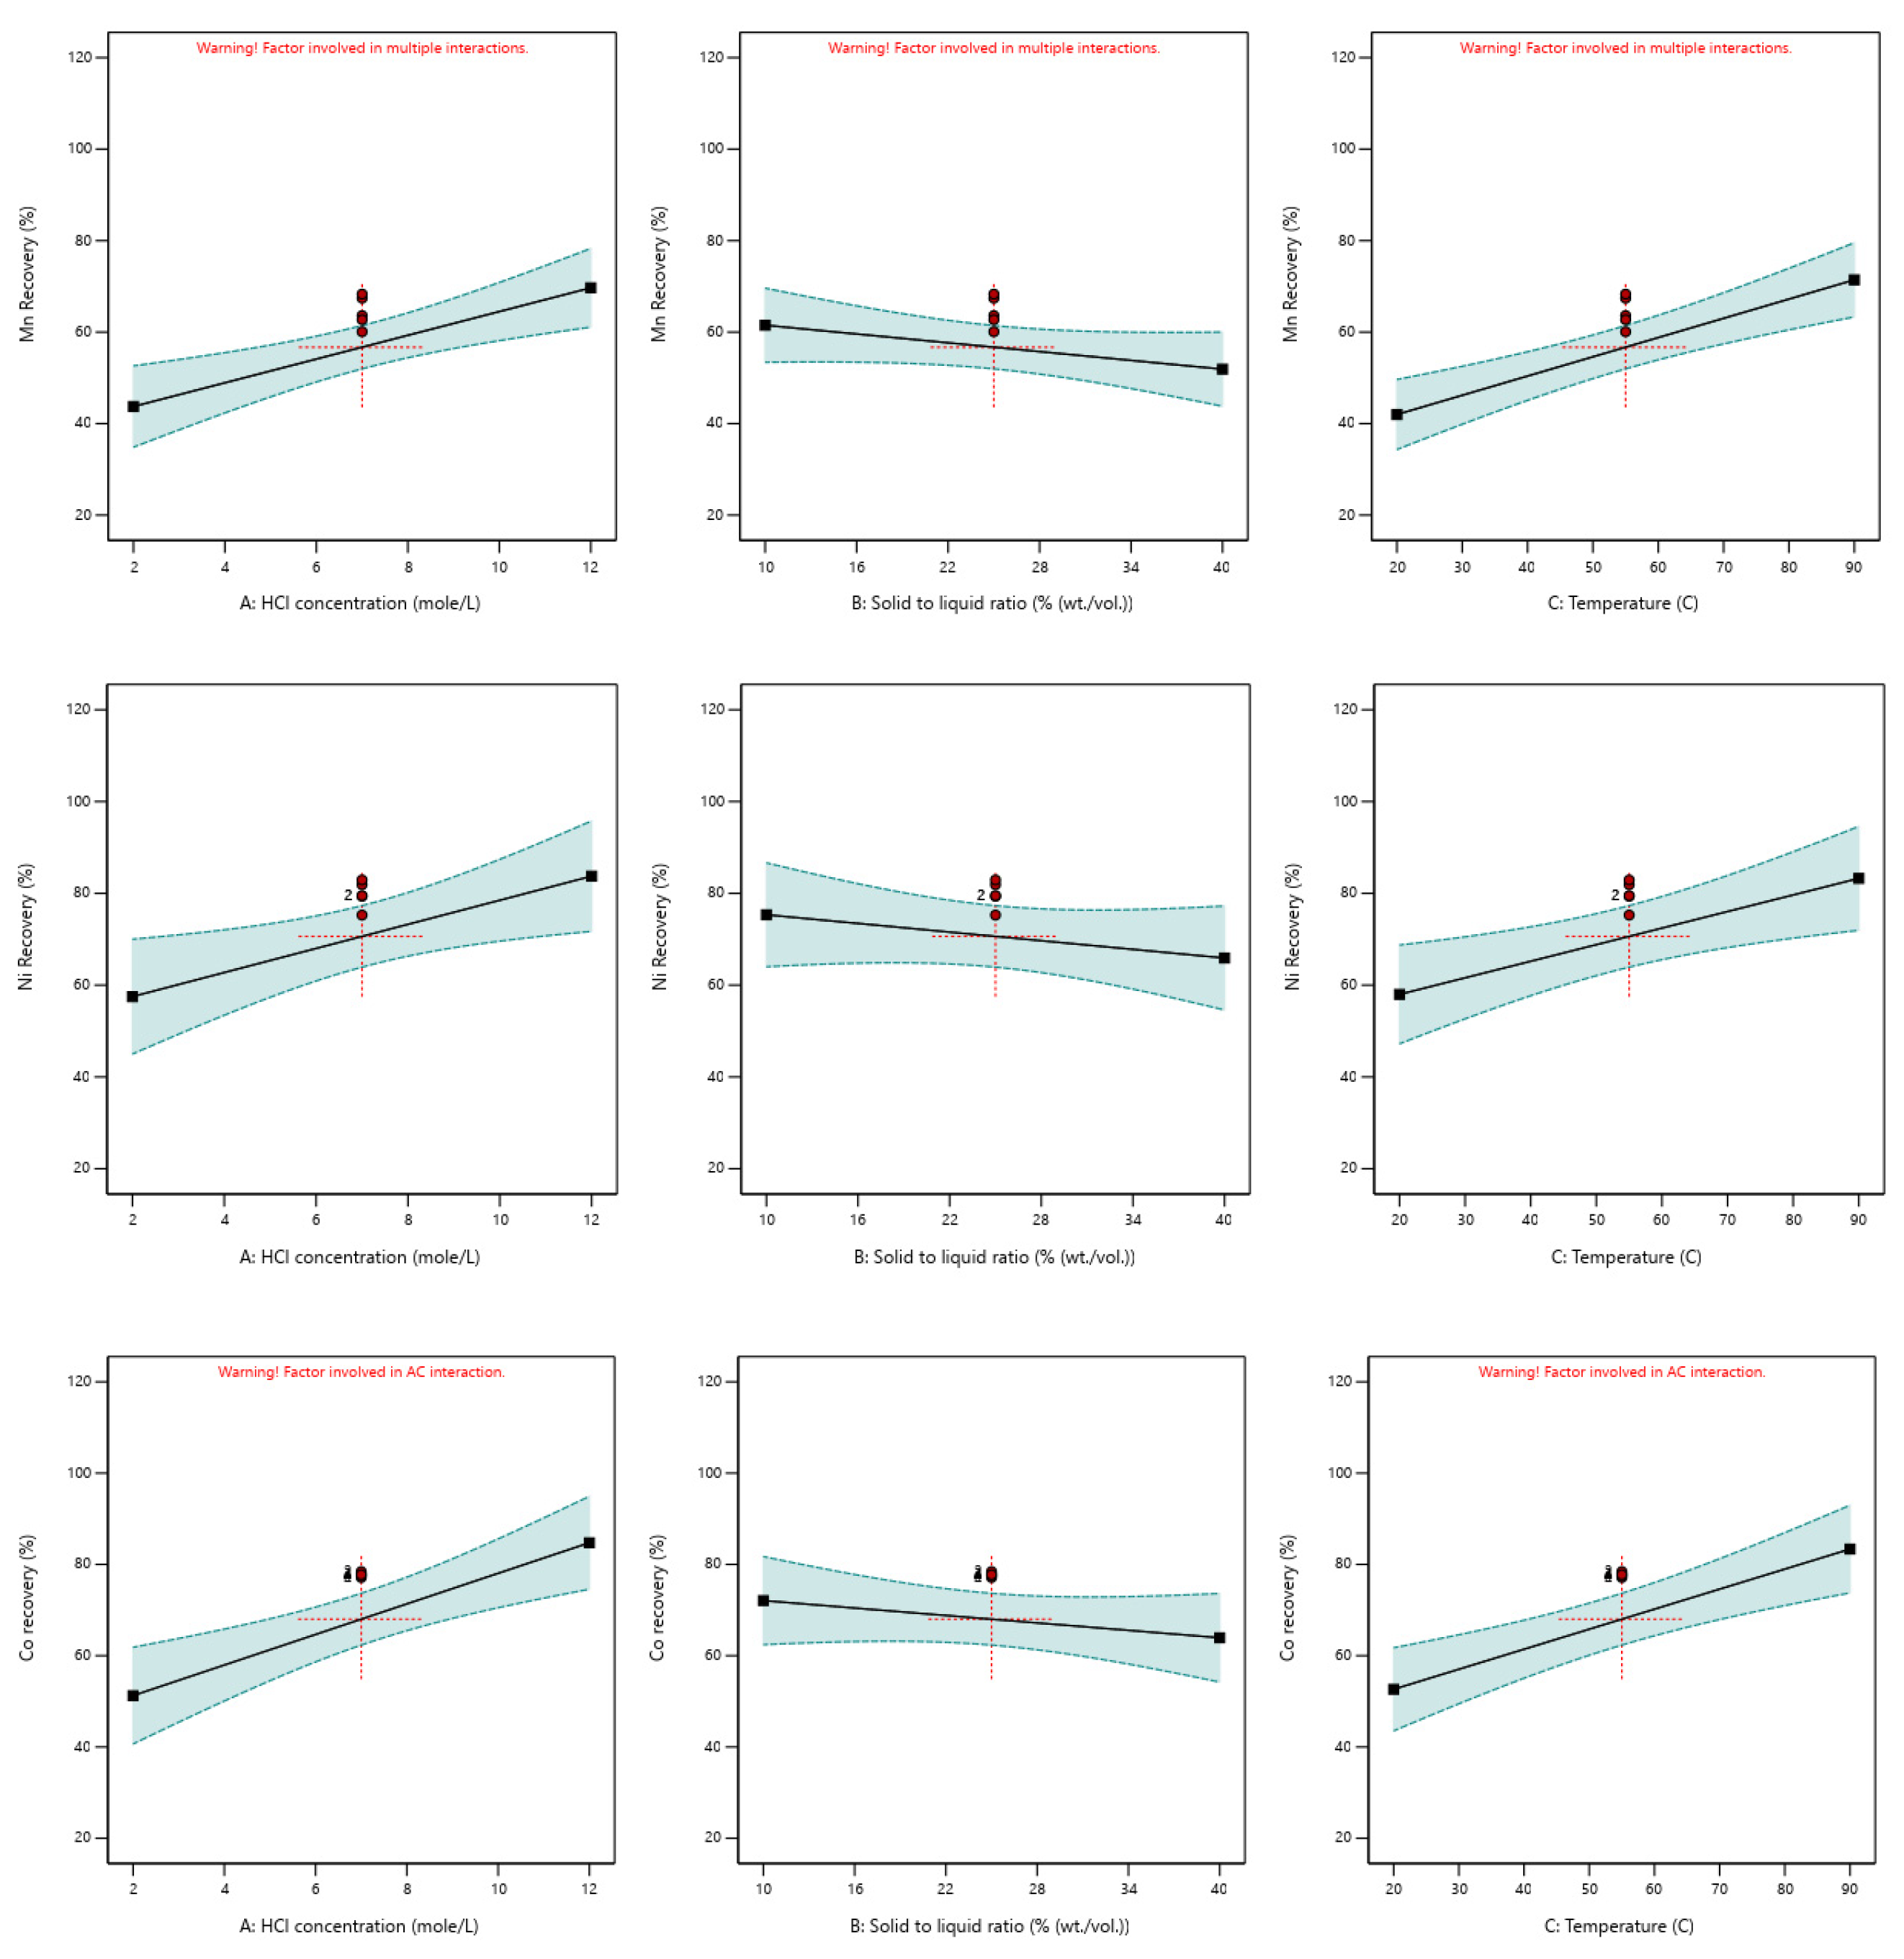
Although chromium behaves similarly to iron under leaching conditions, it is more challenging to recover (Figure A8, Figure A9, Figure A11, Figure A12 and Figure A13 in Appendix B). Higher chromium recovery is observed at elevated temperatures and lower solid-to-liquid ratios (Figure A8, Figure A9, Figure A11 and Figure A13). This may be due to the refractory nature of chromite, the primary chromium-bearing mineral in the feedstock, indicating that the phase controlling chromium leaching is different from the phase governing iron dissolution.
The behavior of Al, Ni, Co, Mn under leaching conditions is close to Mg one regarding HCl concentration and temperature (Figure A10, Figure A11, Figure A12 and Figure A13 in Appendix B). However, a lower solid to liquid ratio is favoring Al, Ni, Co, Mn release.

3.2.6. Parameter Optimization

The desirability function approach was used to determine the maximum values of input variables to achieve optimal performance for one or more responses (metal leaching efficiencies). During the optimization phase, each response is translated into a unique desirability function. The highest ideal response is represented by a value of 1, with the function ranging from 0 to 1, intermediate value indicates results that are roughly acceptable [63,90,91].
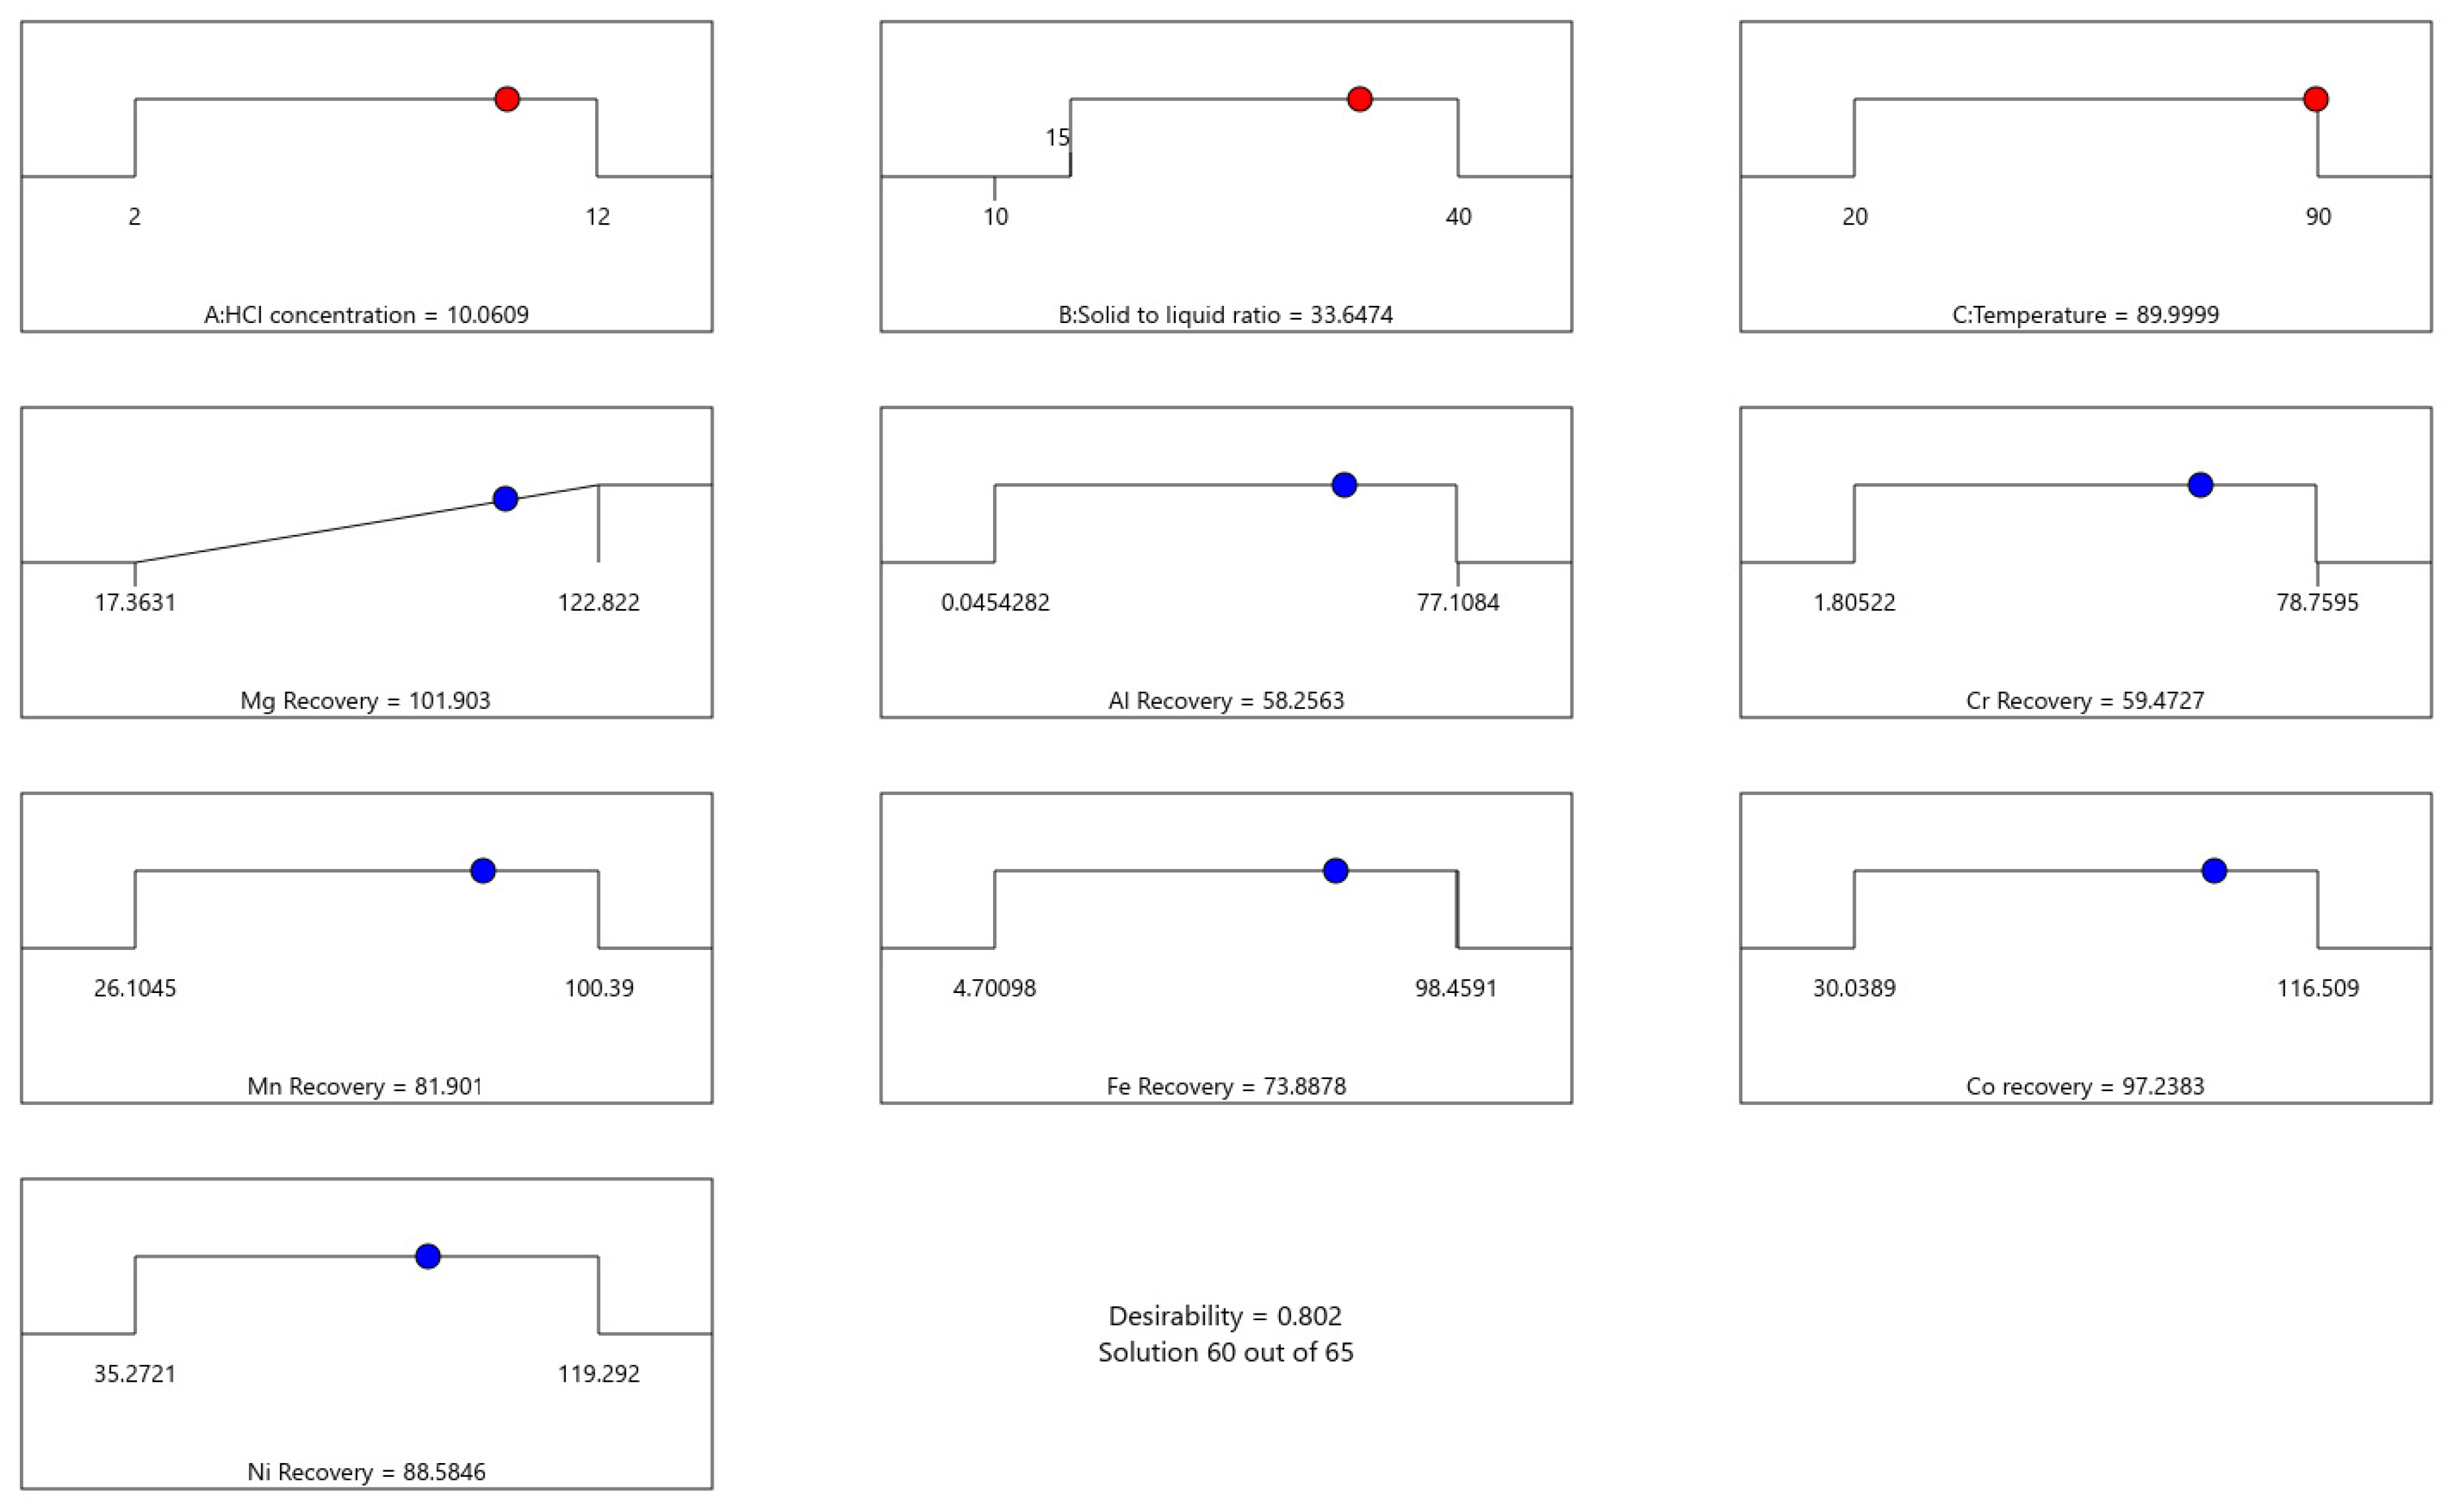
Figure 7 illustrates the independent variable in response surface methodology. By adjusting the parameters for maximum magnesium (Mg) leaching, we determined the operating conditions and the desired outcome. The model predicts full Mg recovery under operating conditions involving HCl concentrations ranging from 10 to 12 M, a solid-to-liquid ratio ranging from 33.6% to 40%, and a temperature of 90 °C. The desirability value of 0.80 demonstrates the applicability of the developed model.

3.3. Experimental Validation and Sensitivity Analysis Around Optimal Experimental Conditions

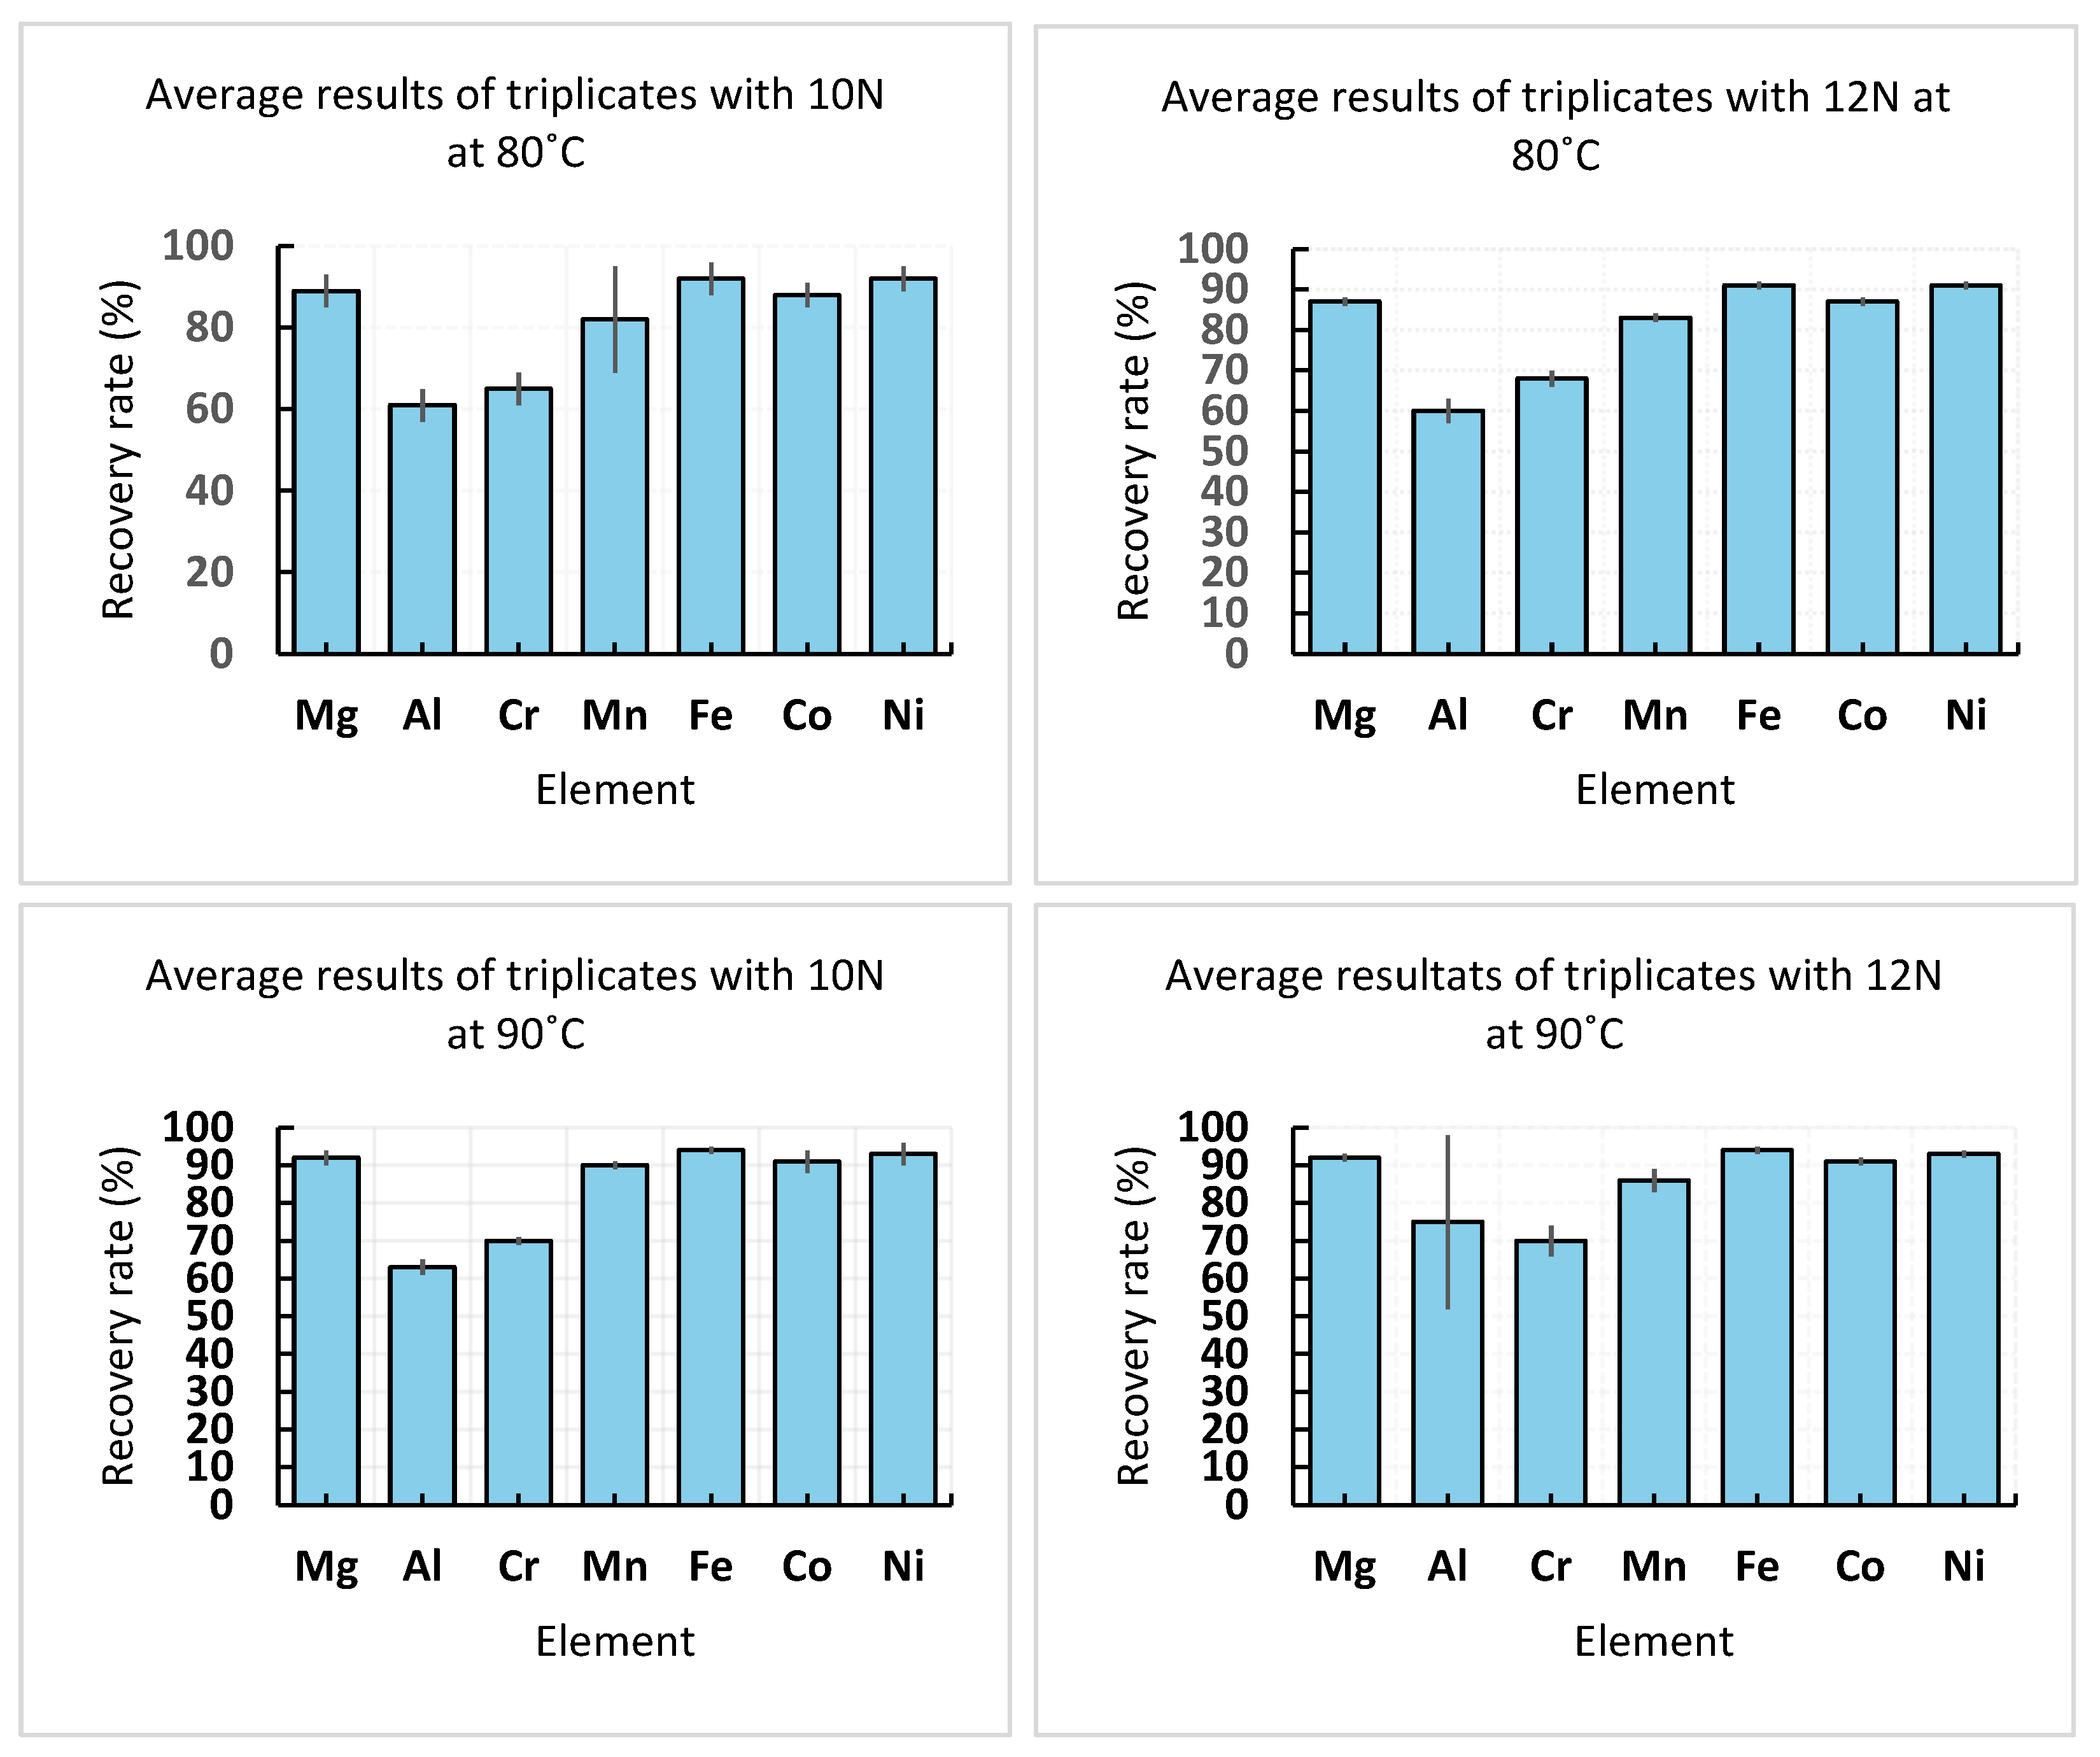
The optimal conditions for a high leaching recovery as defined during the first leaching series and their RSM modeling (W-series) were selected to carry out the second series of leaching tests (D-series). The aim here was to check experimentally the optimal conditions and to evaluate the robustness of the process, or its sensitivity to changes in temperature or concentration of acid, around the optimal values. Four triplicate leaching tests with highly concentrated hydrochloric acid (HCl) at different concentrations, i.e., 10 N and 12 N with two different temperatures i.e., 80 °C and 90 °C, were carried out in batch mode. The results obtained are shown in Table 9, Table 10, Table 11 and Table 12. Recoveries are calculated both according to the geochemistry of the analyzed feed and of the back-calculated feed (Table 9, Table 10, Table 11 and Table 12).
By setting the percentage of solids at 36% and varying the temperature and hydrochloric acid (HCl) concentration, the results showed that the percentage of metal dissolution in the leachate changes significantly as a function of varying temperature and acid concentration. An increase in temperature can accelerate the metal leaching process, with increments of 10 °C. Especially at the level of Mg recovery. This temperature effect is also related to HCl concentration; the higher the HCl concentration, the better the metal recovery. Acid concentration therefore has a positive effect on metal leaching, including leaching of Al, Cr, Mn, Fe, Co and Ni.
The extent of leaching for the two best conditions (10 N and 12 N at the same temperature of 90 °C) was calculated based on the ratio of extracted metals to initial metal contents. For Mg, Al, Cr, Mn, Fe, Co and Ni, the leaching degree for the condition of 10 N at 90 °C is in the order of 92% ± 2%, 63% ± 2%, 70% ± 1%, 90% ± 1%, 94% ± 1%, 91% ± 1% and 93% ± 3%, respectively. For the condition of 12 N at 90 °C, the leaching degree is, correspondingly, in the order of 92% ± 1%, 75% ± 23%, 70% ± 4%, 86% ± 3%, 94% ± 1%, 91% ± 1% and 93% ± 1%. As shown in Figure 8, there are no statistically significant differences in the leaching results for the two conditions.
According to Figure 8, the values of these elements are closer to those obtained by DOE. However, there is still some un-leached Mg, probably due to the presence of some incompletely leached Mg-minerals. For the other metals leached, such as Mn, Al, Fe, Co and Ni, the percentage recovery value appears to be significant, except for chromium, with a leaching rate of around 71%. The low recovery of the latter can be explained by the host mineral of Cr which is chromite, a refractory mineral that resists acid attack and high temperatures. As the material used contains mostly 40–50% chrysotile, acid leaching can transform chrysotile into amorphous hydrated silica at such high HCl concentrations.
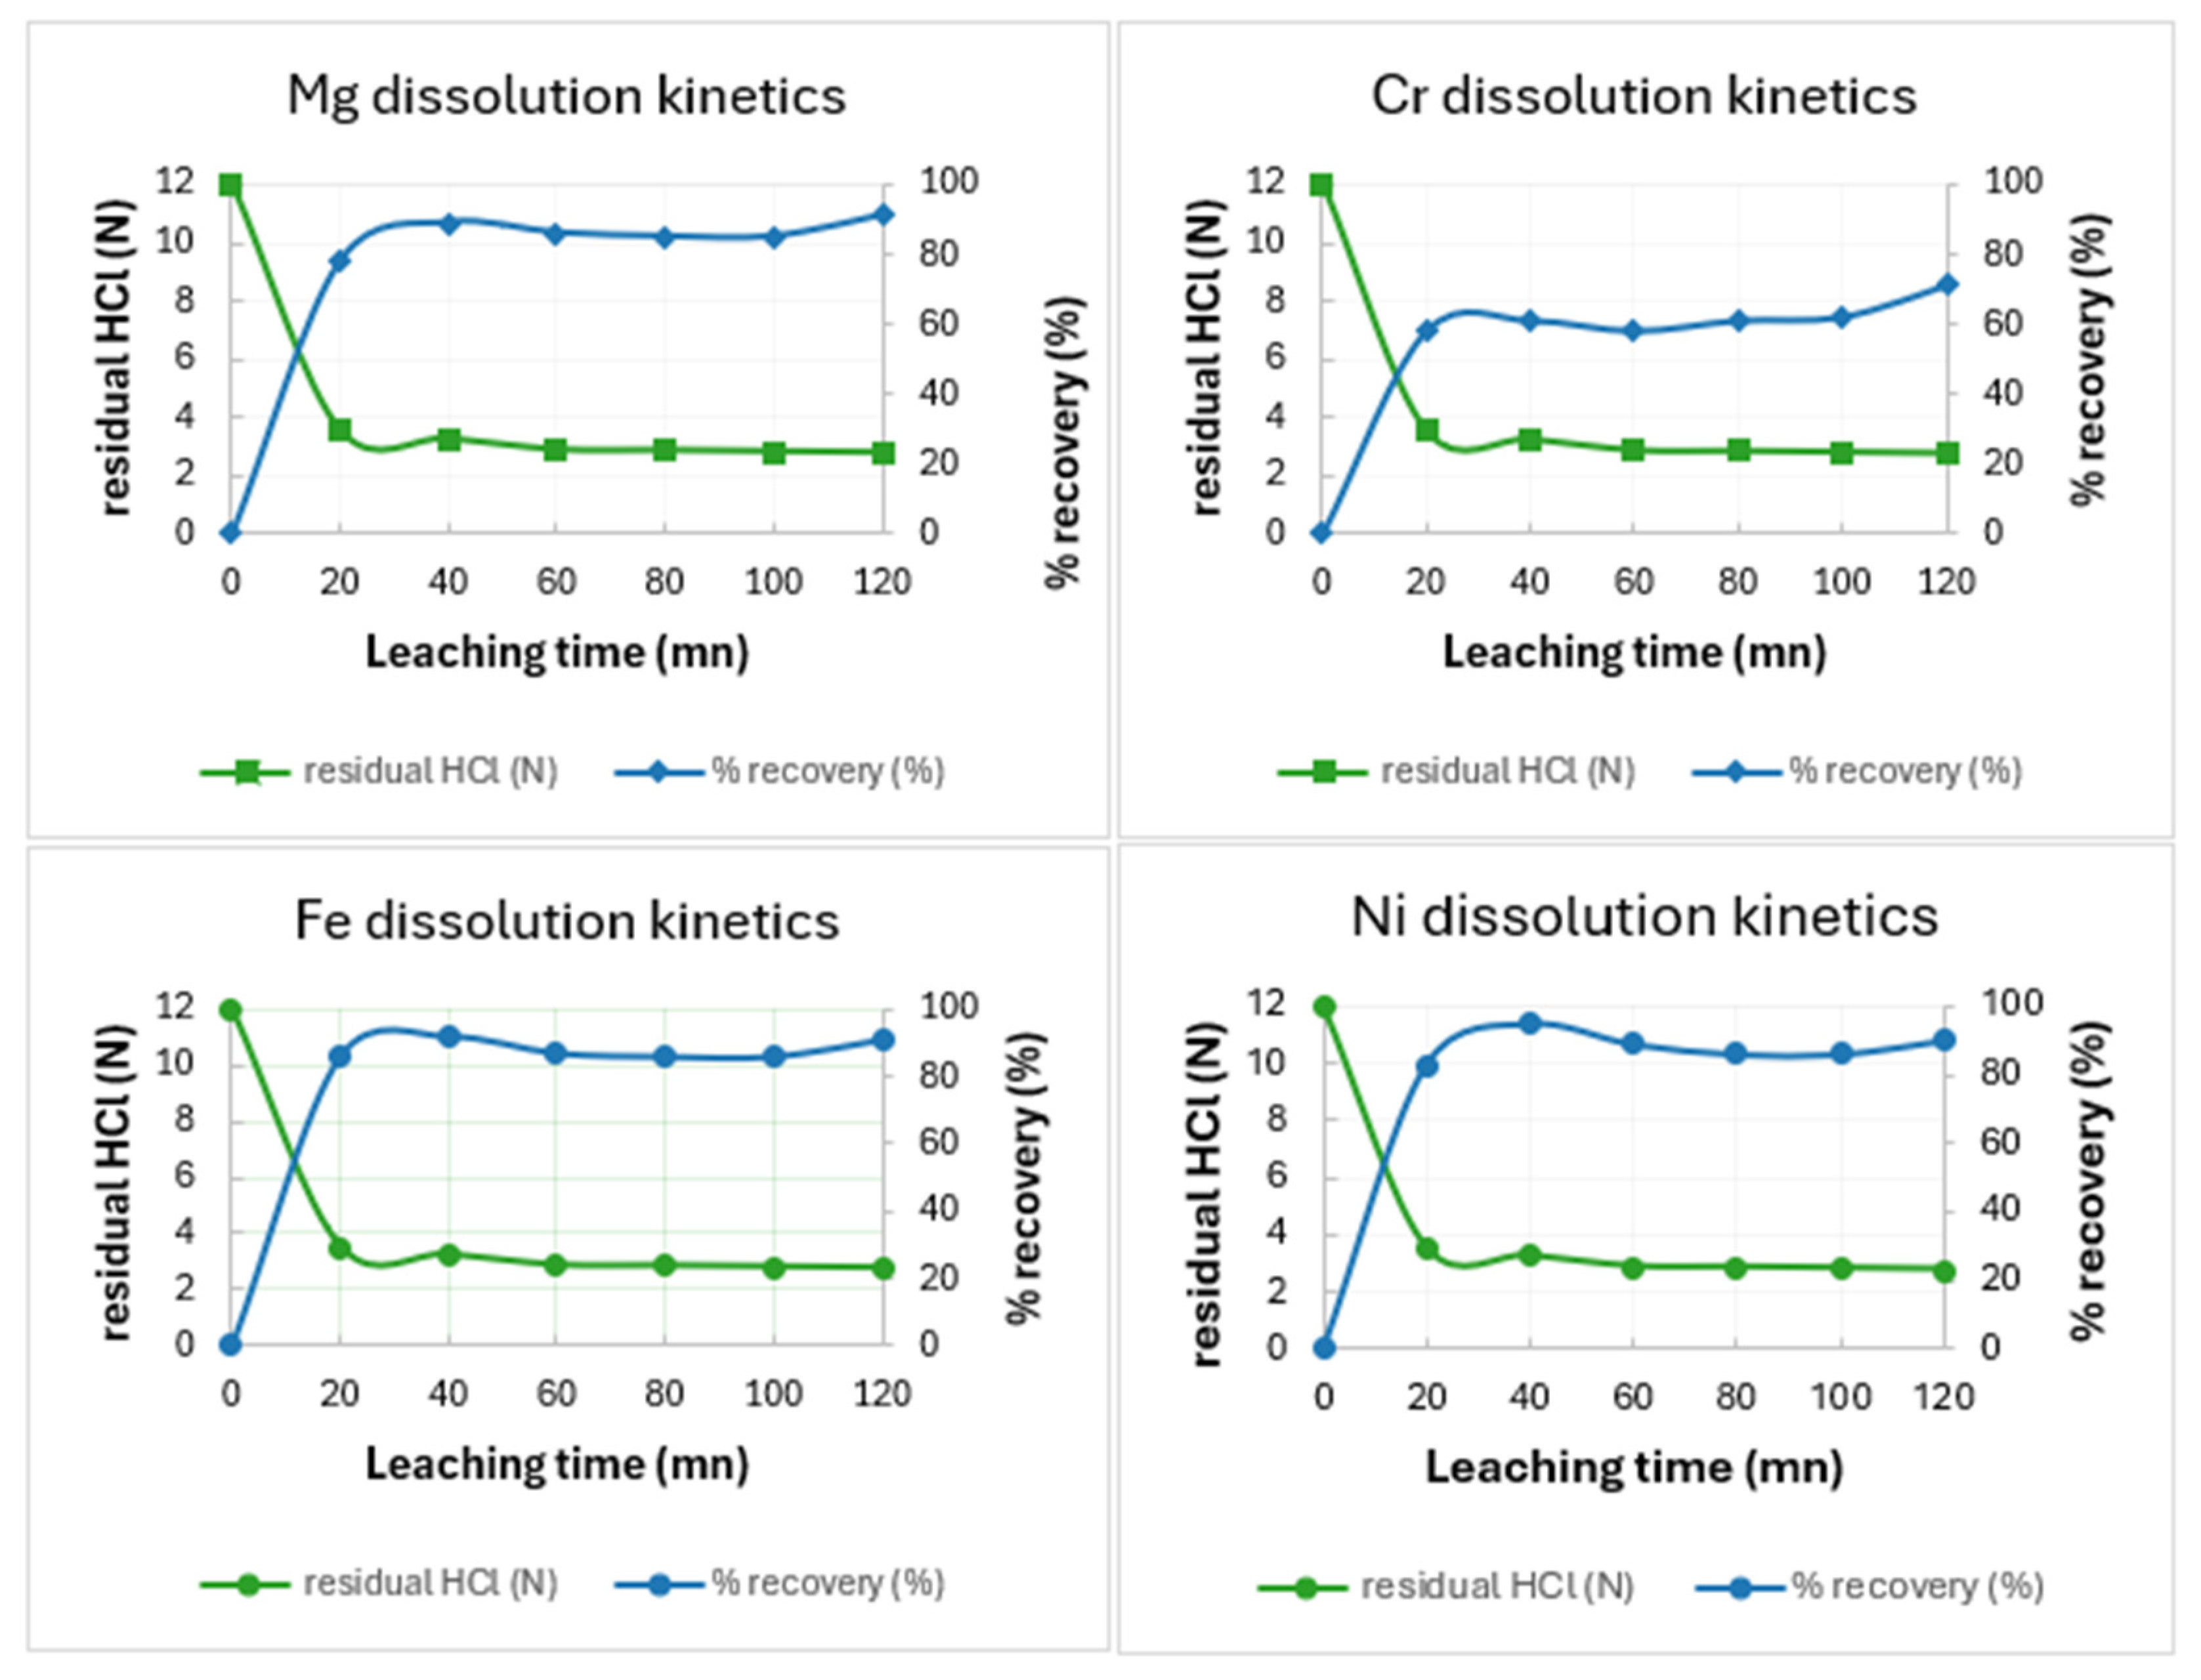
As shown in Figure 9, a rapid decrease in the acid concentration of the leachate was observed between 0 and 20 min, dropping from 12 N to 3.5 N. Thereafter, the residual acid concentration gradually stabilized, reaching approximately 2.8 N after 80 min. In parallel, the recovery percentage of certain metals such as Mg, Fe, Co, and Ni increased significantly during the first 20–40 min, reaching about 90%, and then stabilized between 87 and 92% beyond 80 min, except for Cr, which behaved as a refractory element. We observed that the strong acid consumption during the first 20 min corresponds to the rapid recovery phase of the metals, while the subsequent stabilization of both parameters reflects on the one hand, an equilibrium between the residual acid and the remaining possible reactions, and on the other hand, a probable passivation of certain reactive surfaces.
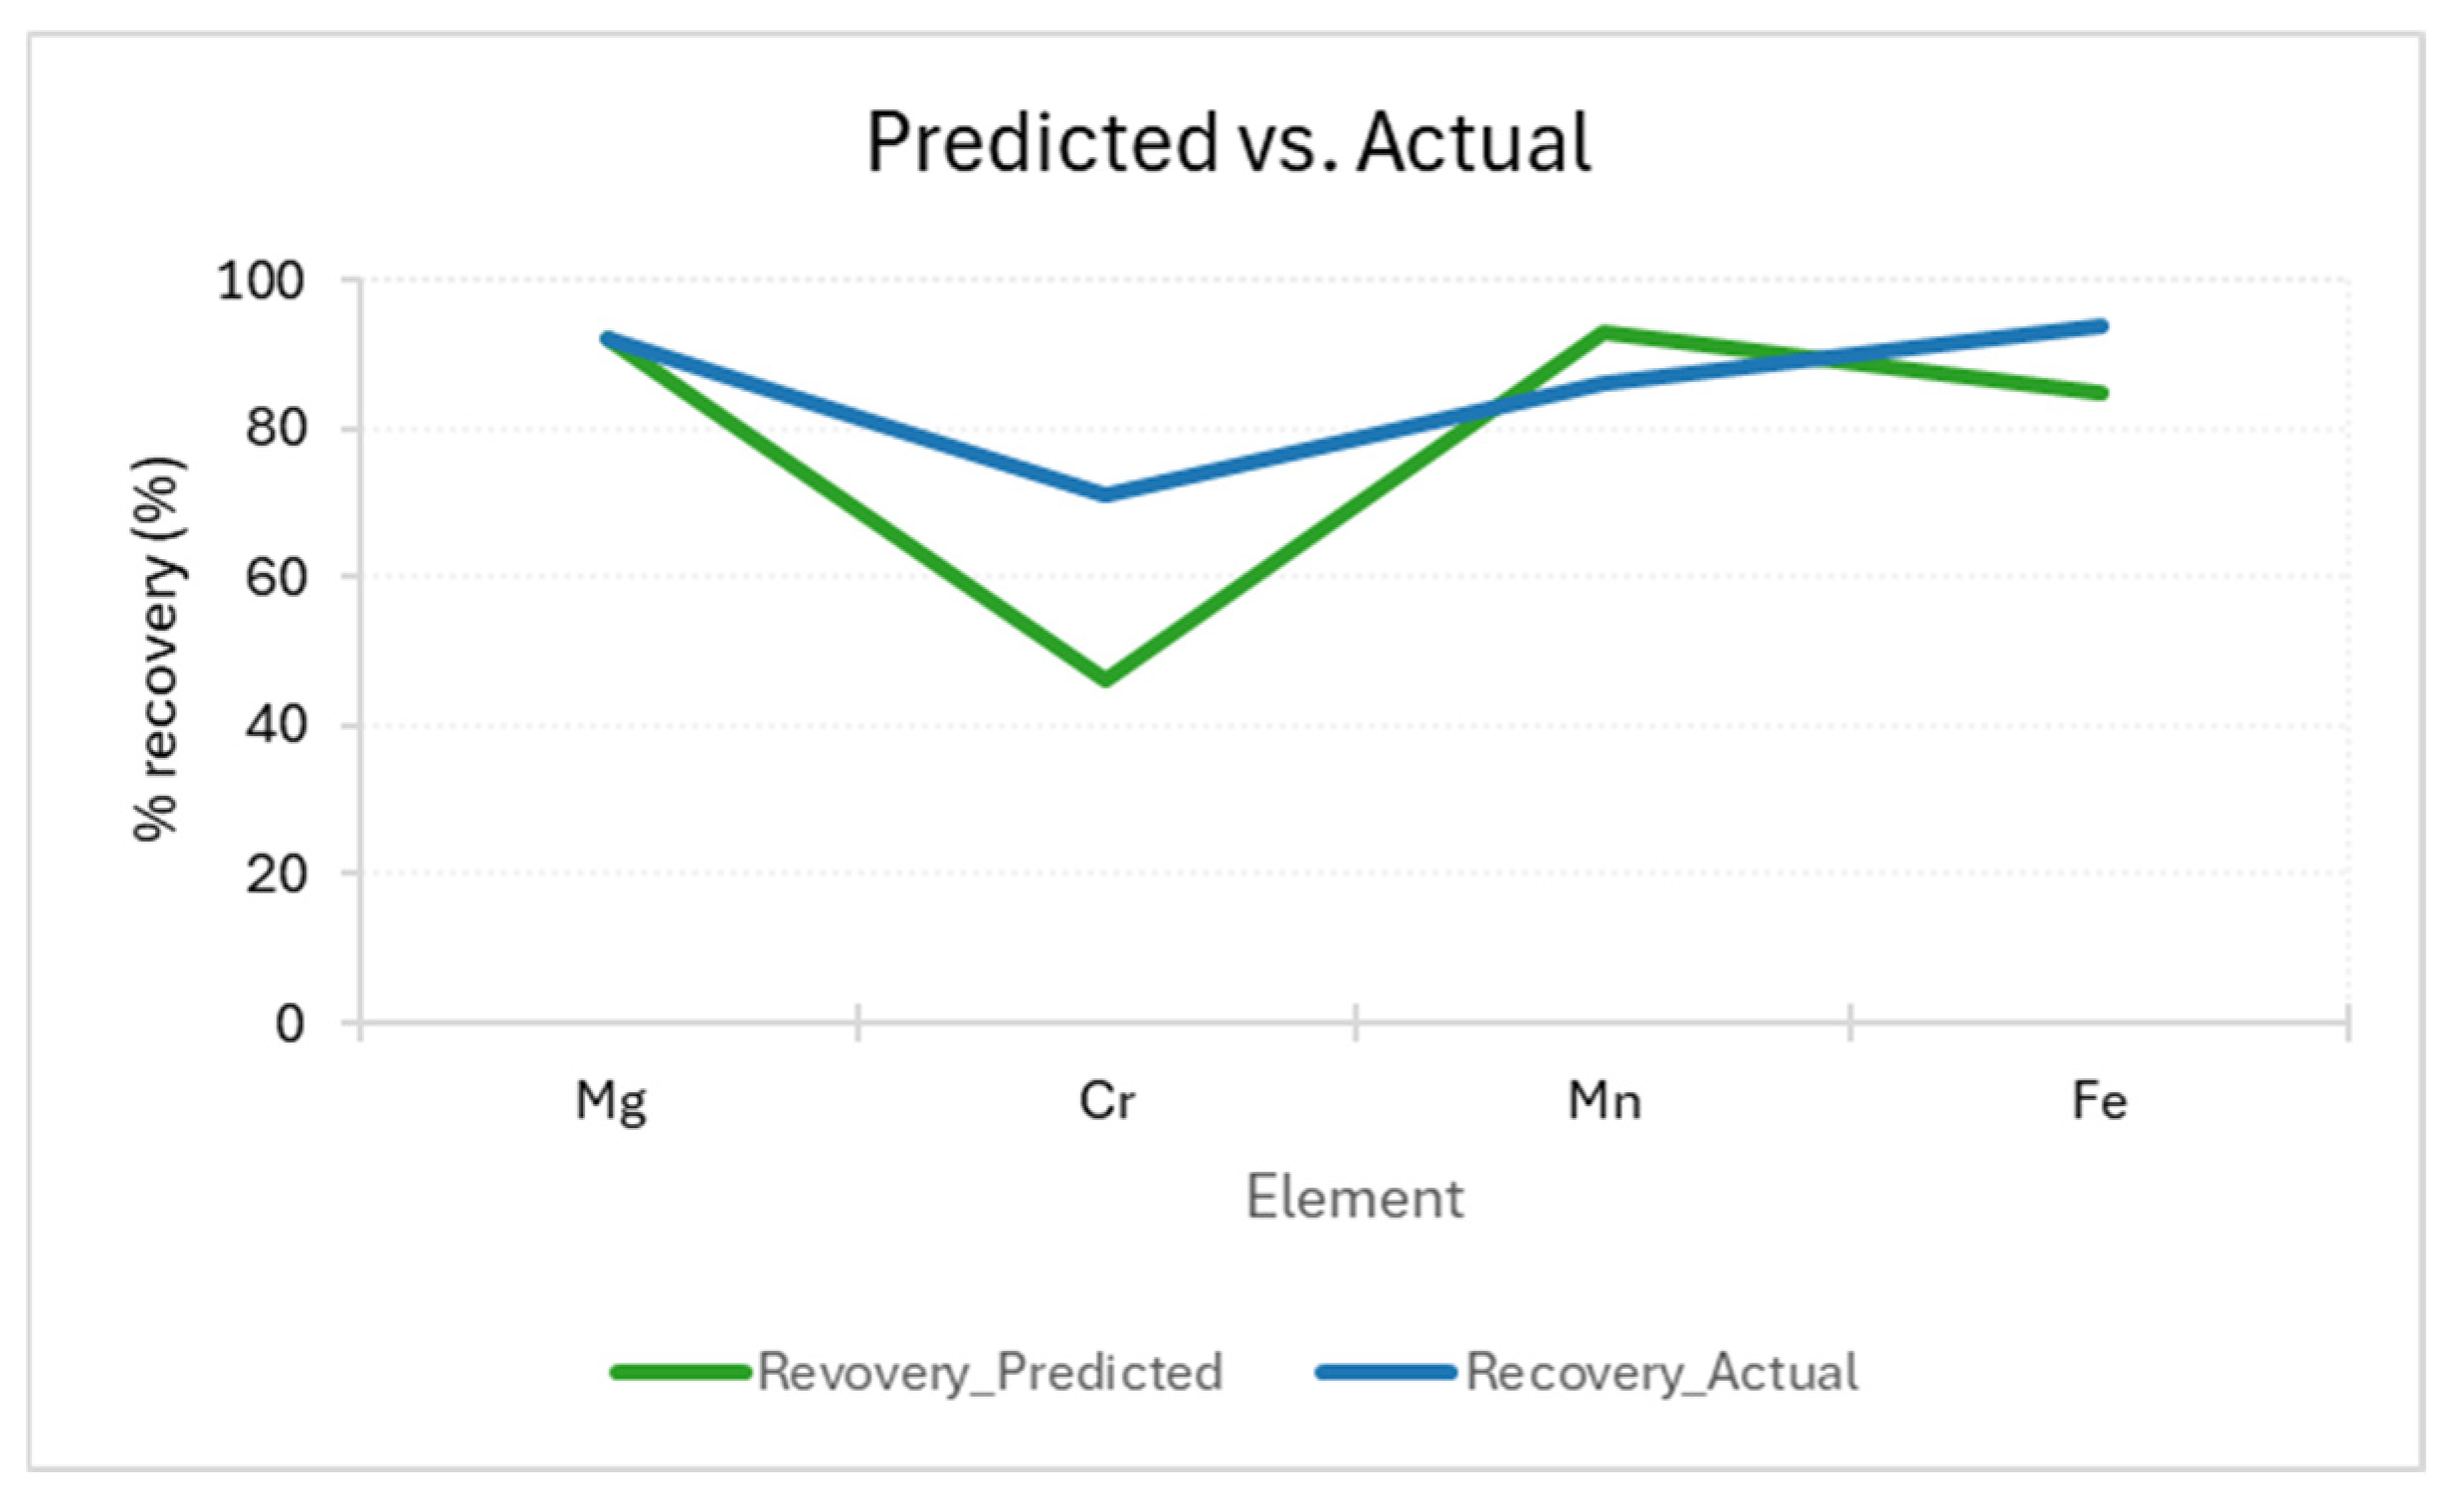
Figure 10 illustrates the comparison between the results predicted by the DOE model and the experimental results obtained under fixed conditions (HCl = 12 N, temperature = 90 °C, and solid content = 36%). Overall, the two curves exhibit a satisfactory agreement, thereby confirming the relevance of the model. However, slight discrepancies are observed for certain elements, particularly Cr and Mn, which can be attributed to experimental variability as well as to the inherent limitations of the model predictions.

4. Discussion

The DOE study, based on a central composite design response surface methodology (CCD RSM), identified that, among the 3 factors studied, the most influential factors for Mg recovery are the temperature and HCl concentration. A concentration of HCl of at least 10 M is necessary to reach a total Mg recovery when the temperature is above 80 °C and the solid-to-liquid ratio is above 30%. The mathematical representation predicts that increasing the temperature even above 90 °C could be beneficial for a selective recovery of Mg. Moreover, while high temperature leads to higher Mg recovery, it limits the leaching of iron. Avoiding iron leaching is desirable because it complicates the subsequent purification stage of the leaching process. If the limitation of iron release is wished, the determination of the main mineral that releases iron in the leachate becomes crucial. Indeed, if this mineral is magnetite, as revealed by the mineral characterization, it could be beneficial to the whole process to remove it by low intensity magnetic separation before the leaching stage. As observed in this study, magnetite should however be liberated from Mg-bearing minerals which are mainly serpentine minerals. This can be done by a targeted grinding to the liberation mesh of magnetite. This study also predicts that, when the solid-to-liquid ratio is high, the process may be more sustainable due to improved selective recovery of magnesium (at the expense of iron) and the possibility of regenerating the acid. Furthermore, this study revealed that nickel, the primary CSM constituent, is more prevalent in the feed than in the Earth’s crust, and exhibits leaching behavior like magnesium’s. Chromium, the second most enriched CSM, exhibits a leaching response in concentrated HCl similar to that of iron. However, this study suggests that this response is not primarily associated with the iron-rich mineral phase. Elevated temperatures enhance its dissolution. Since the primary chromium-bearing phase in asbestos tailings is non-magnetic chromite, using a magnet to separate iron minerals before leaching is likely effectless in terms of chromium recovery. Nevertheless, chromium recovery is expected to be lower than nickel recovery because chromium is found within the refractory spinel structure of chromite [84].
The combination of high HCl concentrations and high temperatures was necessary for this ore to maximize the recovery of its Mg, Ni, Cr contents. This result is consistent with the ones obtained by Cheng and Lamy-Morissette [49] on some asbestos tailings of the same region. Although the geochemistry of the major elements and the CSM they provided are similar to those in our current study, the description of the mineralogy of the feed sample is insufficient to determine whether it could have originated from the same area or tailings pond.
The use of high-strength acid for magnesium recovery likely stems from multiple factors. Notably, the asbestos tailings examined contain a relatively high proportion of chrysotile compared to other deposits in the Thetford region, suggesting a probable origin from the Jefferson mine. This reflects the compositional heterogeneity of asbestos tailings across mining sites [14,28], a variability demonstrated at the scale of individual stockpiles of other mine sites [91]. Since such details are not well documented in academic literature, a more comprehensive characterization of asbestos tailings piles is recommended. When treating tailings as a resource for hydrometallurgical extraction, they should be approached as complex geological formations, with distinct mineralogical and geochemical variations that can influence processing performance. For instance, variations in chrysotile content affect pulp rheology [92,93,94], and the resulting increase in viscosity in concentrated HCl may hinder the efficient recovery of dissolved ions.
Second, the tailings underwent leaching without grinding beforehand to minimize processing costs. While this approach is relevant, the economics must be revised once the leaching and purification of pregnant leach solutions behaviors of the ore are better understood. Adding grinding to the process could improve magnetite liberation and subsequent removal by magnetic separation prior to leaching. This would result in lower iron recovery, possibly benefiting the entire process. However, milling further such tailings may also present some drawbacks, according to our experience in mineral processing. First, the presence of chrysotile fibers makes milling of such rocks less efficient than other hard-rock ores [95]. This is due to the rheological behavior of rocks containing such minerals: their presence induces high-yield stress slurries [94,95,96]. Solutions could be to disintegrating fibers [94] or removing fibers from the process feed, by industrial flotation [94,97] prior to milling but both solutions add major complexities to the flowsheet, and thus cost, and potential loss of recovery downstream. The Mössbauer study also shows that floated fibers still bear magnetite, thus showing that iron impurities will still be present in the leaching feed even after flotation of fibers and subsequent magnetic separation of magnetite. On the other hand, milling is the process stage that consumes the most of energy [94,95] cost. This is not wished for the reprocessing of low-grade tailings. Adding regrinding to the flowsheet will increase carbon tax and make the process somewhat less sustainable. Finally, while the project progressed, iron was shown to be a potential valuable by-product. Considering all these points, the physical separation effort of magnetic minerals was not pursued for this study. It finally was used only for qualitative mineralogy assessment. Instead, the research effort was put on the chemical separation of iron in the downstream hydrometallurgical flowsheet.
Third, this study also suggests that the acid strength could be decreased if the temperature of HCl is further increased. Aside from economics, the boiling temperature of aqueous HCl solutions, according to their concentration, will be the limiting factor.

5. Conclusions

This study investigated the recovery of magnesium and other critical (such as nickel, chromium and cobalt) and strategic metals (CSMs) from an asbestos tailings sample through hydrochloric acid leaching. response surface methodology (RSM), combined with central composite design (CCD), was employed to optimize the recovery conditions. The model provided a satisfactory fit to the experimental data. Additionally, multiple response optimization using the desirability function was applied to determine the optimal leaching conditions for magnesium, iron, and nickel. The optimal parameters—hydrochloric acid concentration of 12 N, leaching temperature of 90 °C, and a solid-to-liquid ratio of 33.6%—resulted in a magnesium recovery slightly more than 90%. Under these conditions, approximately about 90% of both iron and nickel were also leached, together with 70% Cr. Results were interpreted and discussed according to liquid-solid interactions, including the particle size of tailings grains and the mineralogy of asbestos tails.

Author Contributions

Conceptualization, A.B., F.F. and H.A.; methodology, A.B., F.L., H.A., F.F., M.T., S.S., D.R. and Z.R.; software, F.F., H.A. and M.T.; validation, Z.R., H.A., F.F., M.T. and S.S.; formal analysis, F.L., H.A., F.F., D.R., D.F.G. and S.S.; investigation, Z.R., D.F.G., F.F., H.A. and M.T.; resources, A.B., F.L. and D.R.; data curation, F.F., H.A., M.T., D.R., D.F.G. and S.S.; writing—original draft preparation, F.F., H.A., M.T., D.R., D.F.G., S.S. and Z.R.; writing—review and editing, F.L., D.R., H.A., F.F., S.S. and Z.R.; visualization, A.B., F.L., F.F., S.S. and H.A.; supervision, F.L., A.B., D.R. and S.S.; project administration, S.S., H.A., F.L., D.R. and A.B.; funding acquisition, A.B., F.L. and D.R. All authors have read and agreed to the published version of the manuscript.

Funding

This research was funded by the Natural Sciences and Engineering Research Council of Canada, NSERC grant number CCARD-2022-00391, by the Consortium de recherche et d’innovation en transformation métallique au Québec, CRITM grant number PSO-19-2021-072, and by a private partner.

Data Availability Statement

The original contributions presented in this study are included in the article material. Further inquiries can be directed to the corresponding author.

Acknowledgments

This work could not have been conducted without the support of the Canadian and the Quebec provincial governments and of a private partner. Administrative and technical teams at CTRI, Laval University, and IGS are warmly acknowledged for their support; in particular Behibro Affouet Léonie-Esther, Arnaud Grimault, Félix Riverin Gauthier, Anne-Marie Claveau, Mamadou Dia, Idrissa Karaboily, Hassine Bouafif (H.B.), Marouan Rejeb (M.R.), and Lang Shi from McGill University. The asbestos sample under study was a kind donation by COALIA, under Nassima Kemache (N.K.) who was first involved in funding acquisition for CTRI, with H.B. and A.B. Anonymous reviewers and the editor team from MDPI also brought insightful comments that bonified the manuscript.

Conflicts of Interest

The author Ahmed Bouajila was employed by the company Impact Global Solutions (IGS). The remaining authors declare that the research was conducted in the absence of any commercial or financial relationships that could be construed as a potential conflict of interest.

Abbreviations

The following abbreviations, acronyms, and definitions are used in this manuscript:
CSMCritical and strategic metals
MgMagnesium element
Mg0Magnesium metal
MgOMagnesium oxide
MgCl2 Magnesium chloride
NiNickel element
CrChromium element
SiSilicon element
SiO2Silica
DOEDesign of experiments
RSMResponse surface methodology
CCDCentral composite design
XRDX-Ray Diffraction
EPMAElectron probe microanalysis
NIR-SWIRNear InfraRed/shortwave InfraRed
PSDParticle sizes distribution
ACSAmerican Chemical Society
σPopulation standard deviation
nNumber of statistical individuals
D80D stands for diameter of the screen mesh, and the subscript 80 indicates the percent of material which is lower or equal to the indicated diameter
CTRITechnology Center for Industrial Residues
IGSImpact Global Solutions

Appendix A. Head-Sample Characterization Section

Appendix A.1. Quantitative Inventory of Minerals by XRD Analysis
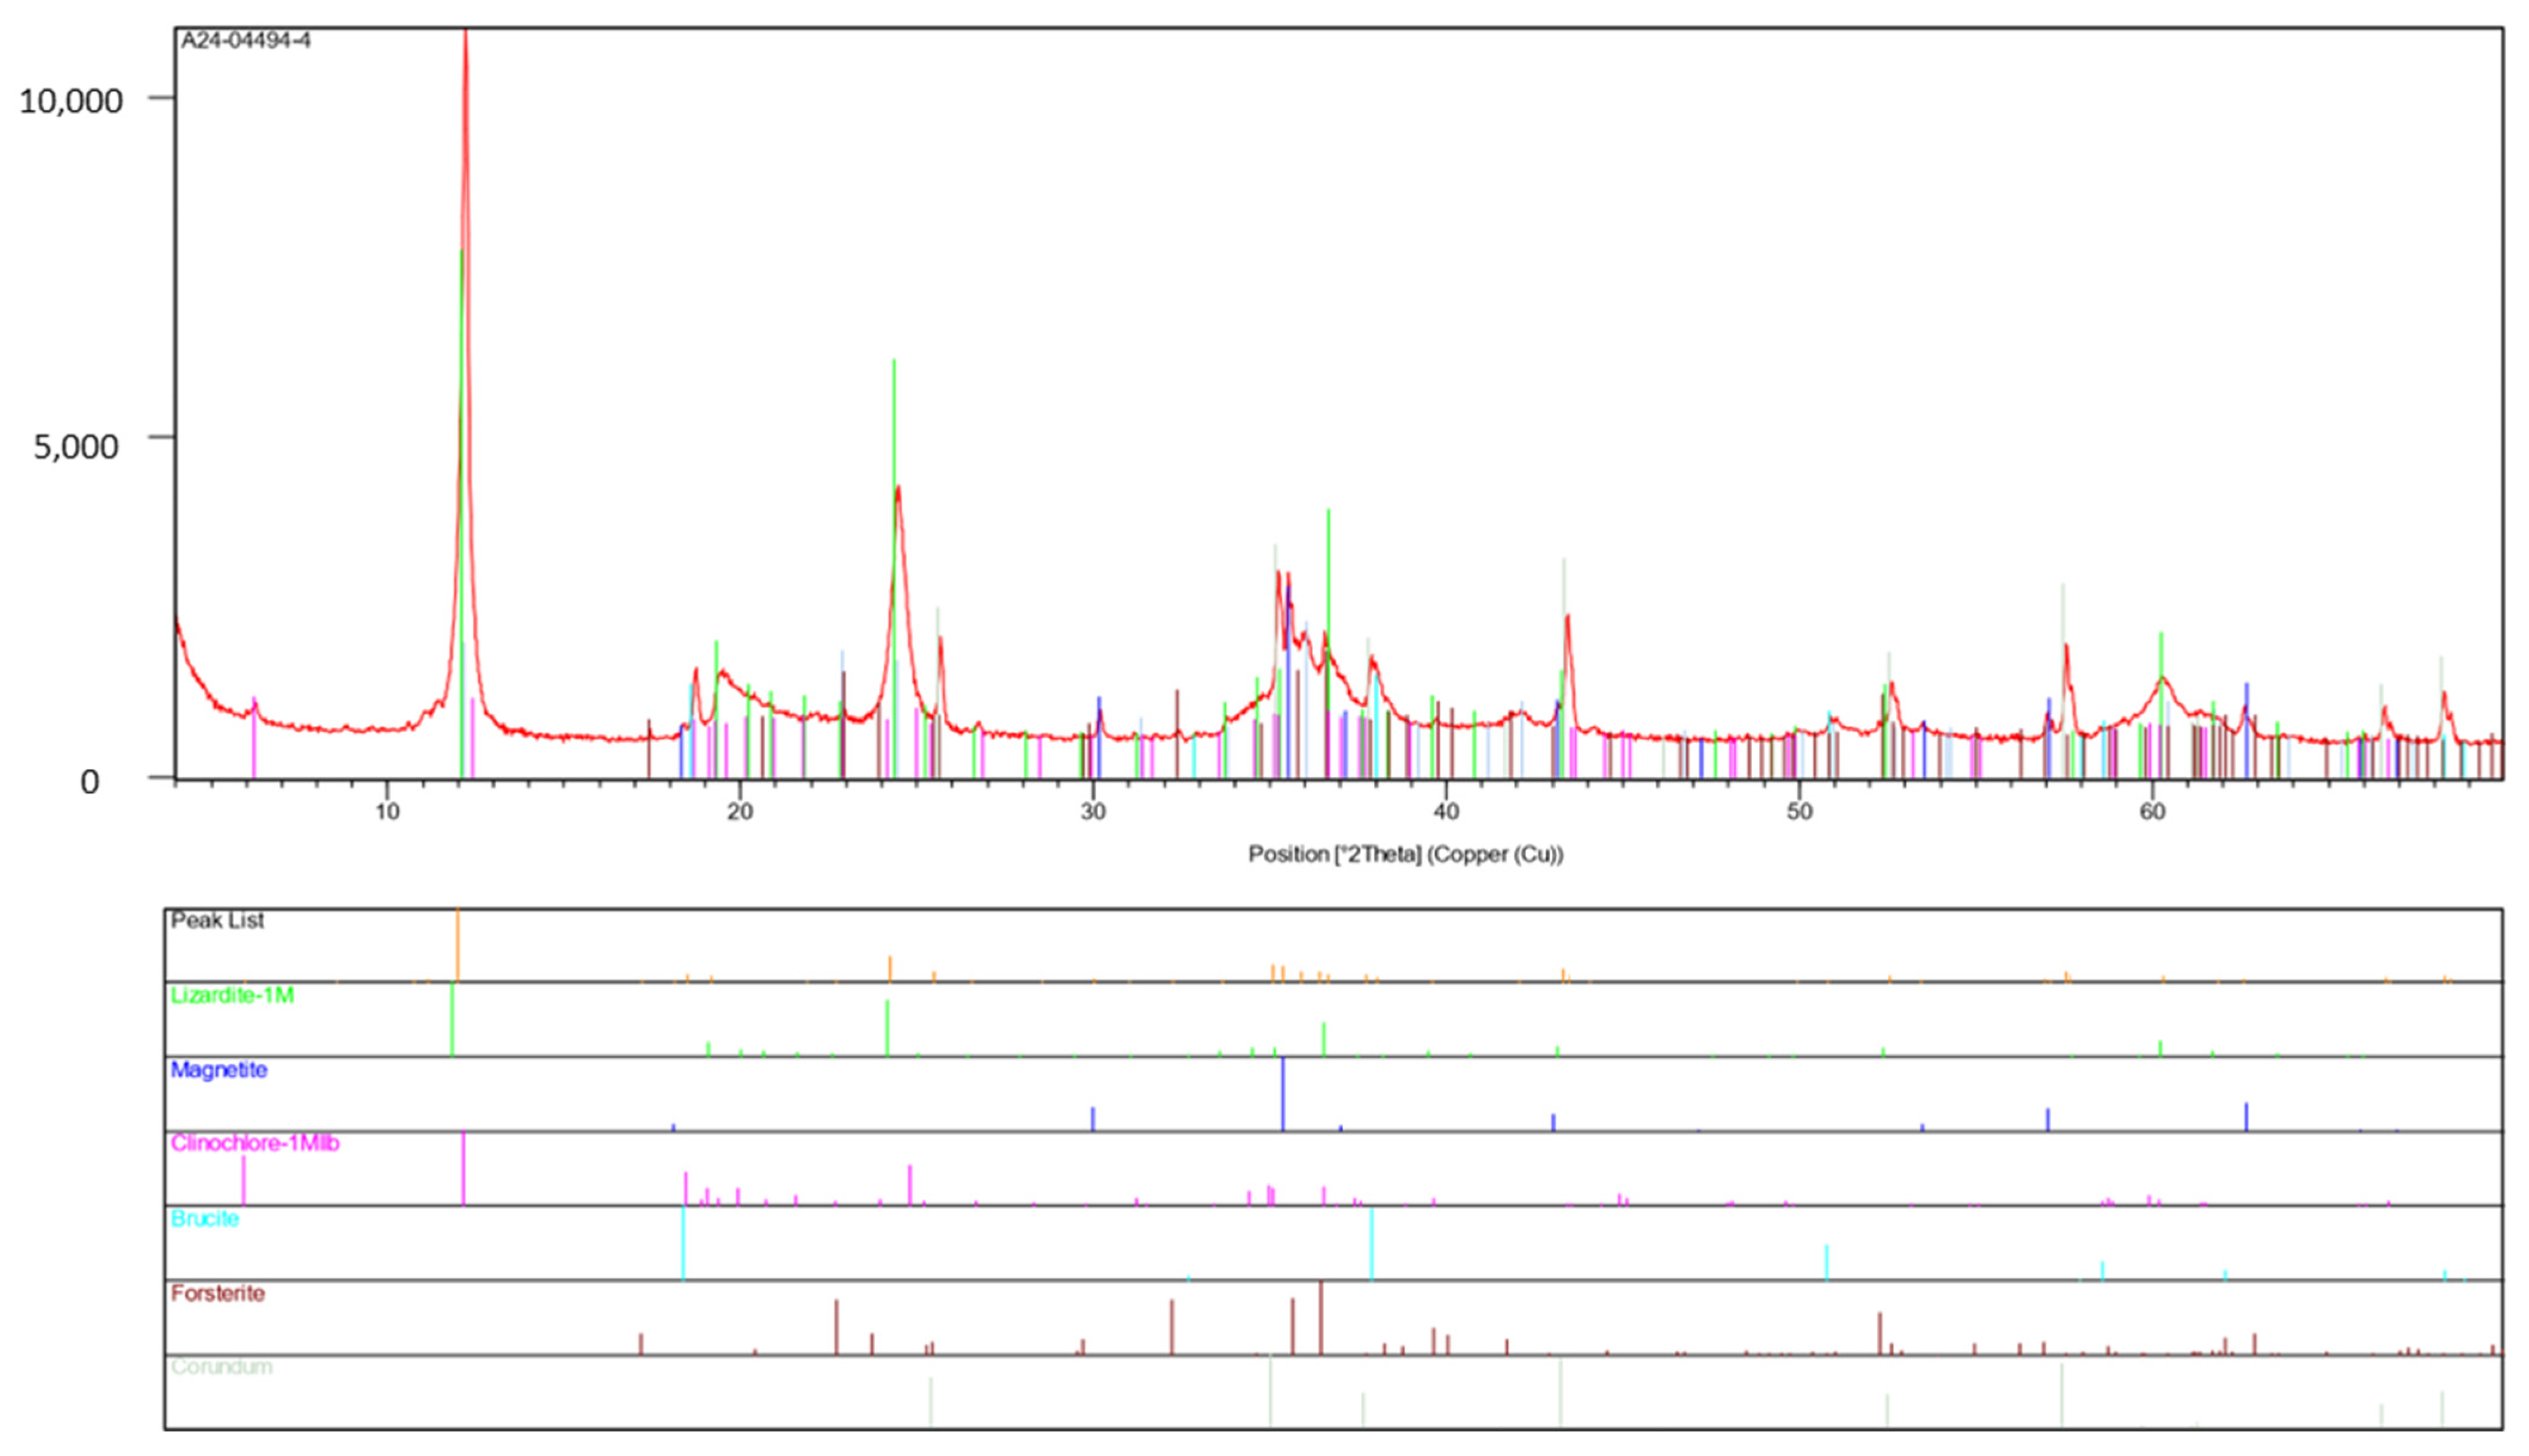
Figure A1. XRD pattern of the crystalline fraction of the head-sample used for leaching experiments. [71]. The red line is the bulk XRD response. Each colored straight line corresponds to the response of the best fitted mineral quoted in the peak list below the X-ray diffractogram.
Metals 15 01215 g0a1
Table A1. Minerals determined by quantitative analysis of the bulk head sample XRD [71].
Identified Minerals by XRD Recovery of Elements (% by Weight)
Serpentine 44.7
Chlorite 2.0
Forsterite (Mg-olivine) 2.0
Brucite (Mg (OH)2) 1.6
Magnetite (Fe3O4, and other spinels) 1.1
Quartz (SiO2) 0.2
Amorphous48.4

Appendix A.2. Experimental Mineralogical Data Collected During the Present Study

Appendix A.2.1. Introduction to Mössbauer Spectroscopy (MS) and Literature Review of Known Responses of Serpentine Minerals
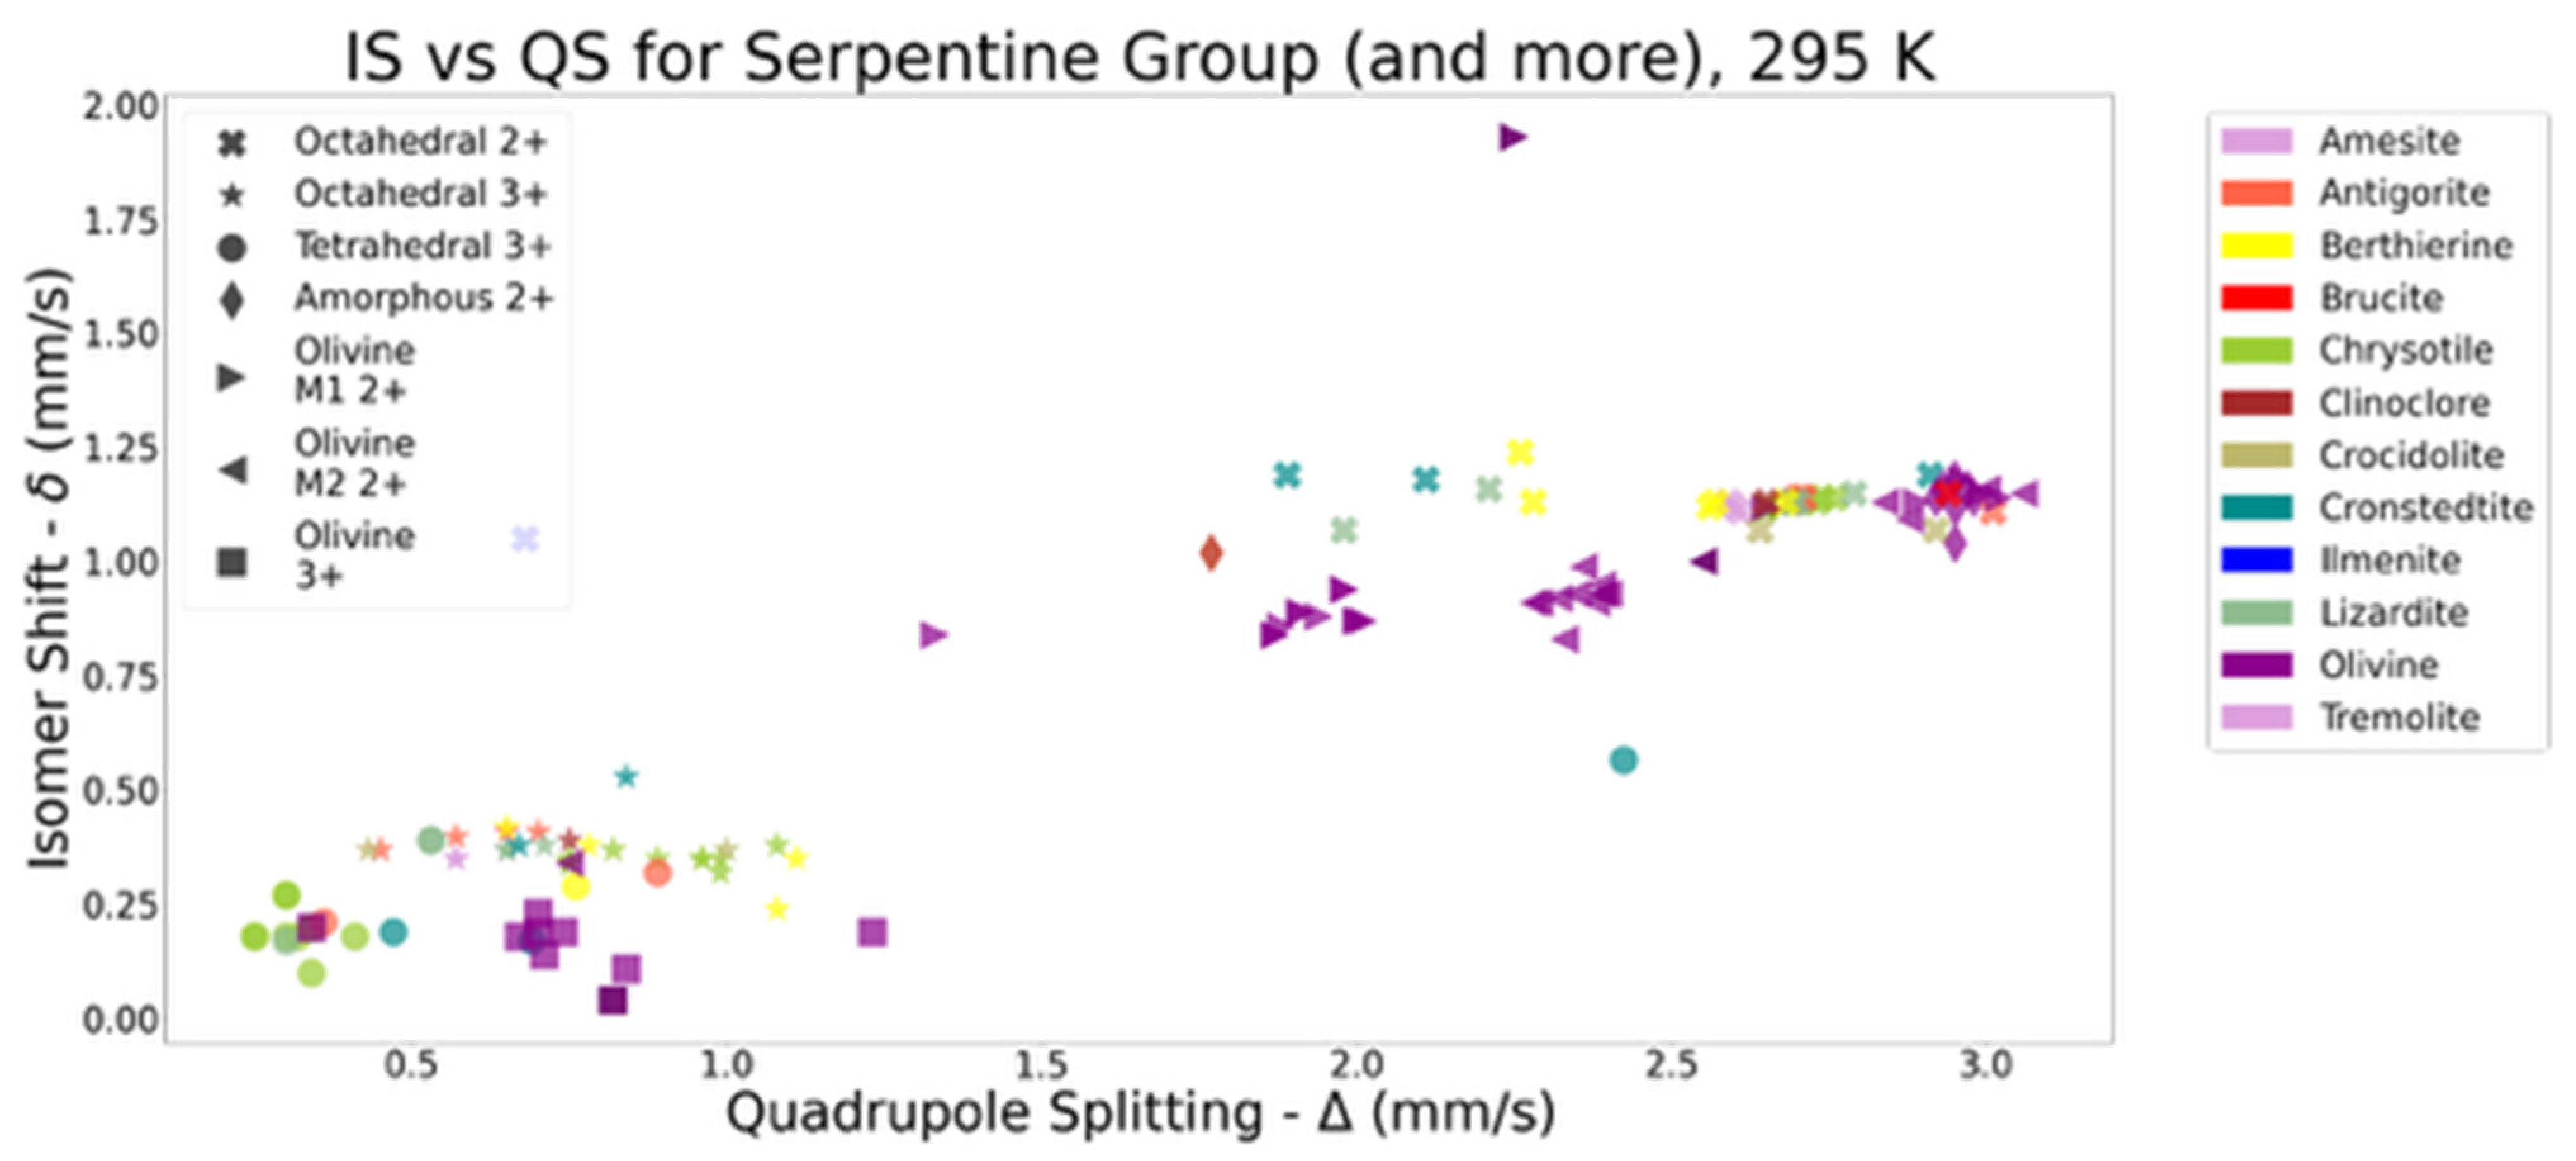
Summary of the principle of Mössbauer Spectroscopy (MS) with a reference to measured features (δ, Δ, data referred to in the MS detailed table results).
Mössbauer spectroscopy is a technique that makes use of the fact that solids have a recoil free emission and absorption of gamma rays. For the study of, 57Fe a source of 57Cois needed, which decays to an excited 57Fe, and emits a gamma ray. Due to differences in the local environment, however, the nuclear energy levels of the absorber may not match those of the emitter. A doppler shift needs to be introduced, by moving the source back and forth, which shifts the energy of the gamma ray. This results in a scan through energy ranges. The Mössbauer spectra shown are plots of absorbed intensity against velocity, where the dips correspond to the velocities at which the gamma ray’s energy, matches an energy transition of the absorber. Many spectra can be fitted to the data. From the spectra, information about the Isomer Shift (δ; unit is mm/s), Quadrupole Splitting (Δ in graphs and tables; unit is mm/s), and magnetic hyperfine splitting (Bhf; unit is Tesla) are obtained. The δ is a shift in the absorption line which is due to the difference of the electron density between the source and the absorber. The Δ splits the transition into two, giving two, equal-intensity lines in the spectrum. It is caused by the interactions of the nuclear quadrupole moment with the surrounding electric field gradient. Bhf splits the transition into three pairs of lines with the intensity increasing from the inner to the outer pair and forming the characteristic magnetic sextet. The magnetic hyperfine splitting is a result of the interactions of the nucleus with the surrounding magnetic fields, if present.
Figure A2. A summarized plot of the isomer shifts and quadrupole splitting values of the componentst of various serpentines minerals that may form during serpentinization [64].
Metals 15 01215 g0a2
Table A2. Room-temperature hyperfine Mössbauer parameters. Crystallographic sites hosting iron ions in the crystal lattice are indicated by O and T, which stand for octahedral and tetrahedral coordination respectively.
MineralCrystal SiteFe Valency δ (mm/s)Δ (mm/s)Bhf (T)Reference
ChrysotileOFe2+1.132.75 [82]
OFe3+0.310.86
TFe3+0.180.33
LizarditeOFe2+1.142.70 [83]
OFe3+0.400.70
TFe3+0.240.39
AntigoriteOFe2+1.132.69 [81,82]
OFe3+0.410.70
TFe3+0.210.36
Magnetite 0.28 49.0[83]
0.6645.9

Appendix A.2.2. Mössbauer Spectra and Complementary Data on a Selection of Hand-Picked Grains from Separated Fractions (“Chrysotile-Free”, Mag. And Non-Mag. Fractions from the Head-Sample
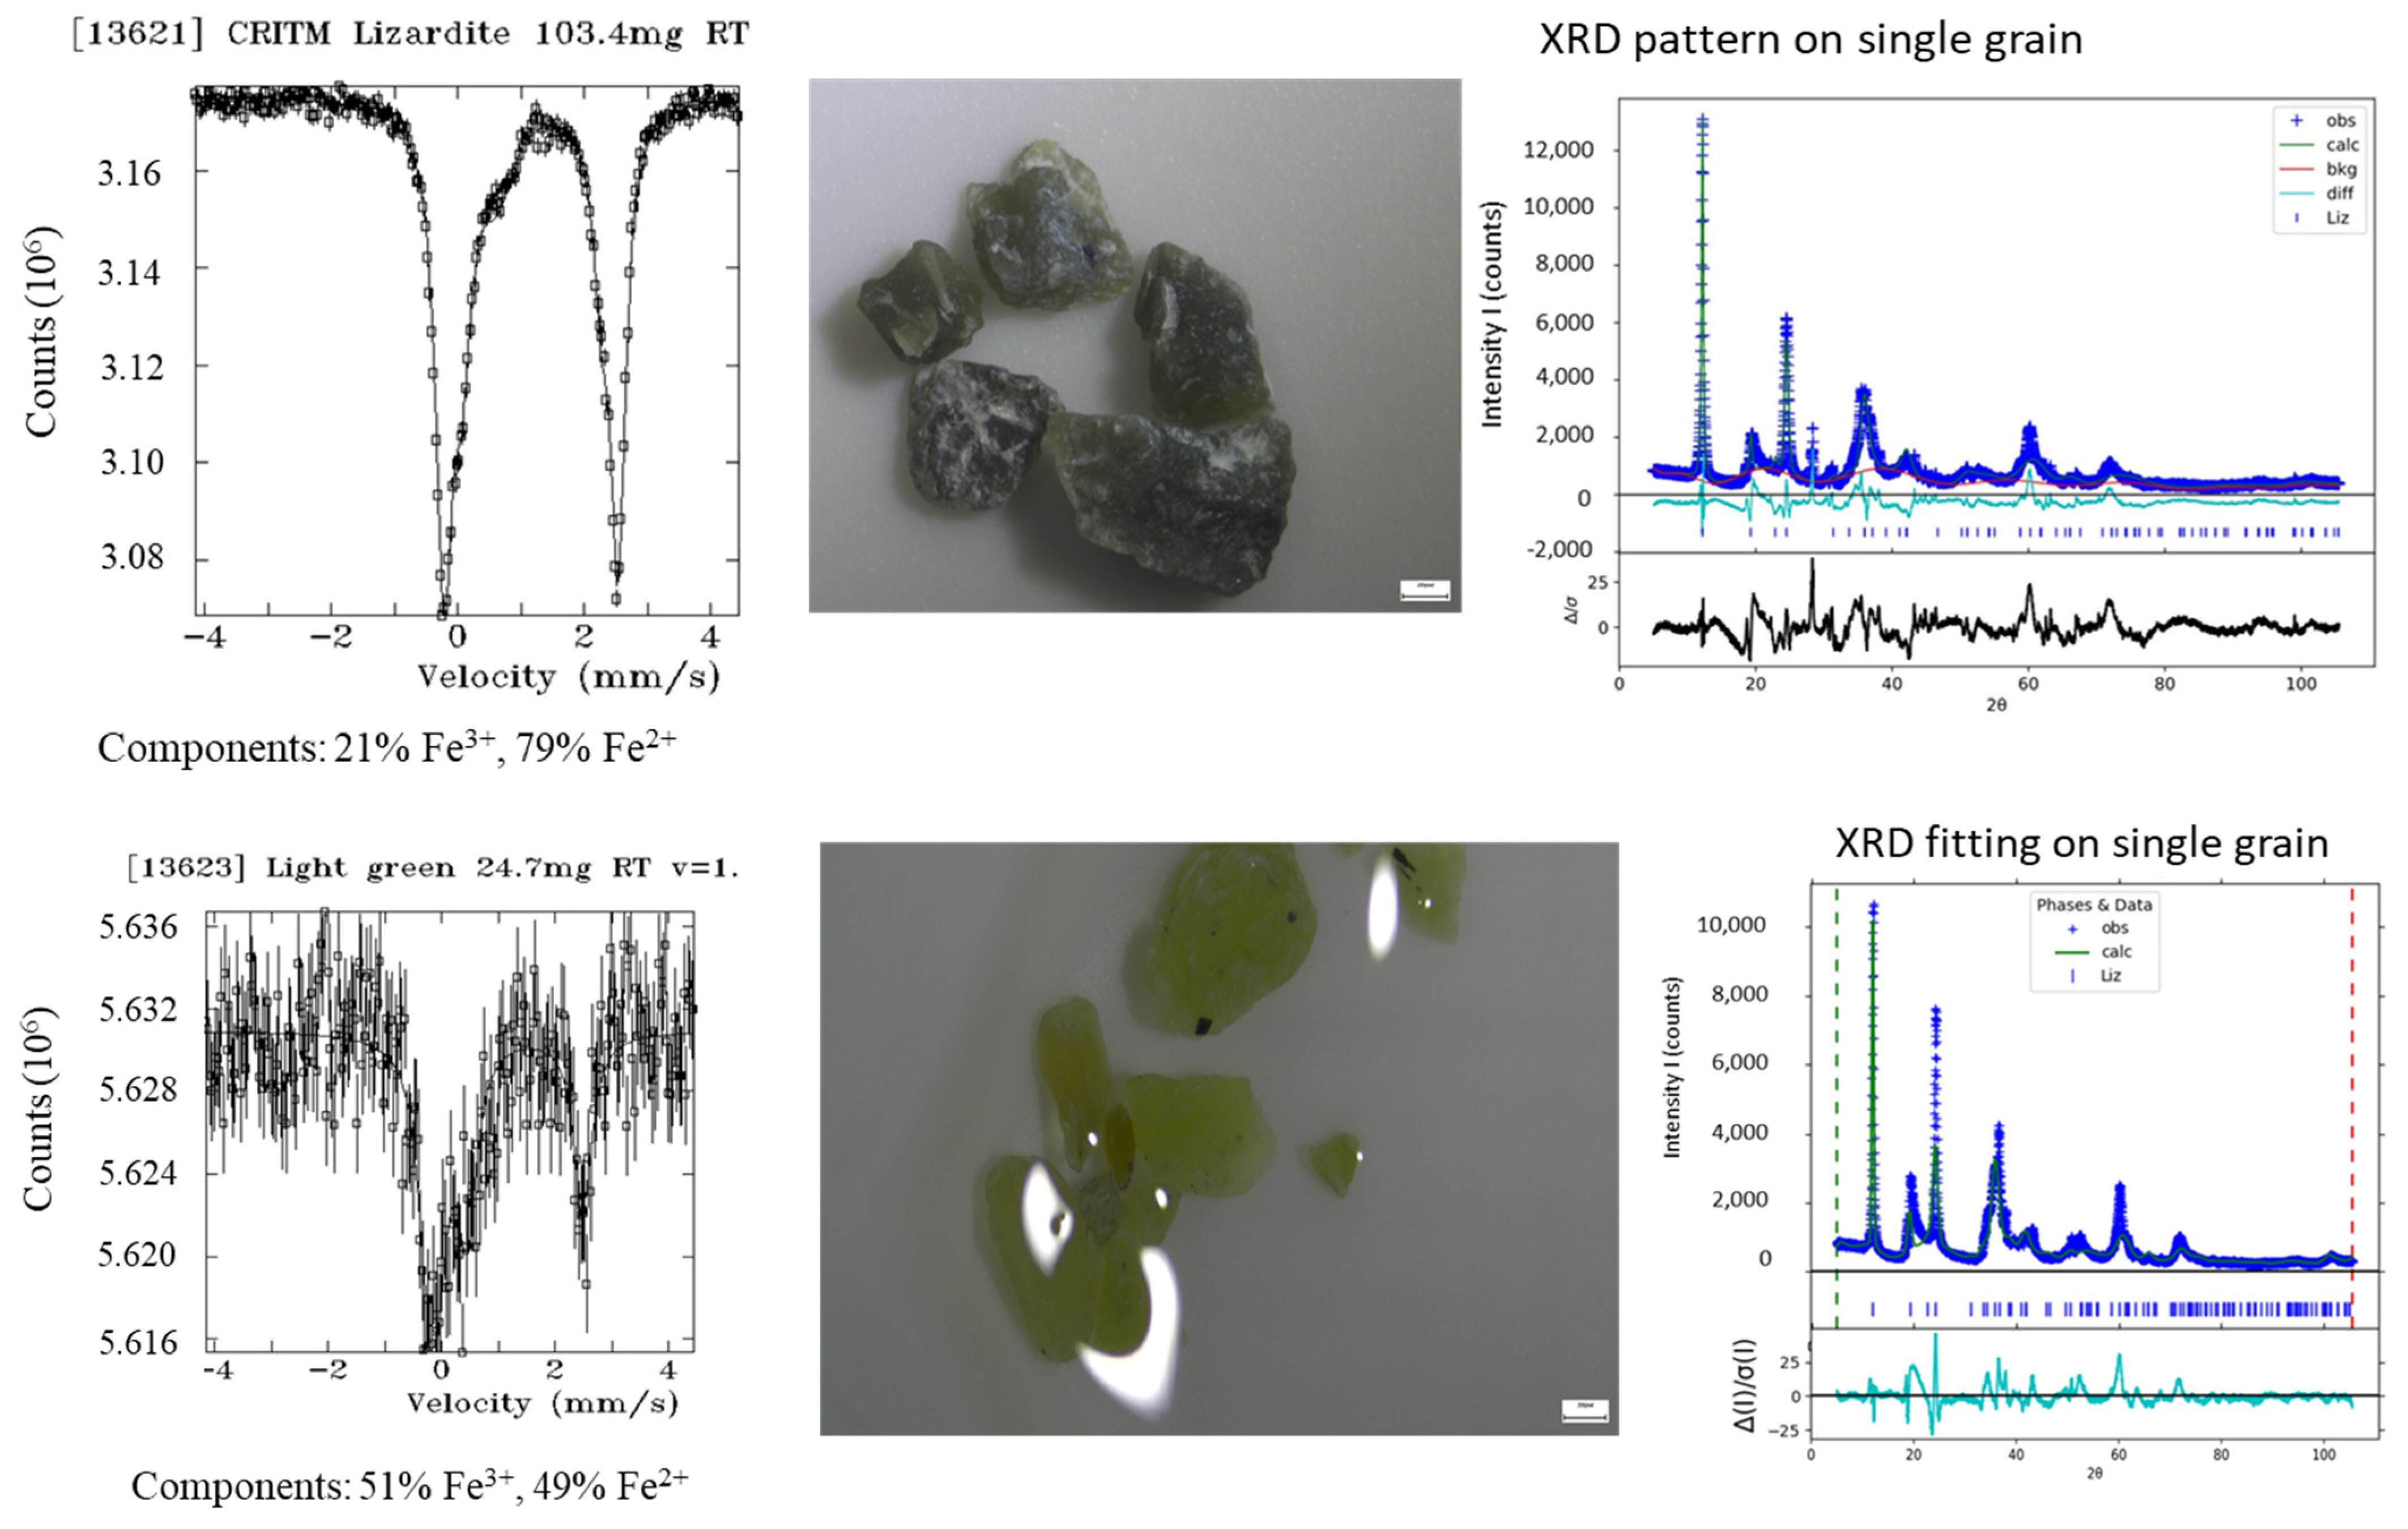
Figure A3. First class of hand-picked grains (iron-bearing minerals and non-magnetic minerals): Mössbauer spectrum (left), picture of the crystals (center) and diffraction pattern (right) of dark green minerals, which are the most abundant species (up) and of light green minerals of the leaching feed of the most abundant mineral species (down). Few other whitish-green grains having similar spectral features, and thus classified as lizardite, were also found but not reported here [64].
Metals 15 01215 g0a3
Figure A4. Second class of iron-bearing minerals and non-magnetic minerals: Green acicular crystals: Mössbauer spectrum (left), picture of the crystals (center) and diffraction pattern (right) of acicular minerals, classified as antigorite, of the leaching feed [64].
Metals 15 01215 g0a4
Figure A5. Third class of iron-bearing minerals and non-magnetic minerals: Opaque greyish platy minerals: Mössbauer spectrum (left), picture of the crystals (center) and diffraction pattern (right) of platy and fibrous minerals of the leaching feed [64]. Due to their visual features, they are thought to be tremolite/actinolite (Grimault, Pers. Comm.).
Metals 15 01215 g0a5
Figure A6. Fourth class of iron-bearing minerals and magnetic minerals: Mössbauer spectrum (left) and diffraction pattern (right) of the magnetic fraction of the leaching feed. Magnetite imprint is very typical and marked on the MS but some other minerals are also present [64].
Metals 15 01215 g0a6
Figure A7. Distinction of magnetite and chromite by XRD [64].
Metals 15 01215 g0a7
Table A3. EPMA specifications and results on selected area of some hand-picked grains [64].
InstrumentCameca Sx100
Accelerating Voltage15 kV
Beam Currents20 nA
Beam Size10 um
MgCrFeNiSiCo
Counting Time (seconds)202020202020
Analytical CrystalsTAPLPETLLiFLLiFLTAPLLiF
StandardsOlivineChromiteHematiteNiOOlivineMetal
Standard SourcesCM TaylorCM TaylorCM TaylorCamecaCM TaylorCameca
Oxide %
NamePoint#MgOCr2O3FeONiOSiO2CoOTotal
Pale Green-G1-11340.500.0031.6010.03542.390.01884.55
Pale Green-G2-21440.390.0552.0100.03441.630.00084.12
Pale Green-G3-31538.390.0003.0720.05140.190.00081.70
Antigorite-G1-11637.990.0003.5790.02543.560.00985.17
Antigorite-G2-21738.370.0003.4990.00043.260.03085.16
Antigorite-G3-31837.790.0024.0450.40242.830.00085.06
(Fe-OX) Antigorite-Mag-1190.0770.00091.540.0120.0730.02291.72
(Fe-OX) Antigorite-Mag-2200.4420.00090.480.0100.4290.06391.42
Lizardite-G1-12139.970.0032.0540.13742.160.03284.36
Lizardite-G2-22239.850.0492.1400.54942.740.05085.38
Lizardite-G3-32338.430.0023.4480.15443.980.00086.01
YB+LG-G1-12438.690.5192.1060.08840.500.00081.90
YB+LG-G2-22538.650.4911.9400.01140.110.02681.22
YB+LG-G3-32639.430.5662.1920.00440.700.00182.90
YB+LG-G4-42739.060.0682.9940.06742.120.02684.34
YB+LG-G5-52839.820.0002.2460.00042.310.01784.40
YB+LG-G6-62940.340.0001.6280.02942.030.00484.04
Legend: YB stands for Yellow-Brown, LG stands for Light Green, Gx stands for Grain number x; Each selected grain, or association of grains (e.g., like YB+LG or Antigorite-Mag-1) was numbered. Point# means Point number.
Table A4. Theoretical geochemical composition of pure minerals identified [18,20,21,22,23,24,25].
MineralSiO2Al2O3MgOFeOFe2O3TiO2Cr2O3MnOCaONa2OH2O
Chrysotile43.63 43.63 13.00
Lizardite43.36 43.63 13.00
Antigorite39.95 30.1517.92 11.98
Tremolite59.17 24.81 13.81 2.22
Actinolite54.862.6316.1110.610.470.19 0.1712.030.82.11
Chlorite43.1926.188.28 1.5920.35
Forsterite42.71 57.26
Brucite 69.11 30.89
Magnetite 31.0368.97
Chromite 32.10 67.90
Quartz100

Appendix A.3. Whole-Rock Geochemistry of the Head-Sample

Table A5. XRF analytical certificate (CTRI Certificate 24900, 21 August 2024).
Sample Code Standard JA-1Standard JA-129400A-E129400A-E229400A-E329400A-E4
Date of Preparation 8 March 20248 March 20248 March 20248 March 2024
IdentificationUnitObtainedExpectedHead-SampleHead-SampleHead-SampleHead-Sample
Na2O%5.0553.840.510.490.300.34
MgO%1.5081.5742.4642.3542.9343.31
Al2O3%15.05815.221.031.000.690.63
SiO2%61.84463.9741.0642.3542.2041.83
P2O5%0.0880.165
SO3%0.019 0.130.170.080.07
K2O%0.6920.770.130.130.060.05
CaO%5.3675.70.470.400.240.30
TiO2%0.7910.85
Cr2O3% 0.480.400.300.28
MnO%0.194 0.140.150.150.16
Fe2O3%7.5417.0711.7310.8810.9010.88
NiO%5.0553.840.400.360.380.43
CuO%
ZnO% 0.330.190.320.24
Total% 98.8798.8798.5498.53
Table A6. MP-AES and ICP-MS analytical certificate after wet digestion (CTRI Certificate 24900, 21 August 2024; Method#9HP-0.5 gH3BO3; Bold: quantitative; Normal: semi-quantitative).
Sample # 29400A29400B29400C
Date of Preparation 8 March 20248 March 20248 March 2024
IdentificationUnitHead-Sample
Test #9HP-0.5 gH3BO3
Head-Sample
Test #9HP-0.5 gH3BO3
Head-Sample
Test #9HP-0.5 gH3BO3
Namg/Kg121212
Mgmg/Kg211,082207,132208,894
Almg/Kg240022213669
Kmg/Kg4504201349
Camg/Kg739189796222
Timg/Kg394750
Vmg/Kg131312
Crmg/Kg557582640
Mnmg/Kg828829904
Femg/Kg63,91359,43065,454
Comg/Kg1009993
Nimg/Kg22721622043
Cumg/Kg6637
Znmg/Kg10611290
Asmg/Kg461
Semg/Kg<1<1<1
Momg/Kg<0.20.4<0.2
Cdmg/Kg<0.1<0.1<0.1
Snmg/Kg<0.1<0.1<0.1
Sbmg/Kg<0.1<0.1<0.1
Temg/Kg<0.1<0.1<0.1
Bamg/Kg101127
Pbmg/Kg<0.10.32.7
Bimg/Kg<0.1<0.1<0.1
Umg/Kg<0.10.1<0.1

Appendix B. Leaching Section

Figure A8. Effect of individual factors on the Cr recovery.
Metals 15 01215 g0a8
Figure A9. 3D surface plot of Cr recovery in response to the interaction of acid concentration and temperature (left) and of solid to liquid ratio and temperature (right). The colder the color (blue), the lower the recovery value. The warmer the color, the higher the recovery value.
Metals 15 01215 g0a9
Figure A10. Effect of individual factors on the Al, Mn, Ni, Co recovery.
Metals 15 01215 g0a10aMetals 15 01215 g0a10b
Figure A11. 2D contour plot of CSM, Fe and Al recoveries in response to the interaction of acid concentration and temperature. The colder the color (blue), the lower the recovery value. The warmer the color, the higher the recovery value.
Metals 15 01215 g0a11
Figure A12. 2D contour plot of CSM, Fe and Al recoveries in response to the interaction of acid concentration and solid to liquid ratio. The colder the color (blue), the lower the recovery value. The warmer the color, the higher the recovery value.
Metals 15 01215 g0a12
Figure A13. 2D contour plot of CSM, Fe and Al recoveries in response to the interaction of the solid to liquid ratio and temperature. The colder the color (blue), the lower the recovery value. The warmer the color, the higher the recovery value.
Metals 15 01215 g0a13
Table A7. Key factors and statistical values for the RSM.
ElementSignificant FactorsModel p-Value Factor p-ValueActual EquationR2
Mg[HCl]<0.00010.003159.5716 − 6.582 × [HCl]0.9225
[S/L]0.0525−1.6775 × [S/L]
T<0.0001+0.3260 × T
[HCl] × [S/L]0.0228+0.0193 × [HCl] × [S/L]
[HCl] × T0.0112+0.0781 × [HCl] × T
Ni[HCl]0.00760.003741.7971 + 2.7266 × [HCl]0.7560
[S/L]0.0366−0.3259 × [S/L]
T0.0071+0.3751 × T
Cr[HCl]<0.0001<0.0001−17.3530 + 2.9614 × [HCl]0.8657
[S/L]0.0495−0.2017 × [S/L]
T<0.0001+0.8469 × T
[HCl] × T0.0036+0.0559 × [HCl] × T
[S/L] × T0.0749−0.0121 × [S/L] × T
[HCl]20.0665−0.0089 × [HCl]2
T20.0380−0.0060 × T2
Co[HCl]0.0002<0.000125.2560 + 3.3626 × [HCl]0.8688
[S/L]0.0390−0.1962 × [S/L]
T0.0002+0.4561 × T
Fe[HCl]0.0001<0.0001−74.1267 + 10.7060 × [HCl]0.8791
[S/L]0.2121+1.2700 × [S/L]
T0.0005+2.1591 × T
[HCl] × [S/L]0.3679+0.0909 × [HCl] × [S/L]
[HCl] × T0.4028+0.0365 × [HCl] × T
[S/L] × T0.0422−0.0197 × [S/L] × T
[HCl]20.0286−0.5914 × [HCl]2
[S/L]20.4755−0.0226 × [S/L]2
T20.0368−0.0127 × T2
Mn[HCl]0.00010.001846.1771 − 0.8993 × [HCl]0.7821
[S/L]0.1196−0.2866 × [S/L]
T0.0001+0.0464 × T
[HCl] × T0.0426+0.0612[HCl] × T
Al[HCl]<0.00010.001729.6489 − 3.6024 × [HCl]0.8211
[S/L]0.2583+0.7849 × [S/L]
T<0.0001−0.02145 × T
[HCl] × [S/L]0.0862+0.0852 × [HCl] × [S/L]
[HCl] × T0.0055+0.06314 × [HCl] × T
Legend: [HCl]: HCl concentration (mole/L); [S/L]: Solid to liquid ratio (%); T: Temperature (°C).

References

  1. Girotto, C.P.; De Campos, S.D.; De Campos, É.A. Chrysotile asbestos treated with phosphoric acid as an adsorbent for ammonia nitrogen. Heliyon 2020, 6, e03397. [Google Scholar] [CrossRef]
  2. Virta, R.L. Asbestos: Geology, Mineralogy, Mining, and Uses; US Department of the Interior, US Geological Survey: Washington, DC, USA, 2002; p. 149. [Google Scholar]
  3. Flanagan, D.M. Mineral Commodity Summaries 2025; US Geological Survey: Washington, DC, USA, 2025. Available online: https://pubs.usgs.gov/publication/mcs2025 (accessed on 15 October 2025).
  4. Spasiano, D.; Pirozzi, F. Treatments of asbestos containing wastes. J. Environ. Manag. 2017, 204, 82–91. [Google Scholar] [CrossRef]
  5. MacLaren, J.F. National Inventory of Sources and Emissions of Asbestos (1970). Air Pollution Control Directorate Environmental Protection Service, Report APCD, 73-4, Ottawa. 1973. Available online: https://publications.gc.ca/site/fra/9.868627/publication.html (accessed on 15 October 2025).
  6. Bernstein, D.M.; Toth, B.; Rogers, R.A.; Sepulveda, R.; Kunzendorf, P.; Phillips, J.I. Evaluation of the dose-response and fate in the lung and pleura of chrysotile-containing brake dust compared to chrysotile or crocidolite asbestos in a 28-day quantitative inhalation toxicology study. Toxicol. Appl. Pharmacol. 2018, 351, 74–92. [Google Scholar] [CrossRef]
  7. Baigenzhenov, O.S.; Chepushtanova, T.A.; Altmyshbayeva, A.Z.; Temirgali, I.A.; Maldybayev, G.; Sharipov, R.H. Investigation of thermodynamic and kinetic regularities of asbestos waste leaching processes. Results Eng. 2024, 21, 102000. [Google Scholar] [CrossRef]
  8. CNESST. Asbestos. Commission des Normes, de L’équité, de la Santé et de la Sécurité du Travail. Available online: https://www.cnesst.gouv.qc.ca/en/prevention-securite/identifier-corriger-risques/liste-informations-prevention/asbestos (accessed on 1 January 2025).
  9. Beaudoin, G.; Hébert, R.; Constantin, M.; Duchesne, J.; Cecchi, E.; Huot, F.; Vigneau, S.; Fiola, R. Spontaneous carbonation of Serpentine in milling and mining waste, southern Québec and Italy. In Proceedings of the ACEME08, 2nd International Conference on Accelerated Carbonation for Environmental and Materials Engineering, Rome, Italy, 1–3 October 2008. [Google Scholar]
  10. Lévesque, A.; Bélanger, N.; Poder, T.G.; Filotas, É.; Dupras, J. From white to green gold: Digging into public expectations and preferences for ecological restoration of asbestos mines in southeastern Quebec, Canada. Extr. Ind. Soc. 2020, 7, 1411–1423. [Google Scholar] [CrossRef]
  11. Grenier, F. L’industrie canadienne de l’amiante. Cah. Géographie Qué 1959, 3, 329. [Google Scholar] [CrossRef]
  12. Kuyek, J. Asbestos Mining in Canada. In Proceedings of the International Ban Asbestos Conference, Ottawa, ON, Canada, 13 September 2003. [Google Scholar]
  13. State Land Hazards and Contaminated Sites. Available online: https://www.wa.gov.au/government/document-collections/state-land-hazards-and-contaminated-sites (accessed on 15 June 2025).
  14. Riordon, P.H. Geology of The Asbestos Deposits of Southern Québec; Report DP-186; Ministère des Ressources Naturelles. 1973. Available online: https://gq.mines.gouv.qc.ca/documents/examine/dp186/DP186.pdf (accessed on 15 June 2025).
  15. Schroetter, J.; Tremblay, A.; Bédard, J.H. Structural evolution of the Thetford Mines Ophiolite Complex, Canada: Implications for the southern Québec ophiolitic belt. Tectonics 2005, 24, TC1001, Erratum in Tectonics 2005, 24 https://doi.org/10.1029/2005TC001799. [Google Scholar] [CrossRef]
  16. Dana, J.D. A System of Mineralogy: Including an Extended Treatise on Crystallography: With an Appendix, Containing the Application of Mathematics to Crystallographic Investigation, and a Mineralogical Bibliography; Durrie & Peck and Herrick & Noyes, Ed.; Original from New York Public Library: New York, NY, USA, 1837; p. 571. Available online: https://catalog.hathitrust.org/Record/008631200 (accessed on 15 June 2025).
  17. Serpentine: The Mineral Serpentine Information and Pictures. Available online: https://www.minerals.net/mineral/serpentine.aspx (accessed on 15 June 2025).
  18. Lizardite Mineral Data. Available online: https://webmineral.com/data/Lizardite.shtml (accessed on 15 June 2025).
  19. Baigenzhenov, O.; Khabiyev, A.; Mishra, B.; Aimbetova, I.; Yulusov, S.; Temirgali, I. Asbestos Waste Treatment—An Effective Process to Selectively Recover Gold and Other Nonferrous Metals. Recycling 2022, 7, 85. [Google Scholar] [CrossRef]
  20. Chrysotile Mineral Data. Available online: https://webmineral.com/data/Chrysotile.shtml (accessed on 15 June 2025).
  21. Riebeckite Mineral Data. Available online: https://webmineral.com/data/Riebeckite.shtml (accessed on 15 June 2025).
  22. Grunerite Mineral Data. Available online: https://webmineral.com/data/Grunerite.shtml (accessed on 15 June 2025).
  23. Actinolite Mineral Data. Available online: https://webmineral.com/data/Actinolite.shtml (accessed on 15 June 2025).
  24. Anthophyllite Mineral Data. Available online: https://webmineral.com/data/Anthophyllite.shtml (accessed on 15 June 2025).
  25. Tremolite Mineral Data. Available online: https://webmineral.com/data/Tremolite.shtml (accessed on 15 June 2025).
  26. Maletaškić, J.; Stanković, N.; Daneu, N.; Babić, B.; Stoiljković, M.; Yoshida, K. Acid leaching of natural chrysotile asbestos to mesoporous silica fibers. Phys. Chem. Min. 2018, 45, 343–351. [Google Scholar] [CrossRef]
  27. Preiner, M.; Xavier, J.C.; Sousa, F.L.; Zimorski, V.; Neubeck, A.; Lang, S.Q. Serpentinization: Connecting Geochemistry, Ancient Metabolism and Industrial Hydrogenation. Life 2018, 8, 41. [Google Scholar] [CrossRef]
  28. Bédard, J.H.; Schroetter, J.-M.; Pagé, P.; Tremblay, A.; Bécu, V. Overview of the geology and Cr-PGE potential of the Southern Québec Ophiolite Belt. Geol. Assoc. Can. 2007, 5, 433–448. [Google Scholar]
  29. Li, X.; Chen, Y.; Li, X.; Wang, M.; Xie, W.; Ding, D. Asbestos-Environment Pollution Characteristics and Health-Risk Assessment in Typical Asbestos-Mining Area. Toxics 2023, 11, 494. [Google Scholar] [CrossRef]
  30. Jacques, O.; Pienitz, R. Asbestos mining waste impacts on the sedimentological evolution of the Bécancour chain of lakes, southern Quebec (Canada). Sci. Total Environ. 2022, 807, 151079. [Google Scholar] [CrossRef]
  31. Ministère de l’Environnement et de la Lutte Contre les Changements Climatiques (MELCC); Ministère de l’Énergie et des Ressources Naturelles (MERN). L’état des Lieux et la Gestion de l’Amiante et des Résidus Miniers Amiantés. Bureau D’audiences Publiques Sur L’environnement. 2020. Available online: https://www.bape.gouv.qc.ca/fr/dossiers/etat-des-lieux-et-gestion-de-l-amiante-et-residus-miniers-amiantes/ (accessed on 15 October 2025).
  32. Paolini, V.; Tomassetti, L.; Segreto, M.; Borin, D.; Liotta, F.; Torre, M. Asbestos treatment technologies. J. Mater. Cycles Waste Manag. 2019, 21, 205–226. [Google Scholar] [CrossRef]
  33. Talbi, G. Caractérisation, Destruction et Recyclage des Déchets Amiantés. Ph.D. Dissertation, Université Montpellier, Montpellier, France, 2018. [Google Scholar]
  34. Patents Assigned to Les Sables Olimag, Inc.—Justia Patents Search. Available online: https://patents.justia.com/assignee/les-sables-olimag-inc (accessed on 16 June 2025).
  35. Nkuna, R.; Ijoma, G.N.; Matambo, T.S.; Chimwani, N. Accessing Metals from Low-Grade Ores and the Environmental Impact Considerations: A Review of the Perspectives of Conventional versus Bioleaching Strategies. Minerals 2022, 12, 506. [Google Scholar] [CrossRef]
  36. Pasquier, L.C.; Mercier, G.; Blais, J.F.; Cecchi, E.; Kentish, S. Technical & economic evaluation of a mineral carbonation process using southern Québec mining wastes for CO2 sequestration of raw flue gas with by-product recovery. Int. J. Greenh. Gas. Control 2016, 50, 147–157. [Google Scholar]
  37. Wang, F.; Dreisinger, D.; Xiao, Y. Accelerated CO2 mineralization and utilization for selective battery metals recovery from olivine and laterites. J. Clean. Prod. 2023, 393, 136345. [Google Scholar] [CrossRef]
  38. Nowamooz, A.; Dupuis, J.C.; Beaudoin, G.; Molson, J.; Lemieux, J.M.; Horswill, M. Atmospheric Carbon Mineralization in an Industrial-Scale Chrysotile Mining Waste Pile. Environ. Sci. Technol. 2018, 52, 8050–8057. [Google Scholar] [CrossRef]
  39. Lin, X.; Li, X.; Liu, H.; Boczkaj, G.; Cao, Y.; Wang, C. A review on carbon storage via mineral carbonation: Bibliometric analysis, research advances, challenges, and perspectives. Sep. Purif. Technol. 2024, 338, 126558. [Google Scholar] [CrossRef]
  40. Pronost, J.; Beaudoin, G.; Tremblay, J.; Larachi, F.; Duchesne, J.; Hébert, R. Carbon Sequestration Kinetic and Storage Capacity of Ultramafic Mining Waste. Environ. Sci. Technol. 2011, 45, 9413–9420. [Google Scholar] [CrossRef]
  41. Exterra. Available online: https://exterracarbon.com/ (accessed on 15 September 2025).
  42. Nagamori, M.; Boivin, J.A. Technico-Economic Simulation for the Hcl-Leaching of Hybrid Serpentine and Magnesite Feeds. Can. Met. Q. 2001, 40, 47–60. [Google Scholar] [CrossRef]
  43. Chouinard, S. Valorisation des Résidus de Serpentine par Extraction du Magnésium au Moyen de Procédés Hydrométallurgiques. Master’s Dissertation, Université du Québec, Institut National de la Recherche Scientifique Centre Eau, Terre et Environnement, Québec, QC, Canada, 2006. [Google Scholar]
  44. Yoo, K.; Kim, B.S.; Kim, M.S.; Lee, J.C.; Jeong, J. Dissolution of Magnesium from Serpentine Mineral in Sulfuric Acid Solution. Mater. Trans. 2009, 50, 1225–1230. [Google Scholar] [CrossRef]
  45. Valouma, A.; Verganelaki, A.; Tetoros, I.; Maravelaki-Kalaitzaki, P.; Gidarakos, E. Magnesium oxide production from chrysotile asbestos detoxification with oxalic acid treatment. J. Hazard. Mater. 2017, 336, 93–100. [Google Scholar] [CrossRef]
  46. Talbi, G.; Cambon, M.; Cambon, O. Virtuous cycle of destruction and total recycling of pure asbestos and asbestos-containing waste. J. Mater. Cycles Waste Manag. 2019, 21, 1167–1176. [Google Scholar] [CrossRef]
  47. Shayakhmetova, R.A.; Mukhametzhanova, A.A.; Akbayeva, D.N.; Terlikbaeva, A.Z.h.; Osipov, P.A.; Alimzhanova, A.M. Magnesium and silicon recovery from chrysotile asbestos waste of the deposit Zhitikara, Kazakhstan. Sci. Rep. 2024, 14, 31866. [Google Scholar] [CrossRef]
  48. Chen, Y.; Yang, X.; Wu, L.; Tong, L.; Zhu, J. Recovery of Mg from H2SO4 Leaching Solution of Serpentine to Precipitation of High-Purity Mg(OH)2 and 4MgCO3·Mg(OH)2·4H2O. Minerals 2023, 13, 318. [Google Scholar] [CrossRef]
  49. Cheng, T.C.; Morissette, C.L.; Mines, T. Deportments of Magnesium and Silicon in a Two-part HCl-NaOH Leaching of Asbestos Tailings. In Proceedings of the Tailings & Mine Waste, Denver, CO, USA, 10–13 November 2024; pp. 1891–1901. [Google Scholar]
  50. Balagh, Z.; Ait-khouia, Y.; Benzaazoua, M.; Taha, Y. Magnesium and calcium extraction from phosphate mine waste rock using phosphoric acid: Thermodynamics, parameter optimization, kinetics, and reaction mechanism. J. Ind. Eng. Chem. 2025, 146, 812–825. [Google Scholar] [CrossRef]
  51. Taheri, B.; Larachi, F. Mineral-Based Magnesium Extraction Technologies: Current and Future Practices. Processes 2025, 13, 2945. [Google Scholar] [CrossRef]
  52. Celik, C.; Peacey, J.; Bishop, G.; White, C.; Giasson, E.; Avedesian, M. Magnola—An innovative process for magnesium production, Materials Science; Metallurgy & Metallurgical Engineering. In Proceedings of the 3rd International Magnesium Conference, Manchester, UK, 10–12 April 1996; Available online: https://www.webofscience.com/wos/WOSCC/full-record/A1997BJ62T00003 (accessed on 16 June 2025).
  53. Telgerafchi, A.E.; Rutherford, M.; Espinosa, G.; McArthur, D.; Masse, N.; Perrin, B. Magnesium production by molten salt electrolysis with liquid tin cathode and multiple effect distillation. Front. Chem. 2023, 11, 1192202. [Google Scholar] [CrossRef]
  54. Fournier, J.; Gauthier, L. Process to Produce Magnesium Compounds, and Various by-Products Using Sulfuric Acid in a HCl Recovery Loop. U.S. Patent EP3221479A1, 30 October 2018. Available online: https://patents.google.com/patent/EP3221479A1/en?oq=US+Patent+EP3221479A1 (accessed on 16 June 2025).
  55. Dutrizac, J.E.; Chen, T.T.; White, C.W. Fundamentals of Serpentine Leaching in Hydrochloric Acid Media. In Magnesium Technology, 1st ed.; Wiley: Hoboken, NJ, USA, 2000; pp. 40–51. [Google Scholar]
  56. Baigenzhenov, O.S.; Kozlov, V.A.; Luganov, V.A.; Mishra, B.; Shayahmetova, R.A.; Aimbetova, I.O. Complex Processing of Wastes Generated in Chrysotile Asbestos Production. Min. Process Extr. Met. Rev. 2015, 36, 242–248. [Google Scholar] [CrossRef]
  57. Abdel-Aal, E.A.; El-Sayed, D.; Ismail, A.K.; El-Hosieny, F.I. Hydrometallurgical processing of serpentine ore. IOP Conf. Ser. Mater. Sci. Eng. 2018, 427, 012028. [Google Scholar] [CrossRef]
  58. Morgan, A. Acid leaching studies of chrysotile asbestos from mines in the Coalinga region of California and from Quebec and British Columbia. Ann. Occup. Hyg. 1997, 41, 249–268. [Google Scholar] [CrossRef] [PubMed]
  59. Faraji, F.; Golmohammadzadeh, R.; Rashchi, F.; Alimardani, N. Fungal bioleaching of WPCBs using Aspergillus niger: Observation, optimization and kinetics. J. Environ. Manag. 2018, 217, 775–787. [Google Scholar] [CrossRef]
  60. Liu, Y.; Shi, P.; Chao, Q.; Jiang, M. Efficient acid leaching of high-magnesium boron tailings and the low-cost recovery of siliceous residues with good adsorption capacity. Hydrometallurgy 2022, 209, 105827. [Google Scholar] [CrossRef]
  61. Tian, B.; Cui, Y.; Qin, Z.; Wen, L.; Li, Z.; Chu, H. Indirect bioleaching recovery of valuable metals from electroplating sludge and optimization of various parameters using response surface methodology (RSM). J. Environ. Manag. 2022, 312, 114927. [Google Scholar] [CrossRef] [PubMed]
  62. Kolbadinejad, S.; Ghaemi, A. Optimization of atmospheric leaching parameters for cadmium and zinc recovery from low-grade waste by response surface methodology (RSM). Sci. Rep. 2024, 14, 1490. [Google Scholar] [CrossRef]
  63. Kumari, M.; Gupta, S.K. Response surface methodological (RSM) approach for optimizing the removal of trihalomethanes (THMs) and its precursors by surfactant modified magnetic nanoadsorbents (sMNP)—An endeavor to diminish probable cancer risk. Sci. Rep. 2019, 9, 18339. [Google Scholar] [CrossRef]
  64. Gavras, D.F. Mössbauer Study of Hand-Picked Minerals from Natural Asbestos Tailings—Summer Report; Physics Department, McGill University: Montreal, QC, Canada, 2024; p. 36. [Google Scholar]
  65. Marzini, L.; Osticioli, I.; Ciofini, D.; Agresti, J.; Bellagamba, S.; Paglietti, F. Identification, mapping, and quantification of asbestos minerals in ACM and NOA using NIR-SWIR hyperspectral scan imaging: Preliminary study. Spectrochim. Acta A Mol. Biomol. Spectrosc. 2025, 333, 125893. [Google Scholar] [CrossRef]
  66. Kabombo, D.; Azizi, D.; Hébert, R.; Larachi, F. Multistep concentration of lizardite/antigorite from chrysotile mine tailings—case of the Carey Mine site in East-Broughton (Québec). Int. J. Chem. React. Eng. 2021, 19, 483–498. [Google Scholar] [CrossRef]
  67. Liu, X.; Ma, Y.; Yan, W.; He, M.; Li, L.; Sui, X. Identify key serpentines antigorite, lizardite and chrysotile with various compositions and crystallographic orientations using micro-Raman spectroscopy. Solid. Earth Sci. 2023, 8, 295–304. [Google Scholar] [CrossRef]
  68. Sarvaramini, A.; Larachi, F. Mössbauer Spectroscopy and Catalytic Reaction Studies of Chrysotile-Catalyzed Steam Reforming of Benzene. J. Phys. Chem. C 2011, 115, 6841–6848. [Google Scholar] [CrossRef]
  69. Rinaudo, C.; Gastaldi, D. Characterization of Chrysotile, Antigorite and Lizardite By FT-RAMAN spectroscopy. Can. Mineral. 2003, 41, 883–890. [Google Scholar] [CrossRef]
  70. Laboratoire Silica Determination and Quantification of Asbestos Fibers by Microscopy. Private Report 2023, 2.
  71. Activation Laboratories Ltd. X-Ray Diffraction Analysis of Four Samples; A24-04494; Activation Laboratories Ltd.: Ancaster, ON, Canada, 2024; 7p. [Google Scholar]
  72. Shi, L. McGill Microprobe Laboratory. Available online: https://www.eps.mcgill.ca/~lang/Web/Probe/main.html (accessed on 16 June 2025).
  73. Ancey, M.; Batenaire, F.; Tixier, R. Application of Statistical Methods in Microanalysis. Chapter 7. In Microanalysis and Scanning Electron Microscopy; Summer School; St-Martin-d’Héres; 38401; France; Maurice, F., Meny, L., Tixier, R., Eds.; Les Editions de Physique: Orsay, France, 1978; pp. 319–342. [Google Scholar]
  74. Okai, T. Preparation of new GSJ geochemical reference material JA-1a (Andesite) and collaborative analysis of JA-1a and JSO-1 (Soil). In Proceedings of the 50th Annual Meeting of the Geochemical Society of Japan; 2003; p. 49. Available online: https://cir.nii.ac.jp/crid/1571135650999739904?lang=en (accessed on 16 June 2025).
  75. El-Sayed, D.; Ismail, A.K.; El-Hosiny, F.I. Magnesium Chloride Crystals with Studying Mechanism and Leaching Kinetics of Serpentinite Ore by Hydrochloric Acid. Trans. Indian. Inst. Met. 2023, 76, 1439–1446. [Google Scholar] [CrossRef]
  76. Beglaryan, H.; Isahakyan, A.; Zulumyan, N.; Melikyan, S.; Terzyan, A. A study of magnesium dissolution from serpentinites composed of different serpentine group minerals. Min. Eng. 2023, 201, 108171. [Google Scholar] [CrossRef]
  77. Dastkhoon, M.; Ghaedi, M.; Asfaram, A.; Goudarzi, A.; Langroodi, S.M.; Tyagi, I. Ultrasound assisted adsorption of malachite green dye onto ZnS: Cu-NP-AC: Equilibrium isotherms and kinetic studies—Response surface optimization. Sep. Purif. Technol. 2015, 156, 780–788. [Google Scholar] [CrossRef]
  78. Daval, D.; Hellmann, R.; Martinez, I.; Gangloff, S.; Guyot, F. Lizardite serpentine dissolution kinetics as a function of pH and temperature, including effects of elevated pCO2. Chem. Geol. 2013, 351, 245–256. [Google Scholar] [CrossRef]
  79. Yardley, E. Enhancing the Dissolution of Lizardite with Oxalate. Available online: https://digitalcommons.library.umaine.edu/etd/1736 (accessed on 15 June 2025).
  80. Zhao, D.; Sun, H.; Peng, T.; Zeng, L. Ionic dissolution and structural evolution of chrysotile and lizardite at the mineral–water interface: Reactions in sulfuric acid solution. Clays Clay Min. 2024, 72, e32. [Google Scholar] [CrossRef]
  81. Lacinska, A.M.; Styles, M.T.; Bateman, K.; Wagner, D.; Hall, M.R.; Gowing, C. Acid-dissolution of antigorite, chrysotile and lizardite for ex situ carbon capture and storage by mineralisation. Chem. Geol. 2016, 437, 153–169. [Google Scholar] [CrossRef]
  82. Mellini, M.; Fuchs, Y.; Viti, C.; Lemaire, C.; Linarè, S.J. Insights into the antigorite structure from Mössbauer and FTIR spectroscopies. Eur. J. Miner. 2002, 14, 97–104. [Google Scholar] [CrossRef]
  83. O’Hanley, D.S.; Dyar, M.D. The composition of lizardite 1T and the formation of magnetite in serpentinites. Am. Miner. 1993, 78, 391–404. [Google Scholar]
  84. Delina, R.E.G.; Perez, J.P.H.; Stammeier, J.A.; Bazarkina, E.F.; Benning, L.G. Partitioning and Mobility of Chromium in Iron-Rich Laterites from an Optimized Sequential Extraction Procedure. Environ. Sci. Technol. 2024, 58, 6391–6401. [Google Scholar] [CrossRef]
  85. Doriguetto, A.C.; Fernandes, N.G.; Persiano, A.I.C.; Filho, E.N.; Grenèche, J.M.; Fabris, J.D. Characterization of a natural magnetite. Phys. Chem. Min. 2003, 30, 249–255. [Google Scholar] [CrossRef]
  86. Viti, C.; Mellini, M. Contrasting chemical compositions in associated lizardite and chrysotile in veins from Elba, Italy. Eur. J. Miner. 1997, 9, 585–596. [Google Scholar] [CrossRef]
  87. Dyar, M.D.; Agresti, D.G.; Schaefer, M.W.; Grant, C.A.; Sklute, E.C. Mössbauer spectroscopy of earth and planetary materials. Annu. Rev. Earth Planet. Sci. 2006, 34, 83–125. [Google Scholar] [CrossRef]
  88. Haynes, W.M.; Lide, D.R.; Bruno, T.J. CRC Handbook of Chemistry and Physics, 97th ed.; CRC Press: Boca Raton, FL, USA, 2016; Available online: https://www.taylorfrancis.com/books/9781498754293 (accessed on 20 June 2025).
  89. Montgomery, D.C. Design and Analysis of Experiments; John Wiley & Sons: Hoboken, NJ, USA, 2005; p. 643. [Google Scholar]
  90. Sagbas, A. Analysis and optimization of surface roughness in the ball burnishing process using response surface methodology and desirability function. Adv. Eng. Softw. 2011, 42, 992–998. [Google Scholar] [CrossRef]
  91. Somot, S. Radium, Uranium et Métaux Dans Les Résidus de Traitement Dynamique, Acide et Alcalin, de Minerais d’Uranium. Sciences de la Terre. Doctoral Dissertation, Université Henri Poincaré, Nancy, France, 1997. [Google Scholar]
  92. Ndlovu, B.N.; Forbes, E.; Becker, M.; Deglon, D.A.; Franzidis, J.P.; Laskowski, J.S. The effects of chrysotile mineralogical properties on the rheology of chrysotile suspensions. Miner. Eng. 2011, 24, 1004–1009. [Google Scholar] [CrossRef]
  93. Hintikka, V.V.; Kalapudas, R.P.; Viitanen, P.I. Effect of Rheology of Grinding Efficiency in the Laboratory Scale Continuous Classifying Mill. Miner. Process. Extr. Metall. Rev. 2000, 20, 133–154. [Google Scholar] [CrossRef]
  94. Uddin, S.; Rao, S.R.; Mirnezami, M.; Finch, J.A. Processing an ultramafic ore using fiber disintegration by acid attack. Int. J. Miner. Process. 2012, 102, 38–44. [Google Scholar] [CrossRef]
  95. Radziszewski, P. Energy recovery potential in comminution processes. Miner. Eng. 2013, 46, 83–88. [Google Scholar] [CrossRef]
  96. Bobicki, E.R.; Liu, Q.; Xu, Z. Microwave Treatment of Ultramafic Nickel Ores: Heating Behavior, Mineralogy, and Comminution Effects. Minerals 2018, 8, 524. [Google Scholar] [CrossRef]
  97. Bobicki, E.R.; Liu, Q.; Xu, Z. Effect of microwave pre-treatment on ultramafic nickel ore slurry rheology. Miner. Eng. 2014, 61, 97–104. [Google Scholar] [CrossRef]
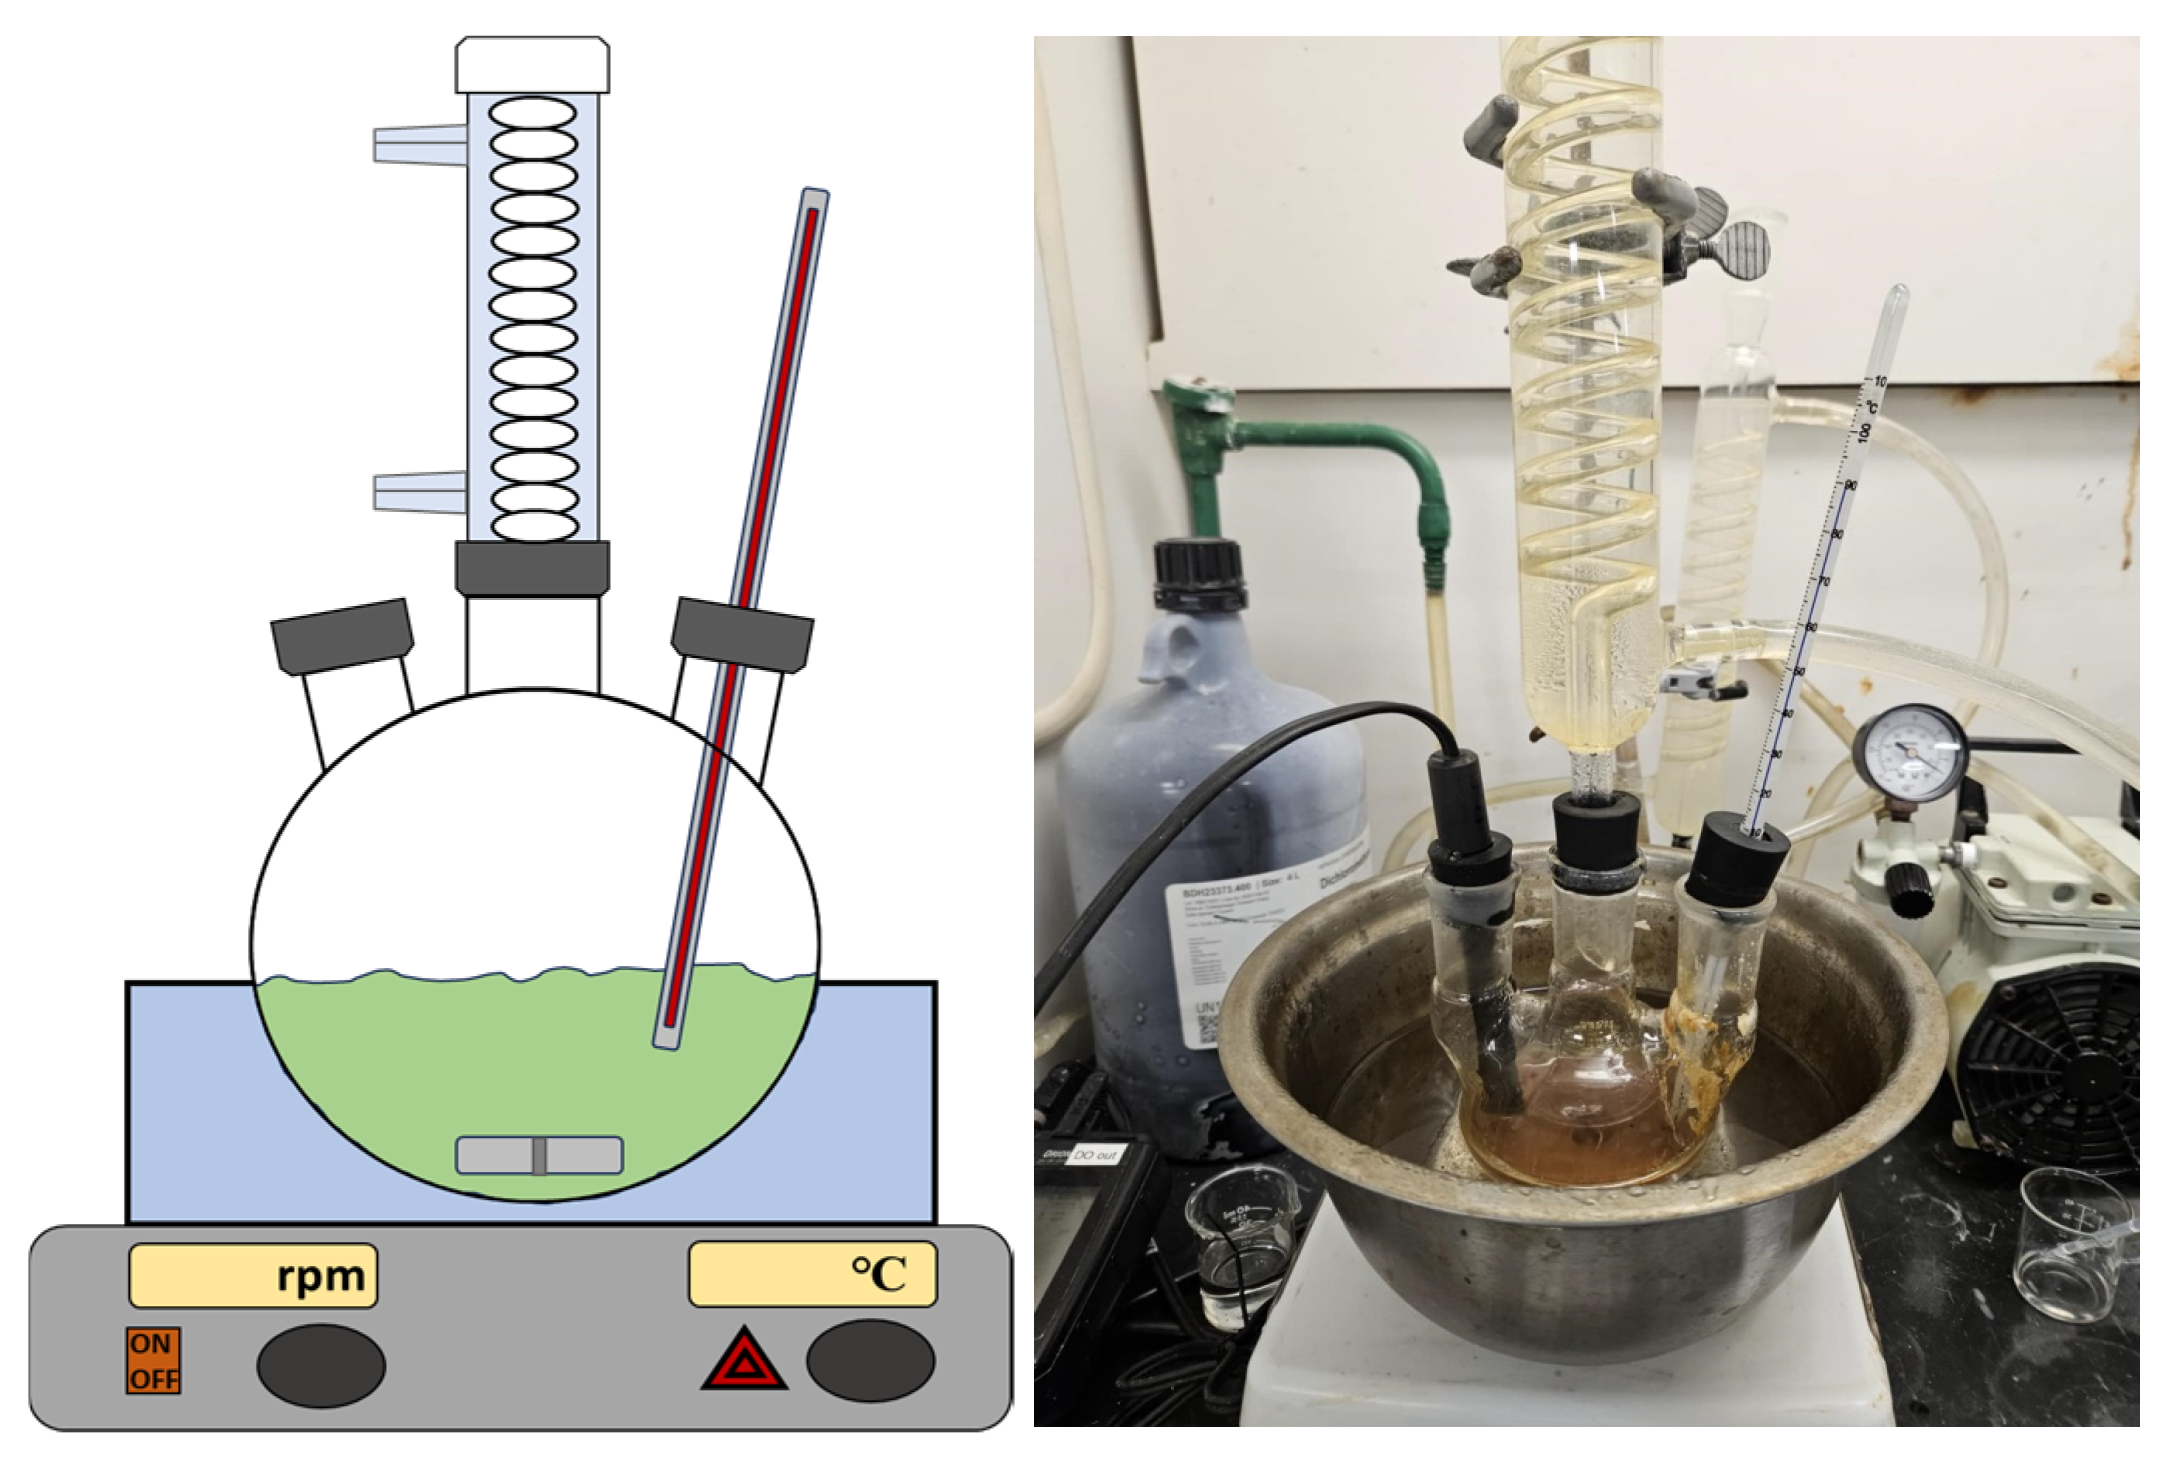
Figure 1. Scheme of the experimental set-up for the leaching experiments and picture of the set-up with the water-bath heating system.
Metals 15 01215 g001
Figure 2. Particle size distribution of 5 random batches of residue (E = sample).
Metals 15 01215 g002
Figure 3. Effect of individual factors, i.e., HCl concentration, solid to liquid ratio and temperature, on the Mg (top three graphs) and Fe (lower three graphs) recovery. Black lines (main lines) represent the effect of parameters based on the developed model, blue area shows the confidence interval according to the model, and red dots are the actual data points with red line being a representation of the uncertainty.
Metals 15 01215 g003
Figure 4. 3D surface plot and 2D contour plot of Mg and Fe recoveries in response to the interaction of acid concentration and temperature. The warmer the color, the higher the recovery. Red dots are the actual data points used by the model.
Metals 15 01215 g004
Figure 5. 3D surface plot and 2D contour plot of Mg and Fe recoveries in response to the interaction of acid concentration and solid to liquid ratio. The warmer the color, the higher the recovery. Red dots are the actual data points used by the model.
Metals 15 01215 g005
Figure 6. 2D contour plot of Mg and Fe recoveries in response to the interaction of temperature and solid to liquid ratio. The warmer the color, the higher the recovery.
Metals 15 01215 g006
Figure 7. Desirability study for maximum Mg recovery in HCl system, following the experimental leaching results on 23 tests. Red circles represent optimal designed leaching conditions, while blue circles represent predicted responses for MCS recoveries.
Metals 15 01215 g007
Figure 8. Comparison of metal recovery percentages based on results from four triplicate tests.
Metals 15 01215 g008
Figure 9. Kinetic study of metals dissolution.
Metals 15 01215 g009
Figure 10. Comparison of Predicted and Experimental metal recoveries.
Metals 15 01215 g010
Table 2. Crystalline minerals identified in the head-sample.
Identified Minerals [64,71]Estimated Amounts
serpentine (lizardite, chrysotile mostly)Most of the sample
chloriteFew percents
forsterite (Mg-olivine)Few percents
brucite (Mg (OH)2)Few percents
magnetite (Fe3O4, and other spinels)Minor
quartz (SiO2)Accessory
Table 3. Room-temperature hyperfine parameters determined by Mossbauer spectroscopy on chrysotile free head-sample (significant digits are reported followed by the incertitude value into parentheses).
Mineralδ (mm/s)Δ (mm/s)Bhf (T)Area
Lizardite 1 This study
Component 1 (Fe2+)1.15(1)2.75(1)060.0
Component 2 (Fe2+)1.16(1)2.20(1)019.3
Component 3 (Fe3+)0.32(2)0.59(4)020.7
Antigorite This study
Component 1 (Fe2+)1.14(1)2.71(1)090
Component 2 (Fe3+)0.25(2)0.42(3)010
Magnetic fraction of the head sample This study
Component 1 0.28(1)−0.02(1)48.7(1)24Assigned to magnetite
Component 2 0.64(1)+0.02(2)45.7(1)37Assigned to magnetite
Component 3 (Fe2+)1.15(1)2.84(1)025Assigned to antigorite
Component 4 (Fe3+)0.38(1)0.46(1)08-
Component 4 (Fe3+)0.45(1)1.05(1)06-
Table 4. Chemical analysis results for 5 random batches (certificates 30806 to 30810) obtained by XRF (%).
OxideUnit12 2 4 5 MeanStd. Dev.
SiO2%36.3736.0835.7935.8336.4336.10.3
Al2O3%0.860.810.780.700.670.760.07
CaO%0.210.340.200.160.210.220.06
MgO%40.2740.0040.3240.9940.4240.40.3
Na2O%-------
K2O%0.020.050.050.020.040.040.01
Fe2O3%8.478.919.088.508.288.70.3
TiO2%-------
MnO%0.120.110.110.100.120.110.01
Cr2O3%0.280.300.320.280.400.310.04
NiO%0.280.290.310.330.320.310.02
LOI%12.9612.9612.9612.9612.96--
Table 5. Contents of metals of interest for the project in the head sample, as given for the W-series and the D-series (expressed in ppm, plus or minus the standard deviation and, under brackets, followed by the relative error).
RunMg (ppm)Al (ppm)Cr (ppm)Mn (ppm)Fe (ppm)Co (ppm)Ni (ppm)
W-series210,000234567088573,242982227
An. Series (n = 3)209,036 ± 1364 (0.7%)2763 ± 604 (22%)593 ± 31 (5%)854 ± 34 (4%)62,932 ± 2335 (4%)97 ± 3 (3%)2144 ± 67 (3%)
D-series (n = 5)236,038 ± 4991 (2%)2748 ± 231 (8%)706 ± 41 (6%)814 ± 20 (3%)60,286 ± 1750 (3%)95 ± 3 (3%)1868 ± 97 (5%)
Table 6. Experimental recoveries values of metal species in leaching solutions. Selected experimental conditions for acid concentration, solid to liquid ratio and temperature levels were designed by using Stat-Ease prior to experiments (next paragraph).
RunAcid Concentration (mol/L)Solid to Liquid Ratio (%)Temperature (°C)Mg (%)Al (%)Cr (%)Mn (%)Fe (%)Co (%)Ni (%)
12.0106069262559276579
25.5409064262558467176
312.0133031132151686578
45.51020187936144253
57.0255568313165717885
62.0405017372753037
712.036831236558104115118124
87.0255566273262677986
95.510202171242175062
108.625202071241415664
117.0255555273366687978
1210.21090854448848610095
138.713301981643496058
148.74055632731.66747977
158.5259090455378828182
162.0239028013473737
1712.0368580393871748074
185.140201961040174954
197.0255570283571837983
2010.440202181546555959
217.0255567273270787882
225.0109011049519696100106
232.02720187941134754
Note: There are some values greater than 100% recoveries. This is explained by unavoidable uncertainties in sampling and characterization of such samples (refer to Section 3.1.3). The order of magnitude of the uncertainty on recoveries (a quotient) is as expected.
Table 7. ANOVA for Mg leaching behavior from the asbestos tailings using HCl using Stat-Ease.
SourceSum of SquaresdfMean SquareF-Valuep-Value
Model18,705.9253741.1814.71<0.0001Significant
A: HCl concentration1573.4511573.456.190.0235
B: Solid to liquid ratio283.081283.081.110.3062
C: Temperature12,073.9112,073.947.48<0.0001
AB1199.1911199.194.720.0443
AC1081.8811081.884.250.0548
Residual4323.0217254.3
Lack of Fit3177.6110317.761.940.1954Not significant
Pure Error1145.417163.63
Cor Total23,028.9322
Table 8. ANOVA for Fe leaching efficiency from the asbestos tailings using HCl using Stat-Ease.
SourceSum of SquaresdfMean SquareF-Valuep-Value
Model18,885.0692098.349.230.0002Significant
A: HCl concentration10,558.25110,558.2546.45<0.0001
B: Solid to liquid ratio251.431251.431.110.3121
C: Temperature4187.3414187.3418.420.0009
AB262.691262.691.160.3019
AC234.321234.321.030.3285
BC843.731843.733.710.0762
A2904.441904.443.980.0675
B2109.571109.570.4820.4997
C21009.3711009.374.440.0551
Residual2955.0913227.31
Lack of Fit1753.66292.271.70.2507Not significant
Pure Error1201.497171.64
Cor Total21,840.1522
Table 9. Average results of triplicate trials with 10 N at 80 °C (Tests 24 A, B, C).
% Recovery
MgAlCrMnFeCoNi
Analysed Feed90626681928892
(σ = 2)(σ = 3)(σ = 3)(σ = 10)(σ = 2)(σ = 2)(σ = 2)
Calculated Feed88596483918791
(σ = 3)(σ = 2)(σ = 3)(σ = 8)(σ = 3)(σ = 2)(σ = 2)
Mean89616582928892
Sigma tot44413433
Table 10. Average results of triplicate trials with 10 N at 90 °C (Tests 25 A, B, C).
% Recovery
MgAlCrMnFeCoNi
Analysed Feed92657190949093
(σ = 1)(σ = 2)(σ = 1) (σ = 1)(σ = 1)(σ = 1)(σ = 2)
Calculated Feed91616990939292
(σ = 2)(σ = 1)(σ = 1)(σ = 1)(σ = 1)(σ = 3)(σ = 2)
Mean92637090949193
Sigma tot2211133
Table 11. Average results of triplicate trials with 12 N at 80 °C (Tests 26 A, B, C).
% Recovery
MgAlCrMnFeCoNi
Analysed Feed88646982.591.587.591
(σ = 1)(σ = 3)(σ = 1)(σ = 0.5)(σ = 0.5)(σ = 0.5)(σ = 1)
Calculated Feed86566683.590.586.591
(σ = 1)(σ = 1)(σ = 2) (σ = 0.5)(σ = 0.5)(σ = 0.5)(σ = 1)
Mean87606883918791
Sigma tot1321111
Table 12. Average results of triplicate trials with 12 N at 90 °C (Tests 27 A, B, C).
% Recovery
MgAlCrMnFeCoNi
Analysed Feed92777186949193
(σ = 1)(σ = 15)(σ = 3)(σ = 2) (σ = 1)(σ = 0.5)(σ = 1)
Calculated Feed90726886939093
(σ = 1)(σ = 18) (σ = 3) (σ = 2)(σ = 1)(σ = 1)(σ = 1)
Mean92757086949193
Sigma tot12343111
Disclaimer/Publisher’s Note: The statements, opinions and data contained in all publications are solely those of the individual author(s) and contributor(s) and not of MDPI and/or the editor(s). MDPI and/or the editor(s) disclaim responsibility for any injury to people or property resulting from any ideas, methods, instructions or products referred to in the content.