Abstract
Understanding the microstructure–property relationship in aluminum extrusions is crucial to leverage their potential in automotive lightweighting. The sensitivity of the processing history to the microstructure and through-thickness variations poses a major challenge since it leads to strong directionality in plasticity and fracture. Reliable characterization of the mechanical response under relevant stress states is crucial for the development of modeling strategies and performance ranking in alloy design. To this end, tensile and 3-point bend tests were performed for an aluminum extrusion produced on a laboratory-scale extrusion press at Rio Tinto Aluminium. Direct measurements of surface strains during bending using stereoscopic digital image correlation revealed that a larger bend angle in the VDA238-100 test does not necessarily imply a higher fracture strain. The T4 sample tested in the extrusion direction sustained a bend angle of 104° compared to 68° in T6 for the same nominal bend severity (ratio of sheet thickness to punch radius), despite comparable major fracture strains of 0.60 and 0.58, respectively. It is proposed that the work-hardening behavior governs the strain distribution on the outer bend surface. The higher hardening rate in the T4 condition helped distribute deformation in the bend zone more uniformly. This delayed fracture to larger bend angles since strain is accumulated at a lower rate. To assess whether the effect of the hardening behavior is manifest at a microstructural lengthscale, microcomputed tomography (μ-CT) scans were conducted on interrupted bend samples. The distribution and severity of damage in the form of cracks on the outer bend surface were distinct to the temper and thus the hardening rate.
1. Introduction
The strive towards a carbon-neutral future has accelerated the transition from internal combustion engine (ICE) vehicles to electric vehicles (EVs). A byproduct of this trend is the added weight of the battery packs. For example, the Ford F-150 Lightning is 28% heavier than the equivalent ICE [1], and the vehicle weight is proportional to the driving range of EVs [2]. Thus, the idea is to offset the added weight of the battery pack through lightweighting solutions that provide sufficient strength and energy absorption for crashworthiness [3]. Aluminum extrusions are highly suitable for structural applications within the vehicle frame, i.e., the vehicle bumper, crush tubes, and rocker panels, due to their high specific strength, cost-effectiveness, and design flexibility [4]. The complex deformation history, inherent to the extrusion process, introduces a crystallographic texture that leads to strong anisotropy in the mechanical properties and fracture limits [5,6,7]. To promote the widespread adoption of aluminum extrusions in automotive vehicles, a fundamental understanding of the material response under different deformation modes relevant to crash applications is required.
The VDA238-100 [8,9,10] tight radius bend test, hereinafter referred to as the V-Bend test, was identified as a suitable test method to characterize the folding behavior in energy-absorbing structural components. A square sample is bent between a pair of rollers and a sharp punch until fracture on the outer (convex) surface occurs. Fracture identification in the VDA238-100 guideline relies on a 30–60 N reduction from the maximum punch force. The bend angle, which can be approximated from the punch displacement and geometric conditions, serves as the sole metric in the VDA238-100 specification for material ranking. Research conducted during the last decade has led to improvements in the accuracy and reliability of the V-Bend test. Noticeable contributions include validation of bend angle measurements [11], incorporation of Digital Image Correlation (DIC) for optical strain measurements [12,13], development of enhanced fracture detection methods [14,15,16,17], and extension to a severe stretch-bend mode for testing of high-ductility alloys [18].
Efforts to infer the relationship between microstructure and bendability of aluminum alloys have been well documented in the literature and will be briefly summarized in the following section. Davidkov et al. [19] identified the alloy composition and heat treatment, which control the strengthening phase and its distribution in the microstructure, as the governing factors for bendability. For the AA6016 aluminum alloy, the presence of β-phase and/or Q-phase in the grain boundary structures was found to promote intergranular fracture, thereby reducing the alloy bendability. Using the same alloy, Castany et al. [20] found that the quench rate is irrelevant for the initiation of cracking, but does control its propagation. The latter was decreased after rapid quenching due to the formation of Mg2Si precipitates along grain boundaries instead of Si precipitates during slow cooling, which controls micro-voiding during crack propagation. Sarkar et al. [21] studied the effect of the iron content in AA5754 sheets on damage accumulation during in situ bending in a scanning electron microscope. A lower iron content (0.08 wt.%) promoted the development of surface instability, visible through undulations on the convex bend surface. The higher iron-containing alloy (0.30 wt.%) formed cracks on the tensile surface, initiated at the iron-rich particles, that adversely affected bendability. The influence of the crystallographic texture, i.e., Cube or Goss, on bendability was revealed in single-crystal experiments of Al-Mg-Si alloys in the study of Ikawa et al. [22]. Superior bendability was reported for a Cube orientation that was independent of the loading direction. Finite-element analysis revealed that the strain localization behavior was specific to the crystal orientation.
In light of the importance of bend performance in material selection, selective studies aimed to correlate material bendability with standard mechanical properties in a tensile test. Snilsberg et al. [23] provided insight into anisotropy in bending and potential correlations with tensile properties of 6000- and 7000-series aluminum extrusions. They found that the direction of the highest fracture strain in the tensile test correlated with the largest bend angle when the principal strain axis was aligned with the extrusion direction (ED); however, inconsistent trends were observed in the diagonal direction, DD (45° to ED). These results were supported by the work of Kordmir [24] on Al-Mg-Si-(Mn) extrusion alloys, who found a linear correlation between the fracture strain in uniaxial tension and the maximum bend angle when the material was tested in the ED and the transverse direction, TD (90° to ED), with inconsistencies in DD. Sarkar et al. [25] found good correlation between bendability and some tensile properties of a T4 heat-treated AA6111 aluminum alloy with varying iron contents (0.06 to 0.68 wt.%). While bendability was reduced for increased iron contents, the yield strength and elongation in the tensile test were unaffected. However, the tensile ductility, measured from the cross-sectional area of the tensile sample at fracture, was reduced by approximately 9% over the studied iron levels that correlated with reduced bendability. These correlations between the minimum bend radius without fracture and the tensile cross-sectional area at fracture are well supported by early studies of Datsko and Yang [26]. Similar trends were found in the study of Westermann et al. [27] on AA7108 extrusions, for which highest tensile ductility in DD, measured from area reduction after fracture, correlated with largest bend angles when the bend axis was aligned in DD.
These studies all have a common reliance upon global geometric relations via the bend angle or sheet/ punch radii to assess bendability and deduce a performance ranking. Cheong et al. [28] recommended caution about solely relying on the bend angle for performance assessment of steel grades of different sheet thicknesses due to the inherent dependence of the bend angle upon the bend severity (ratio of sheet thickness to the punch radius). For example, the bend angle to reach the material fracture strain, which is treated as a material property for a specific stress state, is reached earlier for higher bend severities. Empirical correction methods to account for thickness effects in the bend angle have been proposed from 12 steel grades, but universal applicability remains unclear [29]. Consideration of surface strains, for example, in a V-Bend setup equipped with a DIC system, eliminates the thickness dependence inherent in the bend angle. Nevertheless, it is shown in the present study that even for the same material thickness, surface strain measurements should supplement bend angle analysis for performance ranking of materials with different hardening rates (e.g., such as aluminum alloys with different tempers), since strain accumulation in the bend zone is governed by the material hardening rate. The effect of the hardening rate on the VDA bending performance of aluminum extrusions is addressed in the present study by employing a combined mechanical-metallurgical approach encompassing tensile, V-Bend, and microcomputed tomography (μ-CT) scans of interrupted bend tests.
2. Material Selection and Processing History
The material examined in this study is based on AA6082 with the chemical composition listed in Table 1.

Table 1.
Chemical composition (in wt%) of AA6082.
A schematic overview of the processing history is depicted in Figure 1. Billets of 101.4 mm in diameter were direct chill (DC) cast at the research facility of Rio Tinto Aluminium. Homogenization was conducted in a stepwise manner that involved heating to 530 °C at a rate of 250 °C/h followed by a reduced heating rate of 50 °C/h to reach a temperature of 580 °C, where the material was held for 2 h and then water-quenched. The extrusion trials were performed on a 780-tonne extrusion press (Intoco, Gloucester, UK) at the Rio Tinto Aluminium research facility in Saguenay, Quebec. This 100 mm-diameter press was specifically designed to simulate the thermal and physical characteristics of industrial presses using multi-zone container heating, floating dummy block, full PLC control of the extrusion cycle, and a maximum ram speed of 40 mm/s [30]. The billets were induction heated to 490 °C, extruded with a container temperature of 480 °C and a ram speed of 5 mm/s. Since 95% of the work performed during this process is converted into heat, the extrusion exit temperature rose to 530 °C as measured by a contact thermocouple at the exit of the extrusion die. A standing wave water tank, located at a distance of 2.5 m from the die exit, served to quench the extrudate. The die aperture of 90 mm × 3 mm resulted in an extrusion ratio of 33:1. An exit speed of 10 m/min was approximated from the ram speed, the extrusion ratio, and the travel time between the die exit and water quench (~15 s).
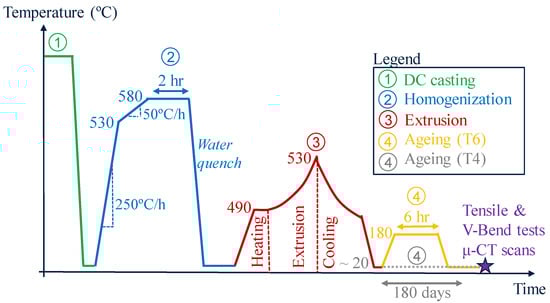
Figure 1.
Schematic overview of the processing history to produce AA6082 aluminum extrusions in T4 and T6 tempers.
A schematic diagram of the extrusion setup is illustrated in Figure 2. Considering the initial billet diameter and extrusion ratio, an 11 m long extrudate was produced. To ensure consistent mechanical properties of the extrudate, the front 2 m and back 2.5 m sections were scrapped. The remaining extrudate, referred to as sampling length, was characterized in the present study.

Figure 2.
A schematic of the extrusion setup at the Rio Tinto Aluminium facility utilized in the present study.
Two different heat treatments were considered in the present study to assess the effect of the microstructure on bendability. The first condition involved natural aging of the extrudate at room temperature for approximately 180 days to produce a T4 temper. The second scenario involved artificial aging in a silicon oil bath for 6 h at 180 °C, followed by quenching to room temperature to yield a T6 temper.
The microstructure across the extrudate thickness was examined in an optical microscope under polarized light after etching the samples with Barker’s reagent. As depicted in Figure 3, the center of the extrudate consisted of highly elongated grains that were primarily unrecrystallized. There was a thin surface layer of recrystallized grains defined as the peripheral coarse grain (PCG) layer. The average thickness of the PCG layer, retrieved from ten measurements, was 40 μm and 50 μm at the front and back of the sampling length, respectively. The PCG layer thickness was similar on the top and bottom of the sample.
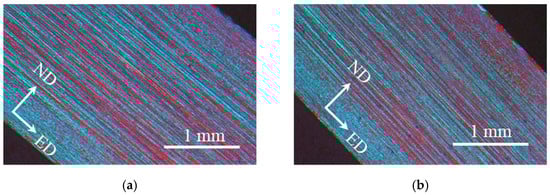
Figure 3.
Microstructure of the studied extrudate extracted from the front (a) and back (b) sample. The grain structure was revealed through Barker’s reagent. Note that ND corresponds to the normal direction perpendicular to the extrudate face, which represents the extrudate thickness.
3. Experimental Methodology
The mechanical test campaign involved tensile and V-Bend tests in both ED and TD. Here, one major focus was to provide insight into the significantly different hardening rates in the T4 and T6 tempers and study potential correlations with the bend performance in the VDA238-100 tests. To critically assess whether differences in the hardening rate are manifest on a microstructural level, for example, in the form of damage such as voids, the microstructure of interrupted bend tests was further analyzed in µ-CT scans.
3.1. Tensile Tests
Sub-size tensile geometries with a 30 mm gauge length, as depicted in Figure 4a, were wire electrical discharge machined (EDM) along the extrusion (ED) and transverse direction (TD). Tensile tests were performed in a 25 kN Instron 8872 tensile machine at a cross-head speed of 0.1 mm/s, which resulted in a strain rate of 3 × 10⁻³ s−1. Clip-on axial and width extensometers with gauge lengths of 12.5 mm and 5 mm, respectively, were attached to the specimen for strain measurements and removed shortly before fracture. The specimen was then pulled to fracture, and the rupture strain was approximated from post-mortem measurements of the fracture area. To this end, images of the fracture surfaces were taken under a scanning electron microscope (SEM) and imported into the ImageJ® software (version 1.54p) where the area of the fracture surface was measured. The true fracture strain was then approximated from the cross-sectional area before testing and after fracture. Details can be found in Fini [31].
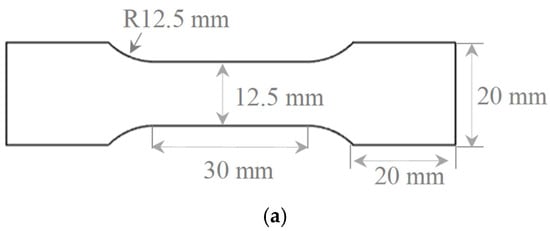
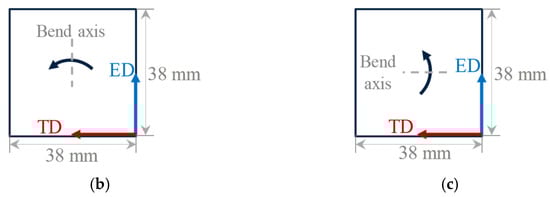
Figure 4.
Sample geometries for the tensile tests (a) and V-Bend tests illustrating bending in TD (b) and bending in ED (c). Note that the as-measured extrudate thickness was 2.9 mm.
3.2. VDA238-100 Tight Radius Bend Test
Bend tests were performed in the inverted VDA238-100 [10] test frame at the University of Waterloo, which is equipped with a full-field stereoscopic DIC system that enables extraction of the strain on the outer (convex) surface where fracture is initiated. An overview of the inverted setup is depicted in Figure 5. The advantage of the inverted setup lies in the stationary punch, such that out-of-plane displacement can be correlated with sheet thinning during bending.
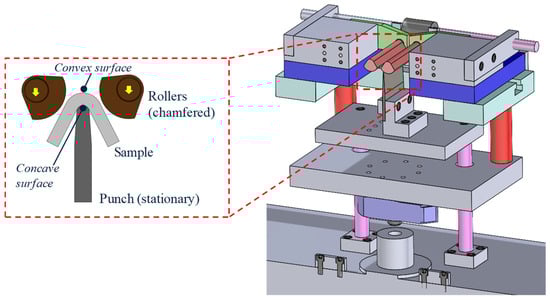
Figure 5.
Schematic of the inverted V-Bend setup at the University of Waterloo.
Square specimens of 38 mm × 38 mm and 2.9 mm in thickness were waterjet cut from the extrudate to perform bend tests in the TD and ED. The adopted terminology for the bend direction is schematically illustrated in Figure 4b–c. For example, bending in TD implies that the major strain direction is aligned with the TD such that the bend axis is parallel to ED, and vice versa for bending in ED. A deviation from the sample dimensions in the VDA recommendation was required in the present study due to geometric constraints of the extrudate, but plane strain tension (vanishing minor strain of ε2~0), as shown in Figure 6a, was maintained. Specimens were deformed between two descending rollers at a gap distance of 5.8 mm, which corresponds to twice the sheet thickness, and a 0.4 mm radius punch. Note that the test speed was reduced from 20 mm/min in the VDA recommendation to 2 mm/min to enable enhanced insight into fracture initiation through hairline cracks. These loading rates might differ from the boundary conditions encountered in real-world automotive applications where dynamic effects may lead to local adiabatic heating and material softening [32]. Fracture was identified from a 60 N load drop threshold of the peak punch force. This VDA load threshold correlated well with the presence of microcracks (see Figure 6c) since bend angles were low to moderate. For more ductile materials, adoption of the stress metric proposed by Noder et al. [17] is recommended to avoid inconclusive results, i.e., a reduction in the punch force without material rupture as a consequence of the kinematic boundary conditions of the test frame.

Figure 6.
Strain path of proportional plane strain tension in the V-Bend test (a). Visual inspection of the convex surface at the peak punch force (b) and the 60N VDA load drop in the peak punch force (c). Note that arrows indicate the location of cracks.
In addition to the tests to fracture, selective tests were manually interrupted near the peak punch force, which correlated with the presence of hairline cracks (see Figure 6b), for microstructural investigation in Section 3.3.
In the VDA 238-100 [10] specification, the bend angle, α, is utilized as the unique metric to assess the bend performance. Adopting the equivalent but more compact expression of the bend angle equation proposed in Larour et al. [33], α is computed from
where Rr is the roller radius, Rp the punch radius, t the sheet thickness, S the punch displacement, and L the roller gap. Note that A was introduced for convenience and corresponds to the sum of Rr, Rp, and t.
Note that the bend angle calculated in Equation (1) corresponds to the sample under load and is expected to differ from the bend angle measured after testing, e.g., with the aid of a protractor, when the sample has unloaded and the material has elastically recovered. Reliance upon the bend angle for performance ranking is problematic for materials with different thicknesses since the bend angle is governed by the bend severity [28]. Instead, Cheong et al. [28] showed that the fracture strain is independent of the bend severity and should complement the bend angle in the analysis. In the present study, it is suggested that even for the same bend severity, the bend angle is insufficient for performance ranking since it does not reflect the material hardening rate that ultimately governs the strain distribution within the bend zone.
To this end, full-field strain analysis on the convex surface was performed with the aid of DIC, in the inverted V-Bend test frame. During bending, images were collected at a frequency of 1.5 frames per second utilizing a pair of 35 mm lenses mounted to two Gazelle Point Grey cameras. Details on the DIC parameters are summarized in Table 2. The virtual strain gauge (VSG) was calculated from
Table 2.
Details on DIC parameters utilized in the strain analysis of the VDA238-100 tight-radius bend tests.
3.3. Tomographic Analysis
The effect of the hardening rate on the microstructure, i.e., spatial distribution of surface cracks, was studied in µ-CT using the Zeiss Xradia 520 Versa model (Carl Zeiss Canada Ltd., Toronto, ON, Canada). For details on the methodology of µ-CT, the reader is referred to Boerckel et al. [34]. Scans of a field of view of approximately 10,000 µm with a voxel size of 10 µm were generated using an X-ray source of 80 kV. The software Dragonfly® (version 2024.1) was utilized for image rendering. Sample preparation involved water jet cutting along the contours schematically shown in Figure 7 to remove the sample flanges.

Figure 7.
Schematic of the location where the sample for µ-CT analysis was extracted from interrupted bend tests.
4. Results and Discussion
This section provides insight into the effect of the heat treatment and loading direction on the mechanical response when subjected to uniaxial and plane strain tension in tensile and V-Bend tests, respectively. Particular attention is devoted to the material hardening rate to assess correlations between the macroscopic fracture behavior and damage at a microstructural lengthscale.
4.1. Tensile Results
The true stress–strain responses of the tensile tests are depicted in Figure 8, and the mechanical properties are summarized in Table 3. Overall, the strength differential between the T4 and T6 temper is apparent and largest at yield. Relative to the T4 condition, the yield stress in the T6 temper is approximately 147 MPa and 142 MPa higher in the ED and TD, respectively. Nevertheless, in the T4 condition, the alloy exhibits a strong hardening rate and gradually approaches the strength level of the T6 temper during post-uniform deformation. The difference in the hardening rate between tempers is quantified through the ratio of the yield stress (YS) to ultimate tensile strength (UTS). A value of close to unity (~0.95) for the T6 temper indicates a low amount of hardening relative to a value of approximately 0.6 for the T4 temper. The markedly different hardening behavior is attributed to the type and size of precipitates that form during the aging treatment. Cluster strengthening in the T4 samples raises the yield stress [35] while decreasing the rate of dynamic recovery and thereby modestly increasing work hardening capacity [36]. In contrast, in the T6 temper, solute atoms precipitate into finely dispersed needle-like β″ precipitates during artificial aging, which hinders dislocation movement [37,38] but lowers the work hardening capacity [38,39].

Figure 8.
True stress–strain response obtained from quasi-static tensile tests is shown for one representative test. Note that the post-uniform deformation was linearly extrapolated to the rupture strain that was obtained from post-mortem thickness measurements.
Table 3.
Mechanical properties obtained from quasi-static tensile tests. The uniform elongation was determined from the Considère criterion, and the rupture strain was approximated from post-mortem thickness measurements. The yield stress corresponds to the 0.2% offset of the flow stress, which corresponds to a 0.2% plastic strain. The average value and standard deviation were computed from two repeats.
Dependence of the loading direction in the stress response is mild in both tempers, but plastic anisotropy, expressed through the R-value, is strong and ranges from approximately 0.24–0.28 for tension parallel to ED to 1.03–1.22 parallel to TD. The R-value provides a measure of the width-to-thickness strain ratio and, as such, affects the post-uniform deformation and eventually the localization mode [40]. For large cross-sectional ratios, i.e., the section width is much larger than the thickness, as in extrusions and sheet metals, a larger R-value is beneficial, such that lateral straining occurs faster than sheet thinning. Thus, a larger R-value is expected to lead to slower localization and, therefore, a higher rupture strain that was approximated from post-mortem fracture area measurements. This reasoning is supported by the rupture strains in the T6 but not the T4 condition. The slightly higher hardening rate in the ED, reflected in a lower YS/UTS for T4 in Table 2, might have contributed to this observation since deformation is better distributed, and it helps delay localization. The role of the hardening rate is further assessed in the bend tests in the next section.
4.2. Bending Results
The evolution of the punch load with the calculated VDA bend angle from the punch displacement in Equation (1) is shown in Figure 9 and summarized in Table 4. The higher load requirement to bend the sample in the T6 condition correlates with the higher strength measured in the tensile tests. The directional dependence of the higher strength in TD appears more pronounced in the bend tests than in the tensile tests for both tempers. The approximately constant offset in the load response between ED and TD in both tempers agrees well with the comparable hardening rate in the tensile test, since the load required to deform the sample is accumulated at the same rate.

Figure 9.
Evolution of the punch load with the VDA bend angle in the V-Bend tests adopting a 60 N VDA load threshold for failure detection.
Table 4.
Summary of fracture results obtained from the 60 N VDA load threshold in the V-Bend tests. The average value and standard deviation were computed from a minimum of five repeats.
The bend angle, which is typically utilized for performance assessment in the VDA 238–100 specification, allows for a clear ranking of the studied alloys (T4-ED > T4-TD > T6-ED > T6-TD) as summarized in Figure 10. The T4 condition sustained significantly larger bend angles in both directions (104° in ED; 83° in TD) compared to the T6 condition (68° in ED; 47° in TD). Nevertheless, consideration of the surface strains on the convex surface provides a different and less conclusive ranking. For example, even though the bend angle of T4-ED (104°) is very different from T4-TD (83°), the VDA fracture strains are comparable and within the standard deviation (compare ε1 = 0.60 ± 0.05 T4-ED and ε1 = 0.57 ± 0.05 T4-TD). Similarly, the superior bend performance of the T4-TD (83°) over the T6-ED (68°) did not translate to the VDA fracture strains (compare ε1 = 0.57 T4-TD and ε1 = 0.58 T6-ED). This observation suggests that reliance upon the bend angle as the sole metric for performance assessment is insufficient even for materials with the same bend severity (ratio of sheet thickness to punch radius). This is a crucial extension of the conclusion initially drawn by Cheong et al. [41], who highlighted limitations of the bend angle for materials of different thicknesses. For example, from the perspective of a tool designer, a larger bend angle is preferable to expand the process window for component forming with sharp part radii where through-thickness cracking is a concern. In contrast, given the same material strength, a structural engineer may prioritize the alloy with a higher failure strain for enhanced energy absorption in a crash scenario.

Figure 10.
Comparison of the VDA bend angle and the corresponding DIC strain retrieved at the 60N VDA load drop in the peak punch force. Potential correlations of these metrics with the work hardening rate, expressed through the YS-to-UTS ratio, are examined.
To the best knowledge of the authors, this observation and potential implications on material selection have been overlooked by the engineering community and warrant closer inspection. To this end, the evolution of the major true strain during bending, which was obtained from averaging the peak strain across the five DIC line slices, was assessed in Figure 11. The relatively small error bars confirm an approximately uniform strain distribution along the bend width. During homogeneous deformation, up to a bend angle of approximately 35°, strain accumulates at a rate specific to the temper but irrespective of the loading direction (see Figure 11a). It appears that there is a strong correlation between the material hardening rate and strain accumulation in the bend tests. The higher hardening rate in the T4 temper promotes faster strain accumulation relative to the T6 condition, and this is further studied in Figure 12.

Figure 11.
Evolution of the major strain evolution during bending (a). This was obtained by averaging the data points of peak major strain across five line slices, which were extracted from the area of interest (AOI) in DIC (b).

Figure 12.
Major strain distribution within the bend zone extracted along the line slice within the bend zone at a 5 mm punch displacement that corresponds to a ~37° VDA bend angle. The abbreviation AOI corresponds to the area of interest in the DIC analysis.
To enable a discussion about the influence of the hardening rate on the strain distribution within the bend zone, the major strain along the line slice #3, located at half-width as depicted in Figure 11b, was extracted at a 5 mm punch displacement in Figure 12. Interestingly, the magnitude and distribution of the major strain vary significantly between the two tempers. For example, the peak major strain ranges from approximately ~0.16 in the T4 temper to ~0.25 in the T6 condition. Straining in the T6 temper occurs localized within a narrow zone around the sample apex, whereas the strain distribution in the T4 temper appears more spread out. This observation is supported by the work hardening rate since the higher hardening capability of the T4 temper helps better distribute deformation.
The stationary punch of the inverted V-Bend design enables direct correlation with sheet thinning of the cross-section until fracture initiation by extracting the out-of-plane displacement of the sample surface in DIC. Noder [42] validated this approach with post-mortem thickness measurements for three different steel grades where punch indentation was small; thus, its contribution to out-of-plane displacement was negligible. The validity of this assumption for aluminum alloys will be critically assessed in μ-CT scans in Section 4.3.
The evolution of the normalized sheet thickness, which was obtained by averaging the out-of-plane displacement across the five data points along the bend width in Figure 11b, is depicted in Figure 13a. For the same test direction, sheet thinning at the VDA bend angle was higher in the T4 than the T6 temper, e.g., 16.8% versus 11.9% in ED and 12.9% versus 9.4% in TD. Interestingly, even for the same surface strain, more sheet thinning occurred in the T4 condition despite its higher hardening rate and ability to distribute the strain more uniformly.

Figure 13.
Evolution of sheet thinning with local straining in the V-Bend test (a). A schematic illustration of the through-thickness strain distribution and migration of the unelongated layer to the inner surface that promotes thinning of the cross-section (b).
There are two competing mechanisms that may explain this observation. First, considering the mechanics of bending, a higher hardening rate leads to an accelerated shift in both the neutral layer, where dε1 = 0, and the unelongated layer, where ε1 = 0, towards the inner (concave) side of the sample, as schematically shown in Figure 13b. Therefore, sheet thinning as a result of tension is no longer balanced by material thinning due to compression. Hence, the resulting stress state of the cross-section remains tensile and promotes thinning. As a result of the higher hardening rate of the T4 temper, the T4 sample is expected to experience faster sheet thinning than the T6 sample under similar boundary conditions. Nevertheless, prescribing the same process conditions may be difficult in practice. As discussed earlier, for the same punch displacement and bend angle, the geometric boundary conditions are identical, but the amount of strain that the material experiences locally may be different and is governed by the material hardening rate. Here, it is vital to correctly interpret the DIC strains in Figure 12, which are surface strains in nature. In other words, enforcing volume conservation for plane strain bending, i.e., ε3 = −ε1, to obtain sheet thinning is inconsistent with the methodology that relies on the measurement of out-of-plane displacement. The latter represents sheet thinning of the cross-section, whereas DIC surface strains provide insight into a single material layer, the convex sample surface.
4.3. Microcomputed Tomography (μ-CT) Results
The preceding discussion revealed a clear dependence of the hardening rate on the material’s ability to uniformly distribute strain in tight-radius bending. This section will critically assess whether this dependence manifests at a microstructural lengthscale, for example, in the form of damage, i.e., surface or subsurface cracks.
For this purpose, μ-CT scans of interrupted bend tests of T6-ED and T4-ED samples were performed, which enable probing the entire sample volume. These material conditions were of particular interest because of their vastly different VDA bend angles of 68° and 104°, despite similar surface strains of about 0.58 and 0.60 for T6-ED and T4-ED, respectively. The deformation histories of the samples, which were manually interrupted near peak load, are depicted in Figure 14.

Figure 14.
Deformation history of the interrupted V-Bend samples prepared for μ-CT scans.
Figure 15 provides an overview of the damage on the outer surface of the bend sample. Even though these tests were interrupted before the VDA failure threshold, surface cracks were manifest in both samples, but the crack morphology differed between the two tempers. Single large cracks in the T4 sample (Figure 15a) developed locally in a narrow band around the sample apex, whereas many small cracks were more broadly distributed in the T6 sample (Figure 15b).

Figure 15.
Top views of μ-CT scans of interrupted T4 (a) and T6 (b) bend tests.
To better assess the spatial distribution and severity of damage, 2D projections were extracted at specific section planes along the width of the sample. The convenience of assessing the crack morphology at arbitrary locations within the sample can be seen as a major advantage of μ-CT over metallographic sectioning. The 2D projections at the location of the deepest crack of 181 μm in the T4 sample and 190 μm in the T6 sample are depicted in Figure 16. For both tempers, the location of damage in the form of cracks is limited to the convex surface. This is important and supports the assumption that failure in the V-Bend test indeed is initiated on the convex surface, such that DIC surface strains are representative of the true material fracture strain. Another peculiar observation was made on the concave side that revealed significant punch indentation in both the T4 (0.299 mm) and T6 (0.195 mm) samples. The higher indentation in the T4 sample, which is close to the nominal 0.4 mm punch radius, correlates with the lower material strength and thus reduced resistance to deformation. In light of this punch indentation, sheet thinning obtained from the out-of-plane displacement in DIC, as discussed in the preceding discussion, should be interpreted as an upper limit.

Figure 16.
Three-dimensional and projected views at the section plane where the crack of maximum depth occurred in the T4 sample (a) and the T6 sample (b), analyzed in μ-CT.
The spatial distribution of the crack morphology is further studied in detailed views of the convex surface, which were extracted at approximately 2 mm increments along the sample width in Figure 17. In the T4 samples, the cracks consistently developed locally in a narrow band around the sample apex, whereas many small cracks were more broadly distributed in the T6 sample. Considering the 40–50 μm PCG layer thickness, the majority of the cracks in the T6 sample appear to be limited to the PCG layer, whereas the larger cracks in the T4 sample propagated to the material interior. The crack orientation at a 45° angle is indicative of failure propagation via shear band and void growth/coalescence as reported by Mattei et al. [43]. Since both the T4 and T6 samples were subjected to the same thermal processing history, the size and distribution of the constituent particles are assumed to be comparable and do not provide a reason for the observed difference in damage severity and distribution. Instead, differences in the precipitate size and spacing due to the aging treatment are deemed responsible for this observation and govern the material yield stress and hardening rate at a macroscopic lengthscale. Upon formation of a crack, the high hardening rate in the T4 condition leads to a rapid increase in strength in the surrounding material, which is surmised to prevent crack initiation in the neighboring substrate. To critically assess this hypothesis, μ-CT scans at a higher resolution than 10 μm are desirable to reveal void formation and distribution, and are part of future work. For example, Atomic Force Microscopy (AFM) of fractured notched tension samples of 7075-T7351 revealed void sizes of 5–10 μm [44], which is taken as an upper bound in the present study, where tests were interrupted during early void nucleation before growth and coalescence.

Figure 17.
Detailed views of the crack morphology on the convex surface of interrupted bend tests at different locations along the sample width in the T4 sample (a) and the T6 sample (b), analyzed in μ-CT.
4.4. Correlation Between Tensile and Bending Performance
Both global and local formability need to be considered during material selection in product design. Tensile uniform elongation is a good approximation for the ability to distribute deformation uniformly in the material and delay or prevent instability in forming operations. In contrast, local formability is concerned with the resistance to fracture, relevant for stretch flanging or crash scenarios [45]. Figure 18 aims to examine correlations between local and global formability, considering various metrics. The higher uniform elongation in the T4 condition relative to the T6 temper (18% versus 8%) correlates well with the higher hardening rate, i.e., lower YS/UTS ratio, and is beneficial to delay formation of an acute neck in part forming. However, the superior global formability of T4 samples does not translate to enhanced local formability in the present study. Overall, tensile rupture strains between T4 and T6 conditions are similar despite the vastly different work hardening rates. Except for T6-TD, equivalent strains in the VDA tests are consistently higher than the tensile rupture strains but comparable among test conditions. The lower strains in the T6-TD V-Bend tests are peculiar and might be related to PCG-layer effects. Future work should consider additional bend tests of samples where the PCG layer is chemically removed. The higher fracture strains in the VDA tests (plane strain tension) compared to the tensile rupture strains may seem counterintuitive given the distinct “plane strain valley” in phenomenological fracture models. Here, it is important to note that fracture in tensile tests is preceded by acute localization under increasing 3D stress triaxiality, which accelerates microstructural damage, i.e., void growth. Therefore, fracture strains approximated from tensile rupture strains are expected to be lower compared to hole expansion tests, which maintain a constant stress state of uniaxial tension at the outer hole edge [46]. Strong textural effects from the extrusion process are manifest in tensile R-values (0.24–0.28 in ED and 1.03–1.22 in TD), which might influence part geometry, such as earing profile in circular cup drawing. However, plastic anisotropy had mild effects on material strength, such that forming forces in manufacturing might be unaffected. The absence of correlation between local and global material performance emphasizes the importance of material characterization under industrially relevant deformation modes.

Figure 18.
Comparison between tensile and bending performance. Note that strains retrieved at the VDA load drop in the bend tests were converted into an equivalent von Mises strain to enable comparison with the tensile rupture strains.
5. Conclusions
The present study employed μ-CT scans and tensile and VDA238-100 bend tests with stereoscopic DIC, to link microscopic features, such as damage distribution and temper-induced microstructural differences, to local material behavior, including strain distribution and work hardening rate in AA6082 extrusions. These insights led to the following conclusions:
- The bend angle as a unique metric for performance ranking is insufficient for materials with significantly different hardening rates despite similar bend severities. Bend angle analysis should be supplemented with DIC strain measurements. For the studied alloys, a larger bend angle did not correlate with a higher surface strain in plane strain tension. For example, in the T4 condition, bending along the extrusion direction (ED) sustained a much larger VDA bend angle relative to the T6 sample (104° ± 6° versus 68° ± 3°, five repeats), but fracture strains were similar (0.60 ± 0.05 versus 0.58 ± 0.03, five repeats).
- It is suggested that the material hardening rate governs the strain distribution on the convex surface of the bend sample. The higher hardening rate in the T4 sample better distributes deformation in the bend zone and delays fracture to larger bend angles since the major strain during bending increases at a slower rate relative to the T6 samples. In contrast, deformation in the T6 condition was restricted to a narrow band around the sample apex, since major strain was accumulated faster relative to the T4 temper. For example, at a VDA bend angle of 37°, peak major strains ranged from approximately 0.14 in the T4 condition to 0.25 in the T6 temper.
- The vastly different work hardening rates in the T4 and T6 tempers were manifest in sheet thinning of the material cross-section and are relevant in forming operations with appreciable bending, such as hemming operations. For the same surface strain, more sheet thinning, approximated by tracking the out-of-plane displacement in DIC, occurred in the T4 condition. The higher hardening rate in the T4 temper is believed to accelerate the transition of the unelongated layer towards the inner bend surface, leading to a larger net tensile state of the cross-section, promoting thinning.
- Distribution and severity of damage in the form of cracks on the outer bend surface of interrupted tests were found to be distinct for the specific alloy temper. Single large cracks in a narrow band developed around the sample apex in the T4 samples compared to many small cracks broadly distributed within the bend zone of the T6 temper. It is suggested that a higher work hardening rate leads to strengthening of the neighboring material to delay crack initiation. Future work should consider μ-CT at a resolution higher than 10 μm to assess void formation across the sample face.
Author Contributions
Conceptualization, J.N.; Methodology, J.N. and K.C.; Validation, J.N. and K.C.; Formal analysis, J.N.; Investigation, J.N., K.C. and W.J.P.; Resources, C.B. and W.J.P.; Writing—original draft, J.N.; Writing—review & editing, K.C., C.B., P.R. and W.J.P.; Supervision, C.B., P.R. and W.J.P.; Project administration, W.J.P.; Funding acquisition, C.B., P.R. and W.J.P. All authors have read and agreed to the published version of the manuscript.
Funding
Financial support through the NSERC Alliance grant (ALLRP 586808-23) between Rio Tinto Aluminium and UBC is kindly acknowledged. This work was undertaken in part thanks to the funding from the Canada Research Chair Program (Poole).
Data Availability Statement
The original contributions presented in this study are included in the article. Further inquiries can be directed to the corresponding author.
Acknowledgments
The authors would like to thank Sheida Nikkhah Fini, who performed the tensile tests, and Heli Eunike for support during post-mortem measurements of the tensile fracture areas. The authors are grateful to James Drummond from the Energy Reduction in Mechanical Pulping (ERMP) Center at the University of British Columbia (UBC), who conducted the µ-CT experiments in the Zeiss Xradia 520 Versa model that was purchased through the CFI 36400 grant. The authors are grateful to Nick Parson at Rio Tinto Aluminium for the valuable discussions on aluminum extrusions.
Conflicts of Interest
Author Paul Rometsch was employed by the company Rio Tinto Aluminium, and this study received funding from Rio Tinto Aluminium. The funder was not involved in the study design, collection, analysis, interpretation of data, the writing of this article or the decision to submit it for publication. The remaining authors declare that the research was conducted in the absence of any commercial or financial relationships that could be construed as a potential conflict of interest.
References
- Scamans, G. Treading Lightly with Secondary Aluminum, Light Metal Age. 2023. Available online: https://www.lightmetalage.com/news/industry-news/automotive/treading-lightly-with-secondary-aluminum/ (accessed on 28 January 2025).
- Kan, Y.; Shida, R.; Takahashi, J.; Uzawa, K. Energy saving effect of light-weight electric vehicle using CFRP on transportation sector. In Proceedings of the Japan International SAMPE Symposium, Tokyo, Japan, 27–30 November 2007. [Google Scholar]
- Burd, J.T.J.; Moore, E.A.; Ezzat, H.; Kirchain, R.; Roth, R. Improvements in electric vehicle battery technology influence vehicle lightweighting and material substitution decision. Appl. Energy 2021, 283, 116269. [Google Scholar] [CrossRef]
- Parson, N.; Fourmann, J.; Beland, J. Aluminum Extrusions for Automotive Crash Applications. In Proceedings of the WCXTM 17: SAE World Congress Experience, Detroit, MI, USA, 4–6 April 2017. [Google Scholar]
- Dunand, M.; Maertens, A.P.; Luo, M.; Mohr, D. Experiments and modeling of anisotropic aluminum extrusions under multi-axial loading—Part I: Plasticity. Int. J. Plast. 2012, 36, 34–49. [Google Scholar] [CrossRef]
- Luo, M.; Dunand, M.; Mohr, D. Experiments and modeling of anisotropic aluminum extrusions under multi-axial loading—Part II: Ductile fracture. Int. J. Plast. 2012, 32–33, 36–58. [Google Scholar] [CrossRef]
- Thomesen, S.; Hopperstad, O.S.; Børvik, T. Anisotropic Plasticity and Fracture of Three 6000-Series Aluminum Alloys. Metals 2021, 11, 557. [Google Scholar] [CrossRef]
- VDA 238-100 (2020); Specification: Plate Bending Test for Metallic Materials. VDA: Berlin, Germany, 2020.
- VDA 238-100 (2017); Test Specification: Plate Bending Test for Metallic Materials. VDA: Berlin, Germany, 2017.
- VDA 238-100 (2010); Test Specification: Plate Bending Test for Metallic Materials. VDA: Berlin, Germany, 2010.
- Larour, P.; Hackl, B.; Leomann, F. Sensitivity analysis on the calculated bending angle in the instrumented bending test. In Proceedings of the International Deep Drawing Research Group, Zurich, Switzerland, 2–5 June 2013. [Google Scholar]
- Roth, C.; Mohr, D. Ductile fracture experiments with locally proportional loading histories. Int. J. Plast. 2016, 79, 328–354. [Google Scholar] [CrossRef]
- Cheong, K.; Omer, K.; Butcher, C.; George, R.; Dykeman, J. Evaluation of the VDA 238-100 tight radius bending test using digital image correlation strain measurement. In Proceedings of the International Deep Drawing Research Group, Munich, Germany, 2–6 July 2017. [Google Scholar]
- Boul, I.; Lang, M.; Mees, G.; Sponem, F.; Sturel, T.; Garat, X. Bending test and bendability of ultra high strength steels. In Proceedings of the International Deep Drawing Research Group, Gyor, Hungary, 21–23 May 2007. [Google Scholar]
- Labudde, T.; Bleck, W. Characterisation of Ductility of Ultra-High Strength Steels. In Proceedings of the International Conference on Technology of Plasticity, Aachen, Germany, 25–30 September 2011. [Google Scholar]
- Troive, L. New method for evaluation of bendability based on three-point-bending and the evolution of the cross-section moment. In Proceedings of the International Deep Drawing Research Group, Munich, Germany, 2–6 July 2017. [Google Scholar]
- Noder, J.; Dykeman, J.; Butcher, C. New Methodologies for Fracture Detection of Automotive Steels in Tight Radius Bending: Application to the VDA 238-100 V-Bend Test. Exp. Mech. 2021, 61, 367–394. [Google Scholar] [CrossRef]
- Grolleau, V.; Roth, C.C.; Lafilé, V.; Galpin, B.; Mohr, D. Loading of mini-Nakazima specimens with a dihedral punch: Determining the strain to fracture for plane strain tension through stretch-bending. Int. J. Mech. Sci. 2019, 152, 329–345. [Google Scholar] [CrossRef]
- Davidkov, A.; Petrov, R.H.; De Smet, P.; Schepers, B.; Kestens, L.A.I. Microstructure controlled bending response in AA6016 Al alloys. Mater. Sci. Eng. A 2011, 528, 7068–7076. [Google Scholar] [CrossRef]
- Castany, P.; Diologent, F.; Rossoll, A.; Despois, J.-F.; Bezenon, C.; Mortensen, A. Influence of quench rate and microstructure on bendability of AA6016 aluminum alloys. Mater. Sci. Eng. A 2013, 559, 558–565. [Google Scholar] [CrossRef]
- Sarkar, J.; Kutty, T.R.G.; Conlon, K.T.; Wilkinson, D.S.; Embury, J.D.; Lloyd, D.J. Tensile and bending properties of AA5754 aluminum alloys. Mater. Sci. Eng. A 2001, 316, 52–59. [Google Scholar] [CrossRef]
- Ikawa, S.; Asano, M.; Kuroda, M.; Yoshida, K. Effects of crystal orientation on bendability of aluminum alloy sheet. Mater. Sci. Eng. A 2011, 528, 4050–4054. [Google Scholar] [CrossRef]
- Snilsberg, K.E.; Westermann, I.; Holmedal, B.; Hopperstad, O.S.; Langsrud, Y.; Marthinsen, K. Anisotropy of Bending Properties in Industrial Heat-treatable Extruded Aluminium Alloys. MSF 2010, 638–642, 487–492. [Google Scholar] [CrossRef]
- Kordmir, S. Anisotropy of Strength and Fracture Behavior in Al-Mg-Si-(Mn) Extrusion Alloys. Master’s Thesis, University of British Columbia, Vancouver, BC, Canada, 2023. [Google Scholar]
- Sarkar, J.; Kutty, T.R.G.; Wilkinson, D.S.; Embury, J.D.; Lloyd, D.J. Tensile properties and bendability of T4 treated AA6111 aluminum alloys. Mater. Sci. Eng. A 2004, 369, 258–266. [Google Scholar] [CrossRef]
- Datsko, J.; Yang, C.T. Correlation of Bendability of Materials with their tensile properties. J. Manuf. Sci. Eng. 1960, 82, 309–313. [Google Scholar] [CrossRef]
- Westermann, I.; Snilsberg, K.E.; Sharifi, Z. Three-Point Bending of Heat-Treatable Aluminum Alloys: Influence of Microstructure and Texture on Bendability and Fracture Behavior. Metall. Mater. Trans. 2011, 42, 3386–3398. [Google Scholar] [CrossRef]
- Cheong, K.; Noder, J.; Zhumagulov, A.; Butcher, C. Characterization and Prediction of Plane Strain Bendability in Advanced High Strength Steels. Metals 2023, 13, 1711. [Google Scholar] [CrossRef]
- Durrenberger, L.; Dietsch, P. Bending angle correlation regarding sheet thickness. In Proceedings of the International Deep Drawing Research Group, Waterloo, ON, Canada, 3–7 June 2018. [Google Scholar]
- Parson, N. (Rio Tinto Aluminium, Saguenay, QC, Canada). Private communication, 2025.
- Fini, S.N. The Effect of PCG Layer Thickness on Bendability of Aluminum Extrusion Alloys. Master’s Thesis, University of British Columbia, Vancouver, BC, Canada, 2023. [Google Scholar]
- Jonsson, S.; Frómeta, D.; Grifé, L.; Larsson, F.; Kajberg, J. Assessment of Rate-Dependency and Adiabatic Heating on the Essential Work of Fracture of Press-Hardening Steels. Metals 2025, 15, 316. [Google Scholar] [CrossRef]
- Larour, P.; Hackl, B.; Leomann, F.; Benedyk, K. Bending angle calculation in the instrumented three-point bending test. In Proceedings of the International Deep Drawing Research Group, Mumbai, India, 25–28 November 2012. [Google Scholar]
- Boerckel, J.D.; Mason, D.E.; McDermott, A.M.; Alsberg, E. Microcomputed tomography: Approaches and applications in bioengineering. Stem Cell Res. Ther. 2014, 5, 144. [Google Scholar] [CrossRef]
- Dumitraschkewitz, P.; Gerstl, S.S.A.; Stephenson, L.T.; Uggowitzer, P.J.; Pogatscher, S. Clustering in Age-Hardenable Aluminum Alloys. Adv. Eng. Mater. 2018, 20, 1800255–1800279. [Google Scholar] [CrossRef]
- Bollmann, C.; Yu, C.; Lalpoor, M.; Miroux, A. Evolution of Work Hardening and Hemming in 6xxx Aluminum Alloys in the Course of Natural Aging Following Continuous Annealing. In Proceedings of the TMS2022, Anaheim, CA, USA, 27 February–3 March 2022. [Google Scholar]
- Miao, W.F.; Laughlin, D.E. Precipitation hardening in aluminum alloy 6022. Scr. Mater. 1999, 40, 873–878. [Google Scholar] [CrossRef]
- Myhr, O.R.; Hopperstad, O.S.; Borvik, T. A Combined Precipitation, Yield Stress, and Work Hardening Model for Al-Mg-Si Alloys Incorporating the Effects of Strain Rate and Temperature. Metall. Mater. Trans. A 2018, 49, 3592–3609. [Google Scholar] [CrossRef]
- Cheng, L.M.; Poole, W.J.; Embury, J.D.; Lloyd, D.J. The influence of precipitation on the work-hardening behavior of the aluminum alloys AA6111 and AA7030. Metall. Mater. Trans. A 2003, 34, 2473–2481. [Google Scholar] [CrossRef]
- Marciniak, Z.; Duncan, J.L.; Hu, S.J. Mechanics of Sheet Metal Forming, 2nd ed.; Butterworth-Heinemann: Oxford, UK, 2002; pp. 1–211. [Google Scholar]
- Cheong, K.; Butcher, C.; Dykeman, J. The Influence of the through-thickness strain gradients on the fracture characterization of advanced high-strength steels. SAE Int. J. Mater. Manuf. 2018, 11, 541–552. [Google Scholar] [CrossRef]
- Noder, J. Plastic Instability and Failure of Sheet Metals Subjected to Complex Stress States. Ph.D. Thesis, University of Waterloo, Waterloo, ON, Canada, 2022. [Google Scholar]
- Mattei, L.; Daniel, D.; Guiglionda, G.; Klöcker, H.; Driver, J.H. Strain localization and damage mechanisms during bending of AA6016 sheet. Mater. Sci. Eng. A 2013, 559, 812–821. [Google Scholar] [CrossRef]
- Jin, H.; Lu, W.-Y.; Korellis, J. Experimental Study of Voids in High Strength Aluminum Alloys. In Proceedings of the SEM Annual Conference, Indianapolis, IN, USA, 7–10 June 2010. [Google Scholar]
- Hance, B. Advanced High Strength Steel: Deciphering Local and Global Formability. In Proceedings of the IABC 2106, Chicago, IL, USA, 28–29 September 2016. [Google Scholar]
- Paul, S.K. A critical review on hole expansion ratio. Materialia 2020, 9, 100566–100578. [Google Scholar] [CrossRef]


Disclaimer/Publisher’s Note: The statements, opinions and data contained in all publications are solely those of the individual author(s) and contributor(s) and not of MDPI and/or the editor(s). MDPI and/or the editor(s) disclaim responsibility for any injury to people or property resulting from any ideas, methods, instructions or products referred to in the content. |
© 2025 by the authors. Licensee MDPI, Basel, Switzerland. This article is an open access article distributed under the terms and conditions of the Creative Commons Attribution (CC BY) license (https://creativecommons.org/licenses/by/4.0/).