Article

Effect of AlCoCrFeNi2.1 High-Entropy Alloy Reinforcement on the Densification, Microstructure, and Hot-Cracking Behavior of LPBF-Processed AA7075

1
Faculty of Mechanical Engineering, Universiti Teknologi MARA, Shah Alam 40450, Selangor, Malaysia
2
School of Mechanical and Electrical Engineering, Quanzhou University of Information Engineering, Quanzhou 362000, China
*
Author to whom correspondence should be addressed.
Metals 2025, 15(11), 1193; https://doi.org/10.3390/met15111193 (registering DOI)
Submission received: 22 September 2025 / Revised: 22 October 2025 / Accepted: 24 October 2025 / Published: 27 October 2025

Abstract

The application of laser powder bed fusion (LPBF) to 7xxx-series aluminum alloys is fundamentally limited by hot cracking and porosity. This study demonstrates that adding 5 wt.% AlCoCrFeNi2.1 high-entropy alloy (HEA) particles to 7075 aluminum alloy (AA7075) powder can effectively mitigate these issues. Microstructural characterization revealed that the HEA particles remained largely intact and formed a strong metallurgical bond with the α-Al matrix. Scanning electron microscopy (SEM) and energy-dispersive X-ray spectroscopy (EDS) analysis confirmed that this bonding is facilitated via the in situ formation of new intermetallic phases at the particle/matrix interface. X-ray diffraction (XRD) identified these phases as primarily Al5Co2 and Fe3Ni2. A key consequence of this reinforced interface is a significant change in cracking behavior; optical microscopy (OM) showed that long, continuous cracks typical of AA7075 were replaced by shorter, deflected cracks in the composite. While porosity was not eliminated, the addition of HEA stabilized the process, yielding a consistent density improvement of 0.5–1.5% across the processing window. This microstructural modification resulted in a substantial ~64% increase in average microhardness, which increased from 96.41 ± 9.81 HV0.5 to 158.46 ± 11.33 HV0.5. These results indicate that HEA reinforcement is a promising route for engineering the microstructure and improving the LPBF processability of high-strength aluminum alloys.

1. Introduction

High-strength 7xxx-series aluminum alloys, particularly 7075 aluminum alloy (AA7075), are indispensable in the aerospace and automotive sectors due to their excellent specific strength and response to precipitation hardening [1,2]. However, the ability to translate these benefits to additive manufacturing via laser powder bed fusion (LPBF) is fundamentally limited by the alloy’s high susceptibility to a triad of defects: porosity, element vaporization, and severe hot cracking [2,3]. The rapid solidification inherent in the LPBF process, with its intense thermal cycles, exacerbates these issues [4]. Element vaporization, notably of low-boiling-point constituents such as Zn and Mg in 7xxx-series alloys, not only modifies the final composition but also destabilizes the melt pool, which can worsen liquation cracking [5,6]. Simultaneously, the complex melt pool dynamics often lead to porosity, which can be broadly categorized into two types. At low energy inputs, the insufficient melting of powder particles results in lack-of-fusion pores, while at high energy inputs, keyhole instability leads to the entrapment of vapor-filled pores [7,8,9]. Coupled with powder bed denudation phenomena that further disrupt processing stability [10], these mechanisms create an extremely narrow viable process window. Consequently, AA7075 has been historically established as a benchmark “low-printability” alloy, motivating extensive research into novel material and process solutions [2,11,12].
Significant progress has been made in mitigating these defects, with strategies broadly divided into process-level and material-level interventions. Process-level strategies aim to control the thermal history and residual stress accumulation during the building process. Techniques such as applying substrate preheating, implementing tailored scan strategies including island scanning, and even innovative substrate design have demonstrated meaningful reductions in thermal gradients and, consequently, decreased cracking susceptibility [13,14]. Some studies have also explored post-scan techniques, such as layer-wise femtosecond laser shock peening (FLSP), which can introduce compressive residual stresses to stunt crack growth without requiring significant thermal input [15]. While beneficial, these process-side measures often cannot fully overcome the intrinsic metallurgical challenges of the alloy.
Alloy modification, or the material-level strategy, has, therefore, proven to be a more effective route. A common approach involves inoculating the alloy with particles that promote grain refinement. This strategy disrupts the formation of long, continuous grain boundary networks where low-melting-point eutectics segregate and cracks preferentially propagate [16]. In this context, adding various inoculants, including Si, TiC/TiN, and Zr-bearing compounds, has shown considerable success in improving the printability of AA7075 [17,18,19,20]. In a notable achievement, Zhou et al. demonstrated that the co-incorporation of sub-micron Si and TiB2 could eliminate solidification cracking entirely by simultaneously refining grains and modifying the solidification path to reduce shrinkage [21]. Similarly, another novel strategy successfully produced crack-free AA7075 by combining Ti particle inoculation with substrate modification [17]. Despite these advances, many effective approaches rely on single-mechanism solutions (e.g., primarily grain refinement) or require complex powder synthesis [18,22], highlighting the need for reinforcements that can offer multifaceted benefits through a straightforward powder blending process.
High-entropy alloys (HEAs), a novel class of multi-principal-element materials, offer a compelling alternative means of reinforcement due to their unique combination of high strength, exceptional hardness, and good thermal stability [12,23]. For this study, the eutectic AlCoCrFeNi2.1 HEA was specifically selected. This choice was predicated on several key attributes established in the recent literature. First, it possesses an attractive duplex (FCC + B2) lamellar microstructure that provides an excellent intrinsic blend of strength and ductility [24,25,26]. Second, and crucially for this application, it has demonstrated excellent processability via LPBF, consistently yielding dense, crack-free builds with exceptional mechanical properties [27,28,29]. The significant difference in melting points and densities between this HEA (rich in high-melting-point elements such as Cr, Fe, Co, Ni) and the AA7075 matrix suggests that the HEA particles can persist as solid or semi-solid entities within the aluminum melt pool [30,31]. This allows them to act as stable sites for heterogeneous nucleation and to physically obstruct crack growth. The robustness of LPBF-processed AlCoCrFeNi2.1 has been further confirmed in studies on its response to shock loading and its resistance to hydrogen embrittlement [30,32].
This study investigates the effects of adding 5 wt.% AlCoCrFeNi2.1 particles to AA7075. To the best of our knowledge, the fabrication of an AA7075 matrix composite reinforced with this specific AlCoCrFeNi2.1 HEA via the LPBF process has not been previously reported. Therefore, establishing an appropriate reinforcement concentration required referencing precedents from closely related material systems. The choice of reinforcement content is a critical parameter, as it must be sufficient to induce microstructural changes without compromising processability [12]. In this context, a highly relevant study by Akinwande et al. [33] on 3D-printed AA7075 reinforced with a shape memory HEA (SMHEA) explored concentrations from 2 to 8 wt.% and identified an optimal dosage of 6.4 wt.% for balanced mechanical properties. This finding, along with similar research by Verma and Singh [34], who also suggested that this low-to-moderate range is effective, provides a strong basis for our selection. Consequently, our choice of 5 wt.% serves as a well-reasoned starting point for investigating the fundamental effects of the AlCoCrFeNi2.1 HEA, with the expectation that it is sufficient to provide a significant reinforcing effect while minimizing potential processing challenges, such as particle agglomeration or a detrimental increase in melt pool viscosity [12,35].
Based on these considerations, we hypothesize that the AlCoCrFeNi2.1 HEA particles play a multifaceted role in improving the LPBF processability of AA7075. We propose that they serve simultaneously as the following: (1) heterogeneous nucleation sites that contribute to grain refinement; (2) hard, physical barriers that deflect and arrest propagating cracks, altering the failure mode; and (3) a source of reactive elements (Co, Cr, Fe, Ni) that can form new, strengthening intermetallic phases at the particle/matrix interface. Therefore, the specific aims of this study are to (i) map the relationship between LPBF processing conditions and the resulting densification in both the base alloy and the HEA-reinforced composite; (ii) elucidate the evolution of the microstructure, focusing on phase formation, particle/matrix interactions, and cracking behavior; and (iii) provide a preliminary assessment of the mechanical properties to validate the effectiveness of this novel reinforcement strategy.

2. Materials and Methods

2.1. Powder Preparation

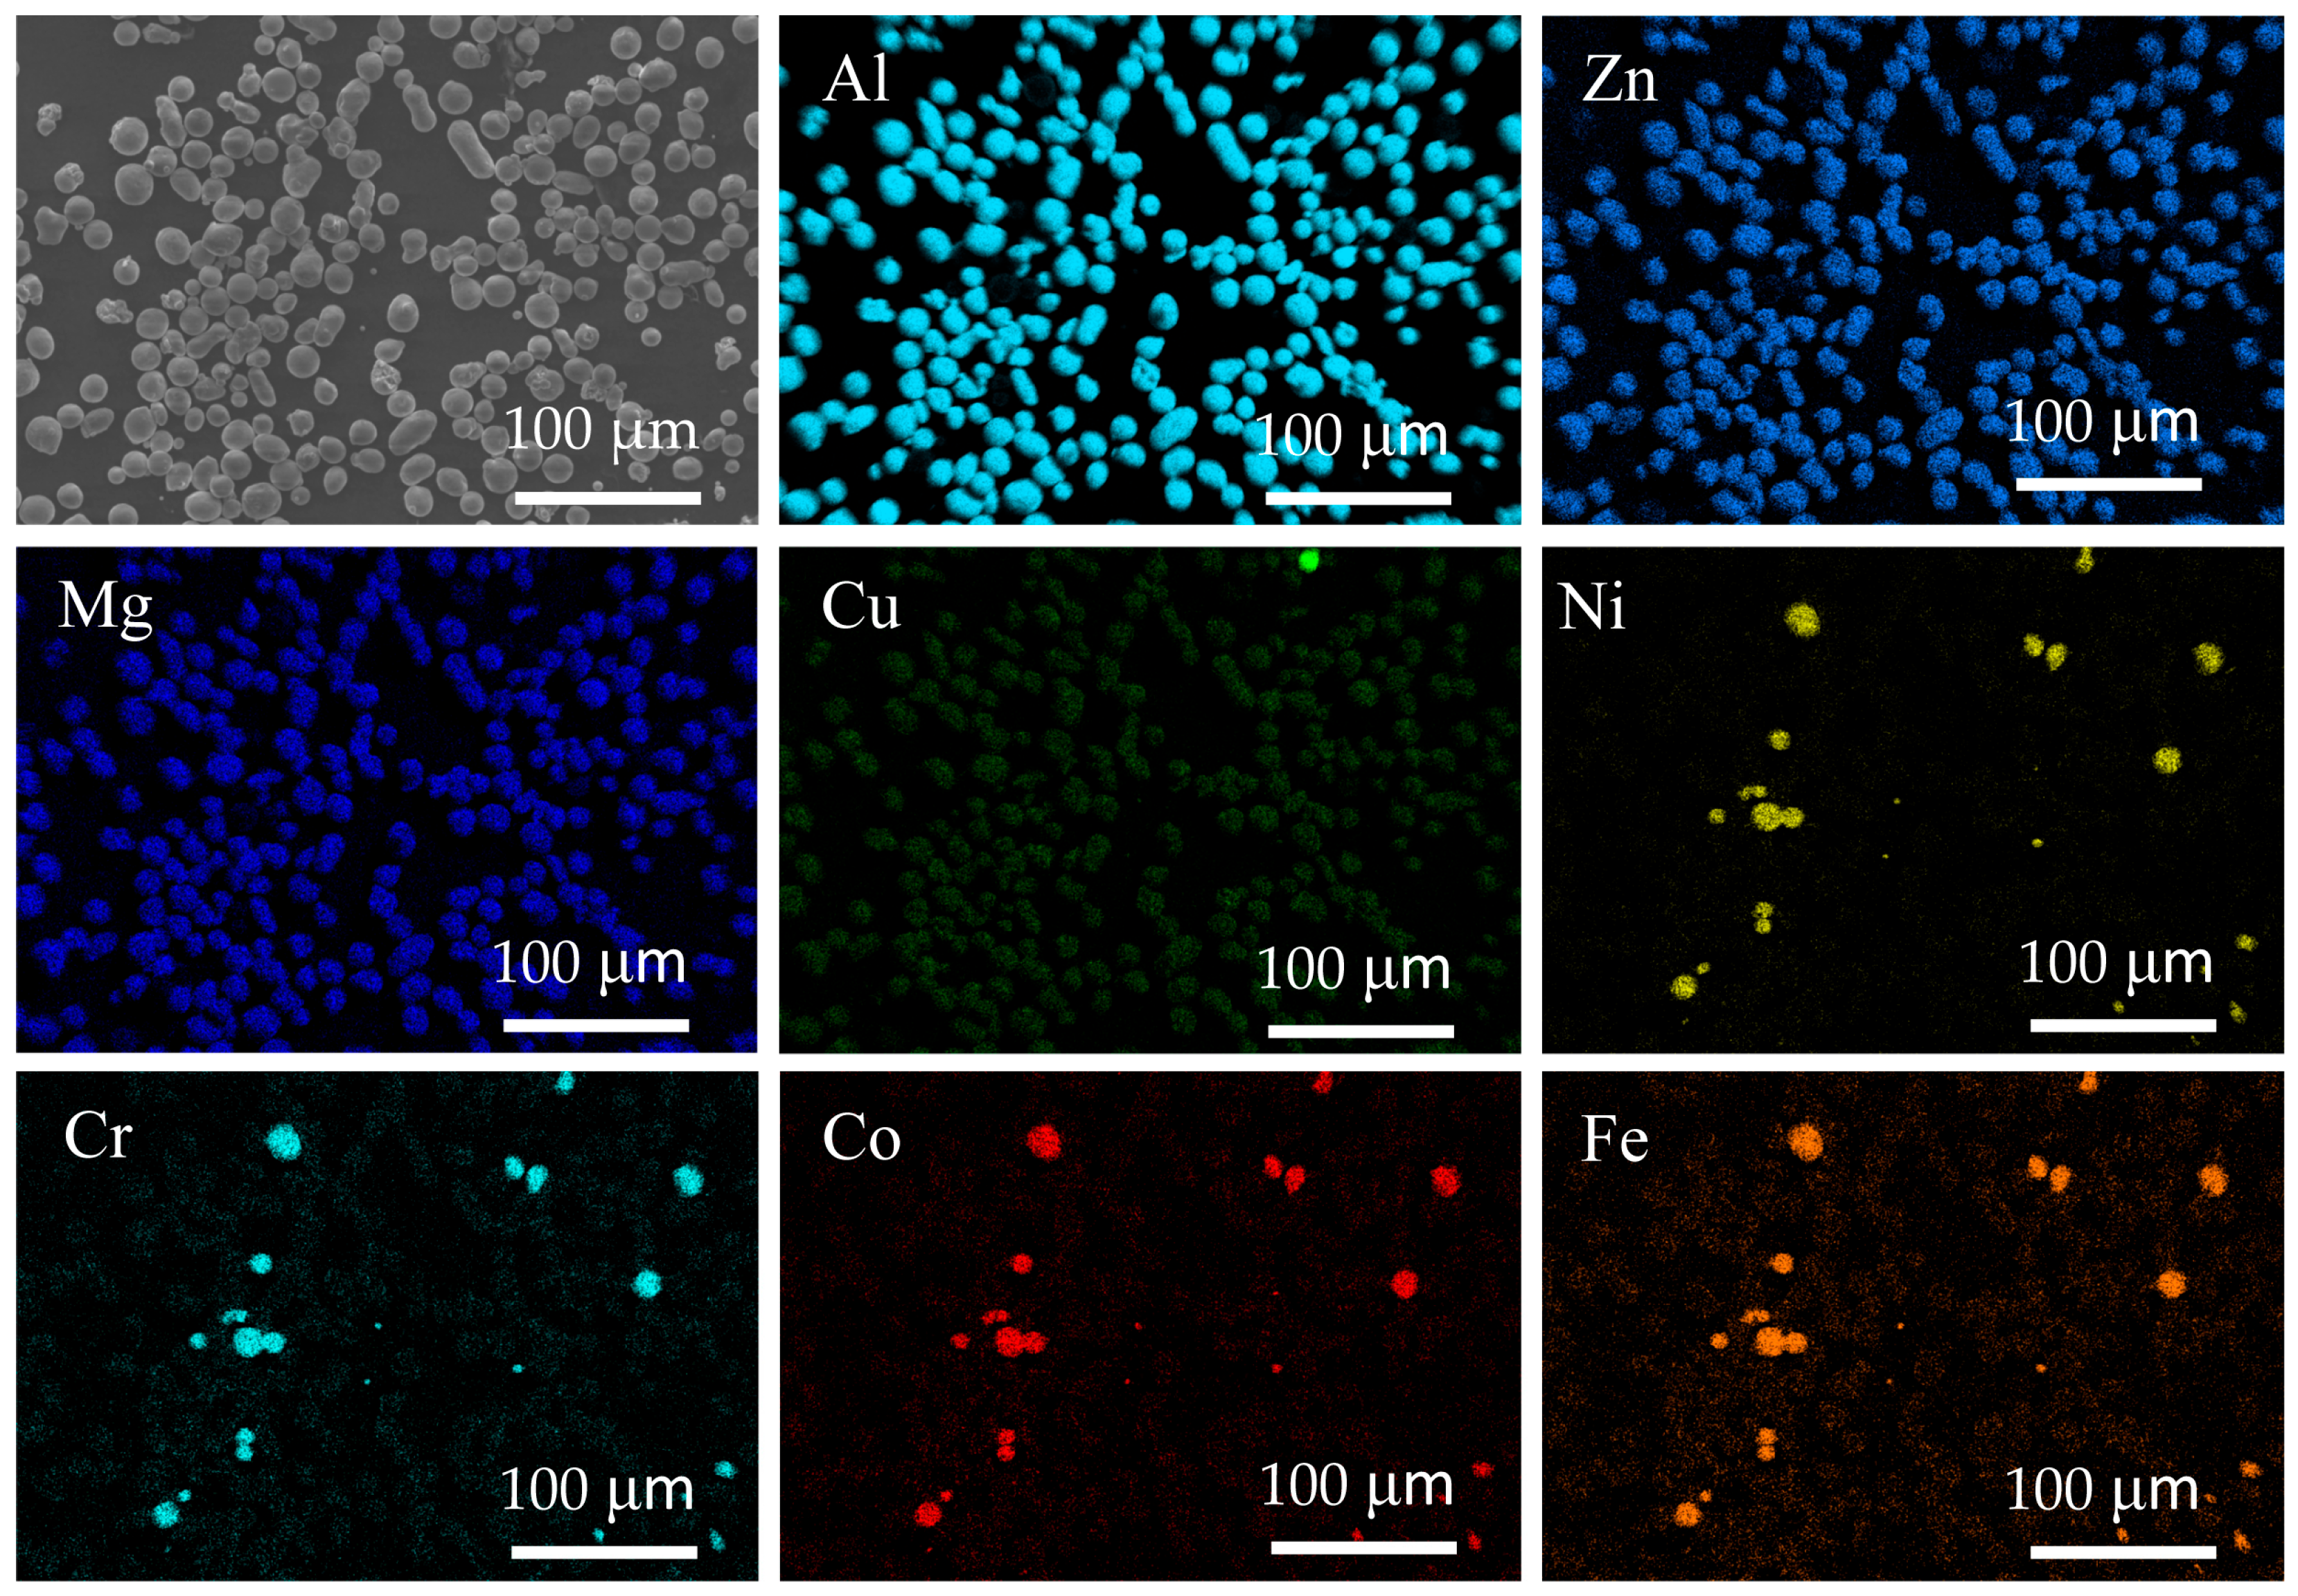
The matrix powder was a commercially available gas-atomized AA7075 powder, with a particle size range of 15–53 μm, spherical morphology, high flowability, and high packing density. The reinforcement was a commercial AlCoCrFeNi2.1 high-entropy alloy (HEA) powder with the same particle size range (15–53 μm) and high sphericity. Both powders were supplied by Guangzhou Shinengine AM Technology Co., Ltd., Guangzhou, China. The particle size distribution parameters (D10, D50, D90) and chemical compositions of the two powders are detailed in Table 1 and Table 2, respectively. To ensure homogeneous mixing, the powders were ball-milled under a high-purity argon atmosphere with an HEA mass fraction of 5 wt.%. Milling was performed for 4 h at 200 rpm, with a ball-to-powder weight ratio of 10:1 and no process control agent. Representative SEM images of the AA7075, HEA, and mixed composite powders are shown in Figure 1, and EDS mapping of the mixed powder composed of AA7075 and 5 wt.% AlCoCrFeNi2.1 alloy is presented in Figure 2.

2.2. LPBF Processing

The specimens were fabricated using an EP-M150 Pro laser powder bed fusion system (Eplus3D, Hangzhou, China) with a fiber laser wavelength of 1070 nm and a nominal spot diameter of approximately 80 μm. The layer thickness was set to 30 μm, and the hatch spacing was 90 μm. A short-stripe scanning strategy with a 67° rotation between successive layers was used to minimize residual stress accumulation and improve densification uniformity. The build platform was made of aluminum alloy and preheated to 100 °C. High-purity argon was used as the protective atmosphere, maintaining the oxygen concentration below 0.1%. Cubic specimens (8 × 8 × 8 mm3) were produced, each with a recessed mark (0.2 mm depth) made on one side for identification.
The main processing parameters (laser power and scan speed) were selected based on both an extensive literature review [2,11] and a preliminary range-finding study designed to identify the viable processing boundaries. The existing literature on LPBF of AA7075 consistently reports a very narrow processing window [2,11,17], which is highly sensitive to lack-of-fusion (LOF) defects at low VEDs and vapor-induced porosity at high VEDs [5]. To validate these findings for our specific material system, we conducted a range-finding study. The parameters for this study (#RF-1, #RF-2, and #RF-3) are listed in Table 3, and the resulting defect microstructures are presented and discussed in Section 3.2.1.
Following this range-finding study, the main study applied 15 parameter sets to both the AA7075 matrix and the AA7075 + 5 wt.% HEA composite, spanning P = 190–250 W and v = 500–900 mm·s−1 (Table 3), corresponding to VED = 78.19–185.19 J·mm−3. To validate the stability of the process and the reliability of the key findings, a separate reproducibility study was subsequently conducted. The processing condition corresponding to sample #1 in Table 3 was selected for this study. This parameter set was chosen because its resulting densification and microhardness for both the monolithic alloy and the composite were identified as being highly representative, closely matching the average values of the entire 15-sample process map. For this condition, two additional samples for both the monolithic AA7075 and the AA7075+HEA composite were fabricated and characterized. The comparative data presented for this parameter set, including densification and microhardness, are, therefore, reported as the average and standard deviation of three independent builds for each material.

2.3. Microstructure and Densification Analysis

The relative density of the samples was determined using the Archimedes method in deionized water at room temperature. To ensure statistical reliability, each specimen was measured six times. The average value was calculated as the final data point, and the corresponding standard deviation is represented by the error bars in the figure. Polished (unetched) cross-sections were examined using an inverted optical microscope (IE500M) [Ningbo Sunny Instruments Co., Ltd. (SOPTOP), Yuyao, Zhejiang, China] to assess pore morphology and distribution. Phase identification was performed via X-ray diffraction (XRD; D8 ADVANCE [Bruker AXS GmbH, Karlsruhe, Germany]) using Cu Kα radiation (λ = 1.5406 Å); 2θ = 20–80°, step size = 0.02°. Microstructural characterization was conducted using field-emission scanning electron microscopy (FE-SEM; Quanta 450 FEG [FEI Company, Hillsboro, OR, USA]) with energy-dispersive spectroscopy (EDS) mapping. Backscattered electron (BSE) imaging was used to enhance contrast between the matrix and the HEA particles, enabling the clear identification of particle/matrix interfaces and secondary phase distribution.

2.4. Microhardness Testing

Vickers microhardness was measured using a digital hardness tester (model 310HVS-5 [Laizhou Huayin Testing Instrument Co., Ltd., Laizhou, Shandong, China]) under a load of 500 gf (4.9 N) with a dwell time of 10 s. For each specimen, five different regions were tested, and the average value was reported. All measurements were performed on polished cross-sections, avoiding visible macro-pores and cracks to ensure representativeness and repeatability.

2.5. Tensile Testing

To evaluate the mechanical properties, sub-sized flat tensile specimens were machined from the as-built LPBF blocks (60 × 10 × 7 mm3) using wire electrical discharge machining (DK350 [Tengzhou Hoton Machinery Co., Ltd., Tengzhou, Shandong, China]). The specimen geometry, which had a gauge length of approximately 25 mm, was prepared in accordance with the ASTM E8/E8M standard [36]. Prior to testing, all specimen surfaces were ground and polished to remove any surface defects and ensure dimensional accuracy.
Uniaxial tensile tests were conducted at room temperature on a Shimadzu Autograph AG-X plus universal testing machine (Shimadzu Corporation, Kyoto, Japan). The tests were performed under displacement control, applying a constant crosshead speed of 0.5 mm·min−1. To ensure the reliability of the data, a minimum of three specimens were tested for each material condition. The ultimate tensile strength (UTS) and elongation at break are reported as the mean ± standard deviation.

3. Results and Discussion

3.1. Densification Behavior
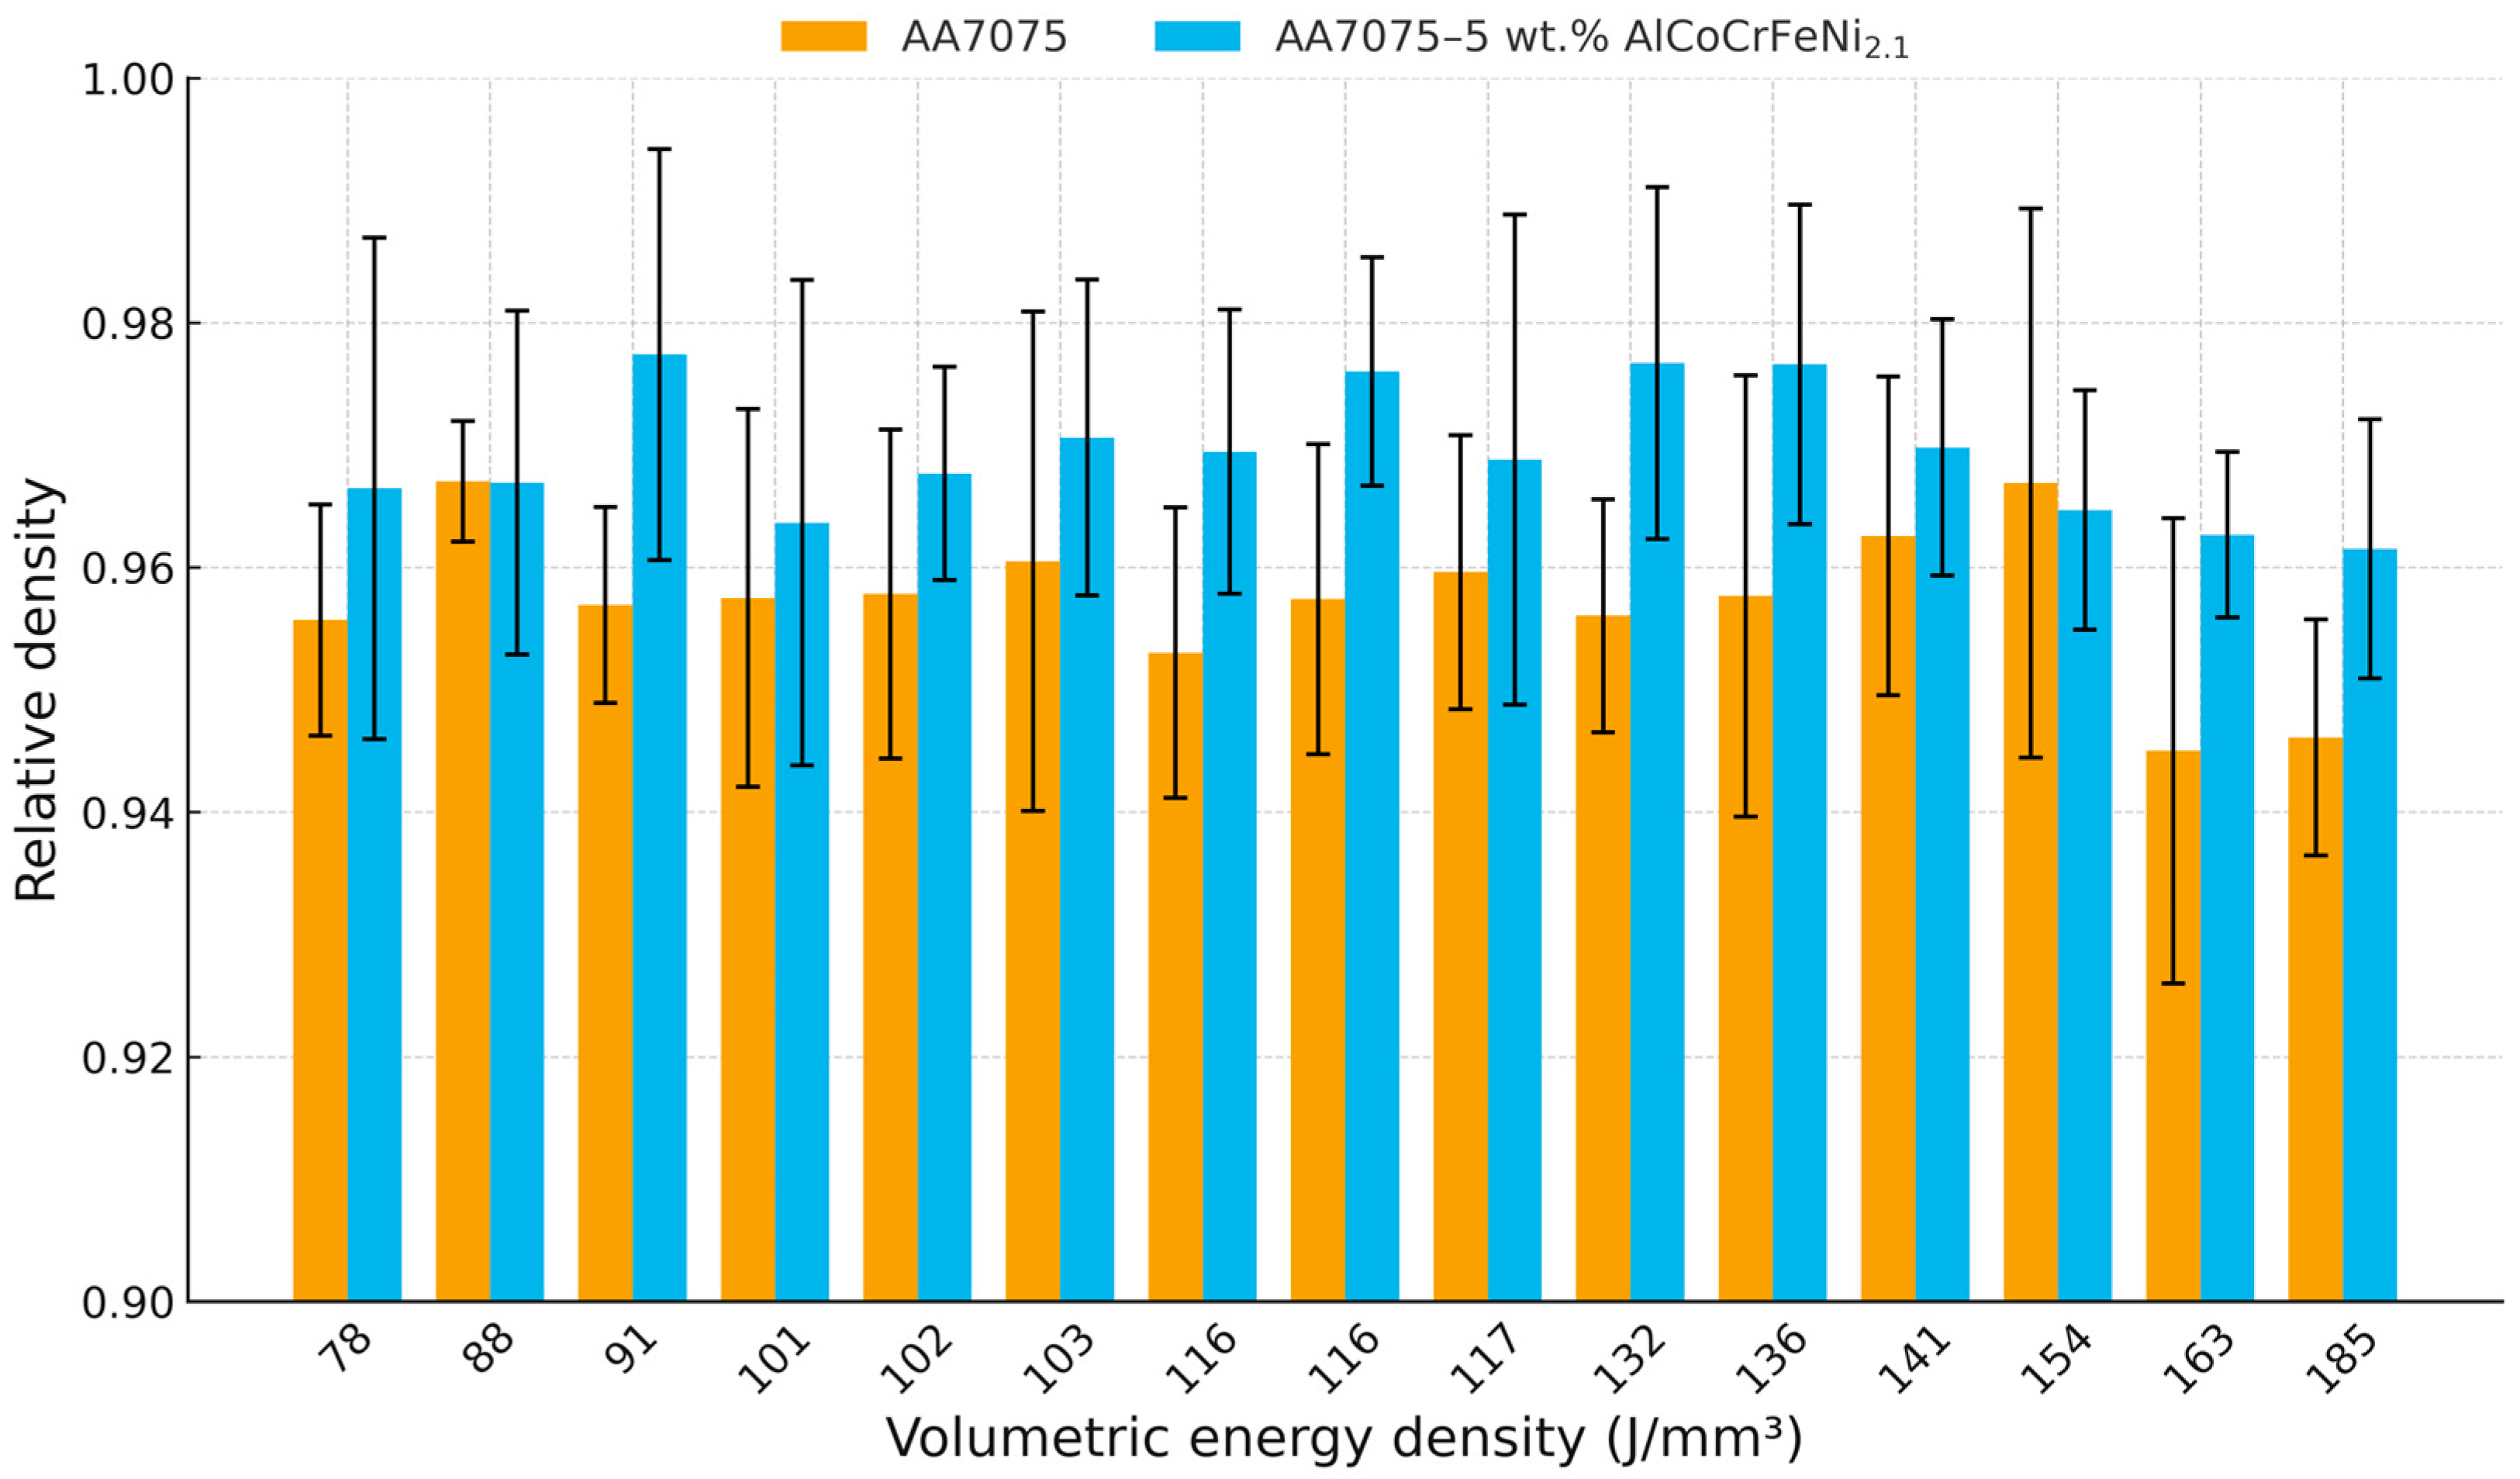
The relative densities of both the unreinforced AA7075 and the AA7075 + 5 wt.% AlCoCrFeNi2.1 composites under different laser power–scan speed conditions are shown in Figure 3. The relative densities of the AA7075 ranged from 94.50% to 96.70%, while those of the HEA-reinforced composites were slightly higher, ranging from 96.15% to 97.74%. In general, the densification behavior followed a non-monotonic (single-peaked) dependence on volumetric energy density (VED), exhibiting a typical volcano-like trend. At a low VED (#5), lack-of-fusion (LOF) defects predominated, resulting in relatively low densities. Conversely, excessively high VED (#11) resulted in reduced densification due to the emergence of abundant near-spherical pores, as evidenced in Figure 4. An optimal densification window was observed in the range of approximately 90–140 J·mm−3, where both alloy systems achieved their highest relative densities. Compared with the base alloy, the composite samples consistently exhibited approximately 0.5–1.5% higher relative densities across the investigated parameter window. A mechanistic interpretation of these densification trends, in connection with the microstructural evidence in Figure 4, Figure 5, Figure 6, Figure 7 and Figure 8, is provided in Section 3.5.1.
To confirm repeatability, a dedicated reproducibility study performed under the sample #1 condition was performed. Three independent builds under this condition yielded an average relative density of 95.92% ± 1.11% for monolithic AA7075 and 97.09% ± 0.84% for the composite. The small standard deviations indicate high process stability. The mean values are in excellent agreement with the single-point data reported in Figure 3.
Figure 3. The relative densities of AA7075 and AA7075 + 5 wt.% AlCoCrFeNi2.1 composites as a function of volumetric energy density.
Metals 15 01193 g003

3.2. Microstructural Analysis

3.2.1. Optical Microscopy
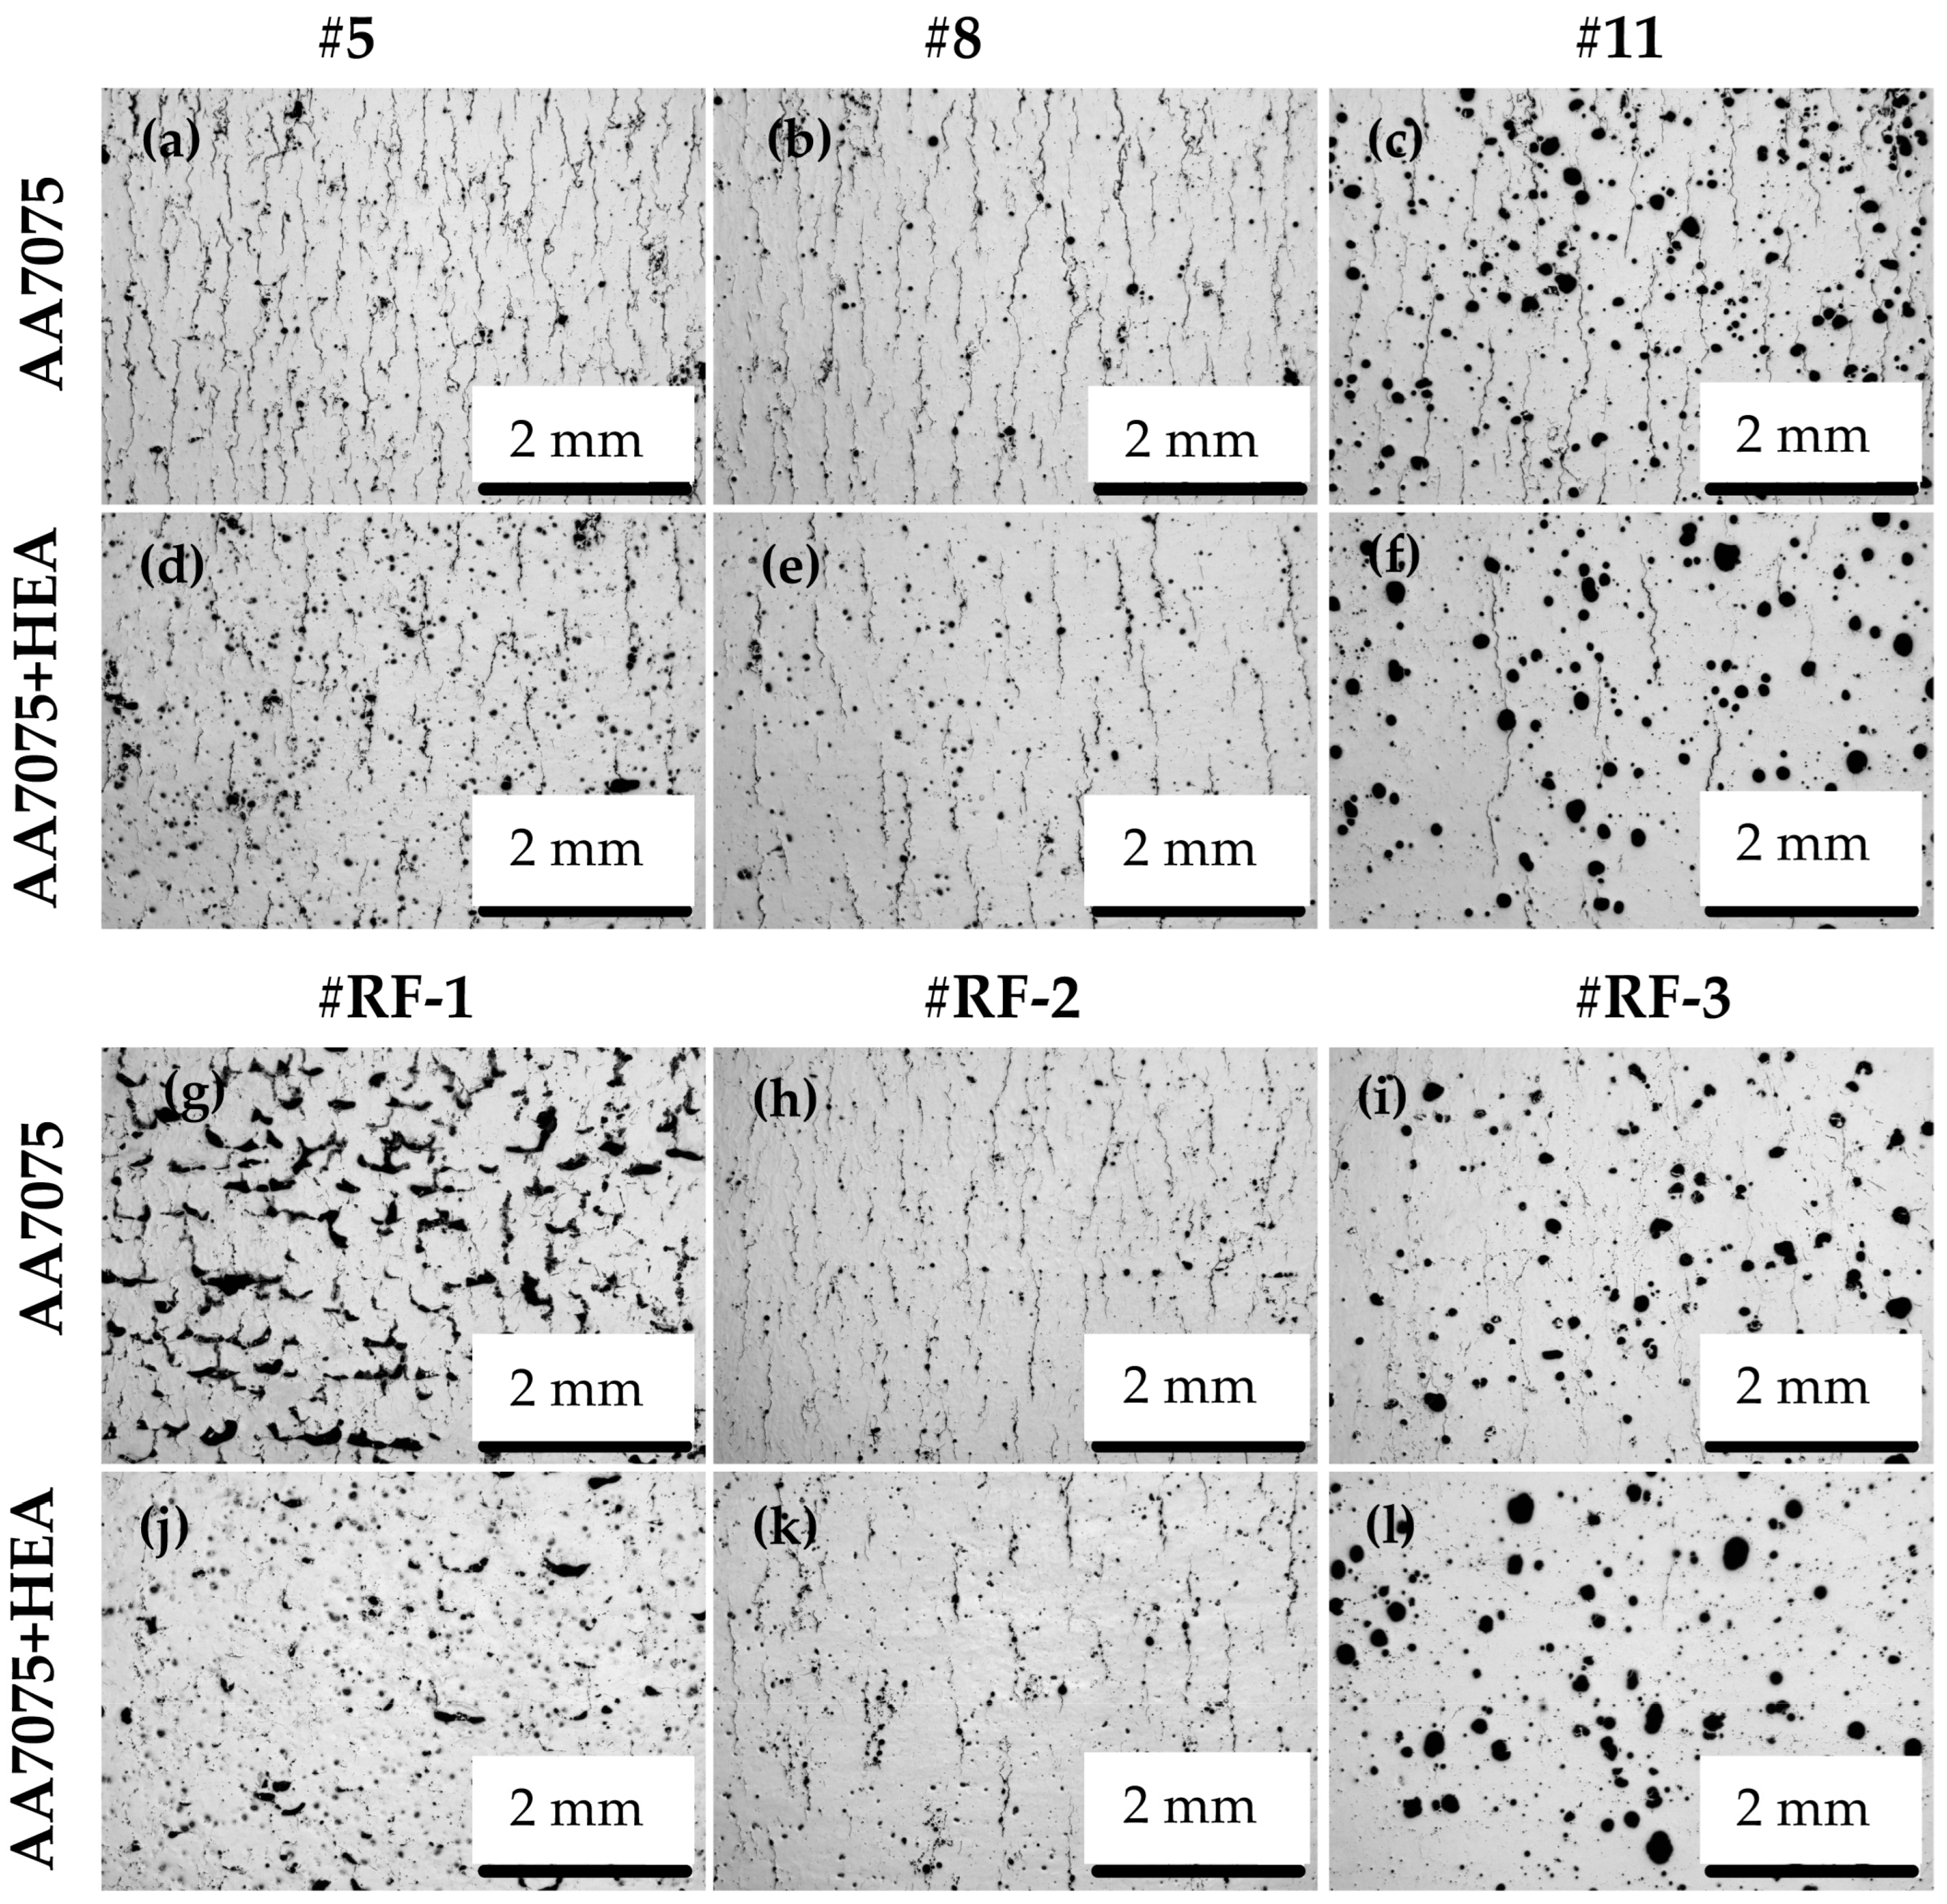
Optical microscopy (OM) observations (Figure 4) revealed distinct differences in crack formation and pore distribution across the investigated processing range.
The processing boundaries established via the range-finding study (Section 2.2) are illustrated in panels (g–l). For the very-low-VED condition RF-1 (100 W; 74.07 J·mm−3), both AA7075 (Figure 4g) and AA7075+HEA (Figure 4j) exhibit severe lack-of-fusion (LOF). For the mid-VED condition RF-2 (190 W; 140.74 J·mm−3), the microstructure becomes much denser, with LOF/cracking being minimized in both materials (Figure 4h,k). For the very-high-VED condition RF-3 (300 W; 222.22 J·mm−3), both materials show abundant, near-spherical pores without pronounced elongation in the build direction (Figure 4i,l), consistent with vapor-/gas-induced porosity due to melt-pool overheating.
The main study (panels a–f) systematically investigated this viable window. Under the low-VED condition #5 (78.19 J·mm−3), AA7075 (a) shows long intergranular cracks with irregularly distributed pores, whereas its HEA-containing counterpart (d) exhibits a lower crack density despite persistent spherical pores. At a medium-VED #8 (116.40 J·mm−3), AA7075 (b) contains fewer cracks but retains elongated defects, while the composite (e) presents shorter, discontinuous cracks, indicating a partial crack-arresting/deflection effect. Under high-VED-within-this-window #11 (185.19 J·mm−3), AA7075 (c) develops extensive spherical porosity together with interconnected cracks; in contrast, the composite (f) still shows large spherical pores but with visibly reduced crack length and continuity, indicating that crack suppression occurs while porosity remains.
Figure 4. Optical micrographs (25×) of (ac,gi) unreinforced AA7075 and (df,jl) AA7075 + 5 wt.% AlCoCrFeNi2.1 composite samples fabricated via LPBF. The processing conditions for (a,d), (b,e), and (c,f) correspond to parameter sets #5, #8, and #11 from Table 3, The processing conditions for (g,j), (h,k), and (i,l) correspond to the preliminary range-finding parameter sets #RF-1, #RF-2, and #RF-3 from Table 3, respectively.
Metals 15 01193 g004

3.2.2. SEM and EDS Analysis

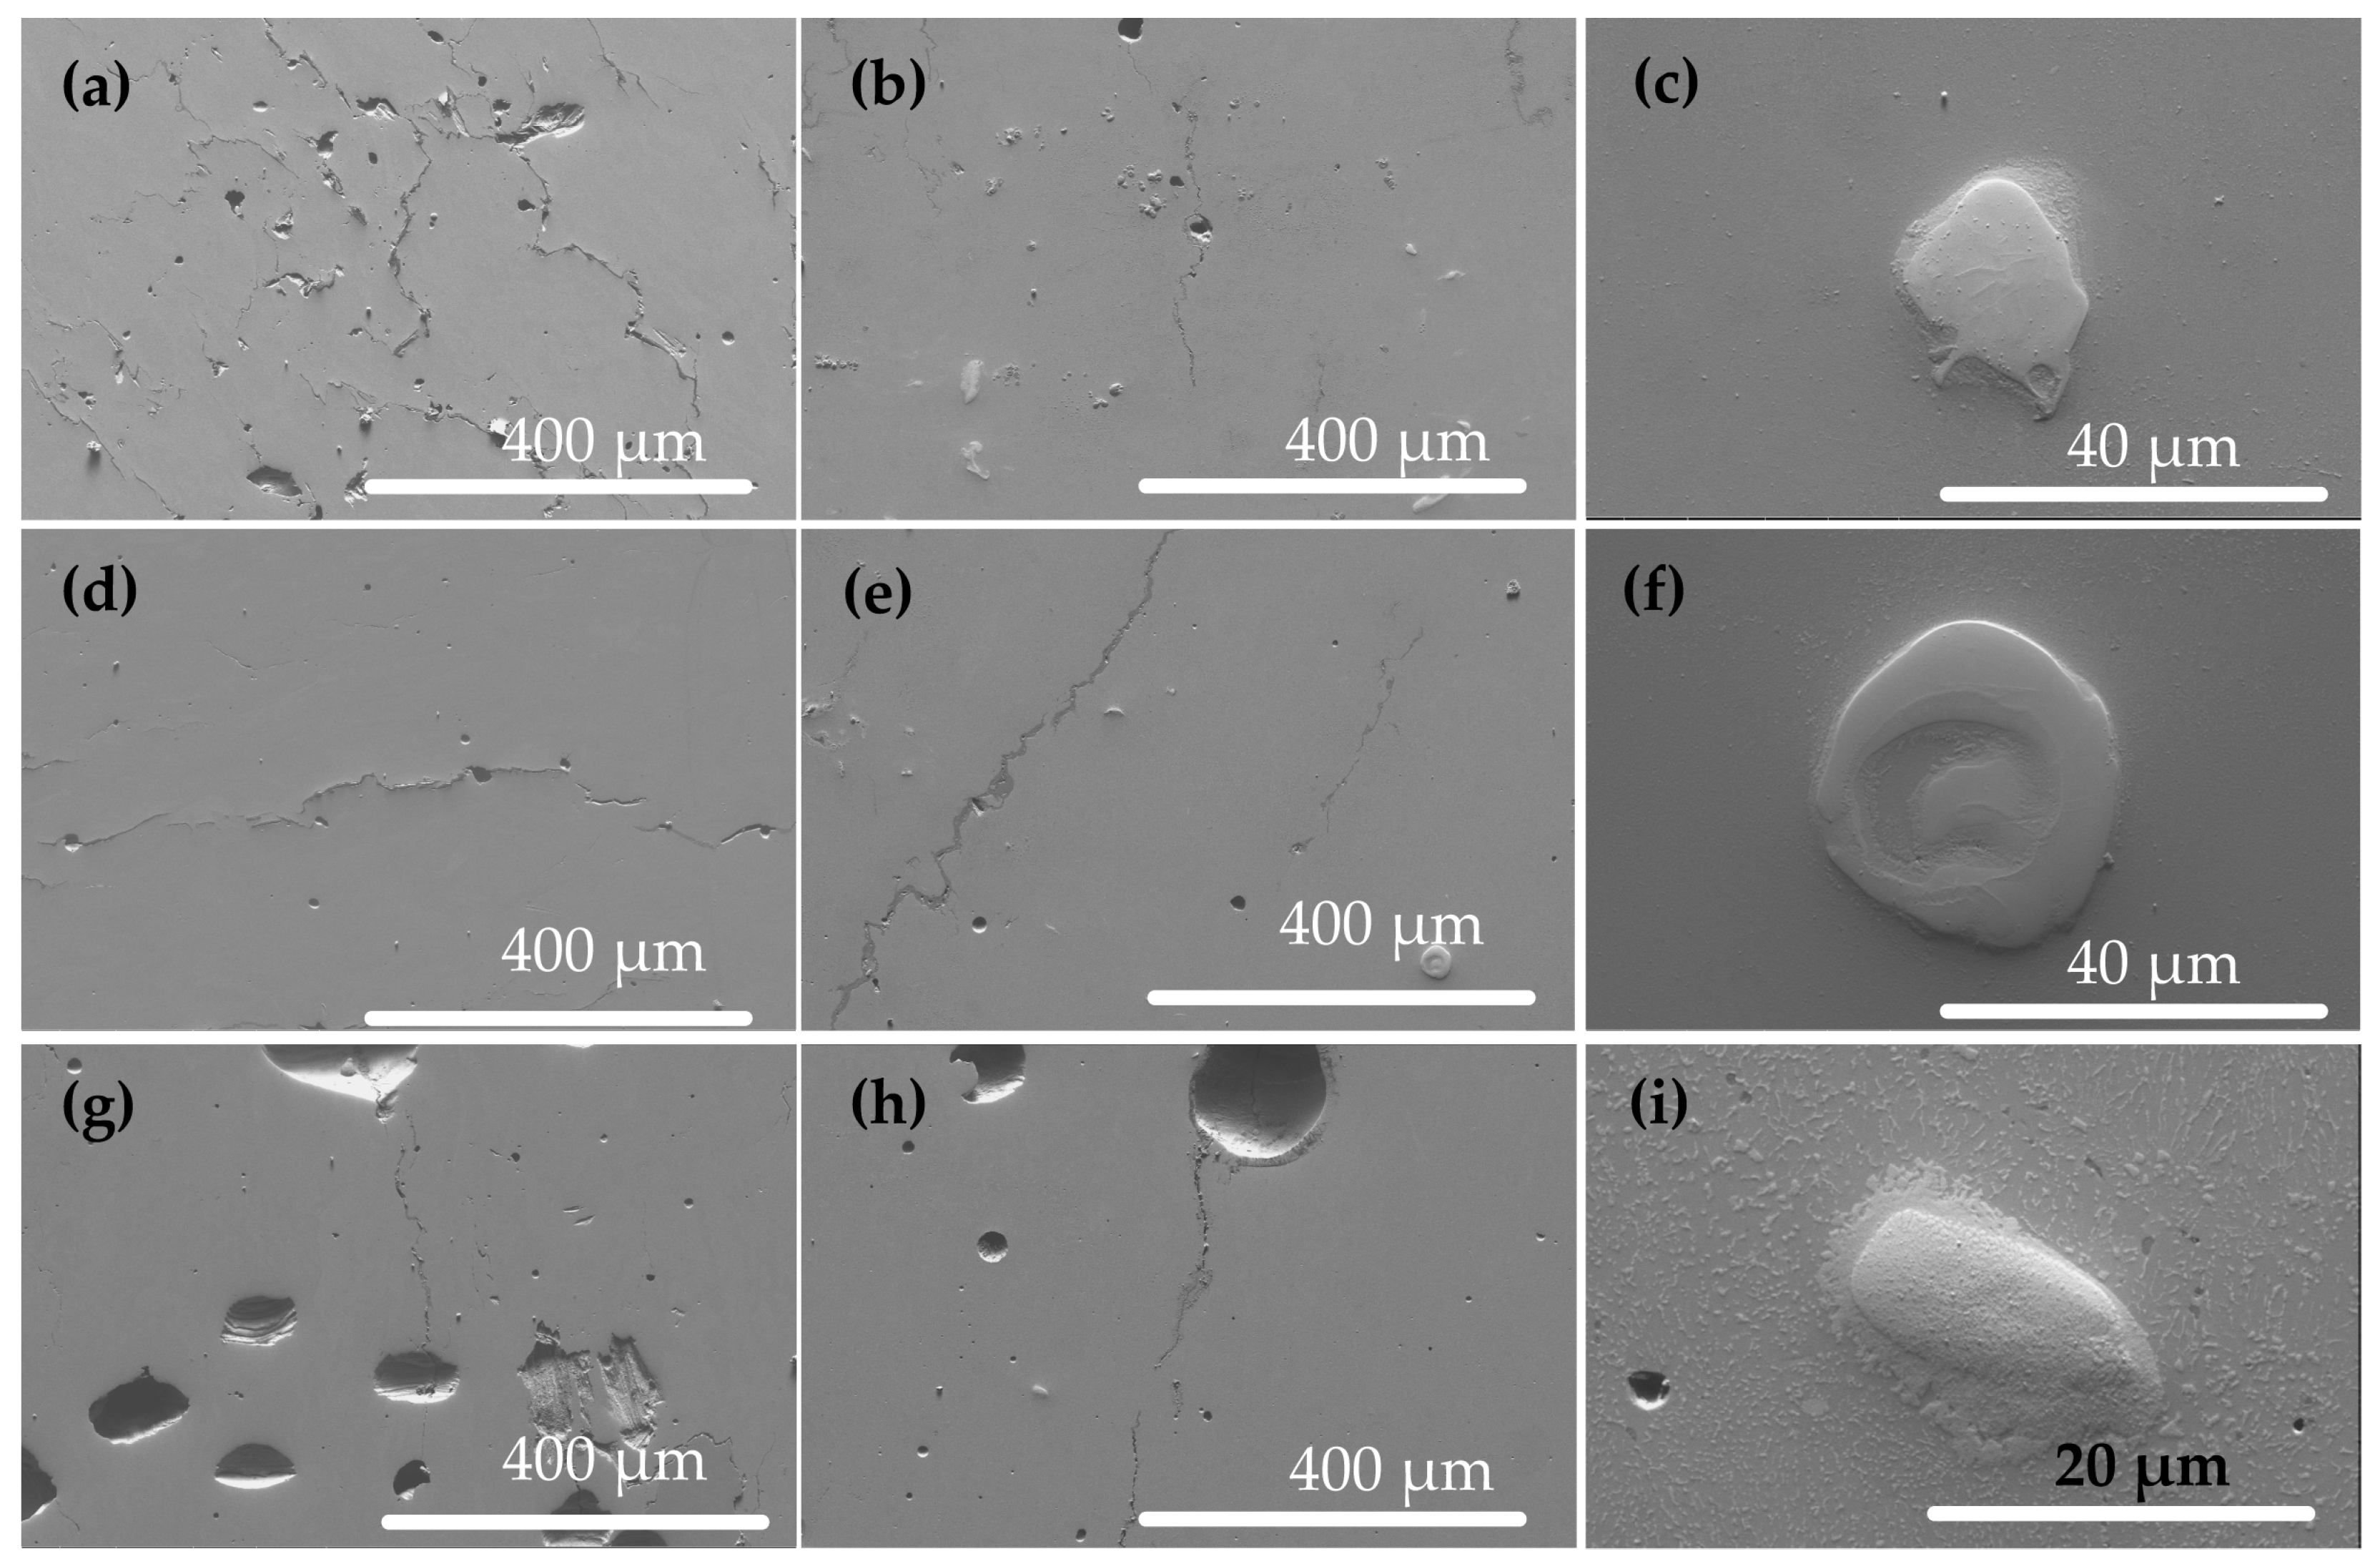
BSE/SEM images (Figure 5) of the unreinforced AA7075 alloy and the HEA-reinforced composite reveal features associated with crack morphology and porosity. Across all VED conditions, the HEA-reinforced samples exhibited bright-contrast particles. Higher-magnification imaging showed that cracks were frequently deflected or terminated near these particles, as observed in the micrographs. The images also showed a change in pore morphology, with pores in the composite samples tending to be more spheroidized than those in the unreinforced alloy.
Figure 5. BSE micrographs illustrating the microstructural features of unreinforced and HEA-reinforced samples produced under different process parameters. Each row corresponds to a specific parameter set—(ac) #5, (df) #8, and (gi) #11—as listed in Table 3. For each parameter set, (a,d,g) show the unreinforced AA7075 alloy, while (b,e,h) correspond to the composite AA7075 + 5 wt.% AlCoCrFeNi2.1, with both being captured at 500× (scale bar = 400 µm). Panels (c,f,i) present high-magnification views at 5000×, 5000×, and 10,000×, respectively, revealing the morphology and compositional contrast of the HEA-rich phase (scale bars = 40 µm, 40 µm, and 20 µm).
Metals 15 01193 g005
The EDS elemental mapping of sample #5-1 (Figure 6) provides crucial metallurgical insight into crack behavior. The feature is distinctly enriched in Fe, Co, Ni, and Cr—these elements are consistent with the HEA. In contrast, the Zn elemental map reveals distinct linear enrichment along the crack path, forming a narrow, continuous band. This trend is not shared by the HEA elements, implying that the Zn enrichment is likely associated with crack-related segregation—a primary cause of hot cracking in 7xxx alloys. The termination of the crack in the HEA-rich region, coupled with the absence of Zn enrichment within the particle, strongly suggests that the HEA reinforcement may contribute to crack deflection and interfacial strengthening by altering the local segregation chemistry.
Figure 6. EDS maps showing HEA-element enrichment and Zn segregation in the 7075 + HEA composite.
Metals 15 01193 g006
Figure 7 presents the EDS line-scan and point analyses across a typical HEA-derived particle. The scan confirms a sharp Al trough and the corresponding enrichment of transition metals (Fe, Co, Ni, Cr) in the particle core. Quantitative EDS analysis of point a shows 32.52 wt.% Ni, 15.71 wt.% Co, and 15.03 wt.% Fe, with Al reduced to 22.91 wt.%. A gradual compositional transition zone is observed at the particle/matrix interface (point b), with elements from both the matrix and the reinforcement, confirming limited yet distinct interdiffusion and metallurgical bonding under rapid solidification.
Figure 7. The microchemical analysis of a representative HEA-rich phase in the LPBF-processed AA7075 + 5 wt.% AlCoCrFeNi2.1 composite. (a) An SEM micrograph showing the phase morphology. (b) An EDS line scan profile along the white line in (a), confirming the enrichment of Co, Cr, Fe, and Ni within the phase. (c) Chemical compositions obtained through EDS point analysis of point ‘A’ (on the HEA-rich phase) and point ‘B’ (in the transition zone between the HEA-rich phase and the α-Al matrix).
Metals 15 01193 g007

3.2.3. Phase Identification (XRD Analysis)
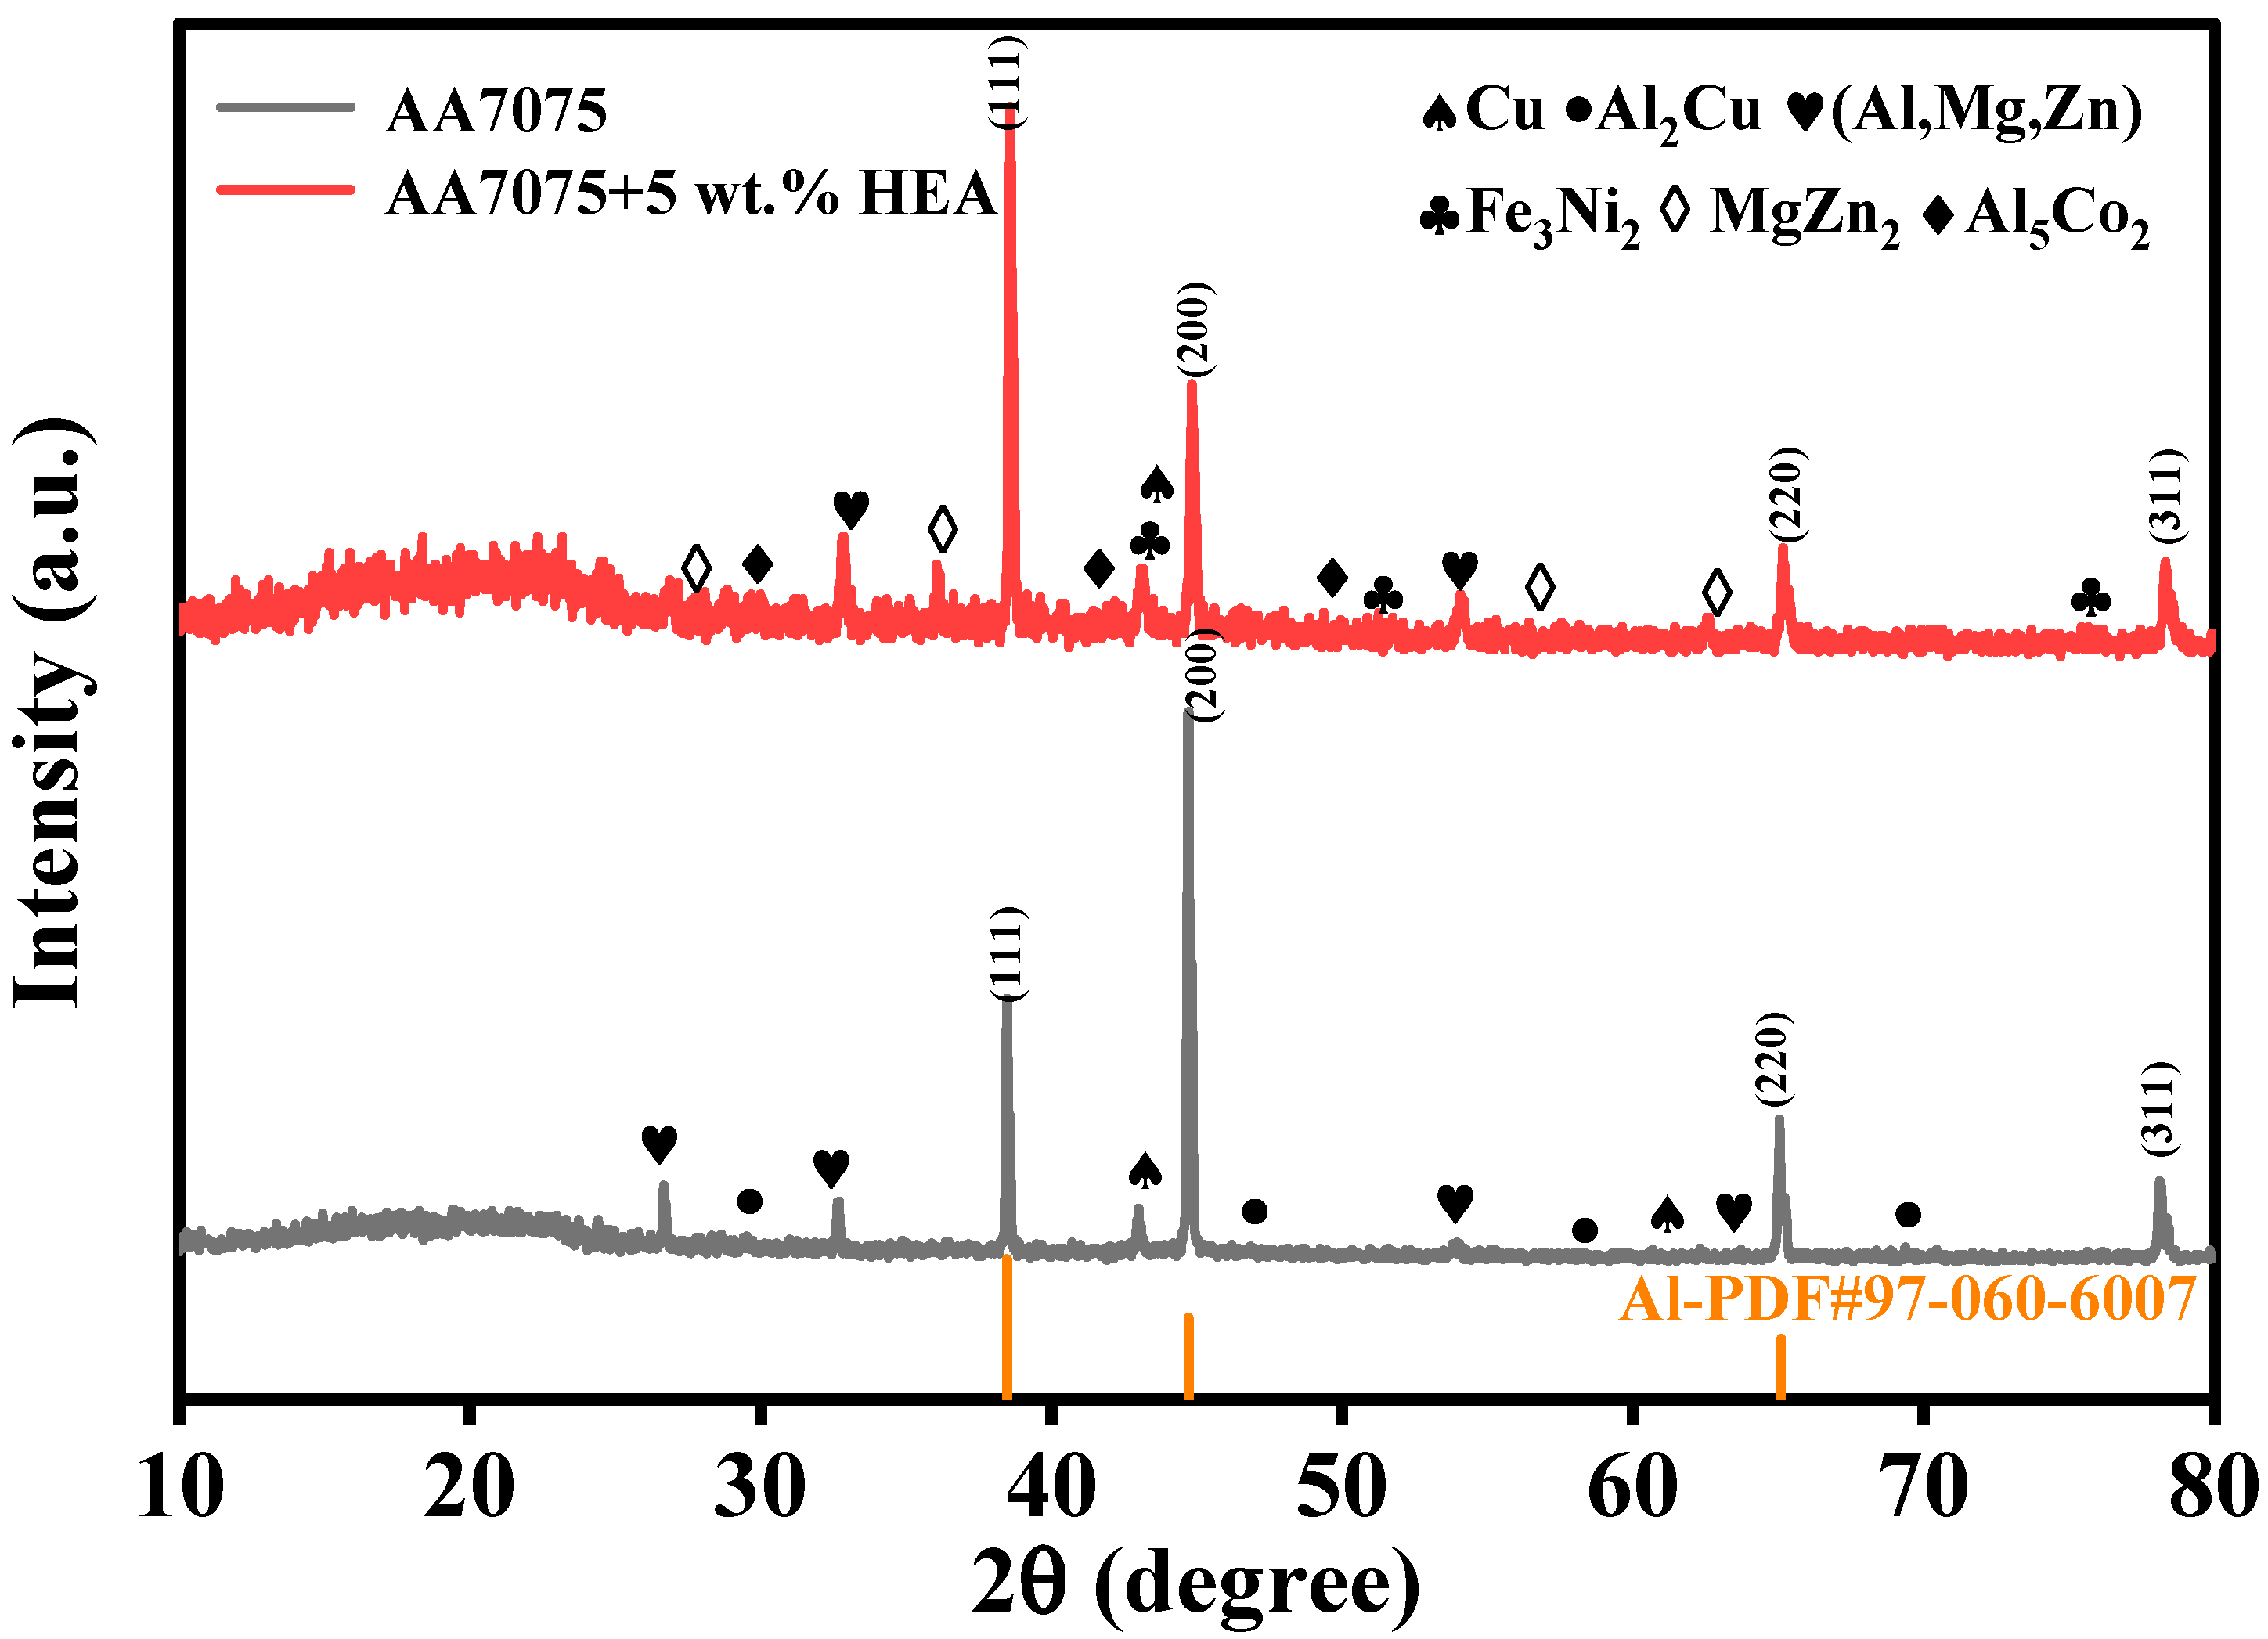
Figure 8 shows the X-ray diffraction (XRD) patterns of the LPBF-fabricated AA7075 alloy and the composite reinforced with 5 wt.% AlCoCrFeNi2.1 high-entropy alloy (HEA) particles. For the unreinforced AA7075 alloy, primary peaks correspond to the α-Al matrix. In addition to the face-centered cubic (FCC) aluminum phase, diffraction signals from typical strengthening constituents such as Al2Cu and MgZn2 are detected. Upon the incorporation of the HEA particle, the composite (AA7075 + 5 wt.% HEA) exhibits additional diffraction peaks corresponding to Fe3Ni2 and Al5Co2 phases. These new intermetallics arise from the in situ reaction between HEA-derived elements (Fe, Co, Ni) and the aluminum matrix during rapid solidification. Notably, the main α-Al peaks in the reinforced sample exhibit visible peak broadening compared to its unreinforced counterpart. Based on the Scherrer equation, this suggests that the crystallite size has been reduced, providing direct evidence of enhanced nucleation rates facilitated by the HEA particles acting as heterogeneous nucleation sites during solidification.
The mechanistic implications of the observations shown in Figure 4, Figure 5, Figure 6, Figure 7 and Figure 8 are discussed in Section 3.5.2 and Section 3.5.3.
Figure 8. A comparison of XRD patterns for the LPBF-processed unreinforced AA7075 and the AA7075 + 5 wt.% HEA composite. Both samples were prepared using parameter set #8, as detailed in Table 3.
Metals 15 01193 g008

3.3. Microhardness as a Function of Processing Parameters

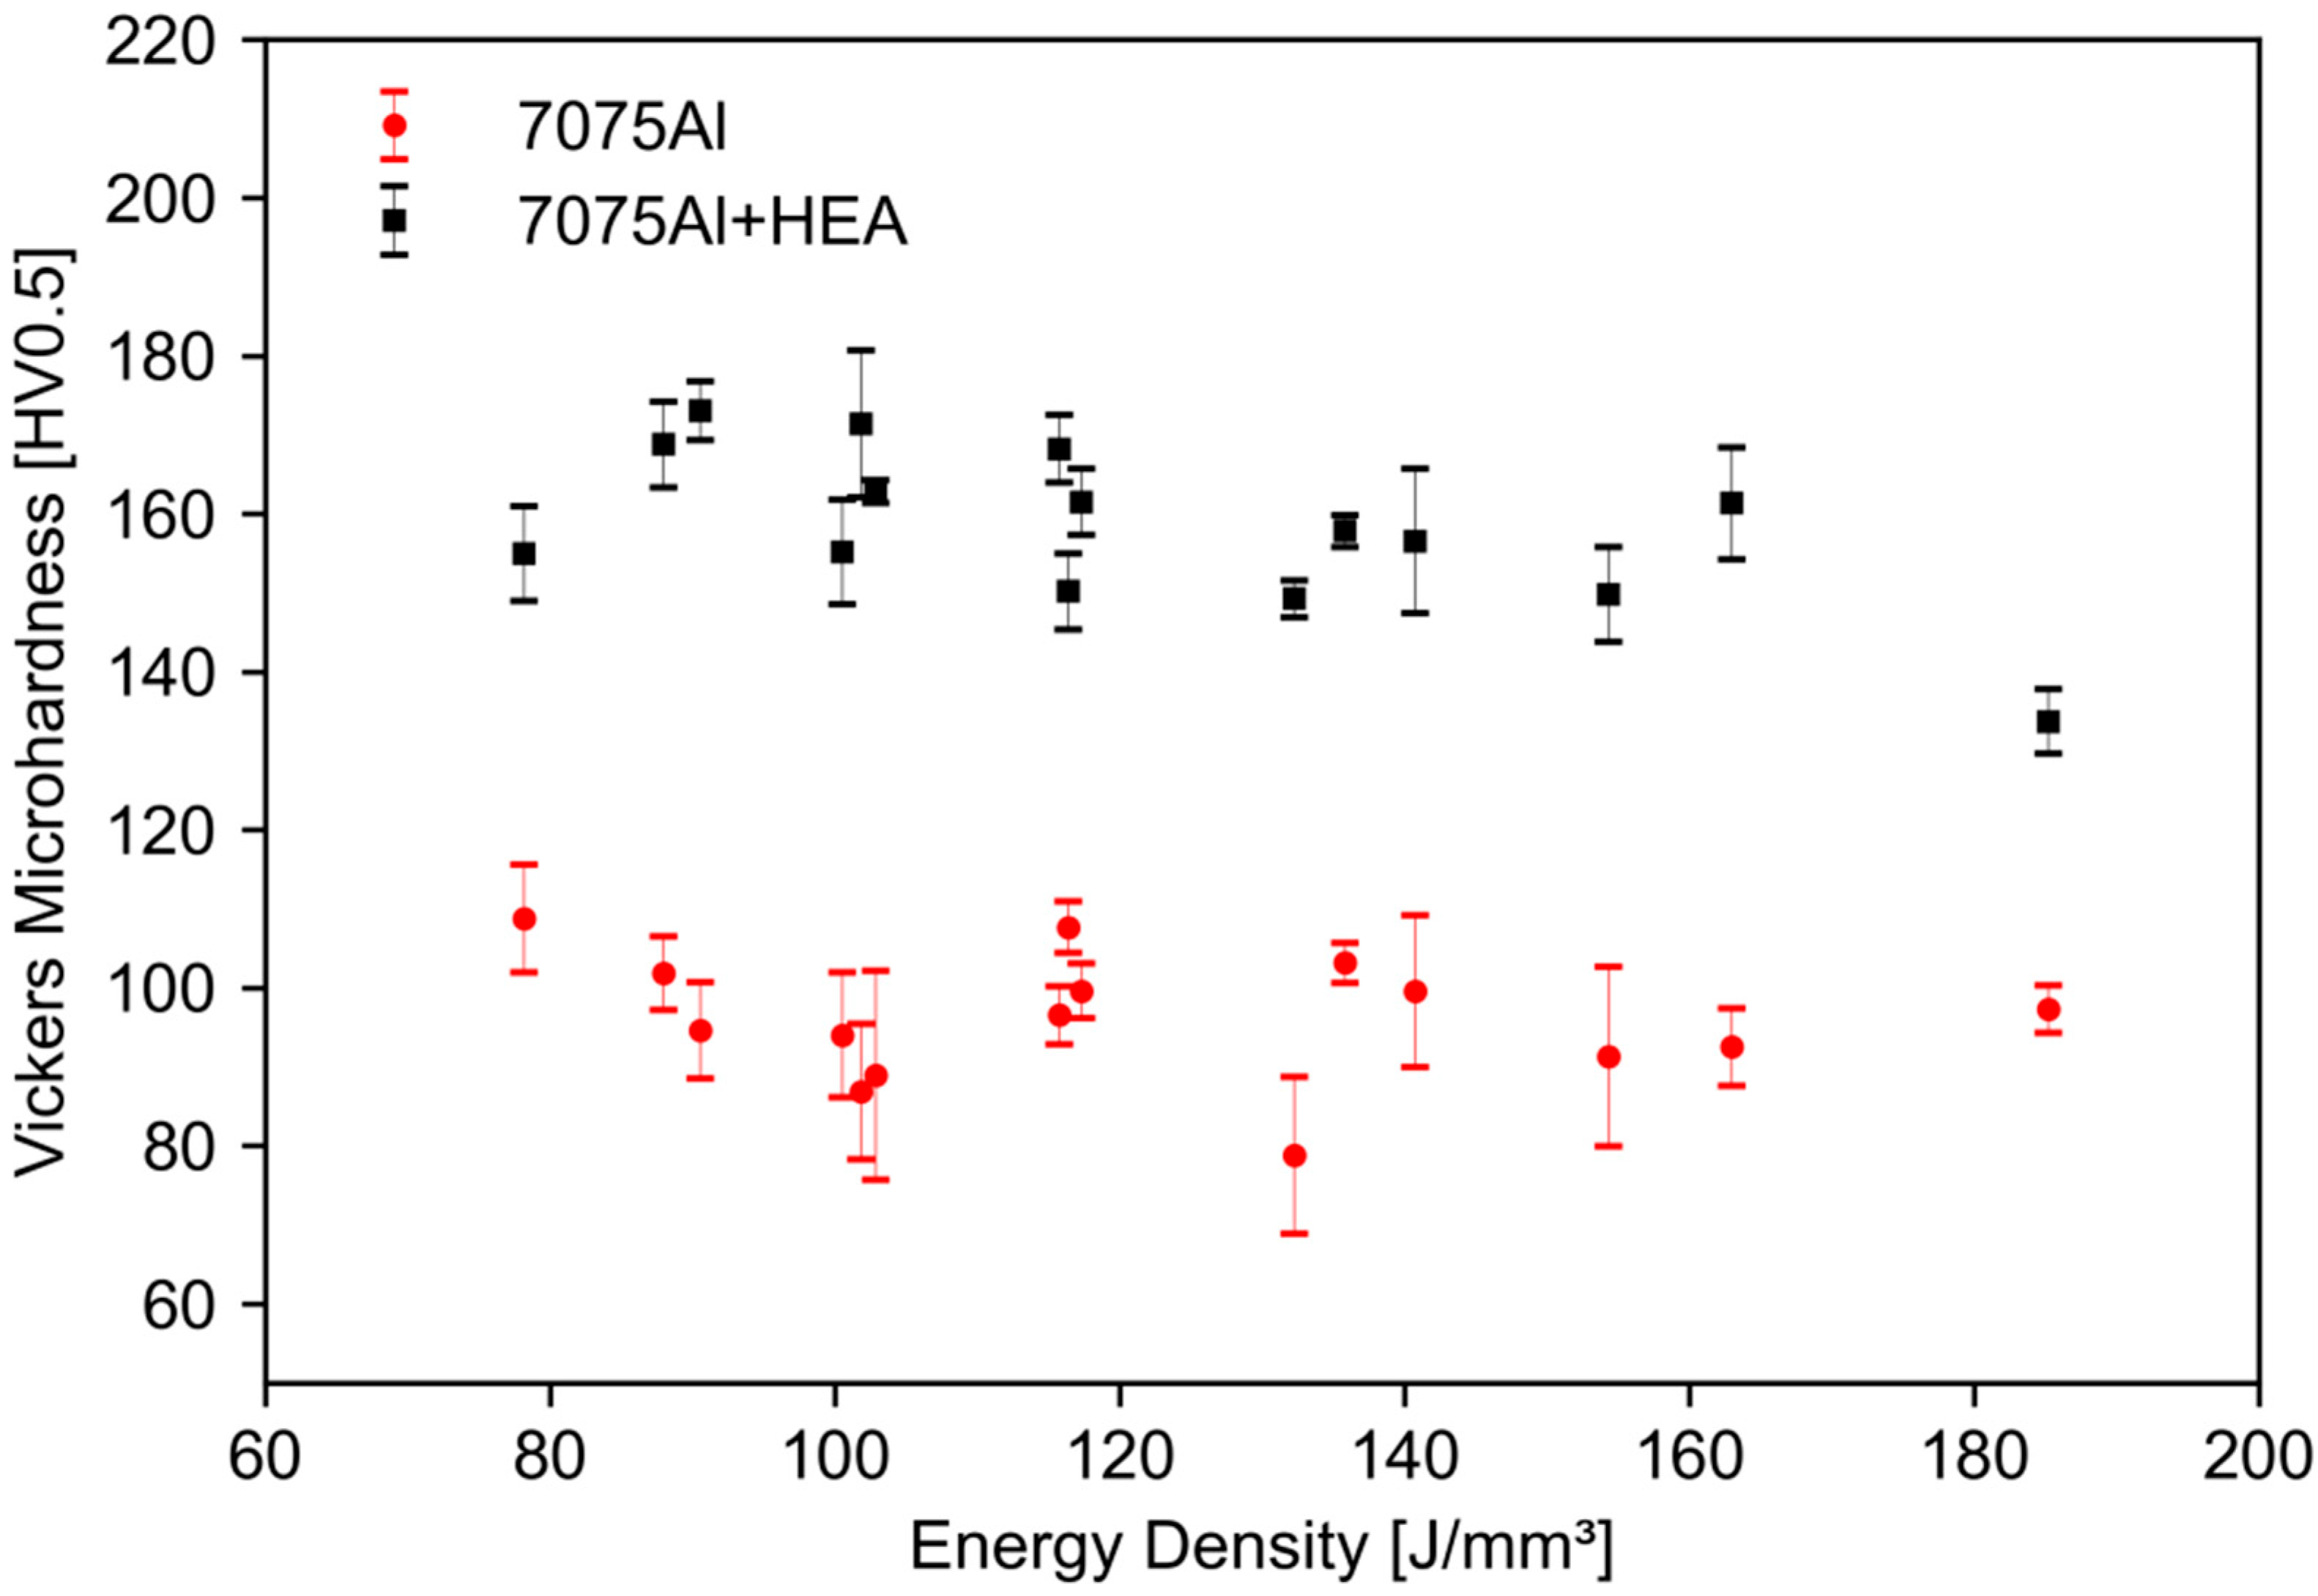
Figure 9 compares the microhardness distributions of the unreinforced alloy and the HEA-reinforced composite across all processing conditions. The average hardness of AA7075 is 96.41 ± 9.81 HV0.5, whereas the average hardness of the AA7075 + 5 wt.% AlCoCrFeNi2.1 composite reaches 158.46 ± 11.33 HV0.5, an average increase of approximately 64%. The hardness of the composite exhibits a “volcano-like” dependence on VED, peaking around indices #9–10 with an average hardness of 171.39–173.04 HV0.5. This trend reflects the competition between intrinsic strengthening mechanisms and defect formation. Under low-energy conditions, the hardness is reduced due to LOF pores, while under high-energy conditions, it decreases due to abundant near-spherical gas pores, accompanied by microcracks. The sustained hardness uplift in the composite arises from multiple, mutually consistent strengthening mechanisms: (i) dispersion strengthening by HEA-derived intermetallics (Orowan bypass); (ii) Hall–Petch strengthening from grain refinement suggested by peak broadening in XRD; (iii) strong particle/matrix interfaces that hinder dislocation motion. Overall, HEA reinforcement shifts the hardness–parameter curve upward and provides a more stable hardness plateau across the optimal processing window.
A substantial increase in microhardness was also confirmed through the reproducibility study. The three replicate builds of sample #1 yielded an average microhardness of 97.46 ± 5.80 HV0.5 for monolithic AA7075 and 157.10 ± 7.51 HV0.5 for the AA7075 + 5 wt.% AlCoCrFeNi2.1. This result, showing a consistent and statistically significant enhancement, validates the hardness values reported for the initial screening samples and confirms that the strengthening effect of the HEA is highly repeatable.

3.4. Validation of Mechanical Performance Enhancement

To quantitatively verify that the improved densification and microstructure translate into enhanced mechanical behavior, uniaxial tensile tests were performed on LPBF-fabricated AA7075 and AA7075 + 5 wt.% HEA. Each data point represents the mean ± standard deviation of three replicates (n = 3). The key properties are summarized in Table 4.
The AA7075+HEA composite shows an increased load-bearing capacity relative to monolithic AA7075. As summarized in Table 4, the Vickers microhardness (HV0.5) increases from 97.5 to 157.1 (≈61%), and the ultimate tensile strength (UTS) increases from 58.8 to 120.2 MPa (≈104%). The elongation at break also increases slightly from 0.70% to 0.81%. These results indicate higher strength with a modest change in ductility for the composite under the tested conditions.
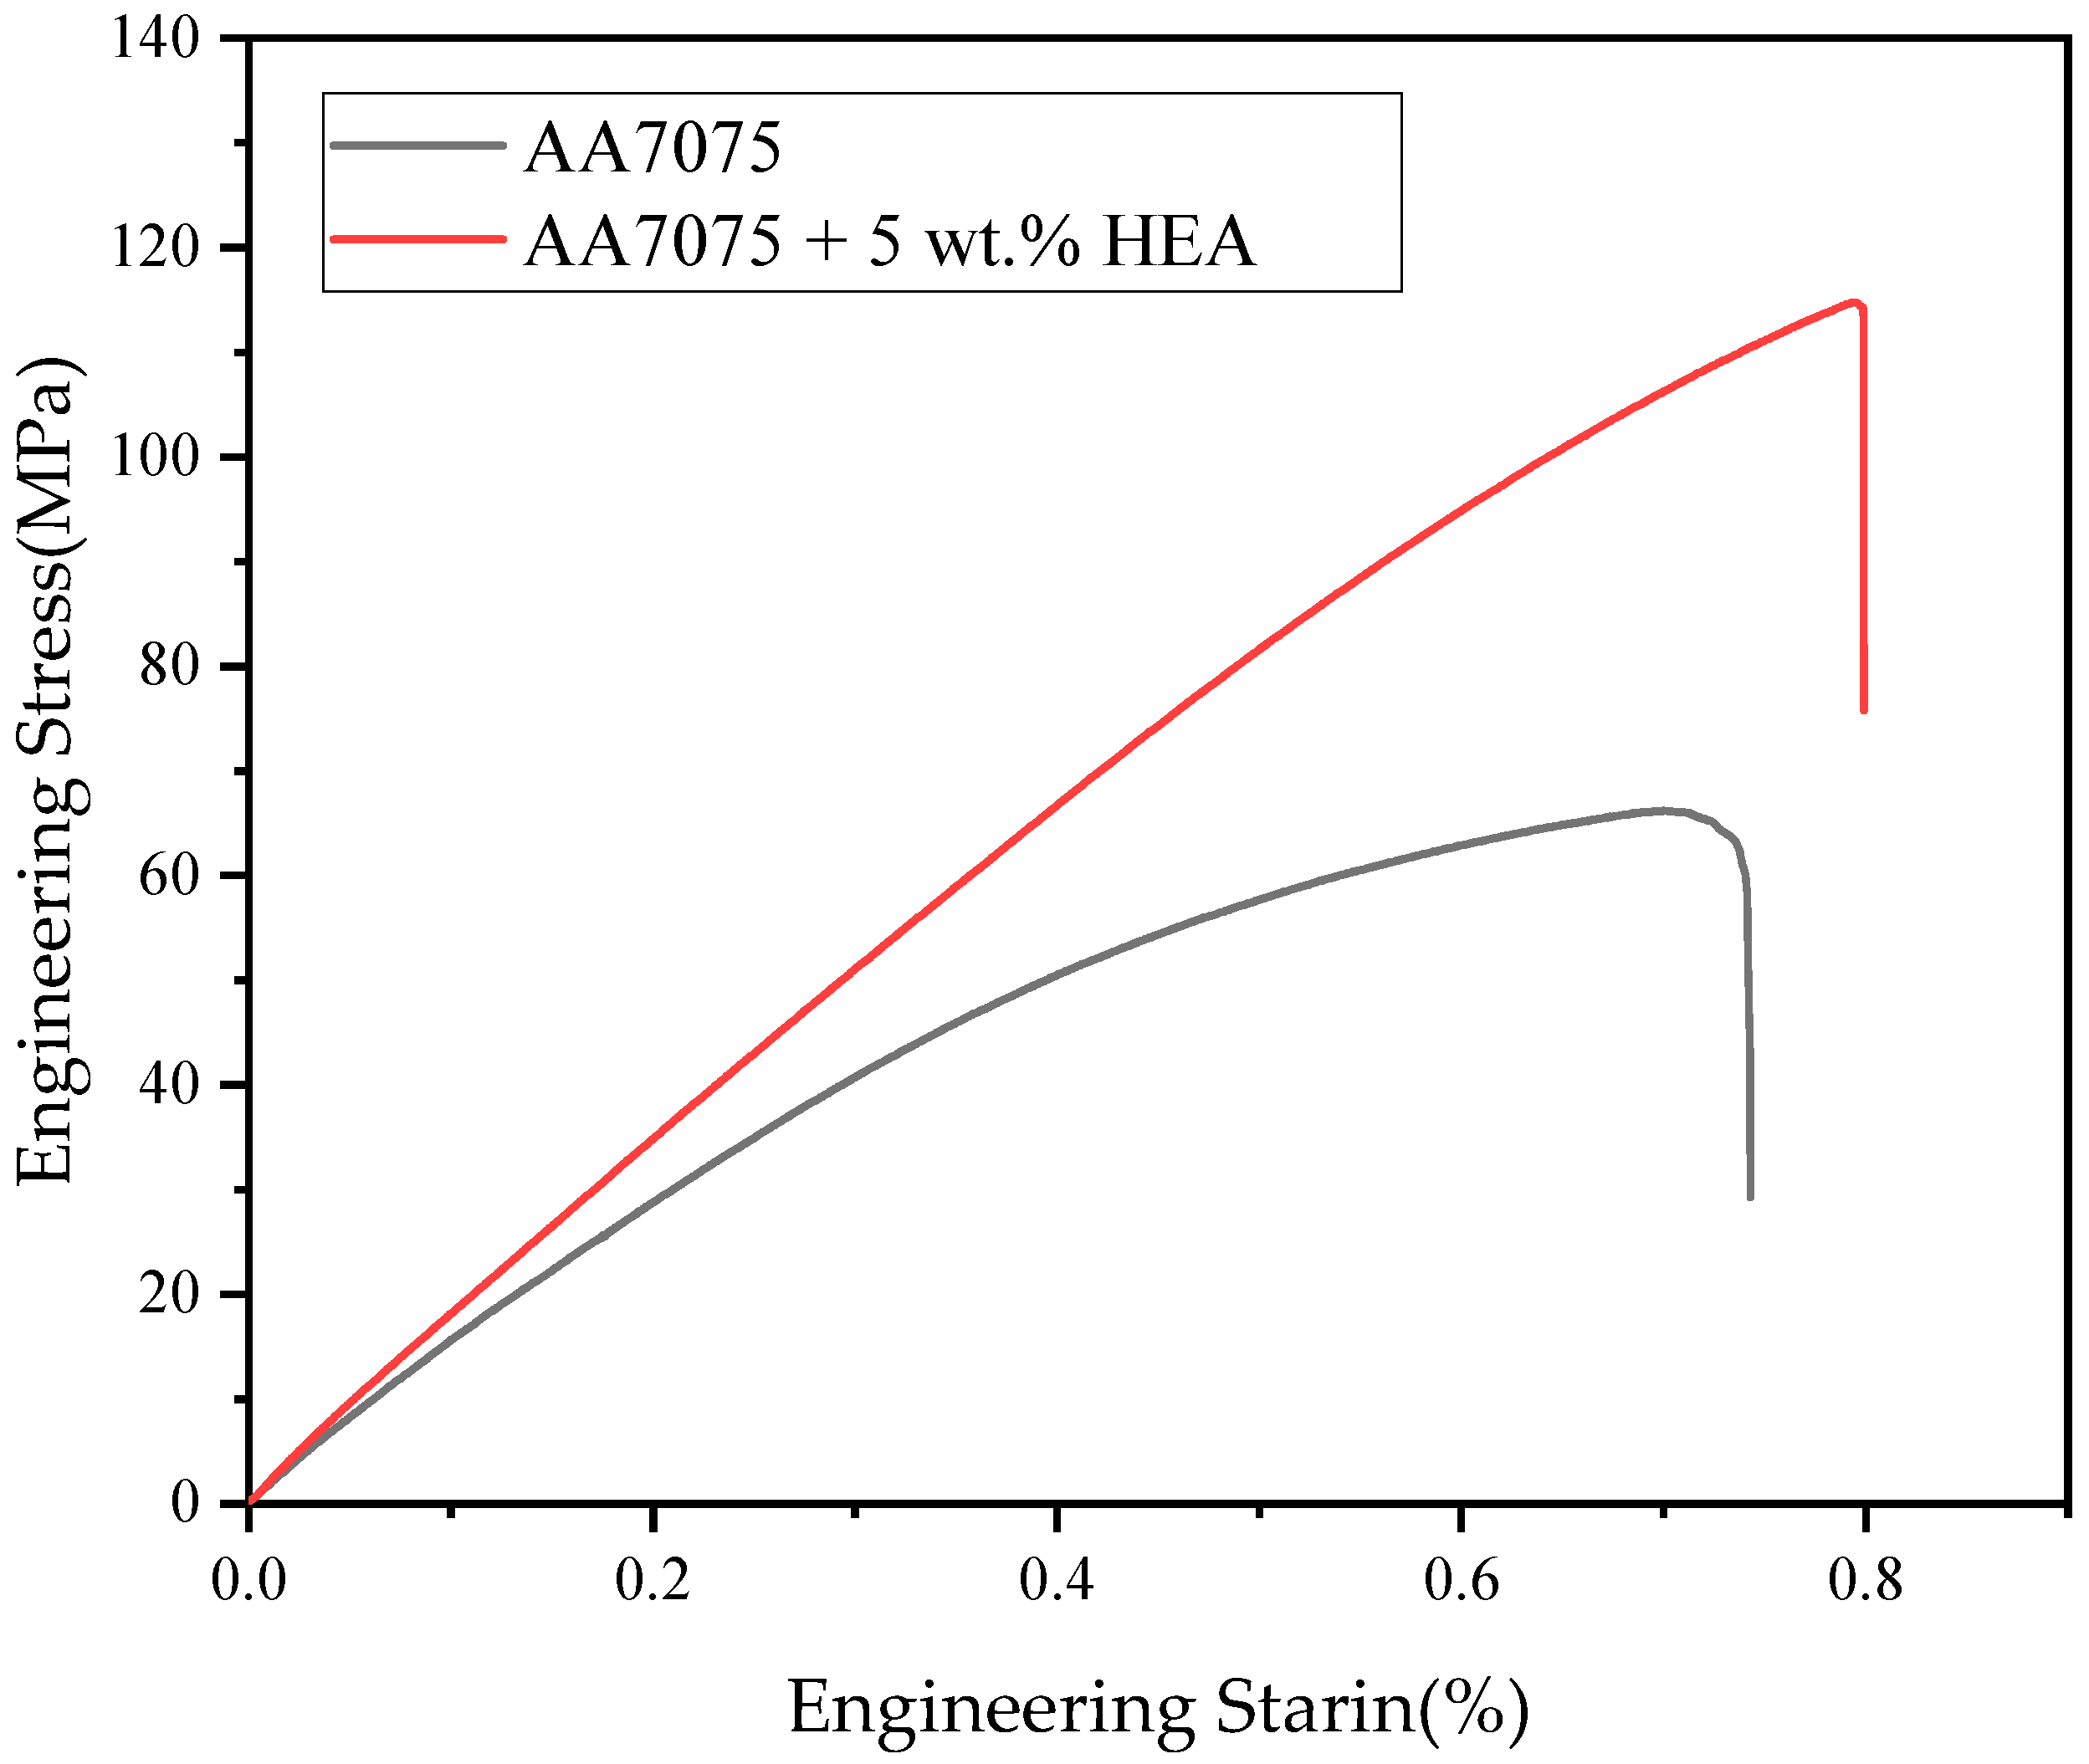
Representative engineering stress–strain curves for both materials are shown in Figure 10. Consistent with the tabulated results, the curve for LPBF-processed AA7075 shows failure at low stress, while the curve for AA7075+HEA demonstrates the ability to sustain significantly higher stress before fracture. This increase in strength was also accompanied by a slight increase in the average elongation at break (from 0.70% to 0.81%).
A full mechanistic analysis of work-hardening behavior and fracture modes (e.g., contributions of second-phase strengthening, load transfer, and defect sensitivity) requires conducting a dedicated study and is beyond the scope of this study, which focuses on defect mitigation and microstructural control in the novel AA7075–HEA composite.

3.5. Discussion

Adding 5 wt.% AlCoCrFeNi2.1 HEA particles modifies both the process response and the microstructure of AA7075 under LPBF. Rather than reiterating subsection-level details, here, we synthesize how densification behavior, crack morphology, phase evolution, and mechanical response are connected through a coherent mechanism involving melt-pool stability, solute redistribution, and interfacial phase formation.

3.5.1. Densification and Process Window

Adding HEA does not remove the canonical lack-of-fusion versus high-energy vaporization-induced porosity behavior. High-energy degradation is attributed to vaporization-driven gas entrapment and melt-pool oscillations [12,28,30,32]. At a comparable VED (≈120–130 J·mm−3), the standard deviation of relative density decreased from ≈1.11% (AA7075) to ≈0.84% (composite), indicating improved process robustness. The practically relevant change is the reduced scatter at a comparable VED. Similar stabilization—without eliminating high-energy porosity—has been reported for Al alloys inoculated with Zr-/Ti-based refiners [2,4,5,8,9], suggesting that material-level modifiers can improve robustness even when underlying pore-formation mechanisms persist.

3.5.2. Crack Behavior and Solute Segregation

A central microstructural change is the transition from long, continuous intergranular cracks in monolithic AA7075 to shorter, more discontinuous networks in the composite (Figure 4). Elemental mapping indicates Zn enrichment along crack paths in the matrix, whereas HEA-derived regions are enriched in Co/Cr/Fe/Ni (Figure 6). This finding is consistent with a crack-deflection and chemistry-modification mechanism: intact HEA particles act as physical obstacles and perturb local solute fields, thereby disrupting the continuity of Zn-rich films associated with liquation-assisted hot cracking in 7xxx systems [2,22,24]. As a result, cracks follow more tortuous paths and are more readily arrested. Compared with single-mechanism approaches (e.g., pure grain refinement), the composite strategy couples mechanical obstruction with multicomponent solute effects during rapid solidification, which may be advantageous when subjected to the steep thermal gradients of LPBF.

3.5.3. Interfacial Phase Formation and Microstructural Control

XRD identifies the formation of Fe3Ni2 and Al5Co2 intermetallics spatially associated with HEA-derived regions (Figure 8), indicating interfacial reactions between the reinforcement and the matrix. These phases, together with strong particle/matrix bonding, are compatible with load-transfer and dispersion-strengthening contributions. The broadening of α-Al peaks points to reduced coherent domain size and/or microstrain; definitive grain-size and boundary-network quantification will require the use of EBSD/TEM for decoupling these effects. Notably, eutectic AlCoCrFeNi2.1 is reported to be LPBF-processable and thermally robust, rationalizing the particles’ persistence as effective nuclei and barriers under aluminum melt-pool conditions [23,26,31].

3.5.4. Mechanical Response and Strengthening Balance

The mechanical response reflects the above microstructural changes. Despite residual porosity and microcracks, the composite sustains markedly higher load before fracture with essentially unchanged ductility (Table 4, Figure 10). We attribute this to (i) the disruption of long intergranular crack networks—restoring load-bearing continuity—and (ii) dispersion/interfacial strengthening from HEA-derived phases and robust particle/matrix interfaces, which together offset potential embrittlement from newly formed intermetallics and defect populations. While the absolute strength in the as-built state remains below those of the crack-free, heat-treated 7xxx alloys reported in the literature, our results demonstrate a step-change in the as-built load-bearing capacity of LPBF-processed AA7075 [1,2,18,19]. As tensile metrics are sensitive to pore morphology/connectivity, 3D defect quantification (e.g., μCT) would enable a more rigorous correlation between defect statistics and tensile scatter/fractography in future research.

4. Conclusions

This study examined AA7075 processed via LPBF with and without 5 wt.% AlCoCrFeNi2.1 particles across 15 power–speed conditions. During this study, we reached the following conclusions:
(1)
Densification. With the addition of HEA, the measured relative density increased by about 0.5–1.5% (absolute) over the same parameter sets, increasing from 94.50 to 96.70% (unreinforced) to 96.15–97.74% (HEA-reinforced). The highest values were obtained near the lower-to-medium VED range (e.g., 97.74% at 220 W/900 mm·s−1, VED = 90.53 J·mm−3 for the composite, and 96.70% at 190 W/800 mm·s−1, VED = 87.96 J·mm−3 for the base alloy). Porosity was not eliminated.
(2)
Hardness. The average Vickers microhardness (HV0.5) increased from 96.41 ± 9.81 to 158.46 ± 11.33 (≈64%). The gain agreed with the observed presence of fine HEA-derived phases/particles in the microstructure and associated grain/particle strengthening.
(3)
Cracks and Voids. OM comparisons at 25× (Figure 4) confirmed that adding 5 wt.% HEA modified the failure mode, transforming the long, continuous cracks typical of AA7075 into shorter, deflected ones. Porosity, however, was not eliminated; characteristic lack-of-fusion (LOF) defects persisted at low VEDs, while vaporization-induced near-spherical pores dominated at high VED values.
(4)
Phase evolution and refinement: XRD identified the formation of Fe3Ni2 and Al5Co2 intermetallics together with peak features consistent with grain refinement/lattice distortion. These microstructural changes were the primary contributors to the observed increase in hardness.
(5)
Elemental redistribution and mechanism insight: EDS mapping showed HEA particles enriched in Fe/Co/Ni/Cr, containing a marked depletion in Zn. In contrast, Zn was segregated linearly along crack paths in the matrix. This redistribution indicated that HEA reinforcement altered the solidification path and solute partitioning, interfering with the metallurgical mechanism underpinning hot cracking in 7xxx alloys.
Overall, AlCoCrFeNi2.1-particle reinforcement provides a viable and effective route for enhancing the performance of LPBF-processed AA7075 by shifting the process–property curve upward through integrated microstructure and interface engineering, while simultaneously offering a mechanistic pathway for hot-cracking mitigation.

Author Contributions

Conceptualization, S.G. and B.S.B.S.; Methodology, S.G. and Y.Z.; Composites-preparation, S.G. and Q.X.; Formal Analysis, S.G. and Q.X.; Investigation, S.G. and B.S.B.S.; Resources, B.S.B.S.; Writing—Original Draft Preparation, S.G.; Writing—Review and Editing, S.G. and B.S.B.S.; Supervision, B.S.B.S.; Project Administration, B.S.B.S.; Funding Acquisition, S.G., Q.X. and Y.Z. All authors have read and agreed to the published version of the manuscript.

Funding

This research was supported by the Natural Science Foundation Project of Fujian Province, China (Grant No. 2023J011808 and No. 2023J011798).

Data Availability Statement

The original contributions presented in this study are included in the article. Further inquiries can be directed to the corresponding author.

Conflicts of Interest

The authors declare no conflicts of interest.

References

  1. Bouzekova-Penkova, A.; Miteva, A. Some Aerospace Applications of 7075 (B95) Aluminium Alloy. Aerosp. Res. Bulg. 2022, 34, 165–179. [Google Scholar] [CrossRef]
  2. Kvvssn, V.; Butt, M.M.; Laieghi, H.; Uddin, Z.; Salamci, E.; Kim, D.B.; Kizil, H. Recent Progress in Additive Manufacturing of 7XXX Aluminum Alloys. Int. J. Adv. Manuf. Technol. 2025, 137, 4353–4399. [Google Scholar] [CrossRef]
  3. Wimmer, A.; Panzer, H.; Zoeller, C.; Adami, S.; Adams, N.A.; Zaeh, M.F. Experimental and Numerical Investigations of the Hot Cracking Susceptibility during the Powder Bed Fusion of AA 7075 Using a Laser Beam. Prog. Addit. Manuf. 2024, 9, 1589–1603. [Google Scholar] [CrossRef]
  4. Paul, S. Finite Element Analysis in Fused Deposition Modeling Research: A Literature Review. Measurement 2021, 178, 109320. [Google Scholar] [CrossRef]
  5. Liu, J.; Wen, P. Metal Vaporization and Its Influence during Laser Powder Bed Fusion Process. Mater. Des. 2022, 215, 110505. [Google Scholar] [CrossRef]
  6. Shi, G.; Zhang, R.; Cao, Y.; Yang, G. A Review of the Vaporization Behavior of Some Metal Elements in the LPBF Process. Micromachines 2024, 15, 846. [Google Scholar] [CrossRef]
  7. Zhao, C.; Parab, N.D.; Li, X.; Fezzaa, K.; Tan, W.; Rollett, A.D.; Sun, T. Critical Instability at Moving Keyhole Tip Generates Porosity in Laser Melting. Science 2020, 370, 1080–1086. [Google Scholar] [CrossRef] [PubMed]
  8. Cunningham, R.; Zhao, C.; Parab, N.; Kantzos, C.; Pauza, J.; Fezzaa, K.; Sun, T.; Rollett, A.D. Keyhole Threshold and Morphology in Laser Melting Revealed by Ultrahigh-Speed X-Ray Imaging. Science 2019, 363, 849–852. [Google Scholar] [CrossRef] [PubMed]
  9. Martin, A.A.; Calta, N.P.; Khairallah, S.A.; Wang, J.; Depond, P.J.; Fong, A.Y.; Thampy, V.; Guss, G.M.; Kiss, A.M.; Stone, K.H.; et al. Dynamics of Pore Formation during Laser Powder Bed Fusion Additive Manufacturing. Nat. Commun. 2019, 10, 1987. [Google Scholar] [CrossRef] [PubMed]
  10. Matthews, M.J.; Guss, G.; Khairallah, S.A.; Rubenchik, A.M.; Depond, P.J.; King, W.E. Denudation of Metal Powder Layers in Laser Powder Bed Fusion Processes. Acta Mater. 2016, 114, 33–42. [Google Scholar] [CrossRef]
  11. Gordon, J.V.; Narra, S.P.; Cunningham, R.W.; Liu, H.; Chen, H.; Suter, R.M.; Beuth, J.L.; Rollett, A.D. Defect Structure Process Maps for Laser Powder Bed Fusion Additive Manufacturing. Addit. Manuf. 2020, 36, 101552. [Google Scholar] [CrossRef]
  12. Kareem, S.A.; Anaele, J.U.; Aikulola, E.O.; Anamu, U.S.; Koko, A.; Bodunrin, M.O.; Alaneme, K.K. Aluminium Matrix Composites Reinforced with High Entropy Alloys: A Comprehensive Review on Interfacial Reactions, Mechanical, Corrosion, and Tribological Characteristics. J. Mater. Res. Technol. 2024, 30, 8161–8186. [Google Scholar] [CrossRef]
  13. Lu, X.; Zhang, W.; Chiumenti, M.; Cervera, M.; Gillham, B.; Yu, P.; Yin, S.; Lin, X.; Babu, R.P.; Lupoi, R. Crack-Free Laser Powder Bed Fusion by Substrate Design. Addit. Manuf. 2022, 59, 103149. [Google Scholar] [CrossRef]
  14. Xiao, J.; Yao, C.; Zhang, B.; Xiao, Z.; Zheng, H.; Qi, D.; Cao, W.; Sun, D.; Yu, W. In-Situ High-Speed X-Ray Imaging of Crack Formation and Elimination Mechanisms in AA7075 Alloy during Laser Remelting. Opt. Laser Technol. 2025, 186, 112716. [Google Scholar] [CrossRef]
  15. Wang, D.; Li, K.; Yao, J.; Geng, X.; Du, B. Effect of Layer-Wise Femtosecond Laser Shock Peening on Cracking Growth in Laser Powder Bed Fused AA 7075. Addit. Manuf. 2024, 95, 104525. [Google Scholar] [CrossRef]
  16. Chen, Y.; Zhang, D.; O’Toole, P.; Qiu, D.; Seibold, M.; Schricker, K.; Bergmann, J.-P.; Rack, A.; Easton, M. In Situ Observation and Reduction of Hot-Cracks in Laser Additive Manufacturing. Commun. Mater. 2024, 5, 84. [Google Scholar] [CrossRef]
  17. Tan, Q.; Fan, Z.; Tang, X.; Yin, Y.; Li, G.; Huang, D.; Zhang, J.; Liu, Y.; Wang, F.; Wu, T.; et al. A Novel Strategy to Additively Manufacture 7075 Aluminium Alloy with Selective Laser Melting. Mater. Sci. Eng. A 2021, 821, 141638. [Google Scholar] [CrossRef]
  18. Zheng, T.; Pan, S.; Murali, N.; Li, B.; Li, X. Selective Laser Melting of Novel 7075 Aluminum Powders with Internally Dispersed TiC Nanoparticles. Mater. Lett. 2022, 319, 132268. [Google Scholar] [CrossRef]
  19. Wu, W.; Gao, C.; Liu, Z.; Wong, K.; Xiao, Z. Laser Powder Bed Fusion of Crack-Free TiN/Al7075 Composites with Enhanced Mechanical Properties. Mater. Lett. 2021, 282, 128625. [Google Scholar] [CrossRef]
  20. Nothomb, N.; Rodriguez-Barber, I.; Avettand-Fénoël, M.-N.; Pérez Prado, M.T.; Marinova, M.; Simar, A. Understanding the Effect of Tailored Heat Treatment on Zr-Modified Al7075 Fabricated by Laser Powder Bed Fusion. Mater. Des. 2025, 258, 114553. [Google Scholar] [CrossRef]
  21. Zhou, S.Y.; Su, Y.; Wang, H.; Enz, J.; Ebel, T.; Yan, M. Selective Laser Melting Additive Manufacturing of 7xxx Series Al-Zn-Mg-Cu Alloy: Cracking Elimination by Co-Incorporation of Si and TiB2. Addit. Manuf. 2020, 36, 101458. [Google Scholar] [CrossRef]
  22. Choi, G.; Chae, H.; Kim, Y.S.; Hong, S.-K.; Shin, E.; Lee, S.Y. Additive Manufacturing of Si-Added 7075 Aluminum Alloys: Microstructural, Mechanical, and Electrochemical Properties via Heat Treatment. Materials 2025, 18, 1544. [Google Scholar] [CrossRef]
  23. Ron, T.; Shirizly, A.; Aghion, E. Additive Manufacturing Technologies of High Entropy Alloys (HEA): Review and Prospects. Materials 2023, 16, 2454. [Google Scholar] [CrossRef]
  24. Chen, X.; Kong, J.; Li, J.; Feng, S.; Li, H.; Wang, Q.; Liang, Y.; Dong, K.; Yang, Y. High-Strength AlCoCrFeNi2.1 Eutectic High Entropy Alloy with Ultrafine Lamella Structure via Additive Manufacturing. Mater. Sci. Eng. A 2022, 854, 143816. [Google Scholar] [CrossRef]
  25. Tang, X.; Zhang, H.; Zhu, Z.; Xue, P.; Wu, L.; Liu, F.; Ni, D.; Xiao, B.; Ma, Z. Dual-Phase Synergistic Deformation Characteristics and Strengthening Mechanism of AlCoCrFeNi2.1 Eutectic High Entropy Alloy Fabricated by Laser Powder Bed Fusion. J. Mater. Sci. Technol. 2023, 150, 75–85. [Google Scholar] [CrossRef]
  26. Talluri, G.; Maurya, R.S.; Murty, B.S. Composition Design of Eutectic High-Entropy Alloys: A Review. J. Mater. Sci. 2025, 60, 1156–1186. [Google Scholar] [CrossRef]
  27. He, L.; Wu, S.; Dong, A.; Tang, H.; Du, D.; Zhu, G.; Sun, B.; Yan, W. Selective Laser Melting of Dense and Crack-Free AlCoCrFeNi2.1 Eutectic High Entropy Alloy: Synergizing Strength and Ductility. J. Mater. Sci. Technol. 2022, 117, 133–145. [Google Scholar] [CrossRef]
  28. Huang, L.; Sun, Y.; Zhao, X.; Wu, C.; Dong, P.; Yang, Q.; Meng, A.; Li, J. Preparation of Ultrahigh-Strength and Ductile Nano-Lamellar Eutectic High-Entropy Alloy via Laser Powder Bed Fusion. Intermetallics 2024, 165, 108165. [Google Scholar] [CrossRef]
  29. Wang, X.; Zhang, Q.; Pan, X.; Chen, X.; Eckert, J.; Qiu, C. On the Microstructural Evolution and Mechanical Property Development of Additively Manufactured AlCoCrFeNi2.1 Eutectic High-Entropy Alloy with Aging Temperature. Mater. Sci. Eng. A 2024, 913, 147060. [Google Scholar] [CrossRef]
  30. Katagiri, K.; Irvine, S.J.; Hari, A.; Kodama, R.; Ozaki, N.; Sano, T.; Ren, J.; Yang, W.; Chen, W.; Clay, M.P.; et al. Static and Shock Compression Studies of Eutectic High-Entropy Alloy AlCoCrFeNi2.1 to Ultrahigh Pressures. J. Appl. Phys. 2024, 135, 095902. [Google Scholar] [CrossRef]
  31. Lan, L.; Wang, W.; Cui, Z.; Hao, X.; Qiu, D. Anisotropy Study of the Microstructure and Properties of AlCoCrFeNi2.1 Eutectic High Entropy Alloy Additively Manufactured by Selective Laser Melting. J. Mater. Sci. Technol. 2022, 129, 228–239. [Google Scholar] [CrossRef]
  32. Fu, Z.; Li, X.; Wu, P.; Liao, L. A Selective Laser Melted AlCoCrFeNi2.1 Eutectic High-Entropy Alloy with Improved Synergy of Strength and Hydrogen Embrittlement Resistance. Opt. Laser Technol. 2025, 183, 112364. [Google Scholar] [CrossRef]
  33. Akinwande, A.A.; Moskovskikh, D.; Romanovski, V. Enhancing Mechanical and Damping Performance of 3D-Printed Aluminium-7075 with Shape Memory High-Entropy Alloy (SMHEA): Parametric Optimization and Mathematical Modeling. Int. J. Adv. Manuf. Technol. 2024, 130, 369–383. [Google Scholar] [CrossRef]
  34. Verma, P.K.; Singh, A. Microstructure Evolution and Mechanical Properties of Aluminium Matrix Composites Reinforced with CoMoMnNiV High-Entropy Alloy. Int. J. Met. 2024, 18, 546–563. [Google Scholar] [CrossRef]
  35. Zhang, Y.; Li, X.; Gu, H.; Li, R.; Chen, P.; Kong, C.; Yu, H. Insight of High-Entropy Alloy Particles-Reinforced 2219 Al Matrix Composites via the Ultrasonic Casting Technology. Mater. Charact. 2021, 182, 111548. [Google Scholar] [CrossRef]
  36. ASTM E8/E8M-24; Standard Test Methods for Tension Testing of Metallic Materials. ASTM International: West Conshohocken, PA, USA, 2024. [CrossRef]
Figure 1. Representative SEM images of (a) AA7075, (b) AlCoCrFeNi2.1, and (c) mixed composite powders.
Metals 15 01193 g001
Figure 2. SEM image and corresponding EDS elemental mappings of the mixed powder composed of AA7075 and 5 wt.% AlCoCrFeNi2.1 alloy.
Metals 15 01193 g002
Figure 9. Vickers microhardness distribution of AA7075 and AA7075 + 5 wt.% AlCoCrFeNi2.1 composites as a function of volumetric energy density.
Metals 15 01193 g009
Figure 10. The representative engineering stress–strain curves of LPBF-fabricated AA7075 and AA7075 reinforced with 5 wt.% HEA. The selected curves show good agreement with the average mechanical properties summarized in Table 4.
Metals 15 01193 g010
Table 1. The particle size distribution parameters of the AA7075 and AlCoCrFeNi2.1 powders.
PowderD10 (μm)D50 (μm)D90 (μm)
AA707518.28431.68754.776
AlCoCrFeNi2.118.19133.85857.794
Table 2. The chemical composition of the AA7075 and AlCoCrFeNi2.1 powders (wt.%).
ElementAlCoCrFeNi2.1AA7075
Al8.22Bal.
Co18.34
Cr16.530.21
Fe17.550.33
NiBal.
Si0.23
Cu1.45
Mn0.13
Mg2.31
Zn5.15
Table 3. The LPBF parameter combinations used in this study.
No.Power (W)Speed (mm·s−1)Layer Thickness (mm)Hatch
Spacing (mm)
VED (J·mm−3)
RF-11005000.030.0974.07
RF-21905000.030.09140.74
RF-33005000.030.09222.22
11905000.030.09140.74
21906000.030.09117.28
31907000.030.09100.53
41908000.030.0987.96
51909000.030.0978.19
62205000.030.09162.96
72206000.030.09135.8
82207000.030.09116.4
92208000.030.09101.85
102209000.030.0990.53
112505000.030.09185.19
122506000.030.09154.32
132507000.030.09132.28
142508000.030.09115.74
152509000.030.09102.88
Table 4. The mechanical properties of LPBF AA7075 and AA7075 + 5 wt.% HEA (mean ± SD, n = 3).
MaterialRelative Density (%)Microhardness
(HV0.5)
UTS
(MPa)
Elongation
(%)
AA707595.92 ± 1.1197.46 ± 5.8058.79 ± 7.420.70 ± 0.09
AA7075 +5 wt.% HEA97.09 ± 0.84157.10 ± 7.51120.21 ± 5.790.81 ± 0.02
Disclaimer/Publisher’s Note: The statements, opinions and data contained in all publications are solely those of the individual author(s) and contributor(s) and not of MDPI and/or the editor(s). MDPI and/or the editor(s) disclaim responsibility for any injury to people or property resulting from any ideas, methods, instructions or products referred to in the content.