Article

Research on the Application of the Taguchi-TOPSIS Method in the Multi-Objective Optimization of Punch Wear and Equivalent Stress in Cold Extrusion Forming of Thin-Walled Special-Shaped Holes

College of Mechanical and Electrical Engineering, Guizhou Normal University, Guiyang 550025, China
*
Author to whom correspondence should be addressed.
Metals 2025, 15(11), 1192; https://doi.org/10.3390/met15111192 (registering DOI)
Submission received: 24 September 2025 / Revised: 24 October 2025 / Accepted: 24 October 2025 / Published: 26 October 2025

Abstract

In the cold extrusion forming of thin-walled, specially shaped holes in aviation motor brush boxes, non-uniform metal flow can easily induce local stress concentrations on the punch, thereby accelerating wear. Reducing the punch wear and equivalent stress is therefore critical for ensuring the forming quality of such thin-walled features and extending the service life of the mold. In this study, a slender punch with a specially shaped cross-section was selected as the research object. The Deform-3D Ver 11.0 software, incorporating the Archard wear model, was employed to investigate the effects of five process parameters—extrusion speed, punch cone angle, punch transition filet, friction coefficient, and punch hardness—on the wear depth and equivalent stress of the punch during the compound extrusion process. A total of 25 orthogonal experimental groups were designed, and the simulation results were analyzed using the Taguchi method combined with range analysis to determine the optimal parameter combination. Subsequently, a multi-objective correlation analysis of the signal-to-noise ratios for wear depth and equivalent stress was conducted using the TOPSIS approach. The analysis revealed that the optimal combination of process parameters was an extrusion speed of 12 mm·s−1, a punch cone angle of 50°, a punch transition filet radius of 1.8 mm, a friction coefficient of 0.12, and a punch hardness of 55 HRC. Compared with the initial process conditions, the integrated application of the Taguchi–TOPSIS method reduced the punch wear depth and equivalent stress by 21.68% and 42.58%, respectively. Verification through actual production confirmed that the wear conditions of the primary worn areas were in good agreement with on-site production observations.

1. Introduction

The brush box in aerospace brushed motors is made of H62 material and serves as a key electrical contact component in aerospace brushed motors. Its function is to secure and guide the brushes, ensuring stable contact with the commutator. The thin-walled irregular-shaped holes of the brush box are formed through processes such as cold extrusion, cold heading, drilling, and composite extrusion of thin-walled special-shaped holes.
Compared to CNC machining, this method offers significant advantages in terms of material savings, efficiency enhancement, and improvement of mechanical properties [1]. Extrusion of thin-walled irregular holes is a core process that determines the final dimensions and performance of the product. Uneven wall thickness can easily lead to uneven metal flow and stress distribution, resulting in local stress concentration on the punch, which in turn causes failure issues such as wear, plastic deformation, and fatigue fracture [2,3,4,5,6]. Therefore, it is necessary to conduct collaborative optimization of the composite extrusion process parameters to improve the uniformity of material flow and suppress the peak value of equivalent stress, thereby ensuring forming quality and reducing punch wear [7,8,9,10,11]. This study conducts multi-objective optimization of the wear depth and equivalent stress of the punch in the cold extrusion process of thin-walled irregular holes in brush boxes, aiming to provide theoretical support and practical references for the improvement of this process.
Currently, the academic research on mold wear and stress distribution during forging, stamping, and other methods aims to reduce mold wear and alleviate stress concentration through algorithmic optimization of process parameter combinations [12,13,14,15]. The empirical model for die wear developed by Davoudi, M. and Nejad, A.F. [16] using DEFORM demonstrates that the die surface bevel angle is the dominant factor influencing wear behavior. Oezode, J.E. and Ajide, O.O. [17] used DEFORM-3D simulations to investigate the extrusion of ZK60 magnesium alloy and found that process parameters, such as extrusion speed and friction coefficient, exert a significant influence on die wear depth. Fernandez, D. and Rodriguez-Prieto, A. [18] utilized DEFORM-3D to analyze simulation results and identified the optimal process parameters to minimize punch wear. Currently, research on the combinatorial optimization of process parameters mainly employs traditional methods such as response surface methodology, analysis of variance (ANOVA), or range analysis. Among them, the response surface methodology involves a cumbersome process and relies on empirical assumptions. Although ANOVA and range analysis can identify the significance of parameters and obtain locally optimal solutions, they still have limitations in terms of global optimization capabilities and in-depth revelation of the mapping mechanism between process parameters and mold responses. The Taguchi method demonstrates favorable robustness and reliability in manufacturing process optimization [19,20]. Elplacy, F., and Samuel, M., et al. [21] optimized the AA2024 aluminum alloy extrusion process by integrating the Taguchi method with finite element simulation and enhanced the process stability. De Bruijn AC and Gómez-Gras G, et al. [22] determined the optimal values of rolling process parameters based on the Taguchi design, improving the surface quality and fatigue life of polished samples. Bakhtiarian, M., Omidvar, H. et al. [23] investigated the selective laser melting process parameters for SS316L stainless steel using the Taguchi method, resulting in significant improvements in density, hardness, and overall mechanical properties. To seek the optimal combination of balanced process parameters, the TOPSIS method is employed for multi-objective optimization. Due to its intuitive concept, simple calculation, and strong practicality, it has become a widely used and effective tool in multi-attribute decision-making [24,25,26,27,28,29]. Faheem, A., Hasan, F. et al. [30] applied the TOPSIS method to optimize multiple objectives in the electrical discharge machining of nickel-titanium alloy. Chen, X., Li, X. et al. [31] applied the TOPSIS method to rank Pareto-optimal solutions, thereby facilitating optimal decision-making. Among others, Yuan, J. and Geng, H. [32] conducted the multi-objective optimization and experimental validation of a laser cladding process using the TOPSIS method. Integrating the Taguchi method, which centers on robustness, with the TOPSIS multi-objective decision-making strategy can effectively coordinate multiple optimization objectives while ensuring the quality of part formation [33,34]. The decision-making process of this integrated method is objective and systematic, with high computational efficiency, as well as exhibiting good result visibility and engineering applicability. Imran, M. and Shuangfu, S. [35] identified the optimal cutting parameters via an integrated signal-to-noise ratio and multi-objective optimization approach, achieving substantial improvements in both surface quality and production efficiency during low-carbon steel machining. Sur, G., Motorcu, A.R. et al. [36] developed an integrated Taguchi-entropy-weighted TOPSIS strategy combined with ANOVA to achieve multi-objective parameter optimization and significance evaluation of key factors. In conclusion, the Taguchi-TOPSIS integrated framework organically combines the efficiency and quality robustness of experimental design with the scientificity of multi-attribute decision-making.
This study addresses the challenges of punch wear and stress control in the compound cold extrusion forming process for thin-walled, irregularly shaped holes in aviation motor brush boxes. Due to the uneven wall thickness of the aviation motor brush box, the blank exhibits three-dimensional non-uniform plastic flow during the forming process, resulting in asymmetric loading on the punch. Particularly, stress concentration forms at the transition zone between the conical surface guiding the flow and the cylindrical section, significantly exacerbating wear and thereby constraining mold lifespan and part precision. In addition to mold structure, process parameters such as extrusion speed, friction conditions, and mold hardness are also key factors influencing wear behavior. Currently, systematic multi-objective optimization research on the extrusion process for thin-walled, irregularly shaped holes remains inadequate, especially regarding the combined optimization strategy that integrates Taguchi experimental design with TOPSIS multi-objective decision-making methods, which has not been reported. For this purpose, this study established a rigid-plastic finite element model based on Deform-3D Ver 11.0 software to simulate the extrusion process and extract data on punch wear depth and equivalent stress. By integrating the Taguchi method with the TOPSIS evaluation system, a comprehensive assessment and optimization of multiple process parameter combinations were achieved. The study aims to reveal the influence mechanisms of key parameters on wear and stress, providing a scientific and reliable multi-objective parameter optimization scheme for the cold extrusion process of such high-precision thin-walled irregularly shaped parts.

2. Experimental Procedure

2.1. Trial Protocol

This study investigates the cold extrusion forming process for thin-walled special-shaped holes through a framework that integrates process design, numerical simulation, and physical experimental verification [37].
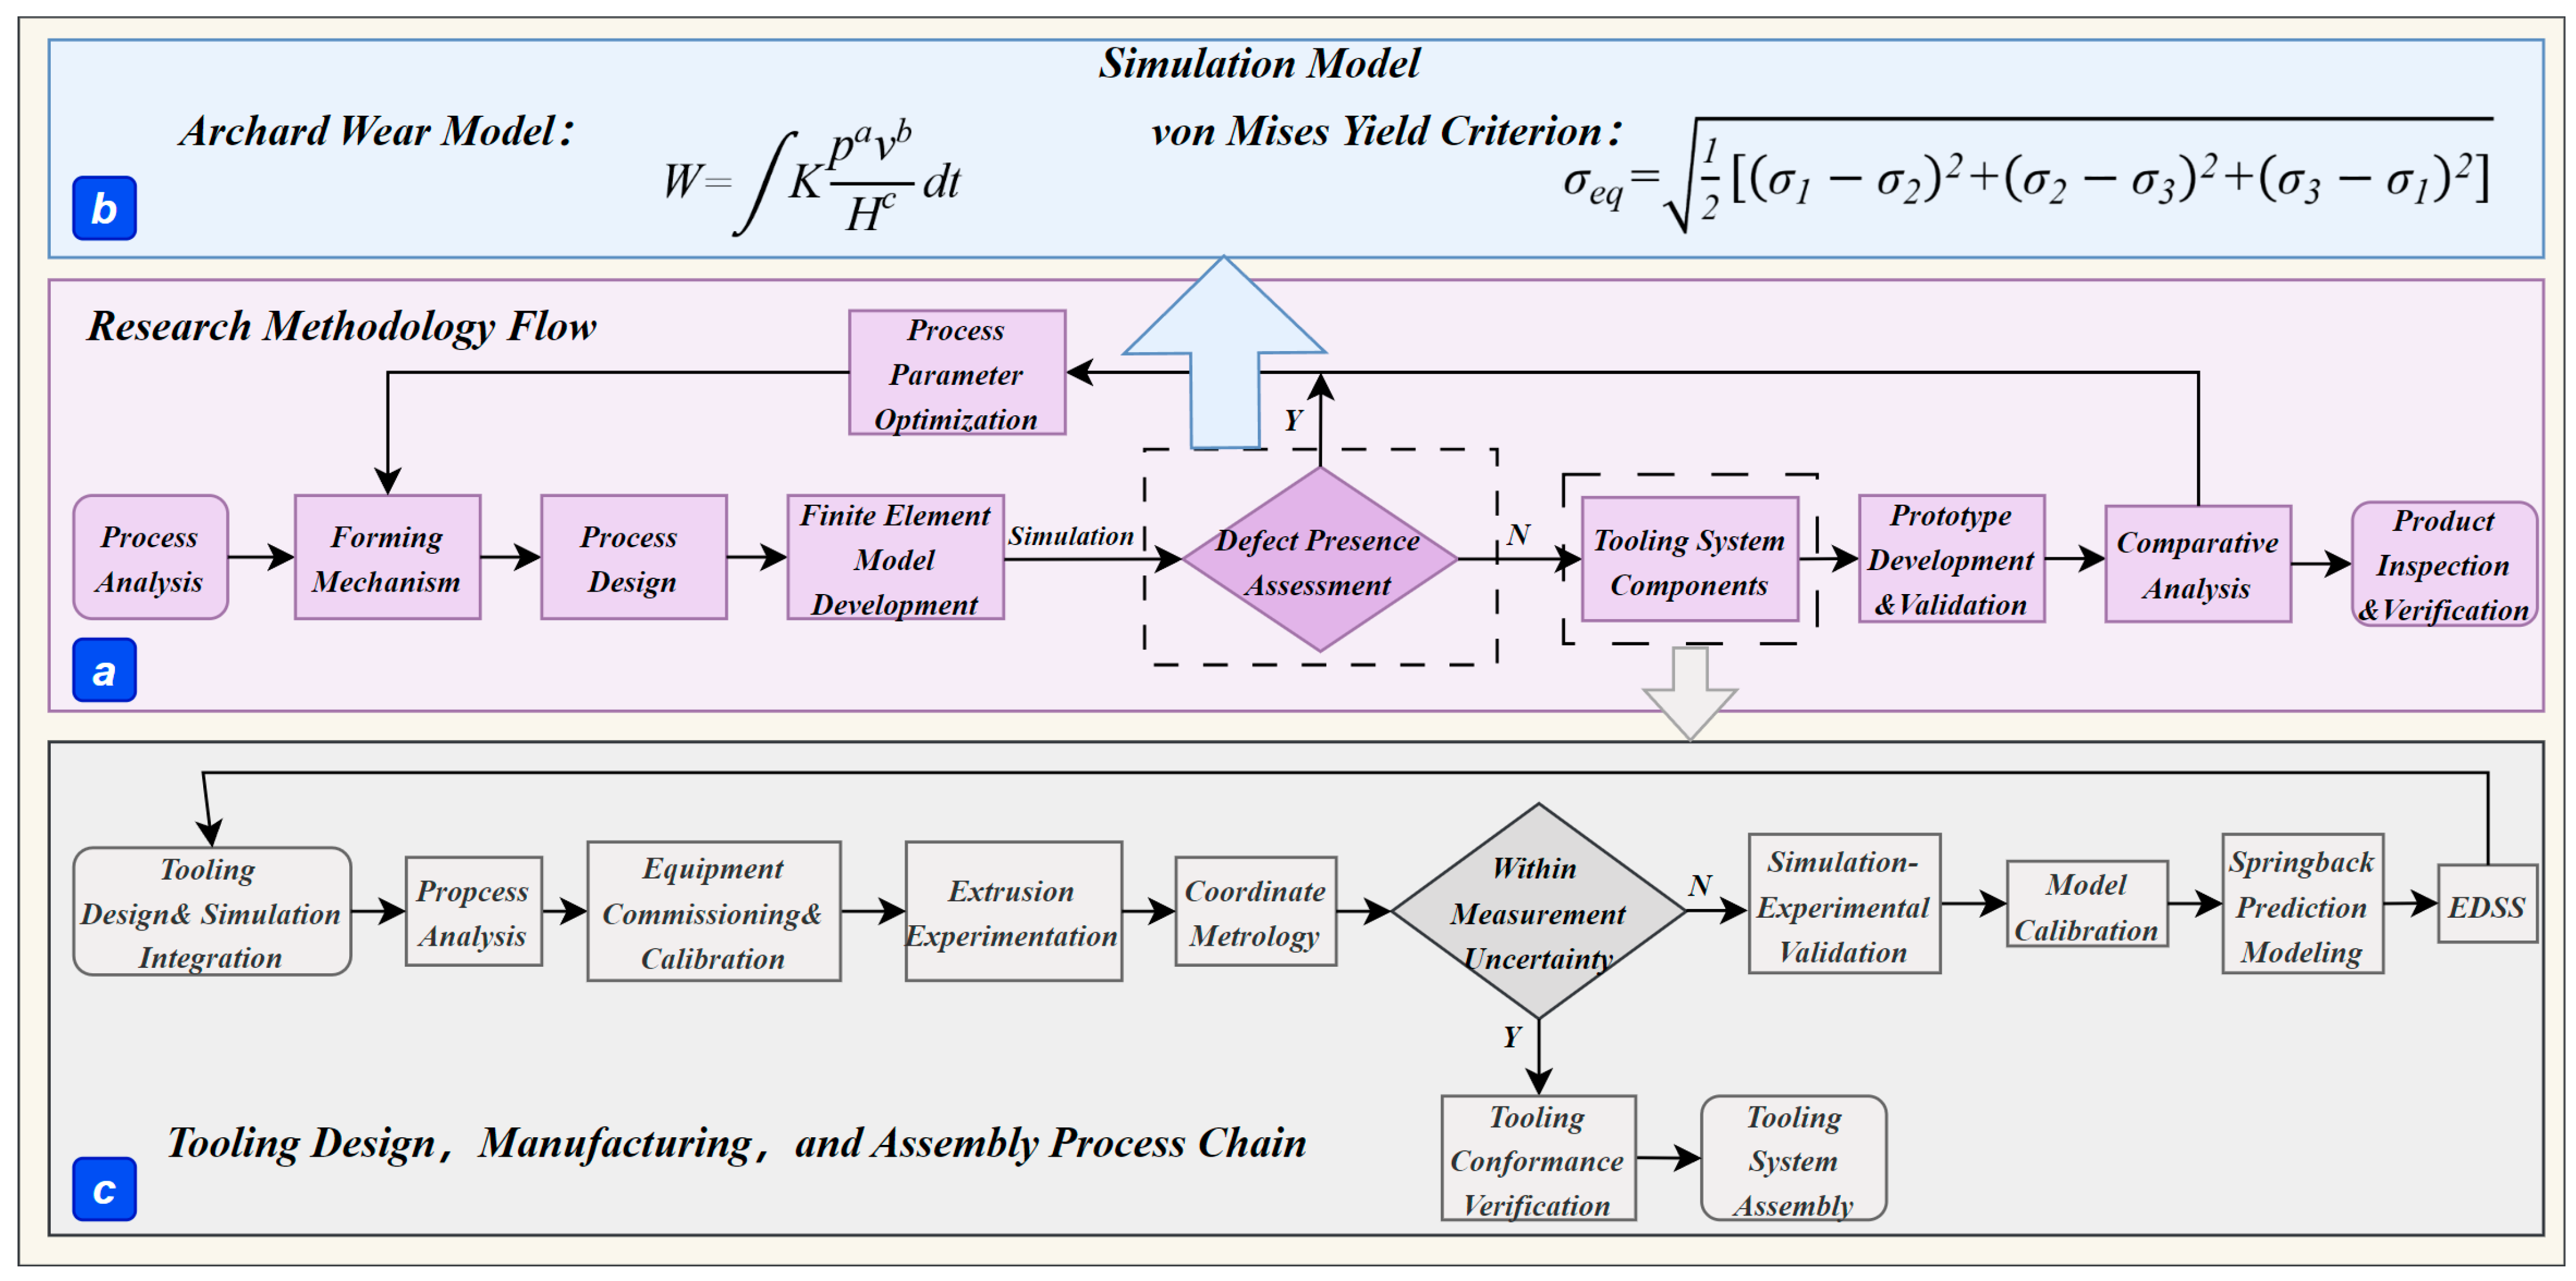
Based on the structural features of the aviation motor brush box (Figure 1) and the mechanism of cold extrusion plastic deformation, a process plan was designed and subsequently validated through numerical simulations. A finite element model integrating the Archard wear model and the von Mises yield criterion was developed, taking into account the deformation behavior and boundary conditions (Figure 2b). This model was used to simulate the forming process of thin-walled profiles with irregular holes and to analyze potential defects. If forming defects such as folding or underfilling were detected, the mold geometry and process parameters were iteratively adjusted and re-simulated until defect-free extruded parts were achieved. The overall technical approach is outlined in Figure 2a.
Upon completion of mold processing, assembly, and debugging, trial production of the parts was carried out (Figure 2c). Trial production plays a critical role in validating process reliability and forming consistency. Should a significant discrepancy arise between the trial results and simulation predictions, further optimization and adjustment of process parameters are required. If good agreement is observed, the formed parts undergo professional inspection for dimensional accuracy and surface quality, while the punch is examined for wear depth and distribution. In cases where the forming quality fails to meet specifications, the engineering decision support system (EDSS) is reapplied to re-optimize the process, and the mold may be re-processed accordingly.

2.2. Constitutive Equation of H62 Material

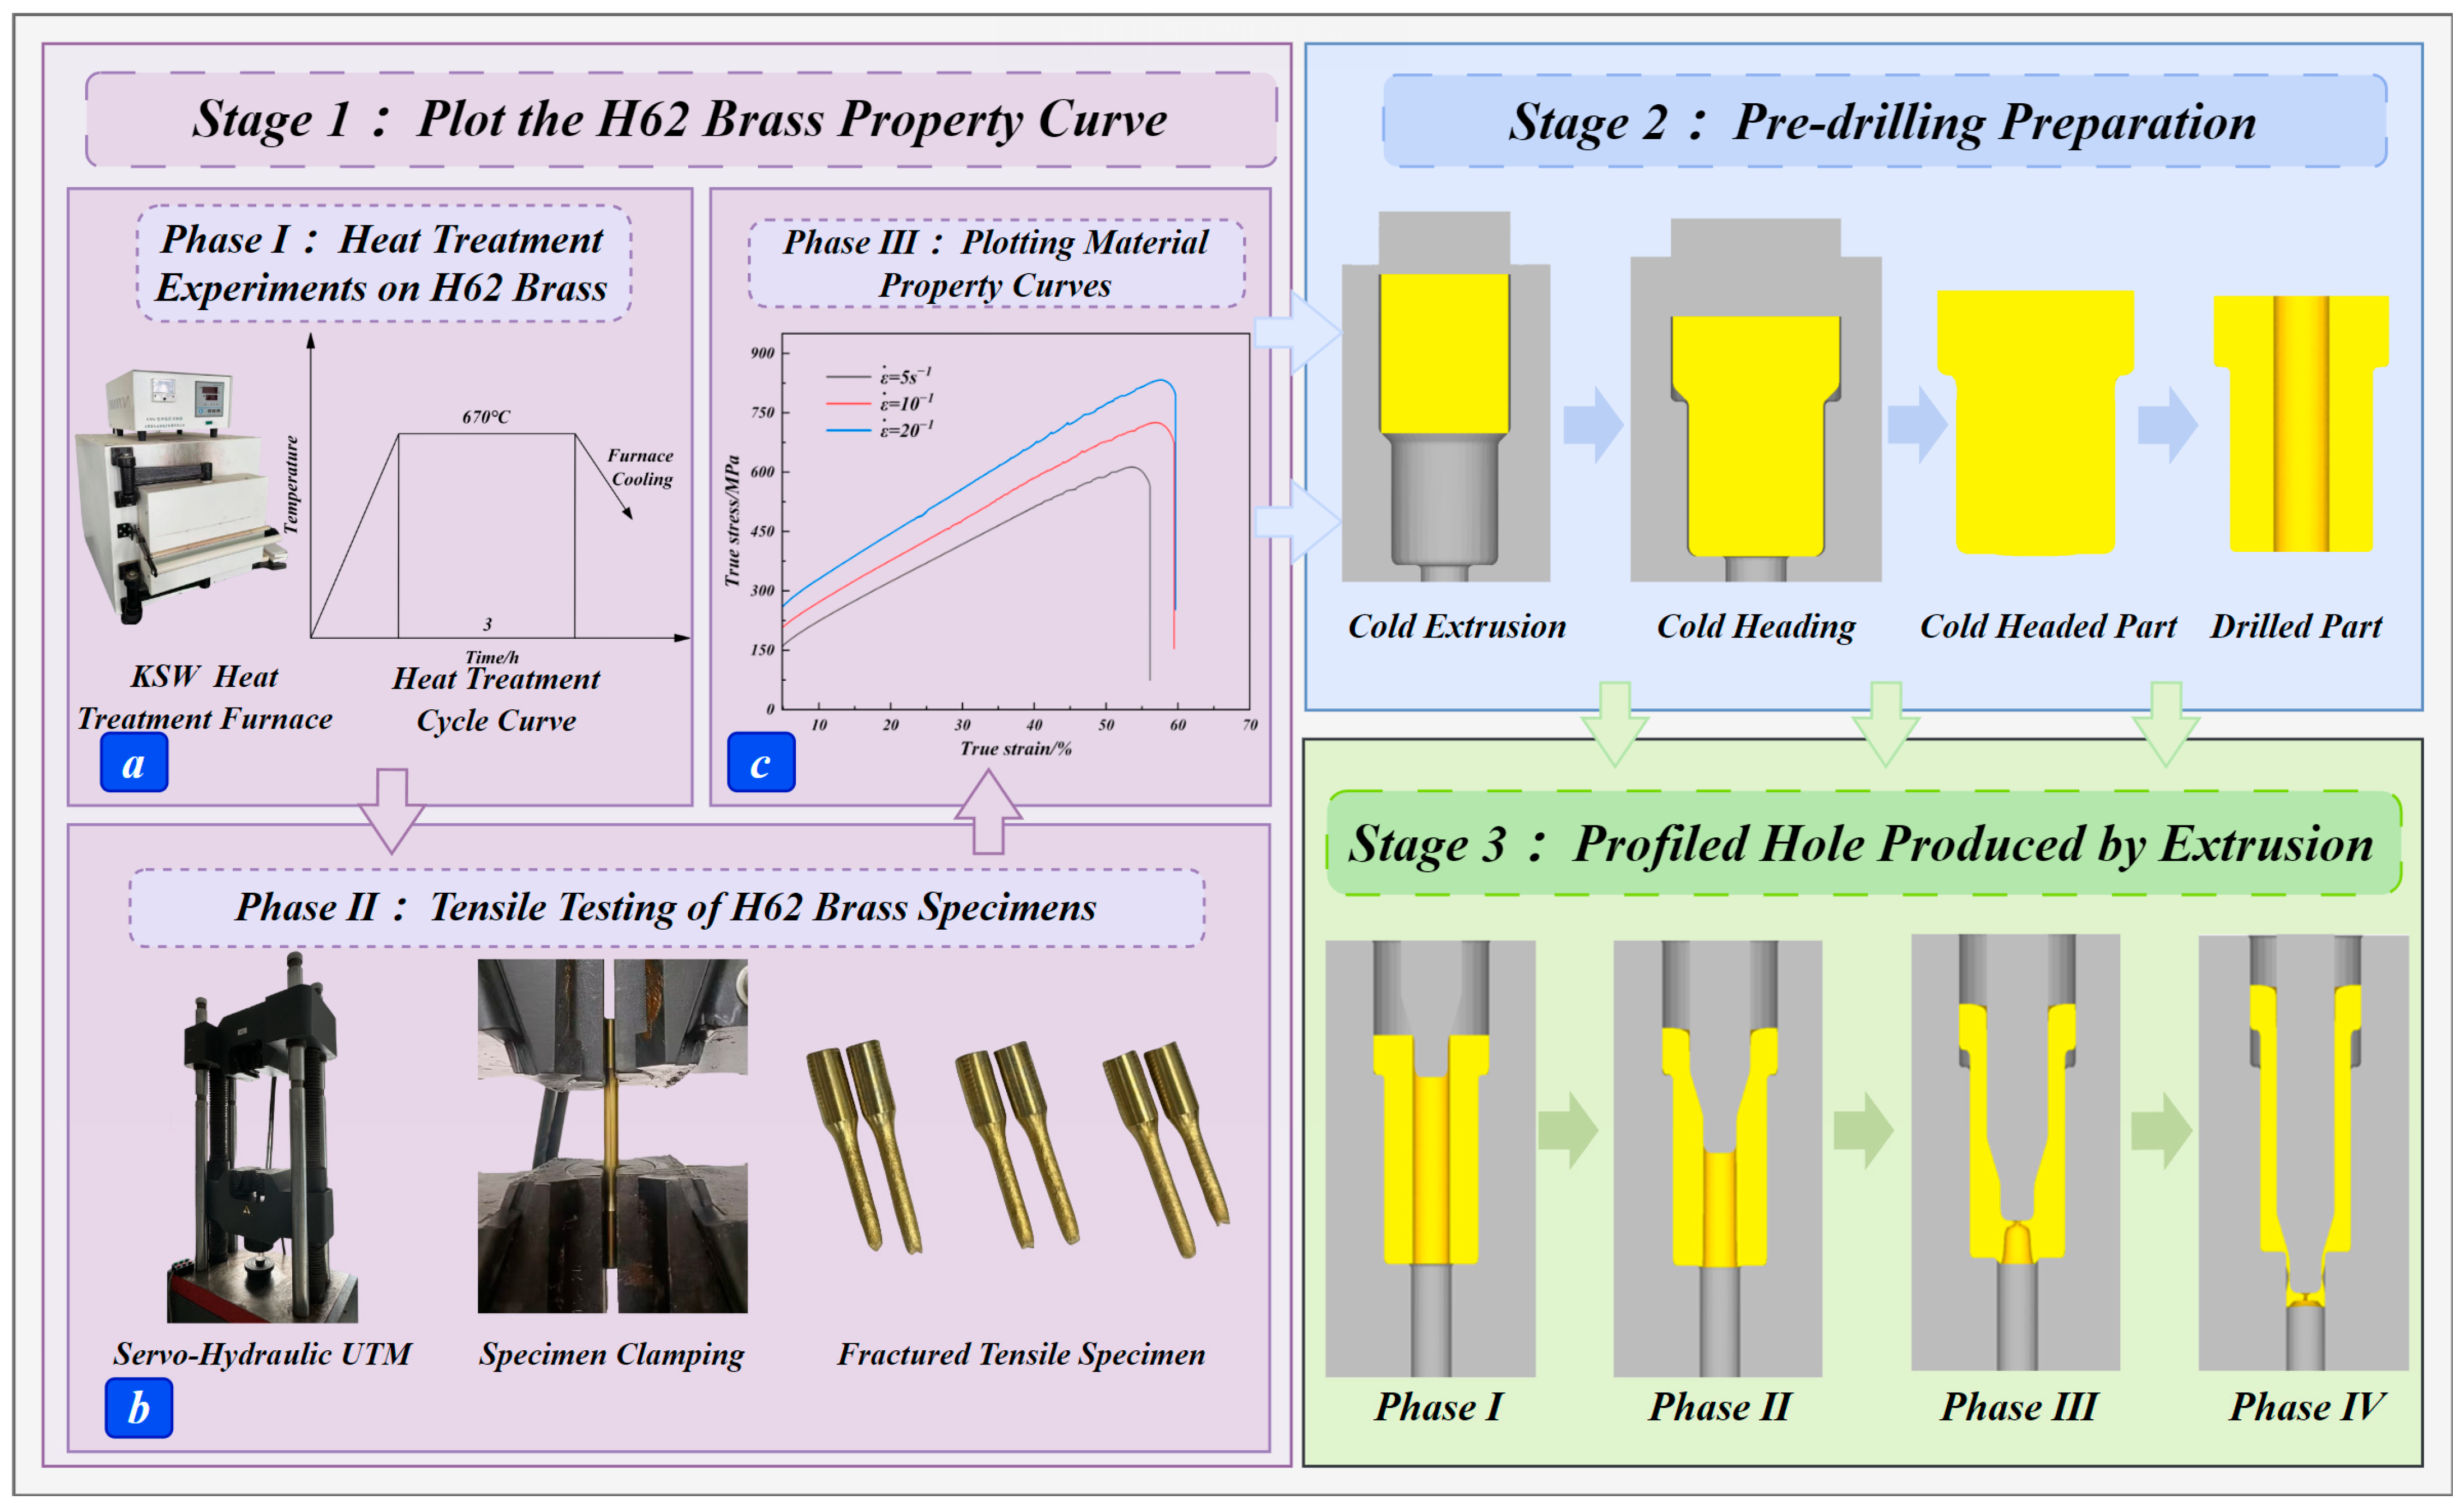
The brush holder of the aviation motor is fabricated from brass H62, a binary alloy consisting of approximately 60.5% to 63.5% copper, with the balance being zinc. The total content of other impurity elements is less than 0.3%. The mechanical properties of the material are provided in Table 1. In this study, a number of bars were machined into standard tensile specimens and subjected to annealing at 670 °C in a KSW box-type resistance furnace. Uniaxial tensile tests were performed using a UTM electronic universal testing machine at crosshead speeds of 5, 10, and 20 mm/min [17]. The obtained engineering stress–strain data were converted into true stress–true strain curves (Figure 3c). A constitutive model was subsequently developed and incorporated into the material library of Deform-3D Ver 11.0 software.

2.3. Simulation Experiment

Simulation experiments of the process, which comprises cold extrusion, cold heading, and drilling (Figure 3, stage 2), were conducted. During the extrusion process of thin-walled special-shaped holes, a cylindrical structure designed to guide metal flow is incorporated at the front end of the slender irregular-section punch to optimize metal flow and suppress folding defects (Figure 3, stage 3).

3. Punch Simulation Analysis

3.1. Finite Element Simulation Model

The Archard wear model and Von Mises yield criterion are widely applied in the quantitative prediction of wear processes and the simulation analysis of material mechanical behaviors, holding significant engineering application value in the design of high-precision components and the assessment of mold lifespan [38,39,40,41,42,43]. Therefore, this paper employs the Archard model to calculate the wear depth of the punch based on Formula (1) and derives the equivalent stress according to the Von Mises criterion based on Formula (2).
W = K p a v b H c d t
where W is the wear depth, K denotes the wear coefficient, p represents the contact pressure, v is the relative velocity, and H stands for the material hardness. The exponents are set to a = 1 , b = 1 , and c = 2 , with K assigned a value of 2 × 10 6 .
σ e q = 1 2 σ 1 σ 2 2 + σ 2 σ 3 2 + σ 3 σ 1 2
where σ e q is the equivalent stress, and σ 1 ,   σ 2 ,   σ 3 are the three principal stresses of the material, respectively.

3.2. Development and Simulation

Three-dimensional models of the punch, blank, and die were created in UG NX 12.0. These models were then exported in STL format and imported into the Deform-3D Ver 11.0 software for simulation. The mold is shown in Figure 4. The brush box of an aviation motor is a thin-walled part with a special-shaped hole. Due to the deep center hole, the punch is designed as a slender rod structure with an irregular cross-section. A punch cone angle is designed to promote metal flow, and a transition filet is designed to reduce stress concentration. The die cavity is designed according to the outer surface contour of the blank, and a through-hole is designed at the bottom for installing the ejector pin.
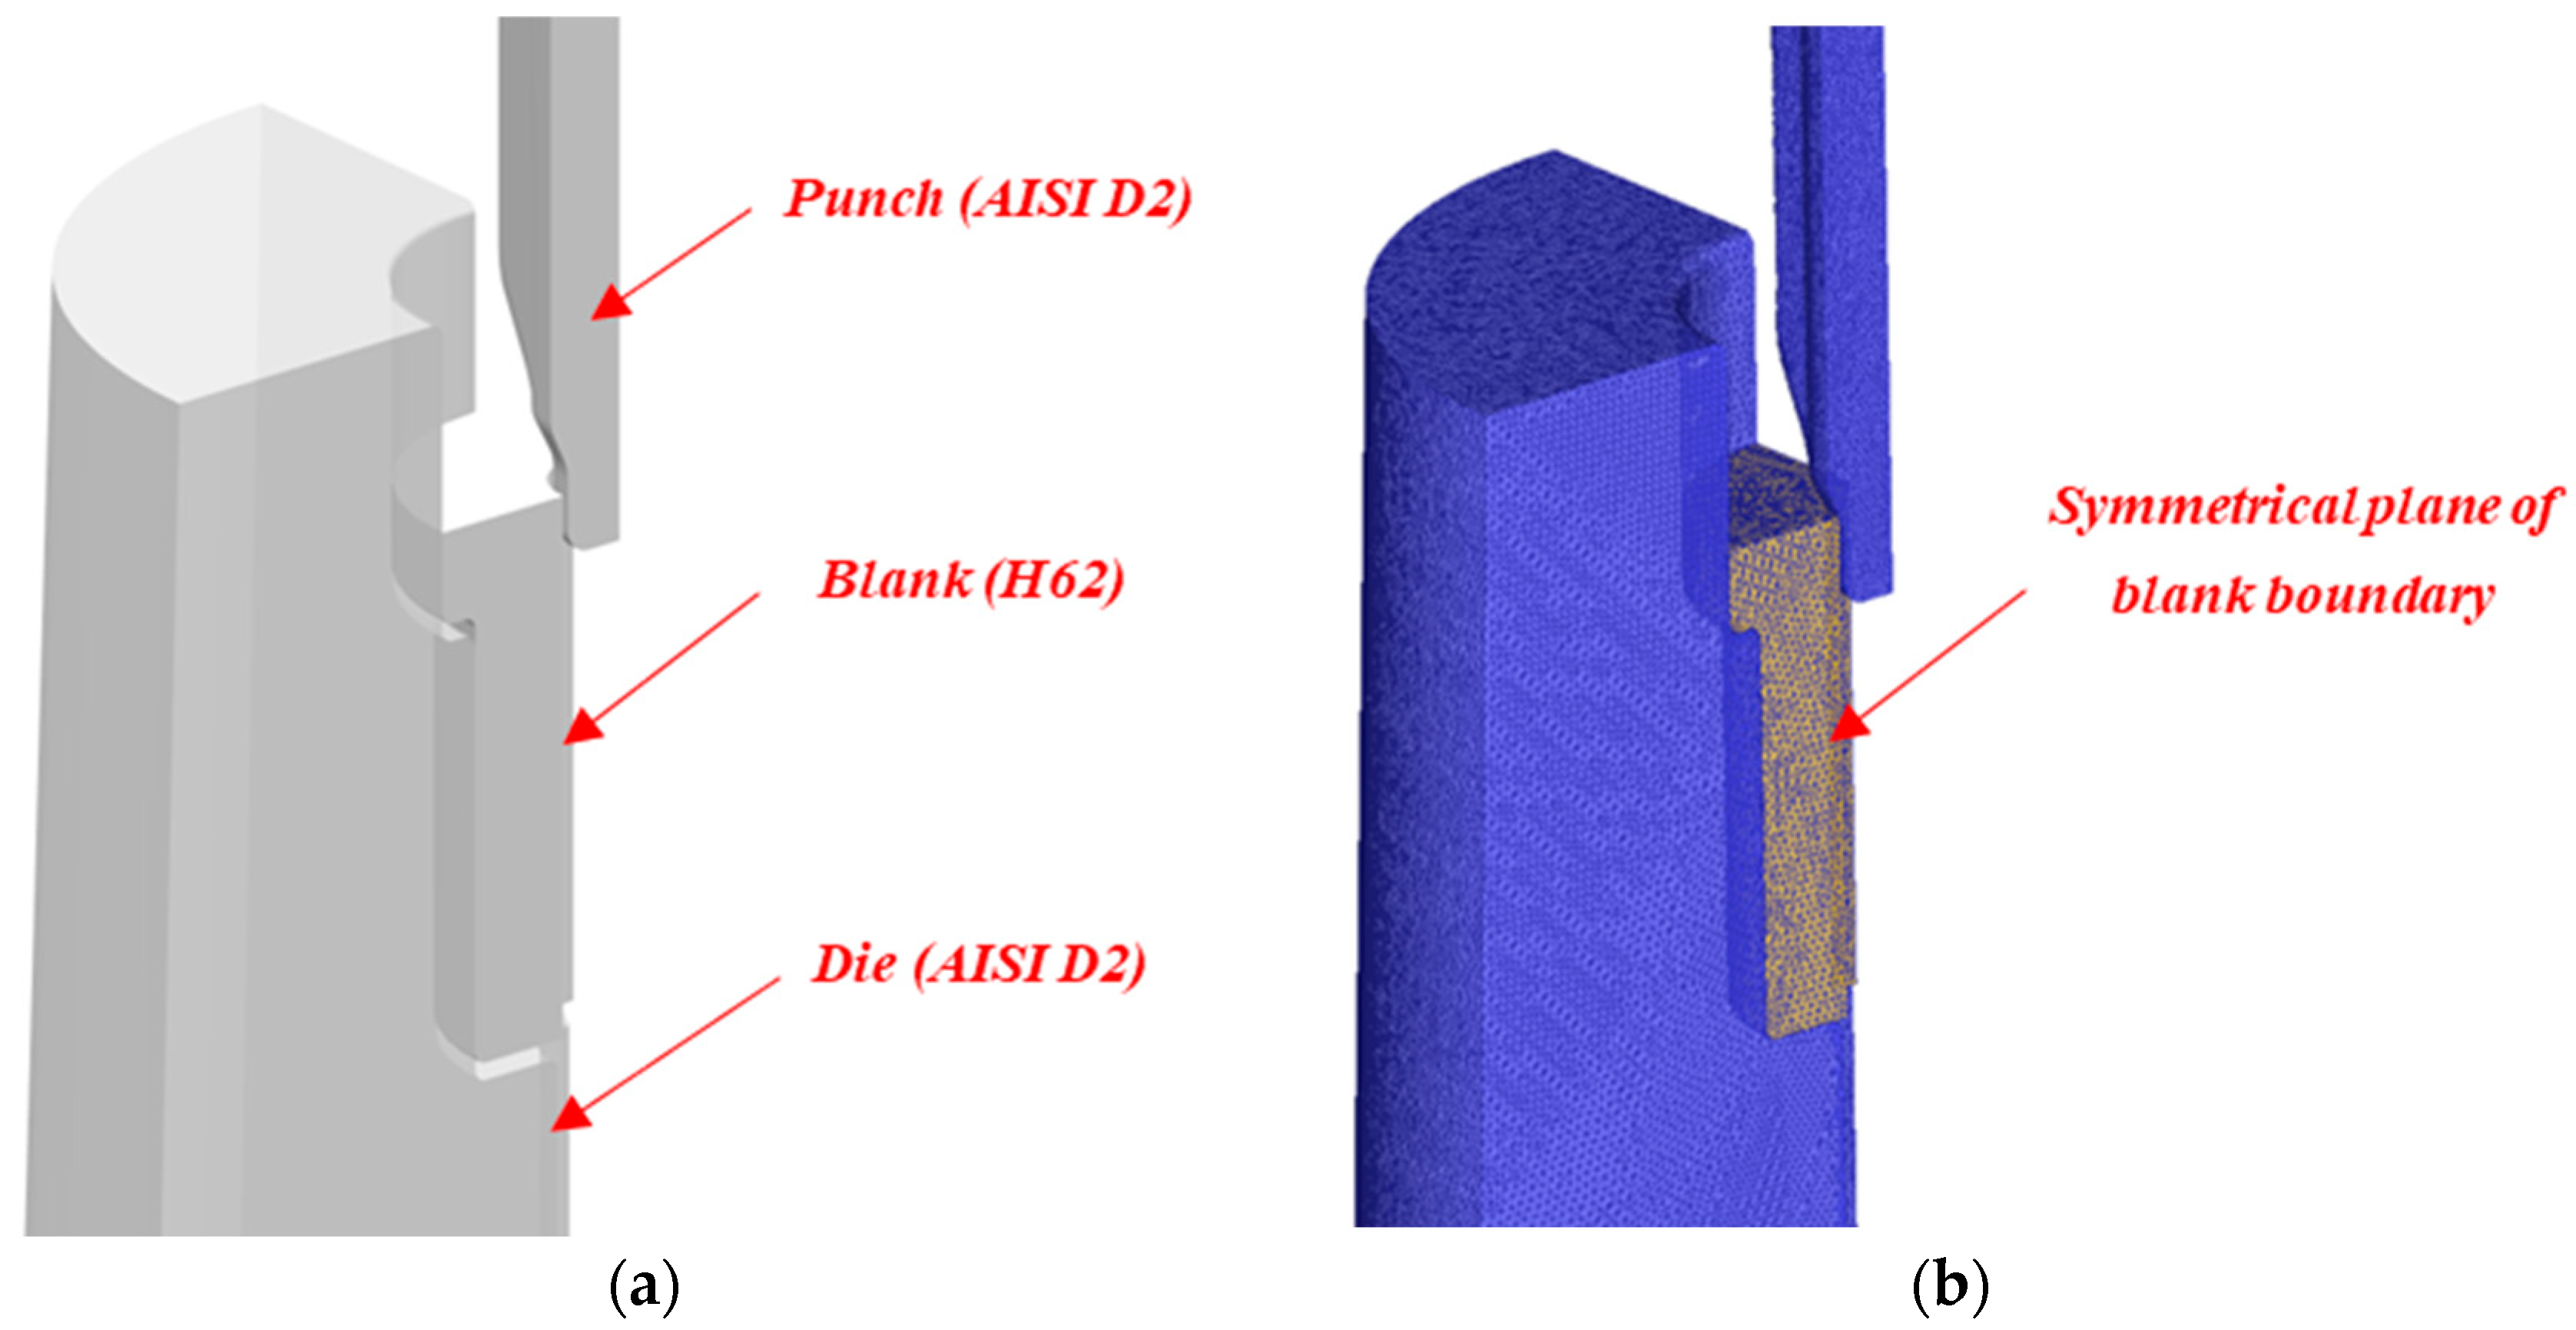
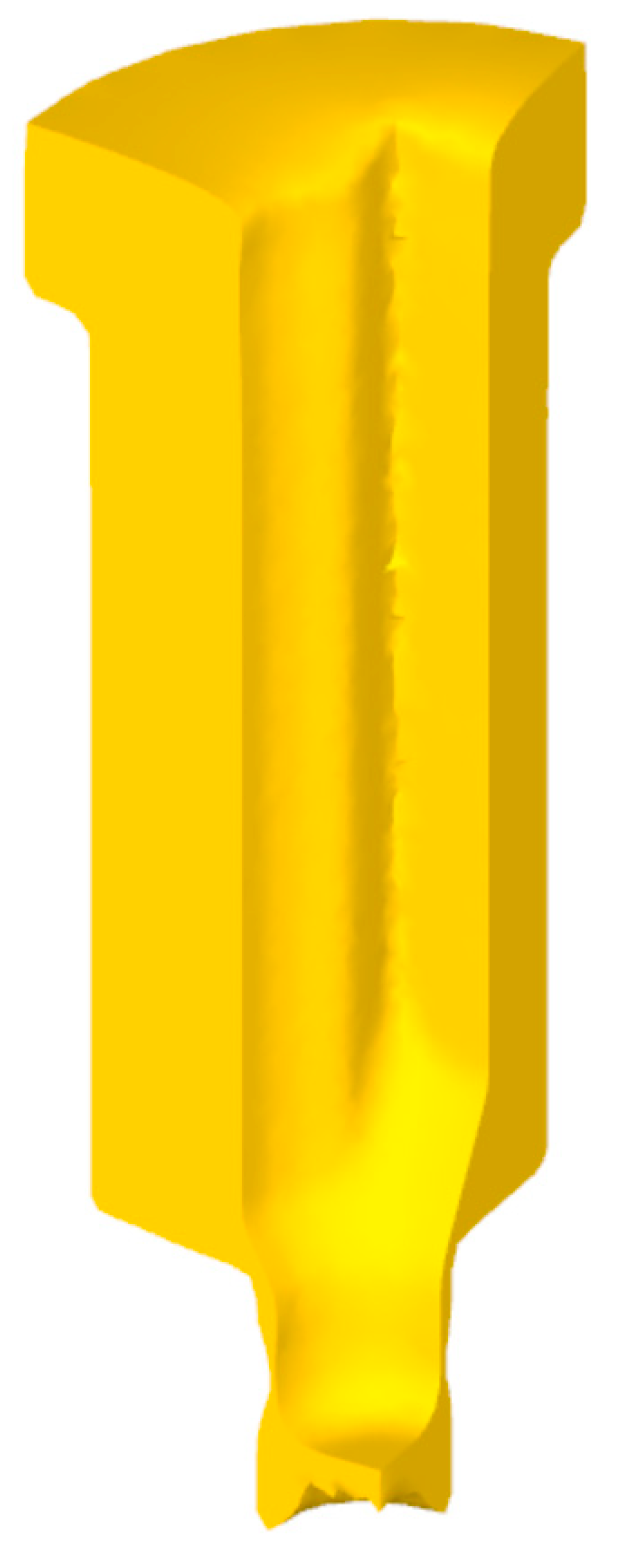
The cold extrusion die for one-step forming of thin-walled special-shaped holes is shown in Figure 5. The cold extrusion die is made of AISI D2 die steel. The punch and die are, respectively, divided into 235,276 and 315,386 grids. The H62 alloy material, used as the blank, is divided into 114,237 grids. The simulation step length is set at 0.0020 s/step. The simulation results obtained using Deform-3D Ver 11.0 software are shown in Figure 6, indicating that the thin-walled special-shaped hole part is free of defects.

3.3. Analysis of Simulation Results

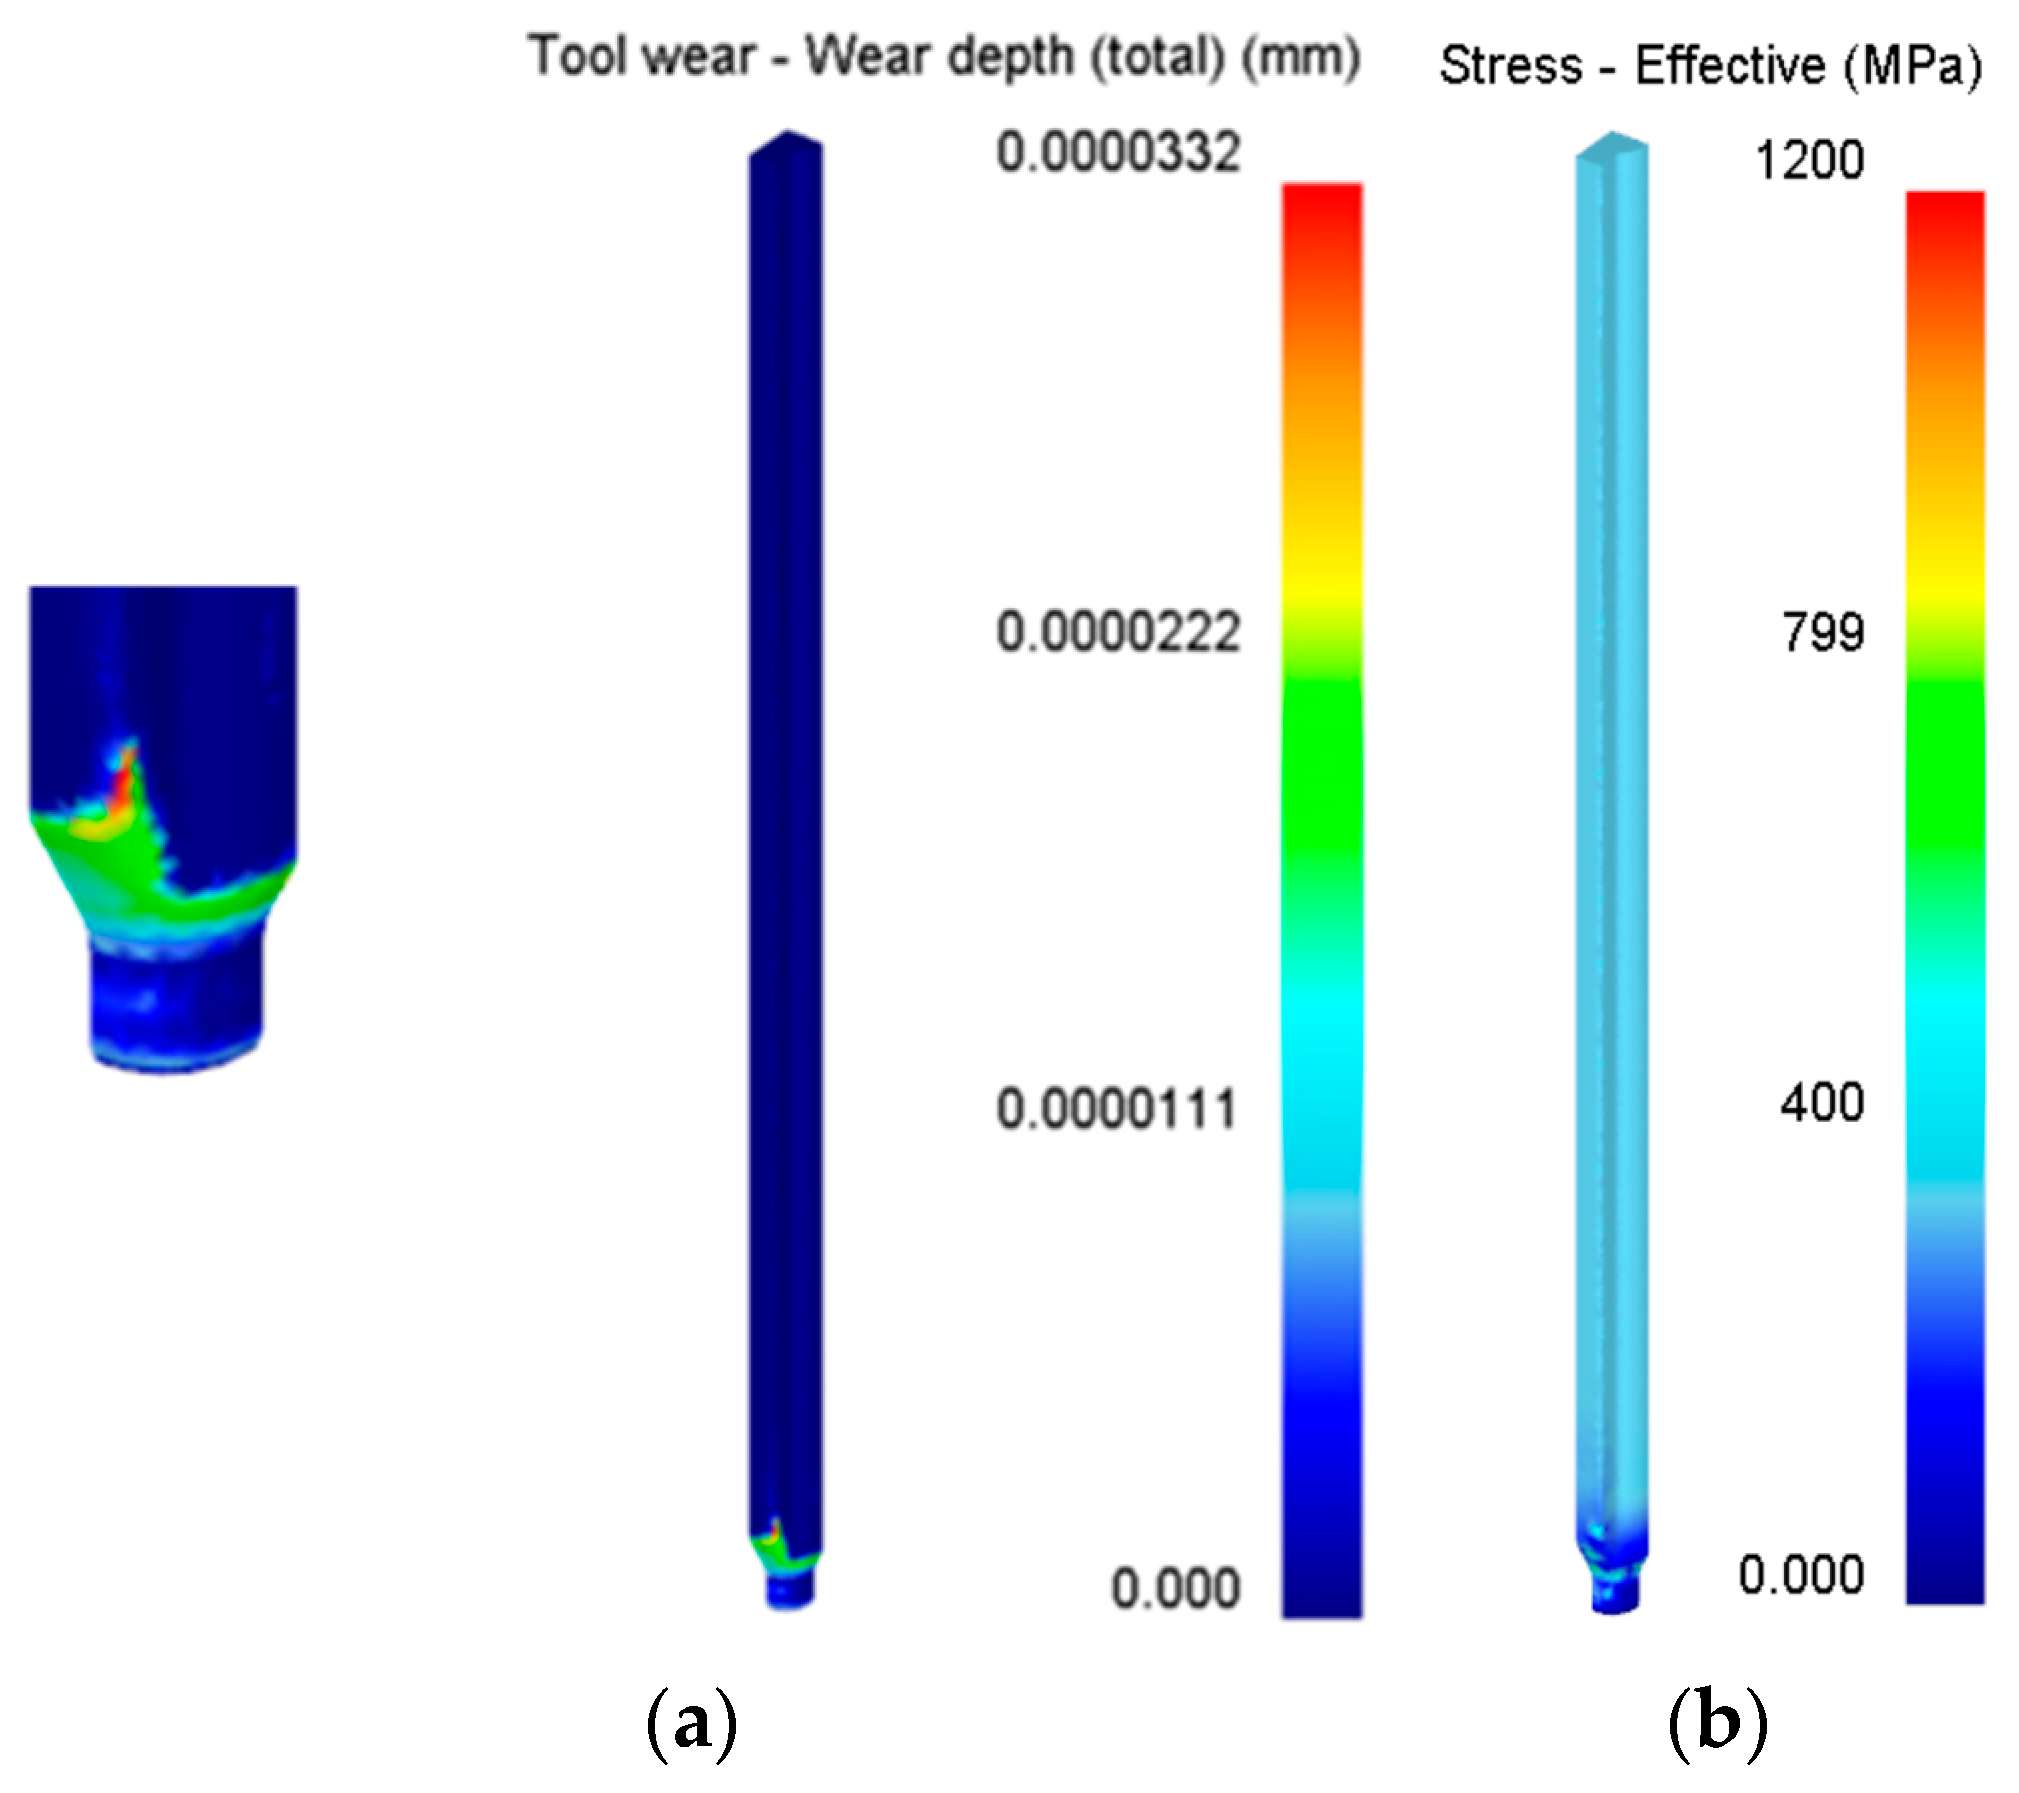
As shown in Figure 7a, the wear of the punch mainly occurs in the conical surface and the transition filet area, with the most severe wear occurring at the transition filet, where the wear depth reaches 3.32 × 10⁻⁵ mm. The allowable value of equivalent stress of cold extrusion dies is usually required to be lower than 2500–3000 MPa. Combined with Figure 7b, it can be seen that the overall stress distribution of the punch is uniform, with the maximum equivalent stress being 1200 MPa, which meets the design requirements for cold extrusion dies.

4. Integrated Application of Taguchi-TOPSIS Method

4.1. Experimental Design Process

To systematically investigate the effects of process parameters on the wear depth and equivalent stress of the punch during its working process, orthogonal experiments were designed using SPSSAU software [44,45,46,47]. Taking five process parameters as input variables, the wear depth and equivalent stress are calculated, respectively, using the Archard wear model and the Von Mises yield criterion, serving as output indicators for evaluating the forming quality of the part and the service life of the punch. The Taguchi method was employed to conduct signal-to-noise ratio analysis on each output response, obtain the optimal level combination of each parameter under single-objective optimization, and perform simulation verification. By integrating TOPSIS to coordinate the multi-objective optimization relationship between wear depth and equivalent stress, the signal-to-noise ratio in the Taguchi method is standardized and normalized, transforming the dual-output objectives into a single indicator—the closeness degree—that comprehensively reflects the degree of proximity to optimality.

4.2. Evaluation Indicators and Orthogonal Experiments

According to the Archard wear theory, the wear depth of the punch mainly depends on factors such as the surface normal pressure, the relative sliding velocity between the punch and the preform, and the hardness of the punch. The normal pressure on the punch is influenced by the coupling of multiple parameters during the extrusion process, including extrusion speed, punch cone angle, punch transition filet, friction coefficient, and punch hardness. Given the aforementioned complex interrelationships, the extrusion speed, punch cone angle, punch transition filet, friction coefficient, and punch hardness are identified as key process parameter variables to systematically investigate the effects of these five process parameters on wear depth and equivalent stress. The orthogonal experiment table is shown in Table 2.

4.3. Taguchi Analysis

In the Taguchi method, the signal-to-noise ratio is a crucial indicator for evaluating the stability and reliability of system responses, achieving the optimization of design objectives by suppressing variation and enhancing robustness. To reduce the risk of punch failure, the wear depth W and equivalent stress P are considered as the-smaller-the-better characteristics, derived from Equation (3).
S / N ( W d , Es ) = 10 × l o g 1 n i = 1 n y i 2
where S/N(Wd,Es) represents the signal-to-noise ratio of wear depth and equivalent stress, n is the total number of experiments, and in this study, n = 25. yi is the output response value corresponding to the i-th group of experiments, where i = 1, 2, 3, …, n.
To enhance the rigor and reliability of the experimental design, the Taguchi method was implemented using SPSSAU software based on predetermined factor levels, which yielded 25 orthogonal experimental runs. Finite element simulations for each run were then conducted using Deform-3D Ver 11.0 software. The specific data are presented in Table 3.

4.4. Range Analysis

The extrusion speed, punch cone angle, punch transition filet, friction coefficient, and punch hardness were defined as factors A, B, C, D, and E, respectively, with wear depth and equivalent stress serving as the response indicators. Analysis of the signal-to-noise (S/N) ratio from the Taguchi method revealed that both response indicators were suboptimal (see Table 4). With wear depth as the optimization goal, the significance of each process parameter’s influence is punch hardness > punch transition rounded angle > friction coefficient > punch cone angle > extrusion speed. Based on the magnitude sorting of the signal-to-noise ratio extreme difference R, the optimal process parameters under this target are A1B5C1D3E5 (extrusion speed of 12 mm·s−1, punch cone angle of 70°, punch transition filet of 1.2 mm, friction coefficient of 0.12, and punch hardness of 55 HRC). With equivalent stress as the optimization goal, the significance order of each parameter is taper angle > dial transition filet > friction coefficient > dial hardness > extrusion speed. Based on the extreme difference analysis results, it was determined that the optimal process parameter combination under this target was A1B1C4D3E5 (extrusion speed of 12 mm·s−1, punch cone angle of 50°, punch transition filet of 1.8 mm, friction coefficient of 0.12, and punch hardness of 55 HRC).
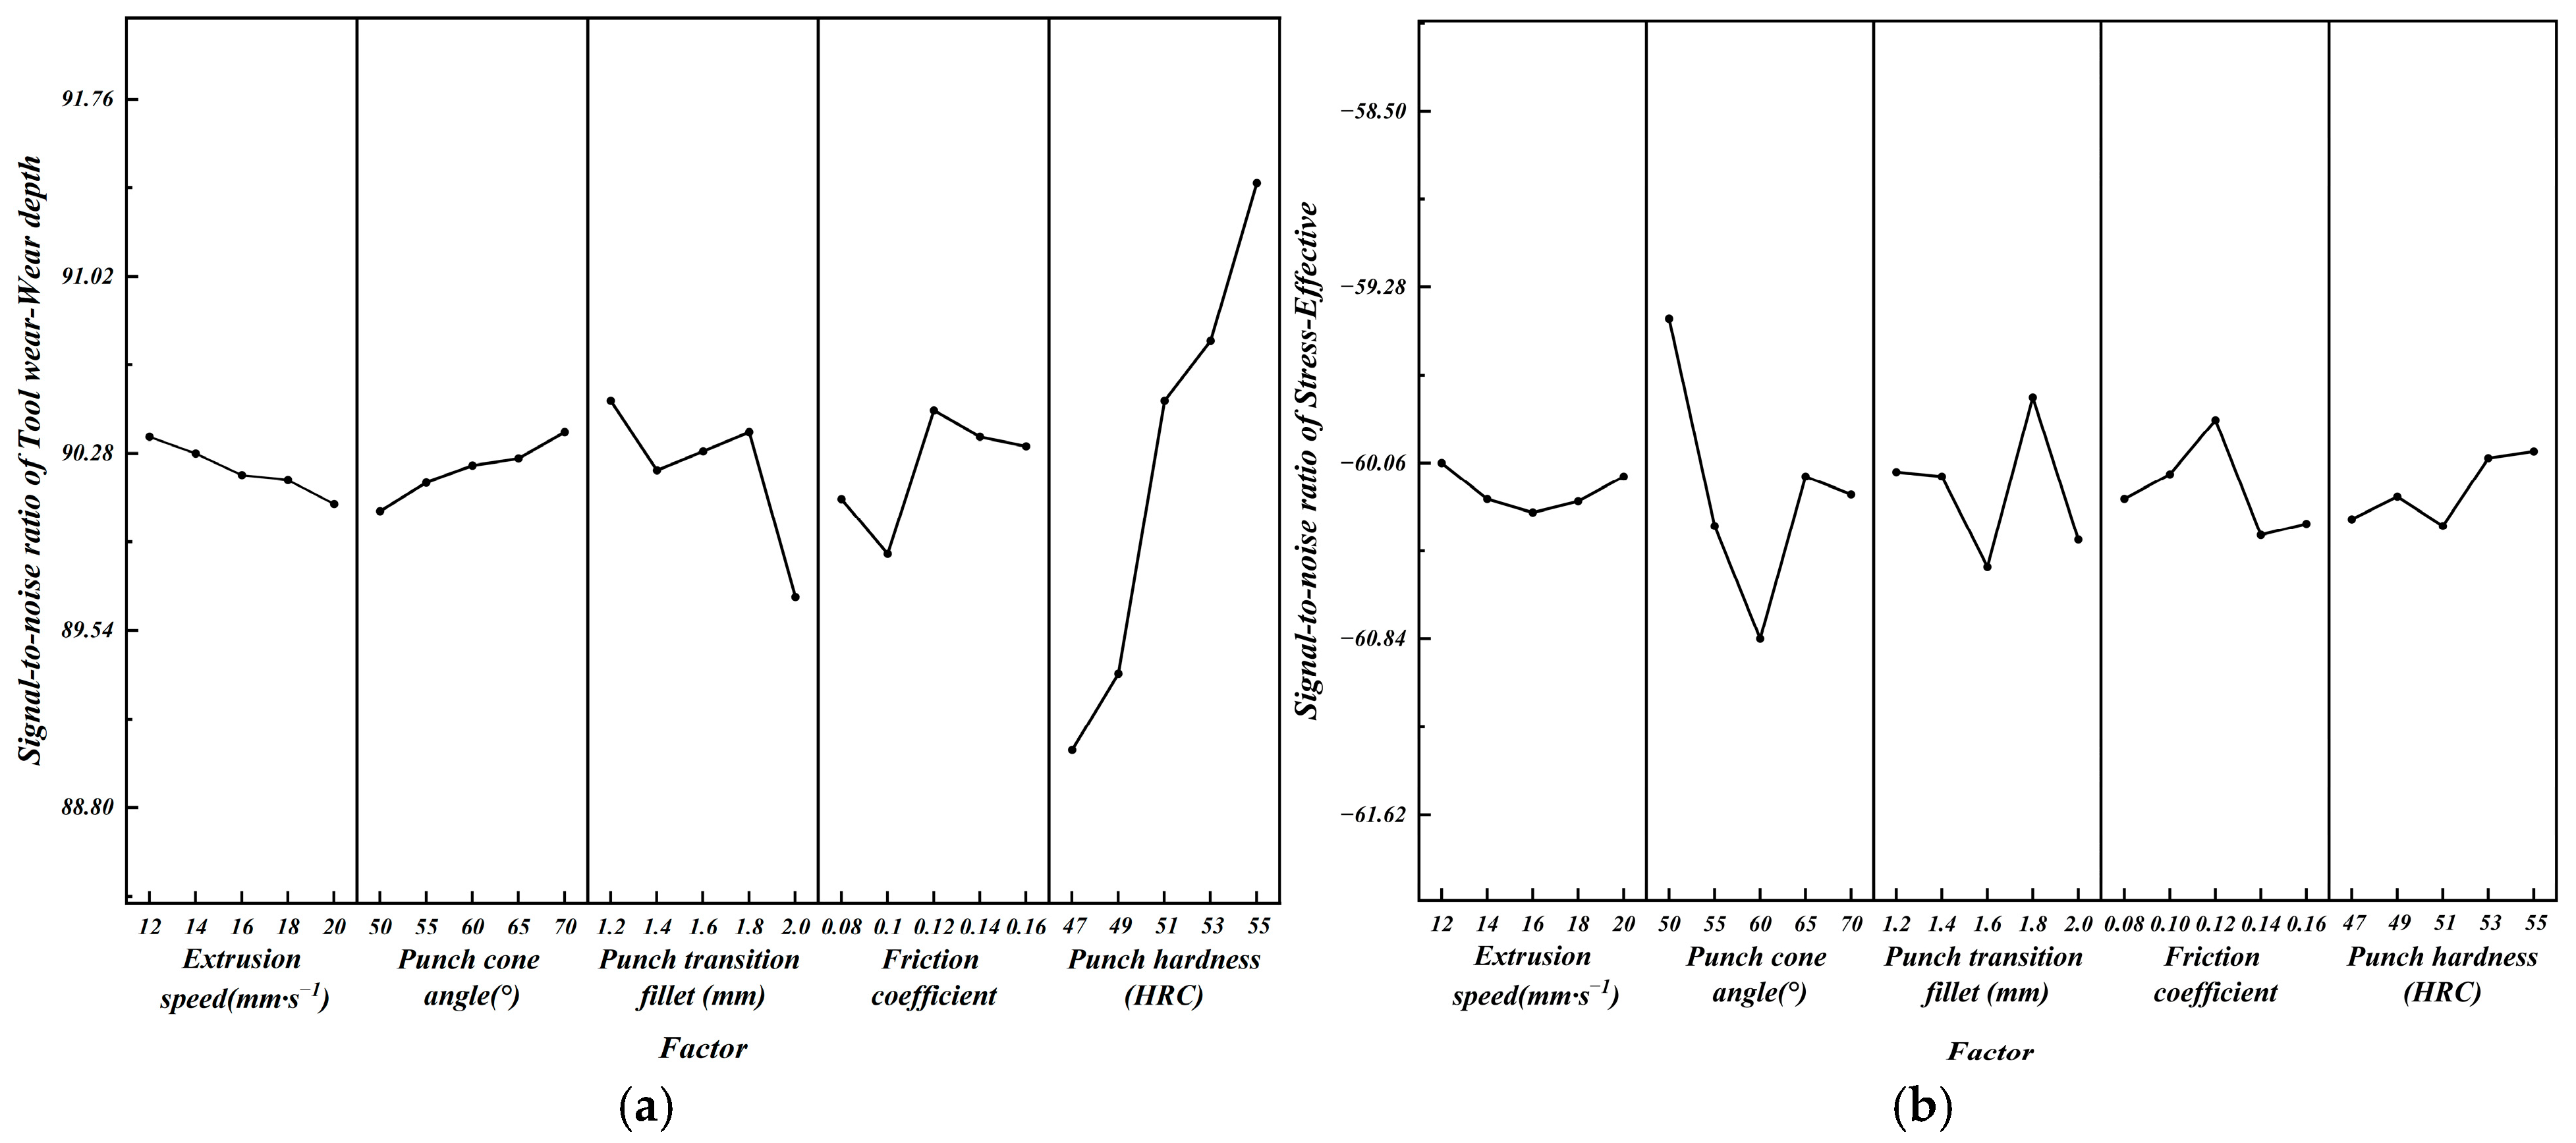
Figure 8 shows the main effect curves of the signal-to-noise ratio for wear depth and equivalent stress. The main effects plot of wear depth shown in Figure 8a indicates that as the extrusion speed increases from A1 to A5, the signal-to-noise ratio exhibits a continuous declining trend, suggesting a positive correlation between extrusion speed and wear depth. The punch cone angle reaches its highest point in terms of B5 signal-to-noise ratio among the five levels, with the smallest wear depth. As the punch cone angle increases, the overall signal-to-noise ratio gradually rises, and the wear depth gradually decreases, indicating a negative correlation between the punch cone angle and the wear depth. The transition filet of the punch achieves the maximum signal-to-noise ratio (SNR) at C1, with the minimum wear depth. From C2 to C4, as the transition filet increases, the SNR shows an upward trend. Within this parameter range, increasing the filet radius helps reduce wear depth and extend the service life of the punch. However, further increasing the filet radius leads to a decline in SNR and an exacerbation of wear depth. The friction coefficient shows inflection points at both D2 and D3, with the signal-to-noise ratio reaching its maximum value and the wear depth being the smallest at D3. As the hardness of the punch increases, the signal-to-noise ratio maintains an overall continuous upward trend, indicating that increasing hardness helps enhance its wear resistance and reduce wear depth. In-depth analysis based on the Archard wear model reveals that as the extrusion speed increases, the signal-to-noise ratio continuously decreases, and the wear depth correspondingly increases. This trend aligns with the direct positive correlation between relative velocity (v) and wear depth (W) in the Archard model. Changes in the punch cone angle induce alterations in the vertical contact pressure (p). An increase in the cone angle leads to a reduction in the vertical component force, thereby decreasing the contact pressure (p) and reducing the wear depth. The influence of the punch cone angle on wear behavior is consistent with the predictions of the Archard model. As the hardness of the punch increases, the wear depth gradually decreases, confirming the direct negative correlation between mold hardness (H) and wear depth (W) as described in the Archard model.
In conclusion, according to the theoretical framework of the Archard model, there is a direct correlation between the extrusion speed, punch cone angle, punch hardness, and the wear depth (W). The influence of the punch transition filet and the friction coefficient on the wear depth exhibits an indirect correlation.
The main effect plot of the equivalent stress signal-to-noise ratio shown in Figure 8b indicates that the equivalent stress signal-to-noise ratio at the intermediate extrusion speed exhibits a distinct inflection point at A3, with the overall trend approximating a quadratic function. A3 represents the minimum value with the highest equivalent stress, while A1 has the highest signal-to-noise ratio and the lowest equivalent stress. For the punch cone angle, B1 demonstrates the highest signal-to-noise ratio, indicating the best stress condition, whereas B3 has the lowest signal-to-noise ratio and the highest equivalent stress. As the punch transition filet increases from C3 to C4, the signal-to-noise ratio gradually rises, which is beneficial for extending service life. However, in the ranges of C1 to C3 and C4 to C5, an increase in the transition filet leads to a decline in the signal-to-noise ratio, adversely affecting service life. The friction coefficient D3 achieves the optimal value, resulting in the minimum equivalent stress on the punch. As the punch hardness increases, the overall signal-to-noise ratio exhibits an upward trend, with E5 having the highest signal-to-noise ratio and the lowest equivalent stress, showing a similar trend to the change in wear depth.
In conclusion, when taking the wear depth as the optimization objective, the optimal combination of process parameters is A1B5C1D3E5 (extrusion speed of 12 mm·s−1, punch cone angle of 70°, punch transition filet of 1.2 mm, friction coefficient of 0.12, and punch hardness of 55 HRC). When taking the equivalent stress as the optimization objective, the optimal combination is A1B1C4D3E5 (extrusion speed of 12 mm·s−1, punch cone angle of 50°, punch transition filet of 1.8 mm, friction coefficient of 0.12, and punch hardness of 55 HRC).

4.5. Simulation Analysis

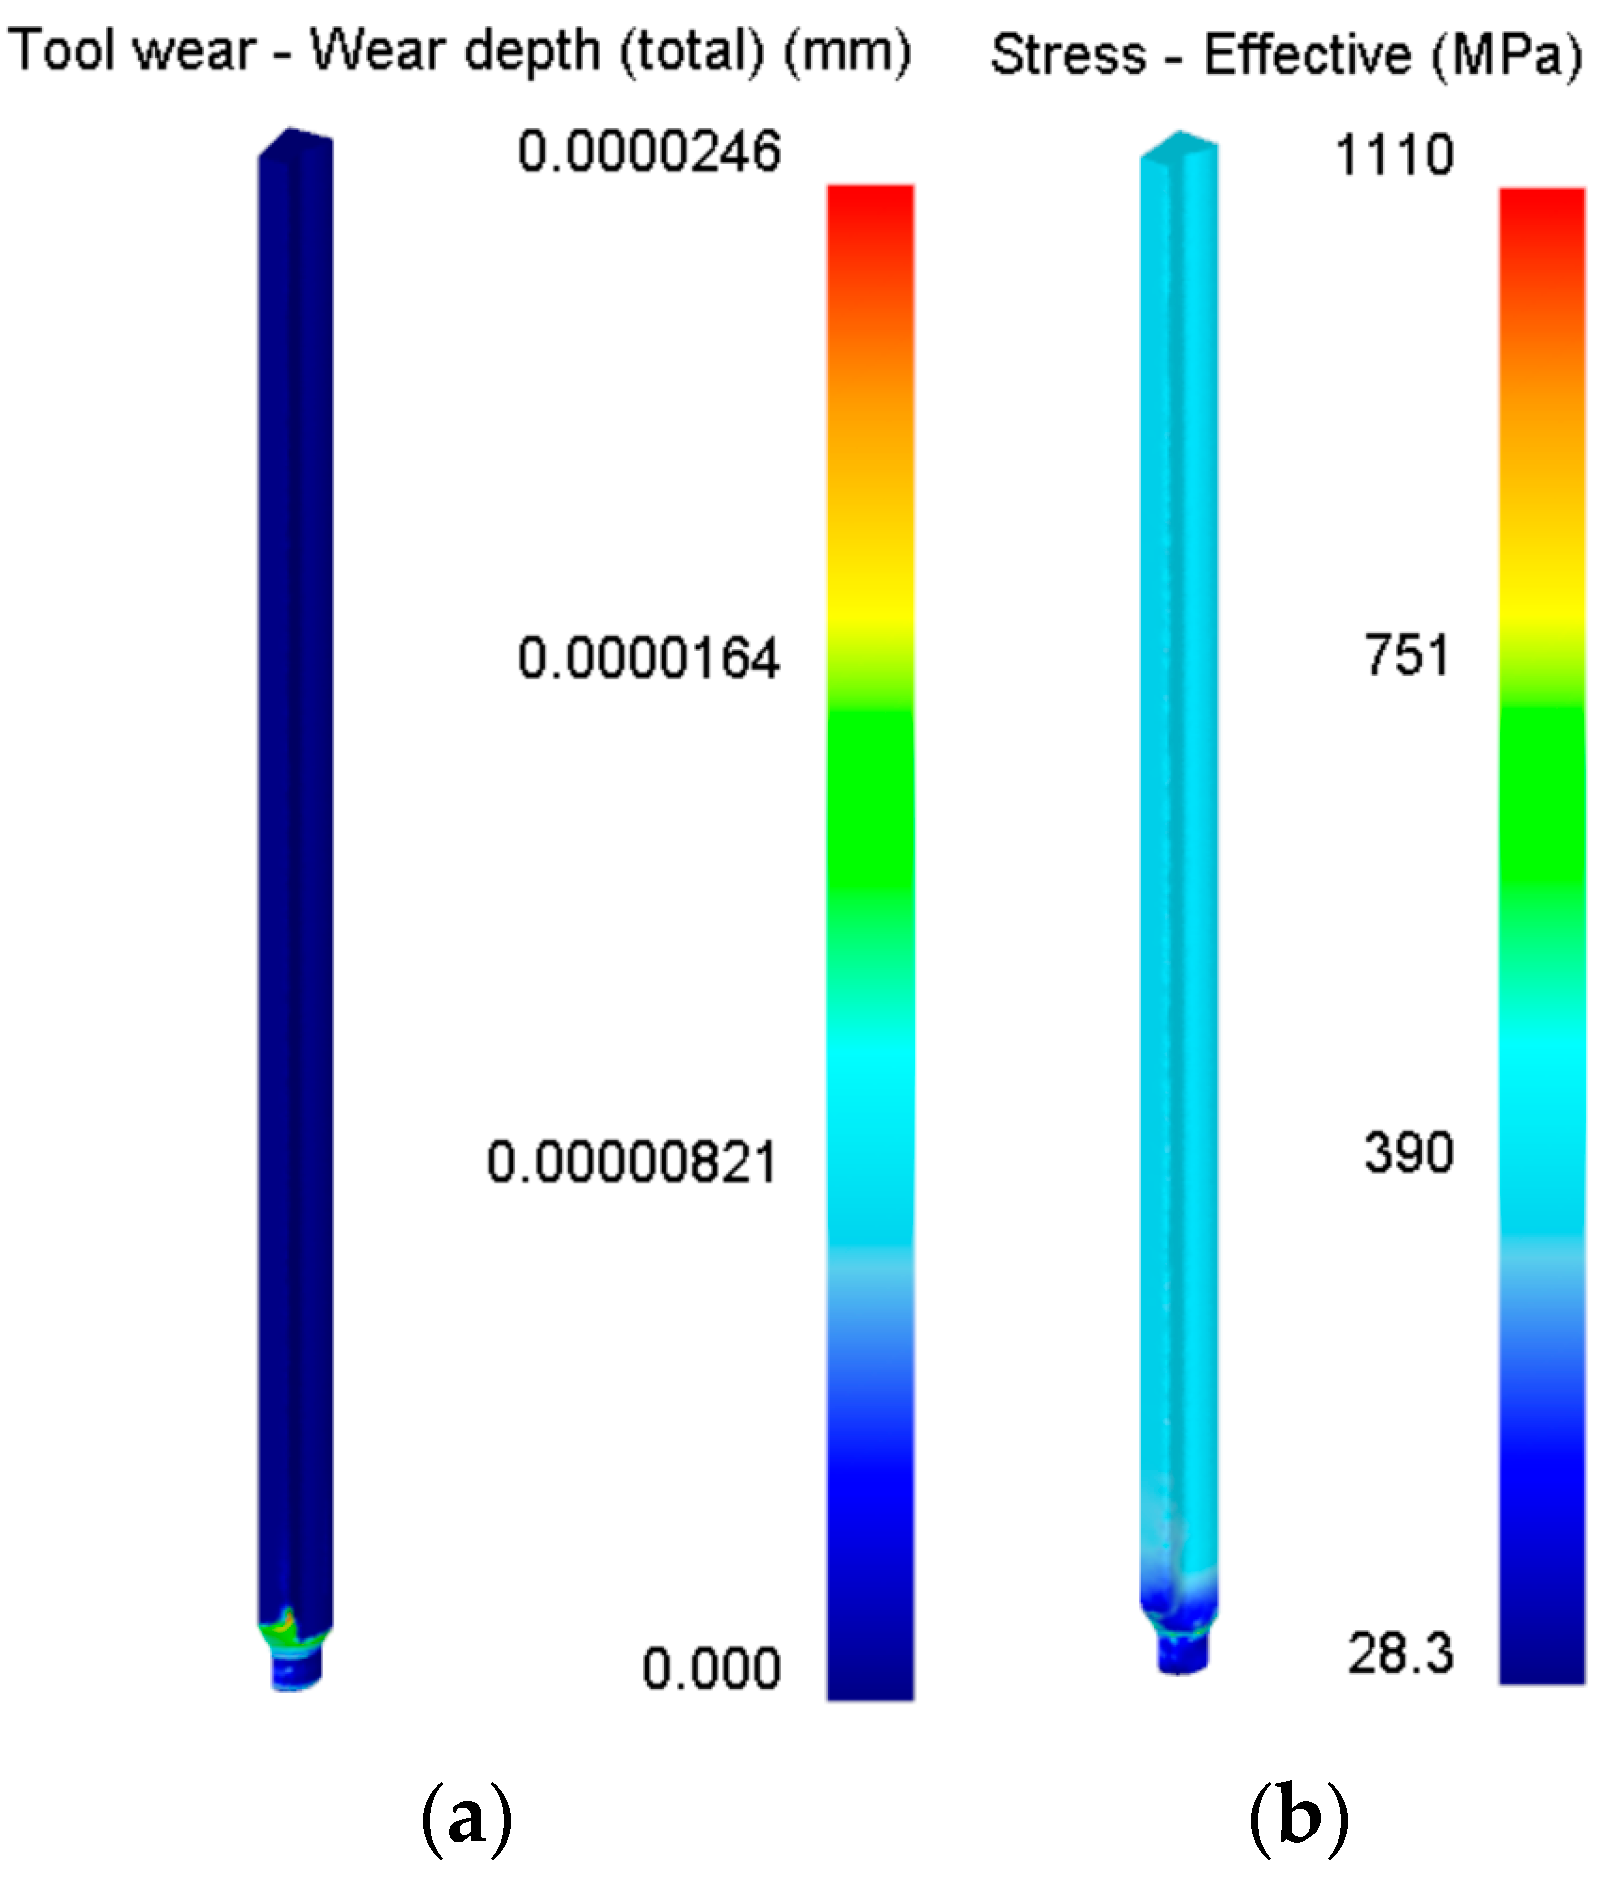
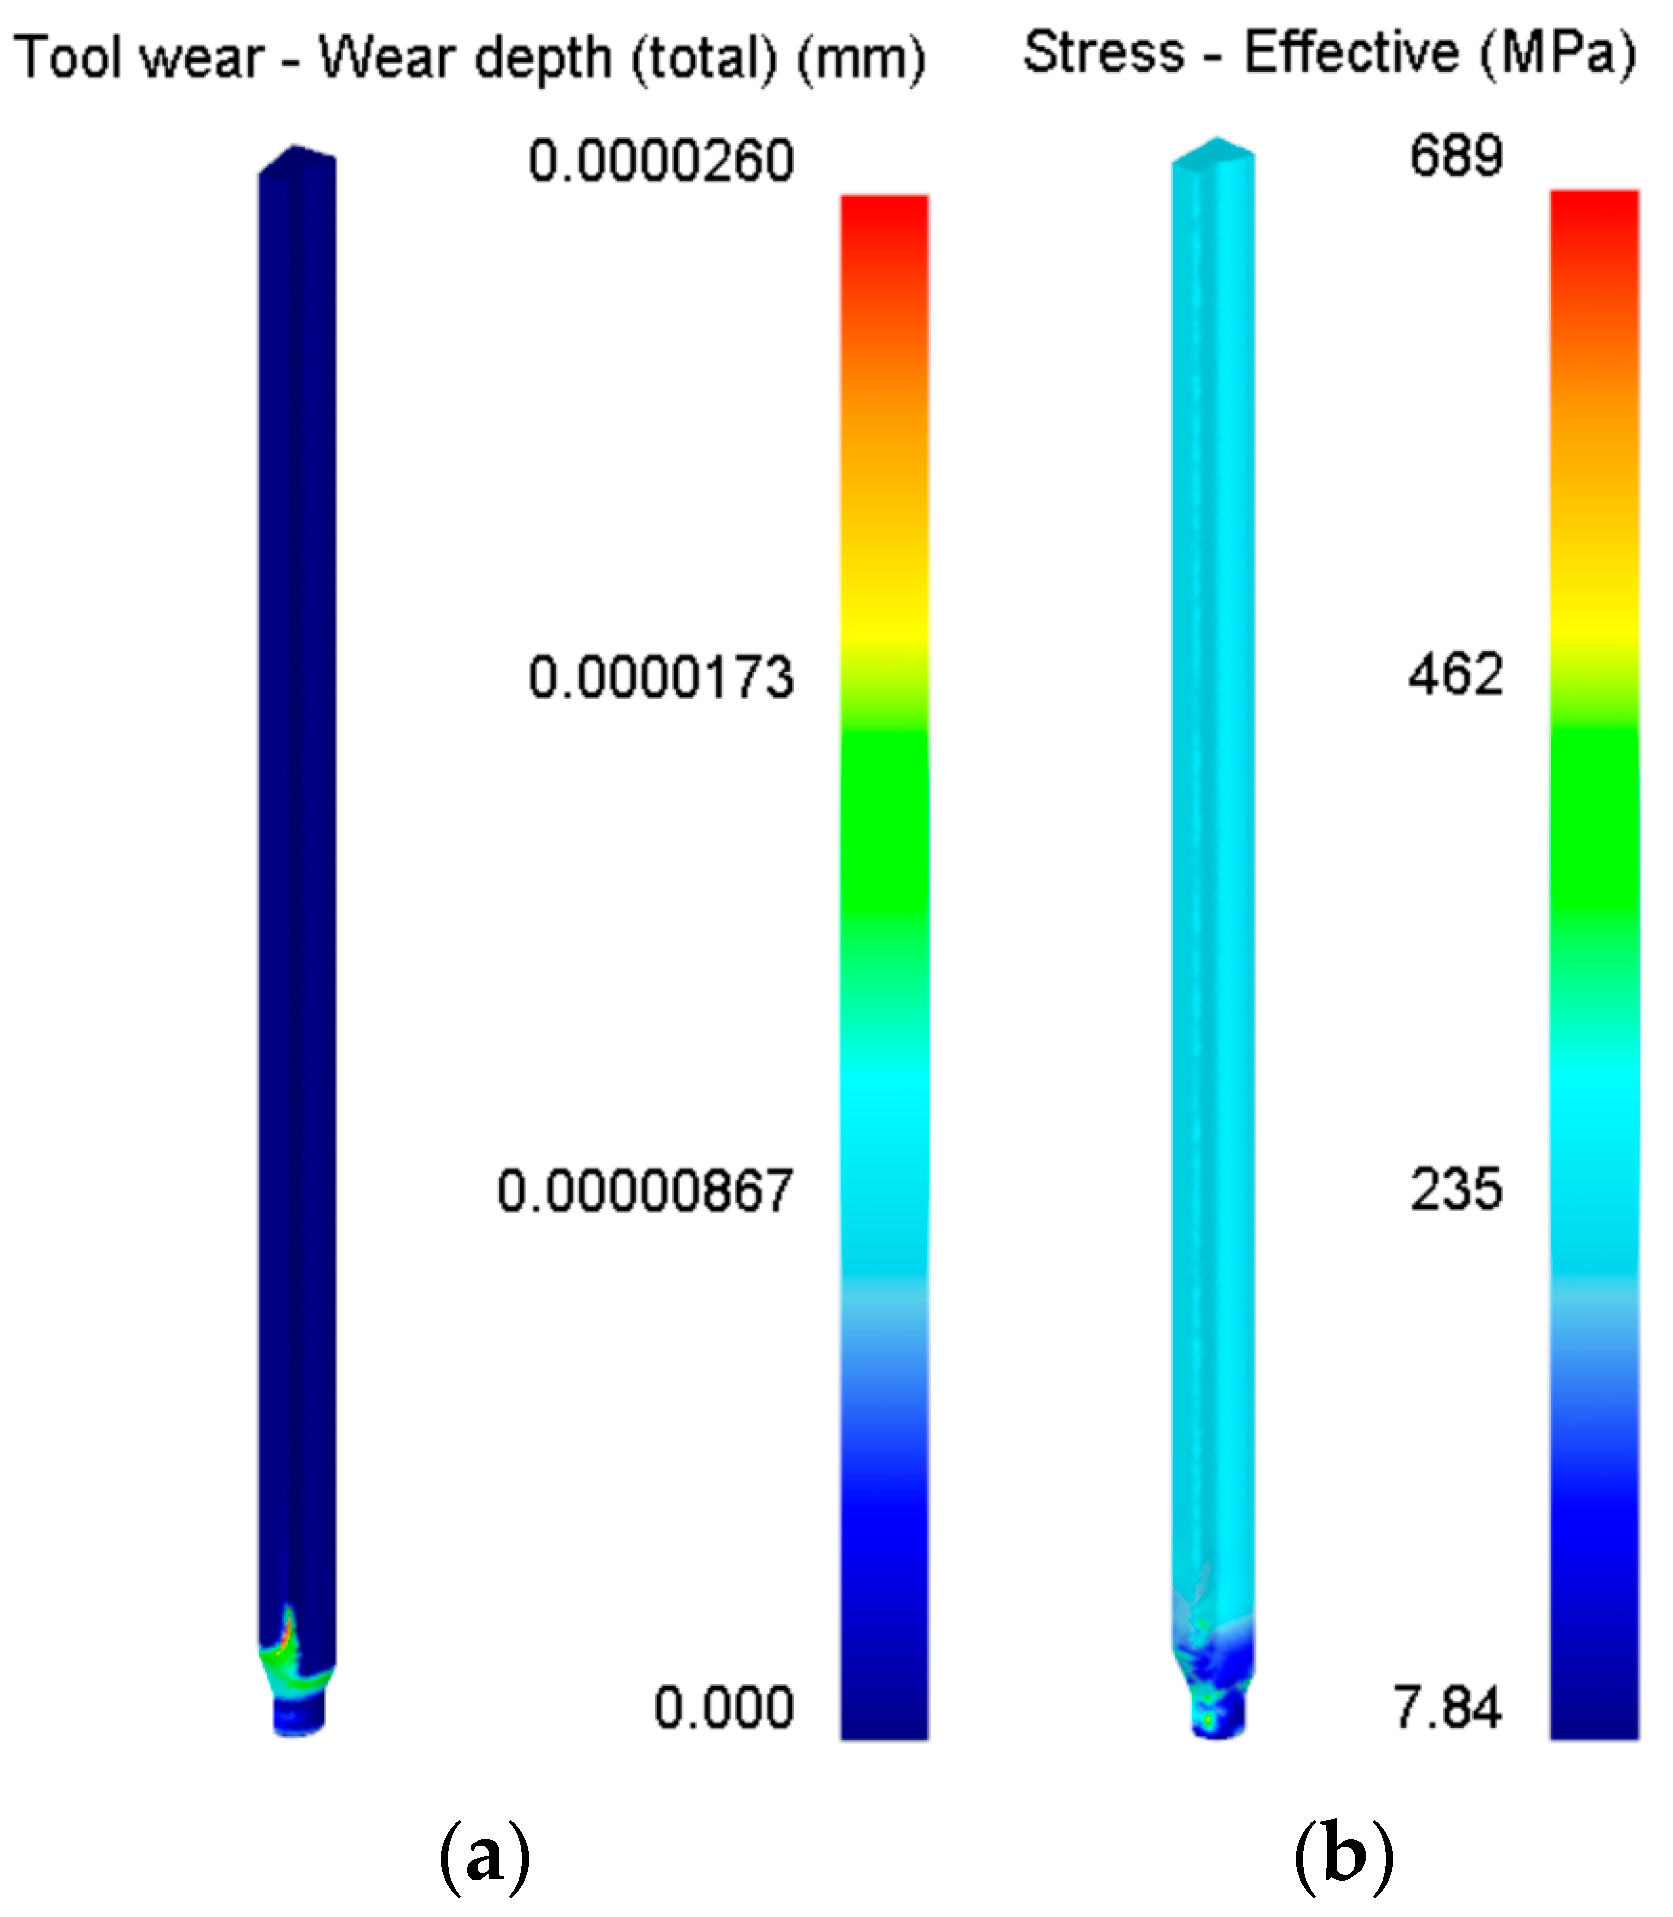
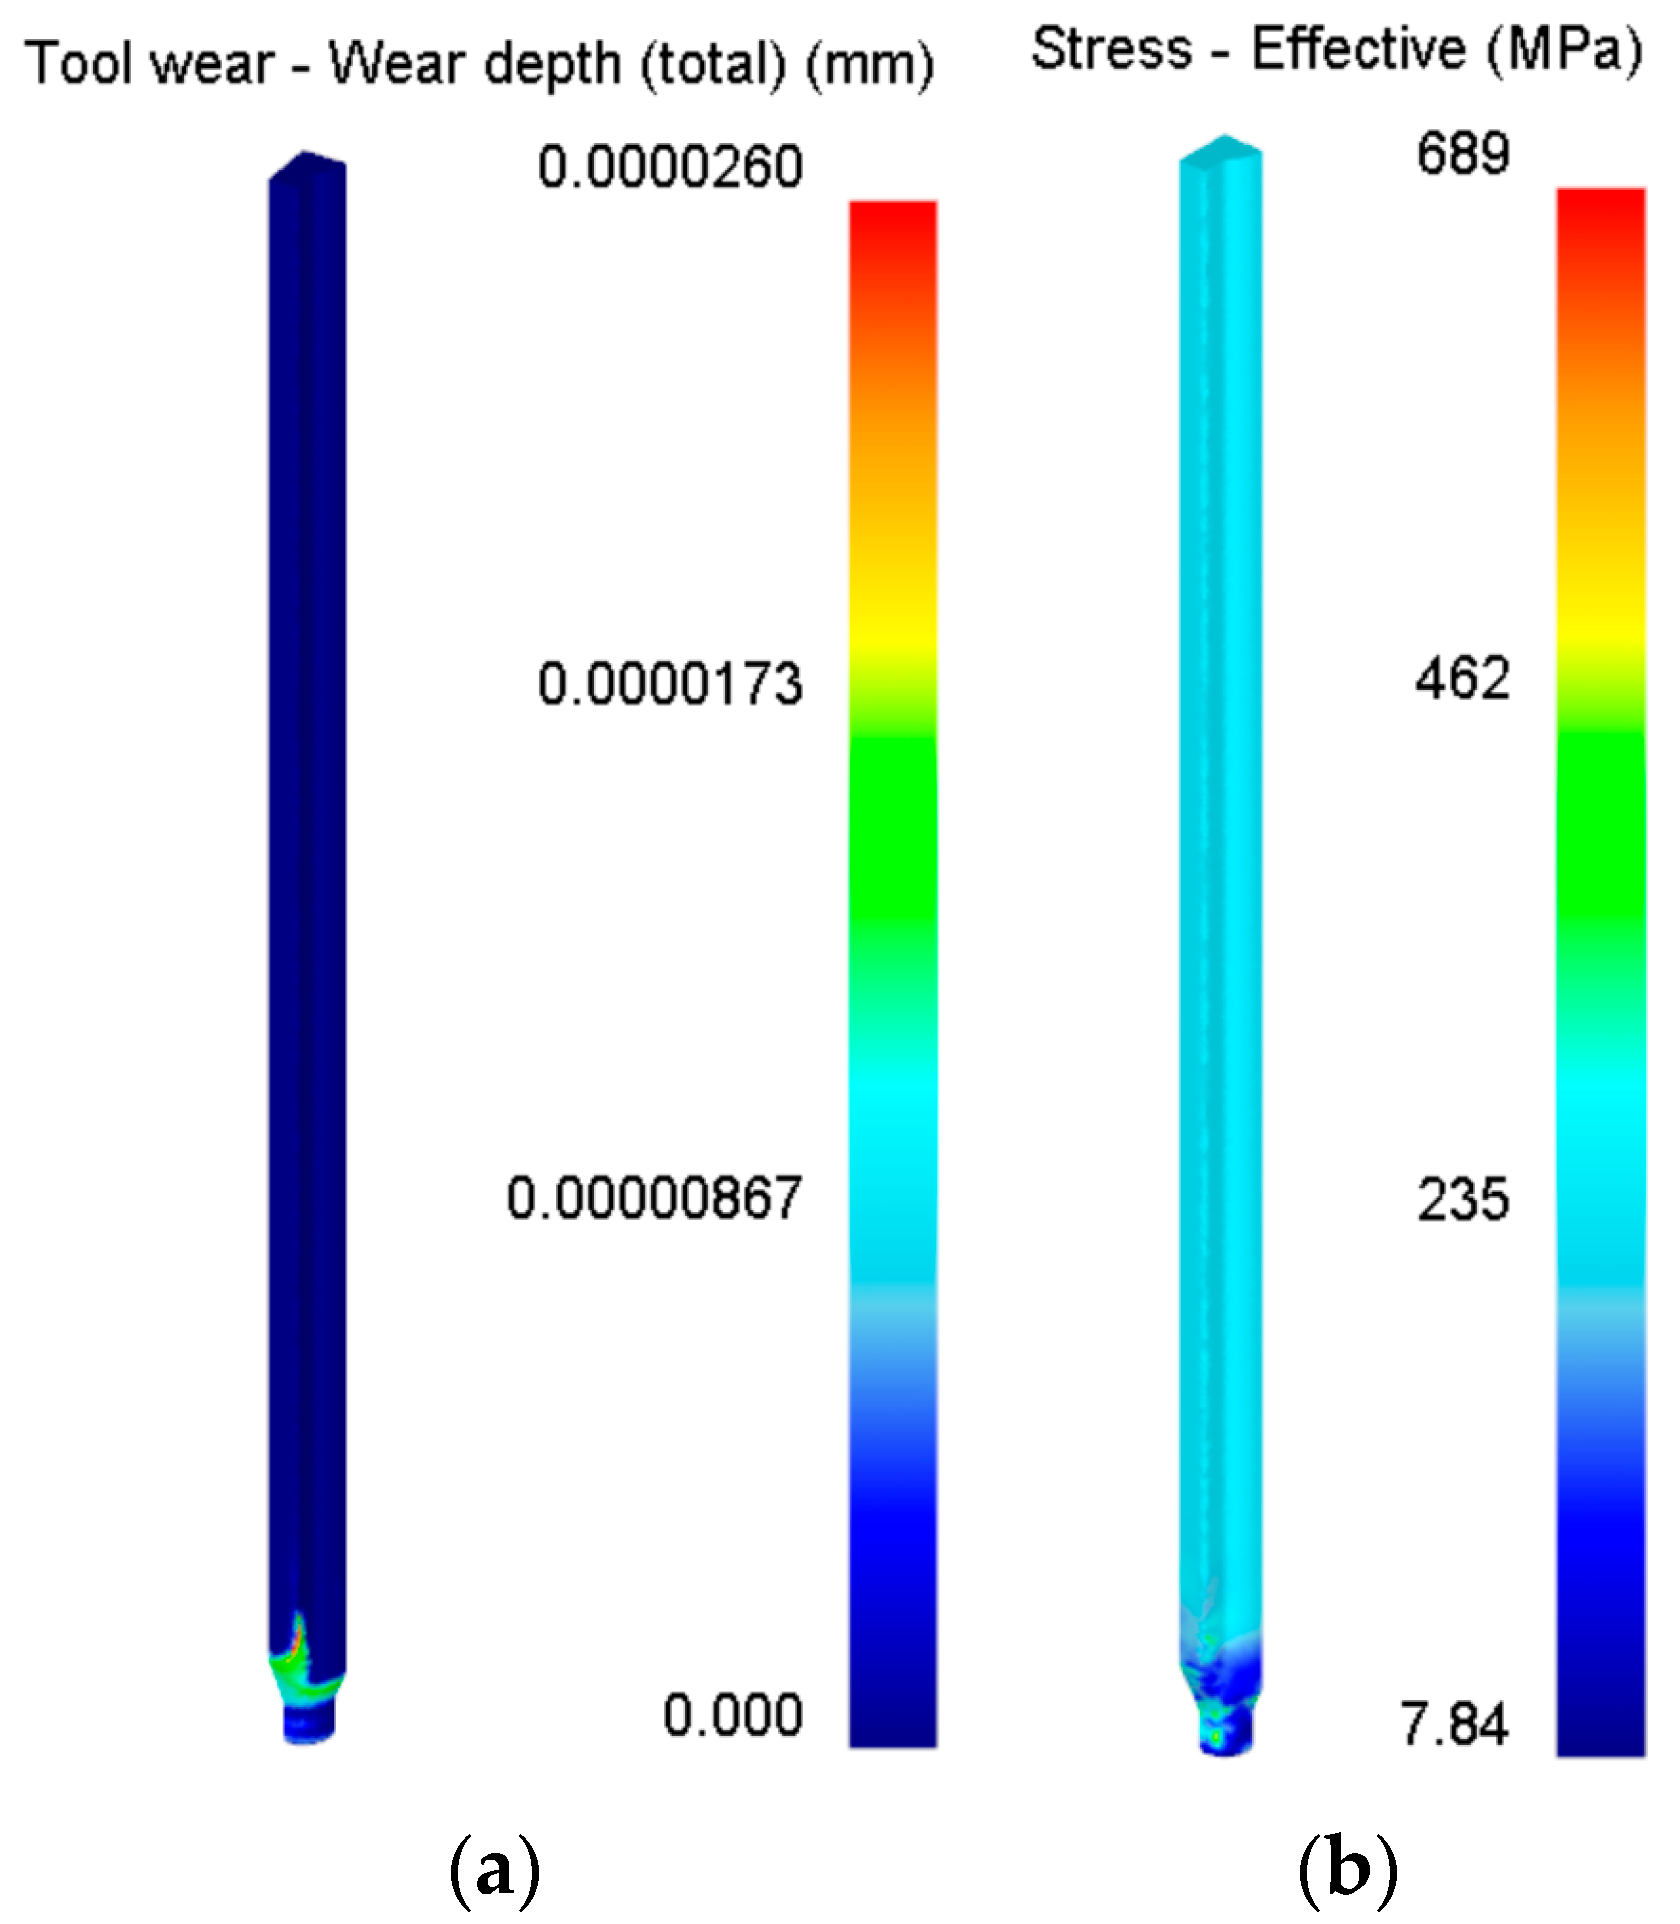
As shown in Figure 9, when wear depth is the optimization target, the punch wear depth is significantly reduced, reaching an optimal wear depth of 2.46 × 10⁻⁵ mm and an equivalent stress of 1110 MPa. As shown in Figure 10, when equivalent stress is the optimization target, the resulting punch has an optimal equivalent stress of 689 MPa and a wear depth of 2.60 × 10⁻⁵ mm.

4.6. TOPSIS Analysis

To address the limitation of the Taguchi method in balancing wear depth and equivalent stress, this paper introduces the TOPSIS method to transform the signal-to-noise ratios of both into closeness degrees, thereby achieving multi-objective optimization decision-making.
Step 1: Let the standardized matrix be denoted as Z, where each element zij is calculated from the original data using the larger-the-better characteristic standardization formula, as given in Formula (4).
z i j = x i j i = 1 m x i j 2 ;   i = 1 , 2 , , m , j = 1 , 2 , , n
In the standardized relationship, let z w and z s represent the standardized values of wear depth and equivalent stress, respectively, and x w and x s represent the original values of the signal-to-noise ratios for the corresponding indicators. Through calculation, it can be obtained that x w 2 203479.80 and x s 2 90572.29 , with the corresponding norms being 451.0874 and 300.9523, respectively. Partial data of the orthogonalized matrix X and the standardized matrix Z, which are composed of 25 objects to be evaluated and two evaluation indicators, are shown as follows.
X = 89.49 58.67 91.93 60.42 86.76 60.74 89.57 61.58 88.51 60.66 91.30 59.62                         Z = 0.1983 0.1949 0.2037 0.2007 0.1989 0.2018 0.1985 0.2046 0.1962 0.2015 0.2023 0.1981
Step 2: The calculation formulas for the positive ideal solution Z i + and the negative ideal solution Z i are derived from (5) and (6).
Z i + = x i   m a x i = 1 n x i 2
Z i = x i   m i n i = 1 n x i 2
Through calculation, Z w + , Z w , Z s + and Z s are 0.2037, 0.1962, −0.1949 and −0.2046, respectively.
Step 3: Calculate the Euclidean distance. The Euclidean distance of the positive ideal solution for the i-th group is D i + ,and that of the negative ideal solution is D i , as derived from Formulas (7) and (8).
D i + = ω w ( z w z w + ) 2 + ω s ( z s z s + ) 2
D i = ω w ( z w z w ) 2 + ω s ( z s z s ) 2
where ω w and ω s are the weights for wear depth and equivalent stress, respectively, both of which were set to 0.5. The symbols z w + and z s + denote the positive ideal solutions for wear depth and equivalent stress, respectively, while z w and z s represent their corresponding negative ideal solutions.
Step 4: Calculate the relative closeness degree C i using Formula (9).
C i = D i D i + + D i
Through calculation, Table 5 is obtained. By observing Table 5, it can be seen that the proximity value of the 19th experimental group is 0.8488, which is the highest among the 25 combinations, reflecting its optimal comprehensive performance across different objectives.
Step 5: The larger-the-better characteristic signal-to-noise ratio is used as its evaluation index, which is derived from Formula (10).
S / N ( C i ) = 10 × l o g 1 n i = 1 n 1 y i 2
where S / N ( C i ) represents the proximity signal-to-noise ratio, n is the total number of experiments (in this study, n = 25), and yi is the output response value corresponding to the i-th experimental group, where i = 1, 2, 3, …, n. The calculation results are shown in Table 5.
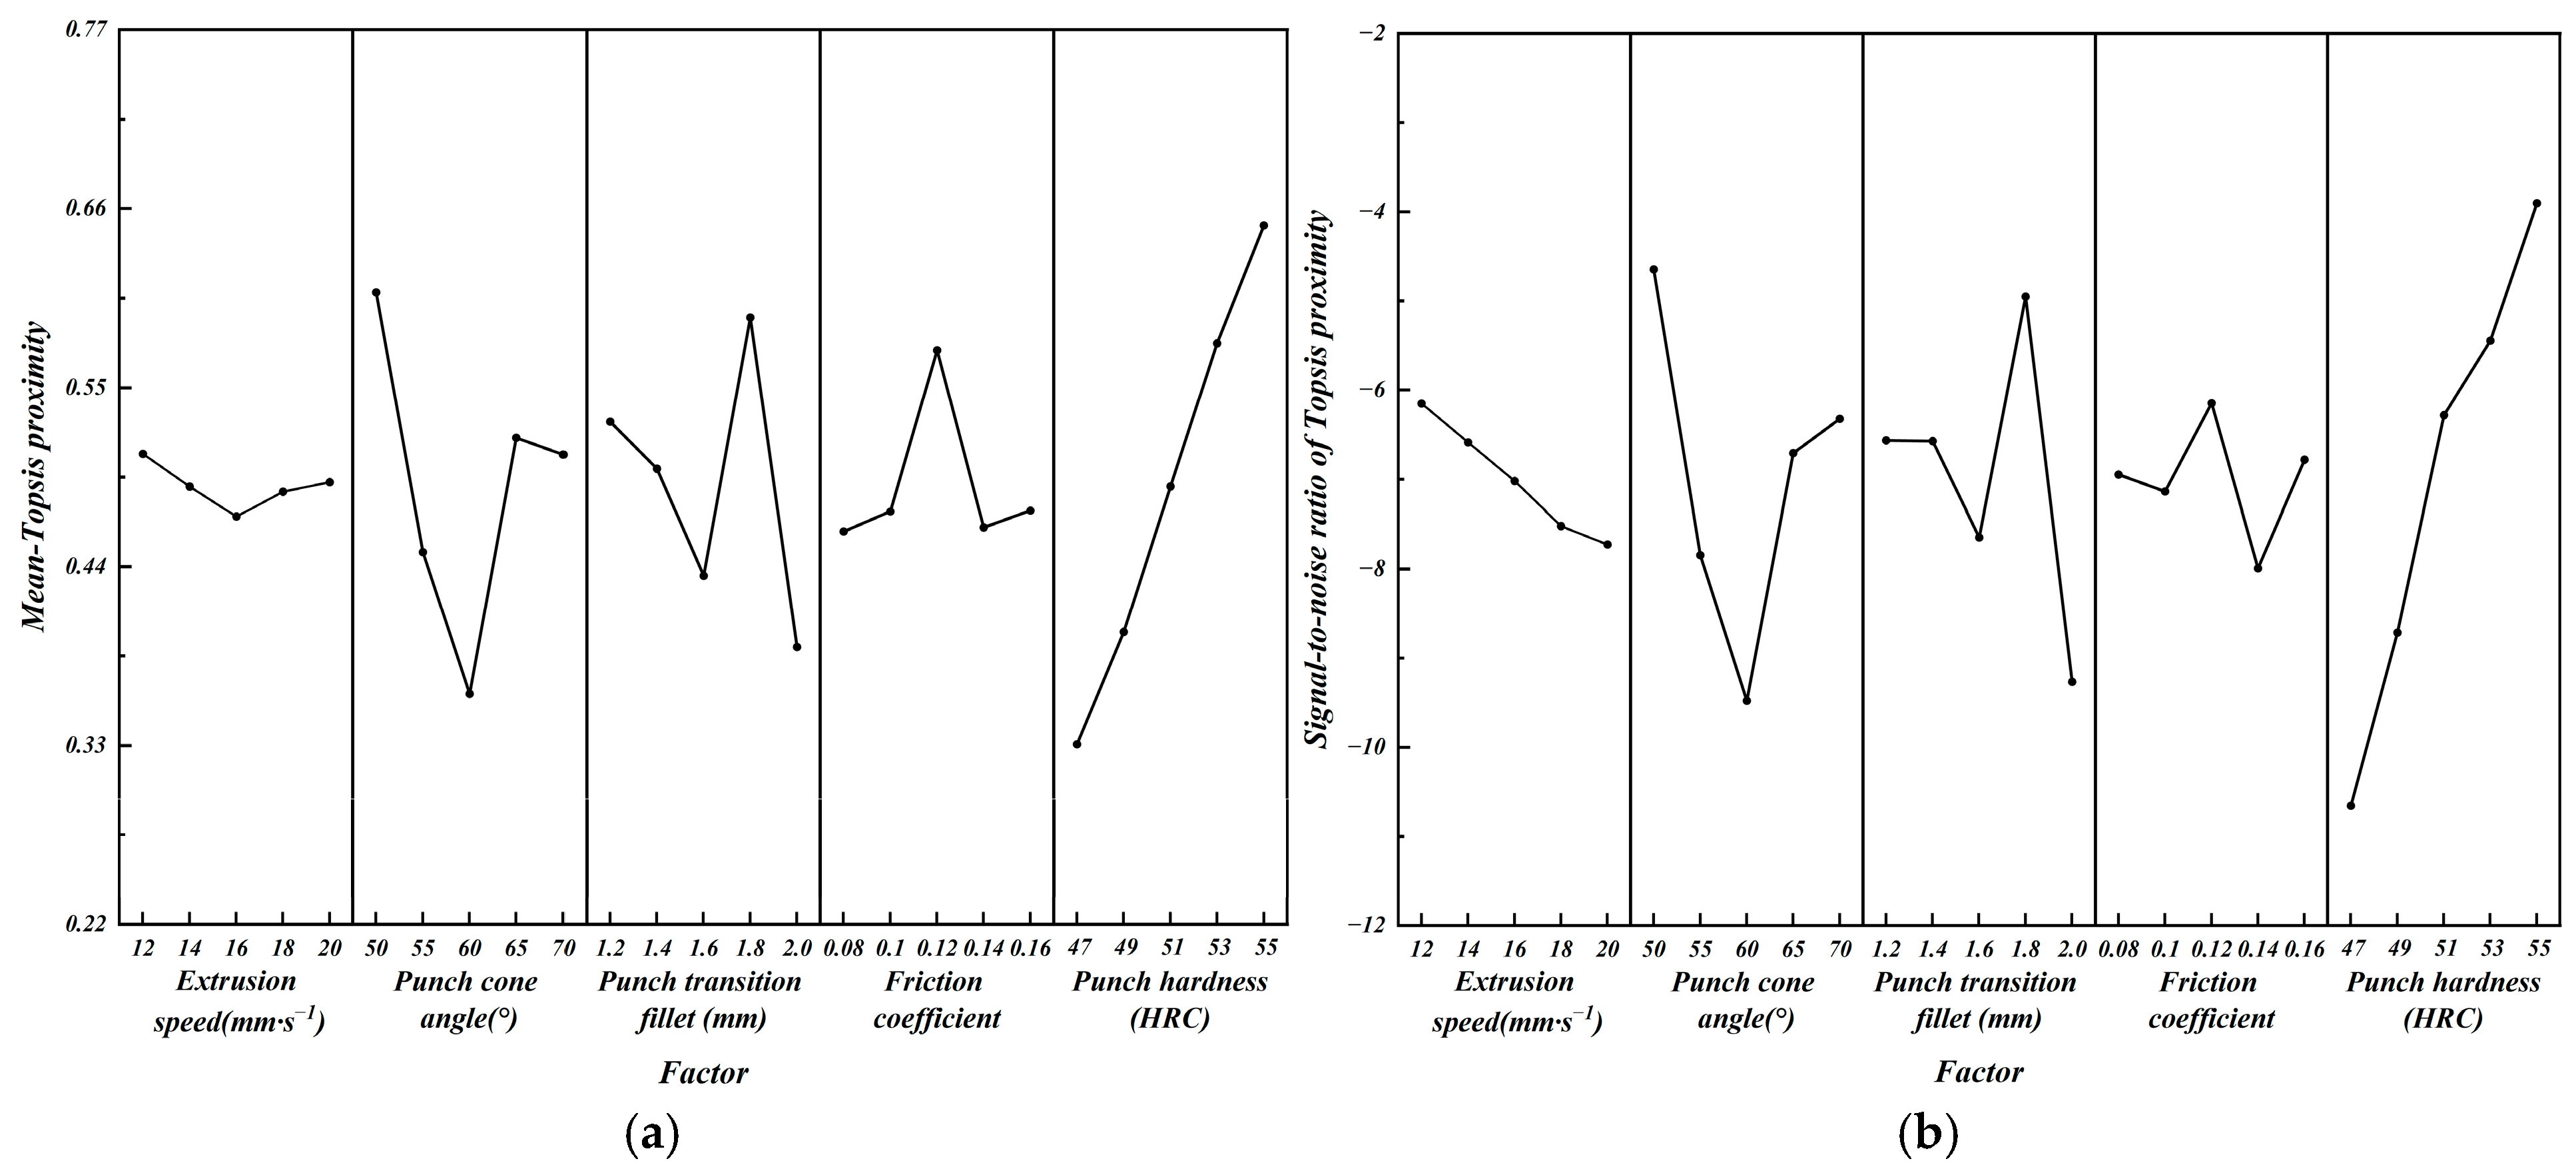
Table 6 indicates that both the mean value of proximity and the optimal parameter combination in the signal-to-noise ratio analysis are A1B1C4D3E5 (extrusion speed of 12 mm·s−1, punch cone angle of 50°, punch transition filet of 1.8 mm, friction coefficient of 0.12, and punch hardness of 55 HRC). The significance analysis indicates that the influence degrees of various process parameters on the target response, in descending order, are as follows: punch hardness > punch cone angle > punch transition filet > friction coefficient > extrusion speed. As shown in Figure 11, the main effect curves exhibit generally consistent changing trends, demonstrating good robustness.

4.7. Validation of the Finite Element Model

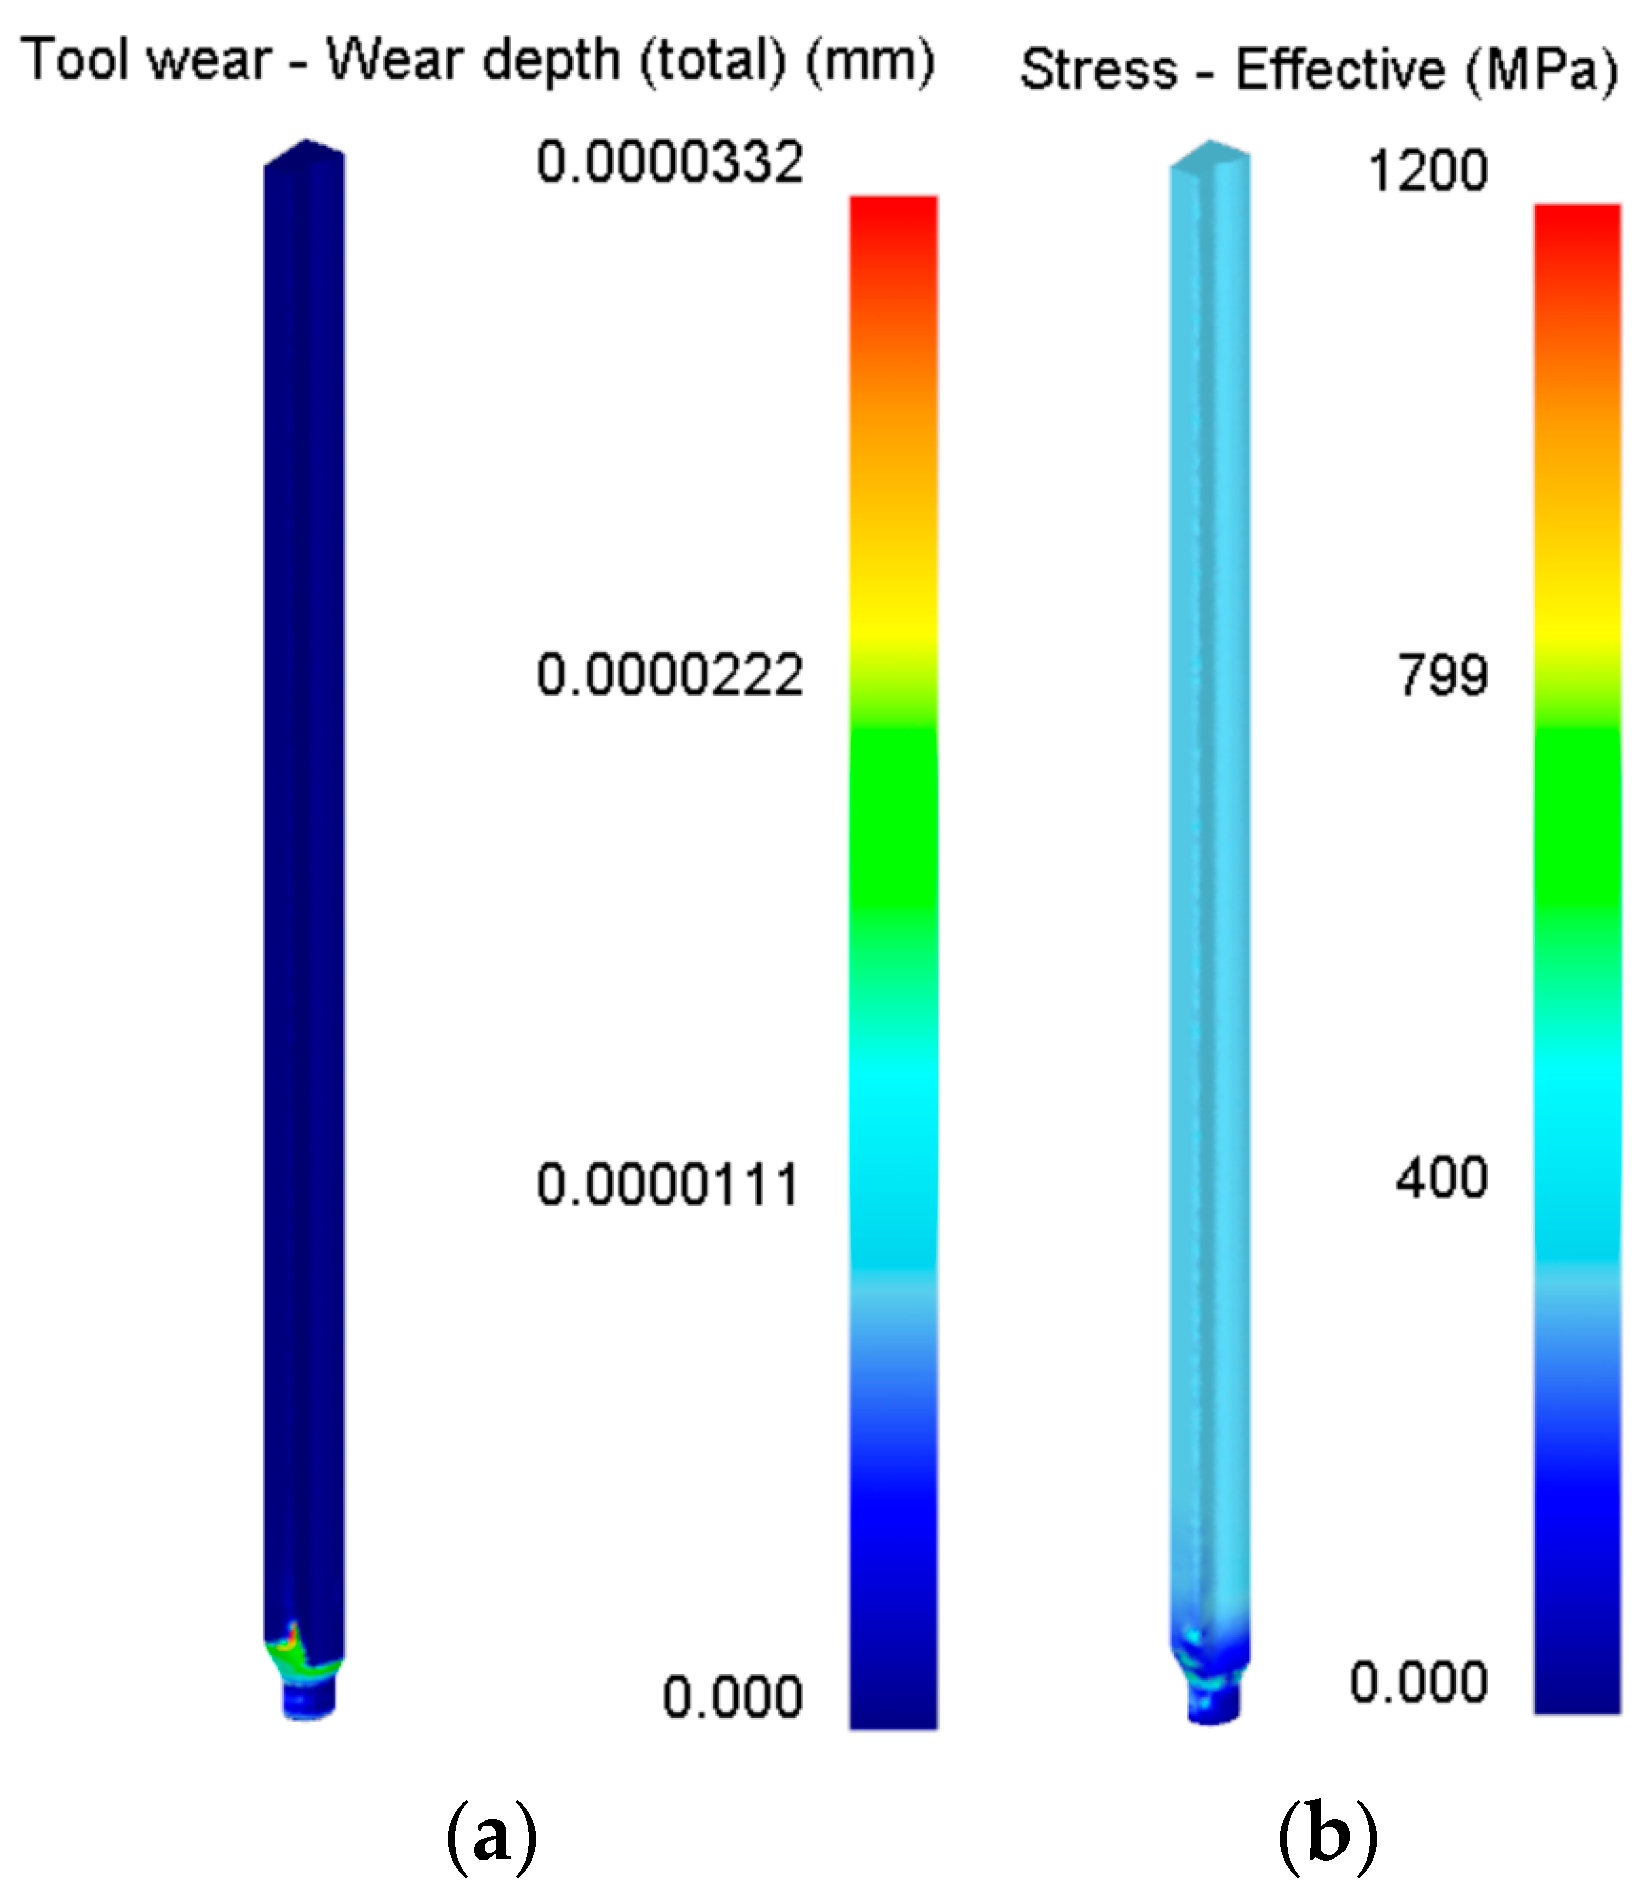
The initial scheme, shown in Figure 12, had a parameter combination of an extrusion speed of 20 mm·s−1, a punch cone angle of 60°, a transition filet of 1.2 mm, a friction coefficient of 0.14, and a punch hardness of 49 HRC. This configuration resulted in a wear depth of 3.32 × 10⁻⁵ mm and an equivalent stress of 1200 MPa. After optimization, the scheme is numbered as Figure 13, with a wear depth of 2.60 × 10⁻⁵ mm and equivalent stress of 689 MPa. Through a comparison between the conditions before and after optimization, as shown in Figure 14, it can be observed that after multi-objective optimization, the wear depth decreased by 21.68% and the equivalent stress decreased by 42.58%, indicating that the multi-objective collaborative optimization strategy significantly enhanced the wear resistance and mechanical properties of the punch.

5. Processing and Trial Production

5.1. Processing and Assembly

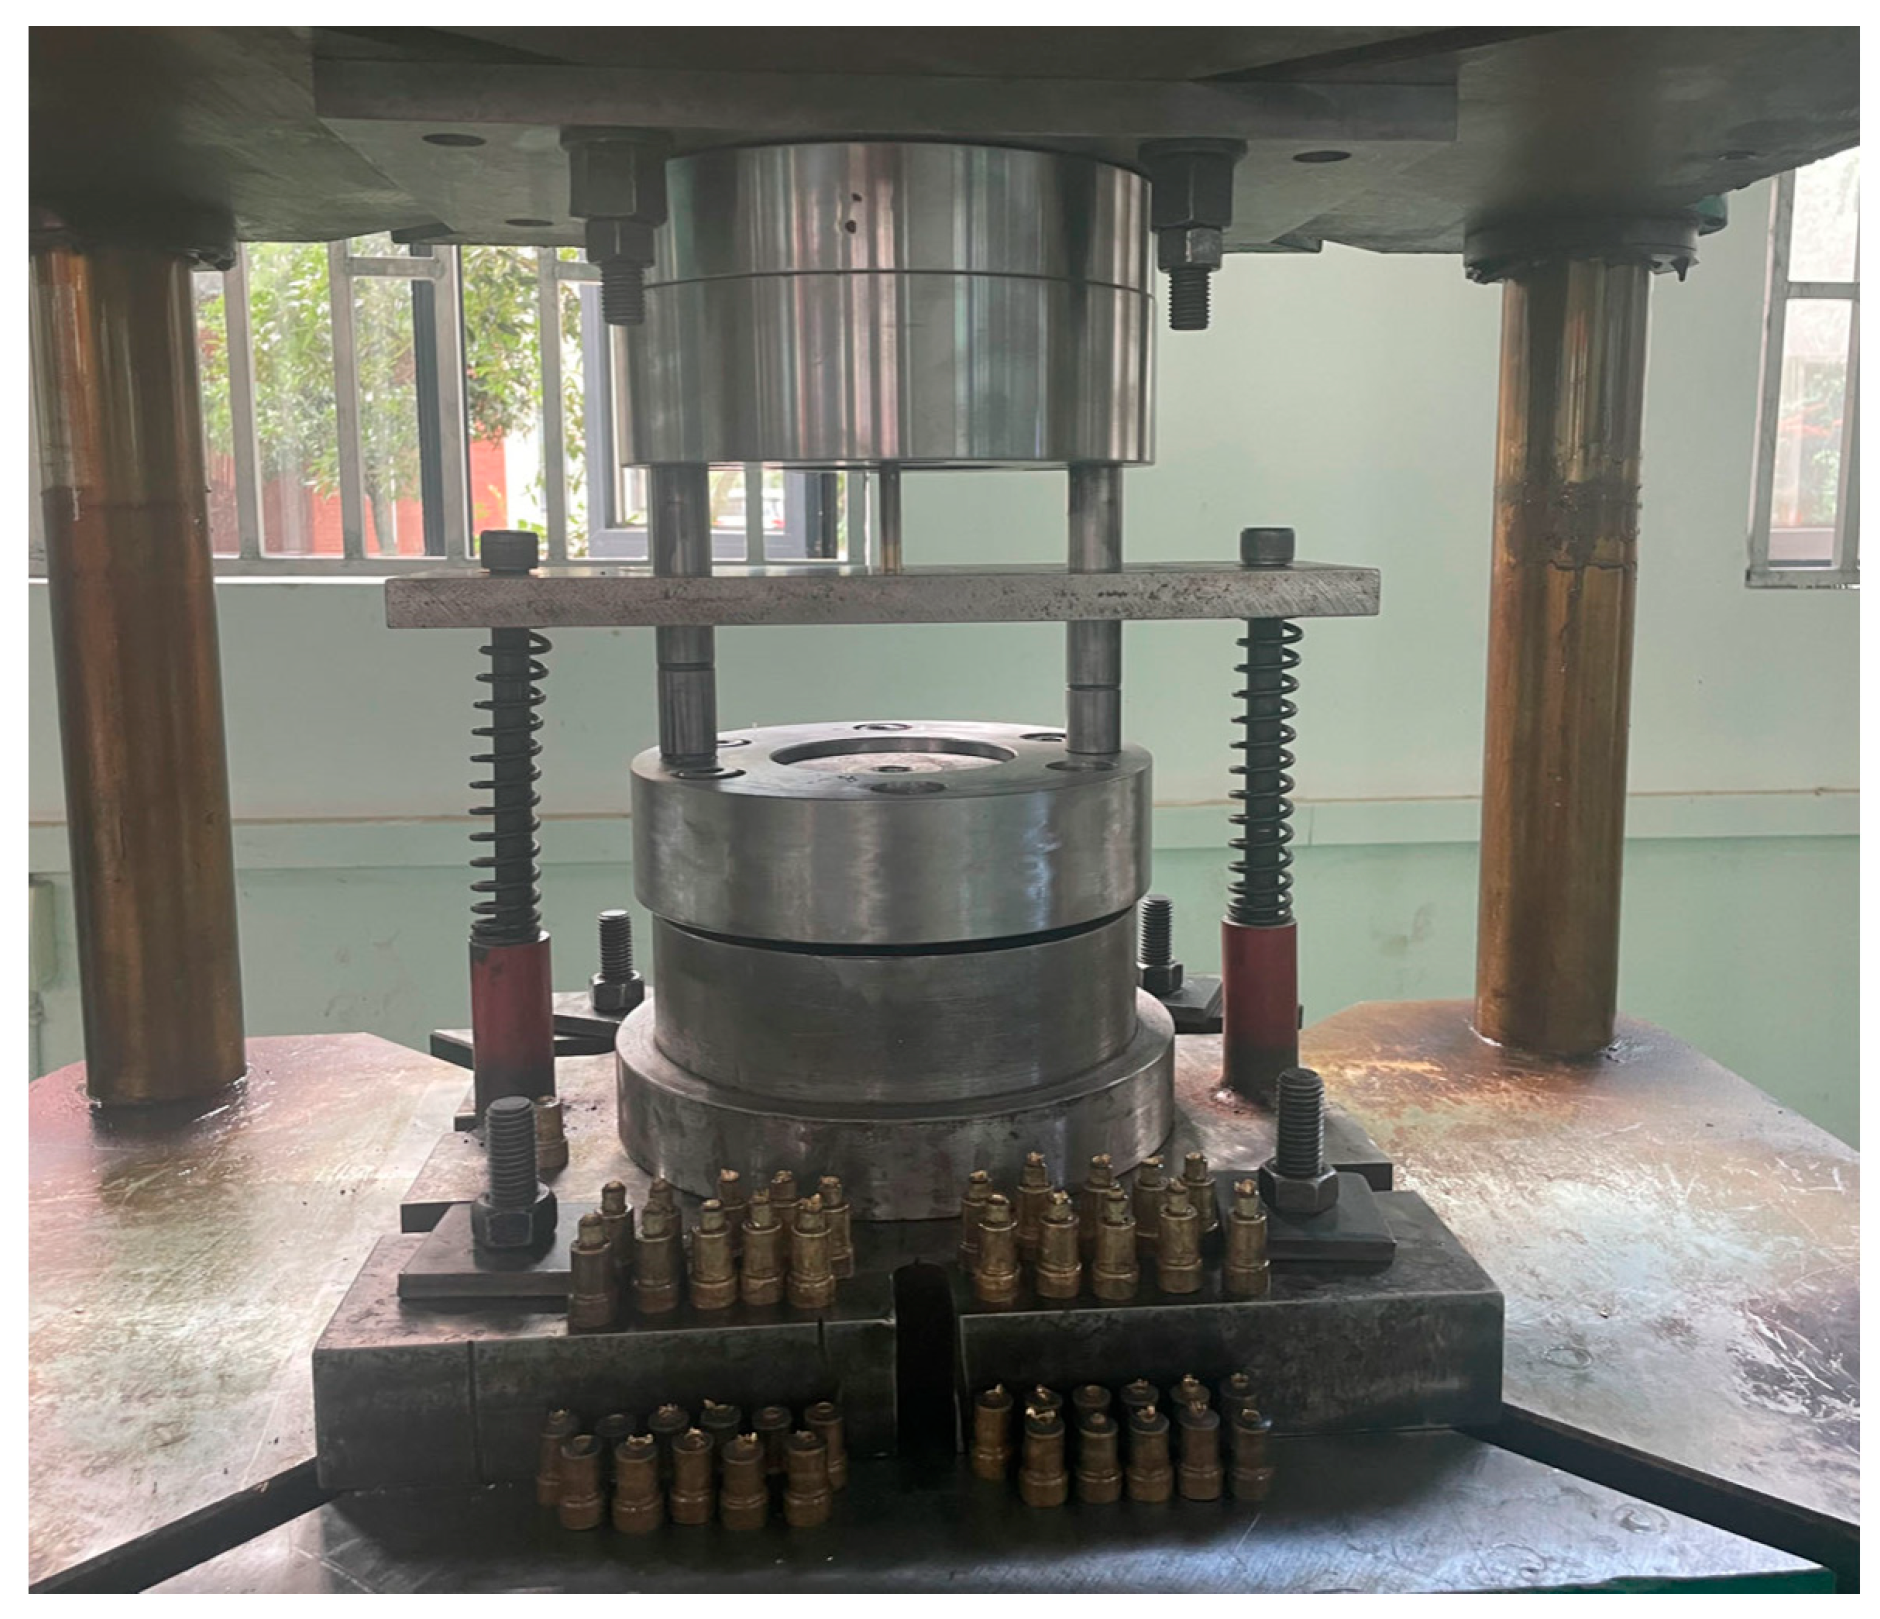
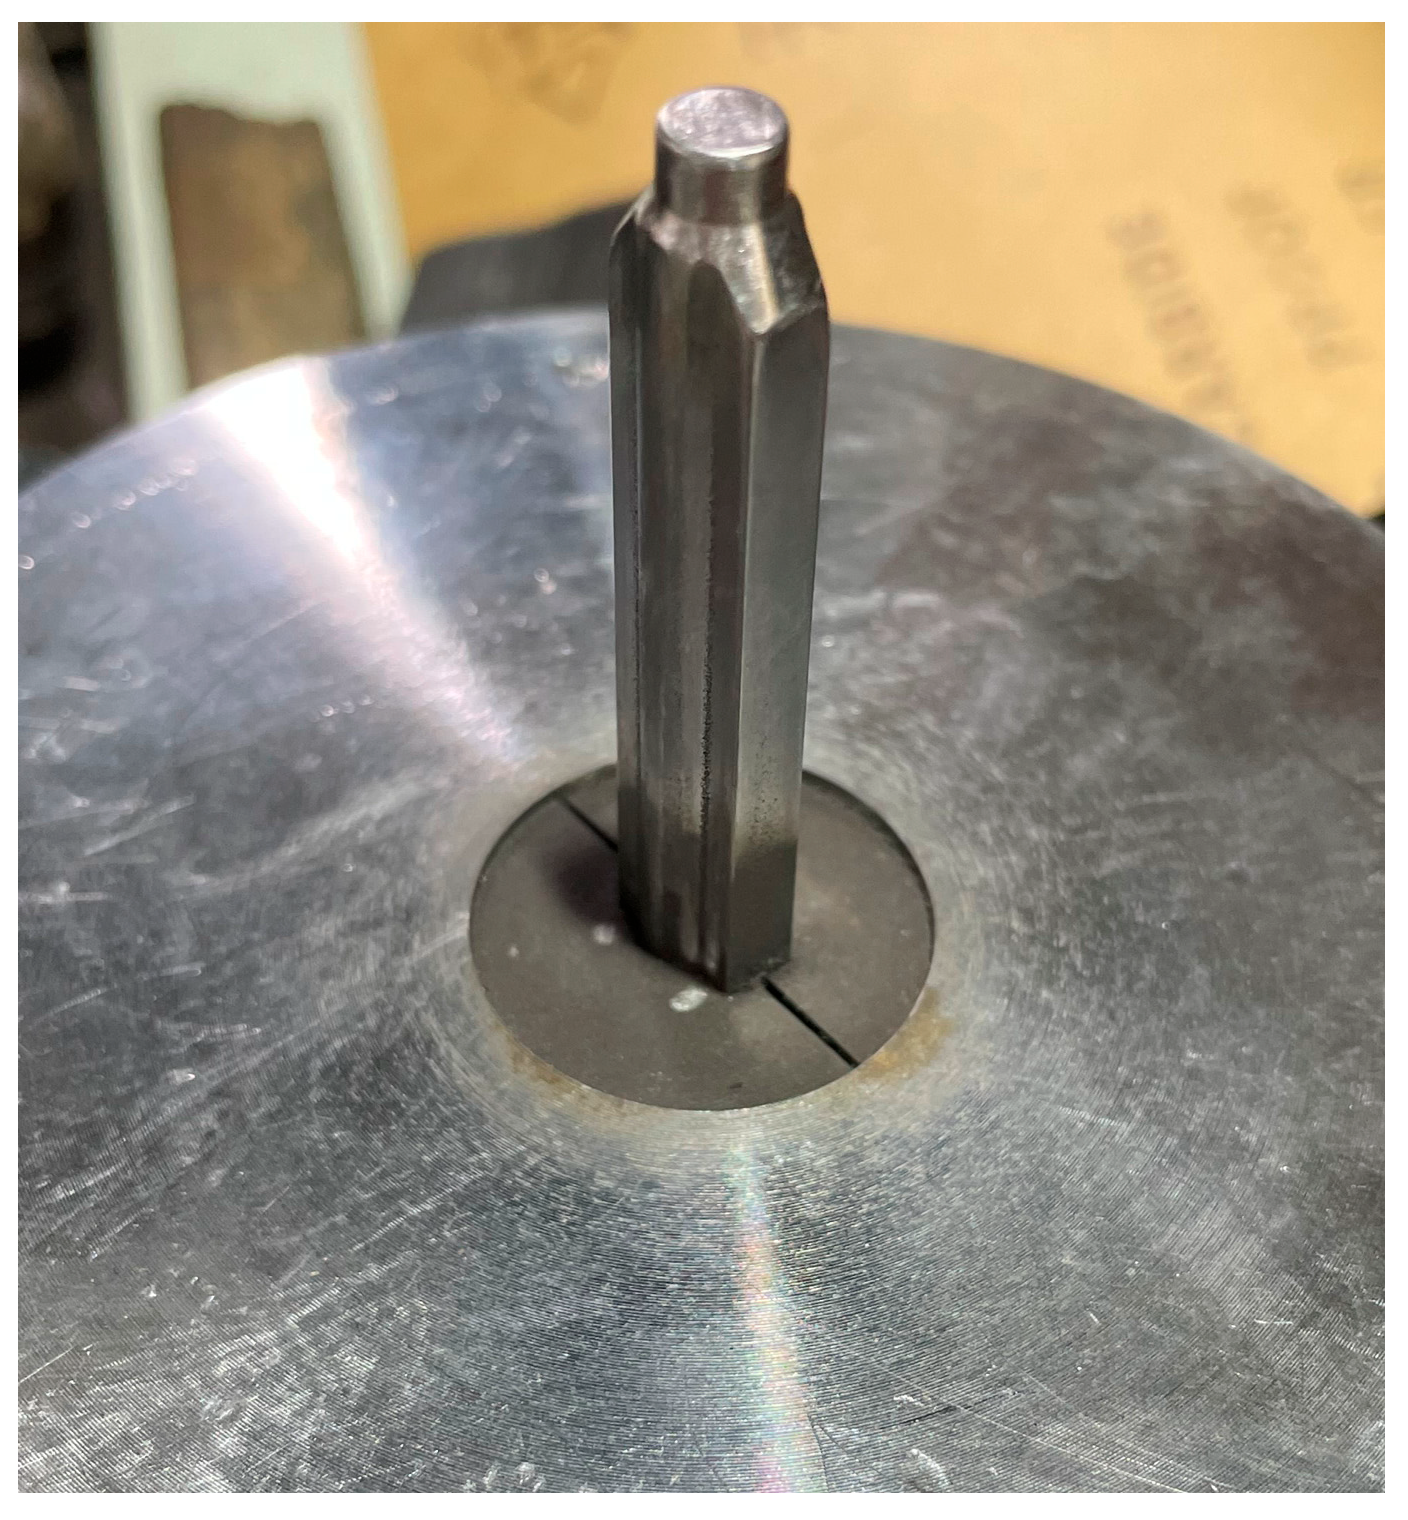
The punch was fabricated from AISI D2 steel, and its complex profile was machined using Electrical Discharge Machining (EDM). The original blank of the punch is pressed into the punch sleeve by a hydraulic press. The interference fit achieves a secure connection between the punch, the sleeve, and the outer jacket, effectively suppressing radial shaking during the working process and ensuring stable positioning of the punch, as shown in Figure 15a. After assembly, the punch is fixed on the magnetic base, and the electrode is held by the electrode fixture for precision machining and forming. The morphology of the punch after machining is shown in Figure 15b. After electrode machining, the surface roughness of the punch is relatively high. To ensure the forming quality of the parts and the service life of the punch, the working surface is polished and ground. After the machining of the slender, special-shaped cross-section punch is completed, the assembly work of the entire mold set is carried out. The general assembly drawing of the mold is shown in Figure 16.

5.2. Trial Production and Testing

Throughout the entire stamping test process, the die operated smoothly, and the forming process was continuous and stable. The numerical simulation results indicated that the maximum wear depth of the punch was 2.60 × 10⁻⁵ mm, and the minimum deviation in the formed part’s dimensions was 0.03 mm. After the calculation, under the optimal combination of process parameters, the estimated output of qualified parts is approximately 1153 pieces. To systematically evaluate the quality, consistency, and process stability during mass production, a total of 1150 parts were trial-produced. These parts were stored for one year to release residual stress. The last three trial-produced parts were selected as test samples (Figure 17) for specialized forming quality inspection. The test results indicated that all forming quality indicators of the parts met the technical requirements. The specific test data are summarized in Table 7, and the test results for each of the three samples can be viewed in the Specification. Macroscopic observation of the wear morphology of the punch after trial production was conducted (Figure 18), revealing that the actual wear was mainly distributed in the conical surface and filet transition areas, which were highly consistent with the wear distribution areas predicted by finite element simulation.

6. Conclusions

  • For the optimization of the thin-walled special-shaped hole punch for the fine, elongated, and irregularly shaped cross-section of an aviation motor brush holder, this study designed an L25(56) orthogonal experimental table with five factors and five levels based on the Taguchi design method and using SPSSAU software. Signal-to-noise ratio and range analyses were conducted on the experimental results to quantify the significance of the influence of various process parameters on wear depth and equivalent stress. The analysis indicates that when the wear depth is taken as the optimization objective, the influencing weights in descending order are punch hardness > punch transition filet > friction coefficient > punch cone angle > extrusion speed. When the equivalent stress is taken as the optimization objective, the influencing weights in descending order are punch cone angle > punch transition filet > friction coefficient > punch hardness > extrusion speed.
  • The Taguchi-TOPSIS integrated application method was employed, using the collaborative proximity of each target response value as the basis for weight determination and combining it with range analysis to derive the optimal process parameter combination. The optimal process parameter combination is as follows: extrusion speed of 12 mm·s−1, punch cone angle of 50°, punch transition filet radius of 1.8 mm, friction coefficient of 0.12, and punch hardness of 55 HRC. Compared with the initial process parameter combination, this optimized combination reduced the wear depth by 21.68% and the equivalent stress by 42.58%, significantly improving the part forming quality and the service life of the punch.
  • This study validates the Taguchi-TOPSIS integrated framework through coupled numerical and physical experiments. The results demonstrate that this method significantly reduces the required experimental effort while efficiently identifying a robust parameter set. This leads to substantial savings in manufacturing costs, alongside improved qualification rates and productivity for thin-walled special-shaped parts in cold extrusion. Consequently, it provides a reliable and cost-effective multi-objective optimization strategy for addressing complex process parameter challenges.
Based on the findings of this study, future research should focus on the following directions to further advance this field: (1) expanding the value ranges of process parameters to explore a broader optimization space; (2) implementing neural network algorithms and developing generalized machine learning models to achieve accurate prediction of optimal process parameters; (3) validating the determined optimal parameters using industrial-grade equipment to ensure practical applicability; (4) establishing more precise mapping relationships between process parameter combinations and performance metrics; and (5) incorporating uncertainty quantification methods to enhance process stability and reliability. These efforts would collectively provide a more systematic theoretical foundation and practical framework for the extrusion of precision thin-walled special-shaped components.

Author Contributions

Conceptualization, Z.L.; software, Z.L.; methodology, Z.L.; data curation, Z.L.; formal analysis, Z.L., Y.Y. and Q.W.; visualization, Z.L.; validation, Z.L.; writing—original draft, Z.L.; writing—review and editing, Z.L., Y.Y. and Q.W.; supervision, Y.Y. and Q.W.; project administration, Y.Y. and Q.W.; funding acquisition, Y.Y. and Q.W. All authors have read and agreed to the published version of the manuscript.

Funding

This research was funded by [Key Project of the Guizhou Provincial Natural Science Foundation in 2020] grant number [[2020] 1Z050].

Data Availability Statement

The original contributions presented in this study are included in the article. Further inquiries can be directed to the corresponding author.

Acknowledgments

My deepest gratitude goes out to everyone who helped shape this study by lending their time and expertise as either coworkers or advisors. This essay would not have been possible without all of their hard work.

Conflicts of Interest

The authors declare no conflict of interest.

References

  1. Callister, W.D., Jr.; Rethwisch, D.G. Materials Science and Engineering: An Introduction; John Wiley & Sons: Hoboken, NJ, USA, 2020. [Google Scholar]
  2. Parida, S.-P.; Jena, P.-C.; Das, S.-R.; Basem, A.; Khatua, A.-K.; Elsheikg, A.-H. Transverse vibration of laminated-composite-plates with fillers under moving mass rested on elastic foundation using higher order shear deformation theory. Proc. Inst. Mech. Eng. Part C J. Mech. Eng. Sci. 2024, 238, 9878–9888. [Google Scholar] [CrossRef]
  3. Pradhan, S.; Dhupal, D.; Das, S.-R.; Jena, P.-C. Experimental investigation and optimization on machined surface of Si3N4 ceramic using hot SiC abrasive in HAJM. Mater. Today Proc. 2021, 44, 1877–1887. [Google Scholar] [CrossRef]
  4. Farzad, H.; Ramin, E. An investigation of die profile effect on die wear of plane strain extrusion using incremental slab method and finite element analysis. Int. J. Adv. Manuf. Technol. 2020, 111, 627–644. [Google Scholar] [CrossRef]
  5. Liu, Y.; Wang, W.; Yan, S.; Zou, L. Transformation of material removal behavior and its mechanism modeling with the wear evolution of pyramidal structured abrasive belts. J. Manuf. Process. 2025, 137, 125–134. [Google Scholar] [CrossRef]
  6. Zhou, Y.; Wang, R.; Hu, J. High-temperature wear mechanism of roller cone bit spiral seal. Wear 2023, 532, 205112. [Google Scholar] [CrossRef]
  7. Lin, Y.; Wang, H.; Wang, H.; Tang, S.; Hao, H.; Huang, J. A novel wear prediction method and wear characteristic analysis of piston/cylinder pair in axial piston pump. Wear 2024, 550, 205402. [Google Scholar] [CrossRef]
  8. Yang, Y.; Hu, B.; Liang, X.; Chen, J.; Gao, L.; Chen, J.; Zhang, Z.; Wang, Q.; Zhang, X.; Ren, X.; et al. Effects of “free flow” coupled with severe shear strain on the volume of the refined microstructure in a 7075 aluminum alloy under rotary extrusion. J. Mater. Process. Technol. 2025, 338, 118772. [Google Scholar] [CrossRef]
  9. Xia, Y.; Shu, X.; Zhu, D.; Pater, Z.; Bartnicki, J. Effect of process parameters on microscopic uniformity of cross wedge rolling of GH4169 alloy shaft. J. Manuf. Process. 2021, 66, 145–152. [Google Scholar] [CrossRef]
  10. Chen, M.; Zhu, C.; Yu, Z.; Ma, C. A novel process for manufacturing large-diameter thin-walled metal ring: Double-roll pendulum hot rotary forging technology. J. Manuf. Process. 2022, 76, 379–396. [Google Scholar] [CrossRef]
  11. Çakıroğlu, R.; Mustafa, G. Comprehensive analysis of material removal rate, tool wear and surface roughness in electrical discharge turning of L2 tool steel. J. Mater. Res. Technol. 2020, 9, 7305–7317. [Google Scholar] [CrossRef]
  12. Rajiev, R.; Sadagopan, P.; Prakash, R.-S. Study on investigation of hot forging die wear analysis—An industrial case study. Mater. Today Proc. 2020, 27, 2752–2757. [Google Scholar] [CrossRef]
  13. Behrens, B.-A.; Brunotte, K.; Hübner, S.; Wester, H.; Müller, F.; Müller, P.; Wälder, J.; Matthias, T. Further development of wear calculation and wear reduction in cold forging processes. J. Manuf. Mater. Process. 2021, 5, 36. [Google Scholar] [CrossRef]
  14. Ma, C.; Li, T.; Xue, C.; Jin, R.; Chu, Z.; Shuai, M.; Tuo, L. Optimization of Roll Configuration and Investigation of Forming Process in Three-Roll Planetary Rolling of Stainless Steel Seamless Tubes. Metals 2025, 15, 540. [Google Scholar] [CrossRef]
  15. Yang, J.; Heogh, W.; Ju, H.; Kang, S.; Jang, T.S.; Jung, H.D.; Jahazi, M.; Han, C.S.; Park, J.S.; Kim, S.H.; et al. Functionally graded structure of a nitride-strengthened Mg2Si-based hybrid composite. J. Magnes. Alloys 2024, 12, 1239–1256. [Google Scholar] [CrossRef]
  16. Davoudi, M.; Nejad, A.-F.; Koloor, S.-S.-R.; Petru, M. Investigation of effective geometrical parameters on wear of hot forging die. J. Mater. Res. Technol. 2021, 15, 5221–5231. [Google Scholar] [CrossRef]
  17. Ogbezode, J.-E.; Ajide, O.-O. Tool wear analysis of C-shaped equal channel reciprocating extrusion process of AISI-H13 steel die using finite element method. J. Braz. Soc. Mech. Sci. Eng. 2021, 43, 568. [Google Scholar] [CrossRef]
  18. Fernández, D.; Rodriguez-Prieto, A.; Camacho, A.-M. Optimal Parameters Selection in Advanced Multi-Metallic Co-Extrusion Based on Independent MCDM Analytical Approaches and Numerical Simulation. Mathematics 2022, 10, 4489. [Google Scholar] [CrossRef]
  19. Jeyakumar, M.; Hari Prasath, R.; Giridharan, S.; Prabhu, C.; Domnic, D. Deform 3D and Taguchi Techniques for Investigating Cutting Force for AISI 1030 Steel. In Recent Advances in Materials and Modern Manufacturing: Select Proceedings of ICAMMM 2021, Tamil Nadu, India, 26–28 March 2021; Springer Nature: Singapore, 2022; pp. 771–788. [Google Scholar]
  20. Jantepa, N.; Nattarawee, S.; Surasak, S. Predictive modeling and optimization of hot forging parameters for AISI 1045 ball joints using Taguchi methodology and finite element analysis. Metals 2024, 14, 1198. [Google Scholar] [CrossRef]
  21. Elplacy, F.; Samuel, M.; Mostafa, R. Modelling and simulation of hot direct extrusion process for optimal product characteristics: Single and multi-response optimization approach. Adv. Prod. Eng. Manag. 2022, 17, 33–44. [Google Scholar] [CrossRef]
  22. de Bruijn, A.-C.; Gómez-Gras, G.; Pérez, M.-A. On the effect upon the surface finish and mechanical performance of ball burnishing process on fused filament fabricated parts. Addit. Manuf. 2021, 46, 102133. [Google Scholar] [CrossRef]
  23. Bakhtiarian, M.; Omidvar, H.; Mashhuriazar, A.; Sajuri, Z.; Gur, H. The effects of SLM process parameters on the relative density and hardness of austenitic stainless steel 316L. J. Mater. Res. Technol. 2024, 29, 1616–1629. [Google Scholar] [CrossRef]
  24. Kumar, R.; Singh, S.; Bilga, P.-S.; Jatin; Singh, J.; Singh, S.; Scutaru, M.-L.; Pruncu, C.-I. Revealing the benefits of entropy weights method for multi-objective optimization in machining operations: A critical review. J. Mater. Res. Technol. 2021, 10, 1471–1492. [Google Scholar] [CrossRef]
  25. Singh, S.; Agrawal, V.; Saxena, K.-K.; Mohammed, K.-A. Optimization on manufacturing processes at Indian industries using TOPSIS. Indian J. Eng. Mater. Sci. 2023, 30, 32–44. [Google Scholar] [CrossRef]
  26. Shih, H.-S.; Olson, D.-L. TOPSIS and Its Extensions: A Distance-Based MCDM Approach; Springer Nature: Berlin/Heidelberg, Germany, 2022; Volume 447. [Google Scholar]
  27. Chatterjee, S.; Shankar, C. A study on the effects of objective weighting methods on TOPSIS-based parametric optimization of non-traditional machining processes. Decis. Anal. J. 2024, 11, 100451. [Google Scholar] [CrossRef]
  28. Wei, X.; Chen, T.; Shen, G.; Ding, F. Alkali-activated slag backfill grout materials optimization: Statistical RSM modelling and NSGA-II performance control. J. Mater. Res. Technol. 2023, 24, 5613–5627. [Google Scholar] [CrossRef]
  29. Kamalizadeh, S.; Niknam, S.-A.; Balazinski, M.; Turenne, S. The use of TOPSIS method for multi-objective optimization in milling Ti-MMC. Metals 2022, 12, 1796. [Google Scholar] [CrossRef]
  30. Faheem, A.; Hasan, F.; Khan, A.-A.; Singh, B.; Ayaz, M.; Shamim, F.; Saxena, K.-K.; Eldin, S.-M. Parametric optimization of electric discharge machining of Ni 55.65 Ti based shape memory alloy using NSGA II with TOPSIS. J. Mater. Res. Technol. 2023, 26, 1306–1324. [Google Scholar] [CrossRef]
  31. Chen, X.; Li, X.; Li, Z.; Cao, W.; Zhang, Y.; Ni, J.; Wu, D.; Wang, Y. Control parameter optimization of dry hobbing under user evaluation. J. Manuf. Process. 2025, 133, 46–54. [Google Scholar] [CrossRef]
  32. Yuan, J.; Geng, H.; Alfano, M. Multi-response optimization of M2 steel coatings deposited by co-axial laser cladding on A2 steel tool surfaces. J. Mater. Res. Technol. 2024, 29, 1102–1117. [Google Scholar] [CrossRef]
  33. Gajević, S.; Markovic, A.; Markovic, S.; Asonja, A.; Ivanovic, L.; Stojanovic, B. Multi-objective optimization of tribological characteristics for aluminum composite using Taguchi grey and TOPSIS approaches. Lubricants 2024, 12, 171. [Google Scholar] [CrossRef]
  34. Kumar, R.; Singh, S.; Aggarwal, V.; Singh, S.; Pimenov, D.-Y.; Giasin, K.; Nadolny, K. Hand and abrasive flow polished tungsten carbide die: Optimization of surface roughness, polishing time and comparative analysis in wire drawing. Materials 2022, 15, 1287. [Google Scholar] [CrossRef]
  35. Imran, M.; Suo, S.; Bai, Y.; Wang, Y.; Raheel, N. Optimising subsurface integrity and surface quality in mild steel turning: A multi-objective approach to tool wear and machining parameters. J. Mater. Res. Technol. 2025, 35, 3440–3462. [Google Scholar] [CrossRef]
  36. Sur, G.; Motorcu, A.-R.; Nohutçu, S. Single and multi-objective optimization for cutting force and surface roughness in peripheral milling of Ti6Al4V using fixed and variable helix angle tools. J. Manuf. Process. 2022, 80, 529–545. [Google Scholar] [CrossRef]
  37. Ashby, M.-F.; Shercliff, H.; Cebon, D. Materials: Engineering, Science, Processing and Design; Butterworth-Heinemann: Oxford, UK, 2018. [Google Scholar]
  38. Hu, J.; Song, H.; Sandfeld, S.; Liu, X.; Wei, Y. Breakdown of Archard law due to transition of wear mechanism from plasticity to fracture. Tribol. Int. 2022, 173, 107660. [Google Scholar] [CrossRef]
  39. Zhang, H.; Wang, W.; Zhao, C.; Cai, Z.; Li, B.; Zhu, M. Numerical Simulation of Contact and Wear Between Deformed Mold and Solidified Shell Based on Archard Model. Metall. Mater. Trans. B 2025, 56, 3774–3792. [Google Scholar] [CrossRef]
  40. Wei, C.; He, C.; Tan, H.; Su, Y.; Chen, G.; Sun, Y.; Ren, C. A predictive model for tool wear behavior during ultra-precision lapping. Int. J. Adv. Manuf. Technol. 2025, 136, 875–895. [Google Scholar] [CrossRef]
  41. Pereira, L.-D.-S.; Donato, G.-H.-B.; Neto, M.-M. Assessment of the von Mises stresses and stress triaxiality in notches using modified tensile specimens. Mater. Res. 2023, 26, e20220572. [Google Scholar] [CrossRef]
  42. Manikandan, P.; Rao, G.-S.; Murty, S.-N.; Venugopal, A.; Narayanan, P.-R.; Mohan, M. Biaxial Tensile Behavior of Aluminum Alloy AA2219-T852 using Tension and Internal Pressure. J. Mater. Eng. Perform. 2023, 32, 6930–6941. [Google Scholar] [CrossRef]
  43. Bhandari, R.; Biswas, P.; Malliik, M.; Mondal, M.-K. Microstructure based numerical simulation of the micromechanics and fracture in hypereutectic Al–Mg2Si composites. Mater. Chem. Phys. 2023, 297, 127427. [Google Scholar] [CrossRef]
  44. Oda, S.; Tanaka, S.-I. Effect of local texture and residual stress on the bendability of extruded 6000-series Al alloy profiles. Mater. Sci. Eng. A 2022, 829, 142167. [Google Scholar] [CrossRef]
  45. Zhao, S.; Bao, J.; Zhang, Q.; Yin, Y.; Wang, X.; Ai, J. Preparation process optimization of hard magnetic brake friction material based on NdFeB additive. Ind. Lubr. Tribol. 2022, 74, 258–264. [Google Scholar] [CrossRef]
  46. Dorkhah, A.; Arab-Solghar, A.; Rezaeizadeh, M. Experimental Analysis of Semi-autogenous Grinding Mill Characteristics Under Different Working Conditions. Iran. J. Sci. Technol. Trans. Mech. Eng. 2020, 44, 1103–1114. [Google Scholar] [CrossRef]
  47. Wang, Y.; Xu, C.; He, L.; Cao, Y. A Multifactor Combination Optimization Design Based on Orthogonality for a Two-Degree-of-Freedom Floating Machine Gun Vibration System. Shock. Vib. 2024, 1, 6686238. [Google Scholar] [CrossRef]
Figure 1. Aircraft motor brush box parts diagram.
Metals 15 01192 g001
Figure 2. Technology roadmap. (a) Research Methodology Flow; (b) Simulation Model; (c) Tooling Design, Manufacturing, and Assembly Process Chain.
Metals 15 01192 g002
Figure 3. Material curve and simulation flow chart. (a) Heat Treatment Experiments on H62 Brass; (b) Tensile Testing of H62 Brass Specimens; (c) Plotting Material Property Curves.
Metals 15 01192 g003
Figure 4. 3D model diagram: (a) cold extrusion punch and its main wear areas, and (b) cold extrusion die.
Metals 15 01192 g004
Figure 5. Cold extrusion die structure (a) and finite element model (b).
Metals 15 01192 g005
Figure 6. Cold extrusion simulation results of thin-walled hole parts with special-shaped.
Metals 15 01192 g006
Figure 7. Wear depth diagram (a) and equivalent stress diagram (b), as well as the main wear regions of the punch in the wear depth diagram.
Metals 15 01192 g007
Figure 8. Main effects plot for signal-to-noise ratio of wear depth (a) and equivalent stress (b).
Metals 15 01192 g008
Figure 9. The simulation results with wear depth as the optimization objective, where (a) is the wear depth diagram and (b) is the equivalent stress diagram.
Metals 15 01192 g009
Figure 10. The simulation results with equivalent stress as the optimization objective, where (a) is the wear depth diagram and (b) is the equivalent stress diagram.
Metals 15 01192 g010
Figure 11. Main Effects Plot for SN Ratios of Wear Depth (a) and Equivalent Stress (b).
Metals 15 01192 g011
Figure 12. The simulated cloud diagrams under the initial scheme: (a) is the cloud diagram of wear depth, and (b) is the cloud diagram of equivalent stress.
Metals 15 01192 g012
Figure 13. The simulated cloud diagrams under the optimized scheme: (a) is the wear depth cloud diagram, and (b) is the equivalent stress cloud diagram.
Metals 15 01192 g013
Figure 14. Comparison of Wear Depth and Equivalent Stress Before and After Optimization.
Metals 15 01192 g014
Figure 15. The punch in electrode processing, with figure (a) showing the preparation diagram before processing and figure (b) showing the punch after processing.
Metals 15 01192 g015
Figure 16. Mold general assembly drawing.
Metals 15 01192 g016
Figure 17. Sample diagram.
Metals 15 01192 g017
Figure 18. Extrusion-shaped hole punch.
Metals 15 01192 g018
Table 1. Mechanical properties of H62.
ParameterTensile Strength/MPaYield Strength/MPaElongation/%Reduction in Area/%Hardness/HB
Numerical Value≥345≥295≥20≥18≤120
Table 2. Orthogonal Experiment Factors and Levels.
LevelFactor
Extrusion Speed (mm·s−1)Punch Cone Angle (°)Punch Transition Filet (mm)Friction
Coefficient
Punch Hardness (HRC)
112501.20.0847
214551.40.1049
316601.60.1251
418651.80.1453
520702.00.1655
Table 3. Analysis of the Taguchi Method: Objective Results and Signal-to-Noise Ratio.
Exp. NoInputOutput Response
Extrusion Speed (mm·s−1)Punch Cone Angle (°)Punch Transition Filet (mm)Friction CoefficientPunch Hardness (HRC)Wd
(×10−5 mm)
S/N(Wd)Es (MPa)S/N(Es)
0112501.20.08473.3589.49859−58.67
0212551.60.14552.5391.931050−60.42
0312602.00.10533.2589.761090−60.74
0412651.40.16512.9290.691110−60.90
0512701.80.12493.2089.89956−59.60
0614502.00.14513.2289.841030−60.25
0714551.40.10493.4189.34951−59.56
0814601.80.16473.3189.601070−60.58
0914651.20.12552.5791.80957−59.61
1014701.60.08532.8790.841140−61.13
1116501.80.10552.8490.93947−59.52
1216551.20.16532.8590.901070−60.58
1316601.60.12512.7791.151050−60.42
1416652.00.08493.5788.941040−60.34
1516701.40.14473.5389.041070−60.58
1618501.60.16493.5289.06952−60.00
1718552.00.12473.7388.561130−61.06
1818601.40.08552.7891.111110−60.90
1918651.80.14532.7091.37903−59.11
2018701.20.10512.8990.781010−60.08
2120501.40.12532.8590.90858−58.66
2220551.80.08513.1390.081010−60.08
2320601.20.14493.3289.571200−61.58
2420651.60.10473.7588.511080−60.66
2520702.00.16552.7291.30958−59.62
Table 4. Analysis results of the range of signal-to-noise ratio for wear depth and equivalent stress.
Maximum Wear DepthMaximum Equivalent Stress
LevelABCDELevelABCDE
190.3590.0490.5090.0989.041−60.06−59.42−60.10−60.22−60.31
290.2890.1690.2189.8689.362−60.22−60.34−60.12−60.11−60.21
390.1990.2390.2990.4690.503−60.28−60.84−60.52−59.87−60.34
490.1790.2690.3790.3590.754−60.23−60.12−59.77−60.38−60.04
590.0790.3789.6890.3191.415−60.12−60.20−60.40−60.33−60.01
Delta0.280.330.820.602.37Delta0.221.420.750.510.33
Rank54231Rank51234
OptA1B5C1D3E5OptA1B1C4D3E5
Table 5. TOPSIS closeness degree data table.
Exp. NoMaximum Wear DepthMaximum Stress D i + D i C i S/N(Ci)
x t z w x s z s
0189.490.1983−58.67−0.19490.00380.00700.6481−3.7671
0291.930.2037−60.42−0.20070.00410.00600.5940−4.5242
0389.760.1989−60.74−0.20180.00590.00280.3218−9.8482
0490.690.2010−60.90−0.20230.00550.00380.4086−7.7740
0589.890.1992−59.60−0.19800.00380.00510.5730−4.8369
0689.840.1991−60.25−0.20020.00490.00370.4302−7.3265
0789.340.1980−59.56−0.19790.00450.00490.5212−5.6599
0889.600.1986−60.58−0.20120.00570.00290.3372−9.4422
0991.800.2035−59.61−0.19800.00210.00700.7692−2.2792
1090.840.2013−61.13−0.20310.00600.00380.3877−8.2300
1190.930.2015−59.52−0.19770.00250.00620.7126−2.9430
1290.900.2015−60.58−0.20120.00470.00450.4891−6.2120
1391.150.2020−60.42−0.20070.00420.00490.5384−5.3778
1488.940.1971−60.34−0.20050.00610.00300.3296−9.6402
1589.040.1973−60.58−0.20120.00630.00250.2840−10.9336
1689.060.1974−60.00−0.19930.00540.00380.4130−7.6809
1788.560.1963−61.06−0.20280.00760.00130.1460−16.7129
1891.110.2019−60.90−0.20230.00530.00430.4479−6.9763
1991.370.2025−59.11−0.19640.00130.00730.8488−1.4238
2090.780.2012−60.08−0.19960.00370.00500.5747−4.8111
2190.900.2015−58.66−0.19490.00150.00780.8387−1.5278
2290.080.1996−60.08−0.19960.00440.00430.4942−6.1219
2389.570.1985−61.58−0.20460.00770.00150.1630−15.7562
2488.510.1962−60.66−0.20150.00700.00220.2391−12.4284
2591.300.2023−59.62−0.19810.00240.00630.7241−2.8040
Table 6. Analysis of Mean Relative Closeness and S/N Ratio Range.
C i S / N ( C i )
LevelABCDELevelABCDE
10.50910.60850.52880.46150.33081−6.1501−4.6491−6.5651−6.9471−10.6569
20.48910.44890.50000.47380.39962−6.5876−7.8462−6.5743−7.1381−8.7148
30.47070.36160.43440.57300.48923−7.0213−9.4802−7.6483−6.1469−6.2823
40.48600.51900.59310.46400.57724−7.5210−6.7091−4.9536−7.9929−5.4484
50.49180.50870.39030.47440.64955−7.7277−6.3231−9.2664−6.7826−3.9054
Delta0.03840.24690.20280.11150.3187Delta1.57764.83114.31281.84606.7515
Rank52341Rank52341
OptA1B1C4D3E5OptA1B1C4D3E5
Table 7. Parts forming quality inspection results table.
No.Inspection ItemUnitInspection Method & Technical
Requirement
Specification
1#2#3#
1Length of upper rectangular cavitymmUniversal Measuring Microscope 9 0 + 0.036 9.0149.0169.016
2Width of upper rectangular cavitymmUniversal Measuring Microscope 4.5 0 + 0.03 4.524.514.52
3Diameter of upper cylindrical cavitymmUniversal Measuring Microscope 6.6 0 + 0.09 6.646.636.64
4Length of lower rectangular cavitymmUniversal Measuring Microscope 9 0 + 0.036 9.0129.0139.021
5Width of lower rectangular cavitymmUniversal Measuring Microscope 4.5 0 + 0.03 4.514.514.51
6Diameter of lower cylindrical cavitymmUniversal Measuring Microscope 6.6 0 + 0.09 6.646.626.63
7Surface roughness (Ra) of profiled thin-wall boreμmSurface roughness tester≤1.61.41.41.4
8Overall lengthmmDigital caliper 25.1 0.5 0 25.025.025.0
9Flange heightmmDigital caliper 7.6 0.3 0 7.57.47.5
10Diameter of flange cylindrical surfacemmDigital caliper 17.21 0.2 0 17.0617.0417.06
11Diameter of minor cylindrical surfacemmDigital caliper 14.0 0.2 0 13.913.913.9
Disclaimer/Publisher’s Note: The statements, opinions and data contained in all publications are solely those of the individual author(s) and contributor(s) and not of MDPI and/or the editor(s). MDPI and/or the editor(s) disclaim responsibility for any injury to people or property resulting from any ideas, methods, instructions or products referred to in the content.