Article

PLGA and Mg(OH)2 Composite Coatings on Zinc Alloy for Improving Degradation Resistance and Cell Compatibility

1
Key Laboratory for Anisotropy and Texture of Materials, Education Ministry of China, School of Materials Science and Engineering, Northeastern University, Shenyang 110819, China
2
Technical Center of Ben Gang Group Corporation, Benxi 117000, China
*
Authors to whom correspondence should be addressed.
Metals 2025, 15(11), 1187; https://doi.org/10.3390/met15111187 (registering DOI)
Submission received: 15 September 2025 / Revised: 11 October 2025 / Accepted: 20 October 2025 / Published: 25 October 2025

Abstract

To address the issue of burst release of Zn2+ ions in the early degradation stage of degradable zinc alloys and enhance their cellular activity, a composite coating consisting of PLGA and Mg(OH)2 was prepared on the surface of Zn alloys. The incorporation of Mg(OH)2 serves two purposes: on one hand, it regulates the pH value; on the other hand, it releases Mg2+ ions to improve cytocompatibility. A series of tests, including electrochemical corrosion testing, ion dissolution testing, sample morphology observation, and cytotoxicity testing, was conducted to investigate the morphology, degradation process, ion release, and cytocompatibility of the coating. The results demonstrate that the composite coating can effectively reduce the release of Zn2+ ions, regulate the pH value after coating degradation, and control the release of Mg2+ ions, thereby significantly reducing the toxicity to osteoblasts and improving its biocompatibility.

1. Introduction

Traditional medical orthopedic implant materials are usually made of permanent metal materials, including cobalt alloys, titanium alloys and stainless steels [1]. However, permanent bone implant materials can cause several side effects, including local inflammation, stress corrosion cracking, and the need for secondary surgery, which can cause pain to patients [2]. Currently, the most extensively researched biodegradable medical materials include biodegradable polymer materials, iron alloys, and magnesium alloys. Biodegradable polymer materials exhibit favorable biological activity. However, their mechanical properties fall short of requirements, and their X-ray imaging capabilities are inadequate, impeding precise localization within the patient’s body [3,4]. Ferroalloys exhibit excellent mechanical properties and biological activity. However, their degradation rate is notably slow, and the degradation products are insoluble [5,6,7]. Magnesium alloy possesses outstanding mechanical properties and biocompatibility, with an elastic modulus akin to that of human cortical bone, effectively preventing stress shielding at the implant–bone interface. However, its degradation rate is too fast, and hydrogen gas is also produced during the degradation process, which hinders tissue healing [8,9].
Zinc alloys, as a new generation of biodegradable metal material, offer irreplaceable advantages. The degradation rate of zinc alloys is moderate (0.02–0.2 mm/y), their mechanical properties are excellent, and zinc is a necessary trace element in the human body [10,11,12]. Current research indicates that zinc alloys exhibit good biocompatibility during long-term in vivo implantation experiments [13,14,15,16]. However, the in vitro cytotoxicity of zinc-based alloys is a significant concern. Zn2+ can promote cell growth at low concentrations but becomes toxic to cells at high concentrations. In in vitro cell experiments, zinc alloys frequently exhibited a burst release of Zn2+, which affected cell viability [17,18,19].
Controlling the initial burst release of Zn2+ is important. Surface modification has been performed in many studies. In the past, surface modification of zinc alloys was mainly focused on industrial applications, with less attention to degradation performance and cell compatibility [20]. Currently, surface modification methods for improving the cell compatibility of zinc alloys mainly include chemical deposition, anodizing, and atomic layer deposition. However, these methods did not significantly reduce Zn2+ release [21,22,23]. PLGA has excellent biocompatibility and an adjustable degradation rate. It has been approved for clinical use by the US Food and Drug Administration and the European Medicines Agency [24,25]. Sankalp et al. [26] significantly improved the corrosion resistance and cell adhesion of magnesium alloys by using PLGA coatings. Additionally, many studies have shown that Mg2+ promotes the proliferation and gene expression of osteoblasts [27,28,29]. Kim et al. [30] added Mg2+ to polycarbonate (PCL) scaffolds to promote cell migration on the scaffold.
In this study, we prepared a double-layer PLGA coating on the surface of zinc alloy to control the burst release of Zn2+, and incorporated Mg(OH)2 into PLGA coating to promote osteoblast growth and regulate the pH value during PLGA degradation. The inner PLGA layer had a slow degradation rate and was used for long-term protection of alloys. The outer PLGA/Mg(OH)2 composite layer had a fast degradation rate and quickly released Mg2+ to promote osteoblast growth. We studied the role of the composite coating on the release of Zn2+ and Mg2+ during degradation of the coated zinc alloy and its effect on the activity of osteoblasts.

2. Materials and Methods

2.1. Materials and Specimen Preparation

As-cast Zn (Zn-0.05 wt%Mg-0.5 wt%Mn) alloy bar with a diameter of 10 mm was cut into disks with Φ 10 mm and 2 mm thickness. The samples were first ground with SiC papers with meshes of 400, 800, 1500, and 2000, subsequently, cleaned by ultrasonic in ethanol for 15 min, and then dried.
Ethanol and deionized water are mixed uniformly in a volume ratio of 9:1, and then the KH550 silane coupling agent is added to prepare a 3% solution. The zinc alloy is immersed in this solution for 15 min and then slowly withdrawn, allowing it to dry naturally in the air. Next, a 6% solution of PLGA-1 is prepared by dissolving it in CH2Cl2. The silane coupling agent-treated zinc alloy is immersed in this solution and withdrawn at a speed of 0.5 cm/s, followed by natural drying. The resulting sample is named PL. Subsequently, Mg(OH)2, with a mass ratio of 14% relative to PLGA-1, is added to the above solution, stirred for 5 h to ensure uniform distribution of Mg(OH)2, and the silane coupling agent-treated zinc alloy is again immersed, withdrawn, and dried. The resulting sample is named PMG. Following the same procedure, PLGA-2 is dissolved, and then Mg(OH)2 is added at mass ratios of 8%, 14%, and 20% relative to PLGA-2, respectively. Each mixture is stirred uniformly, and the PMG samples are immersed in it, withdrawn, and dried. The resulting samples are named MG8, MG14, and MG20, respectively. Table 1 lists the main characteristics of each sample.

2.2. Surface Characterization

The surface morphology and the element distribution on the surface during immersion were analyzed by using field emission scanning electron microscopy (FE-SEM, Nova Nano SEM 450, FEI Company, Hillsboro, OR, USA), equipped with energy dispersive spectroscopy (EDS). In order to measure the thickness of the coating, the samples were embedded in epoxy resin, and the cross-sections of the samples were ground and polished for SEM observation. The water contact angle of the sample surface was measured by SL200KS (KINO, Boston, MA, USA). The roughness of the samples was measured by a roughness tester (TR200, Yantai Times Electromechanical Technology Co., Ltd., Yantai, China). The glass transition temperature of the sample coating was measured by differential scanning calorimeter (DSC, DSC404F3, Netzsch-Gerätebau GmbH, Selb, Germany). Smart Lab X-ray diffraction (XRD) was used to analyze the phase composition of the sample surface, with the diffraction angle set in the range of 10° to 90°. Fourier transform infrared (FTIR, Bruker Vertex 70, Brooke Instruments, Karlsruhe, Germany) was used to analyze the functional groups on the surface of the samples. The infrared spectrum was recorded in the scanning range of 4000 cm−1 to 450 cm−1.

2.3. Electrochemical Measurement

Simulated body fluids (SBFs) was prepared by dissolving reagent-grade chemicals, 8 g/L NaCl, 0.4 g/L KCl, 0.14 g/L CaCl2, 0.35 g/L NaHCO3, 0.2 g/L MgSO4·7H2O, 0.12 g/L KH2PO4·H2O and 0.12 g/L Na2HPO4·H2O into deionized water. The samples were immersed in SBF solution at 37 °C for 28 days to test the protective effect of the coating on the samples, and SBF was refreshed every 7 days. The open-circuit potential (OCP), potentiodynamic polarization and electrochemical impedance spectroscopy (EIS) of the sample in SBF at 37 °C were measured by the automatic laboratory corrosion measurement system (Versa STAT 3000, Princeton Applied Research, Oak Ridge, TN, USA). A standard three-electrode was used for the electrochemical test, in which the platinum electrode was used as the counter electrode, the saturated calomel electrode (SCE) was used as the reference electrode, and the sample embedded in epoxy resin with an exposed area of 0.785 cm2 was used as the working electrode. OCP value was recorded for 1 h. The polarization test was performed with a scanning potential range of 0.01 V to 0.15 V VS OCP. Such a low overpotential was used since higher overpotentials may result in the fast hydrogen evolution reaction during cathodic polarization tests, which may destroy the bonding between the polymer coating and alloy matrix. The scanning rate is 1 mV/s. EIS curves were collected in the frequency range of 0.01 Hz to 100 kHz by applying a sinusoidal potential with an amplitude of 10 mV around EOCP at steady state.

2.4. Degradation Measurements

The samples were soaked in SBF, and the bonding between the coating and the substrate was characterized by an ultrasonic scanning microscope (V400E, Kraemer Sonic Industries GmbH, Herborn, Germany), while a pH meter was used to measure the pH change in SBF during the immersion. the ratio of the surface area of the samples to the volume of the liquid was 1.25 cm2/mL, and the temperature was 37 °C.

2.5. In Vitro Biocompatibility Evaluation

All cell experiments were carried out by an indirect contact cell assay according to ISO 10993-12 [31]. To prepare extract, the samples were soaked in 70% alcohol for 2 h and then sterilized under ultraviolet radiation for 24 h. After that, the samples were placed in the complete culture medium at 37 °C in a humidified atmosphere of 5% CO2 for 24 h and 72 h, and then the samples were taken out, and the complete culture medium was filtered with a 0.2 μm sieve. The complete medium consisted of alpha-modified eagle’s medium (MEMα, Gibico, Brooklyn, NY, USA), 10% fetal bovine serum (FBS, Gibico, USA), and 1% penicillin/streptomycin (Gibico, USA). The ratio of the sample surface area to the complete medium volume was 1.25 cm2/mL. The ion concentration in the extract was measured by inductively coupled plasma atomic emission spectroscopy (Optima 5300DV, Waltham, MA, USA).

2.5.1. Cytotoxicity and Cell Proliferation

100 μL of complete culture medium with a cell density of 1 × 10⁴ cells/mL was put into each well of a 96-well cell culture plate. After 24 h of culture in the cell incubator, the culture medium was replaced with the extract. After 1, 3, and 5 days of culture, the extract was replaced with fresh culture medium containing MTT dye. After 4 h incubation, the solution in the culture plate was discarded, 100 μL DMSO was added, and shaken for 10 min, and the absorbance was measured with an enzyme-labeled instrument (Bio-RAD 680, Bio-Rad, Hercules, CA, USA) at 570 nm.

2.5.2. Fluorescence Staining

After 4 h and 24 h incubation, MC3T3-E1 cells were washed with PBS, fixed with 4% paraformaldehyde (PFA) solution for 20 min, and 0.5% Triton X-100 (Amresco, Newburgh, NY, USA) was added to destroy the cell permeability for 5 min. Then, phalloidin was added and incubated in a dark environment for 30 min. Then, the cells were stained with DAPI (4,6-diamino-2-phenylindole) for 2 min, and the images were observed under a fluorescence microscope after the anti-fluorescence quenching solution was dripped.

2.5.3. Live/Dead Cell Staining

MC3T3-E1 cells were cultured for 1, 3, and 5 days, washed with PBS, then 250 μL dye was added, and cultured at 37 °C for 30 min. Calcein AM and propidium iodide were used for staining, and the concentration of detection buffer was 0.1%. After adding the anti-fluorescence quenching solution, the images were observed under a fluorescence microscope.

3. Results

3.1. Surface Characterization

Figure 1 shows the surface morphology of different samples. The surface of the PL sample was very flat, and there were white particles attached to the PLGA coating on the surface of the other samples. The number of particles increased with the increasing addition of Mg(OH)2. According to EDS results in Table 2, the contents of Mg and O in the particles were much higher than those in the PLGA coating.
Figure 2 shows the SEM images of the cross-sections and EDS line scanning of different samples. It can be seen that the thickness of the single-layer PLGA coating on PL sample was about 4 μm, and that of the double-layer PLGA coating on MG8, MG14, and MG20 was close to 8 μm, and the thickness of the coating increased slightly with the increase in Mg(OH)2 addition. The coating mainly contained C and O, and the Mg element was also detected in the Mg(OH)2-containing coatings. Although the distribution of Mg(OH)2 is relatively homogeneous throughout the coating, there may still exist some clusters of Mg(OH)2, which results in the observed low amount of C in the MG8 specimen.
Figure 3a shows XRD patterns of the samples. The diffraction peaks of Zn were detected in all samples, and Mg(OH)2 was detected in Mg(OH)2-containing coatings.
Figure 3b shows FTIR spectra of the coatings. There was an inconspicuous characteristic absorption peak at 3689 cm−1 due to the stretching vibration of Mg-OH [32], and the broad peak observed at 3446 cm−1 was attributed to the stretching vibration of O-H [33]. The absorption peaks at 2995 cm−1 and 2963 cm−1 were caused by CH2 and CH3, respectively. The absorption peaks at 1752 cm−1 and 1185 cm−1 were caused by C=O and C-O bonds.
Figure 3c shows the water contact angle of the samples. The water contact angle of Zn was about 57°, and that of the coated samples was close to 80°. The PLGA coating increased the water contact angle, but the addition of Mg(OH)2 did not change the water contact angle.
Figure 3d shows the roughness of the samples. The roughness of the PL sample was lower than that of the Zn sample, but the roughness of the PMG sample was higher than that of Zn sample, and the roughness of the double-layer coated samples was much higher. The roughness increased with the increase in Mg(OH)2 content.
Figure 3e shows the DSC curves of the sample coatings. It can be seen that the glass transition temperature of PLGA1 was higher than that of PLGA2. After adding Mg(OH)2, the glass transition temperature of the coating decreased, and the decreasing range increased with the increase in Mg(OH)2 content. The aforementioned results demonstrate that varying amounts of Mg(OH)2 were incorporated into the PLGA coating.

3.2. Electrochemical Measurement

Figure 4 shows the electrochemical performance of the samples. The open-circuit potential of the Zn sample initially increased, then decreased, and finally stabilized at a relatively high value. The open-circuit potential of the coated samples first decreased and then increased slightly. In Figure 4b, the corrosion current density (icorr) of the samples with coating decreased significantly, and the icorr of the samples with double-layer coating was lower than that of the samples with single-layer coating. In Figure 4c, the capacitance arc diameter of the samples with coatings was larger than that of the Zn sample, and the capacitance arc diameter of the samples with double-layer coating was larger than that of the single-layer coating. Among the double-layer coating samples, the capacitance arc diameter increased with the increasing content of Mg(OH)2.
Figure 5 shows the potentiodynamic polarization curves of samples after immersion for different durations. The corrosion current density of the samples with a single-layer coating was higher than that of Zn at 7 and 14 days. For the samples with a double-layer coating, the corrosion current density was lower than that of Zn, except on the 14th day.
Figure 6 shows Nyquist plots of the samples immersed in SBF for different durations. The capacitance arc diameter of the samples with single-layer coating decreased rapidly, and after 7 days of immersion, the capacitance arc diameter was smaller than that of the Zn sample. In contrast, the capacitance arc diameter of the samples with double-layer coating remained consistently larger than that of the Zn sample throughout the whole immersion process.
Figure 7 shows the changes in the electrochemical performance of the samples during immersion. The corrosion current density of the samples with double-layer coatings was lower than that of the Zn sample, especially during the first 7 days. The corrosion current density of the samples with single-layer coatings was slightly higher than that of Zn sample on the 7th and 14th days. The impedance modulus of the samples with double-layer coatings decreased significantly within the first 3 days but remained higher than that of the Zn sample throughout the immersion process. In contrast, the impedance modulus of the single-layer coated samples did not consistently stay higher than that of the Zn sample. When the immersion time increased from 21 days to 28 days, a sudden increase in corrosion resistance was observed for the composite coating samples. It could be because corrosion products formed with the increase in immersion time, and the corrosion products sealed the holes of the composite coating. The above results indicate that the electrochemical performance of the coated samples was better than the Zn sample, and the protective effect of the double-layer coatings was better than that of the single-layer coatings.

3.3. Degradation Measurements

Figure 8 shows the microstructure of the samples after immersion. After immersion, no change was observed on the surfaces of PL and MG8 samples. On PM sample, Mg(OH)2 partially dissolved, and a few holes were left on the surface. On MG14 and MG20 samples, pits formed on the site of Mg(OH)2, but no holes were generated, while there were more pits and less Mg(OH)2 on the surface of the MG20 sample compared to the MG14 sample. After 3 days of immersion, holes appeared on the surface of the PL sample, and most of the Mg(OH)2 on the surface of the other samples had dissolved. With the increase in Mg(OH)2 content, more and larger pits formed on the surface of the samples with double-layer coating. After 28 days of immersion, more and larger holes were formed on the surfaces of PL and PM samples compared to the third day, but the holes on the PL sample were unevenly distributed. The outer coating of the MG8 sample had partially degraded, forming large holes. Most of the outer coating on the surface of MG14 sample had degraded, and the outer coating on the surface of MG20 sample had almost completely degraded, leaving only some residues on the surface. The pits on the coating could be formed due to two reasons. The first one is that the Mg(OH)2 particles dissolved in the solution directly. The second one is that the Mg(OH)2 particles detached from the coating because of loss of attachment from the PLGA, which undergoes hydrolysis during immersion. In a word, the added Mg(OH)2 resulted in more defects in the coating, which accelerated the degradation of coatings.
Figure 9 illustrates pH changes in SBF with different samples. The pH of the SBF containing Zn and PL samples initially increased, stabilizing at 8.5 and 8.3, respectively. In contrast, for the PM sample and those with double-layer coatings, the pH initially increased, then decreased, and finally stabilized at 7.9 and 7.4, respectively.
Figure 10a presents ultrasound scanning images of the samples immersed for different durations. Before immersion, the ultrasound image of the samples with single-layer coatings showed no shadows, indicating no significant defects or irregularities, as the brightness of the image corresponds to the intensity of the received sound waves. In contrast, the samples with double-layer coatings displayed shadows, with the shadow area increasing as the Mg(OH)2 content increased.
After 1 day of immersion, shadows appeared in the ultrasound images of the single-layer coated samples, while the shadow area of the PM sample was slightly larger than that of the PL sample. The shadow areas in the images of the double-layer coated samples also grew larger.
After 3 days of immersion, the shadow areas in the ultrasound images had further expanded across all samples. Notably, almost the whole surface of the double-layer coated samples was covered with shadows, except for the MG8 sample, which showed fewer shadows.
Figure 10b shows the sound wave diagrams of the samples. At point 1, the waveform indicated no attenuation of the sound wave, suggesting the absence of gas or significant defects, as sound waves typically attenuate when passing through gas. Moving to point 2, a noticeable attenuation in the sound occurred, signifying the presence of minor defects. This attenuation became more pronounced at point 3, suggesting further deterioration of the coating, possibly due to increased defects or gas accumulation. The above results indicate that the addition of Mg(OH)2 increased the internal defects of the coating and accelerated the degradation of the coating.

3.4. In Vitro Biocompatibility Evaluation

Figure 11a shows ion concentration of the 1-day extracts. After 1 day of extraction, the Zn2+ concentration released from the Zn sample was about 6.3 μg/mL. The single-layer PL coating significantly reduced Zn2+ concentration to about 2 μg/mL, while the double-layer further reduced it to about 1 μg/mL. Zn2+ concentration decreased slightly with the increase in Mg(OH)2 content. The Mg2+ concentration in the initial medium was about 22 μg/mL. The Mg(OH)2-containing single-layer (PMG sample) increased Mg2+ concentration to 27 μg/mL, while the double-layer containing coating significantly increased Mg2+ concentration to about 40 μg/mL. In addition, the Mg2+ concentration increased with the increase in Mg(OH)2 content in the coating.
The OD values of MC3T3-E1 cells cultured in the 1 day extract are presented in Figure 11b. For cells cultured in the 1-day extracts, the OD value of the Zn sample decreased over time, whereas the OD values of the coated samples increased and were significantly higher than those of the Zn sample. After 5 days of culture, the OD values of the double-layer coated samples and PM samples were significantly higher than those of the PL sample.
The cell viability of MC3T3-E1 cultured in the 1 day extract is shown in Figure 11c. In the 1-day extract, the cell viability of the Zn sample dropped below 50% after 1 day of culture and declined sharply over time. The cell viability of the PL samples also decreased over time, but it remained above 75%. The PM samples showed an increase in cell viability over time, and after 5 days of culture, their viability was significantly higher than that of the PL sample, reaching 87%. Samples with double-layer coatings maintained high cell viability throughout the culture period, exceeding 90%.
Figure 12 shows the morphology of MC3T3-E1 cells cultured in the extract. After 4 h of culture, there was no obvious difference in the cell morphology among the samples, and cells were all round in shape. After 24 h of culture, cells in the coated samples spread from round to spindle shape, and obvious pseudopodia were seen. However, the cells in the Zn sample extract were abnormal, with some cells still round, and the spreading area was much smaller than that of the coated samples.
Figure 13 shows images of live–dead MC3T3E1 cells after 1 day of cultivation. After 1 day of culture, the number of living cells on the Zn sample was less than that on the coated samples, but the number of dead cells was much higher than that on the coated samples. The number of dead cells on the samples with single-layer coating was slightly higher than that on the samples with double-layer coating.
Figure 14 shows images of live–dead MC3T3E1 cells after 3 days of cultivation. After 3 days of culture, the number of living cells on the Zn sample further decreased, while the number of dead cells increased. In contrast, the coated samples showed an increase in the number of living cells. Although the number of dead cells on the single-layer coated samples increased slightly, the number of dead cells on the double-layer coated samples remained relatively unchanged.
Figure 15 shows images of live–dead MC3T3E1 cells after 5 days of cultivation. After 5 days of culture, very few living cells remained in the Zn sample. On the coated samples, the number of both living and dead cells increased, while the double-layer coated samples continued to show fewer dead cells compared to the single-layer coated samples. The above results indicate that the coating inhibited the release of Zn2+, and the samples with double-layer coatings exhibited better cell compatibility than those with single-layer coatings, and the Mg2+ released from the coating promoted the growth of MC3T3-E1 cells.

4. Discussion

4.1. Surface Properties

In this study, we successfully incorporated the Mg(OH)2 compound into PLGA coating (Figure 1). The Mg(OH)2 compound was uniformly dispersed throughout the coating without altering the chemical bonds between Mg(OH)2 and PLGA, indicating no chemical reaction occurred between the two materials. The addition of Mg(OH)2 did not affect the hydrophilicity of PLGA coating, but it increased the surface roughness and defects and lowered the glass transition temperature of PLGA (Figure 3). This reduction in the glass transition temperature, attributed to Mg(OH)2’s role as a plasticizer, weakened the molecular segment interactions within PLGA [34]. Since the glass transition temperature was an indicator of the PLGA degradation rate [35], the increased Mg(OH)2 content in the coating accelerated the degradation process.

4.2. Protection and Degradation of Coatings

During the initial days (first 3 days), zinc alloys degrade rapidly due to direct exposure of their bare surfaces to body fluids, lacking a protective layer of corrosion products [36]. The anodic reaction involves zinc metal losing electrons to form zinc ions, while the cathodic reaction primarily consists of oxygen reduction to hydroxide ions. Given the abundant presence of phosphate, carbonate, and calcium ions in physiological environments, zinc ions progressively combine with hydroxide to form zinc hydroxide [36]. Simultaneously, they react with phosphate, carbonate, and calcium ions to precipitate complex compounds such as zinc phosphate, calcium zinc phosphate, and calcium carbonate [37]. The accumulation of these corrosion products substantially reduces the degradation rate of zinc alloys. Coatings composed of PLGA or PLGA/magnesium hydroxide composites significantly suppress the initial corrosion rate (Figure 7). As these coatings gradually degrade over time, the underlying alloy becomes increasingly exposed to corrosive solutions, leading to accelerated corrosion. Concurrently, corrosion products generated from the zinc alloy substrate impede further penetration of corrosive fluids, thereby providing partial protection. The significantly improved corrosion resistance was obtained for the composite coating after 7 days of immersion. After 7 days, the formation of corrosion product film could further inhibit the release of Zn2+ ions, which could solve the problem of the fast release of Zn2+ ions. For the composite coating samples, the corrosion current density is about half of that of bare Zn samples even after 28 days of immersion, which shows relatively long-term protective ability. The interplay of these factors results in a near-constant corrosion rate for PLGA-coated samples beyond the initial phase, maintaining degradation levels consistently lower than those of uncoated Zn alloy substrates (Figure 7).
The degradation product of Zn alloys, Zn(OH)2, tends to increase the pH value of the solution [38]. In contrast, the degradation of PLGA coatings generates carbonic acid, which has the effect of lowering the pH. Additionally, the release of Mg(OH)2 from the coatings contributes to an increase in pH. For both Zn alloy samples and single-layer PLGA-coated samples, the pH-increasing effect of Zn(OH)2, a degradation product of Zn alloys, takes a dominant role, leading to an elevation in the solution’s pH (Figure 9). When the pH exceeded 8.6, it became toxic to cells [39]. However, for PLGA composite coating samples containing Mg(OH)2, although the release of Mg(OH)2 promotes a rise in pH, the presence of Mg(OH)2 simultaneously accelerates the degradation of PLGA. Consequently, the overall pH of the solution only shows a slight increase and is even lower than that of the bare Zn alloy samples (Figure 9).

4.3. Biocompatibility

The biocompatibility of degradable Zn alloys mainly depends on the release rate of Zn ions during degradation. The release of a small amount of Zn ions can promote osteogenesis; however, excessive release of Zn ions can induce cytotoxicity [40]. For MC3T3-E1 cells, studies have shown that when the concentration of Zn ions is greater than 19.5 μg/mL, it significantly inhibits cell viability [41]. When Zn ions are in the low concentration range (1.76–12.1 μg/mL), they can enhance cell viability and promote cell growth [42]. Magnesium ions have good biocompatibility in the human body and are one of the essential macronutrients for the human body. The human body has a high tolerance for Mg ions; when the concentration of Mg ions does not exceed 198 mg/L, no biological toxicity is induced [43]. Moreover, Mg ions have a significant ability to promote osteogenesis; when the concentration of Mg ions is greater than 156 mg/L, they can significantly promote the growth of MC3T3-E1 osteoblasts [44].
The initial release concentration of Zn ions from bare zinc alloy is relatively high, reaching 6.3 μg/mL in the extract solution, showing a significant inhibitory effect on cell viability, which is consistent with numerous literature reports [20]. However, the PLGA and Mg(OH)2 composite coating not only significantly reduces the release concentration of Zn ions but also releases a large amount of Mg ions. As a result, the cell viability of the samples with PLGA and Mg(OH)2 composite coating is greatly improved (Figure 11). The morphology of cells (Figure 12) and the reduced number of cell deaths (Figure 13, Figure 14 and Figure 15) were markedly better in the coated samples compared to the uncoated Zn sample. This is the combined result of the reduced concentration of Zn ions in the extract solution and the release of Mg ions. The functional effect on cytocompatibility of the composite coating is expected to be maintained as long as possible. However, the other properties, such as corrosion resistance, of the coating must be considered as well. The present work is only a preliminary attempt, and long-term cytocompatibility will be studied in the future. Furthermore, the in vivo evaluation is necessary and essential to assess the realistic applicability of the composite coating in future work.

5. Conclusions

In this study, PLGA + Mg(OH)2 composite coatings were developed on Zn alloys for biomedical applications. The degradation process and relative impact on the cell compatibility of Zn alloys were investigated. The key conclusions are as follows:
(1)
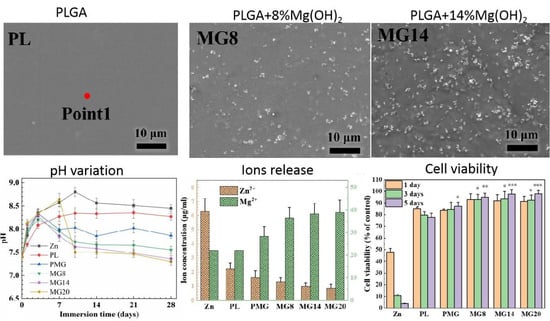
The PLGA + Mg(OH)2 composite coating significantly enhanced the corrosion resistance of Zn alloy, effectively suppressing the rapid release of Zn2+.
(2)
Adding Mg(OH)2 to the PLGA coating increases the number of defects in the coating and reduces its glass transition temperature. Both of these effects accelerate the degradation of the coating as well as the release of Mg(OH)2. As a result, the acidification effect caused by PLGA degradation and the alkalinization effect from Mg(OH)2 release counteract each other, leading to a neutral pH in the degradation product solution.
(3)
The synergistic effect of reduced Zn ion release and increased Mg ion release improved the cytocompatibility of osteoblasts.

Author Contributions

Conceptualization, Q.J., H.X., L.Y., Y.Z. and E.Z.; Methodology, Q.J., H.X., L.Y., Y.Z., C.S. and E.Z.; Validation, Q.J., H.X., Y.Z., C.S. and E.Z.; Formal analysis, H.X., Y.Z., C.S., M.Z. and E.Z.; Investigation, Q.J., H.X., C.S., M.Z. and E.Z.; Resources, E.Z.; Writing—original draft, Q.J. and H.X.; Writing—review and editing, L.Y., Y.Z., C.S., M.Z. and E.Z.; Supervision, L.Y. and E.Z.; Project administration, E.Z.; Funding acquisition, L.Y. and E.Z. All authors have read and agreed to the published version of the manuscript.

Funding

The authors would like to acknowledge the financial support from the National Key Research and Development Program of China (No. 2023YFB3812903).

Data Availability Statement

The original contributions presented in this study are included in the article. Further inquiries can be directed to the corresponding authors.

Conflicts of Interest

The author Mrs. Chang Shi and Mr. Ming Zhang were employed by the company Technical Center of Ben Gang Group Corporation. The remaining authors declare that the research was conducted in the absence of any commercial or financial relationships that could be construed as a potential conflict of interest.

References

  1. Staiger, M.P.; Pietak, A.M.; Huadmai, J.; Dias, G. Magnesium and its alloys as orthopedic biomaterials: A review. Biomaterials 2006, 27, 1728–1734. [Google Scholar] [CrossRef] [PubMed]
  2. Cockerill, I.; Su, Y.; Sinha, S.; Qin, Y.-X.; Zheng, Y.; Young, M.L.; Zhu, D. Porous zinc scaffolds for bone tissue engineering applications: A novel additive manufacturing and casting approach. Mater. Sci. Eng. C 2020, 110, 110738. [Google Scholar] [CrossRef]
  3. Rahim, M.I.; Ullah, S.; Mueller, P.P. Advances and Challenges of Biodegradable Implant Materials with a Focus on Magnesium-Alloys and Bacterial Infections. Metals 2018, 8, 532. [Google Scholar] [CrossRef]
  4. Guo, H.; Xia, D.; Zheng, Y.; Zhu, Y.; Liu, Y.; Zhou, Y. A pure zinc membrane with degradability and osteogenesis promotion for guided bone regeneration: In vitro and in vivo studies. Acta Biomater. 2020, 106, 396–409. [Google Scholar] [CrossRef]
  5. Peuster, M.; Wohlsein, P.; Brügmann, M.; Ehlerding, M.; Seidler, K.; Fink, C.; Brauer, H.; Fischer, A.; Hausdorf, G. A novel approach to temporary stenting: Degradable cardiovascular stents produced from corrodible metal—Results 6–18 months after implantation into New Zealand white rabbits. Heart 2001, 86, 563–569. [Google Scholar] [CrossRef] [PubMed]
  6. Peuster, M.; Hesse, C.; SChloo, T.; Fink, C.; Beerbaum, P.; Schnakenburg, C. Long-term biocompatibility of a corrodible peripheral iron stent in the porcine descending aorta. Biomaterials 2006, 27, 4955–4962. [Google Scholar] [CrossRef]
  7. Kraus, T.; Moszner, F.; Fischerauer, S.; Fiedler, M.; Martinelli, E.; Eichler, J.; Witte, F.; Willbold, E.; Schinhammer, M.; Meischel, M.; et al. Biodegradable Fe-based alloys for use in osteosynthesis: Outcome of an in vivo study after 52 weeks. Acta Biomater. 2014, 10, 3346–3353. [Google Scholar] [CrossRef]
  8. Chakraborti, S.; Chakraborti, T.; Mandal, M.; Mandal, A.; Das, S.; Ghosh, S. Protective role of magnesium in cardiovascular diseases: A review. Mol. Cell. Biochem. 2002, 238, 163–179. [Google Scholar] [CrossRef] [PubMed]
  9. Wong, H.M.; Yeung, K.W.K.; Lam, K.O.; Tam, V.; Chu, P.K.; Luk, K.D.K.; Cheung, K.M.C. A biodegradable polymer-based coating to control the performance of magnesium alloy orthopaedic implants. Biomaterials 2010, 31, 2084–2096. [Google Scholar] [CrossRef]
  10. Pan, X.; Ou, M.; Lu, Y.; Nie, Q.; Dai, X.; Liu, O. Immunomodulatory zinc-based materials for tissue regeneration. Biomater. Adv. 2023, 152, 213503. [Google Scholar] [CrossRef]
  11. Mostaed, E.; Sikora-Jasinska, M.; Drelich, W.; Vedani, M. Zinc-based alloys for degradable vascular stent applications. Acta Biomater. 2018, 71, 1–23. [Google Scholar] [CrossRef] [PubMed]
  12. Su, Y.; Cockerill, I.; Wang, Y.; Qin, Y.-X.; Chang, L.; Zheng, Y.; Zhu, D. Zinc-Based Biomaterials for Regeneration and Therapy. Trends Biotechnol. 2019, 37, 428–441. [Google Scholar]
  13. Jia, B.; Yang, H.; Han, Y.; Zhang, Z.; Qu, X.; Zhuang, Y.; Wu, Q.; Zheng, Y.; Dai, K. In vitro and in vivo studies of Zn-Mn biodegradable metals designed for orthopedic applications. Acta Biomater. 2020, 108, 358–372. [Google Scholar] [CrossRef] [PubMed]
  14. Xiao, C.; Shi, X.Y.; Yu, W.T.; Wei, X.W.; Cheng, L.L.; Qiu, X.; Li, B.R.; Fan, D.C.; Li, J.L.; Zhang, X.Z.; et al. In vivo biocompatibility evaluation of Zn-0.05Mg-(0, 0.5, 1wt%) Ag implants in New Zealand rabbits. Mater. Sci. Eng. C 2021, 119, 111435. [Google Scholar] [CrossRef] [PubMed]
  15. Kafri, A.; Ovadia, S.; Yosafovich-Doitch, G.; Aghion, E. In vivo performances of pure Zn and Zn–Fe alloy as biodegradable implants. J. Mater. Sci. Mater. Med. 2018, 29, 94. [Google Scholar] [CrossRef]
  16. Zhou, C.; Li, H.-F.; Yin, Y.-X.; Shi, Z.-Z.; Li, T.; Feng, X.-Y.; Zhang, J.-W.; Song, C.-X.; Cui, X.-S.; Xu, K.-L.; et al. Long-term in vivo study of biodegradable Zn-Cu stent: A 2-year implantation evaluation in porcine coronary artery. Acta Biomater. 2019, 97, 657–670. [Google Scholar] [CrossRef]
  17. Ma, J.; Zhao, N.; Zhu, D. Endothelial Cellular Responses to Biodegradable Metal Zinc. ACS Biomater. Sci. Eng. 2015, 1, 1174–1182. [Google Scholar] [CrossRef]
  18. Ma, J.; Zhao, N.; Zhu, D. Bioabsorbable zinc ion induced biphasic cellular responses in vascular smooth muscle cells. Sci. Rep. 2016, 6, 26661. [Google Scholar] [CrossRef]
  19. Brauer, D.S.; Gentleman, E.; Farrar, D.F.; Stevens, M.M.; Hill, R.G. Benefits and drawbacks of zinc in glass ionomer bone cements. Biomed. Mater. 2011, 6, 045007. [Google Scholar] [CrossRef]
  20. Yuan, W.; Xia, D.; Wu, S.; Zheng, Y.; Guan, Z.; Rau, J.V. A review on current research status of the surface modification of Zn-based biodegradable metals. Bioact. Mater. 2022, 7, 192–216. [Google Scholar] [CrossRef]
  21. Zhuang, Y.; Liu, Q.; Jia, G.; Li, H.; Yuan, G.; Yu, H. A Biomimetic Zinc Alloy Scaffold Coated with Brushite for Enhanced Cranial Bone Regeneration. ACS Biomater. Sci. Eng. 2021, 7, 893–903. [Google Scholar] [CrossRef]
  22. Dong, H.; Zhou, J.; Virtanen, S. Fabrication of ZnO nanotube layer on Zn and evaluation of corrosion behavior and bioactivity in view of biodegradable applications. Appl. Surf. Sci. 2019, 494, 259–265. [Google Scholar] [CrossRef]
  23. Yuan, W.; Xia, D.; Zheng, Y.; Liu, X.; Wu, S.; Li, B.; Han, Y.; Jia, Z.; Zhu, D.; Ruan, L.; et al. Controllable biodegradation and enhanced osseointegration of ZrO2-nanofilm coated Zn-Li alloy: In vitro and in vivo studies. Acta Biomater. 2020, 105, 290–303. [Google Scholar] [CrossRef]
  24. Hu, X.-F.; Feng, Y.-F.; Xiang, G.; Lei, W.; Wang, L. Lactic acid of PLGA coating promotes angiogenesis on the interface between porous titanium and diabetic bone. J. Mater. Chem. B 2018, 6, 2274–2288. [Google Scholar] [CrossRef] [PubMed]
  25. Silva, A.T.C.R.; Cardoso, B.C.O.; Silva, M.; Freitas, R.; Sousa, R. Synthesis, Characterization, and Study of PLGA Copolymer in Vitro Degradation. J. Biomater. Nanobiotechnol. 2015, 6, 8. [Google Scholar] [CrossRef]
  26. Agarwal s Morshed, M.; Labour, M.-N.; Hoey, D.; Duffy, B.; Curtinb, J.; Jaiswal, S. Enhanced corrosion protection and biocompatibility of a PLGA–silane coating on AZ31 Mg alloy for orthopaedic applications. RSC Adv. 2016, 6, 113871–113883. [Google Scholar] [CrossRef]
  27. Choi, S.; Kim, K.-J.; Cheon, S.; Kim, E.-M.; Kim, Y.-A.; Park, C.; Kim, K. Biochemical activity of magnesium ions on human osteoblast migration. Biochem. Biophys. Res. Commun. 2020, 531, 588–594. [Google Scholar] [CrossRef]
  28. He, L.Y.; Zhang, X.M.; Liu, B.; Tian, Y.; Ma, W.H. Effect of magnesium ion on human osteoblast activity. Braz. Ournal Med. Biol. Res. 2016, 49, e5257. [Google Scholar] [CrossRef]
  29. Nie, X.; Sun, X.; Wang, C.; Yang, J. Effect of magnesium ions/Type I collagen promote the biological behavior of osteoblasts and its mechanism. Regen. Biomater. 2020, 7, 53–61. [Google Scholar] [CrossRef]
  30. Kim, K.-J.; Choi, S.; Sang, C.Y.; Yang, S.-J.; Cho, Y.-S.; Kim, K. Magnesium ions enhance infiltration of osteoblasts in scaffolds via increasing cell motility. J. Mater. Sci. Mater. Med. 2017, 28, 96. [Google Scholar] [CrossRef]
  31. ISO 10993-12; Biological Evaluation of Medical Devices—Part 12: Sample Preparation and Reference Materials. International Organization for Standardization: Geneva, Switzerland, 2025.
  32. Zhu, Y.; Wu, G.; Zhang, Y.-H.; Zhao, Q. Growth and characterization of Mg(OH)2 film on magnesium alloy AZ31. Appl. Surf. Sci. 2011, 257, 6129–6137. [Google Scholar] [CrossRef]
  33. Yousefi, S.; Ghasemi, B.; Nikolova, M.P. Opto-structural characterization of Mg(OH)2 and MgO nanostructures synthesized through a template-free sonochemical method. Appl. Phys. A 2021, 127, 549. [Google Scholar] [CrossRef]
  34. Liu, G.; Mcennis, K. Glass Transition Temperature of PLGA Particles and the Influence on Drug Delivery Applications. Polymers 2022, 14, 993. [Google Scholar] [CrossRef]
  35. Klose, D.; Siepmann, F.; Elkharraz, K.; Krenzlin, S.; Siepmann, J. How porosity and size affect the drug release mechanisms from PLGA-based microparticles. Int. J. Pharm. 2006, 314, 198–206. [Google Scholar] [CrossRef]
  36. Su, Y.; Yang, H.; Gao, J.; Qin, Y.X.; Zheng, Y.; Zhu, D. Interfacial Zinc Phosphate is the Key to Controlling Biocompatibility of Metallic Zinc Implants. Adv. Sci. 2019, 6, 1900112. [Google Scholar] [CrossRef] [PubMed]
  37. Yang, H.; Wang, C.; Liu, C.; Chen, H.; Wu, Y.; Han, J.; Jia, Z.; Lin, W.; Zhang, D.; Li, W.; et al. Evolution of the degradation mechanism of pure zinc stent in the one-year study of rabbit abdominal aorta model. Biomaterials 2017, 145, 92–105. [Google Scholar] [CrossRef]
  38. Yuan, W.; Li, B.; Chen, D.; Zhu, D.; Han, Y.; Zheng, Y. Formation Mechanism, Corrosion Behavior, and Cytocompatibility of Microarc Oxidation Coating on Absorbable High-Purity Zinc. ACS Biomater. Sci. Eng. 2019, 5, 487–497. [Google Scholar] [CrossRef]
  39. Mostofi, S.; Rad, E.B.; Wiltsche, H.; Fasching, U.; Szakacs, G.; Ramskogler, C.; Srinivasaiah, S.; Ueçal, M.; Willumeit, R.; Weinberg, A.-M.; et al. Effects of Corroded and Non-Corroded Biodegradable Mg and Mg Alloys on Viability, Morphology and Differentiation of MC3T3-E1 Cells Elicited by Direct Cell/Material Interaction. PLoS ONE 2016, 11, e0159879. [Google Scholar] [CrossRef] [PubMed]
  40. Su, Y.; Wang, K.; Gao, J.; Yang, Y.; Qin, Y.-X.; Zheng, Y.; Zhu, D. Enhanced cytocompatibility and antibacterial property of zinc phosphate coating on biodegradable zinc materials. Acta Biomater. 2019, 98, 174–185. [Google Scholar] [CrossRef]
  41. Qian, J.; Zhang, W.; Chen, Y.; Zeng, P.; Wang, J.; Zhou, C.; Zeng, H.; Sang, H.; Huang, N.; Zhang, H.; et al. Osteogenic and angiogenic bioactive collagen entrapped calcium/zinc phosphates coating on biodegradable Zn for orthopedic implant applications. Biomater. Adv. 2022, 136, 212792. [Google Scholar] [CrossRef] [PubMed]
  42. Yang, H.; Qu, X.; Lin, W.; Chen, D.; Zhu, D.; Dai, K.; Zheng, Y. Enhanced Osseointegration of Zn-Mg Composites by Tuning the Release of Zn Ions with Sacrificial Mg-Rich Anode Design. ACS Biomater. Sci. Eng. 2019, 5, 453–467. [Google Scholar] [CrossRef] [PubMed]
  43. Li, X.; Hu, J.; Yu, Z.; Liu, M.; Xiao, X.; Qin, G.; Yang, L.; Zhang, E. A study on the in vitro and in vivo degradation behaviour and biocompatibility of a Mg-Mn-Zn alloy with PLLA and Micro arc oxidation composite coating. Surf. Coat. Technol. 2023, 471, 129894. [Google Scholar]
  44. Gao, J.C.; Qiao, L.Y.; Xin, R.L. Effect of Mg2+ concentration on biocompatibility of pure magnesium. Front. Mater. Sci. China 2010, 4, 126–131. [Google Scholar] [CrossRef]
Figure 1. SEM images of the surface features of different samples.
Metals 15 01187 g001
Figure 2. SEM images of the cross-sections and EDS line scanning of different samples.
Metals 15 01187 g002
Figure 3. XRD patterns (a), FTIR spectra (b), water contact angles (c), roughness (d), and DSC curves (e) of the samples.
Metals 15 01187 g003
Figure 4. The open-circuit potential (a), potentiodynamic polarization curves (b), and Nyquist plots (c) of the samples after initial immersion for 1 h.
Metals 15 01187 g004
Figure 5. Potentiodynamic polarization curves of samples immersed in SBF for different durations.
Metals 15 01187 g005
Figure 6. Nyquist plots of samples immersed in SBF.
Metals 15 01187 g006
Figure 7. Variation curve of corrosion current density (a) and resistance modulus (b).
Metals 15 01187 g007
Figure 8. SEM images of samples immersed for different durations.
Metals 15 01187 g008
Figure 9. Changes in pH value of SBF with different samples during the immersion process.
Metals 15 01187 g009
Figure 10. The ultrasound scanning image of samples immersed for different times (a). Sonic wave diagram at typical locations (b).
Metals 15 01187 g010
Figure 11. Ion concentration of the 1-day extracts (a). OD values of MC3T3-E1 cultured in the 1 day extracts (b) for 1 day, 3 days, and 5 days. Cell viability of MC3T3-E1 cultured in the 1 day extracts (c) for 1 day, 3 days, and 5 days. * p < 0.05, ** p < 0.01, *** p < 0.001 vs. PL.
Metals 15 01187 g011
Figure 12. Images of MC3T3-E1 cells stained by phalloidin/DAPI after cultivation for 4 h and 24 h.
Metals 15 01187 g012
Figure 13. Images of live–dead MC3T3E1 cells after cultivation for 1 day.
Metals 15 01187 g013
Figure 14. Images of live–dead MC3T3E1 cells after cultivation for 3 days.
Metals 15 01187 g014
Figure 15. Images of live–dead MC3T3E1 cells after cultivation for 5 days.
Metals 15 01187 g015
Table 1. Main characterization of samples (the content of Mg(OH)2 is the mass fraction of PLGA).
Sample NameMain Charcterization
ZnZn-0.05Mg-0.5Mn
PLGA1480,000 molecular weight PLGA (75/25)
PLGA2100,000 molecular weight PLGA (50/50)
PLSingle coating; (PLGA1; No Mg(OH)2)
PMGSingle coating; (PLGA1 + 14% Mg(OH)2)
MG8Double coatings; The inner layer: PLGA1+ 14% Mg(OH)2;
The outer layer: PLGA2 + 8% Mg(OH)2
MG14Double coatings; The inner layer: PLGA1+ 14% Mg(OH)2;
The outer layer: PLGA2 + 14% Mg(OH)2
MG20Double coatings; The inner layer: PLGA1+ 14% Mg(OH)2;
The outer layer: PLGA2 + 20% Mg(OH)2
Table 2. EDS analysis results at point 1 and point 2 in Figure 1 (mass%). The “-” means “not detected”.
PositionCOMg
Point 168.7731.23-
Point 233.2247.5919.18
Disclaimer/Publisher’s Note: The statements, opinions and data contained in all publications are solely those of the individual author(s) and contributor(s) and not of MDPI and/or the editor(s). MDPI and/or the editor(s) disclaim responsibility for any injury to people or property resulting from any ideas, methods, instructions or products referred to in the content.

