Article

Microstructure and Properties of Gas-Nitrided Ti-6Al-4V Alloy

1
School of Mechanical Engineering, University of Shanghai for Science and Technology, Shanghai 200093, China
2
Shanghai Engineering Research Center of Hot Manufacturing, Shanghai Dianji University, Shanghai 201306, China
3
School of Materials and Chemistry, University of Shanghai for Science and Technology, Shanghai 200093, China
*
Authors to whom correspondence should be addressed.
Metals 2025, 15(11), 1185; https://doi.org/10.3390/met15111185 (registering DOI)
Submission received: 24 September 2025 / Revised: 20 October 2025 / Accepted: 21 October 2025 / Published: 25 October 2025
(This article belongs to the Special Issue Surface Modification and Treatment of Metals)

Abstract

To enhance its surface properties, the Ti-6Al-4V alloy was subjected to a nitrogen atmosphere at elevated temperatures. An orthogonal experiment was employed to investigate the effects of nitriding temperature, nitriding duration, and nitrogen flow rate on the surface hardness and the thickness of the nitrided layer. Mechanical properties were assessed using a micro-Vickers hardness tester and a universal material testing machine. Accelerated corrosion tests were performed by immersing the samples in solutions with varying HF concentrations, while wear resistance was evaluated via a circumferential dry sliding wear test. The results indicate that after nitriding, the subsurface region is primarily composed of TiN, Ti2N, and Ti2AlN. Nitriding temperature exerts the greatest influence on the thickness of the nitrided layer, whereas nitrogen flow rate has the least impact. Conversely, nitrogen flow rate shows the strongest effect on surface hardness, with nitriding temperature having the weakest influence. After nitriding, the microstructure becomes coarse with a decrease in substrate hardness. As nitriding temperature and time increase, the thickness of the nitrided layer grows, but both the tensile strength and percentage elongation after fracture decline. The sample nitrided at 850 °C for 2 h under a nitrogen flow rate of 20 mL·min−1 exhibits favorable overall properties. Compared with the as-received sample, its surface hardness increases noticeably, though both the tensile strength and percentage elongation after fracture decrease. In comparison to the continuous weight loss of the as-received sample when immersed in HF solution, the nitrided sample exhibits an initial mass loss of nearly zero, which suggests that the nitrided layer has a protective efficacy. After nitriding, the wear rate is reduced to no more than 3% of that of the as-received sample. Therefore, gas nitriding is considered a feasible technique for improving the surface properties of Ti-6Al-4V in complex environments.

1. Introduction

Owing to its high specific strength, low density, excellent corrosion resistance and biocompatibility, Ti-6Al-4V has been widely utilized in various fields including the automation industry, aerospace, marine engineering, and biomedical applications [1,2,3,4]. However, Ti-6Al-4V still suffers from insufficient surface hardness and poor wear resistance, which impair its service life, safety, and reliability, thereby restricting its application scope [5,6]. Furthermore, when Ti alloys are employed as components in marine engineering, they encounter the issue of concurrent wear and corrosion. Although a passive film can form spontaneously on its surface, endowing it with a certain degree of corrosion resistance, this film is susceptible to damage under frictional forces and corrosive effects from salt spray, sediments, microorganisms, etc. Additionally, Ti-6Al-4V is also prone to corrosion in acidic environments or those rich in halogen ions [7,8,9]. Under service conditions involving high loads and high-concentration salt environments, Ti-6Al-4V may fail to meet application requirements due to insufficient wear and corrosion resistance. Therefore, enhancing the wear and corrosion resistance of Ti-6Al-4V holds great practical application value [4,10].
Nitrided layers on Ti alloys typically exhibit high microhardness, excellent wear resistance, and good chemical stability. Compared to other alloying elements, nitrogen strengthens the crystal lattice by forming an interstitial solid solution, hinders dislocation movement, and concurrently generates a compound layer. This renders it highly effective in enhancing the surface properties of Ti alloys, particularly in improving wear and corrosion resistance [11]. Gerdes fabricated a 400 μm thick nitrided layer on Ti-6Al-4V via laser nitridation, which increased the surface hardness from 370 HV to 750 HV [12]. Yue observed that the corrosion current density of laser-nitrided Ti-6Al-4V in a 2 mol·L−1 HCl solution was significantly lower than that of the as-received sample [13]. Man’s findings indicated that the surface hardness of laser-nitrided Ti-6Al-4V was enhanced by a factor of 2.3, while its wear resistance was improved by 8 times [14]. Fossati noted that the corrosion resistance of ion-nitrided Ti-6Al-4V was enhanced in HNO3 solution [15]. Li fabricated Ti-6Al-4V via additive manufacturing, and potentiodynamic polarization test results further confirmed that ion nitriding enhanced its corrosion resistance in a natural seawater environment [16]. In practical applications, equipment for laser nitriding and ion nitriding is typically expensive and demands high technical proficiency from operators. Furthermore, due to their limited treatment area, these two methods are not suitable for large-scale production. In contrast, direct gas nitriding offers advantages such as a simple reaction process, low cost, and suitability for large-sized components.
Gas nitriding can be traced back to the 1960s [17]. Early studies reported that this process could enhance the hardness of materials; however, it concurrently led to a reduction in impact strength, which was attributed to the formation of elongated nitride grains. Nitriding treatment of Ti alloys within the low-temperature range (below 600 °C) has minimal impact on their strength and fatigue properties. However, the growth rate of the nitrided layer is slow, resulting in an insufficient increase in hardness. Zhecheva performed gas nitriding on four types of Ti alloys, including Ti-6Al-4V [5]. The results indicated that when the nitriding temperature was below the β-transus temperature (Tβ) of the alloy, the microstructure remained uniform; in contrast, when the temperature exceeded Tβ, the microstructure became inhomogeneous. Additionally, the nitrogen flow rate exerted a great influence on the performance of the nitrided layer. Luong deposited a TiN layer on Ti-6Al-4V using direct current reactive sputtering technology, and observed that increasing the nitrogen flow rate from 10 mL·min−1 to 30 mL·min−1 enhanced the corrosion resistance of the alloy [18]. Although oxidation during direct gas nitriding is virtually inevitable, the method’s appealing simplicity continues to make it a compelling choice.
In this study, the primary objective of the nitriding treatment is to enhance the surface properties of the material while preserving the inherent mechanical properties of its substrate. Nitriding temperature, nitriding duration, and nitrogen flow rate are generally recognized as three core controllable processing parameters of direct gas nitriding. Ti-6Al-4V samples were subjected to direct gas nitriding under process parameters designed via orthogonal experiments, aiming to investigate the effects of these three parameters on the nitriding process. The nitrided samples were characterized, with micro-Vickers hardness and tensile properties measured, to determine the optimal parameters. Additionally, evaluations of wear and corrosion resistance were performed to clarify the protective efficacy of the nitrided layer.

2. Materials and Methods

2.1. Experimental Processes

Ti-6Al-4V samples were prepared by wire electrical discharge machining from 2 mm thick cold-rolled and annealed sheets. Their chemical composition is provided in Table 1.
To ensure nitriding efficiency and minimize the impact of nitriding on the mechanical properties of the substrate, the nitriding temperature should be below Tβ (≈980 °C), and the nitriding duration should be maintained within a reasonable range. In the orthogonal experiment, nitriding temperatures were set at 850, 900, and 950 °C, nitriding durations were set at 1, 2, and 4 h, and nitrogen flow rates were controlled at 10, 20, and 30 mL·min−1. Table 2 outlines the designed orthogonal experiment groups along with their corresponding nitriding processing parameters.
Prior to nitriding, the samples were polished using 60–1000 # SiC sandpapers (Lab Testing Technology (Shanghai) Co., Ltd., Shanghai, China), ultrasonically cleaned in ethanol for 10 min, rinsed with deionized water, and dried in a drying oven at 60 °C for 10 min. The pretreated samples were placed in a single-zone tube furnace (Hefei Kejing Material Technology Co., Ltd., Hefei, China), with high-purity nitrogen (≥99.999%) employed for gas nitriding. Before heating, the furnace was evacuated and purged with nitrogen three times to reduce residual oxygen. The nitrogen flow rate was set as per the designed values, after which the samples were heated to the selected nitriding temperature at a rate of 10 °C·min−1 and held for the corresponding duration. Upon completion of the holding period, the samples were furnace-cooled and subsequently removed.
To evaluate the influence, weight, and statistical significance of each factor, the experimental results were subjected to range analysis followed by analysis of variance (ANOVA). In the range analysis, the effect of every factor at each level must be quantified. For a factor with m levels, the sum of the experimental results obtained at the i -th level, denoted K i , and the corresponding mean value, k i , are calculated as follows:
K i = j = 1 n i y i j       ( i = 1,2 , , m )
k i = K i n i
where n i is the number of tests (replicates) conducted at the i-th level; in the present work n i = 3 for every level of each factor, and y i j denotes the experimental result obtained in the j -th replicate of the i -th level.
Once the mean response k i for every level of a factor is determined, the range R K is calculated as the difference between the largest and smallest k i . The size of R K quantifies the factor’s influence: a larger R K implies a greater potential to elevate the response. In addition, the absolute values of k i and their progression across levels discloses both the individual contribution of each level and the factor’s overall trend. A higher k i denotes a stronger positive impact on the response, whereas a lower k i indicates the reverse. The range-based findings are subsequently verified by analysis of variance. Neglecting factor–factor interactions, the sums of squares ( S S ) and degrees of freedom ( d f ) required for ANOVA are computed as follows:
y - = 1 N p = 1 N y p
S S T = p = 1 N ( y p y - ) 2
S S F = n i i = 1 m ( k i y - ) 2
S S e = S S T S S F
d f T = N 1
d f F = m 1
d f e = d f T d f F
where y - is the overall mean response, S S T is the total sum of squares, S S F is the sum of squares for the individual factor, S S e is the error sum of squares, d f T is the total degrees of freedom, d f F is the degrees of freedom for the individual factor, d f e is the error degrees of freedom, N is the total number of experimental runs, and y p is the result from the p -th run.

2.2. Characterizations and Tests

For microstructure observation, the samples were embedded in epoxy resin with one side exposed for characterization. Kroll’s reagent (volume ratio: HF:HNO3:H2O = 1:2:50) was used as the etching solution. Microstructural observations were conducted using a GX-4XC optical microscope (Shanghai Optical Instrument Factory, Shanghai, China) and a Zeiss GeminiSEM 300 scanning electron microscope (SEM) (Carl Zeiss AG, Oberkochen, Germany). The elemental distributions of nitrogen, aluminum, titanium, and oxygen on both the sample surface and cross-section were analyzed using an Oxford Xplore30 energy-dispersive spectrometer (EDS) (Oxford Instruments plc, Abingdon, UK) attached to the SEM. Phase composition analysis of the sample surface was conducted using a Bruker D8 Advance X-ray diffractometer (Bruker Corporation, Billerica, MA, USA) with Cu Kα radiation, operating at a voltage of 40 kV and a current of 40 mA.
Micro-Vickers hardness measurements were performed using an HVS-1000Z microhardness tester (Shanghai Juhui Instrument Manufacture Co., Ltd., Shanghai, China), with an applied load of 2.94 N and a dwell time of 15 s, conducted on the nitrided surface of the samples. For each sample, 15 replicate measurements were conducted to ensure data reliability. In accordance with GB/T 228.1-2021 [19], tensile tests were performed on the tensile samples both before and after nitriding using an electronic universal testing machine (Shenzhen Suns Technology Stock Co., Ltd., Shenzhen, China), with a crosshead speed of 0.5 mm·min−1 at room temperature (~25 °C). Each sample was prepared in triplicate for experimental validation, ensuring reproducibility of the results. The tensile properties of the samples were derived from their respective tensile curves, with the corresponding mean values and standard errors calculated and reported.
Accelerated corrosion tests were conducted by immersing the samples in centrifuge tubes containing 7.5 mL of HF solutions with mass fractions of 1%, 3%, and 5%, respectively, for a total duration of 1 h. The samples were removed every 10 min, ultrasonically cleaned in deionized water, weighed, and then their corrosion morphologies were observed.
A 15 mm × 15 mm square sheet was subjected to a 6 mm diameter circular dry friction wear test using an MFT-5000 multifunctional friction and wear tester (Rudolph Technologies, Inc., Flanders, NJ, USA). A GCr15 (AISI 52100) ball with a 6 mm diameter was used as the abrasive. The rotation speed was set at 200 r·min−1, the total friction duration was 30 min, and the applied loads were 3, 5, and 10 N, respectively. The variation in the friction coefficient with friction time was recorded. The surface morphologies of the samples and wear scars were observed using a white light interference three-dimensional surface profiler, and the wear volumes were calculated to determine the wear rates of the samples.

3. Results and Discussion

3.1. Microstructures and Hardness of the Substrate

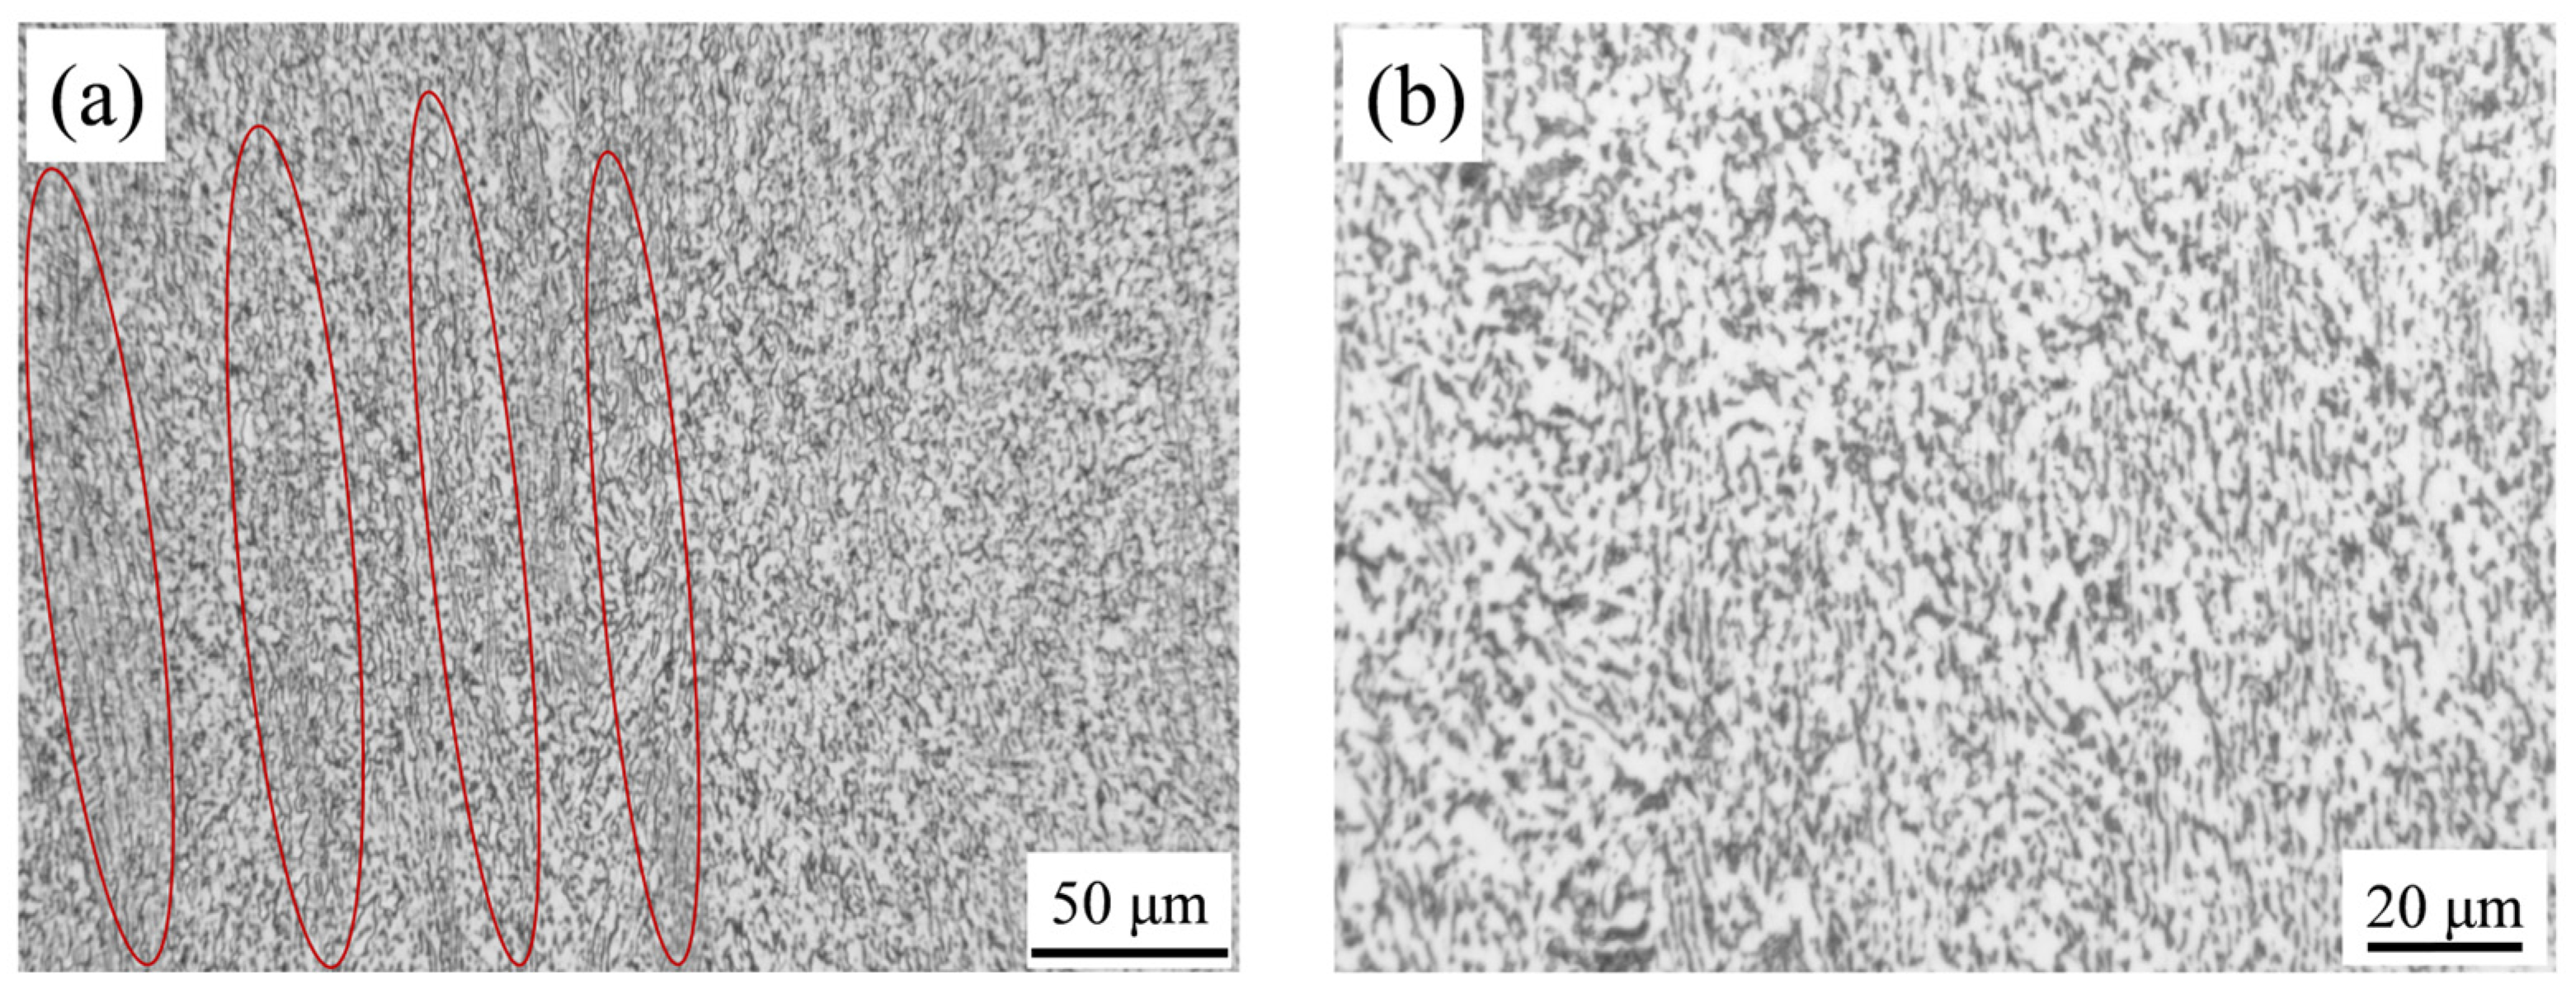
The as-received Ti-6Al-4V exhibited a typical α + β dual-phase structure, as presented in Figure 1. The microstructure was fine-grained, with locally observed near-parallel boundaries (marked in red in Figure 1a). In the high-magnification image (Figure 1b), these near-parallel boundaries were clearly distinguishable, which could be attributed to the cold-rolling process. The grains had undergone deformation along the rolling direction, and partial boundary retention was observed after annealing.
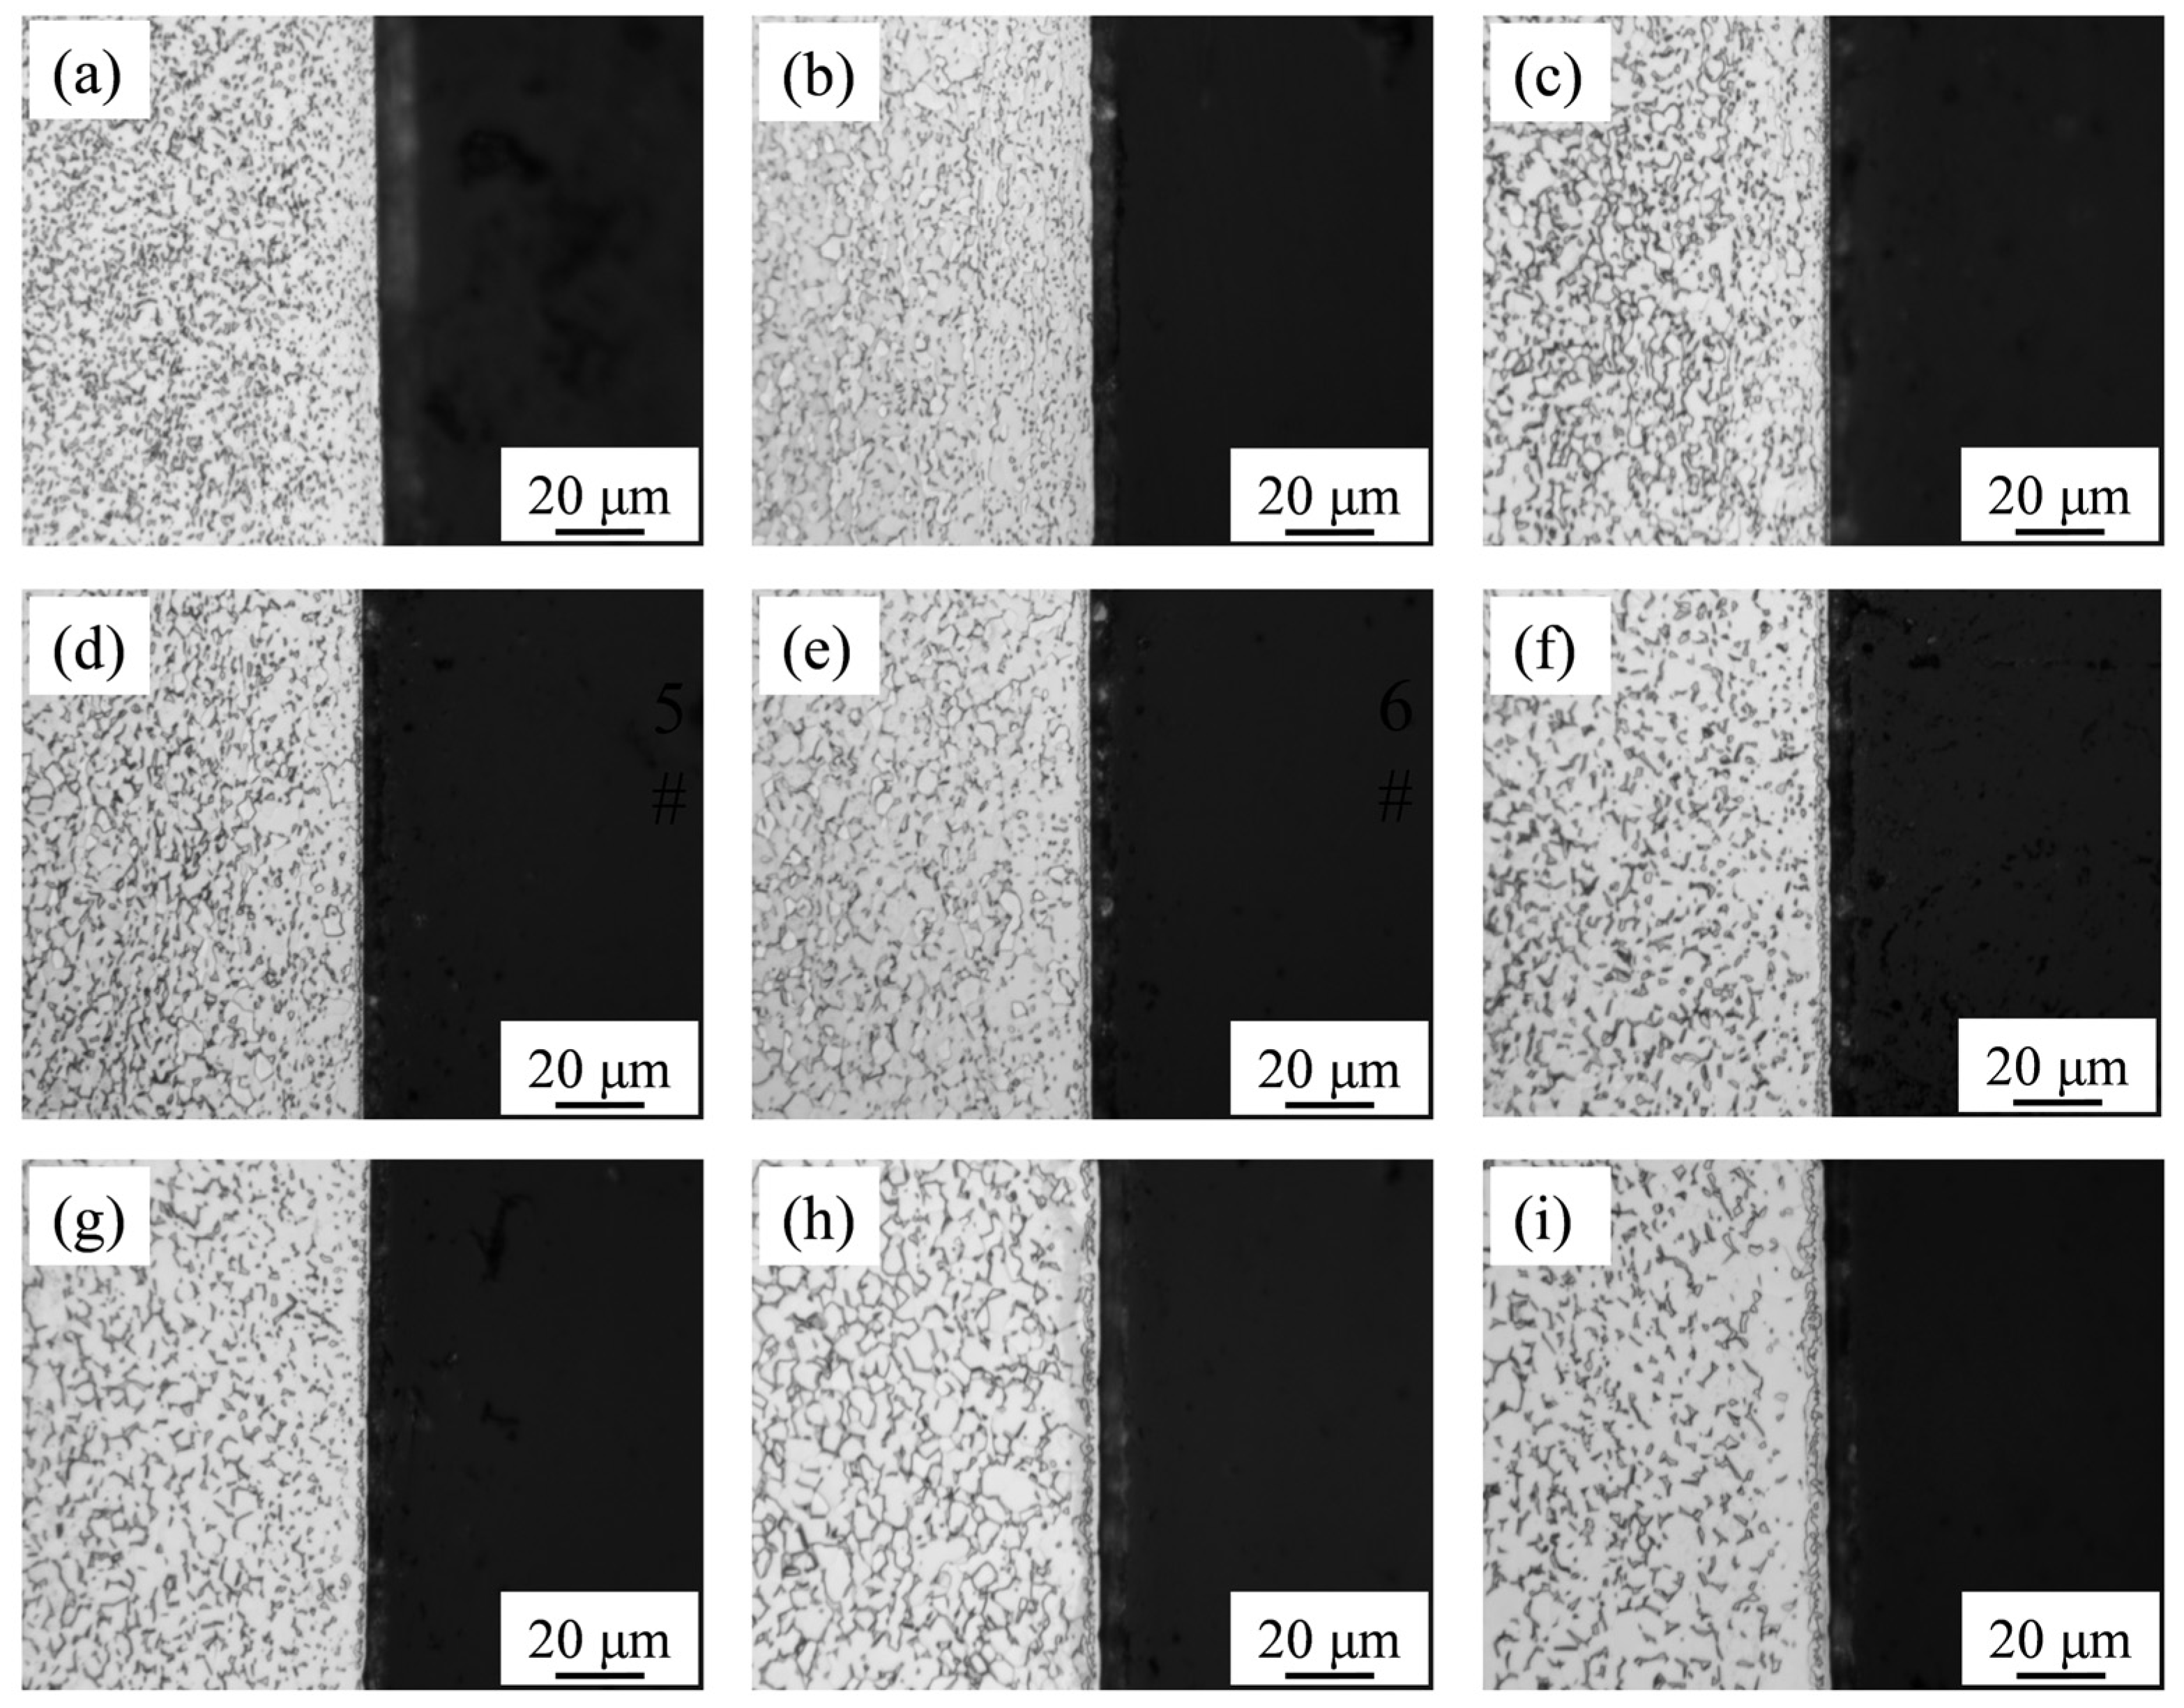
Since the samples were heated at 850–950 °C during nitriding, their microstructures were changed as presented in Figure 2. The microstructure near the surface differed from that of the substrate due to the diffusion and reaction of nitrogen in Ti-6Al-4V, which will be further discussed in subsequent sections. In the substrate, grains grew with increasing temperature and prolonged heating time. Notably, for samples nitrided at 950 °C (Samples 7#–9#), a significant increase in grain size was observed, as presented in Figure 2g–i.
The micro-Vickers hardness of the as-received sample was approximately 331.88 HV0.3. After nitriding, the substrate hardness also changed, as typically presented in Figure 3. Samples 3#, 6#, and 9# were held at 850, 900, and 950 °C for 4 h, respectively, with their substrate hardness presented in Figure 3a. The results indicate that, for the same nitriding duration (4 h), the substrate hardness gradually decreased as the nitriding temperature increased. Samples 7#, 8#, and 9# were held at 950 °C for 1, 2, and 4 h, respectively, and their substrate hardness also exhibited a decreasing trend. This is because prolonged heating or high-temperature exposure caused the microstructure to coarsen, weakening the plastic deformation resistance of the substrate and thereby reducing the micro-Vickers hardness.

3.2. Surface Characteristics After Nitriding

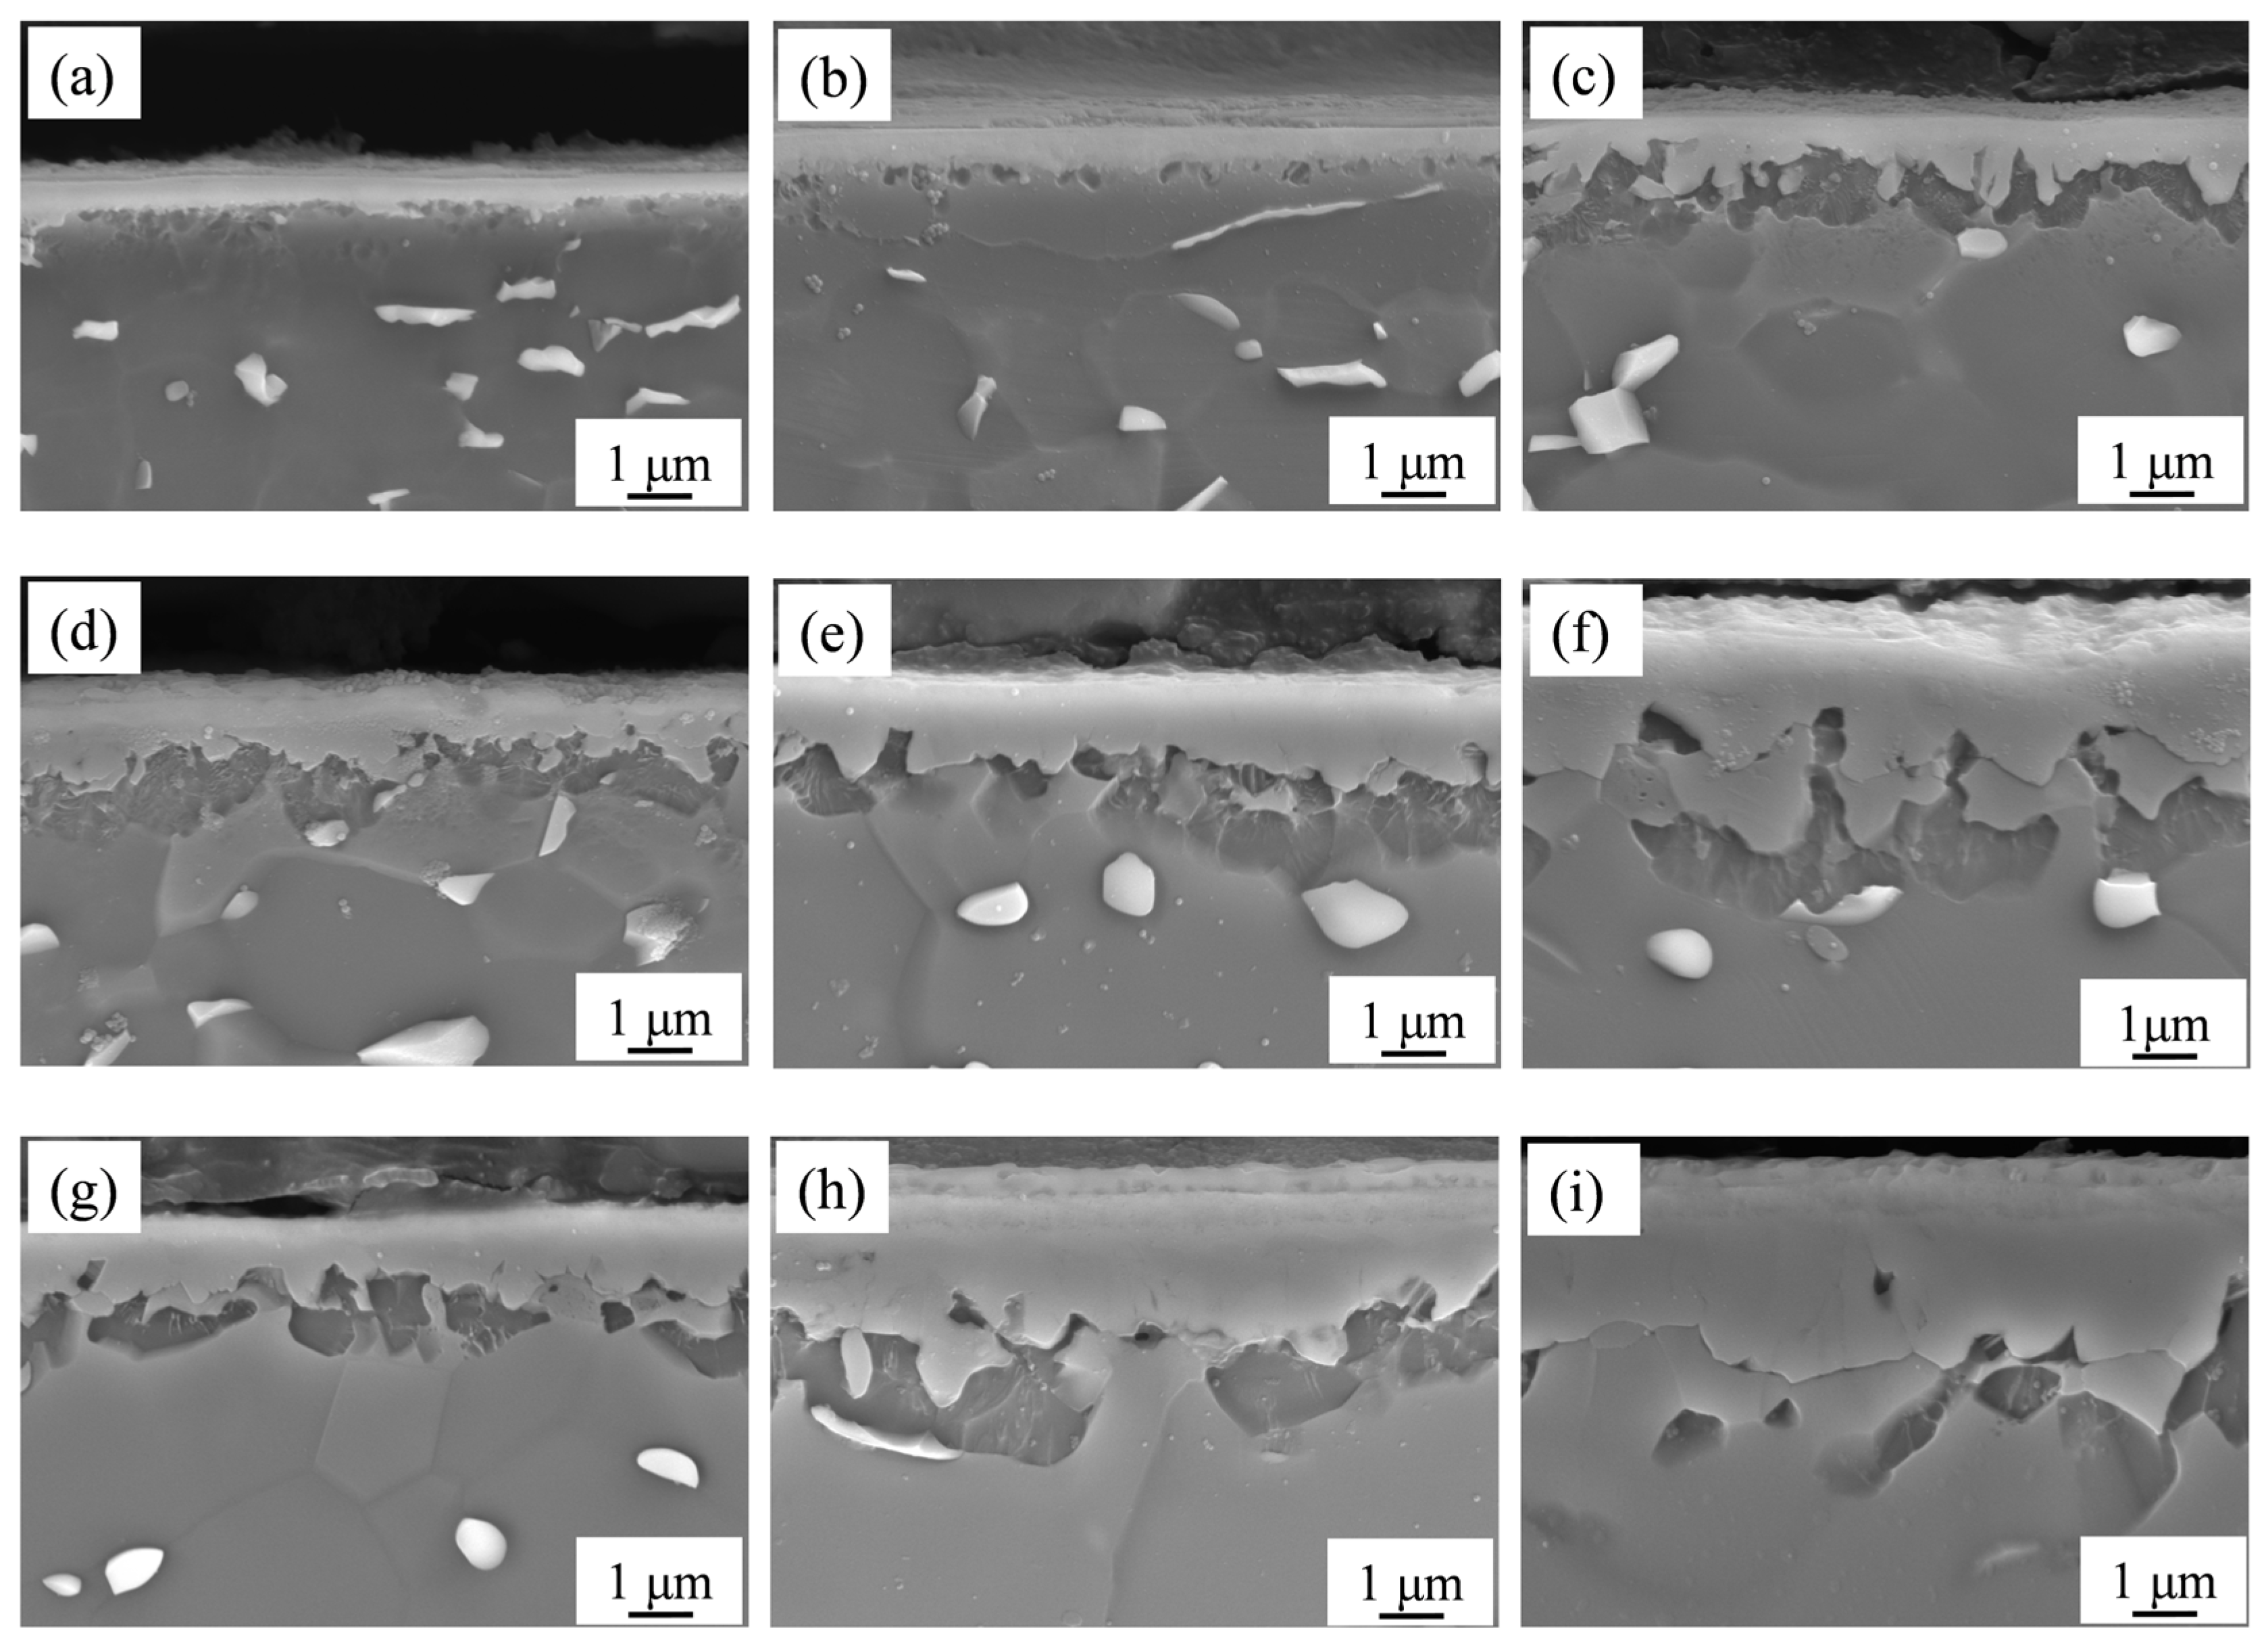
The cross-sections of the nitrided samples were also observed by SEM, as presented in Figure 4. Irregular white blocks, typically regarded as the β phase [2], were randomly precipitated in the α matrix. A series of light gray layers was observed on the sample surfaces. As the nitriding temperature increased and the nitriding duration was prolonged, the thickness of these layers increased.
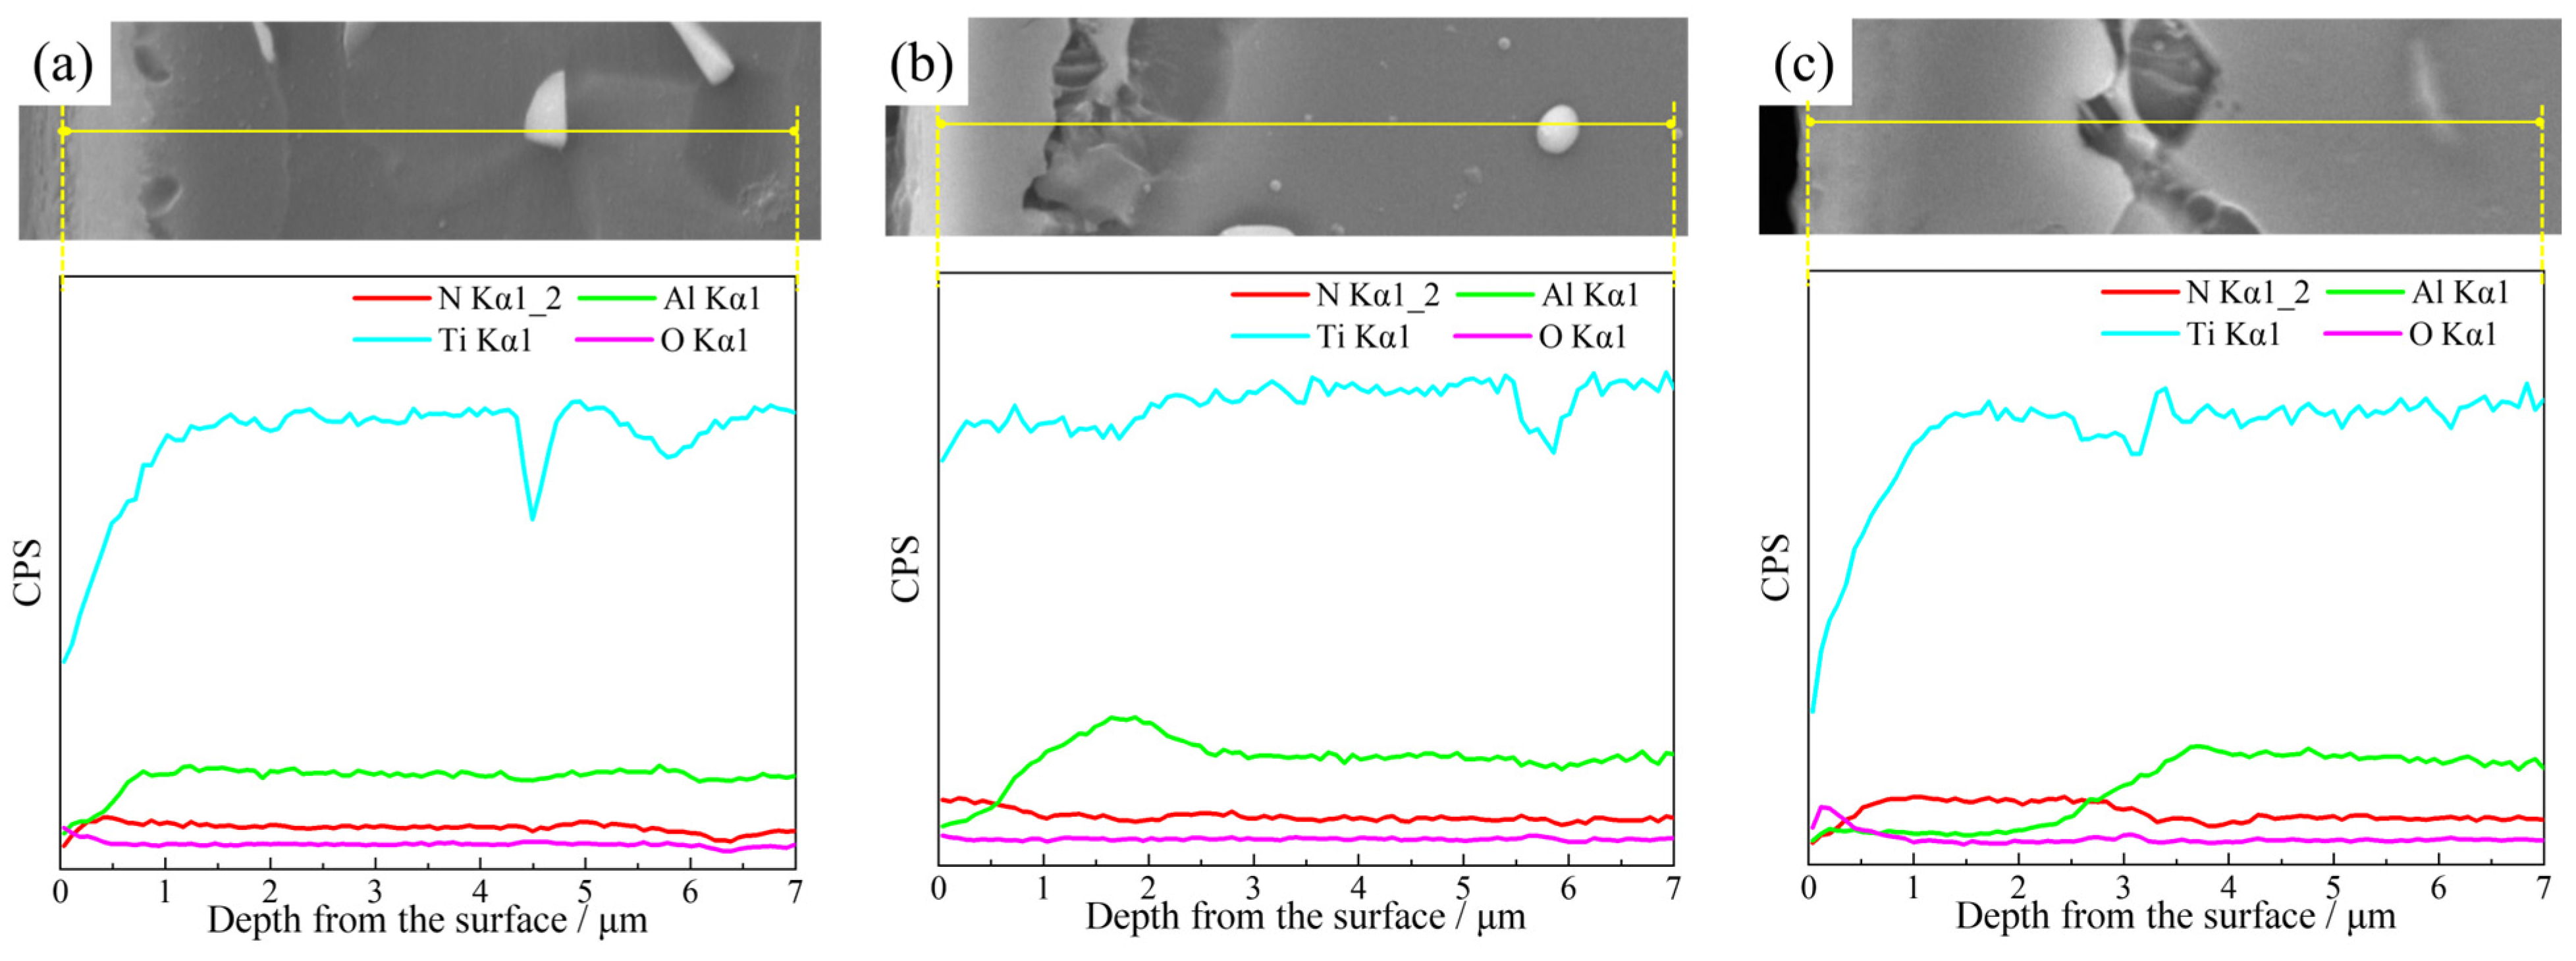
Due to the varying thicknesses of Samples 2#, 5#, and 9#, further analysis was conducted using EDS. The surface element distributions are presented in Figure 5, and the cross-sectional line scanning results are presented in Figure 6. For Sample 2#, which was nitrided at 850 °C for 2 h, the relatively low nitriding temperature and moderate duration limited the nitriding and diffusion of nitrogen. A slight enrichment of nitrogen was detected near the surface (Figure 4a and Figure 5a). For Sample 5#, nitrogen enrichment was more extensive (Figure 5b and Figure 6b), and this phenomenon became much more pronounced in Sample 9# (Figure 5c and Figure 6c).
These results indicate that increasing the nitriding temperature and duration enhances nitrogen diffusion and promotes the formation of the nitrided layer. The nitriding process involves three key steps: adsorption of nitrogen atoms on the surface, diffusion of nitrogen atoms into the subsurface, and formation of nitrides. Elevating the nitriding temperature increases the activity of both nitrogen atoms and substrate atoms, which facilitates these three processes. Additionally, prolonging the nitriding duration allows these processes to continue, enabling nitrogen atoms to diffuse deeper and the nitrided layer to grow thicker.
Additionally, oxygen was detected on the surfaces, indicating that oxidation was nearly unavoidable. Although the furnace was purged with nitrogen three times, a small amount of oxygen remained. Titanium has a strong affinity for oxygen, which results in the formation of oxides.
The concentration of aluminum was lower in the surface layer, particularly for Samples 5# and 9#, with a peak observed at the interface between the layer and the substrate—this suggests that aluminum gradually migrated from the surface and accumulated in the subsurface. Since nitrogen preferentially combines with titanium to form nitrides [20], titanium tends to remain on or diffuse toward the surface; this, in turn, promotes the migration and enrichment of aluminum in the subsurface. Both nitrogen and aluminum are α stabilizers, capable of expanding the α phase region and reducing the volume fraction of the β phase in the alloy. As presented in Figure 4, the number of β blocks near the surface decreased with increasing nitriding temperature and prolonged nitriding duration. This phenomenon is also attributed to the enrichment of nitrogen and migration of aluminum during nitriding.
Figure 7 presents the XRD patterns of the samples before and after nitriding. The as-received sample consisted of α and β phases, with the α phase being dominant. The primary nitrides formed in the nitrided samples were TiN, Ti2N, and Ti2AlN. Compared to the as-received sample, several TiN diffraction peaks were detected in Sample 1#, while Ti2N and Ti2AlN diffraction peaks were barely observable. In Sample 2#, the relative intensities of the Ti2N diffraction peaks were extremely low, and the Ti2AlN diffraction peaks remained barely detectable. Diffraction peaks corresponding to TiN, Ti2N, and Ti2AlN all appeared in Sample 3# as well as Samples 4#–9#.
Due to the sufficient nitrogen atoms on the sample surface, TiN preferentially formed during nitriding, according to
Ti + N → TiN
Subsequently, nitrogen atoms diffused inward, and Ti2N formed according to
TiN + Ti → Ti2N
As nitridation progressed further, Al participated in the reaction, and Ti2AlN was generated according to
Ti2N + Al → Ti2AlN
Compared with the as-received sample, the diffraction peaks corresponding to the α phase in the nitrided samples shifted to the left, particularly the peak at approximately 38.40°. In the as-recieved sample, the lattice constants of α matrix were a = b = 2.9267 Å and c = 4.6752 Å, while in Sample 1#, they were a = b = 2.9268 Å and c = 4.6759 Å. With the increases in nitriding temperature and nitriding duration, the lattice further expanded. The lattice constants of α matrix were a = b = 2.9346 Å and c = 4.726 Å in Sample 2#, and they were a = b = 2.9327 Å and c = 4.7057 Å in Sample 4#. This phenomenon can be attributed to the solid solution of nitrogen atoms in the titanium lattice. Nitrogen atoms typically occupy interstitial sites in the titanium lattice, causing lattice expansion. The shift in the diffraction peaks indicates that, in addition to forming nitrides on the surface, some nitrogen atoms also diffused into the substrate, resulting in the formation of a nitrogen-diffusion layer.
Some diffraction peaks of TiO2 were observed in the XRD patterns of the samples, indicating the formation of oxides during heating. The oxidation process is influenced by temperature, time, and nitrogen flow rate, with a competitive relationship existing between nitridation and oxidation. Among Samples 1#, 2#, and 3#, the TiO2 diffraction peaks were weakest in Sample 3#, which was nitrided under the highest nitrogen flow rate (30 mL·min−1) despite being heated for the longest duration. Samples 5# and 7#, which were also nitrided under a nitrogen flow rate of 30 mL·min−1, exhibited barely detectable TiO2 diffraction peaks. Moreover, as presented in Figure 5 and Figure 6, surface oxygen enrichment was noticeable in Samples 2# and 9# but weak in Sample 5#. These observations suggest that oxidation can be partially inhibited under high nitrogen flow rates.

3.3. Thickness and Surface Hardness

Table 3 presents the average thicknesses of the nitrided layers on the samples measured from SEM images, as well as the mean micro-Vickers hardness values obtained by applying the load directly to the sample surfaces. Range analysis and variance analysis were performed based on the data in Table 3, with the results presented in Table 4, Table 5, Table 6 and Table 7.
From the range analysis results of the nitrided layer thickness (Table 4), the range of nitriding temperature was the largest, whereas that of nitrogen flow rate was the smallest. This indicates that nitriding temperature exerts the greatest influence on the nitrided layer thickness, while nitrogen flow rate has the least impact. The variance analysis results were consistent with the range analysis results. The p -value for nitriding temperature was the smallest and less than 0.05 (Table 5), indicating that its influence on thickness was significant. The influence of nitriding duration did not reach a significant level, though its p -value was close to 0.05. In contrast, the nitrogen flow rate exhibited the highest p -value, signifying the weakest influence. When comparing samples nitrided at different temperatures with the same nitriding duration, the thickness increased as the nitriding temperature rose. It was also observed that the thickness increased with the extension of nitriding duration at a constant nitriding temperature. According to the Arrhenius Law, the diffusion coefficient increases exponentially with a rise in temperature, as shown in the following formula:
D = D 0 e x p ( Q d R T )
where D 0 is the frequency factor, which is related to the crystal structure and vibrational entropy; Q d is the diffusion activation energy; R is the gas constant; T is the absolute temperature. This means that the jump frequency of nitrogen atoms in the metal lattice increases significantly, thereby significantly accelerating the penetration rate and diffusion depth of nitrogen, which directly leads to an increase in the thickness of the penetration layer. While based on Fick’s Second Law, under constant temperature, the relationship between the penetration layer thickness δ and time t is as shown in the following formula:
δ D t
which means that extending the time does increase the penetration layer thickness, but the growth rate slows down gradually, and the influence of temperature on the thickness is much greater than that of time.
The surface hardness of the nitrided samples was higher than that of the as-received sample, confirming the hardening effect of nitriding. The results of range analysis and variance analysis on surface hardness revealed the distinct impacts of the three factors (Table 6 and Table 7). From the range analysis, nitrogen flow rate exerted the greatest impact on surface hardness, whereas nitriding temperature had the weakest effect. In contrast, the variance analysis indicated that the p -value of nitrogen flow rate was less than 0.05, which reached a statistically significant level. However, the p -values of nitriding temperature and nitriding duration were relatively close and did not meet the threshold for statistical significance.
At nitrogen flow rates of 10 mL·min−1 and 20 mL·min−1, the surface hardness was subject to a complex interplay between nitriding temperature and nitriding time. In contrast, when the nitrogen flow rate was increased to 30 mL·min−1, a consistent decrease in the hardness of all samples was observed. For samples treated at the same nitriding temperature, the hardness enhancement of those processed under a 30 mL·min−1 nitrogen flow was limited. For instance, Sample 3# exhibited lower hardness than Sample 2#, even though it was subjected to a longer nitriding duration. Analogously, Sample 5# underwent a longer nitriding duration than Sample 4# but also demonstrated a reduction in hardness. When comparing samples with identical nitriding durations (i.e., Samples 5# and 2#), it was found that the sample nitrided at 30 mL·min−1 (Sample 5#) had lower hardness than that nitrided at 20 mL·min−1 (Sample 2#)—despite the former being treated at a higher nitriding temperature. A similar phenomenon was also observed between Samples 7# and 4#.
The nitrogen flow rate directly regulates the supply rate and concentration of active nitrogen species, which in turn influences the adsorption and diffusion behaviors of nitrogen atoms on the material surface. Specifically, an excessively high nitrogen flow rate accelerates the escape of active nitrogen atoms, while an insufficiently low flow rate reduces the total amount of available active nitrogen atoms. Both scenarios are unfavorable for the progression of the nitriding reaction. In the present study, the K 2 value corresponding to nitrogen flow rate in Table 6 was the highest among K 1 K 3 , indicating that a nitrogen flow rate of 20 mL·min−1 was the most effective for enhancing the surface hardness of the samples.

3.4. Tensile Tests

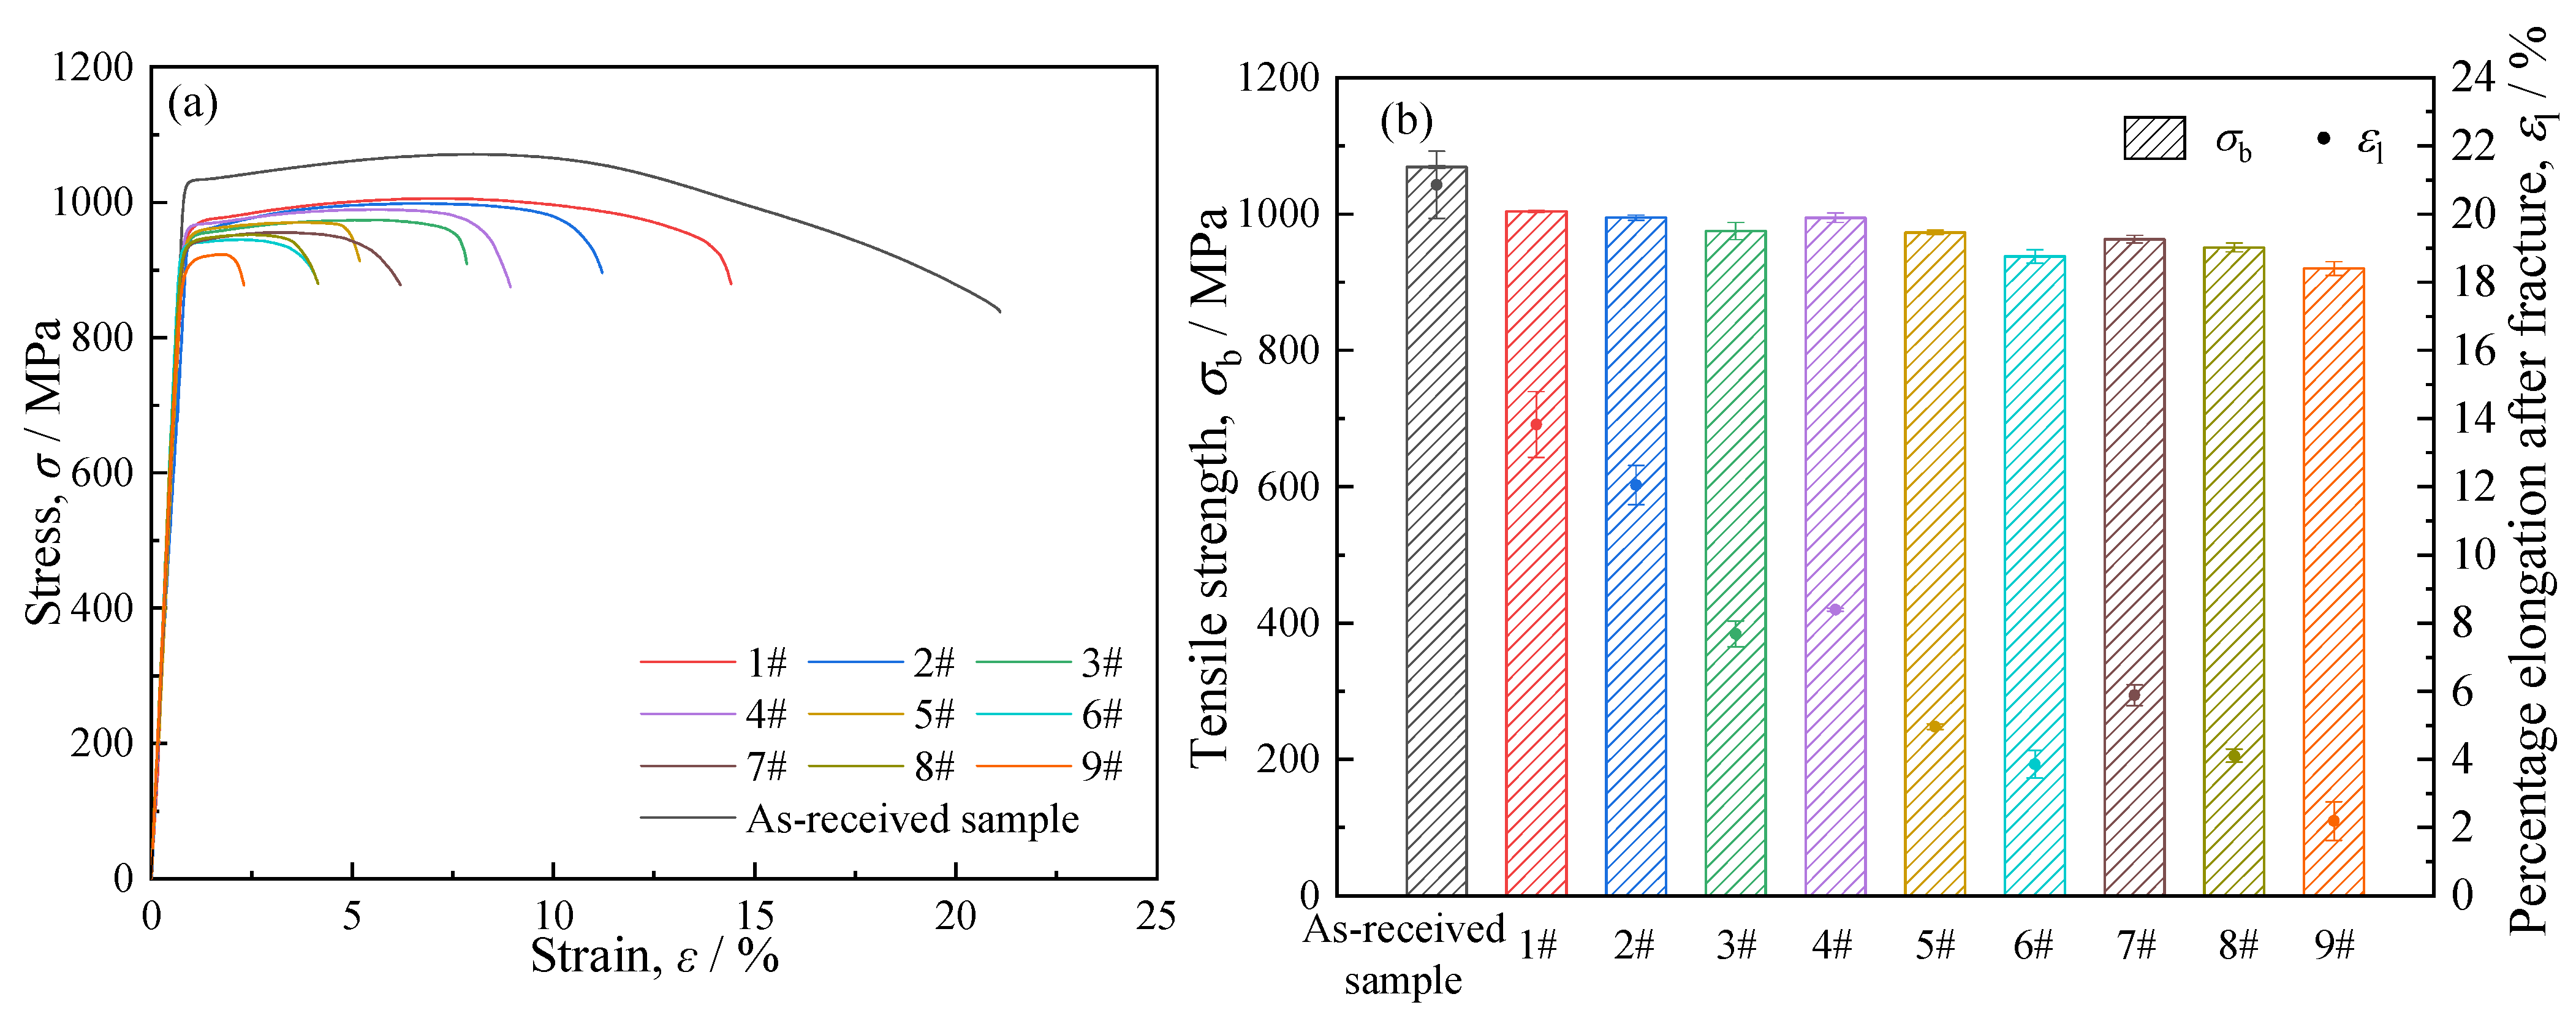
Figure 8 presents the tensile stress–strain curves of the samples, along with the tensile strengths and percentage elongations after fracture derived from the tensile tests. As illustrated in Figure 8a, the stress–strain curves of all samples exhibited distinct elastic stages and plastic deformation stages. The elastic moduli of the nitrided samples varied from 122.52 to 131.23 GPa, which were slightly higher than that of the as-received sample (110.80 GPa). This phenomenon can be attributed to the formation of a hard nitrided layer on the sample surface. Nevertheless, the enhancement effect of the nitrided layer on the elastic modulus was limited, primarily due to the small thickness of these layers. Furthermore, the elastic modulus of a material is predominantly determined by the strength of interatomic bonds and its crystal structure, and variations in grain size exert negligible influence on the elastic modulus [21], which explains the only slight differences observed in the elastic moduli between the nitrided and as-received samples.
The tensile strength and percentage elongation after fracture of each sample are presented in Figure 8b. The as-received sample exhibited a tensile strength of ~1068.87 MPa and a percentage elongation after fracture of ~20.8%. After nitriding, both the tensile strength and percentage elongation after fracture of the samples decreased. Specifically, with the increase in nitriding temperature and the extension of nitriding duration, both properties exhibited a gradual downward trend. In this study, the nitrided layers were relatively thin, and all samples fractured during the plastic deformation stage rather than undergoing brittle fracture, indicating that the nitrided layers exerted only a slight influence on the tensile strength. As reflected in the aforementioned results, the nitriding temperature and duration induced microstructural evolution in the substrate, which in turn led to changes in the substrate’s hardness. Consequently, the variation in tensile strength was primarily attributed to the evolution of the substrate microstructure—a factor predominantly determined by the heating temperature and holding time during the nitriding process.
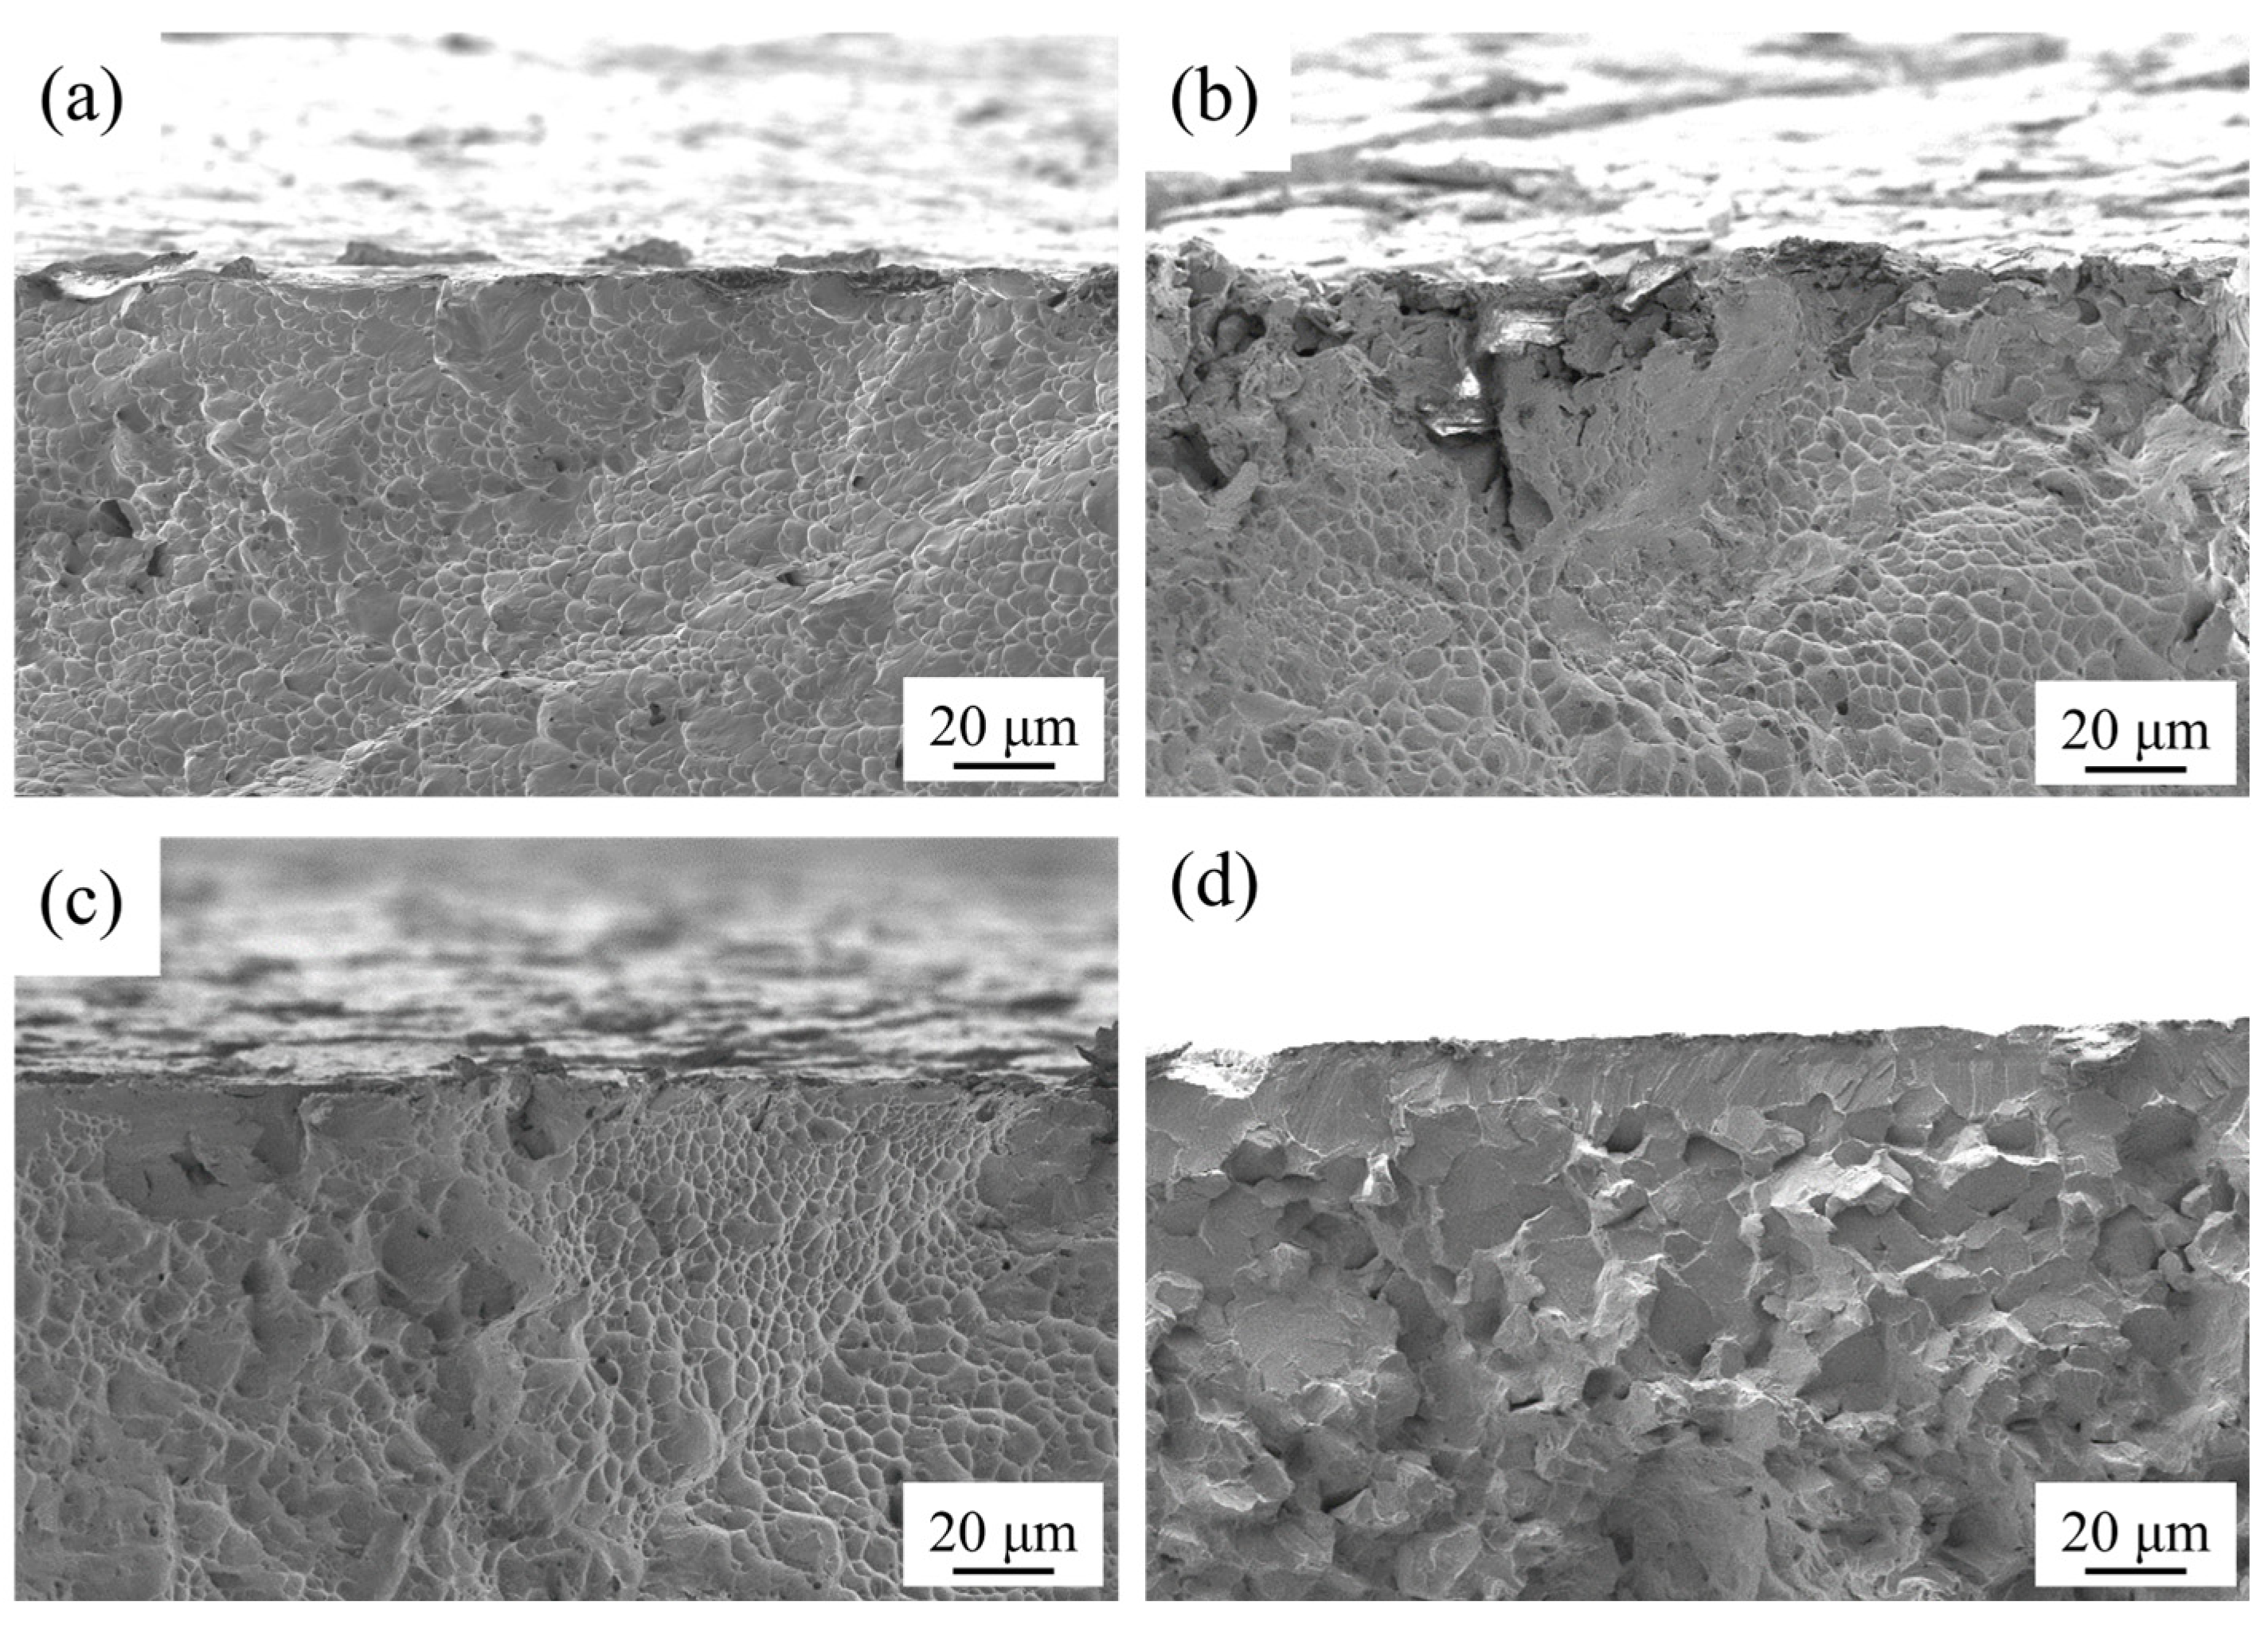
Additionally, the change in percentage elongation after fracture was found to exhibit a trend opposite to that of nitrided layer thickness. Since all nitrided samples retained a certain degree of plasticity, the percentage elongation after fracture was associated with the initiation and propagation of microcracks. The fracture cross-sections of the samples were observed by SEM, with representative images presented in Figure 9. The as-received sample exhibited continuous dimples across its entire fracture cross-section–a hallmark of typical ductile fracture behavior. For Samples 2# and 5#, local cleavage features were observed in the near-surface region, while dimples dominated the remaining areas of the cross-sections. For Sample 9#, smooth cleavage planes were distributed along the surface and extended inward, resulting in a mixed fracture mode of transgranular and intergranular fracture; dimples were only locally present in the inner region of the cross-section. The fracture cross-sectional characteristics of Samples 2#, 5#, and 9# indicated that fracture initiation occurred at the surface—specifically, within the nitrided layer. Owing to the high hardness and brittleness of the nitrided layer, microcracks were more prone to initiation and propagation during tensile loading, which in turn led to a reduction in sample plasticity. As the nitriding temperature and duration increased, the thickness of the nitrided layer increased, thereby exacerbating the adverse effect on plasticity. Consequently, in the context of this study, a thicker nitrided layer was unfavorable for maintaining the mechanical properties of Ti-6Al-4V.
Based on the results presented in Section 3.3 and Section 3.4, the nitrided layer thickness, surface hardness, and tensile properties of the samples were found to be governed by distinct influencing factors. To achieve a thicker nitrided layer, higher nitriding temperatures and longer duration were required; however, this condition led to a reduction in both tensile strength and percentage elongation after fracture. Surface hardness was strongly influenced by the nitrogen flow rate, with 20 mL·min−1 identified as an optimal value. For nitrided Ti-6Al-4V samples, the target performance requirement is to enhance wear resistance—this necessitates an increase in surface hardness relative to the as-received sample while preserving tensile properties as much as possible.
For Samples 4#–9#, nitriding resulted in a significant decrease in plasticity, indicating that 900 °C and 950 °C were unsuitable nitriding temperatures for this application. Additionally, the percentage elongation after fracture of Sample 3# was below 10%, suggesting that a 4 h nitriding duration was excessively long. In comparison to Sample 1#, Sample 2# exhibited a thicker nitrided layer and higher surface hardness, while its tensile properties remained comparable. Consequently, Sample 2#—which possessed a surface hardness of 661.31 HV0.3, a tensile strength of ~994.9 MPa, and a percentage elongation after fracture of ~12.1%—was deemed to have the most desirable comprehensive performance. This sample, along with the as-received sample, was therefore selected for subsequent accelerated corrosion and wear tests for comparative analysis.

3.5. Accelerated Corrosion Results

It is well established that nitrided layers formed on Ti alloys enhance corrosion resistance in commonly used electrolytes [13,15,16,17]. To evaluate the protective efficacy of the nitrided layer under harsh environmental conditions, accelerated corrosion tests were conducted: the as-received sample and Sample 2# were immersed in highly corrosive hydrofluoric acid (HF) solutions for comparative analysis. The cumulative weight losses of the two samples after immersion in HF solutions of varying concentrations are presented in Figure 10.
For the as-received sample, the cumulative weight loss increased gradually with prolonged immersion time, although the rate of increase slowed over time. At the same immersion duration, the sample exhibited greater cumulative weight loss in higher-concentration HF solutions than in lower-concentration ones.
For Sample 2# immersed in a 1% HF solution, the cumulative weight loss remained nearly zero during the initial 20 min. Similarly, when Sample 2# was exposed to 3% and 5% HF solutions, its cumulative weight loss was also close to zero within the first 10 min of immersion. These observations demonstrate that the nitrided layer effectively protected the substrate from HF-induced etching during the initial corrosion stage. Once corrosion was initiated, the weight loss rate of Sample 2# in all three HF solutions first increased and then decreased—exhibiting a trend analogous to that of the as-received sample.
When immersed in a 1% HF solution, Sample 2# consistently exhibited lower cumulative weight loss than the as-received sample; however, the difference in cumulative weight loss between the two samples narrowed as immersion time increased. An analogous trend was observed when the two samples were exposed to a 3% HF solution. Furthermore, after 60 min of immersion in a 5% HF solution, the cumulative weight losses of the two samples became nearly identical. This phenomenon indicates that the protective efficacy of the nitrided layer was almost completely depleted following prolonged immersion.
The surface morphologies of the samples after accelerated corrosion tests were observed via SEM, and the representative images are presented in Figure 11. The surfaces of the as-received samples exhibited a uniform corrosion feature, as illustrated in Figure 11a (a typical example). When examined under a higher magnification, some residual β-phase particles were clearly identified on the corroded surface, as presented in Figure 11b.
For Sample 2# immersed in a 1% HF solution for 60 min (Figure 11c,d), partial surface etching was observed, with a morphology similar to that of the as-received sample. Additionally, the nitrided layer remained locally residual on the surface. In contrast, when Sample 2# was immersed in 3% and 5% HF solutions for 60 min, residual nitrided layers were barely observed. Notably, both samples (immersed in 3% and 5% HF) exhibited morphologies analogous to that of the as-received sample.
Ti and TiO2 are soluble in HF solutions, as described by the following reactions:
Ti + 6HF → [TiF6]2− + 2H2 + 2H+
TiO2 + 6HF → [TiF6]2− + 2H2O + 2H+
Therefore, the as-received samples underwent rapid etching when exposed to HF solutions.
TiN is also soluble in HF solutions, as described by the following reaction:
2TiN + 12HF → 2[TiF6]2− + 2NH4+ + 2H+ + H2
However, in a non-oxidizing environment, the reaction rate of Equation (6) was much slower than those of Equations (4) and (5). To gain insight into the corrosion process of Sample 2#, the surface morphologies of the sample after immersion in a 1% HF solution for 10, 20, and 30 min were observed via SEM, as presented in Figure 12.
The change in the surface was rarely observed after 10 min of immersion (Figure 12a). As the immersion time was extended to 20 min, pits began to emerge on the surface (Figure 12b); a further extension of the immersion time to 30 min resulted in a noticeable increase in the size of these holes (Figure 12c).
Galvanetto observed that the nitrided layer on Ti-6Al-4V peeled off following immersion in HCl solutions, and further pointed out that localized dissolution primarily occurred at defects in the nitrided layer [22]. Fossati immersed glow-discharge nitrided Ti-6Al-4V in a 4 mol·L−1 HNO3 solution; nitrided layer peeling was also observed, and the Ti2N layer exhibited a higher corrosion resistance than the TiN layer [15]. In this study, the nitrided layer was composed of TiO2 and nitrides. The localized dissolution of the nitrided layer at the initial stage could be attributed to the dissolution of TiO2. Subsequently, the substrate was exposed to the solution and underwent continuous etching. As the immersion time increased, further localized dissolution occurred: the corrosion holes expanded, and more of the substrate was etched, which ultimately led to a gradual reduction in the protective efficacy of the nitrided layer. As the substrate preferentially reacted with HF, its dissolution led to the detachment of the nitrided layer from the substrate. This explains why corrosion accelerated after several minutes of immersion in HF solutions. Following immersion, black powder was observed in the solution; this powder is attributed to undissolved nitrides that had detached from the substrate.
Nevertheless, for the initial 10 min of immersion, the cumulative weight losses of Sample 2# in 1%, 3%, and 5% HF solutions were only 0.15%, 0.19%, and 1.50% of those of the as-received sample, respectively. This result clearly demonstrates the strong protective efficacy of the nitrided layer.

3.6. Wear Test Results

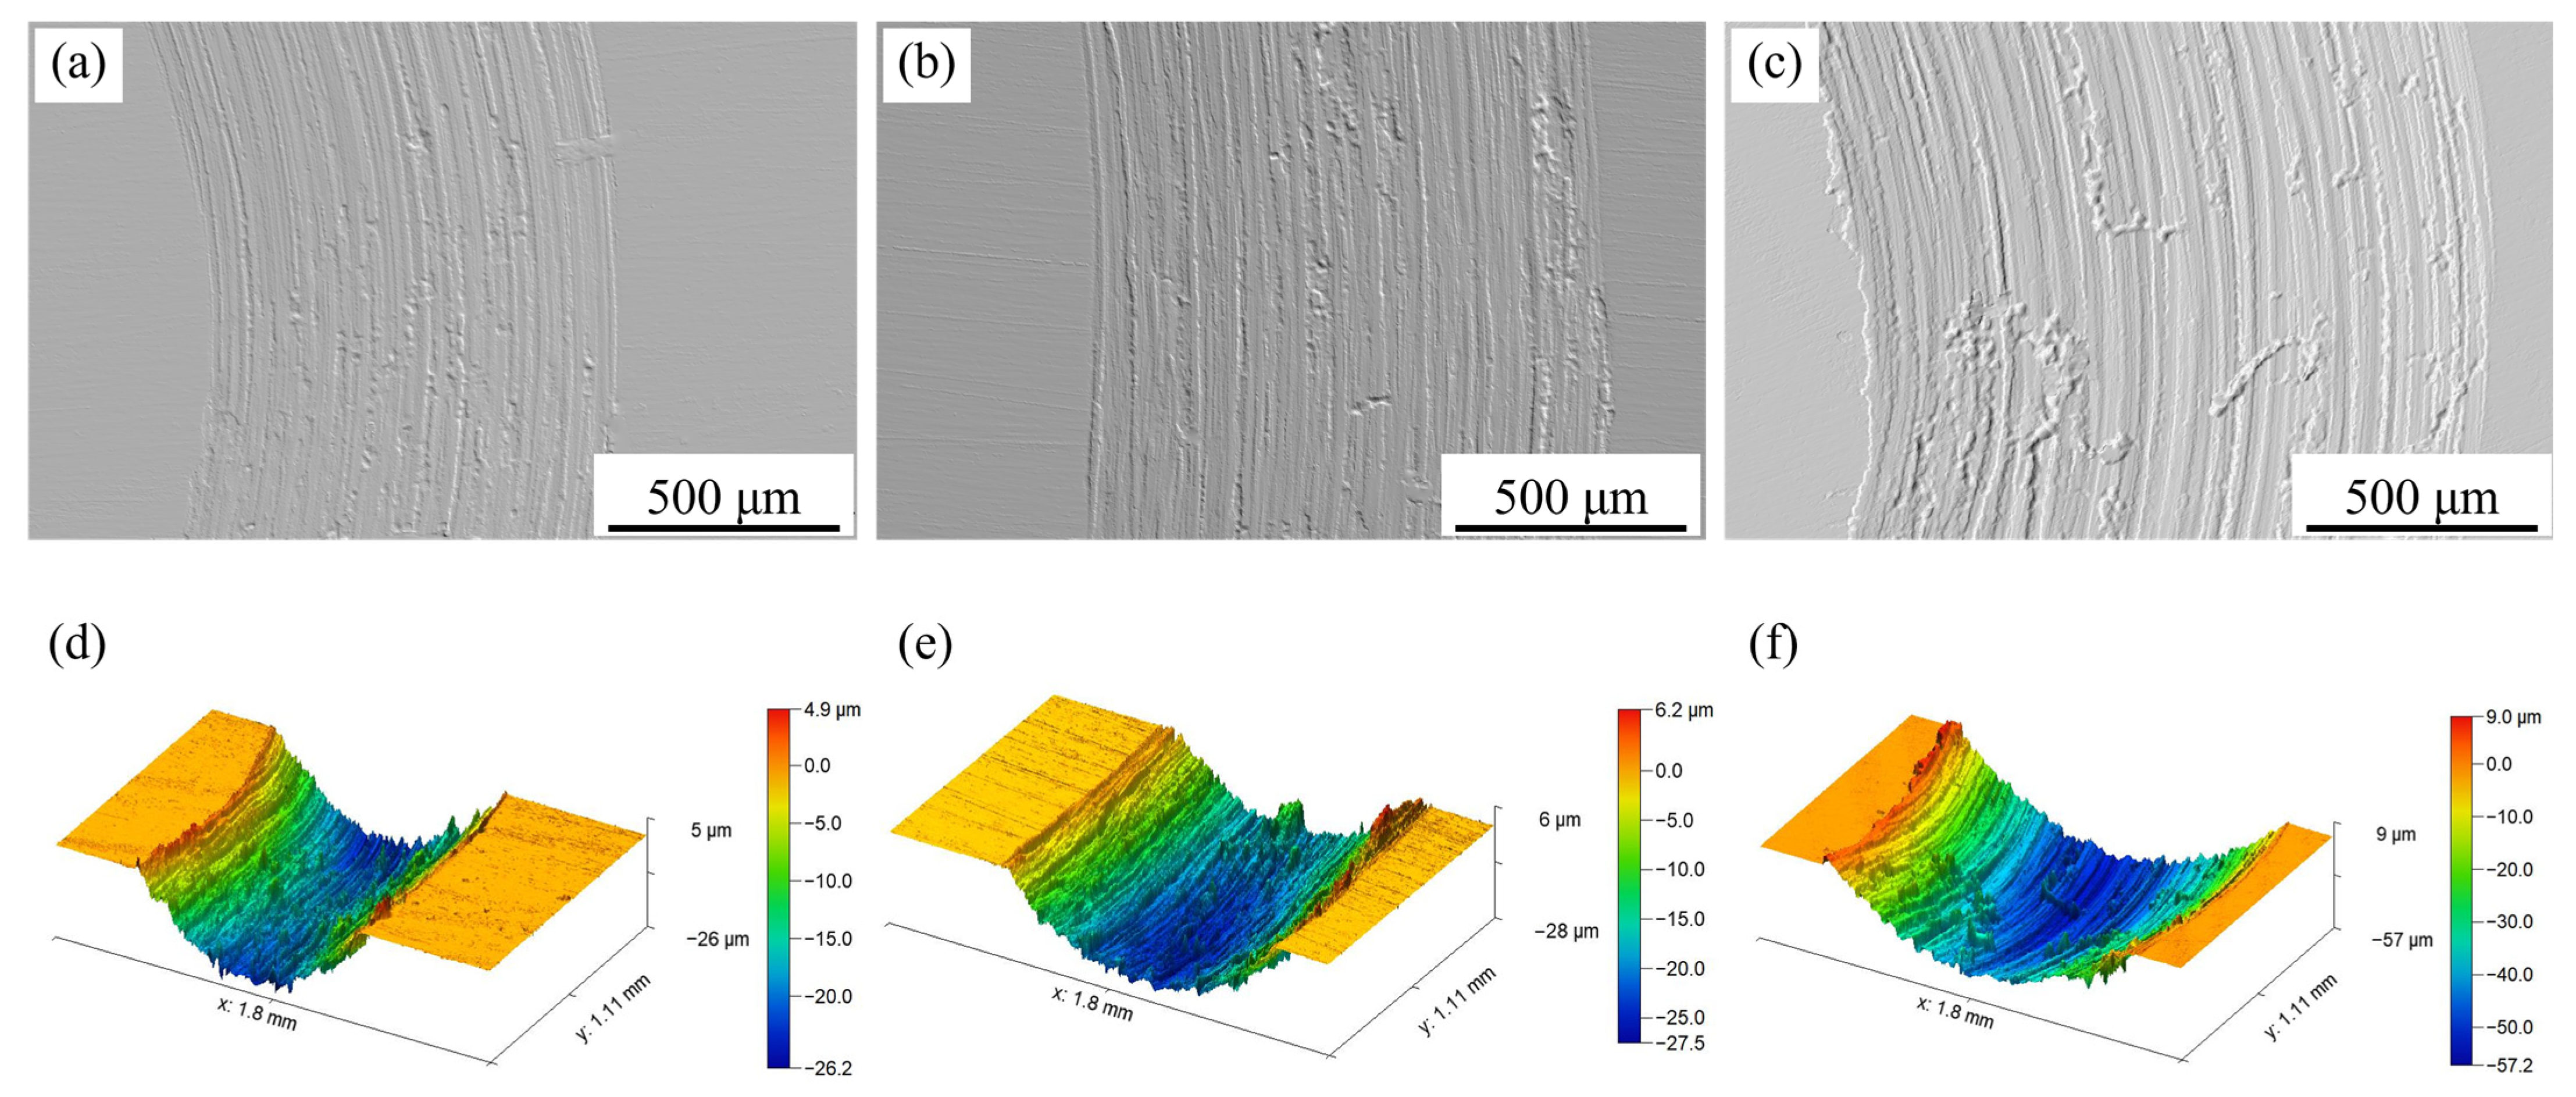
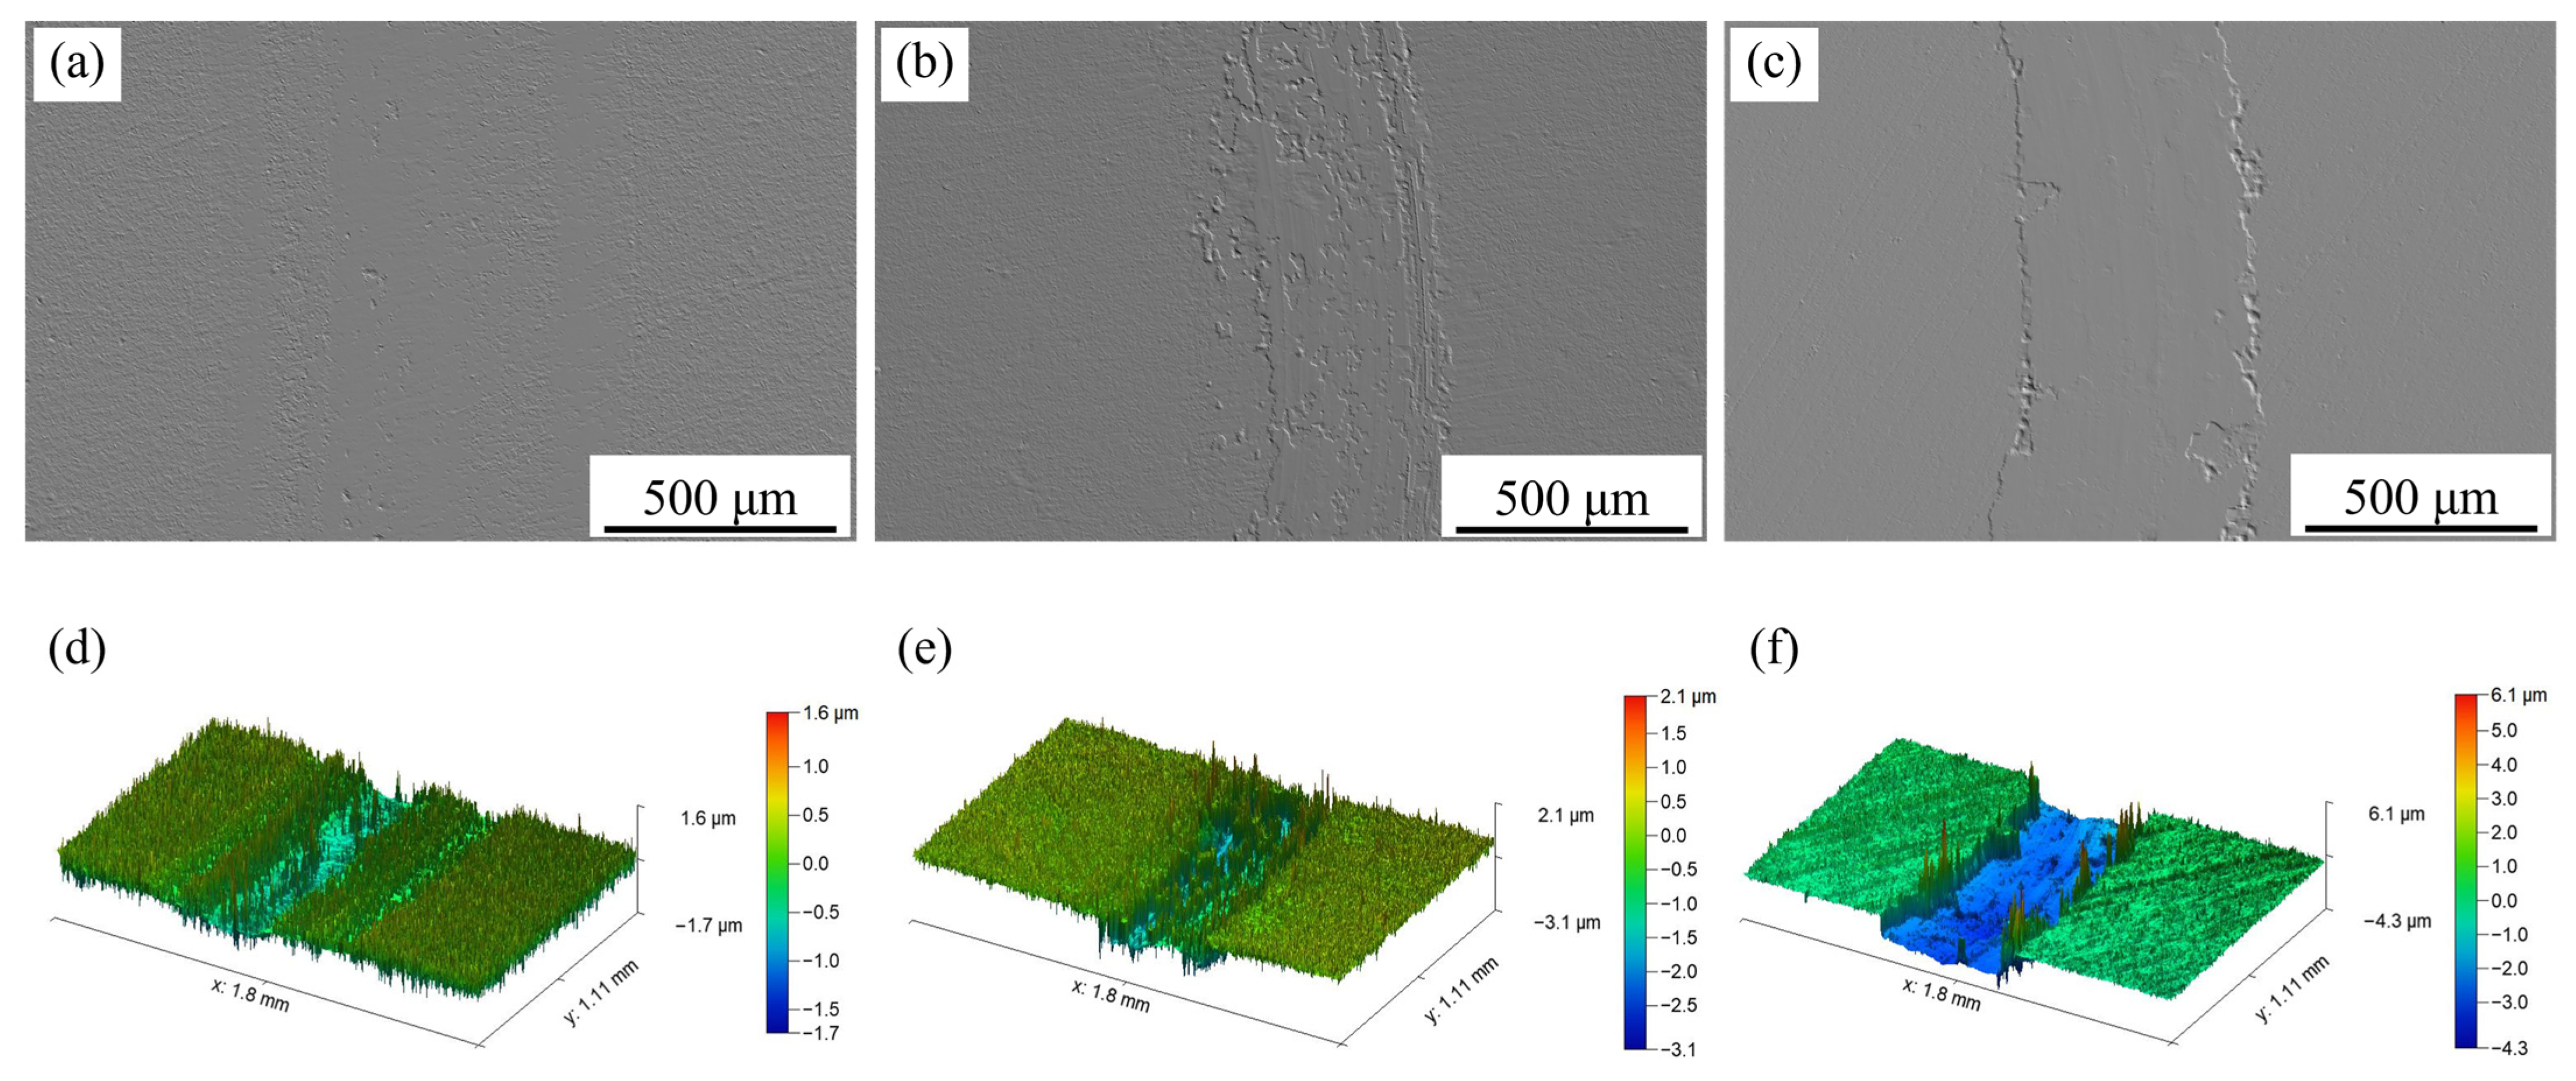
Figure 13 presents the variation in friction coefficient with time for the as-received sample and Sample 2#. The surface morphologies and three-dimensional morphologies of the worn sample surfaces are depicted in Figure 14 and Figure 15, respectively.
For the as-received sample tested under an applied load of 3 N, the friction coefficient increased slightly before stabilizing at approximately 0.5. When the applied load was increased to 5 N, the friction coefficient initially remained at approximately 0.3, followed by a gradual increase to around 0.5. Under an applied load of 10 N, the as-received sample exhibited an initial decrease in friction coefficient during the wear process, which was subsequently followed by an increase to approximately 0.5. When the applied load was small, a steady wear condition was achieved within a short time. As presented in Figure 14a,d, furrows were the dominant morphological feature on the worn surface. With increasing applied load, small abrasive debris was generated, which in turn exerted a self-lubricating effect and reduced the friction coefficient. Subsequently, this abrasive debris either adhered to the substrate or the grinding ball, leading to the establishment of a relatively steady wear state. Additionally, localized scuffing was observed on the worn surfaces, as illustrated in Figure 14b,e. When the applied load was further increased to 10 N, more small abrasive debris formed, resulting in a noticeable initial decrease in the friction coefficient. As a steady wear condition was gradually established, the friction coefficient increased progressively and eventually stabilized at approximately 0.5. Due to the high applied load of 10 N, plastic deformation and scuffing were prone to occur on the worn surface, as presented in Figure 14c,f.
Under different applied loads, the initial friction coefficients of Sample 2# were nearly identical and consistently lower than those of the as-received sample (Figure 13). Sample 2# featured a hard nitrided layer on its surface, which inhibited the occurrence of local plastic deformation.
As illustrated in Figure 15, the nitrided layer exhibited lower surface smoothness compared to the as-received sample. This reduced smoothness led to a smaller initial contact area between the friction pairs, thereby minimizing frictional resistance and resulting in the consistently lower initial friction coefficients observed.
As noted in Section 3.3, the nitrided layer of Sample 2# exhibited a thickness of approximately 0.73 μm. As presented in Figure 15a,d, following the wear test under an applied load of 3 N, the nitrided layer remained largely intact, with almost no furrows detected on its worn surface. Additionally, the running-in period between the hard nitrided layer and the grinding ball was prolonged; a steady wear state was ultimately established between the two contact surfaces. Under applied loads of 5 and 10 N (Figure 15b,c,e,f), the wear depths exceeded the thickness of the nitrided layer, indicating that the substrate was exposed and subjected to wear. Since the grinding ball came into contact with the relatively soft substrate within a short time, the running-in period was shortened. For Sample 2# tested under 5 N, the contact stress rises, leading to brittle fracture and spallation in local areas of the nitrided layer due to stress concentration. Meanwhile, the substrate with relatively low hardness comes into contact with the friction pair, and the detached hard wear debris from the surface layer acts as a third body at the friction interface. Consequently, during friction under this load condition, plastic deformation and wear on the substrate surface are aggravated, and plowing grooves are formed. When the applied load was increased to 10 N, the nitrided layer was more susceptible to wear. Abrasive debris from the nitrided layer partially filled the furrows on the substrate, thereby establishing a new steady wear state. Consequently, the worn surface of Sample 2# under 10 N appeared relatively smooth, with a clear boundary between the worn and unworn regions.
Figure 16 presents the fitted average cross-sectional profiles of the wear scars. Both the width and depth of the wear scar increased with increasing applied load. Compared to Sample 2#, the as-received sample exhibited wider and deeper wear scars; conversely, the wear scars of Sample 2# were narrower and shallower. The cross-sectional area (A) of each wear scar was determined from the profiles in Figure 16, and the wear rate (w) was subsequently calculated using the following formula:
w = V/(F × L) = π × D × A/(F × π × D × n × t × 10−3) = A/(F × n × t × 10−3)
where V is the wear volume of the sample, F is the applied load, and L is the sliding length of the grinding ball, D is the diameter of the circular track used in the dry friction wear test, n is the rotating speed (200 r·min−1), and t is the rotating time (30 min). By substituting the values of n and t into Equation (18), the wear rate w was directly calculated using the following expression:
w = A/6F
The calculated wear rates of the as-received sample and Sample 2# are presented in Figure 17. Under an applied load of 3 N, the wear rate of Sample 2# was only 2.29% of that of the as-received sample. With increasing applied load, the wear rates of both samples increased; notably, Sample 2# exhibited a more pronounced upward trend, which was attributed to the gradual wear-through of its nitrided layer. Even under the highest applied load of 10 N, the nitrided layer retained most of its high wear resistance: the wear rate of Sample 2# remained as low as 2.89% of the as-received sample’s wear rate.
Farokhzadeh noted that a thick compound layer is prone to crack initiation, and the propagation of such cracks could be effectively suppressed in a timely manner—ultimately leading to reductions in both fatigue performance and wear resistance [23]. Nolan proposed that a surface layer containing high-hardness nitrides required a lower-hardness nitrogen diffusion layer for structural support [24]. Without this supportive diffusion layer, cracks were likely to initiate in the hard, brittle surface layer due to the plastic deformation of the substrate. These cracks could then lead to local spalling of the surface layer, which ultimately evolved into severe wear. Li removed the surface compound layer while retaining the diffusion layer after nitriding pure Ti and discovered that the diffusion layer could effectively inhibit the initiation and propagation of cracks, thereby enhancing the anti-cavitation ability [25]. Therefore, it is concluded that nitrogen diffusion in the substrate exerts an important influence on the alloy’s wear resistance.
Additionally, Batory noted that thin nitrided layers formed via low-temperature, short-duration nitriding exhibited superior resistance to crack initiation and propagation compared to thicker nitrided layers produced through high-temperature, long-duration treatment [26]. In this study, nitrogen atoms not only formed a nitrided layer on the sample surface but also diffused into the substrate interior. Thinner nitrided layers were obtained when the nitriding temperature was set to 850 °C. Even though the nitrided layer of Sample 2# was worn through under the higher applied loads, the underlying diffusion layer still exhibited noticeable wear resistance—indicating that the selected nitriding parameters were suitable.
Overall, Ti-6Al-4V samples were subjected to direct gas nitriding via a designed orthogonal experiment, with three process parameters—nitriding temperature, nitriding duration, and nitrogen flow rate—selected as the experimental factors. Given that the nitriding process requires heating the specimens at a relatively high temperature for a certain duration, the specimens undergo an equivalent heat treatment, which induces microstructural changes. Furthermore, despite the equipment’s desirable sealing performance and three rounds of gas purging, oxygen absorption and diffusion during the nitriding process remain unavoidable. The results indicate that the three process parameters exert contradictory effects. Increasing the nitriding temperature and extending the nitriding duration are beneficial for the growth of the nitrided layer but cause microstructural coarsening, which in turn reduces the material’s plasticity. Raising the nitrogen flow rate partially inhibits oxidation; however, it is unfavorable for achieving sufficient nitriding—an effect that limits improvements in hardness.
Among the nine designed experimental groups, the combination of a nitriding temperature of 850 °C, a nitriding duration of 2 h, and a nitrogen flow rate of 20 mL·min−1 was identified as the most suitable process parameter set. The protective effect of the nitrided layer was verified via HF etching and wear tests. Owing to the limited number of specimens prepared in this study, numerical simulations will be further conducted to model key processes—including nitrogen diffusion, nitride formation, stress evolution, and crack initiation within the nitrided layer—with the aim of further optimizing the nitriding process and thereby enhancing material properties. Additionally, the wear mechanisms could be investigated in greater depth through integrated testing and modeling under diverse conditions; this would help clarify the respective influences of the nitrided layer and diffusion layer, representing another valuable direction for future research.
4. Conclusions

The following conclusions can be drawn from the above results and discussion:
  • Nitriding treatment increases the grain size of the Ti-6Al-4V alloy while reducing the hardness of the substrate. After nitriding, the sub-surface region is primarily composed of TiN, Ti2N, and Ti2AlN, with the surface hardness increasing to nearly twice that of the as-received sample.
  • As the nitriding temperature and time increase, both the tensile strength and percentage elongation after fracture decrease. Increasing the nitriding temperature or prolonging the nitriding time leads to an increase in the thickness of the nitrided layer, while the surface hardness is significantly affected by the nitrogen flow rate.
  • The tensile strength and percentage elongation after fracture both exhibit a downward trend with increasing nitriding temperature and prolonged nitriding duration. Specifically, under the nitriding condition of 850 °C for 2 h with a nitrogen flow rate of 20 mL·m−1, the surface hardness is notably increased from 331.88 HV0.3 to 661.31 HV0.3. In contrast, the tensile strength decreases slightly from 1068.87 MPa to 994.85 MPa, and the percentage elongation after fracture decreases from 20.8% to 12.1%.
  • At the initial stage of immersion in HF solution, the nitrided layer protects the substrate from etching, resulting in a weight loss close to zero. Compared with the as-received sample, the nitrided sample also exhibits a notable improvement in wear resistance, with its wear rate being less than 3% of that of the as-received sample.

Author Contributions

Conceptualization, Q.L., R.L. and Y.M.; Methodology, Q.L. and X.L.; Investigation, Q.L., Y.Z., S.D., X.L., Y.M. and R.L.; Resources, Q.L., Y.M. and R.L.; Data curation, Q.L., Y.Z. and S.D.; Writing—original draft, Q.L., Y.Z. and S.D.; Writing—review and editing, Q.L., Y.Z., S.D., X.L., R.L. and Y.M.; Supervision, Q.L., X.L., R.L. and Y.M.; Funding acquisition, Q.L., R.L. and Y.M. All authors have read and agreed to the published version of the manuscript.

Funding

This research was funded by the Shanghai Engineering Research Center of Hot Manufacturing, Shanghai Dianji University, grant number 18DZ2253400.

Data Availability Statement

The original contributions presented in this study are included in the article. Further inquiries can be directed to the corresponding authors.

Acknowledgments

The authors extend their gratitude to Tingting Wang (from Scientific Compass www.shiyanjia.com) for providing invaluable assistance with the SEM and EDS analysis.

Conflicts of Interest

The authors declare no conflicts of interest.

References

  1. Sha, W.; Don, M.; Mohamed, A.; Wu, X.; Siliang, B.; Zhecheva, A. X-ray diffraction, optical microscopy, and microhardness studies of gas nitrided titanium alloys and titanium aluminide. Mater. Charact. 2008, 59, 229–240. [Google Scholar] [CrossRef]
  2. Tkachuk, O.V.; Sheykin, S.E.; Lavrys, S.M.; Rostotskii, I.Y.; Danyliak, M.O.M.; Pohrelyuk, I.M.; Proskurnyak, R.V. Effect of stage gas nitriding on corrosion and wear resistance of Ti6Al4V alloy in physiological environment. Vacuum 2024, 230, 113713. [Google Scholar] [CrossRef]
  3. Li, Q.; Zhao, H.; Yang, J.; Song, S.; Liu, X. Optimization of Pedicle Screw Parameters for Enhancing Implant Stability Based on Finite Element Analysis. World Neurosurg. 2024, 183, e345–e354. [Google Scholar] [CrossRef]
  4. Pei, W.; Xie, Z.; Wang, J.; Pei, X.; Zhang, Q.; Liu, J. Tribocorrosion performance of TC4 anodized/carbon fiber composite in marine environment. J. Mater. Res. Technol. 2024, 32, 762–773. [Google Scholar] [CrossRef]
  5. Zhecheva, A.; Malinov, S.; Sha, W. Titanium alloys after surface gas nitriding. Surf. Coat. Technol. 2006, 201, 2467–2474. [Google Scholar] [CrossRef]
  6. Das, M.; Bhattacharya, K.; Dittrick, S.A.; Mandal, C.; Balla, V.K.; Sampath Kumar, T.S.; Bandyopadhyay, A.; Manna, I. In situ synthesized TiB–TiN reinforced Ti6Al4V alloy composite coatings: Microstructure, tribological and in-vitro biocompatibility. J. Mech. Behav. Biomed. Mater. 2014, 29, 259–271. [Google Scholar] [CrossRef] [PubMed]
  7. Nishimura, T. Corrosion resistance of molybdenum-containing titanium alloy for overpack in simulating underground environment. J. Nucl. Mater. 2009, 385, 495–503. [Google Scholar] [CrossRef]
  8. Yan, L.; Noël, J.J.; Shoesmith, D.W. Hydrogen absorption into Grade-2 titanium during crevice corrosion. Electrochim. Acta 2011, 56, 1810–1822. [Google Scholar] [CrossRef]
  9. Pang, J.; Blackwood, D.J. Corrosion of titanium alloys in high temperature near anaerobic seawater. Corros. Sci. 2016, 105, 17–24. [Google Scholar] [CrossRef]
  10. Li, J.; Zhang, D.; Chen, X.; Xu, D.; Qiu, D.; Wang, F.; Easton, M. Laser directed energy deposited, ultrafine-grained functional titanium-copper alloys tailored for marine environments: Antibacterial and anti-microbial corrosion studies. J. Mater. Sci. Technol. 2023, 166, 21–33. [Google Scholar] [CrossRef]
  11. Wang, D.; Sun, D.; Han, X.; Wang, Q. In situ Ti2AlN reinforced TiAl-based composite with a novel network structure: Microstructure and flexural property at elevated temperatures. Mater. Sci. Eng. A 2019, 742, 231–240. [Google Scholar] [CrossRef]
  12. Gerdes, C.; Karimi, A.; Bieler, H.W. Water droplet erosion and microstructure of laser-nitrided Ti-6A1-4V. Wear 1995, 186–187, 368–374. [Google Scholar] [CrossRef]
  13. Yue, T.M.; Yu, J.K.; Mei, Z.; Man, H.C. Excimer laser surface treatment of Ti–6Al–4V alloy for corrosion resistance enhancement. Mater. Lett. 2002, 52, 206–212. [Google Scholar] [CrossRef]
  14. Man, H.C.; Bai, M.; Cheng, F.T. Laser diffusion nitriding of Ti–6Al–4V for improving hardness and wear resistance. Appl. Surf. Sci. 2011, 258, 436–441. [Google Scholar] [CrossRef]
  15. Fossati, A.; Borgioli, F.; Galvanetto, E.; Bacci, T. Corrosion resistance properties of plasma nitrided Ti–6Al–4V alloy in nitric acid solutions. Corros. Sci. 2004, 46, 917–927. [Google Scholar] [CrossRef]
  16. Li, Y.; Zhou, Z.; Yi, X.; Yan, J.; Xiu, J.; Fang, D.; Shao, M.; Ren, P.; He, Y.; Qiu, J. Improved seawater corrosion resistance of electron beam melting Ti6Al4V titanium alloy by plasma nitriding. Vacuum 2023, 216, 112463. [Google Scholar] [CrossRef]
  17. Cuthill, J.R.; Hayes, W.D.; Seebold, R.E. Nitriding Phenomena in Titanium and the 6Al-4V Titanium Alloy. J. Res. Natl. Bur. Stand. A Phys Chem. 1960, 64A, 119–125. [Google Scholar] [CrossRef] [PubMed]
  18. Luong, V.D.; Doan Dinh, P.; Linh, N.; Thinh, N.; Khanh, D.; Rubanik, V.; Bahrets, D. Impact of reactive nitrogen flow on morphology, mechanical properties, and biocorrosion behavior of sputtered TiN coatings towards orthopedic applications. Surf. Topogr. Metrol. Prop. 2023, 11, 035002. [Google Scholar] [CrossRef]
  19. GB/T 228.1-2021; Metallic materials—Tensile testing—Part 1: Method of test at room temperature. State Administration for Market Regulation: Beijing, China, 2021.
  20. Luk’yanenko, A.G.; Pohrelyuk, I.M.; Fedirko, V.M.; Molyar, A.G.; Trush, V.S.; Kravchyshyn, T.M. Gas nitriding of the near-beta-titanium alloy. Arch. Metall. Mater. 2023, 68, 431–438. [Google Scholar] [CrossRef]
  21. Zhou, Y.L.; Luo, D.M. Microstructures and mechanical properties of Ti–Mo alloys cold-rolled and heat treated. Mater. Charact. 2011, 62, 931–937. [Google Scholar] [CrossRef]
  22. Galvanetto, E.; Galliano, F.P.; Fossati, A.; Borgioli, F. Corrosion resistance properties of plasma nitrided Ti–6Al–4V alloy in hydrochloric acid solutions. Corros. Sci. 2002, 44, 1593–1606. [Google Scholar] [CrossRef]
  23. Farokhzadeh, K.; Edrisy, A.; Pigott, G.; Lidster, P. Scratch resistance analysis of plasma-nitrided Ti–6Al–4V alloy. Wear 2013, 302, 845–853. [Google Scholar] [CrossRef]
  24. Nolan, D.; Huang, S.W.; Leskovsek, V.; Braun, S. Sliding wear of titanium nitride thin films deposited on Ti–6Al–4V alloy by PVD and plasma nitriding processes. Surf. Coat. Technol. 2006, 200, 5698–5705. [Google Scholar] [CrossRef]
  25. Li, H.; Cui, Z.; Li, Z.; Zhu, S.; Yang, X. Surface modification by gas nitriding for improving cavitation erosion resistance of CP-Ti. Appl. Surf. Sci. 2014, 298, 164–170. [Google Scholar] [CrossRef]
  26. Batory, D.; Szymanski, W.; Panjan, M.; Zabeida, O.; Klemberg-Sapieha, J.E. Plasma nitriding of Ti6Al4V alloy for improved water erosion resistance. Wear 2017, 374–375, 120–127. [Google Scholar] [CrossRef]
Figure 1. Optical microstructures of the as-received sample: (a) low magnification; (b) high magnification.
Metals 15 01185 g001
Figure 2. Optical microstructures of the cross-section of nitrided samples: (a) 1#; (b) 2#; (c) 3#; (d) 4#; (e) 5#; (f) 6#; (g) 7#; (h) 8#; (i) 9#.
Metals 15 01185 g002
Figure 3. Substrate hardness of the nitrided samples: (a) nitrided for 4 h at different temperatures; (b) nitrided at 950 °C for different durations.
Metals 15 01185 g003
Figure 4. Cross-sectional SEM images of the nitrided samples: (a) 1#; (b) 2#; (c) 3#; (d) 4#; (e) 5#; (f) 6#; (g) 7#; (h) 8#; (i) 9#.
Metals 15 01185 g004
Figure 5. Cross-sectional element distribution diagrams of the surface areas in the nitrided samples: (a) 2#; (b) 5#; (c) 9#.
Metals 15 01185 g005
Figure 6. Cross-sectional EDS line scanning results of the surface areas in the nitrided samples: (a) 2#; (b) 5#; (c) 9#.
Metals 15 01185 g006
Figure 7. XRD patterns of the as-received and nitrided samples.
Metals 15 01185 g007
Figure 8. Tensile stress–strain curves (a) and mechanical properties (b) of the as-received and nitrided samples.
Metals 15 01185 g008
Figure 9. SEM images of the fracture cross-sections: (a) as-received sample; (b) 2#; (c) 5#; (d) 9#.
Metals 15 01185 g009
Figure 10. Cumulative weight losses of the as-received sample and Sample 2# during immersion in HF solutions of varying concentrations.
Metals 15 01185 g010
Figure 11. Surface morphologies of the samples after 60 min immersion: (a,b) As-received sample immersed in a 1% HF solution; (c,d) Sample 2# immersed in a 1% HF solution; (e,f) Sample 2# immersed in a 3% HF solution; (g,h) Sample 2# immersed in a 5% HF solution.
Metals 15 01185 g011
Figure 12. Surface morphologies of Sample 2# after immersion in a 1% HF solution for different durations: (a) 10 min; (b) 20 min; (c) 30 min.
Metals 15 01185 g012
Figure 13. Friction coefficient-wearing time curves of the samples under different loads: (a) 3 N; (b) 5 N; (c) 10 N.
Metals 15 01185 g013
Figure 14. Surface morphologies (ac) and three-dimensional morphologies (df) of the worn surfaces of as-received sample under different applied loads: (a,d) 3 N; (b,e) 5 N; (c,f) 10 N.
Metals 15 01185 g014
Figure 15. Surface morphologies (ac) and three-dimensional morphologies (df) of the worn surfaces of Sample 2# under different applied loads: (a,d) 3 N; (b,e) 5 N; (c,f) 10 N.
Metals 15 01185 g015
Figure 16. Cross-sectional profiles of wear scars for the as-received sample and Sample 2# under different applied loads: (a) 3 N; (b) 5 N; (c) 10 N.
Metals 15 01185 g016
Figure 17. Wear rates of the as-received sample and Sample 2# under different applied loads.
Metals 15 01185 g017
Table 1. Chemical composition of the as-received Ti-6Al-4V.
ElementTiAlVOFeCHN
Mass fraction/%Bal.6.154.200.110.14<0.02<0.001<0.01
Table 2. Nitriding processing parameters corresponding to each sample.
Sample NumberFactors
Nitriding Temperature/°CNitriding Duration/hNitrogen Flow Rate/mL·min−1
1#850110
2#850220
3#850430
4#900120
5#900230
6#900410
7#950130
8#950210
9#950420
Table 3. Average thicknesses of nitrided layers and surface hardnesses of nitrided samples.
Samples1#2#3#4#5#6#7#8#9#
Thickness/μm0.510.730.811.081.352.031.412.333.16
Hardness/HV0.3614.11661.31617.87624.58595.81657.57618.99665.34697.37
Table 4. Range analysis of nitrided layer thickness (μm).
Calculated ValueFactors
Nitriding TemperatureNitriding DurationNitrogen Flow Rate
K 1 0.681.001.62
K 2 1.491.471.66
K 3 2.302.001.19
Range   R K 1.621.000.47
Table 5. Variance analysis of nitrided layer thickness.
Calculated Value Factors
Nitriding Temperature Nitriding Duration Nitrogen Flow Rate
Sum of squares of deviations3.921.500.41
Freedom222
Mean square1.960.750.20
F -value25.859.902.68
p -value0.0370.0920.272
Table 6. Range analysis of surface hardness (HV0.3).
Calculated ValueFactors
Nitriding TemperatureNitriding DurationNitrogen Flow Rate
K 1 631.10619.32645.67
K 2 626.08640.82661.18
K 3 660.57657.60610.89
Range   R K 34.4938.2950.29
Table 7. Variance analysis of surface hardness.
Calculated ValueFactors
Nitriding TemperatureNitriding DurationNitrogen Flow Rate
Sum of squares of deviations2083.242209.943978.98
Freedom222
Mean square1041.621104.971989.49
F -value10.2810.9019.63
p -value0.0890.0840.048
Disclaimer/Publisher’s Note: The statements, opinions and data contained in all publications are solely those of the individual author(s) and contributor(s) and not of MDPI and/or the editor(s). MDPI and/or the editor(s) disclaim responsibility for any injury to people or property resulting from any ideas, methods, instructions or products referred to in the content.