Abstract
Al–Zn–Mg–Cu alloys are well known for their outstanding strength, toughness, and corrosion resistance, arising from the balanced addition of Mg, Zn, and Cu. However, conventional casting methods often lead to grain boundary segregation and the formation of coarse Fe-rich phases, which severely limit subsequent heat treatment and plastic processing. To overcome these drawbacks, this study systematically investigates the effects of the Continuous Rheo-Extrusion (CRE) process on the microstructure and mechanical performance of Al–Zn–Mg–Cu alloys using XRD, EBSD, SEM, and TEM analyses. The CRE process refines the average grain size from 53.5 μm to 16.1 μm and raises the fraction of high-angle grain boundaries to 88.8%. Moreover, coarse Fe-rich phases are fragmented to below 5 μm, while the elemental distribution of Zn, Mg, and Cu becomes more homogeneous, effectively reducing grain boundary segregation. The Al2Cu precipitates are refined from 106.3 nm to 11.7 nm, corresponding to an 88.9% size reduction. These microstructural optimizations yield a remarkable increase in tensile strength (from 204.7 ± 23.7 MPa to 338.0 ± 9.3 MPa) and elongation (from 11.4 ± 2.4% to 13.8 ± 1.3%). Quantitative analysis confirms that dislocation and precipitation strengthening are the dominant contributors to this improvement. Overall, the CRE process enhances microstructural uniformity through the synergistic effects of shear deformation, continuous dynamic recrystallization (CDRX), and dynamic precipitation, thereby providing a solid theoretical and practical foundation for short-process fabrication of high-strength, high-ductility Al–Zn–Mg–Cu alloys.
1. Introduction
As the automotive industry increasingly demands materials that combine light weight with high performance, aluminum alloys have become a major research focus due to their low density and high specific strength. However, conventional aluminum alloy systems exhibit limitations in practical applications: 5xxx series Al–Mg alloys, despite their excellent formability, weldability, and corrosion resistance, often possess insufficient strength for high-strength load-bearing components [1]; 7xxx series Al–Zn–Mg–Cu alloys offer high strength but are frequently limited by poor ductility and corrosion resistance, restricting their range of applications [1]. These drawbacks necessitate the development of new alloy compositions capable of achieving a superior property balance.
Building on this motivation, recent studies have focused on Al–Zn–Mg–Cu alloys, which offer a promising pathway to achieve synergistic improvements in strength and ductility through precise control of alloying ratios and optimized heat treatment [2]. Composition design studies reveal that Mg not only contributes to solid-solution strengthening but also promotes the formation of the β’ (Al8Mg5) phase, enhancing age-hardening potential. The combined addition of Zn and Cu facilitates the precipitation of η’ (MgZn2) and S’ (Al2CuMg) phases, both of which significantly enhance strength [3]. For example, Zhao et al. [4] reported that adding an appropriate amount of Cu can increase the yield strength by 80.5%. Liu et al. [5] investigated the dynamic deformation behavior, establishing a mechanistic foundation for designing crash-resistant Al–Zn–Mg–Cu alloys.
However, Al–Zn–Mg–Cu alloys still present challenges during plastic deformation. The strengthening process in these alloys are often accompanied by severe plastic instability [6]. Geng et al. [6] demonstrated that this phenomenon can be effectively mitigated by optimizing composition design and heat treatment processes to control the precipitate size and distribution.
In conventional thermomechanical routes, where ingots are subjected to subsequent rolling or extrusion, microstructural inhomogeneity and irregular precipitation of secondary phases are frequently observed, resulting in the formation of coarse Fe-rich intermetallic compounds. This behavior primarily originates from the slow cooling rate of conventional casting, which allows alloying elements to segregate and coarsen. Consequently, large chain-like precipitates often develop along grain boundaries, acting as preferential sites for crack initiation. Mei et al. [7] reported that such coarse grain-boundary phases severely compromise plasticity and toughness by facilitating early crack propagation. Furthermore, inevitable Fe impurities in the alloy tend to form coarse, brittle Fe-rich phases (e.g., Al3Fe, Al6(Fe,Mn)) during solidification, which are difficult to dissolve or fragment through traditional heat treatment or deformation processing [8]. Chen et al. [8] emphasized that these Fe-rich particles degrade mechanical performance, while Shen et al. [1] further noted that excessive Cu can lead to the precipitation of coarse Al2Cu phases, aggravating the loss of ductility. Collectively, these microstructural defects induce severe fluctuations in mechanical properties and hinder the further strengthening of Al–Zn–Mg–Cu alloys.
To overcome the microstructural defects introduced by conventional casting, researchers have developed two principal approaches: microalloying modification and process optimization.
The first strategy focuses on introducing trace alloying elements to suppress the formation and coarsening of secondary phases. For example, Wen et al. [9] found that minor additions of Sc and Zr promote the precipitation of fine Al3Sc and Al3Zr particles, which act as heterogeneous nucleation sites, thereby refining grain structure and inhibiting intergranular phase growth. The second strategy aims to control solidification behavior by adjusting processing parameters. Dutkiewicz et al. [10] demonstrated that increasing cooling rates or employing semi-solid techniques such as rheocasting can partially refine grains and secondary phases. However, both approaches present inherent limitations. Microalloying increases material cost and complexity, and the introduction of additional solute elements may lead to undesirable impurity phases or segregation. Meanwhile, semi-solid processing, though effective in refining the microstructure, requires precise process control and specialized equipment, hindering its scalability for industrial applications.
Given the challenges and inherent limitations of traditional processing routes, the Continuous Rheo-Extrusion (CRE) technique has recently attracted increasing attention as an innovative forming method. The CRE process integrates solidification and deformation within a single continuous step, effectively refining grains and enhancing microstructural uniformity by imposing intense shear deformation under semi-solid or near-liquid conditions. Compared with conventional extrusion or multistep routes—such as ingot casting followed by rolling or extrusion—the CRE process offers distinct advantages for large-scale industrial implementation. Its unique thermomechanical coupling enables simultaneous regulation of solidification kinetics and deformation behavior, thereby producing fine, homogeneous microstructures with improved mechanical integrity [11,12]. Moreover, the cooling rate during CRE has been identified as a critical parameter influencing melt structure evolution, and optimization of key parameters such as extrusion ratio and wheel speed can precisely tailor microstructure and performance [13,14]. Yang et al. [15] reported that CRE significantly refines the Al6(Mn,Fe) phase in Al–Mg–Mn–Fe alloys, enhancing mechanical properties, while subsequent studies [16,17,18,19] confirmed that dynamic recrystallization plays a dominant role in grain refinement and property evolution. In addition, continuous shear deformation during CRE promotes the fragmentation and redistribution of Fe-rich intermetallics, improving the homogeneity of the secondary-phase network and reducing microstructural anisotropy [20].
Despite these promising results, comprehensive investigations on the microstructure evolution and strengthening mechanisms of Al–Zn–Mg–Cu alloys processed by CRE remain limited. In particular, the coupled effects of severe plastic deformation, dynamic recrystallization, and dynamic precipitation have not been systematically analyzed. Therefore, this study aims to fill this research gap by employing XRD, EBSD, SEM, and TEM to explore the microstructural evolution and mechanical response of Al–Zn–Mg–Cu alloys under CRE processing. The novelty of this work lies in providing a quantitative and mechanistic understanding of the synergistic strengthening contributions arising from grain refinement, dislocation accumulation, and nanoscale precipitation, thereby offering theoretical and technological guidance for the industrial fabrication of high-strength, high-ductility Al–Zn–Mg–Cu alloys.
2. Materials and Methods
2.1. Material Preparation
The experimental materials consisted of commercial 5182 Al–Mg alloy, high-purity zinc (99.999%), and an Al–50Cu master alloy containing 50 wt.% Cu. The alloy was prepared through the following melting procedure: the 5182 alloy was first melted at 720 °C for 1 h to ensure complete liquefaction, after which pure Zn and Al–50Cu were added according to the designed composition. The melt was maintained at temperature for 30 min to achieve full compositional homogenization. Subsequently, hexachloroethane (C2Cl6) was introduced as a refining and degassing agent, and the melt was held for 15 min to complete the impurity-removal pretreatment.
The pre-treated melt was then used to prepare samples by two methods: First, it was cast into a preheated casting steel mold at 200 °C using the gravity casting process. Second, the melt was shaped using the self-developed CRE-300 continuous rheo-extrusion machine (State Key Laboratory of Rolling Technology and Continuous Rolling Automation (RAL), Shenyang, China), with the extrusion wheel set at a rotation speed of 11 r/min, cooling water flow rate set at 1 m3/h, the gap between the wheel shoes set at 15 mm × 10 mm, the wheel diameter set at 300 mm, and the extrusion die diameter set at 9.5 mm.
To verify the chemical composition, samples were collected from the melt prior to casting and analyzed using inductively coupled plasma atomic emission spectroscopy (ICP–AES (Thermo Fisher Scientific, Waltham, MA, USA)). The measured compositions are summarized in Table 1, and schematic illustrations of the gravity casting and CRE processes are presented in Figure 1.

Table 1.
Chemical composition of the alloy (in wt.%).
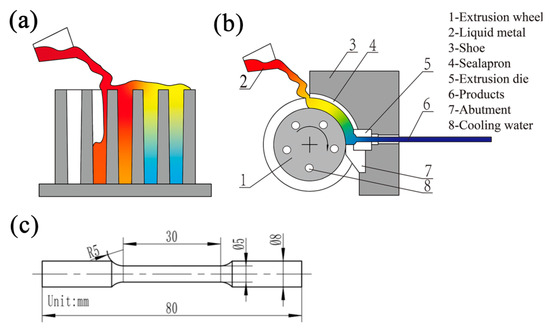
Figure 1.
Schematic diagram of the Al–Zn–Mg–Cu alloy preparation processes: (a) Gravity casting; (b) CRE; (c) Tensile test specimen dimensions (mm).
2.2. Mechanical Property Measurement
Tensile and hardness tests were performed to evaluate the mechanical properties of the alloys prepared by different casting routes.
Standard dog-bone tensile specimens were prepared in accordance with GB/T 228.1-2021 [21]. The specimen geometry is shown in Figure 1c. Three parallel samples were tested under each processing condition to ensure reproducibility. Tensile tests were carried out at room temperature using a WDW-100D universal testing machine (Changchun Testing Machine Research Institute, Changchun, China), operating at a constant crosshead speed of 0.5 mm·min−1. Strain was recorded using a clip-on extensometer. The engineering stress–strain curves were recorded automatically, and the ultimate tensile strength (UTS), yield strength (YS), and total elongation (EL) were determined from the average of three valid tests.
The Vickers microhardness of the samples was measured using a HV-1000 microhardness tester (Shanghai Taiming Optical Instrument Co., Shanghai, China). Tests were conducted under a load of 200 g (1.96 N) with a dwell time of 15 s, following the GB/T 4340.1-2024 standard [22]. Five indentations were made on each polished sample surface with a minimum spacing of three times the diagonal length to avoid mutual influence, and the average value was reported as the representative hardness.
2.3. Microstructure Characterization
2.3.1. X-Ray Diffraction (XRD) Analysis
Phase analysis of the materials was performed using an X-ray diffractometer (XRD Panalytical X’ Pert Pro, Malvern Panalytical, Almelo, The Netherlands) equipped with Cu Kα radiation (λ = 1.5406 Å) operated at 40 kV and 40 mA. Peak broadening data were analyzed using the Williamson–Hall (W–H) method to estimate lattice strain and dislocation density, where b represents the Burgers vector of aluminum [23].
2.3.2. Scanning Electron Microscopy (SEM) Analysis
The microstructure of the specimens was observed using a ZEISS-ULTRA 55 scanning electron microscope (Scanning Electron Microscopy, SEM) (ZEISS, Oberkochen, Germany), followed by analysis of the composition and grain size using the integrated Energy Dispersive Spectrometer (EDS) and Electron Back Scattering Diffraction (EBSD) in the SEM. The SEM samples were first ground with sandpaper and then mechanically polished using a polishing cloth with diamond paste to achieve a smooth, scratch-free surface. EBSD sample preparation: After fine grinding with sandpaper, the samples were mechanically polished, followed by electro-polishing. The electro-polishing solution was a 5% perchloric acid ethanol solution, with the voltage set between 20–25 V, and the temperature controlled within the range of −35 °C to −25 °C. The step size was 1.5 μm. After electro-polishing, the samples were ultrasonically cleaned in ethanol for 5 min to remove any residual electrolyte.
2.3.3. Transmission Electron Microscopy (TEM) Analysis
The precipitate morphology and crystal structure were characterized using transmission electron microscopy (TEM). Both FEI Tecnai F20 (FEI, Hillsboro, OR, USA) and JEOL JEM-2010 (JEOL, Tokyo, Japan) instruments were operated at an accelerating voltage of 200 kV. Selected-area electron diffraction (SAED) and high-resolution TEM (HRTEM) were employed to identify precipitate phases and analyze the interface relationship between precipitates and the matrix.
TEM sample preparation was performed using the twin-jet electropolishing technique. Thin foils were prepared in an electrolyte consisting of 65 vol.% nitric acid and methanol (volume ratio 3:7), with a polishing current of 60–80 mA and a temperature maintained at −35 °C to −25 °C. The samples were ultrasonically rinsed in ethanol immediately after polishing to prevent oxidation.
3. Results
3.1. Microstructure
Figure 2 illustrates the EBSD maps of the Al–Zn–Mg–Cu alloys fabricated by gravity casting and continuous rheo-extrusion (CRE). Both samples exhibit a predominant <110> and <111> grain orientation distribution, typical of face-centered cubic (FCC) aluminum alloys. Nevertheless, distinct differences in grain morphology, size uniformity, and grain boundary characteristics can be observed between the two processing routes.
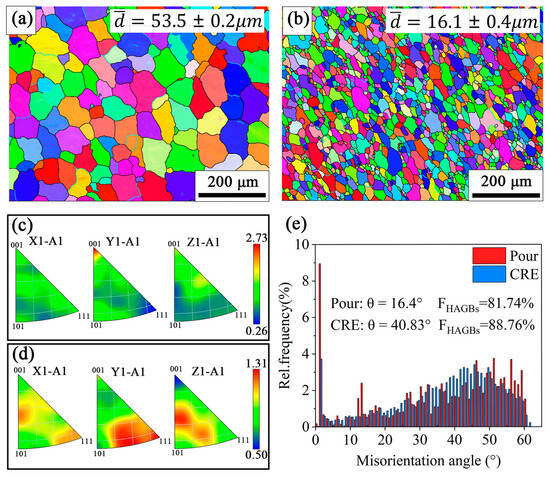
Figure 2.
(a,b) Grain orientation distribution IPF maps of Al–Zn–Mg–Cu alloys prepared by different methods, (c,d) Pole figures, (e) Distribution of adjacent grain boundary orientation angles: (a,c) Gravity casting; (b,d) CRE.
In the gravity-cast sample (Figure 2a,c,e), the random grain orientation results from the relatively slow cooling rate and the absence of external shear during solidification. The pole figure analysis indicates a maximum texture intensity of 2.73 and a minimum of 0.26 near the <111> direction, suggesting a weak and non-uniform texture distribution. This heterogeneity is attributed to the unrestricted grain growth typical of conventional gravity casting, where nucleation occurs randomly without directional preference [24]. In contrast, the CRE-processed sample (Figure 2b,d,e) exhibits a weaker texture intensity (maximum 1.31, minimum 0.50) but a more pronounced preferred orientation, indicating that intense shear deformation and dynamic recrystallization during CRE promote grain refinement and texture evolution [1].
As shown in Figure 2e, the average grain boundary misorientation angle (θ) of the gravity-cast sample is 16.4°, with a prominent peak in the low-angle region (0–5°), indicating the presence of subgrain boundaries and dislocation cell structures formed during solidification. Although partial static recrystallization may have occurred, a considerable number of low-angle boundaries remain. The fraction of high-angle grain boundaries (HAGBs) reaches 81.8%, suggesting partial recrystallization but also orientation restrictions and incomplete dislocation annihilation in certain regions.
In contrast, the CRE-processed sample shows a dramatic increase in the average misorientation angle to 40.8°, with the HAGB fraction rising to 88.8%. The misorientation histogram reveals a clear shift from the low-angle to high-angle region (30–60°), indicating that continuous dynamic recrystallization (CDRX) and shear deformation effectively promoted grain boundary transformation and randomization.
From the grain size perspective, the CRE-processed alloy exhibits significantly finer and more uniformly distributed grains (average size: 16.1 μm) compared to the coarser and heterogeneous grains (average size: 53.5 μm) observed in the gravity-cast sample. This pronounced refinement is mainly attributed to continuous dynamic recrystallization (CDRX) occurring during the CRE process. Under high strain-rate and high-stress deformation conditions, large amounts of dislocations are introduced and accumulated, increasing the stored deformation energy, which in turn promotes the formation of recrystallization nuclei. Subsequent dislocation rearrangement and subgrain rotation lead to the progressive evolution of high-angle grain boundaries, thereby completing recrystallization and producing an equiaxed fine-grained microstructure [24].
Figure 3a–c present the dynamic recrystallization (DRX) distribution maps and statistical results for both the gravity-cast and CRE samples. The fraction of recrystallized regions in the CRE-processed alloy reaches 97.97%, compared with 93.68% in the gravity-cast alloy, while the corresponding fraction of substructure regions decreases markedly. The discrepancy between the HAGB fraction and the recrystallized area fraction may be due to the presence of deformed grains that have not fully recrystallized but still contain high-angle boundaries. This phenomenon can be attributed to strain energy accumulation and dynamic recovery (DRV) during the CRE process [11,12]. The elevated strain energy facilitates dislocation rearrangement and subgrain boundary rotation, accelerating the conversion from low-angle to high-angle grain boundaries and thereby enhancing recrystallization completeness. From Figure 3a, it can also be observed that the grain boundary uniformity in the gravity-cast sample is more significant, with some grain boundaries appearing indistinct and a higher number of low-angle grain boundaries (LAGBs). These boundaries are typically regions where dislocations accumulate, which may lead to stress concentration during tensile deformation, increasing the risk of embrittlement.
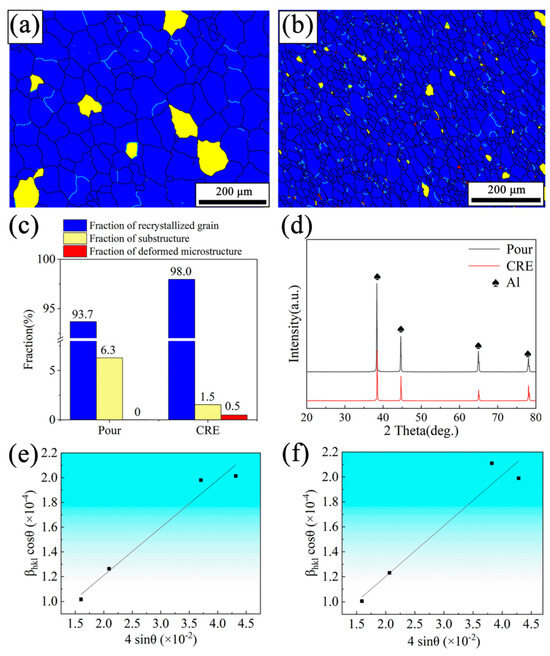
Figure 3.
Dynamic recrystallization distribution maps of Al–Zn–Mg–Cu alloys prepared by different methods: (a) Gravity casting; (b) CRE; (c) Statistical results of dynamic recrystallization characteristic regions; (d) XRD analysis; (e,f) Inset images of the Williamson-Hall plots for gravity casting and CRE, where the slope and intercept are used to calculate microstrain and grain size.
Figure 3d shows the XRD patterns of gravity-cast and CRE samples. Both samples exhibit characteristic diffraction peaks mainly corresponding to α-Al matrix phase, confirming that no new crystalline phases formed during processing. However, the CRE sample exhibits noticeably lower peak intensity and pronounced peak broadening compared with the gravity-cast sample. This peak broadening primarily originates from two mechanisms: Grain refinement induced by severe plastic deformation (SPD) during the rheo-extrusion process, which reduces the coherent scattering domain size and an increase in lattice microstrain resulting from a high dislocation density, leading to local lattice distortion. These combined effects contribute to the observed full width at half maximum (FWHM) broadening, reflecting a higher defect density and refined microstructure in the CRE-treated alloy.
Figure 4 presents SEM micrographs and corresponding EDS elemental maps of the Al–Zn–Mg–Cu alloys fabricated via gravity casting and CRE processing. In the gravity-cast alloy (Figure 4a), a typical dendritic solidification morphology is observed, characterized by coarse primary grains and heterogeneous distribution of second-phase particles along the grain boundaries. The coarse interdendritic constituents exhibit elemental segregation, particularly of Mg, Zn, and Cu, indicating the formation of eutectic and Fe-rich phases. In contrast, the CRE-processed alloy (Figure 4c) shows a completely transformed microstructure. The dendritic morphology disappears, and the grains become fine and equiaxed with a uniform dispersion of second-phase particles. Only a small number of fine white precipitates are observed at the grain boundaries, where Zn and Mg are slightly enriched according to EDS results. These observations confirm that the strong shear deformation and dynamic solidification conditions in CRE effectively suppressed element segregation and promoted compositional uniformity.
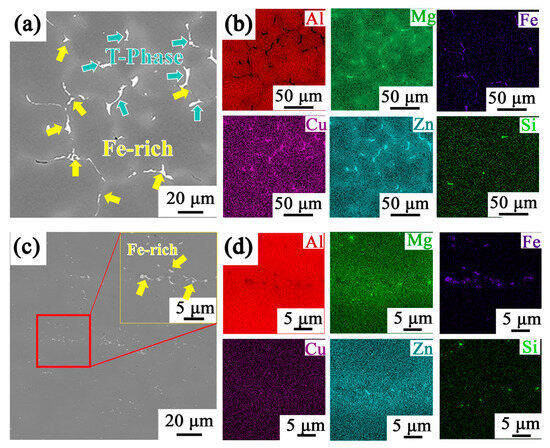
Figure 4.
Scanning electron microscope images and corresponding energy dispersive spectroscopy (EDS) scan results of Al–Zn–Mg–Cu alloys prepared by different casting methods: (a,b) Gravity casting; (c,d) CRE.
The observed differences in microstructure and second-phase distribution between the gravity-cast and CRE-processed alloys are primarily attributed to severe plastic deformation (SPD) and continuous dynamic recrystallization (CDRX) that occur during CRE. Under the intense shear and high strain-rate conditions of CRE, coarse interdendritic and Fe-rich particles are mechanically fragmented, producing finer and more uniformly dispersed second-phase fragments. Concurrently, the high density of dislocations and abundant short-circuit diffusion paths (dislocations, grain boundaries) accelerate solute atom migration toward dislocation-rich regions, promoting dynamic precipitation and the formation of nanoscale strengthening phases. Moreover, grain-boundary migration during CDRX aids in redistributing second phases away from continuous interdendritic networks, thereby reducing element segregation and improving compositional homogeneity [25].
Figure 4b shows the EDS mapping results, where significant element segregation of Mg, Zn, Cu, and Fe is observed in the gravity-cast alloy. In particular, coarse eutectic phase clusters are formed at the triple grain boundary regions, with the enrichment of Mg, Zn, and Cu elements in the same locations, suggesting that this phase may be the Mg–Zn-based T phase [2,26]. Additionally, Fe forms coarse Fe-rich phases at the grain boundaries. These coarse eutectic phases, which have a network-like distribution, are hard and brittle, making them prone to becoming stress concentration points during subsequent loading, thereby initiating crack nucleation and propagation, significantly damaging the material’s plasticity and toughness. This uneven element distribution is mainly caused by compositional segregation during solidification and the relatively slow cooling rate. In contrast, the CRE-processed alloy (Figure 4d) exhibits significantly refined second-phase particles with sizes reduced to approximately 5 μm, and the distribution is more uniform, highlighting the core advantage of the CRE process in microstructure regulation. No significant Cu element enrichment was detected in the CRE sample, which is likely due to the SPD that promotes more Cu atoms into solid solution in the matrix.
Figure 5 presents TEM images for Al–Zn–Mg–Cu alloys prepared by different methods, showing the morphology of Al2Cu phases and dislocations. In the gravity-cast sample (Figure 5a), large Al2Cu particles are surrounded by irregular, entangled dislocation networks that form dislocation walls or cells, indicating a local dislocation pile-up and a pronounced particle-pinning effect. In contrast, the CRE sample (Figure 5b) exhibits a markedly higher dislocation density with a finer, more complex entangled structure and, in places, nascent subgrain boundaries. These nanoscale Al2Cu precipitates act as effective obstacles to dislocation motion, thereby enhancing precipitation strengthening; combined with the refined grain structure and elevated dislocation density after CRE, this contributes substantially to the observed yield-strength increase.
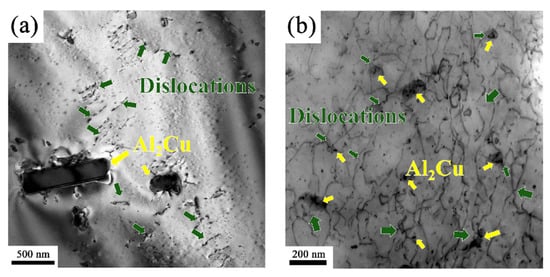
Figure 5.
TEM images of Al–Zn–Mg–Cu alloys prepared (a,b) showing the morphology of Al2Cu phases and dislocations; Al2Cu phases and dislocations are indicated by yellow and green arrows, respectively: (a) Gravity casting; (b) CRE.
Figure 6 shows the TEM images and EDS mapping results of Al–Zn–Mg–Cu alloys prepared by different processes. As shown in Figure 6a, large coarse second-phase particles (approximately 256 ± 45 nm in size) with irregular morphology are present in the cast sample. The element mapping results show significant element segregation of Mg, Zn, and Cu, with a very uneven distribution in the matrix. After CRE processing, the alloy’s microstructure undergoes significant transformation: the second-phase particle size is refined to 63 ± 15 nm, the morphology becomes more regular, and the particles are more evenly distributed in the matrix. The specific mechanisms behind this microstructure evolution are as follows: First, high strain-rate deformation promotes the fragmentation of the original coarse second-phase particles; second, the dynamic recrystallization process helps the second-phase particles redistribute more evenly; third, the SPD in the CRE process provides favorable conditions for element diffusion.
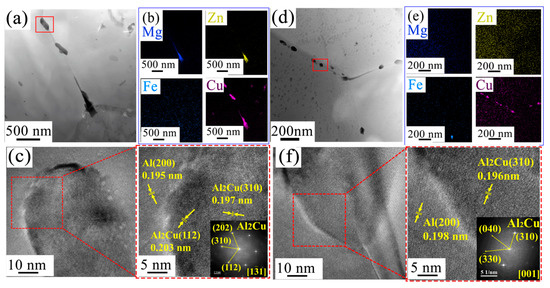
Figure 6.
TEM images of Al–Zn–Mg–Cu alloys prepared by different processes. (a,d) Bright field images; (b,e) Corresponding EDS scan results; (c,f) High-resolution TEM images of the areas within the red boxes, with the corresponding Fast Fourier Transform (FFT) images as insets: (a–c) Gravity casting; (d–f) CRE.
Figure 6f shows the high-resolution TEM image of the CRE sample, clearly showing that nano-sized Al2Cu precipitates (with a (200) interplanar spacing of 0.197.7 ± 12.0 nm) are uniformly dispersed both inside the fine Al matrix (with a (310) interplanar spacing of approximately 0.196 nm) and at the grain boundaries, which is a typical feature of dynamic precipitation. Under the high-temperature and high-strain-rate conditions of CRE, intense dynamic recrystallization or dynamic recovery occurs within the alloy, and the lattice distortion regions formed provide abundant non-uniform nucleation sites for solute atoms (Cu, Mg, Zn, etc.), significantly promoting the nucleation process while effectively suppressing the Ostwald ripening of the precipitates. Meanwhile, the existence of dislocations, grain boundaries, and other short-circuit diffusion pathways greatly accelerates the diffusion rate of solute atoms, leading to widespread and uniform distribution of the precipitates both inside the grains and at the grain boundaries. These dispersed nanoscale phases, acting as non-shearable particles, effectively pin dislocations and hinder grain boundary migration, generating a significant synergistic effect of precipitation strengthening and grain boundary strengthening.
In contrast, Figure 6c shows that in the cast alloy, although the FFT spectra confirm the presence of Al2Cu phases, the precipitation primarily occurs during the later stage of cooling and solidification, tending to accumulate and coarsen in regions with lower energy, such as grain boundaries or interdendritic regions. This leads to the formation of larger Al2Cu particles, which makes it difficult to establish a high-efficiency dispersion strengthening network similar to that in the CRE state, thus limiting the strengthening effect.
In summary, the advantage of the CRE process lies in its ability to achieve significant microstructural optimization through a single forming step: not only does it promote dynamic recrystallization, but it also effectively suppresses the formation of coarse second phases. Compared to traditional multi-pass cumulative continuous extrusion processes, despite the smaller amount of deformation in CRE, an ideal microstructure can still be obtained by properly controlling the process parameters [24]. Notably, the CRE samples exhibit clearer and more regular lattice fringes, indicating that this process can effectively reduce crystal defect density, thus laying the microscopic foundation for achieving excellent mechanical properties.
3.2. Tensile Property Differences
Figure 7a,b show the stress–strain curves and statistical results of ultimate tensile strength (UTS), yield strength (YS), and elongation (EL) and Vickers hardness values for Al–Zn–Mg–Cu alloys prepared by different methods. As seen in Figure 7b the mechanical properties of the CRE-processed sample show a significant improvement compared to the gravity-cast sample: UTS increases from 204.7 ± 23.7 MPa to 338.0 ± 9.3 MPa, YS increases from 97.7 ± 12.0 MPa to 183.9 ± 7.2 MPa, EL increases from 11.4 ± 2.4% to 13.8 ± 1.3%, and average Vickers hardness from 527.9 ± 21.4 HV to 551.0 ± 20.1 HV.
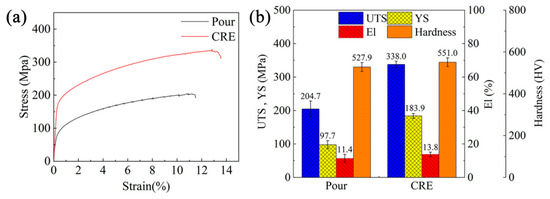
Figure 7.
(a) Stress–strain curves of Al–Zn–Mg–Cu alloys prepared by different processes; (b) Statistical results of mechanical properties.
The CRE sample demonstrates superior yielding characteristics, with yield strength significantly higher than the gravity-cast sample. Additionally, the plastic deformation phase exhibits a clear strain hardening effect. This simultaneous improvement in strength and plasticity is primarily attributed to the microstructural evolution and synergistic effects of multiple strengthening mechanisms during the CRE process. On one hand, solute atoms dissolve into the Al matrix, causing lattice distortion, and solute segregation at the grain boundaries forms defect strengthening. On the other hand, the material undergoes a complex thermo-mechanical coupling process during CRE—high strain rate deformation significantly refines the grain size, accompanied by dynamic recrystallization. Refining elements such as Zr and Ti effectively suppress the growth of recrystallized grains, ultimately forming a uniformly fine equiaxed grain structure. The refined grains and evenly distributed second phases effectively impede dislocation movement, allowing the material to maintain structural integrity under large strains without fracture, thus exhibiting better plasticity and ductility.
The serrations observed in the stress–strain curve of the gravity-cast sample are characteristic of the Portevin-Le Chatelier (PLC) effect [6], which is common in Al–Mg alloys. This phenomenon is attributed to dynamic strain aging caused by the interaction between Mg atoms and dislocations. The absence of pronounced serrations in the CRE sample suggests that the refined microstructure and homogeneous distribution of solute atoms reduce the susceptibility to the PLC effect.
Figure 8 Fracture morphology of gravity-cast and CRE-formed samples. The gravity-cast sample exhibits typical brittle fracture characteristics, while the CRE-formed sample primarily shows ductile fracture with a mixed fracture feature.
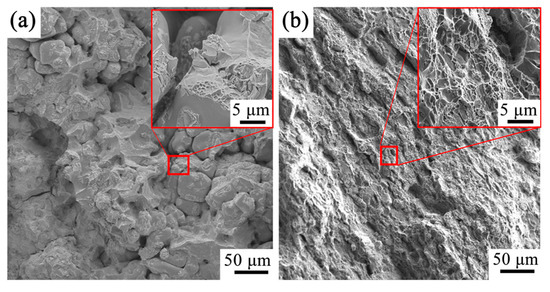
Figure 8.
Fracture morphology SEM images of Al–Zn–Mg–Cu alloys prepared by different processes at room temperature: (a) Gravity casting; (b) CRE.
The fracture surface of the gravity-cast sample (Figure 8a) at low magnification clearly shows typical intergranular fracture features. High-magnification images further reveal extensive intergranular fracture features, consistent with its low elongation rate (11.4 ± 2.4%). This fracture behavior is primarily attributed to the coarse grains and unevenly distributed second-phase particles in the cast structure: in particular, the coarse Fe-rich intermetallic compounds precipitated at the grain boundaries easily form stress concentration points, promoting crack initiation and propagation. At the same time, due to the lower strength of the grain boundaries, cracks tend to propagate along the grain boundaries, ultimately leading to cleavage fracture.
In contrast, the fracture of the CRE-processed sample (Figure 8b) exhibits significantly more ductile fracture characteristics: the low-magnification image shows a distinctly rough fracture surface, with typical shear lips and tear ridges. In Figure 8b, a large number of uniformly distributed ductile dimples are visible, and their formation is closely related to the distribution of fine second-phase particles. At high magnification, the depth and morphology of the ductile dimples can be clearly observed, showing a typical “honeycomb” pattern. The dimple size distribution is relatively uniform, with most diameters in the 1–3 μm range, indicating that after nucleation, micropores do not easily expand. This is related to the fine second-phase particles (Figure 6f) and the high-density grain boundaries (Table 2), which effectively hinder the coalescence of micropores and is consistent with the fine precipitate size formed during the CRE process. Moreover, the increased number of ductile dimples per unit area reflects the increased nucleation sites for micropores, but because the dimples are small and evenly distributed, early fracture caused by localized stress concentration is avoided. Additionally, from the contrast in shadow intensity of the dimples, it can be seen that the CRE-formed sample has a significantly larger depth-to-width ratio for its ductile dimples compared to the gravity-cast sample, indicating that the voids underwent more severe three-dimensional plastic deformation before fracture. The formation of deeper dimples requires higher local strain and dislocation slip distances, which is reflected in the increase in the material’s macroscopic elongation in Figure 7b.

Table 2.
EBSD Results of Al–Zn–Mg–Cu Alloys under Different Casting Processes.
Figure 9a,b show the tensile fracture morphology and corresponding EDS elemental mapping results of gravity-cast and CRE-treated samples.
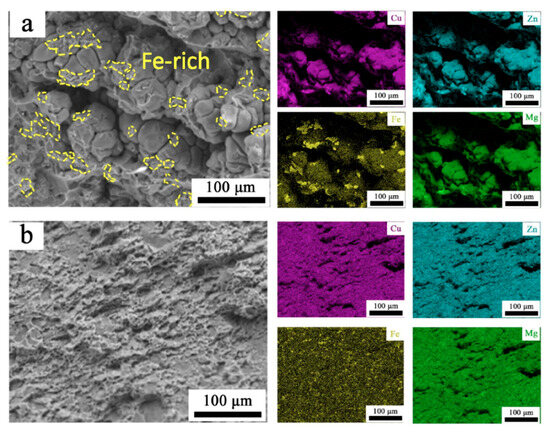
Figure 9.
Fracture morphology SEM images of Al–Zn–Mg–Cu alloys prepared by different processes at room temperature and corresponding EDS elemental mapping results: (a) Gravity casting; (b) CRE.
From the fracture morphology, the gravity-cast sample (Figure 9a) exhibits typical brittle fracture characteristics, with numerous large and protruding blocky Fe-rich phase particles (marked by yellow dashed boxes as “Fe-rich”), surrounded by intergranular fracture traces. These large Fe-rich phases precipitate along the interdendritic or grain boundary regions during solidification, forming irregularly large compound clusters that appear as protruding blocky features at the fracture surface. The EDS mapping results in Figure 9b show significant Fe enrichment in these areas, forming large-sized Fe-rich phases. These Fe-rich phases, as hard and brittle particles, are prone to becoming stress concentration points under tensile loading, which induces crack initiation. Once cracks initiate at these brittle particles, they rapidly propagate along the particle-matrix interfaces or through the particles, ultimately leading to brittle fracture, which is consistent with the lower tensile strength and elongation of the sample.
In contrast, the fracture morphology of the CRE-treated sample (Figure 9b shows significant changes: the fracture surface is finer and more uniform, exhibiting ductile fracture characteristics, and no large clusters of Fe-rich particles are observed. The EDS mapping results in Figure 9b also show that Fe is more uniformly distributed in the CRE sample, with no locally highly concentrated large particles. This difference arises from the intense shear deformation introduced during the CRE process: under strong shear forces, the original coarse Fe-rich particles are broken up and dispersed throughout the matrix. Additionally, the high temperature and deformation may promote the dissolution and re-precipitation of some Fe-rich phases, forming finer, more dispersed particles. These dispersed fine Fe-rich phases significantly reduce the stress concentration effect and no longer serve as primary crack initiation sources. Instead, they may delay crack propagation rates by pinning dislocations, which improves the material’s plasticity and toughness.
4. Discussion
After CRE processing, the average grain size of the Al–Zn–Mg–Cu alloy is markedly reduced (Table 2), which motivates an analysis of the underlying microstructural evolution. This section therefore centers on CDRX as the principal mechanism responsible for grain refinement during CRE. CDRX proceeds via the progressive evolution of dislocation networks, subgrain formation and rotation, and the gradual transformation of low-angle into HAGBs [27]. The EBSD recrystallization maps (Figure 3) and misorientation statistics (Figure 2) provide the quantitative evidence supporting a three-stage CDRX pathway in the present alloys.
4.1. Dislocation Reorganization and Subgrain Formation (Polygonization Stage)
Under the high stored strain energy generated by CRE’s intense shear deformation, dislocations rapidly multiply and rearrange into low-energy walls and tangles, leading to the nucleation of subgrains bounded by low-angle grain boundaries (LAGBs). The presence of dislocation walls, cells and nascent subgrain boundaries (see arrows in Figure 3b) is consistent with the polygonization stage of CDRX.
4.2. Subgrain Boundary Merging and Increased Orientation Difference (Core CDRX Stage)
As deformation continues, adjacent subgrains rotate and merge under strain [27]. By absorbing moving dislocations, the dislocation density at the subgrain boundaries increases, leading to a gradual increase in the orientation difference between adjacent subgrains. This mechanism causes the original low-angle grain boundaries to evolve into high-angle grain boundaries. The grain boundary orientation difference distribution statistics in Figure 2e provide key quantitative evidence for this process: compared to the cast state, the orientation difference peak in the CRE sample significantly shifts from the low-angle region to the high-angle region around 30–60°, directly proving the successful transformation of subgrain boundaries into HAGBs.
4.3. HAGBs Migration and Grain Refinement (Completion of Recrystallization)
Once subgrain boundaries transform into HAGBs, they acquire higher mobility. Under concurrent thermal activation and ongoing deformation, these boundaries migrate and consume dislocation-rich regions, producing equiaxed, low-dislocation recrystallized grains [28]. The EBSD recrystallization distribution maps and grain size distribution maps in Figure 3a,c clearly show the final result of this process: after CRE treatment, the recrystallized area ratio reaches 97.97%, and the grain size is significantly refined (the average size is reduced from 53.5 μm in the cast state to 16.1 μm), with the grain size distribution becoming more concentrated, showing typical fully recrystallized microstructure features.
In summary, CRE provides a high-strain, shear-dominant thermo-mechanical path that promotes CDRX, producing a fine, equiaxed microstructure with a high fraction of HAGBs—a microstructure that sets the stage for multiple synergistic strengthening mechanisms (grain-boundary, precipitation, and dislocation strengthening).
From the perspective of strengthening mechanisms, the equiaxed grains in the gravity-cast state show static recrystallization characteristics, while the elongated grains in the CRE-processed state inhibit the equiaxed growth of recrystallized grains due to continuous plastic deformation [24]. The significant difference in grain size between the two processes is mainly attributed to the intense shear deformation and the synergistic effect of dynamic recrystallization experienced by the material during CRE [26]. The fine and evenly distributed second-phase particles in the CRE material more effectively impede dislocation motion, while the greater solid solution of solute atoms enhances the solid solution strengthening effect [1]. This synergistic effect results in superior mechanical properties. In contrast, while the coarse Fe-rich phases in the traditional gravity-cast material can provide some strengthening, their uneven distribution leads to stress concentration, which is detrimental to the improvement of overall performance.
To explore the response mechanism of yield strength to microstructural changes after CRE processing (compared to the gravity-cast alloy), this study reveals the incremental contributions of four strengthening mechanisms: grain boundary strengthening (), solid solution strengthening (), second-phase strengthening () and dislocation strengthening (). These mechanisms collectively drive the increase in yield strength (), and their quantitative relationship can be calculated through the relevant formulas [29,30,31]. The specific analysis is as follows:
4.3.1. Grain Refinement Strengthening
Al–Zn–Mg–Cu alloys have a face-centered cubic (FCC) structure with relatively high stacking fault energy (166 mJ/m2), making them prone to dynamic recovery (DRV) during hot deformation [24,31]. Under high strain rate conditions, the rapid accumulation of stored energy promotes the occurrence of continuous dynamic recrystallization (CDRX), which significantly refines the grains [18]. Grain boundary strengthening follows the Hall-Petch relationship, and its contribution to strength can be described by the Hall-Petch equation [31]:
In this study, the Hall-Petch coefficient, k, is taken as 0.14 MPa·m1/2 [23], with the average grain sizes before and after CRE treatment denoted as d0 and d1, respectively, with values of 53.5 μm and 16.5 μm. In the continuous large-strain process of CRE, dynamic recrystallization unfolds as a progressive, multi-stage phenomenon. The fine grains initially formed by continuous dynamic recrystallization feature high-density grain boundaries, which play dual roles in subsequent deformation. Firstly, they act as dislocation barriers, increasing local energy storage through dislocation stacking and thereby providing stronger driving forces for subsequent dynamic recrystallization. Secondly, they enhance strain coordination capabilities, promoting more uniform nucleation. These interstitial modifications constitute significant obstacles during dislocation slip while simultaneously enhancing strain adaptation capabilities throughout deformation [13,28]. The significant increase in the average orientation angle and the enhanced peak in the high-angle region of Figure 2e are direct results of CDRX, leading to a marked increase in the proportion of high-angle grain boundaries (HAGBs), which significantly increases the grain boundary density (ρGB). Additionally, grain refinement significantly increases the grain boundary area fraction, enhancing resistance to dislocation motion and promoting homogeneous deformation. The equiaxed grain structure formed during dynamic recrystallization improves stress distribution and reduces stress concentration.
4.3.2. Second-Phase Strengthening
Transmission electron microscopy (TEM) results show that during CRE, the strengthening phases are more finely and uniformly distributed. This is due to the combined effects of the quasi-fast solidification and SPD from the CRE process, which refines the coarse Fe-rich phases [23]. According to the classical formula of the stress concentration coefficient Kt [32]:, where Kt is the stress concentration factor, a is the defect size and ρ is the phase curvature radius, . As shown in Figure 9, the coarse Fe-rich phases (Kt = 4.06), which act as crack initiation sources, induce intergranular fracture, while the refined phases (Kt = 2.02) promote uniform plastic deformation. This reduction by 50.2%, increases the crack initiation energy barrier [33], and based on the formula , it can be seen that the elongation improves.
Moreover, the fragmented second-phase particles inhibit grain growth during the recrystallization process through a pinning effect, helping to maintain the deformation texture. This nanoscale dispersion significantly enhances the role of the Orowan bypass mechanism, leading to second-phase strengthening [31]:
The uniform distribution and small size of the precipitates are beneficial for increasing resistance to dislocation motion [34,35,36]. In the CRE-formed samples, the average size of the second-phase particles decreases to approximately 0.5 μm, and their distribution becomes more uniform, which is favorable for the nucleation and growth of ductile dimples, promoting the development of ductile fracture mechanisms. Meanwhile, the CRE process significantly reduces the effect of Fe-rich phases as stress concentrators by optimizing their size and distribution, effectively suppressing brittle fracture and significantly improving the overall mechanical properties of Al–Zn–Mg–Cu alloys. Furthermore, no other phases were observed in the alloys before and after CRE, so it can be assumed that all other solute elements have dissolved into the α-Al matrix. Therefore, it can be considered that the elemental composition before and after CRE does not change significantly, and the contribution of solid solution strengthening is minimal.
4.3.3. Dislocation Strengthening
During the CRE process, the material is under a complex stress state: the main shear stress direction forms a specific angle with the extrusion direction, which promotes grain slip and rotation along the direction of maximum shear stress [37], resulting in grain orientation rearrangement. As seen in Figure 4, the Y1-Al direction forms an α-fiber texture component, with strong textures in the Y1 and Z1 directions, reflecting the preferential activation of the {111} slip system and the preferential grain orientation caused by plastic deformation. The formation of specific crystallographic orientations alters the activation conditions of the slip systems, affecting the material’s plastic deformation behavior [37]. The accumulation of strain generates a large number of dislocations, leading to a significant increase in dislocation density. The relationship between dislocation strengthening () and dislocation density () can be described by the Bailey-Hirsch equation [31]:
where is a constant, M is the average orientation factor, and dislocation density () is estimated using the Williamson-Hall (W-H) method based on X-ray diffraction (XRD) [23]. According to the XRD pattern in Figure 3d, select the four diffraction peaks (111), (200), (220), and (311), and the Pseudo-Voigt function was used to fit the Bragg angle (θ) and the integral half-width () for each peak. Both and θ are converted to radians (rad). The contribution of grain size (D) and microstrain (ε) to peak broadening follows the following formula: , where Ks the Scherrer constant with a value of 0.9, and λ is the X-ray wavelength. The W-H plot is constructed with 4sinθ as the X-axis and βhkl cosθ as the Y-axis (see Figure 3e,f). Linear least squares fitting was performed on the data points, and the slope of the resulting line corresponds to the microstrain (ε), while the Y-axis intercept is related to the grain size (D) via (D = Kλ/intercept). The dislocation densities for the two samples are 1.32 × 10¹³ m−2 and 1.04 × 10¹⁴ m−2, respectively. EBSD analysis shows that the CRE-processed sample has elongated grains, which result from the SPD during extrusion, causing the grains to orient along the direction of maximum shear stress [26]. In contrast, the gravity-cast sample has predominantly equiaxed grains, exhibiting typical solidification microstructure features [38]. Additionally, the grain orientation randomness is significantly higher in the CRE sample, with a lower orientation concentration, indicating that the material underwent more uniform deformation and recrystallization during the CRE process. This orientation evolution is primarily due to the activation of crystal slip systems during severe plastic deformation (SPD) [4,23]. According to dislocation slip theory, FCC metals primarily slip along the {111} plane in the <110> direction, which aligns with the observed orientation distribution.
Based on the above formulas, this study calculated the quantitative contributions of each strengthening mechanism to the yield strength increment before and after CRE processing. The symbols, their physical meanings, and the values used in the calculations are shown in Table 3.

Table 3.
Physical meanings and values of symbols used in the calculation equations.
The comparison between the experimentally measured and calculated yield strength increments is shown in Figure 10. The calculated yield strength increment is 88.4 MPa (, contributing 55.4%, 27.1%, 17.5% and 0 to the total contribution, which well matches the experimental measurement (86.3 MPa). The deviation between the two values may result from the interaction between the strengthening mechanisms. Analysis reveals that dislocation strengthening and second-phase strengthening are the dominant mechanisms driving the increase in yield strength after CRE processing. Figure 11 presents a schematic diagram of the microstructural evolution and strengthening mechanisms during the CRE process.
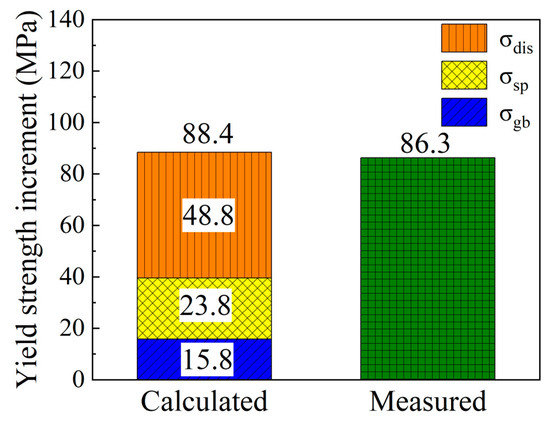
Figure 10.
Comparison of the calculated and measured yield strength increments of Al–Zn–Mg–Cu alloys before and after CRE processing.
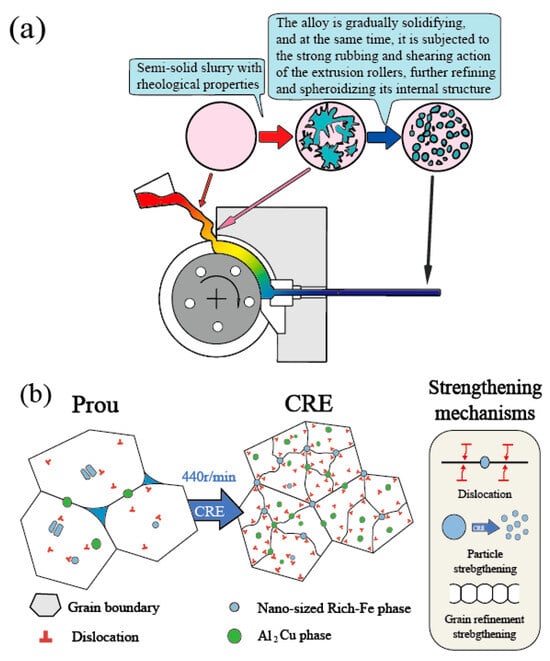
Figure 11.
(a) Microstructural evolution of Al–Zn–Mg–Cu alloys during the CRE process and (b) schematic diagram of strengthening mechanisms.
This study provides new insights into the microstructure refinement and strengthening mechanisms of Al–Zn–Mg–Cu alloys processed by CRE, highlighting the potential of this technique for industrial applications. However, this study primarily focuses on optimizing the room-temperature quasi-static mechanical properties and microstructure of Al–Zn–Mg–Cu alloys through CRE processing. It has not yet addressed their performance in corrosion behavior, fatigue properties, and high-temperature thermal stability. The absence of these critical service properties represents a key limitation of the current work. Future research should address this gap through systematic environmental durability, dynamic loading, and high-temperature exposure testing to comprehensively evaluate the application potential of this material and process.
5. Conclusions
- 1.
- Compared to the traditional gravity casting process, the mechanical properties of Al–Zn–Mg–Cu alloys fabricated using the CRE process are significantly improved: tensile strength, yield strength and elongation increased from 204.7 ± 23.7 MPa, 97.7 ± 12.0 MPa and 11.4 ± 2.4% to 338.0 ± 9.3 MPa, 183.9 ± 7.2 MPa and 13.8 ± 1.3%, respectively, achieving a simultaneous improvement in both strength and ductility.
- 2.
- The CRE process significantly refines the microstructure of the Al–Zn–Mg–Cu alloys: the average grain size is refined from 53.5 μm to 16.1 μm, the fraction of high-angle grain boundaries increases to 88.8%, and the average orientation difference angle increases to 40.8°. Meanwhile, coarse Fe-rich phases are broken down to below 5 μm, and Al2Cu phases are refined from 106.3 nm to 11.7 nm with a more uniform distribution.
- 3.
- Quantitative analysis shows that dislocation strengthening and second-phase strengthening are the dominant factors contributing to the increase in yield strength. The refinement of Fe-rich phases and the uniform dispersion Al2Cu phases improve Orowan strengthening efficiency. Furthermore, the formation and evolution of a high-density dislocation network further enhance deformability and optimize the stress distribution.
Author Contributions
Conceptualization, Z.W. (Ziren Wang), W.D., Z.W. (Zhenpeng Wei), C.Y. and M.X.; Methodology, J.A., W.D., Z.W. (Ziren Wang), C.Y. and G.W.; Formal analysis, G.W., Z.W. (Ziren Wang), W.S., H.Z., J.A. and Z.W. (Zhenpeng Wei); Investigation Z.W. (Ziren Wang), G.W., C.Y., Z.W. (Zhenpeng Wei) and M.X.; Resources, W.D., J.A., W.S., Z.W. (Zhenpeng Wei), H.Z. and C.Y.; Data curation, Z.W. (Ziren Wang), M.X., H.Z. and C.Y.; Writing—original draft preparation, Z.W. (Ziren Wang) and M.X.; Writing—review and editing, W.D. and J.A.; Validation, Z.W. (Ziren Wang), J.A., H.Z., and Z.W. (Zhenpeng Wei); Visualization, Z.W. (Ziren Wang), M.X., J.A., W.S. and H.Z.; Supervision, W.D., J.A. and G.W.; Project administration, J.A., W.D. and G.W.; Funding acquisition, W.D. All authors have read and agreed to the published version of the manuscript.
Funding
This research was funded by the National Natural Science Foundation of China (grant number 52161006), Jiayuguan City Science and Technology Program Projects (grant number 24-03), Central Guidance for Local Scientific and Technological Development Funding Projects (grant number 23ZYQB309), Central Guidance for Local Scientific and Technological Development Funding Projects (grant number 24ZYQD004) and Gansu Provincial Science and Technology Major Project (grant number 22ZD6GB019).
Data Availability Statement
The original contributions presented in this study are included in the article. Further inquiries can be directed to the corresponding authors.
Conflicts of Interest
Authors Guoli Wei, Chengliang Yang and Zhenpeng Wei were employed by Gansu Dongxing Aluminum Co., Ltd. Author Wenzheng Shen was employed by Gansu Hongda Aluminum Profile Co., Ltd. The remaining authors declare that the research was conducted in the absence of any commercial or financial relationships that could be construed as a potential conflict of interest.
References
- Shen, G.; Chen, X.; Yan, J.; Fan, L.; Yang, Z.; Zhang, J.; Guan, R. A Review of Progress in the Study of Al-Mg-Zn(-Cu) Wrought Alloys. Metals 2023, 13, 345. [Google Scholar] [CrossRef]
- Lei, C.; Wang, Q.; Ebrahimi, M.; Li, D.; Tang, H.; Zhang, N.; Cai, H. Hot Deformation Behavior and Processing Maps of an As-Cast Al-5Mg-3Zn-1Cu (wt%) Alloy. Materials 2023, 16, 4093. [Google Scholar] [CrossRef] [PubMed]
- Shen, G.; Chen, X.; Yan, J.; Fan, L.; Yang, Z.; Zhang, J.; Guan, R. Effects of heat treatment processes on the mechanical properties, microstructure evolution, and strengthening mechanisms of Al–Zn–Mg–Cu alloy. J. Mater. Res. Technol. 2023, 27, 5380–5388. [Google Scholar] [CrossRef]
- Zhao, Y.; Tian, T.; Jia, H.; Ma, P.; Yang, Z.; Xu, J.; Zha, M.; Wang, H. Effects of Mg/Zn ratio and pre-aging on microstructure and mechanical properties of Al–Zn–Mg–Cu alloys. J. Mater. Res. Technol. 2023, 27, 1874–1885. [Google Scholar] [CrossRef]
- Liu, H.; Zhao, Z.; Zhang, D.; Zhang, J. Mechanical property and microstructure evolution of novel Al–Mg–Zn(–Cu) alloys under dynamic impact. Mater. Sci. Technol. 2021, 37, 852–862. [Google Scholar] [CrossRef]
- Geng, Y. Study on the Early-Stage Precipitation Strengthening Mechanism and Plastic Instability Behavior of the Al-Mg-Zn(-Cu) Alloy for Automotive Application. Ph.D. Thesis, University of Science and Technology Beijing, Beijing, China, 29 May 2023. [Google Scholar]
- Mei, L.; Yang, M.; Chen, X.; Jin, Q.; Wang, Y.; Li, Y. Precipitate evolution and properties of an Al–Zn–Mg–Cu alloy processed by thermomechanical treatment. Mater. Sci. Eng. A 2023, 867, 144716. [Google Scholar] [CrossRef]
- Chen, X.; Liu, K.; Liu, Q.; Kong, J.; Cristino, V.A.; Lo, K.-H.; Xie, Z.; Wang, Z.; Song, D.; Kwok, C.-T. Influence of Zn Content on the Corrosion and Mechanical Properties of Cast and Friction Stir-Welded Al-Si-Mg-Fe-Zn Alloys. Materials 2025, 18, 3306. [Google Scholar] [CrossRef] [PubMed]
- Wen, K.; Li, X.W.; Xiong, B.Q.; Liu, H.L.; Wang, Y.J.; Li, Z.H.; Zhang, Y.A.; Li, Y.N. Influence of minor Sc additions on grain refinement and microstructure characteristics of a high Zn-containing Al–Zn–Mg–Cu-Zr alloy. J. Cent. South Univ. 2022, 29, 780–794. [Google Scholar] [CrossRef]
- Dutkiewicz, J.; Atkinson, H.; Lityńska-Dobrzyńska, L.; Czeppe, T.; Modigell, M. Characterization of semi-solid processing of aluminium alloy 7075 with Sc and Zr additions. Mater. Sci. Eng. A 2013, 580, 362–373. [Google Scholar] [CrossRef]
- Won, S.-J.; So, H.; Han, J.-W.; Oh, S.J.; Kim, K.-H. Roles of Sc and Ag Microalloying Elements in the Mechanical Properties of Al–Zn–Mg–Cu (Al7xxx) Alloy. Metals 2023, 13, 244. [Google Scholar] [CrossRef]
- Afifi, M.A.; Hamdy, M.; Brechtl, J.; Khan, M.A.; Fahim, I.S. Enhancing mechanical properties of Al–Zn–Mg–Cu alloys: The impact of high strain rate compression and subsequent heat treatment on microstructural evolution. Mater. Today Commun. 2024, 40, 110131. [Google Scholar] [CrossRef]
- Huang, Y.; Zhao, Y.; Liu, Y.; Xiao, Z.; Yang, L.; Huang, Y. Microstructural evolution and phase transformation behavior of Al-8.1Zn-2.0Mg-1.0Cu-0.2Ag-0.15Zr alloy during isothermal compression. J. Mater. Res. Technol. 2024, 33, 1018–1031. [Google Scholar] [CrossRef]
- Guan, R.; Tie, D.; Li, Z.; An, Y.; Wang, X.; Li, Q.; Chen, X. Microstructure evolution and mechanical property improvement of aluminum alloys with high magnesium content during continuous rheo-extrusion. Mater. Sci. Eng. A 2018, 738, 31–37. [Google Scholar] [CrossRef]
- Yang, S.; Li, B.; Tian, W.; Xu, Z.; Zhang, Y.; Qi, W.; Guan, R. Effect of Sc on microstructure and mechanical properties of Al-Mg alloys during continuous rheo-extrusion. J. Alloys Compd. 2025, 1017, 179070. [Google Scholar] [CrossRef]
- Wang, Y.; Gao, M.; Yang, B.; Bai, J.; Guan, R. A Calculation Model for Cooling Rate of Aluminum Alloy Melts during Continuous Rheo-Extrusion. Materials 2021, 14, 5684. [Google Scholar] [CrossRef] [PubMed]
- Ning, Y.; Yang, L.; Gao, M.; Guan, R. Effect of Extrusion Ratio on Microstructure and Properties of Al-1.5Fe-0.4Cr Alloy Obtained by Continuous Rheo-Extrusion. Metals 2024, 14, 1310. [Google Scholar] [CrossRef]
- Yang, B.; Gao, M.; Liu, Y.; Pan, S.; Meng, S.; Fu, Y.; Guan, R. Formation mechanism of refined Al6 (Mn, Fe) phase particles during continuous rheo-extrusion and its contribution to tensile properties in Al–Mg–Mn–Fe alloys. Mater. Sci. Eng. A 2023, 872, 144952. [Google Scholar] [CrossRef]
- Yang, B.; Gao, M.; Wang, Y.; Guan, R. Dynamic recrystallization behavior and mechanical properties response of rheo-extruded Al–Mg alloys with various Mg contents. Mater. Sci. Eng. A 2022, 849, 143450. [Google Scholar] [CrossRef]
- Lei, C.; Wang, Q.; Tang, H.; Liu, T.; Li, Z.; Jiang, H.; Wang, K.; Ebrahimi, M.; Ding, W. Hot deformation constitutive model and processing maps of homogenized Al–5Mg–3Zn–1Cu alloy. J. Mater. Res. Technol. 2021, 14, 324–339. [Google Scholar] [CrossRef]
- GB/T 228.1-2021; Metallic Materials—Tensile Testing—Part 1: Method of Test at Room Temperature. Standardization Administration of China (SAC), Standards Press of China: Beijing, China, 2021.
- GB/T 4340.1-2024; Metallic Materials—Vickers Hardness Test—Part 1: Test Method. Standardization Administration of China (SAC), Standards Press of China: Beijing, China, 2024.
- Zhang, Z.; Li, Y.; Li, H.; Zhang, D.; Zhang, J. Effect of high Cu concentration on the mechanical property and precipitation behavior of Al–Mg–Zn-(Cu) crossover alloys. J. Mater. Res. Technol. 2022, 20, 4585–4596. [Google Scholar] [CrossRef]
- Wu, S.; Zhu, B.; Jiang, W.; Qiu, H.; Guo, Y. Hot Deformation Behavior and Microstructure Evolution of a Novel Al-Zn-Mg-Li-Cu Alloy. Materials 2022, 15, 6769. [Google Scholar] [CrossRef] [PubMed]
- Zhao, Y.-Q.; Jia, H.-L.; Tian, T.; Gu, T.; Ma, P.-K.; Song, J.-W.; Zha, M.; Wang, H.-Y. Improved mechanical properties of Al-xMg-yZn-Cu alloys via optimized Mg/Zn ratio and thermomechanical processing. Mater. Sci. Eng. A 2024, 911, 146916. [Google Scholar] [CrossRef]
- Yang, Z.; Tang, J.; Mo, X.; Chen, W.; Fu, D.; Zhang, H.; Teng, J.; Jiang, F. Microstructure, mechanical properties, and strengthening mechanisms of ultra-high strength Al–Zn–Mg–Cu alloy prepared by continuous extrusion forming process. Mater. Des. 2024, 242, 112985. [Google Scholar] [CrossRef]
- He, F.; Shi, L.; Wu, C. Effect of Elastic Strain Energy on Dynamic Recrystallization During Friction Stir Welding of Dissimilar Al/Mg Alloys. Metals 2025, 15, 577. [Google Scholar] [CrossRef]
- Huang, K.; Logé, R.E. A review of dynamic recrystallization phenomena in metallic materials. Mater. Des. 2016, 111, 548–574. [Google Scholar] [CrossRef]
- Yang, M.; Liu, S.; Zhang, Y.; Tang, J.; Zhang, M. Mechanism for enhanced precipitation strengthening due to the addition of copper to Al-Zn-Mg alloys with high Zn/Mg ratio. Mater. Des. 2023, 234, 112295. [Google Scholar] [CrossRef]
- Dong, B.; Xia, Y.; Cai, X.; Lin, S.; Fan, C. Addition of Sc in wire-based directed energy deposition of Al–Zn–Mg–Cu alloy: Microalloying to refine grains and improve mechanical properties. Addit. Manuf. 2023, 67, 103494. [Google Scholar] [CrossRef]
- Yang, B.; Wang, Y.; Gao, M.; Wang, C.; Guan, R. Microstructural evolution and strengthening mechanism of Al–Mg alloys with fine grains processed by accumulative continuous extrusion forming. J. Mater. Sci. Technol. 2022, 128, 195–204. [Google Scholar] [CrossRef]
- Wei, S.; Kim, J.; Tasan, C.C. In-situ investigation of plasticity in a Ti-Al-V-Fe (α+ β) alloy: Slip mechanisms, strain localization, and partitioning. Int. J. Plast. 2022, 148, 103131. [Google Scholar] [CrossRef]
- Santos-Güemes, R.; Bellón, B.; Esteban-Manzanares, G.; Segurado, J.; Capolungo, L.; LLorca, J. Multiscale modelling of precipitation hardening in Al–Cu alloys: Dislocation dynamics simulations and experimental validation. Acta Mater. 2020, 188, 475–485. [Google Scholar] [CrossRef]
- Ren, X.; Jiang, X.; Yuan, T.; Zhao, X.; Chen, S. Microstructure and properties research of Al–Zn–Mg–Cu alloy with high strength and high elongation fabricated by wire arc additive manufacturing. J. Mater. Process. Technol. 2022, 307, 117665. [Google Scholar] [CrossRef]
- Pan, Y.; Zhang, D.; Liu, H.; Zhuang, L.; Zhang, J. Precipitation hardening and intergranular corrosion behavior of novel Al–Mg–Zn (-Cu) alloys. J. Alloys Compd. 2021, 853, 157199. [Google Scholar] [CrossRef]
- Sha, G.; Cerezo, A. Early-stage precipitation in Al–Zn–Mg–Cu alloy (7050). Acta Mater. 2004, 52, 4503–4516. [Google Scholar] [CrossRef]
- Song, C.-R.; Dong, B.-X.; Zhang, S.-Y.; Yang, H.-Y.; Liu, L.; Kang, J.; Meng, J.; Luo, C.-J.; Wang, C.-G.; Cao, K.; et al. Recent progress of Al–Mg alloys: Forming and preparation process, microstructure manipulation and application. J. Mater. Res. Technol. 2024, 31, 3255–3286. [Google Scholar] [CrossRef]
- Cao, L.; Lin, X.; Zhang, Z.; Bai, M.; Wu, X. Effect of Hot Deformation and Heat Treatment on the Microstructure and Properties of Spray-Formed Al–Zn–Mg–Cu Alloys. Metals 2024, 14, 451. [Google Scholar] [CrossRef]
Disclaimer/Publisher’s Note: The statements, opinions and data contained in all publications are solely those of the individual author(s) and contributor(s) and not of MDPI and/or the editor(s). MDPI and/or the editor(s) disclaim responsibility for any injury to people or property resulting from any ideas, methods, instructions or products referred to in the content. |
© 2025 by the authors. Licensee MDPI, Basel, Switzerland. This article is an open access article distributed under the terms and conditions of the Creative Commons Attribution (CC BY) license (https://creativecommons.org/licenses/by/4.0/).