Article

High-Cycle Fatigue Strength Prediction Model for Ti-6Al-4V Titanium Alloy Compressor Blades Subjected to Foreign Object Damage

College of Power Engineering, Naval University of Engineering, Wuhan 430033, China
*
Authors to whom correspondence should be addressed.
Metals 2025, 15(10), 1150; https://doi.org/10.3390/met15101150
Submission received: 10 September 2025 / Revised: 13 October 2025 / Accepted: 16 October 2025 / Published: 17 October 2025
(This article belongs to the Special Issue Advances in the Fatigue and Fracture Behaviour of Metallic Materials)

Abstract

The high-cycle fatigue (HCF) strength of titanium alloy blades, particularly Ti-6Al-4V, is critical for the reliability and performance of aviation engine components. Foreign object damage (FOD), which introduces notches, microstructural alterations, and residual stresses, significantly degrades the fatigue performance of these blades. Of particular concern are tensile residual stresses, which, caused by factors such as FOD, notches, or non-uniform plastic deformation, lead to increased local tensile loads, promote crack initiation, and accelerate crack growth. This study investigates the effects of external damage, including the impact angle and the resultant residual stresses, on the high-cycle fatigue strength of Ti-6Al-4V titanium alloy blades. Blade simulation specimens with impact-induced damage were tested under high-cycle fatigue conditions to assess the influence of various impact angles and the resulting tensile residual stresses. A modified fatigue strength prediction model was developed, incorporating shear factors and tensile residual stresses, to improve the accuracy of fatigue life predictions. Compared with the Neuber model and Peterson model, the modified model increases the proportion of predictions falling within the 10% scatter band by 30%, resulting in a significant improvement in prediction accuracy. The experimental results demonstrated that the modified model more accurately predicted the high-cycle fatigue strength, particularly in the presence of external damage and tensile residual stresses.

1. Introduction

Titanium alloys, particularly Ti-6Al-4V, are widely used in aerospace engineering due to their excellent mechanical properties, as well as their exceptional resistance to both corrosion and elevated temperatures. These properties make titanium alloys especially well-suited for critical rotating components, such as engine compressor blades, which are subjected to complex loading conditions and extreme operational environments. Among the various failure mechanisms affecting titanium alloys, fatigue is a predominant concern, particularly in components exposed to prolonged cyclic loading. High-cycle fatigue (HCF), characterized by material failure after numerous low-stress cycles, is of particular relevance in aerospace applications where components experience sustained fluctuating stress levels. Under these conditions, fatigue crack initiation and propagation can significantly reduce the service life of critical components, thus posing substantial risks to system reliability and safety.
In the context of foreign object damage (FOD), localized stress concentrations, microcrack formation, and significant alterations to the material’s microstructure occur. Research has shown that FOD not only generates macroscopic notches and microcracks but also creates localized stress concentrations that considerably degrade the fatigue performance of affected components [1,2,3]. Such localized damage can substantially reduce material fatigue strength, often leading to premature failure. Moreover, residual stresses, particularly tensile residual stresses induced by impact damage, exacerbate the fatigue behavior. These stresses can either accelerate or impede crack propagation depending on their magnitude, orientation, and interaction with the applied loading conditions. Numerous studies have explored the influence of FOD and residual stresses on material fatigue strength, providing valuable insights into the mechanisms that govern the fatigue behavior of damaged components.
Zhao et al. [4] introduced a worst-notch model that integrates crack propagation behavior and residual stress effects to evaluate the HCF strength of damaged specimens. This model assumes the presence of microcracks at the root of the impact-induced notch, and employs a crack propagation model to calculate the high-cycle fatigue strength of the damaged specimens. It also considers the effect of impact residual stresses [5,6,7], treating these residual stresses as mean stresses to assess their influence on the stress intensity factor range threshold for crack propagation.
Traditional fatigue testing methods, such as step-loading and group testing, typically require multiple identical specimens, making them unsuitable for evaluating components with inherently inconsistent FOD characteristics. To address this limitation, Maxwell [8] proposed a step-loading test method (SLTM) based on a single specimen, which enables more efficient and practical fatigue testing of damaged blades.
Several experimental studies have investigated the influence of impact angle, notch geometry, and residual stress on fatigue strength. Ruschau et al. [9] conducted impact damage tests on Ti-6Al-4V titanium alloy simulation blade leading edges and performed detailed microstructural analysis of the damaged area using scanning electron microscopy (SEM). The study focused on the micro-damage characteristics at both the surface and interior of the notch root. Through high-cycle fatigue testing, the impact of the impact angle on the simulated blade’s damage characteristics and its effect on fatigue strength were systematically assessed. The results showed that, compared to vertical impacts, inclined impacts had a more significant detrimental effect on the fatigue strength of the specimens.
Thompson [10] explored the mechanisms of different FOD simulation methods and loading conditions on the fatigue behavior of damaged blades. The fatigue strength of FOD specimens was tested under different stress states. By analyzing the experimental data, the study investigated the effect of damage conditions on the elastic stress concentration factor (Kt), linking the fatigue source region of the damaged specimens with the Kt distribution at a given location, thereby further revealing the key factors influencing fatigue strength.
Additional research by Bao [11], Jia [12], and Hu [13] further emphasized the roles of impact location, residual stress, and stress concentration in fatigue performance. Bao conducted FOD tests on Ti-6Al-4V titanium alloy specimens. Through an analysis of the fatigue strength of the damaged specimens, it was found that when the impact damage occurred at the specimen edge, a 30° impact caused the greatest reduction in the high-cycle fatigue (HCF) strength of the specimen. When the impact damage occurred at the specimen surface, a 60° impact led to the greatest reduction in the HCF strength. Jia, based on stress concentration analysis of notch-type specimens, conducted high-cycle fatigue tests after impact. The study found no significant correlation between the stress concentration factor and the impact angle. Additionally, the Peterson formula was used to predict the high-cycle fatigue strength of the damaged specimens, with a maximum prediction error of 45% compared to the experimental values [14]. Hu analyzed FOD test data and conducted high-cycle fatigue tests on dimpled-type specimens. The study found that under different impact angle conditions, the fatigue strength of the dimpled-type damaged specimens decreased by 50% to 70%. Subsequently, a comparison was made between the high-cycle fatigue strength of specimens after residual stress removal through annealing, revealing an improvement in fatigue strength after annealing. This indicates that residual stress is a significant factor influencing fatigue strength [15].
Notch and residual stress are the key factors affecting HCF performance. In this paper FOD tests were conducted to obtain notched airfoil blades and tested their HCF limits. Furthermore, the residual and vibration stress near the aerofoil blade notch were obtained by combining numerical simulation and experiments [1,16,17,18,19].
Despite these contributions, a comprehensive and validated fatigue strength prediction model that accounts for both impact angle and residual stress remains lacking. This study aims to address this gap by considering the combined effects of impact angle and residual stress on high-cycle fatigue strength prediction. A shear factor and residual stress-modified mean stress model are proposed to enhance the accuracy of predicting the high-cycle fatigue strength of blades with FOD. Experimental data are then used to validate the effectiveness of the modified model.

2. Materials and Methods

2.1. Material and Equipment

The material investigated for the gas turbine compressor blade in this study is Ti-6Al-4V titanium alloy. The test specimens are Ti-6Al-4V titanium alloy forgings produced by the Xi’an Aero Engine Corporation of China Aviation Industry Corporation (Engine Research Institute, Xi’an, China). This alloy is a α + β two-phase titanium alloy, known for its high specific strength and excellent thermal stability, among other mechanical properties. Table 1 presents the mechanical properties of Ti-6Al-4V titanium alloy.
The air cannon impact test device used in this paper was independently designed and constructed by the laboratory. This device can control the air chamber pressure through a pressure regulating valve, achieve precise control of the projectile velocity using the driving force generated by the release of high-pressure gas, and finally adjust the three-axis clamping table to control the position and angle of the impact point, thereby simulating the impact damage characteristics of foreign objects on the test piece under different impact conditions.
The high-cycle fatigue tests were conducted according to the GB/T 3075-2008 [20]. The high-cycle fatigue testing was performed using an HTD504B electro-hydraulic servo fatigue testing machine (WanCe Technology Co., Ltd., Shenzhen, China), which enables precise cyclic loading and mechanical property measurements under high-cycle fatigue conditions. Figure 1b shows the fatigue testing machine.
The fatigue testing machine system consists of the main machine system, oil source, and control system. Table 2 lists the main technical parameters of the fatigue testing machine, as well as the accuracy of the relevant measurement parameters.
Figure 1c shows the dimensions and physical specimens used in both the impact test and tensile fatigue test of this paper.

2.2. Experimental Procedure

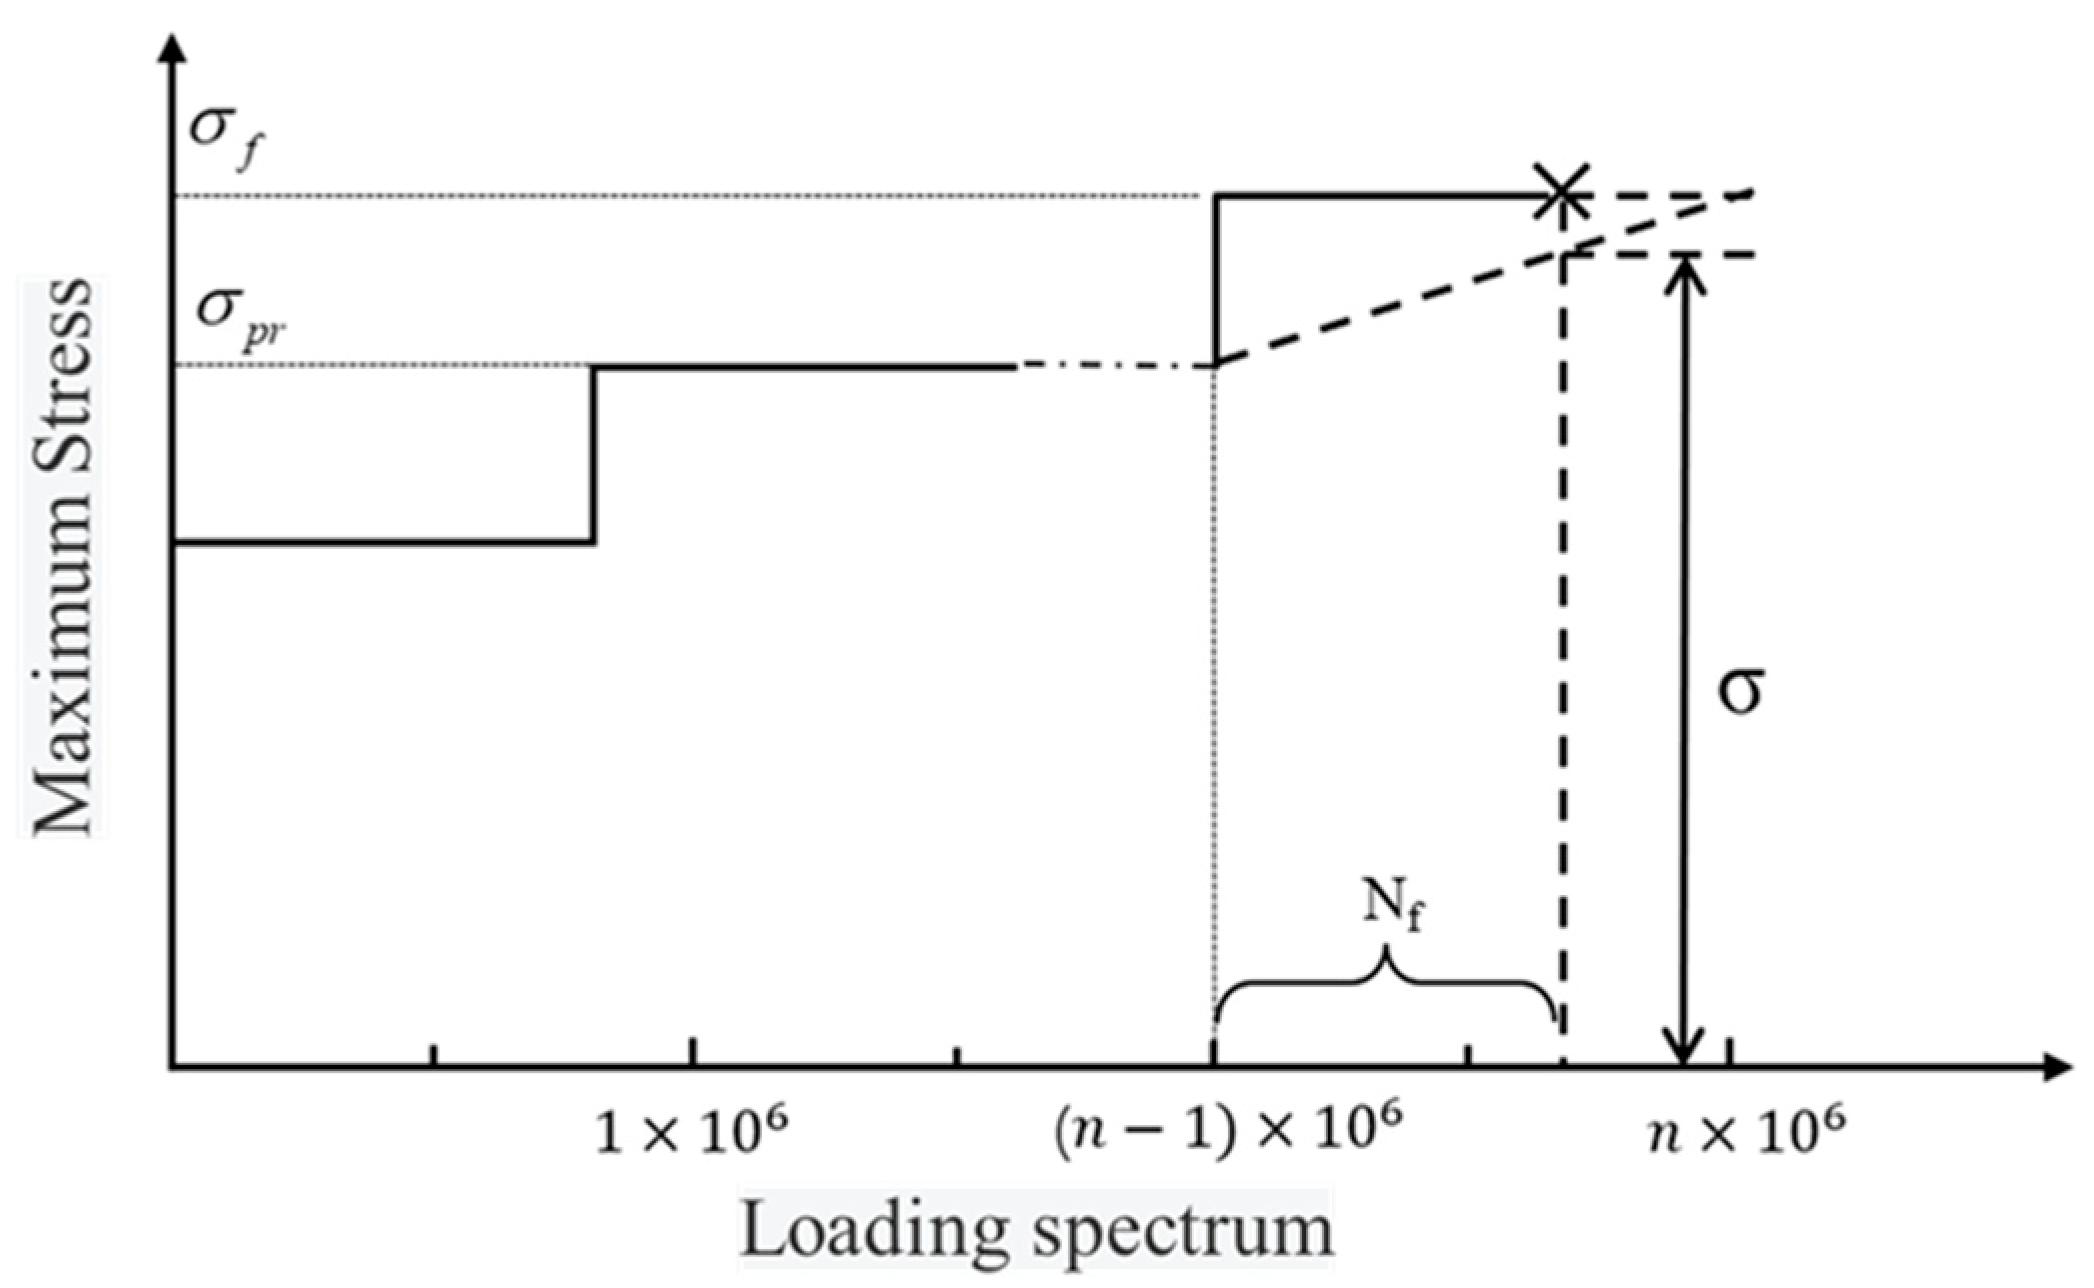
The high-cycle fatigue tests were conducted on Ti-6Al-4V titanium alloy specimens using a tensile fatigue testing machine (WanCe Technology Co., Ltd., Shenzhen, China). Throughout the testing process, the specimens were subjected to periodic, repeated tensile loads, with the load amplitude and frequency maintained within the set range. If a specimen fractured during the test, the experiment was immediately stopped, and the number of cycles at the point of fracture was recorded. This data serves as a crucial indicator of the material’s fatigue performance. If the specimen did not fracture after reaching the predetermined number of fatigue cycles, a step loading method was employed to further increase the stress amplitude, thereby accelerating the fatigue failure process until the specimen fractured. The principle of the step loading method is illustrated in Figure 2. The use of the step loading method allows for effective control over the load application during the experimental process and aids in the accurate evaluation of the material’s fatigue life.
For the fatigue fracture surface of the specimens, a Scanning Electron Microscope (SEM) (Hitachi, Wuhan, China) was used to observe the damage area, fatigue crack initiation sites, crack propagation zones, and final fracture regions at high resolution. The SEM images were used to identify the initial fatigue crack initiation points, crack propagation trajectories, and the final fracture process, thus revealing the fracture behavior and the underlying micro-mechanisms of Ti-6Al-4V titanium alloy under different loading conditions.

3. Experimental Results and Analysis

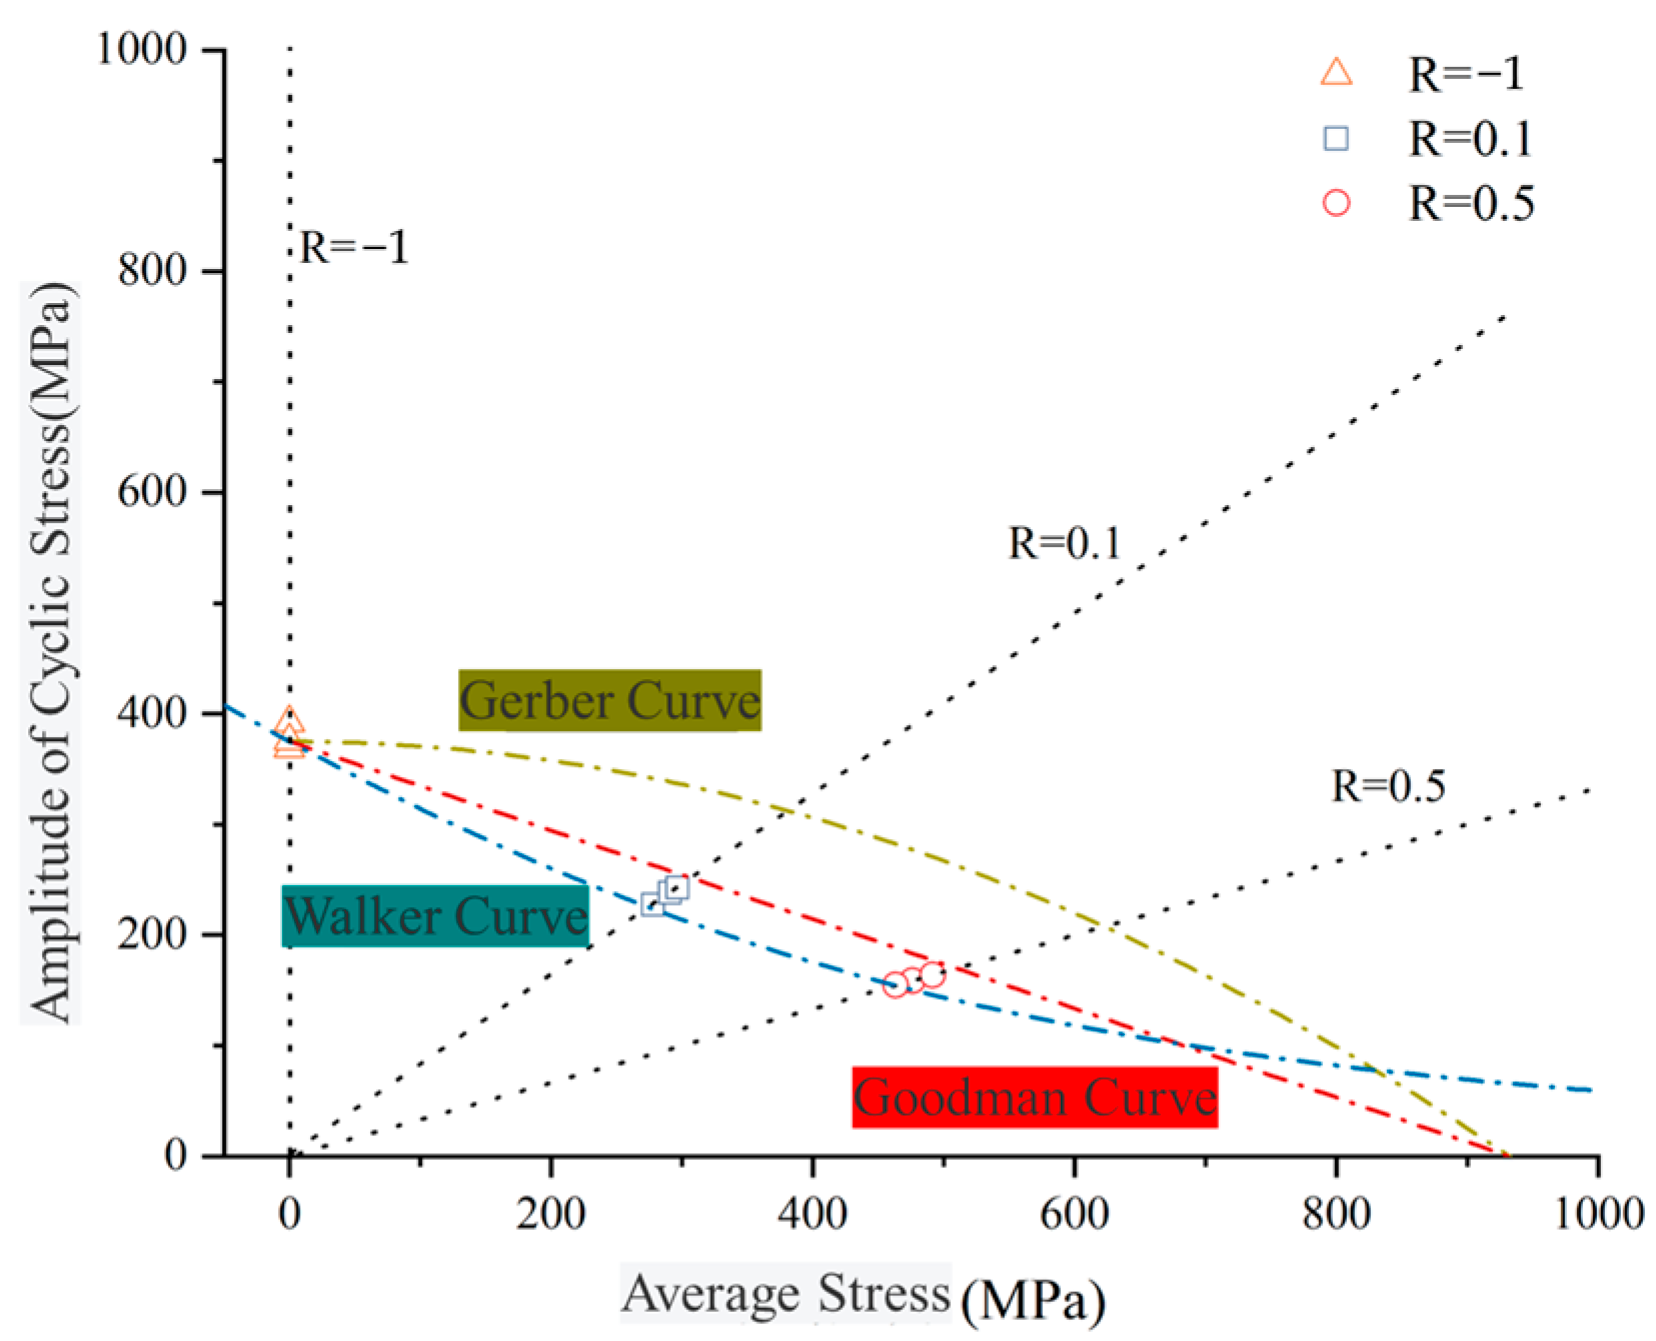
The constant life curve reflects the effect of loading conditions on the high-cycle fatigue strength, as shown in Figure 3.
When the mean stress is zero, the cyclic stress amplitude represents the high-cycle fatigue strength of the material at R = −1. When the mean stress equals the material’s ultimate strength, the cyclic stress amplitude is zero, leading to the static strength failure of the material. The amplitude of the cyclic stress decreases as the mean stress increases. The experimental conditions for the high-cycle fatigue strength of the intact specimen are shown in Table 3.
The high-cycle fatigue strength test results of the intact specimens under different stress ratios are shown in Table 4. The high-cycle fatigue strength of Ti-6Al-4V titanium alloy under different stress ratios and cyclic stress amplitudes is represented on the constant life curve. By analyzing the data in the table, it can be concluded that the maximum high-cycle fatigue strength of the damaged specimens is 288.14 MPa, which is significantly lower than the 524 MPa of the intact specimens. The high-cycle fatigue strength of the pitted damage is 30–55% of the intact specimen, while the high-cycle fatigue strength of the notch-type damage is 22–42% of the intact specimen’s high-cycle fatigue strength. Therefore, it can be concluded that external impacts significantly weaken the high-cycle fatigue strength of the specimens.
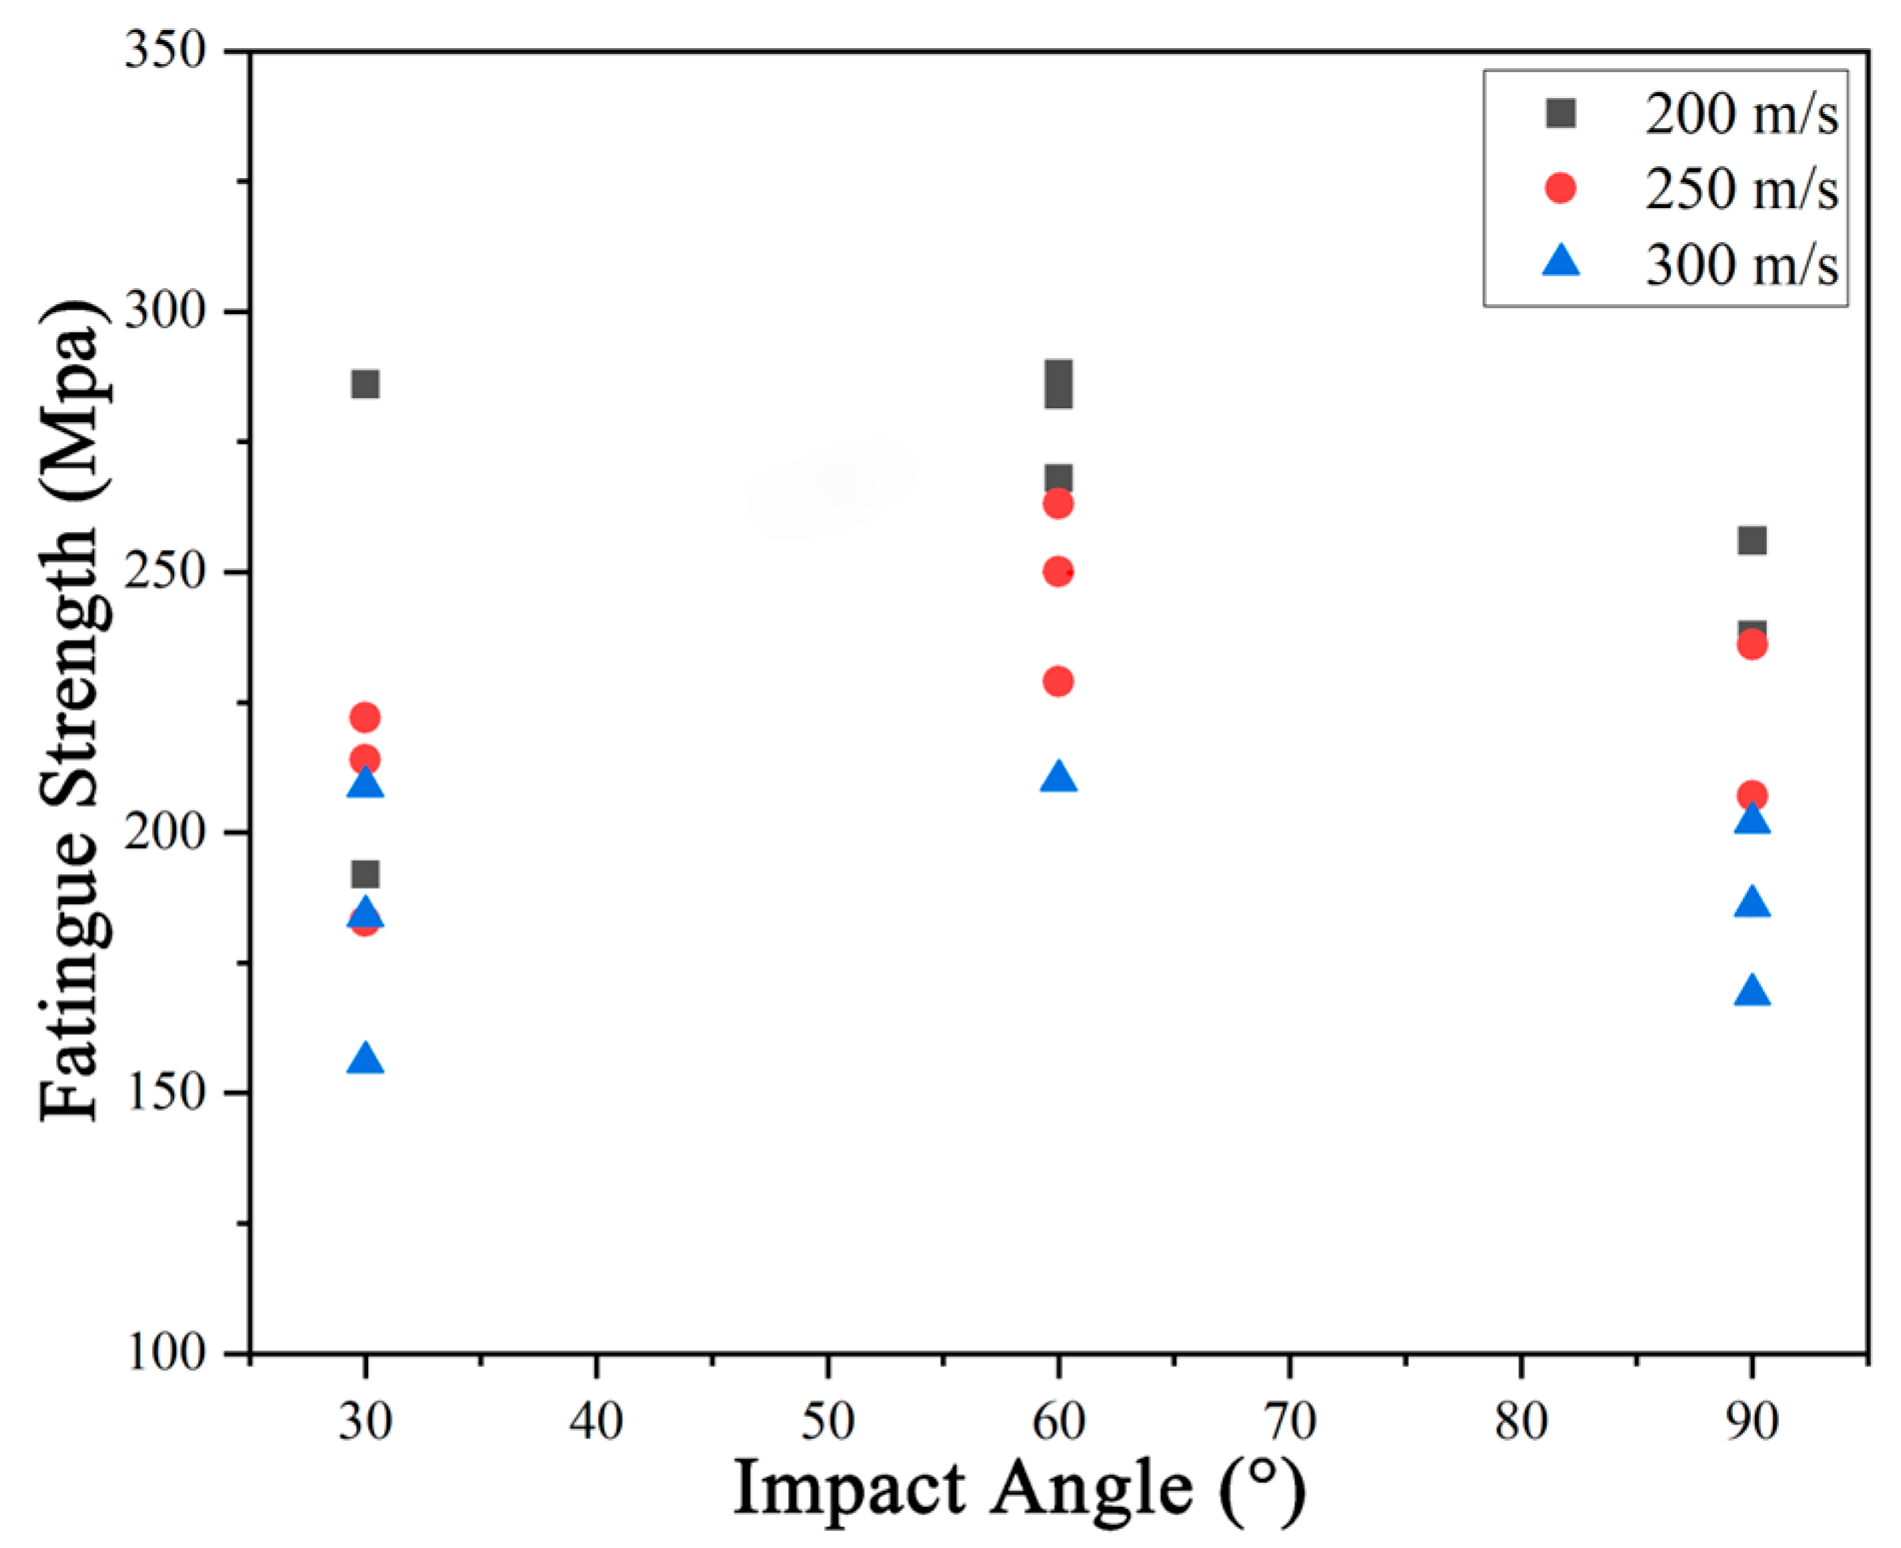
Based on the measured data in Table 4, the relationship between impact angle, impact velocity, and fatigue strength of the damaged specimens is plotted. From Figure 4, it can be observed that, under the same impact velocity, as the impact angle decreases (from 90° to 60°), the notch depth gradually decreases, and the high-cycle fatigue strength of the specimen increases. However, when the impact angle further decreases, the fatigue strength significantly drops. Analysis of the fracture surface features suggests that the significant decrease in fatigue strength at small impact angles is due to the increased microscopic damage features under shear action, which exacerbates stress concentration.
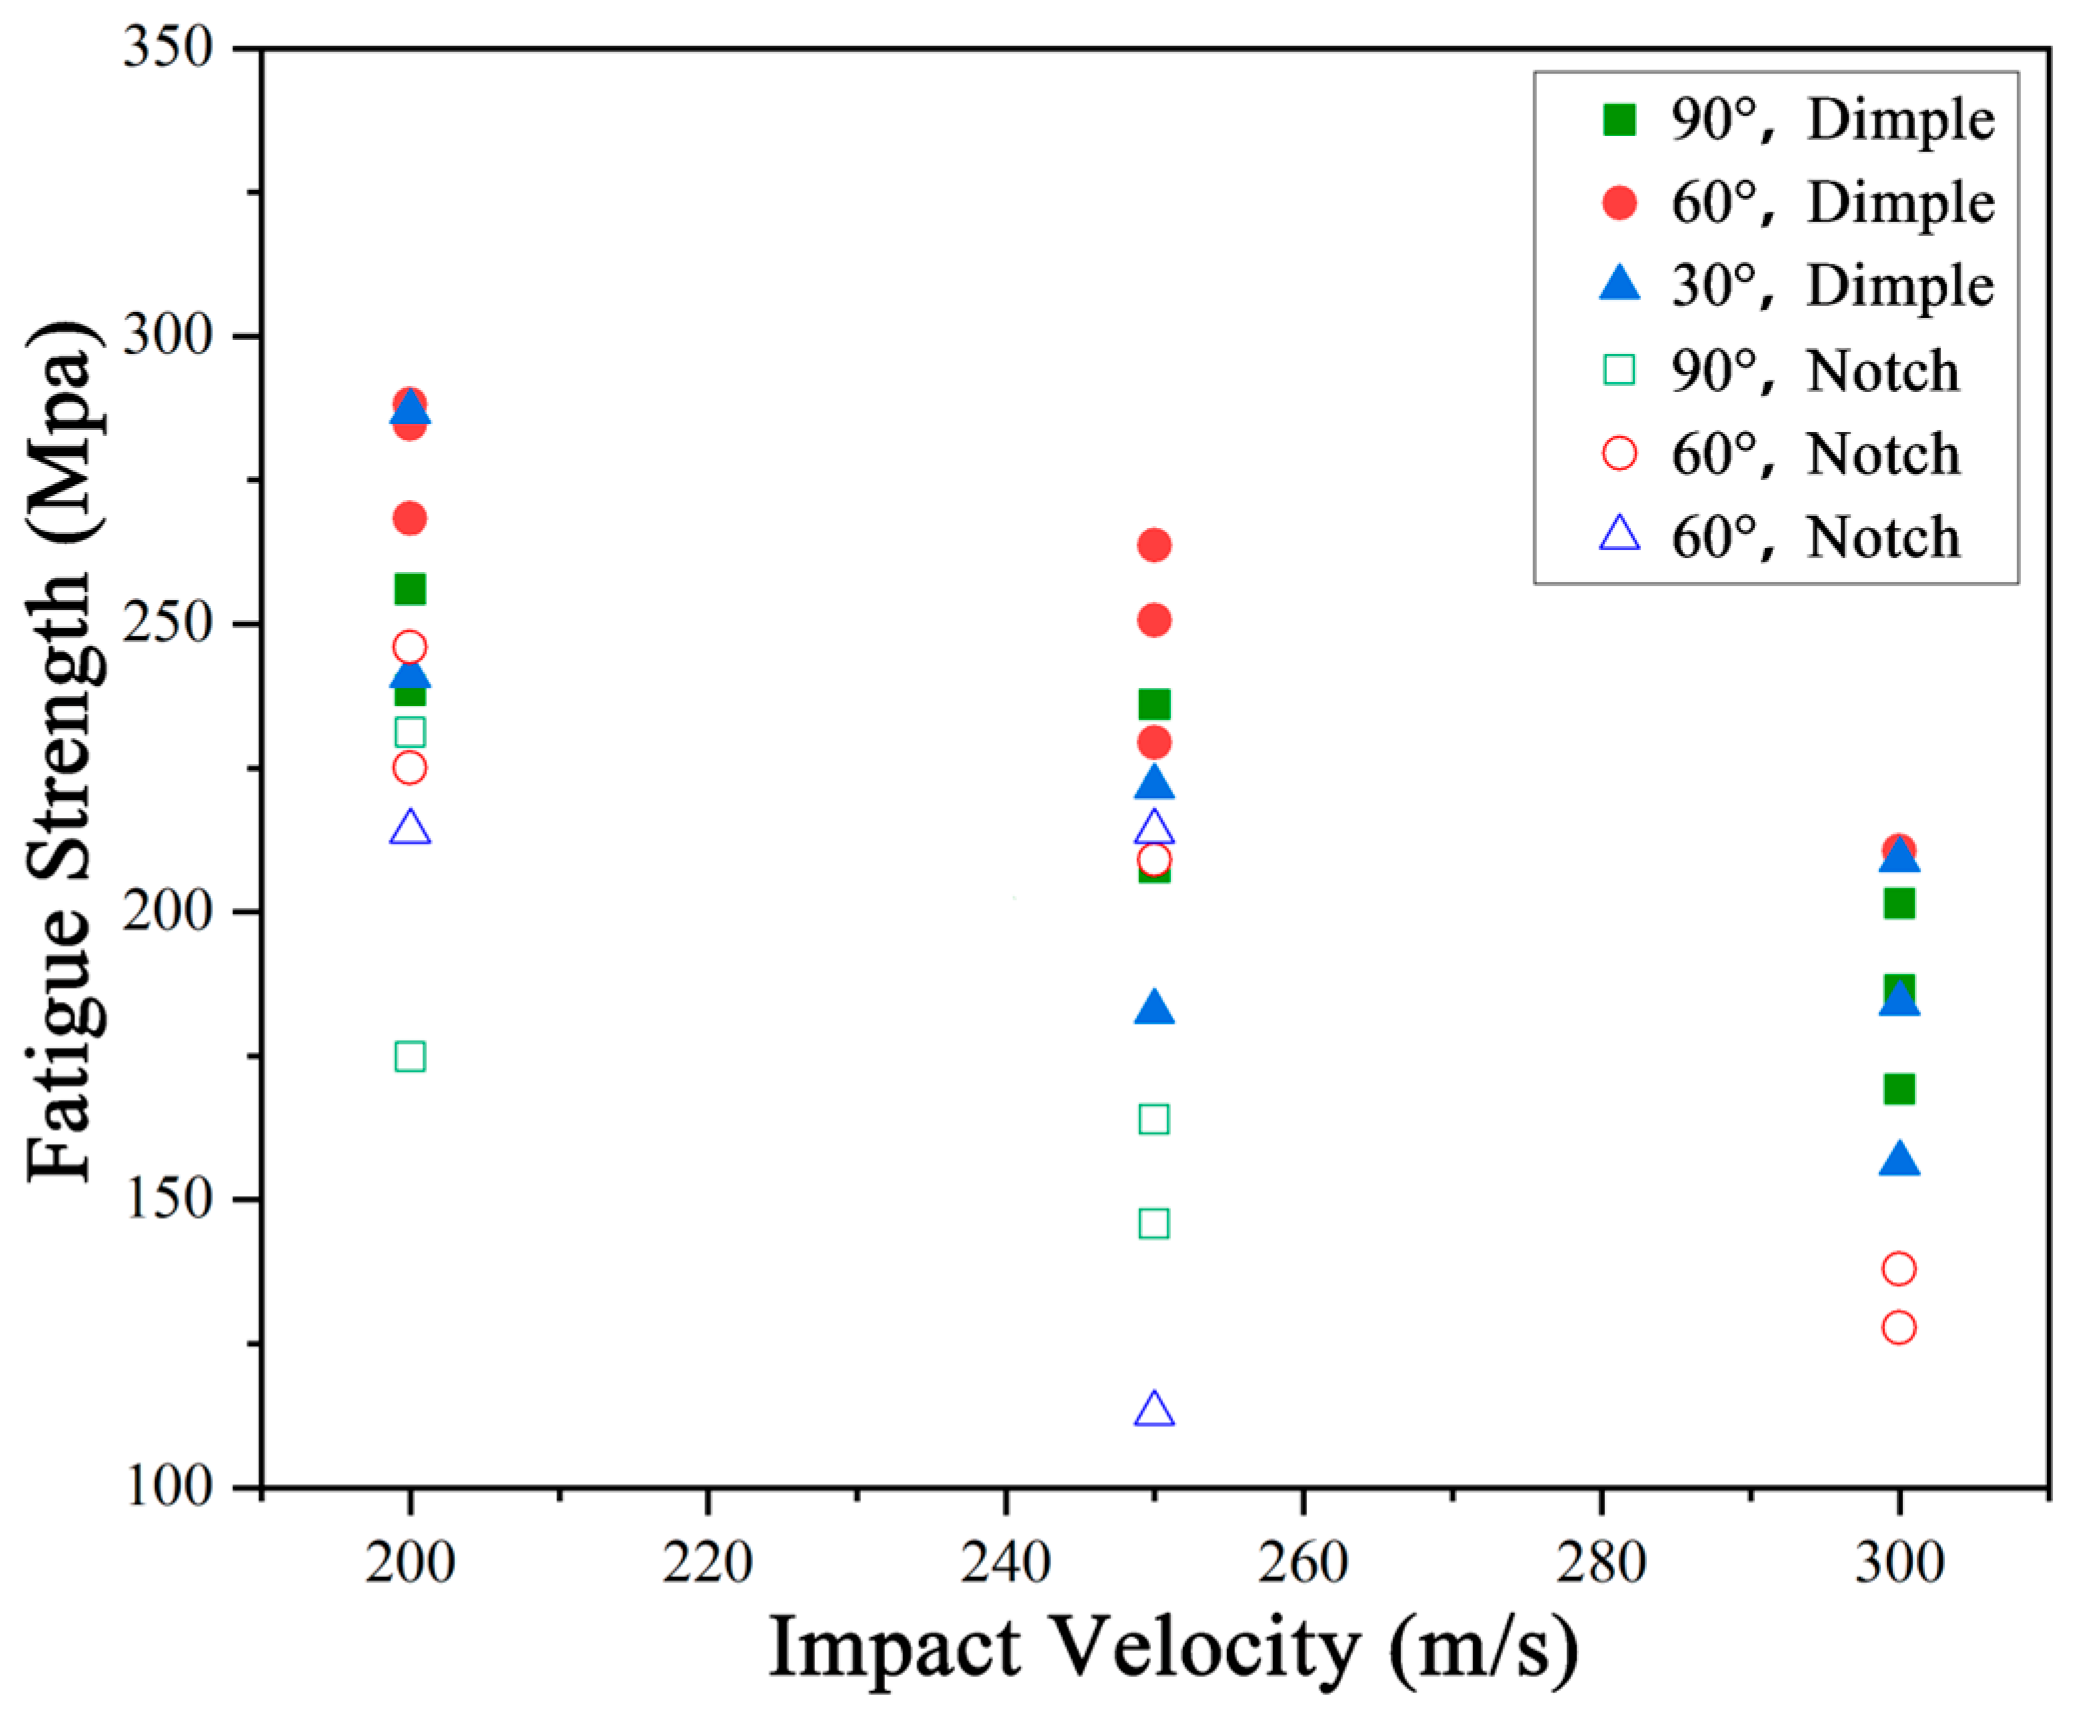
From Figure 5, it can be observed that as the impact velocity increases, the notch depth increases, and the high-cycle fatigue strength of the specimen decreases. There is a correlation between impact velocity and fatigue strength. Additionally, the fatigue strength decrease due to notch-type damage is more severe than that due to pitted damage.

4. Improvement of Lifetime Prediction Model

4.1. Prediction and Analysis of High-Cycle Fatigue Strength

In this study, damage depth is uniformly considered as the notch depth, and the radius of the steel ball is taken as the radius of the notch root. High-cycle fatigue strength of foreign object-damaged specimens can be predicted using Peterson’s formula and Neuber’s formula, as shown in Equations (1) and (2). The formulas are used to estimate the fatigue strength of materials with irregular defects or uneven surfaces. Both formulas are particularly applicable for fatigue analysis in the presence of surface defects, cracks, or other irregular shapes. The prediction results and errors are shown in Table 5.
K f = 1 + K t 1 1 + a p / r
K f = 1 + K t 1 1 + a N / r
The elastic stress concentration factor Kt can be calculated using the following formula:
K t = 1 + 2 H r
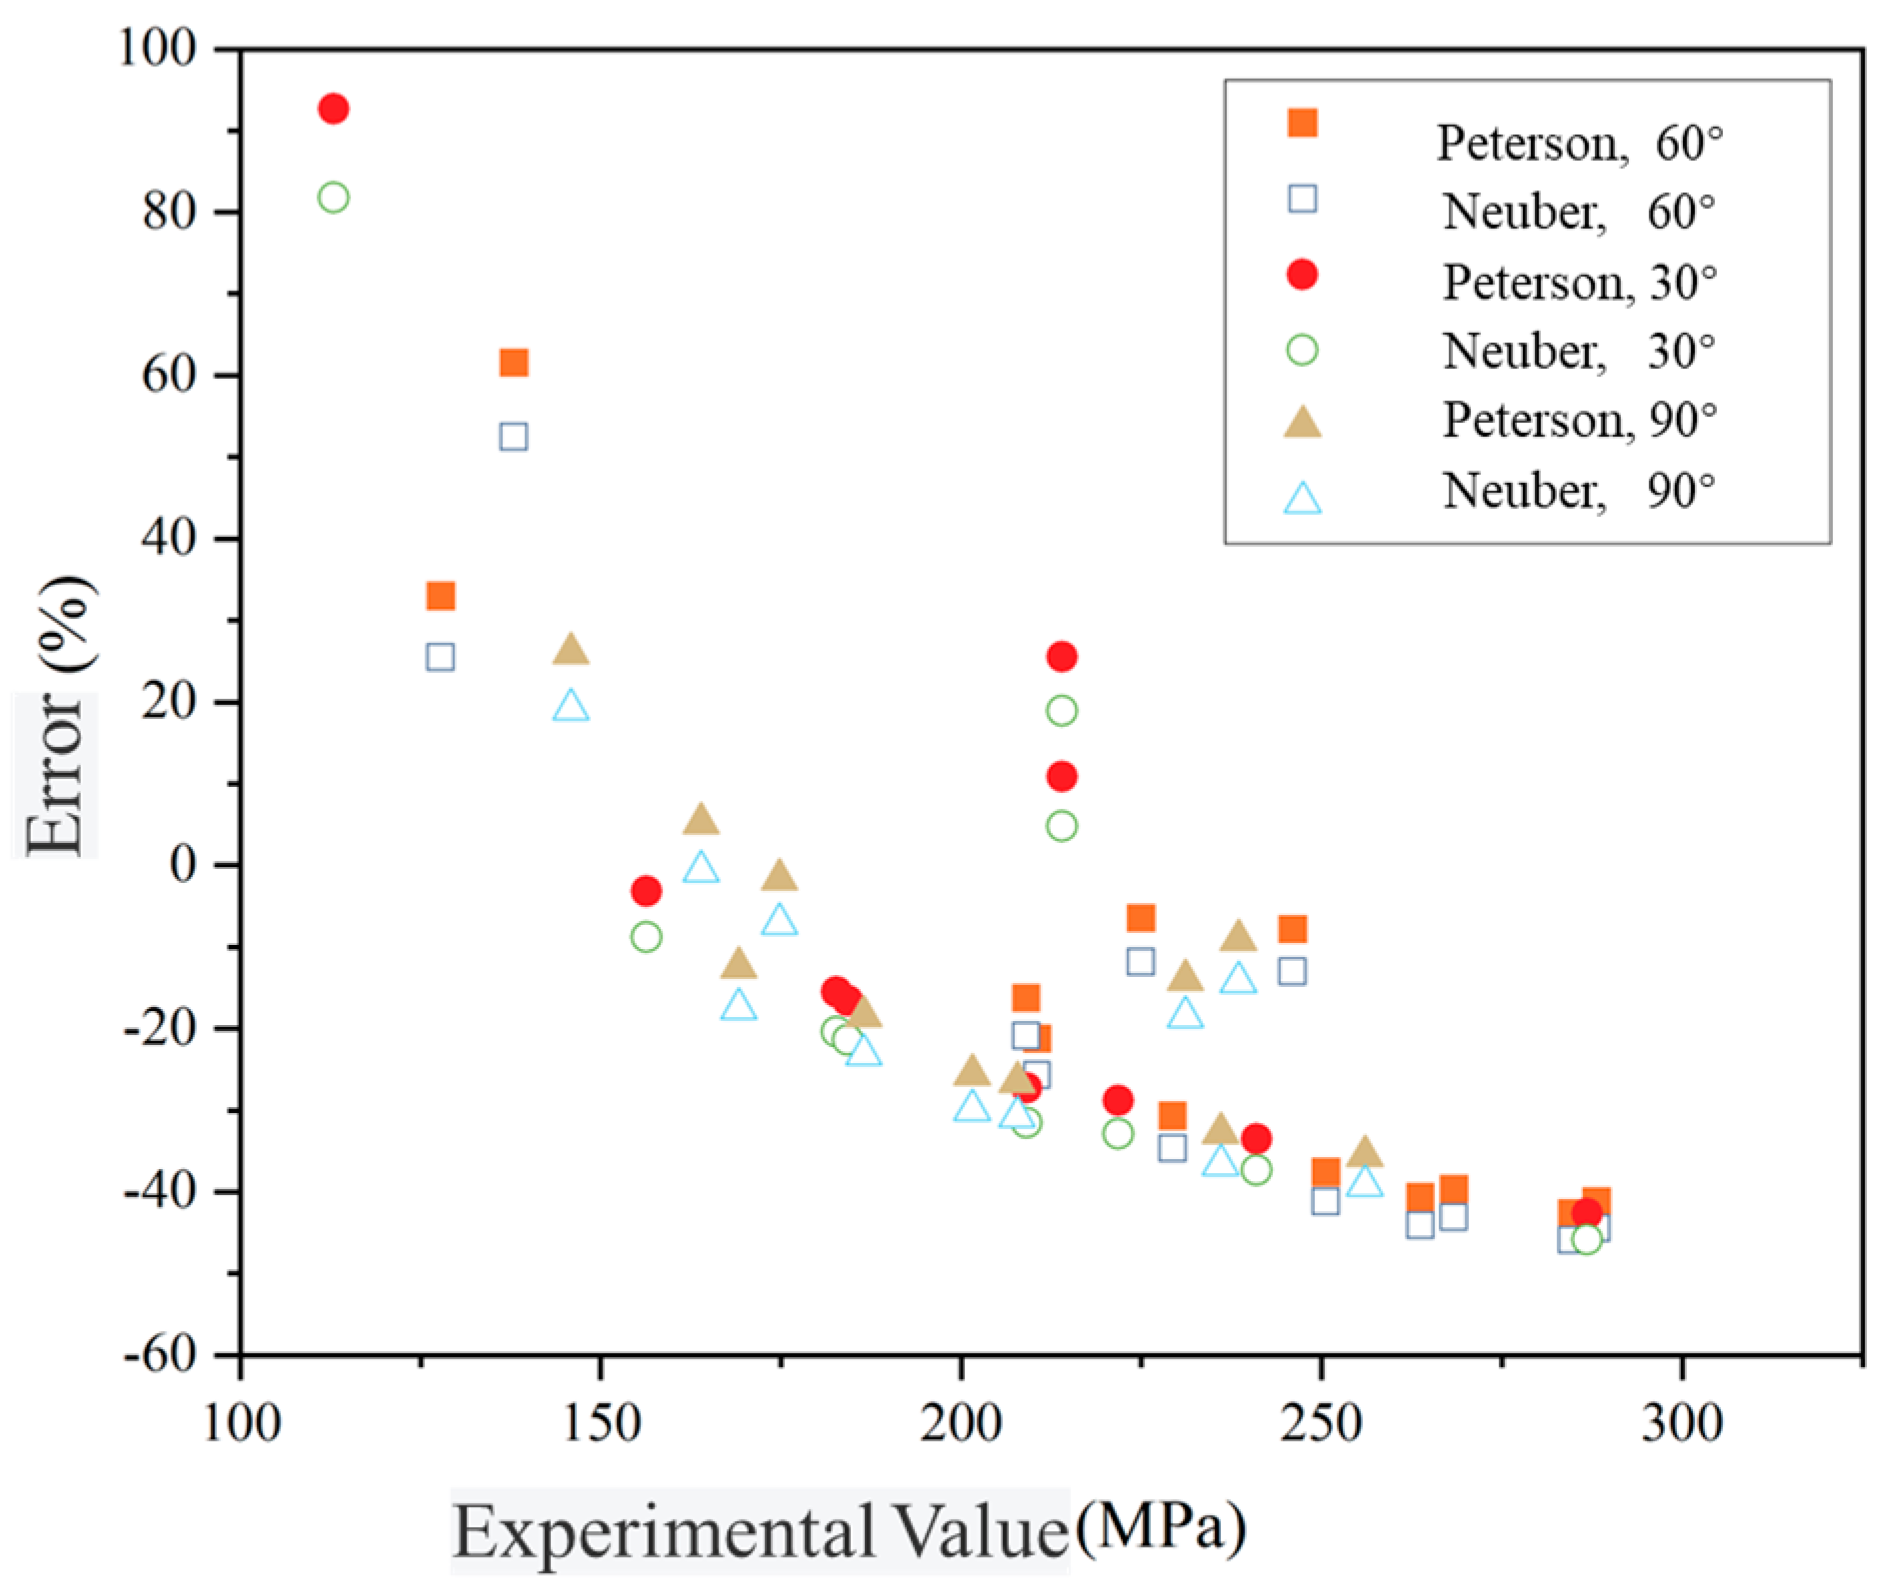
Figure 6 shows the results of fatigue strength predictions based on the mean stress model, comparing predicted values with the experimental results. It can be seen that the errors for both the Peterson and Neuber formulas in predicting high-cycle fatigue strength of foreign object-damaged specimens are within a range of −50% to +100%, with Neuber formula predictions being more conservative than Peterson formula predictions.
For notch-type foreign object-damaged specimens, 58.3% of Neuber’s predictions fall within a 20% scatter band around the experimental values, while 83.3% fall within a 40% scatter band. For pit-type foreign object-damaged specimens, 23.8% of Neuber’s predictions fall within the 20% scatter band, and 81% fall within the 40% scatter band. Peterson’s predictions show 14.3% and 71.4% in these respective bands. Overall, Neuber’s formula provides more accurate predictions for pit-type damages, and its results are more conservative.
Figure 7 illustrates the prediction errors under different impact angles. For 90° vertical impact, the errors are mainly within ±40%, with most of the predictions being lower than the experimental values. However, for 60° and 30° impacts, the prediction errors are larger due to greater shear effects during oblique impacts, which introduce significant microscopic plastic deformations and residual stresses, lowering the high-cycle fatigue strength. Traditional mean stress models do not account for this effect.
In foreign object damage scenarios, the uncertainty of impact conditions leads to differences between actual and theoretical predictions. The mean stress model does not account for the influence of residual stresses, causing significant deviation in the predictions. Thus, it is necessary to revise the model by considering stress concentration, stress gradient, and residual stress to improve the prediction accuracy of high-cycle fatigue strength in foreign object-damaged blades.

4.2. Shear Factor Adjustment to the Model

From the analysis of high-cycle fatigue strength at different impact angles, it was found that the impact angle has a significant effect on fatigue strength. The angle influences the shear effects on the specimen, leading to varying degrees of microscopic plastic deformation, thus affecting stress concentration. Therefore, a shear factor is introduced to adjust the elastic stress concentration factor:
K t = ( 1 + 2 H r ) k ( θ )
Based on the relationship of impact angle’s influence on high-cycle fatigue strength, at the same damage depth, shear effects are more significant. Therefore, a function describing the impact angle is introduced as the shear factor, expressed as follows:
k ( θ ) = a 1 sin ( b 1 π θ 180 + c 1 ) + a 2 sin ( b 2 π θ 180 + c 2 )
In the equation, a1, b1, c1, a2, b2, c2 are the parameters of the shear factor, with values as shown in the Table 6.
The fatigue strength prediction results based on the corrected Neuber formula, as shown in Table 7. (The optimal values of the prediction results are highlighted in bold.)
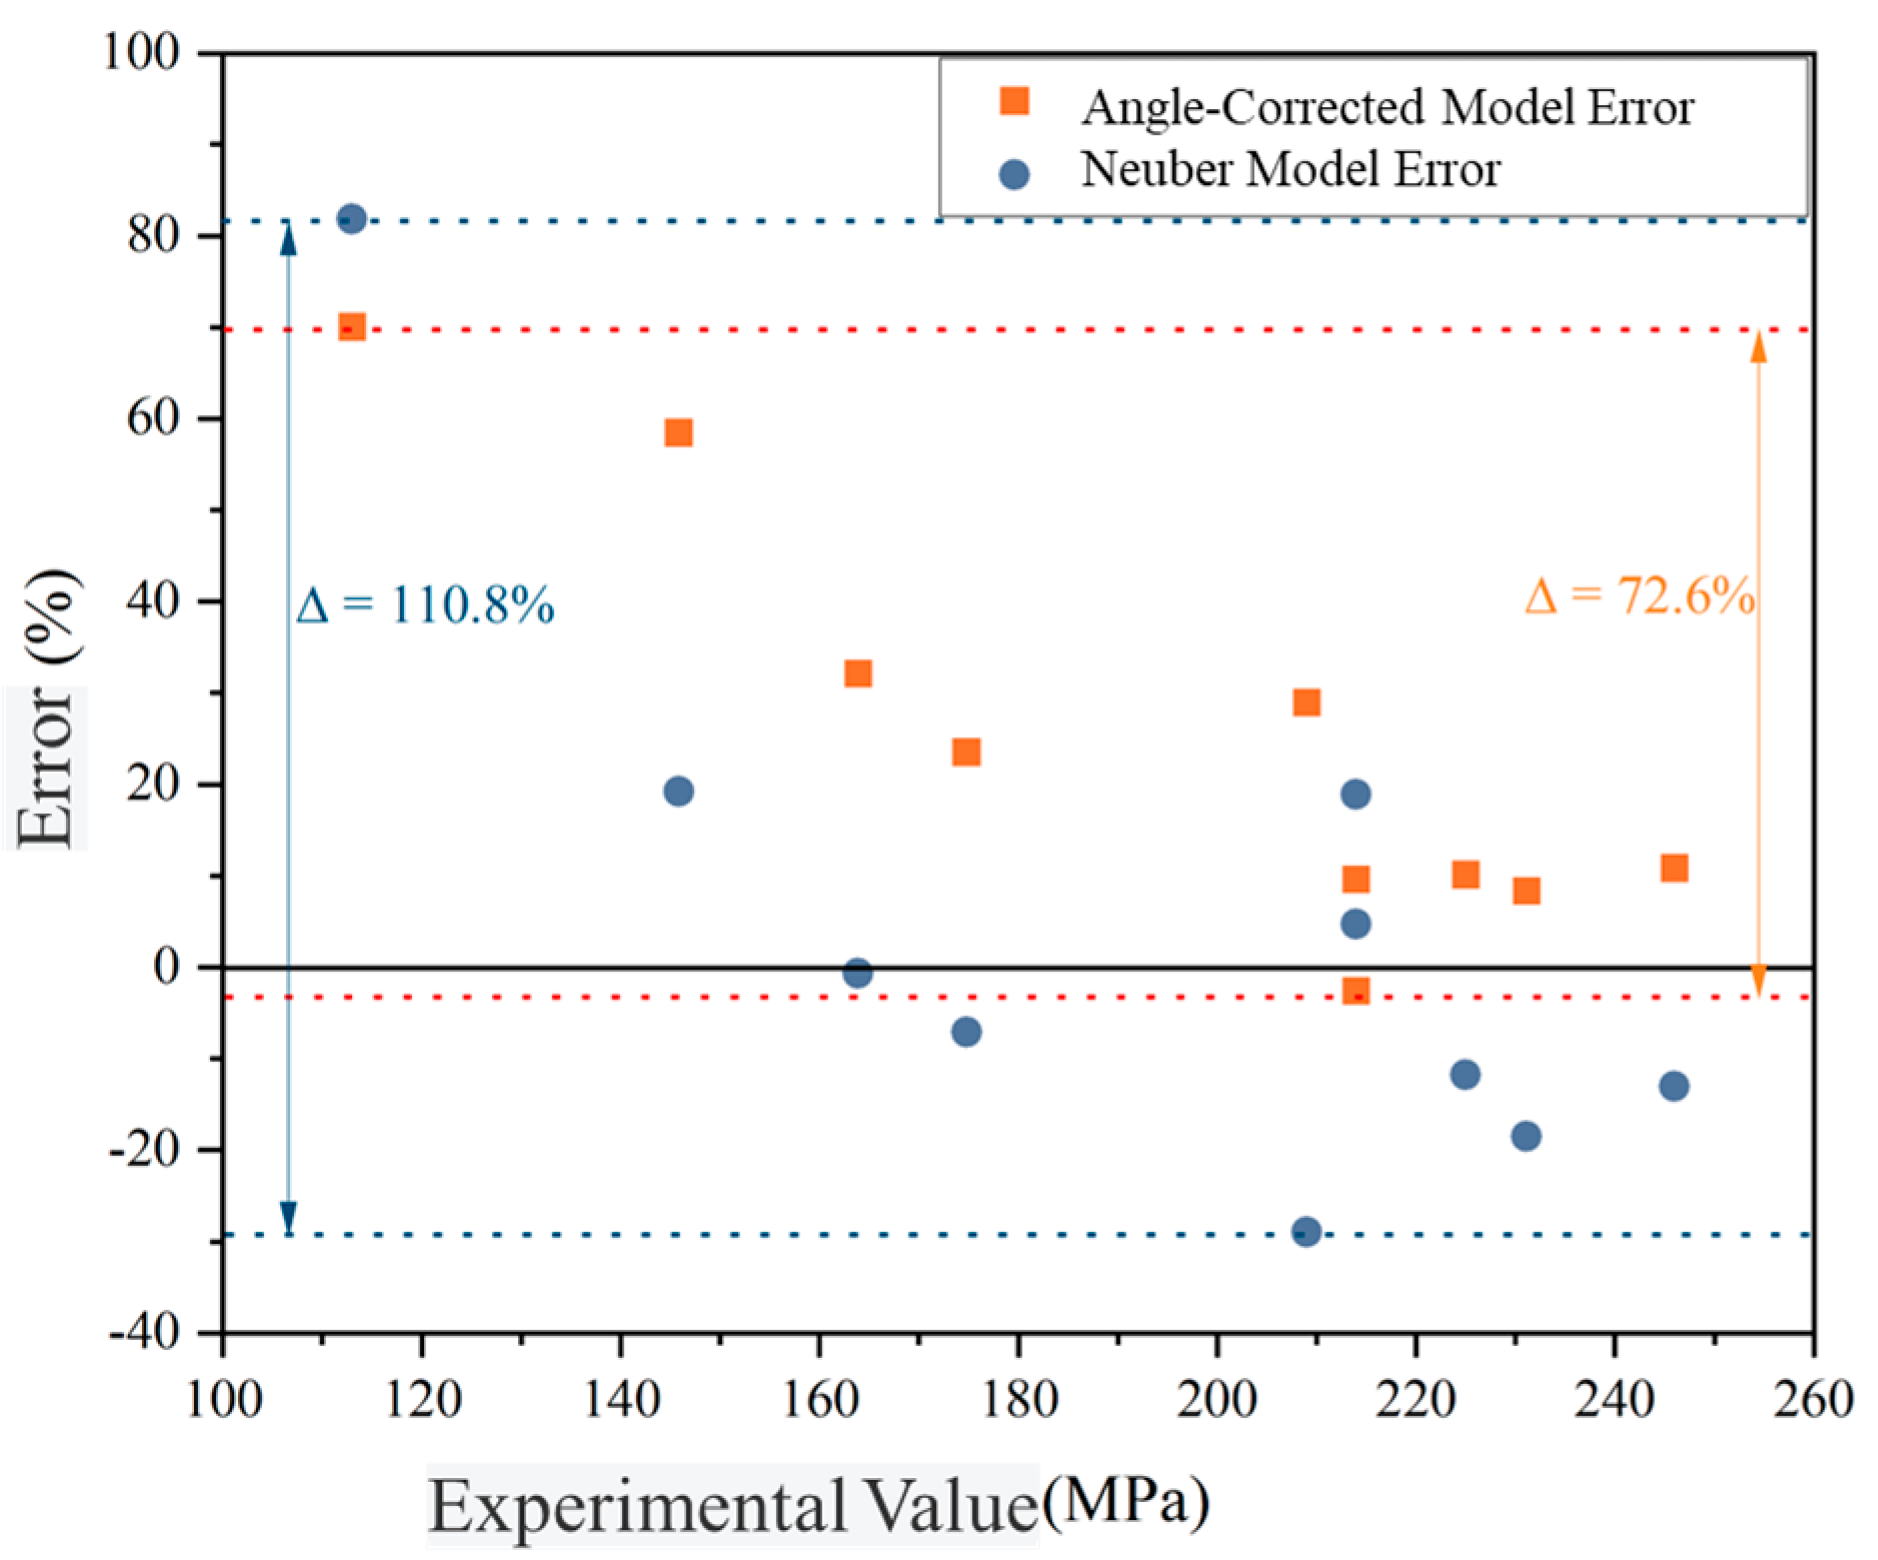
Figure 8 presents the error analysis of fatigue strength predictions based on the modified Neuber model. The modified model shows a significant reduction in prediction error range, with a scatter band of 72.6%, much smaller than the original model’s 110.8%.
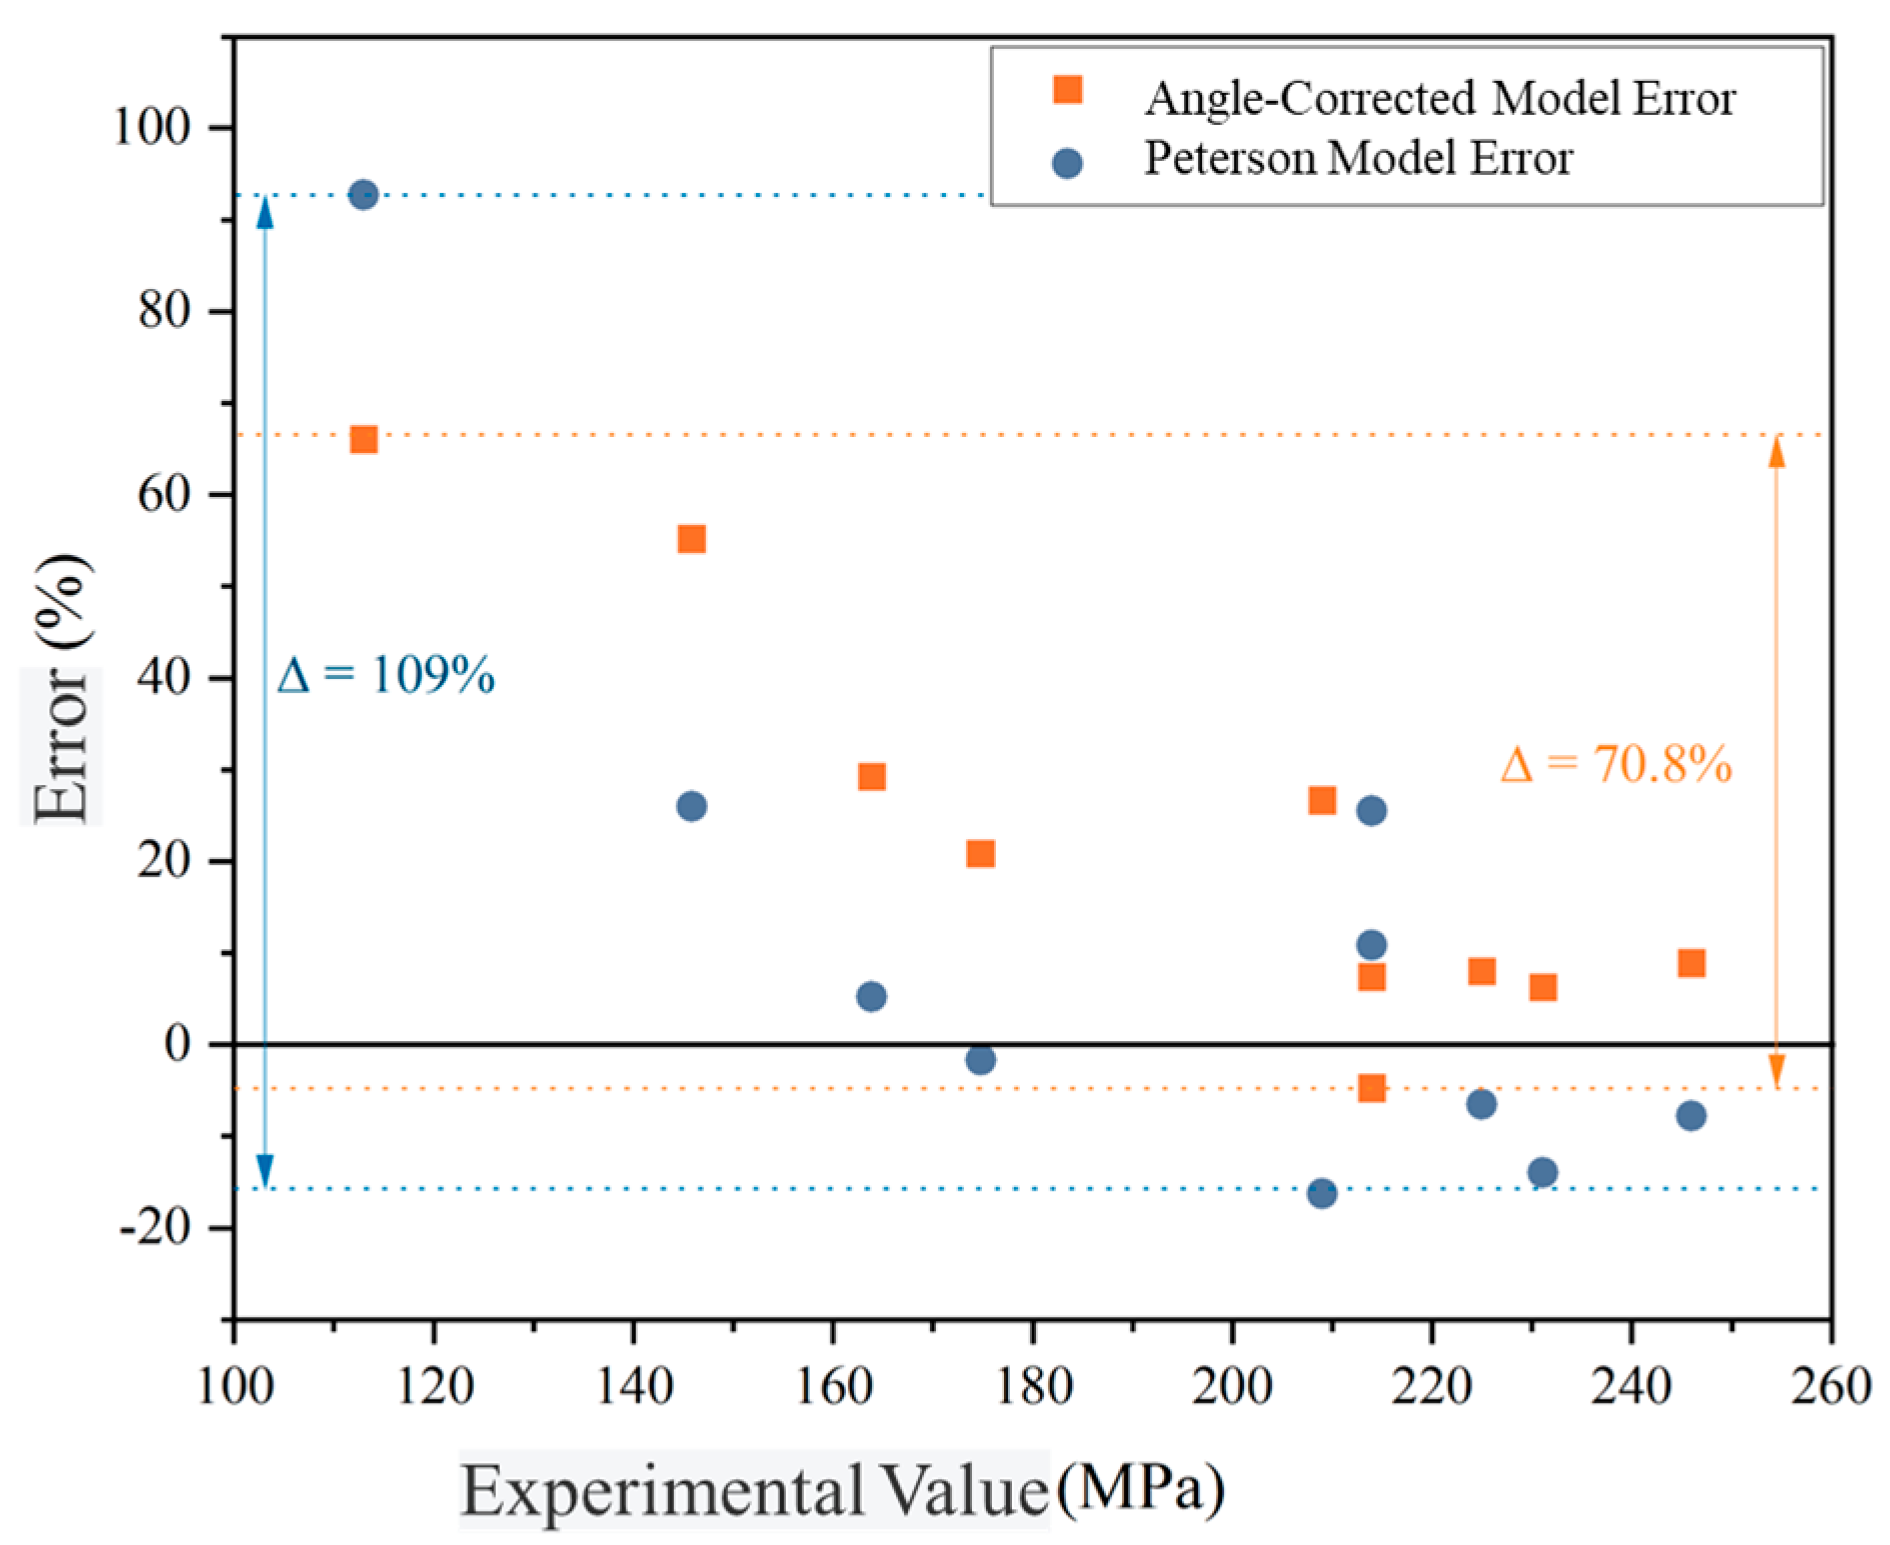
Figure 9 shows the prediction error analysis for the modified Peterson model. The scatter band for the modified model is 70.8%, which is also much smaller than the original model’s 109%, indicating better dispersion after considering shear effects under foreign object impact conditions. However, the modified model tends to overestimate the high-cycle fatigue strength, due to the lack of consideration for residual stress effects.

4.3. Adjustment for Residual Stress in the Model

The residual stress generated by FOD to the blade cannot be ignored. Residual stress, acting as a mean stress, superimposes with the cyclic load, significantly reducing the high-cycle fatigue strength of the damaged specimen. Residual stress changes the stress ratio of the load but does not affect the stress amplitude of the load.
Assume that the original cyclic load’s stress ratio is:
R 0 = σ min / σ max
When residual tensile stress exists within the specimen, the stress ratio of the load becomes:
R r e = ( σ min + σ r e ) / ( σ max + σ r e )
Without considering residual stress, the high-cycle fatigue strength of the specimen is denoted as σe, and after considering the residual stress, the high-cycle fatigue strength of the specimen is assumed to be σ e . We get:
( 1 R 0 2 ) w σ e = ( 1 R r e 2 ) w σ e
Assume that the fatigue notch factor corrected by the residual stress is denoted as K f , then we can obtain:
K f σ e = K f σ e
Substituting Equation (8) into (9),
K f = σ e σ e K f = ( 1 R 0 2 ) w ( 1 R r e 2 ) w K f = ( 1 + σ r e σ max ) w K f
Considering the impact of both impact angle and residual stress, the modified mean stress prediction model can be obtained.
The modified Peterson formula is:
K f = ( 1 + σ r e σ max ) w ( 1 + K t 1 1 + a p / r )
The modified Neuber formula is:
K f = ( 1 + σ r e σ max ) w ( 1 + K t 1 1 + a N / r )

5. Discussion

Based on the residual stress distribution in the foreign object impact damage area obtained from numerical simulations, the average stress of the element points in the notch root region is used as the residual stress value for modifying the high-cycle fatigue life of the foreign object-damaged specimen. The mean residual stress value is calculated using numerical simulations, and stress values higher than 10% of the maximum stress are selected to calculate the stress mean. The results are shown in Table 8.
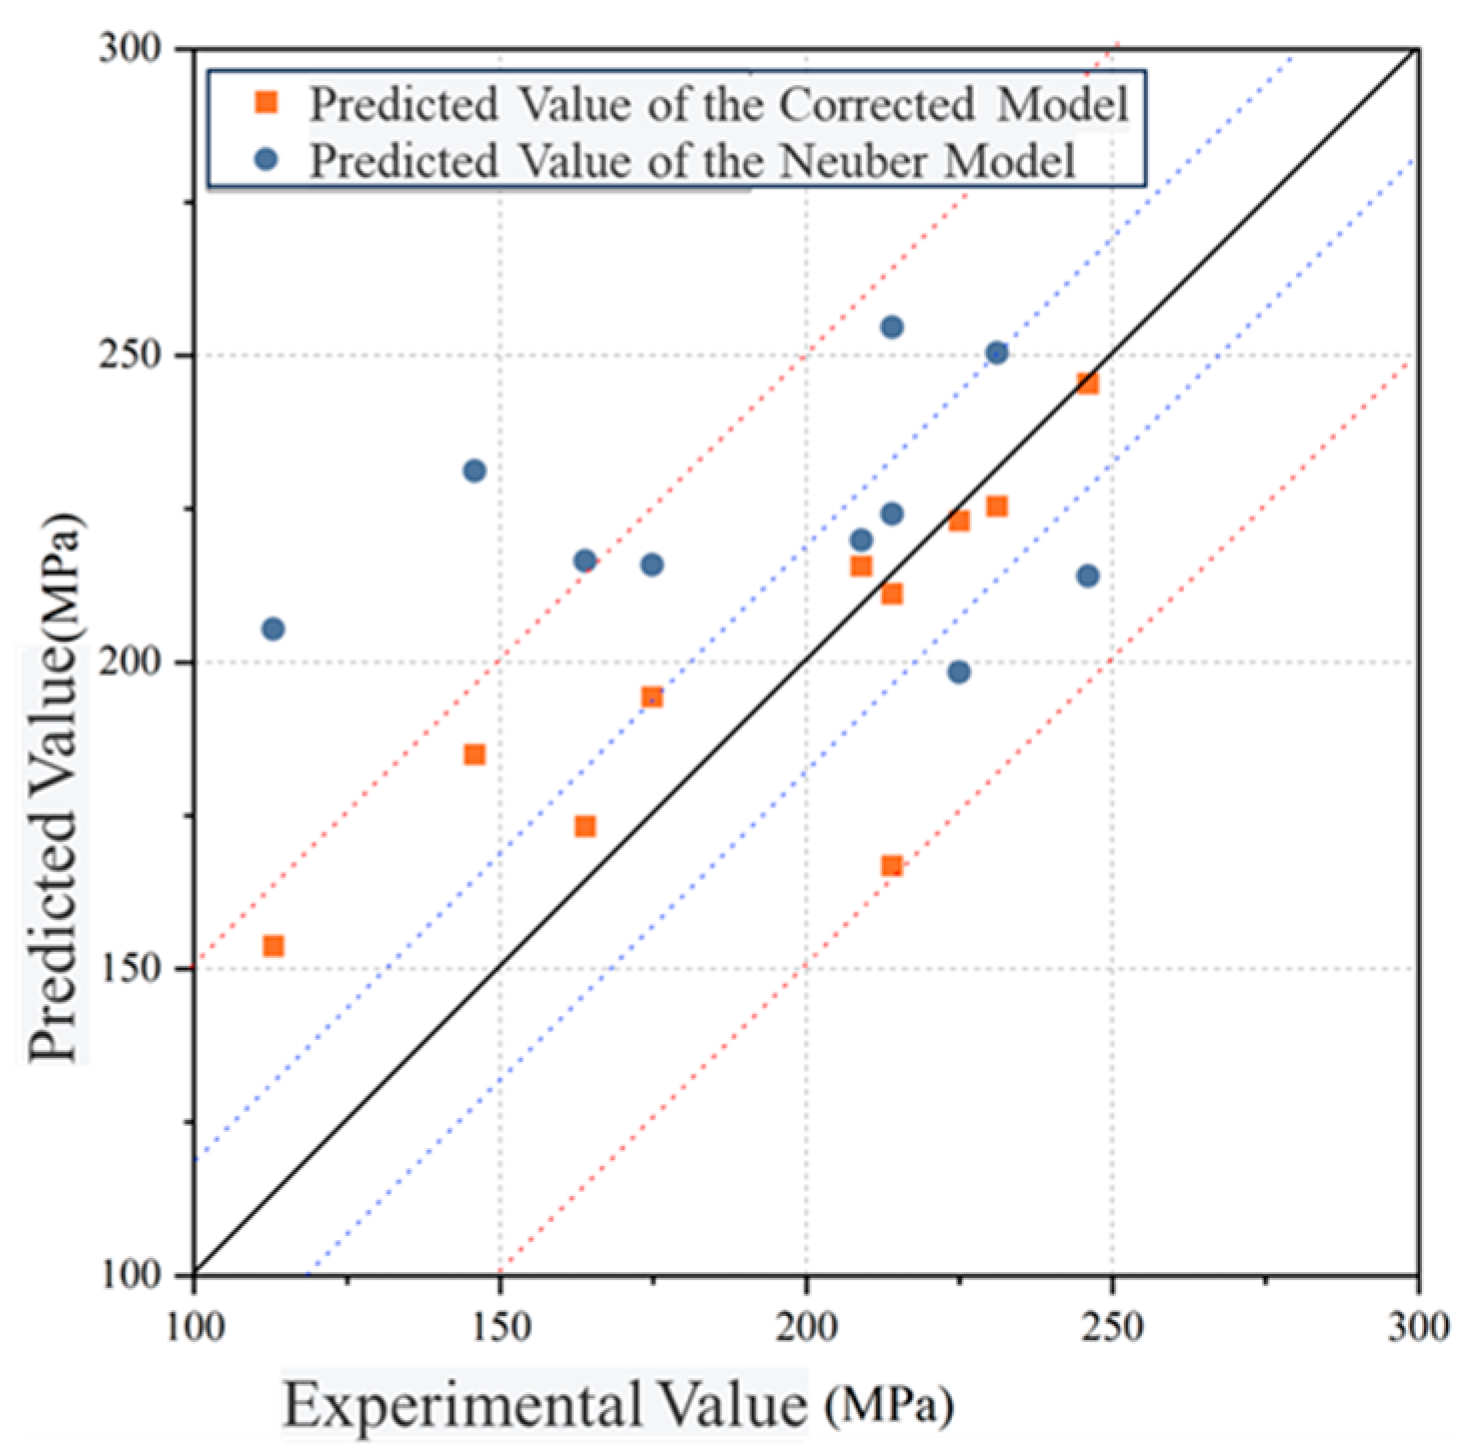
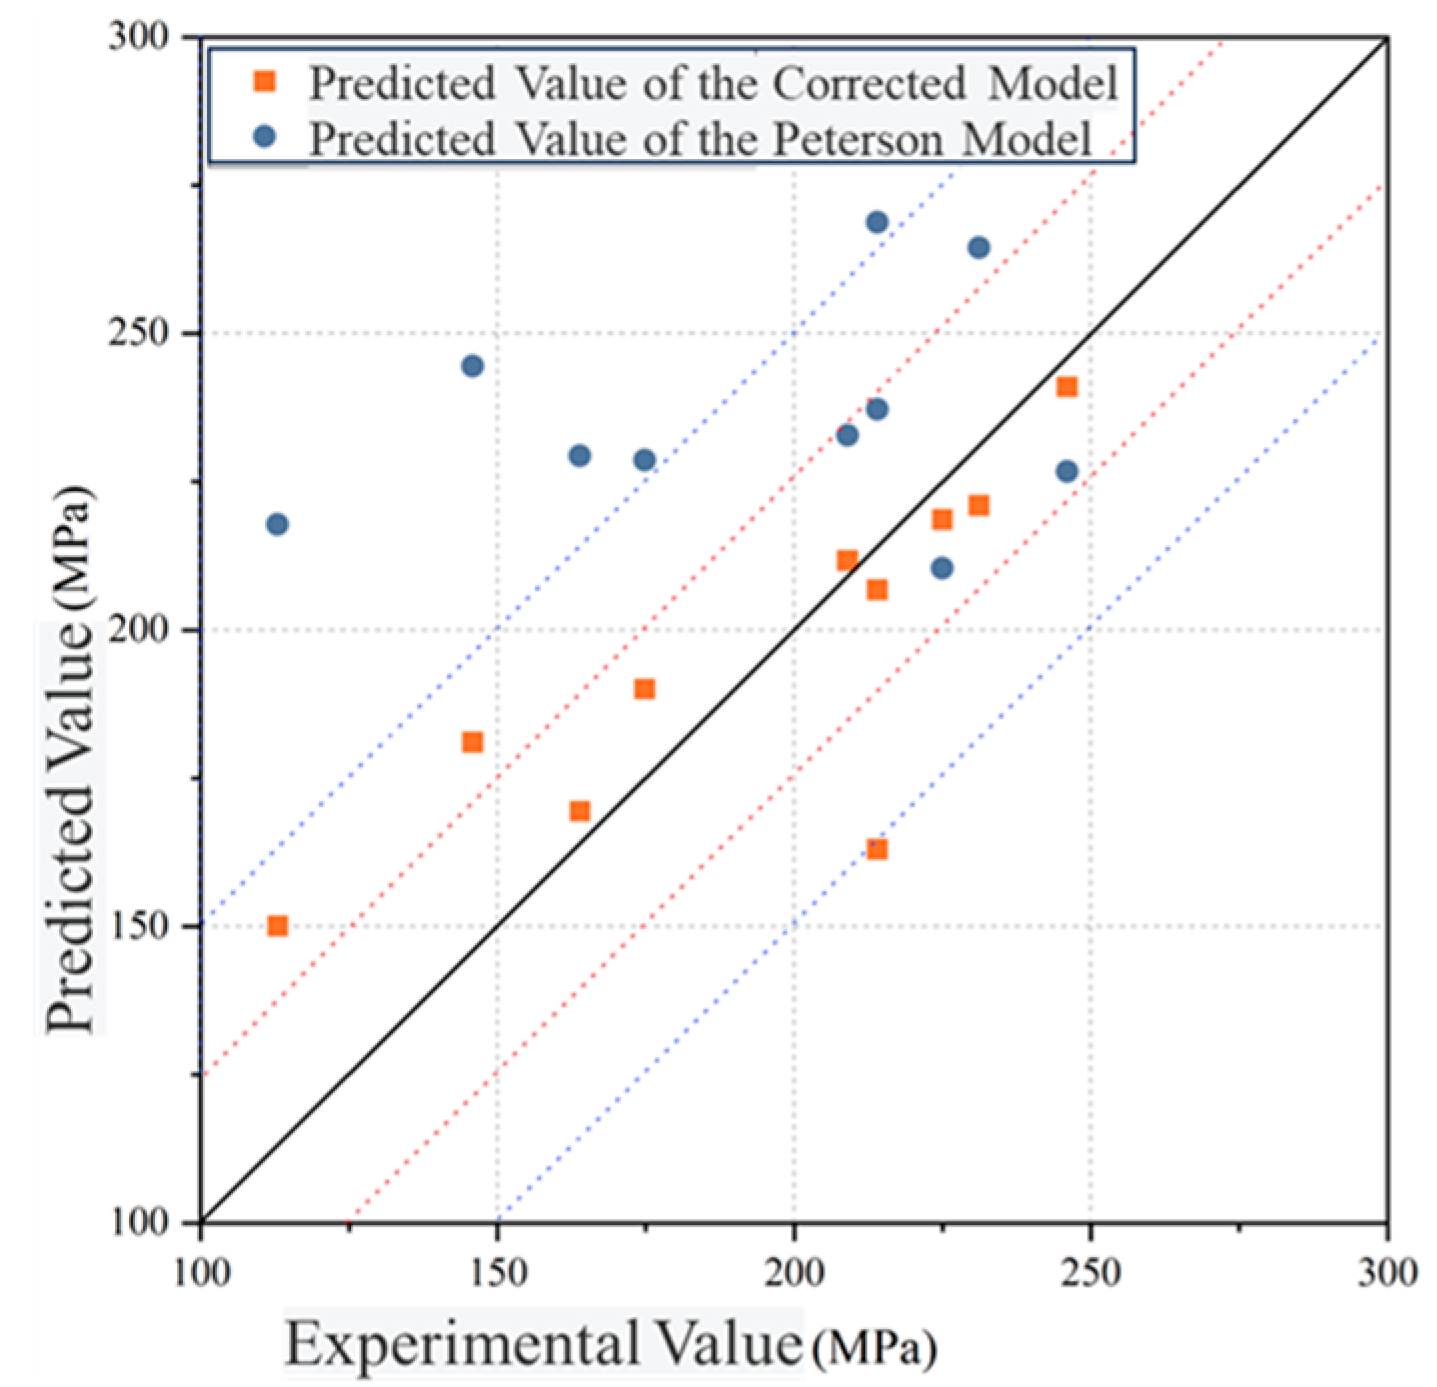
As shown in Figure 10 and Figure 11, the predictions of the modified Neuber model, which considers shear effects and residual stress factors, are within a 10% deviation range of the experimental values for 60% of the cases. In contrast, only 30% of the predictions from the original model fall within the 10% deviation range of the experimental values. The error scatter band of the modified model’s predictions is 72.6%, significantly lower than the 110.8% error scatter band of the Neuber model predictions, indicating that the modified model provides higher prediction accuracy.
As seen in Figure 12, the predictions of the modified Peterson model, which incorporates the impact angle and residual stress factors, are within a 10% deviation range of the experimental values for 70% of the cases. In comparison, only 40% of the predictions from the original model fall within the 10% deviation range of the experimental values. The error scatter band of the modified model’s predictions is 56.9%, significantly lower than the 109% error scatter band of the Peterson model predictions, further demonstrating the higher prediction accuracy of the modified model.

6. Conclusions

This study evaluates the predictive accuracy of the mean stress model for high-cycle fatigue strength of FOD on compressor blades. A shear factor was introduced to modify the mean stress model, considering the impact of the strike angle. Additionally, residual stress results obtained through numerical simulations were incorporated, and the effect of tensile residual stress on the stress ratio was accounted for to further improve the model’s predictive performance for high-cycle fatigue strength of FOD-damaged blades. The main conclusions are as follows:
(1)
The application of the mean stress model to predict the high-cycle fatigue strength of FOD-damaged blades showed poor performance when using both the Neuber and Peterson formulas. These methods exhibited significant prediction errors, especially for blades subjected to oblique impact damage.
(2)
A shear factor was proposed to describe the correction of the mean stress model due to the impact angle. The results show that the error distribution band of the corrected model was 72.6%, significantly smaller than the 100.8% of the Neuber model. This indicates that the mean stress model, considering the impact angle, reduces the variability in predicting high-cycle fatigue strength.
(3)
The influence of tensile residual stress on the applied mean stress was considered, and a mean stress correction model incorporating tensile residual stress was developed based on the medium-life Walker curve. The results demonstrate that only 30% and 40% of the predictions using the Neuber and Peterson models, respectively, fall within the 10% scatter band of the experimental values. In contrast, the corrected model increased the number of predictions within the 10% scatter band by 30%, significantly improving the prediction accuracy compared to the original mean stress model.

Author Contributions

Conceptualization, Y.L. and X.H.; investigation, Y.L., W.Y. and X.H.; data curation, Z.T.; writing—original draft preparation, W.Y.; writing—review and editing, Y.L., X.H. and Z.T. All authors have read and agreed to the published version of the manuscript.

Funding

This research received no external funding.

Data Availability Statement

The data presented in this study are available on request from the corresponding author. The data are not publicly available due to privacy.

Acknowledgments

The authors wish to thank the reviewers for their careful, unbiased, and constructive suggestions, which led to this revised manuscript.

Conflicts of Interest

The authors declare no conflicts of interest.

References

  1. Zhang, Y.; Su, C.; Liu, X. Notch-based probabilistic fatigue analysis of automobile transmission gear considering size effect. Theor. Appl. Fract. Mech. 2023, 125, 103882. [Google Scholar] [CrossRef]
  2. Zhang, M.; Liu, Y.; Wang, W.; Wang, P.; Li, J. The fatigue of impellers and blades. Eng. Fail. Anal. 2016, 62, 208–231. [Google Scholar] [CrossRef]
  3. Cui, D.; Bao, R.; Zhang, R.; Liu, B.; Ouyang, T. Overview of the Development of Aircraft Structural Fatigue and Structural Integrity. J. Aeronaut. 2021, 42, 524394. [Google Scholar]
  4. Zhao, Z.; Wang, L.; Liu, C.; Liu, L.; Chen, W. Prediction of High-Cycle Fatigue Performance of 1Cr11Ni2W2MoV Stainless Steel Plate after Foreign Object Damage. Int. J. Aerosp. Eng. 2020, 2020, 8837564. [Google Scholar] [CrossRef]
  5. Zhao, Z.; Wang, L.; Zhang, J.; Liu, L.; Chen, W. Prediction of high-cycle fatigue strength in a Ti-17 alloy blade after foreign object damage. Eng. Fract. Mech. 2021, 241, 107385. [Google Scholar] [CrossRef]
  6. Murakami, Y.; Takagi, T.; Wada, K.; Matsunaga, H. Essential structure of SN curve: Prediction of fatigue life and fatigue limit of defective materials and nature of scatter. Int. J. Fatigue 2021, 146, 106138. [Google Scholar] [CrossRef]
  7. Gao, J.W.; Yu, M.H.; Liao, D.; Zhu, S.P.; Han, J.; Lesiuk, G.; Correia, J.A.F.O.; De Jesus, A.M.P. Fatigue and damage tolerance assessment of induction hardened S38C axles under different foreign objects. Int. J. Fatigue 2021, 149, 106276. [Google Scholar] [CrossRef]
  8. Maxwell, D.C.; Nicholas, T. A Rapid Method for Generation of a Haigh Diagram for High Cycle Fatigue; Fatigue and Fracture Mechanics: 29th Volume; ASTM International: West Conshohocken, PA, USA, 1999. [Google Scholar]
  9. Ruschau, J.J.; Nicholas, T.; Thompson, S.R. Influence of foreign object damage (FOD) on the fatigue life of simulated Ti-6Al-4 V airfoils. Int. J. Impact Eng. 2001, 25, 233–250. [Google Scholar] [CrossRef]
  10. Thompson, S.R.; Nicholas, T.; Ruschau, J.J.; Thompson, S.R. An investigation into impacting techniques for simulating foreign object damage and their influences on the fatigue limit strength of Ti-6Al-4V. STAR 2007, 45, 23. [Google Scholar]
  11. Bao, Z. Study on the Effect of Notches on the High-Cycle Fatigue Strength of Ti-6Al-4V and Prediction Methods. Ph.D. Thesis, Nanjing University of Aeronautics and Astronautics, Nanjing, China, 2014. [Google Scholar]
  12. Jia, X. Study on the Effect of Centrifugal Force Field on FOD Titanium Alloy Blade HCF and Methods for Determining the Usable Limits. Ph.D. Thesis, Nanjing University of Aeronautics and Astronautics, Nanjing, China, 2020. [Google Scholar]
  13. Hu, X. Foreign Object Damage and Its Effect on the High-Cycle Fatigue Strength of Titanium Alloy Blades. Ph.D. Thesis, Nanjing University of Aeronautics and Astronautics, Nanjing, China, 2009. [Google Scholar]
  14. Yang, X.; Wu, P.; Dong, Z. Notch fatigue life prediction in metals: A critical distance model with microstructure and geometry effects. Theor. Appl. Fract. Mech. 2025, 141, 105213. [Google Scholar] [CrossRef]
  15. Hu, X.; Wan, Y.; Jiang, R.; Song, Y.D. Fatigue strength prediction of TC4 titanium alloy following foreign object damage based on contour feature. J. Mech. Sci. Technol. 2019, 33, 4727–4734. [Google Scholar] [CrossRef]
  16. Wang, C.; Shang, Y.; Zhou, L.; Zhao, Z.; Zhang, X.; Wang, L.; Li, B.; He, W.; Chen, W. High cycle fatigue limit assessment of foreign object damaged aerofoil blades considering the residual stress induced by impact. Eng. Fract. Mech. 2025, 318, 110993. [Google Scholar] [CrossRef]
  17. Denkena, B.; Mai, O.; Poll, G.; Neubauer, T. Enhanced boundary zone rolling contact fatigue strength through hybrid machining by hard turn-rolling. In Proceedings of the Bearing World, Hannover, Germany, 12–13 April 2016. [Google Scholar]
  18. Wang, Y.; Ma, H.; Zhang, Y. Effect of the notch depth on fracture behavior of TC4 titanium alloy sheets. Eng. Fract. Mech. 2023, 277, 108947. [Google Scholar] [CrossRef]
  19. Liu, Q. Manufacturing Technology and Failure Analysis of Titanium Alloy Blades for Aircraft Engines; Aviation Industry Press: Beijing, China, 2018. [Google Scholar]
  20. GB/T 3075-2008; Metallic Materials—Fatigue Testing—Axial-Force-Controlled Method. Standardization Administration of China: Beijing, China, 2008.
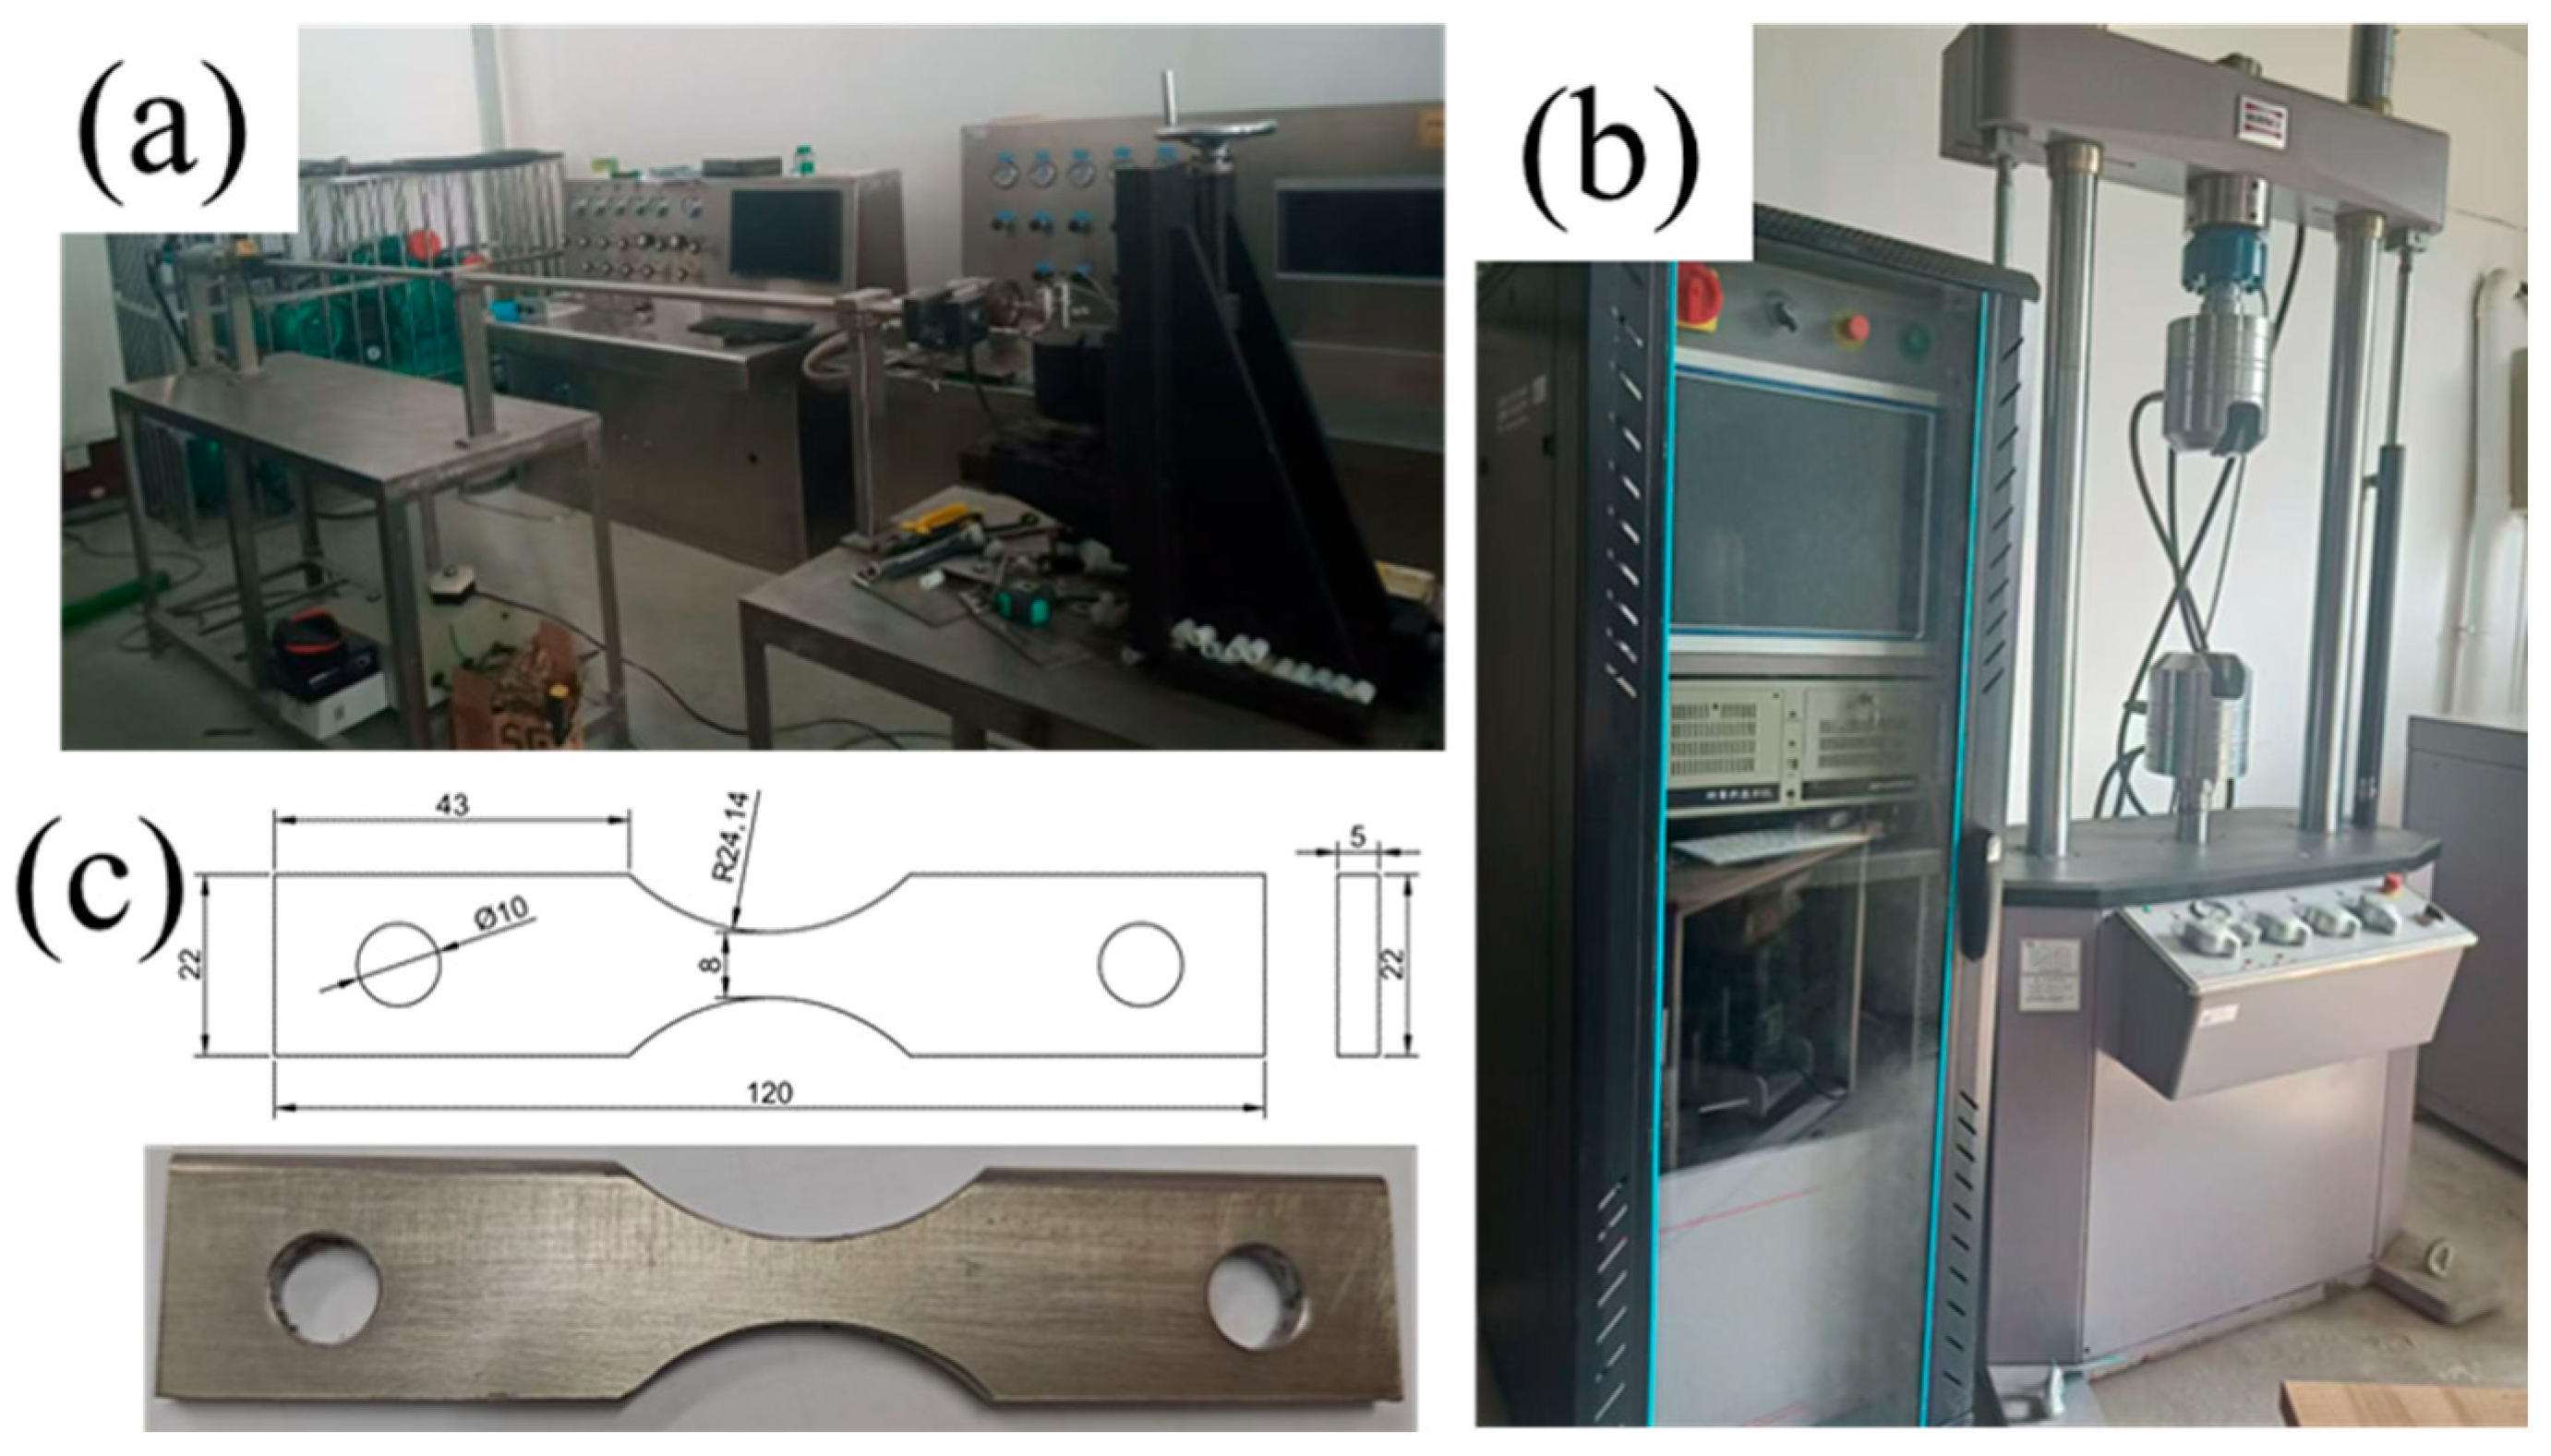
Figure 1. Test bench and test pieces. (a) Air Cannon Impact Test Bench; (b) Fatigue Tensile Test Bench; (c) Drawing of sample dimensions and photograph of the sample.
Metals 15 01150 g001
Figure 2. Step method schematic diagram.
Metals 15 01150 g002
Figure 3. Relationship between stress ratio and high cycle fatigue strength of Ti-6Al-4V titanium alloy.
Metals 15 01150 g003
Figure 4. Influence of impact angle on fatigue strength.
Metals 15 01150 g004
Figure 5. Influence of impact velocity on fatigue strength.
Metals 15 01150 g005
Figure 6. Prediction of fatigue strength by mean stress model.
Metals 15 01150 g006
Figure 7. Prediction error under different impact angles.
Metals 15 01150 g007
Figure 8. Prediction error of fatigue strength by modified Neuber model considering impact Angle.
Metals 15 01150 g008
Figure 9. Prediction error of fatigue strength by modified Peterson model considering impact Angle.
Metals 15 01150 g009
Figure 10. High-cycle fatigue strength prediction by modified Neuber model.
Metals 15 01150 g010
Figure 11. Prediction error of fatigue strength by modified Neuber model.
Metals 15 01150 g011
Figure 12. High-cycle fatigue strength prediction by modified Peterson model.
Metals 15 01150 g012
Table 1. Mechanical Properties of Ti-6Al-4V Titanium Alloy (Room Temperature).
Property ρ / ( k g / m 3 ) E
(GPa)
Poisson’s RatioYield Strength (MPa)Tensile Strength (MPa)
Value44301130.31860932
Table 2. The parameter values of fatigue testing machine.
Dynamic Load±50 kNTest Frequency0.01–50 Hz
Piston Stroke0–150 mmClamping Pressure0–21 MPa
Force Control Accuracy<0.5%Displacement Control Accuracy<0.5%
Measurement Range±75 mmSampling Frequency10 kHz
Table 3. High cycle fatigue strength of intact specimen.
No.Max Cyclic Stress (MPa)Stress Ratio
R
Cyclic Life (×104)HCF
(MPa)
S01360−1100368.7
390−129
S02360−1100391.9
390−1100
420−16.2
S03360−1100375.9
390−153
S044800.1100504.8
5200.162
S054800.1100528.8
5200.1100
5600.122
S064800.1100539.2
5200.1100
5600.148
S076000.5100635
6500.570
S086000.5100618
6500.536
S096000.5100655.5
6500.5100
7000.511
Table 4. High cycle fatigue test results of damaged specimens.
No.Velocity
v (m/s)
Impact
Angle
θ (°)
Notch
Depth
H (mm)
Notch
Width
L1 (mm)
Notch
Length
L2 (mm)
R Fatigue   Strength  
σ 0.1 (MPa)
D01200901.192.322.370.1238.48
D02200901.142.342.340.1256.01
D04200900.581.920.990.1231.13
D05200900.992.382.270.1174.81
D07200601.042.372.970.1288.14
D08200601.212.462.860.1268.37
D09200601.182.172.670.1284.74
D10200601.312.610.910.1225.00
D12200601.022.761.030.1246.00
D13200301.152.613.210.1286.85
D14200300.542.282.510.1214.00
D15200301.262.412.800.1241.00
D19250901.302.782.840.1235.99
D20250901.472.973.060.1207.74
D21250900.783.171.350.1145.86
D23250900.982.912.060.1163.91
D25250601.362.883.190.1250.62
D26250601.362.893.010.1263.68
D27250601.292.993.340.1229.32
D28250600.932.883.600.1209.02
D31250301.322.483.480.1221.80
D34250301.422.953.260.1182.71
D35250300.873.063.450.1214.00
D36250301.173.072.840.1113.00
D37300901.492.783.010.1186.47
D38300901.562.942.870.1201.50
D39300901.622.973.060.1169.17
D43300601.123.013.730.1210.53
D44300601.082.862.480.1138.00
D45300601.032.951.750.1127.82
D49300301.443.062.720.1184.21
D50300301.492.992.480.1209.10
D51300301.513.022.620.1156.39
Table 5. Fatigue strength prediction by Peterson formula and Neuber formula.
No.Impact
Angle
(°)
Velocity
(m/s)
Depth (mm)Experimental
(MPa)
Peterson Prediction
(MPa)
ErrorNeuber Prediction
(MPa)
Error
D01902001.19238.48216.63−9.16%204.32−14.3%
D02902001.14256.01219.42−14.29%207.00−39.2%
D04902000.58231.13264.4314.40%250.44−18.5%
D05902000.99174.81228.6630.80%215.90−7.1%
D07602001.04288.14225.42−21.77%212.78−44.5%
D08602001.21268.37215.55−19.68%203.28−43.0%
D09602001.18284.74217.17−23.73%204.85−45.9%
D10602001.31225.00210.4216.31%198.37−11.8%
D12602001.02246.00226.7016.81%214.01−13.0%
D13302001.15286.85218.85−23.71%206.46−45.9%
D14302000.54214.00268.7515.92%254.6318.9%
D15302001.26241.00212.93−11.65%200.77−37.4%
D19902501.30235.99210.92−10.62%198.84−36.6%
D20902501.47207.74203.07−2.25%191.31−30.8%
D21902500.78145.86244.5067.62%231.1719.2%
D23902500.98163.91229.3339.91%216.54−0.7%
D25602501.36250.62208.02−17.00%196.06−41.2%
D26602501.36263.68208.02−21.11%196.06−44.1%
D27602501.29229.32211.41−7.81%199.32−34.7%
D28602500.93209.02232.7935.92%219.88−20.9%
D31302501.32221.80209.94−5.35%197.90−32.9%
D34302501.42182.71205.2712.35%193.42−20.4%
D35302500.87214.00237.223.25%224.144.7%
D36302501.17113.00217.7380.48%205.3881.8%
D37903001.49186.47202.228.45%190.49−23.2%
D38903001.56201.50199.32−1.08%187.72−30.0%
D39903001.62169.17196.9616.42%185.45−17.6%
D43603001.12210.53220.574.77%208.11−25.7%
D44603001.08138.00222.9595.35%210.4052.5%
D45603001.03127.82226.0580.01%213.3925.5%
D49303001.44184.21204.3810.95%192.57−21.4%
D50303001.49209.10202.22−3.29%190.49−31.5%
D51303001.51156.39201.3828.76%189.69−8.8%
Table 6. Parameter value of the shear factor.
Propertya1b1c1a2b2c2
value17.10.0425−1.048516.20.04441.9716
Table 7. Prediction results of fatigue strength based on corrected impact Angle.
No.Experimental
Value (MPa)
Correct KtM-Peterson Prediction
(MPa)
ErrorM-Neuber Prediction
(MPa)
Error
D04231.132.24250.448.4%245.556.2%
D05174.812.62215.9023.5%211.1620.8%
D10225.002.37237.925.7%242.918.0%
D12246.002.15260.786.0%267.798.9%
D14214.002.40234.619.6%229.767.4%
D21145.862.44231.1758.5%226.3455.2%
D23163.912.62216.5432.1%211.8029.2%
D28209.022.07269.5529.0%264.6426.6%
D35214.002.72208.48−2.6%203.79−4.8%
D36113.002.97192.1570.0%187.6166.0%
Table 8. Fatigue strength prediction by modified Neuber formula.
No.Experimental
Value (MPa)
Corrected
Kt Value
Correction
Neuber Model (MPa)
Correction
Error
Correction
Peterson Model
(MPa)
Correction
Error
D04231.132.24225.40−2.5%220.99−4.4%
D0517 5.312.62194.3111.2%190.048.7%
D10225.002.37223.02−0.9%218.62−2.8%
D12246.002.15245.43−0.2%241.01−2.0%
D14214.002.40211.15−1.3%206.78−3.4%
D21145.862.44184.9426.8%181.0724.1%
D23163.912.62173.235.7%169.443.4%
D28209.022.07215.643.2%211.711.3%
D35214.002.72166.78−22.1%163.03−23.8%
D36113.002.97153.7236.0%150.0932.8%
Disclaimer/Publisher’s Note: The statements, opinions and data contained in all publications are solely those of the individual author(s) and contributor(s) and not of MDPI and/or the editor(s). MDPI and/or the editor(s) disclaim responsibility for any injury to people or property resulting from any ideas, methods, instructions or products referred to in the content.