Article

Dynamic Recrystallization and Microstructural Evolution During Hot Deformation of Al-Cu-Mg Alloy

State Key Laboratory of Materials Low-Carbon Recycling, Beijing University of Technology, Beijing 100124, China
*
Author to whom correspondence should be addressed.
Metals 2025, 15(10), 1100; https://doi.org/10.3390/met15101100
Submission received: 10 September 2025 / Revised: 28 September 2025 / Accepted: 30 September 2025 / Published: 1 October 2025

Abstract

Isothermal hot compression tests were performed on an Al-4.8Cu-0.25Mg-0.32Mn-0.17Si alloy using a Gleeble-3500 thermomechanical simulator within the temperature range of 350–510 °C and strain rate range of 0.001–10 s−1, achieving a true strain of 0.9. The constitutive equation and hot processing maps were established to predict the flow behavior of the alloy. The hot deformation mechanisms were investigated through microstructural characterization using inverse pole figure (IPF), grain boundary (GB), and grain orientation spread (GOS) analysis. The results demonstrate that both dynamic recovery (DRV) and dynamic recrystallization (DRX) occur during hot deformation. At high lnZ values (high strain rates and low deformation temperatures), discontinuous dynamic recrystallization (DDRX) dominates. Under middle lnZ conditions (low strain rate or high deformation temperature), both continuous dynamic recrystallization (CDRX) and DDRX are the primary mechanisms. Conversely, at low lnZ values (low strain rates and high temperatures), CDRX and geometric dynamic recrystallization (GDRX) become predominant. The DRX process in the Al-Cu-Mg alloy is controlled by the deformation temperature and strain rate.

1. Introduction

Al-Cu-Mg alloys (2XXX series) are widely used in aerospace and automotive applications due to their excellent heat resistance and high specific strength [1,2,3,4]. During manufacturing, these alloys undergo hot deformation processes such as forging and extrusion, which have critical impacts on their microstructural evolution [5,6,7]. The softening mechanisms of Al-Cu-Mg alloys involve dynamic recovery (DRV) and dynamic recrystallization (DRX), both of which govern microstructural development and mechanical properties during hot deformation [8,9].
During hot deformation of aluminum alloys, three DRX mechanisms operate: continuous dynamic recrystallization (CDRX), discontinuous dynamic recrystallization (DDRX), and geometric dynamic recrystallization (GDRX) [10,11,12]. CDRX initiates from DRV, and progresses through subgrain rotation and the transformation of low-angle to high-angle grain boundaries (HAGBs), a hallmark feature of this mechanism [8,13]. DDRX predominantly occurs at elevated temperatures, exhibiting distinct nucleation and growth stages [14,15]. GDRX arises when grains elongate perpendicular to the deformation direction during hot deformation, forming serrated grain boundaries that evolve into fine equiaxed grains [16,17]. Although some studies suggest GDRX and CDRX represent the same DRX mechanism, key distinctions exist between them [18]. Zhang et al. [17] investigated AA6061 alloy during hot deformation at 250–475 °C with strain rates of 0.01–1 s−1, revealing GDRX and CDRX as the dominant DRX mechanisms, with their role being temperature and strain rate dependent. The operative mechanism is primarily governed by thermomechanical processing parameters. Li et al. [19] demonstrated that the operative DRX mechanism varies with the lnZ value: GDRX dominates at low lnZ, CDRX at middle lnZ, and DDRX at high lnZ. Similarly, Asgharzadeh et al. [20] found DRX to prevail at low lnZ and DRV to dominate at high lnZ in AA6063 alloy.
In studies of hot deformation for 2XXX series aluminum alloys, constitutive equations are widely employed to characterize the relationship between flow stress and deformation conditions [5,21]. The strain-compensated Arrhenius equation effectively predicts flow behavior during hot deformation [22,23]. Additionally, hot processing maps based on the dynamic materials model (DMM) provide a convenient approach for optimizing deformation parameters, allowing direct identification of favorable temperature and strain rate ranges for the deformation process [10,24,25].
Currently, studies on the dominant DRX mechanisms and optimal hot deformation parameters for Al-Cu-Mg alloys remain limited. This work aims to investigate the DRX behavior during hot deformation. Isothermal compression tests were conducted on an Al-Cu-Mg alloy at 350–510 °C with strain rates of 0.001–10 s−1. The appropriate hot deformation parameters were predicted by establishing constitutive equations and hot processing maps. The deformed microstructures were characterized using the electron backscatter diffraction (EBSD) technique. Based on the processing maps and microstructural analyses, the optimal processing window and underlying deformation mechanisms were determined.

2. Materials and Methods

An Al-Cu-Mg alloy with the nominal composition listed in Table 1 was prepared by melting pure Al (99.9%), pure Mg (99.9%) and master alloys Al-50Cu, Al-10Mn and Al-20Si (in wt%)) in a furnace at 780 °C for 3.5 h, followed by mold casting. Finally obtained a cast ingot measuring 250 × 100 × 20 mm3. The as-cast ingot was machined into cylindrical specimens (Φ10 mm × 15 mm), with surfaces polished using abrasive papers. (The sample selection location is in the middle area of the ingot.) The actual composition of the alloy was determined by inductively coupled plasma optical emission spectroscopy (ICP-OES) (PerkinElmer Inc., Waltham, MA, USA) and also listed in Table 1. The experimental specimens were subjected to single-step homogenization at 530 °C for 18 h. The uniform structure of the homogenized specimen was confirmed in a scanning electron microscopy (SEM) (Thermo Fisher Scientific, Hillsboro, OR, USA) image in Figure 1b. For comparison, an SEM image for the as-cast alloy sample is also shown in Figure 1a.
Isothermal compression tests were performed using a Gleeble-3500 thermomechanical simulator (DSI, Poestenkill, NY, USA). To minimize experimental errors, graphite sheets and lubricant were applied between the specimen and anvils under vacuum conditions. Specimens were heated to target temperatures (350, 390, 430, 470 and 510 °C) at 5 °C/s, and then compressed to a true strain (ε) of 0.9 at various strain rates (0.001, 0.01, 0.1, 1 and 10 s−1), followed by water quenching. To account for temperature gradients, the sample was held at the target temperature for 3 min under isothermal conditions prior to testing, ensuring thermal balance and uniform temperature distribution [7]. A scheme of the thermal compression applied to the specimens is illustrated in Figure 1c. The immediate water quenching allowed the preservation of high-temperature microstructures to room temperature. Specimens were mechanically polished, followed by electropolishing in a solution of 10% HNO3 and 90% ethanol (20 V, 0.6 A, 15 s). Microstructural characterization was conducted using an FEI Quanta 650 SEM with EBSD (operated at 11.0 kV, 22.0 nA, 2 μm step size) (Thermo Fisher Scientific, Hillsboro, OR, USA). EBSD data were processed and analyzed using Orientation Imaging Microscopy (OIM) analysis software (OIM Analysis 6.2, AMETEK Inc., Berwyn, PA, USA).

3. Results and Discussion

3.1. True Stress–Strain Curve

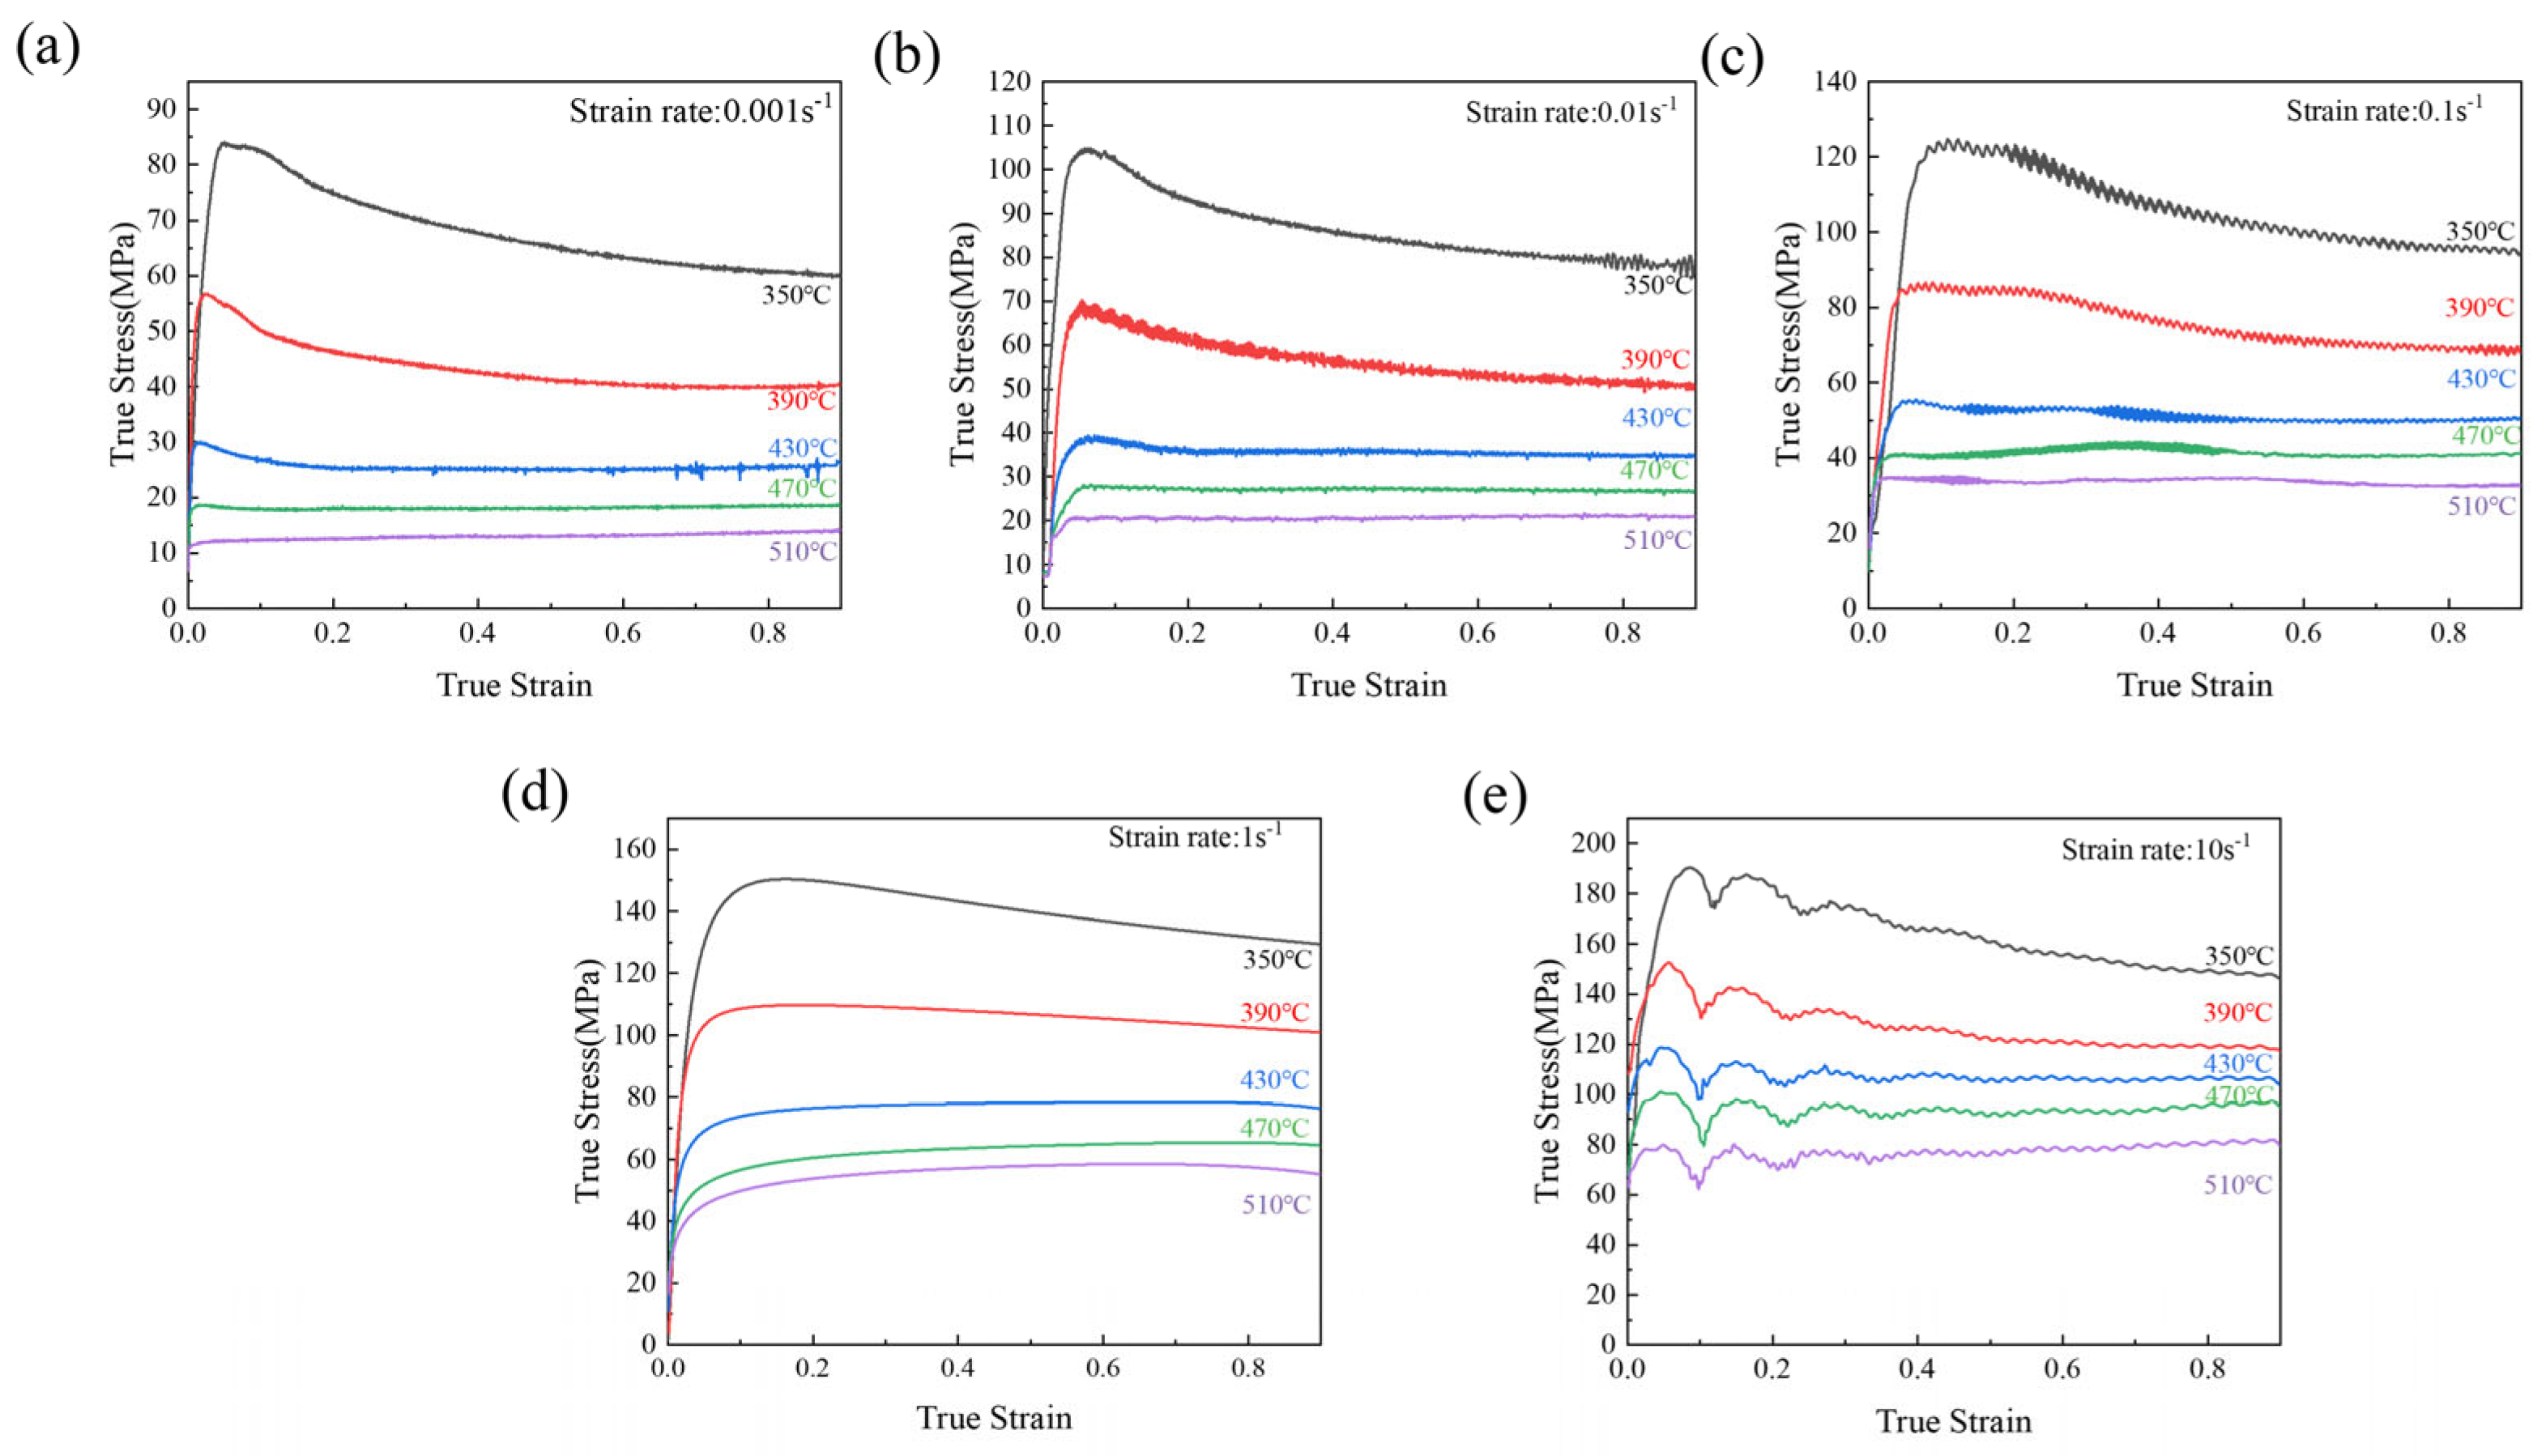
Figure 2 presents the true stress–strain curves of the Al-Cu-Mg alloy at different strain rates and temperatures. When ε < 0.1, the flow stress increases rapidly with strain, showing significant strain hardening. As the strain rate increases, the peak flow stress rises markedly. After the peak of stress, the flow stress decreases gradually, and especially when the strain rate is 0.1 and 10 s−1 (Figure 2c,e), the flow stress decreases in a serrated form, indicating a dynamic balance between work hardening and dynamic softening (DRV and DRX) [26]. Typically, DRV maintains steady-state flow behavior, while DRX leads to stress reduction [27,28,29].
As shown in Figure 2, the peak flow stress reaches a maximum value of 83.9 MPa at 350 °C and strain rate of 0.001 s−1 (see Figure 2a) and a maximum value of 190.3 MPa at 350 °C and strain rate of 10 s−1 (see Figure 2e). The increase in the strain rate increases the peak flow stress by 106.4 MPa, exhibiting a strong strain rate sensitivity for the flow stress. This flow stress enhancement arises from accelerated dislocation accumulation, entanglement and multiplication at higher strain rates, which shortens DRV/DRX processes and requires greater deformation stress [28,29,30]. Conversely, when the deformation temperature increases from 350 to 510 °C, the maximum flow stress at strain rate of 10 s−1 decreases from 190.3 to 79.8 MPa, demonstrating significant thermal softening. Elevated temperatures enhance thermal activation, promoting vacancy migration and dislocation annihilation, and increasing the driving force for DRV/DRX [31]. Under high strain rate conditions, DRX grains undergo fragmentation due to rapid deformation, leading to localized softening zones (manifested as stress minima). Subsequently, the non-recrystallized matrix continues to undergo work hardening (resulting in stress recovery), collectively contributing to an oscillatory stress response.

3.2. Establishing the Constitutive Equation of the Alloy

The relationship between flow stress (σ), strain rate ( ε ˙ ), and deformation temperature (T) can be described by the strain-compensated Arrhenius Equation [27,31,32]:
ε ˙ = A 1 σ n 1 e x p Q R T   α σ < 0.8
ε ˙ = A 2 e x p β σ e x p Q R T   α σ > 1.2
ε ˙ = A s i n h α σ n e x p Q R T   a l l   σ
where A, A 1 ,   A 2 , n, n 1 , α, and β are material constants (with α = β/ n 1 ), σ is the flow stress (MPa), Q is the hot deformation activation energy (kJ/mol), and R is the universal gas constant (8.314 J/(mol·K)).
In this study, the constitutive equation was established using data at a strain of ε = 0.5. Taking natural logarithm of both sides of Equations (1)–(3) yields:
l n ε ˙ = n 1 l n σ + l n A 1 Q R T
l n ε ˙ = β σ + l n A 2 Q R T
l n ε ˙ = n l n s i n h α σ + l n A Q R T
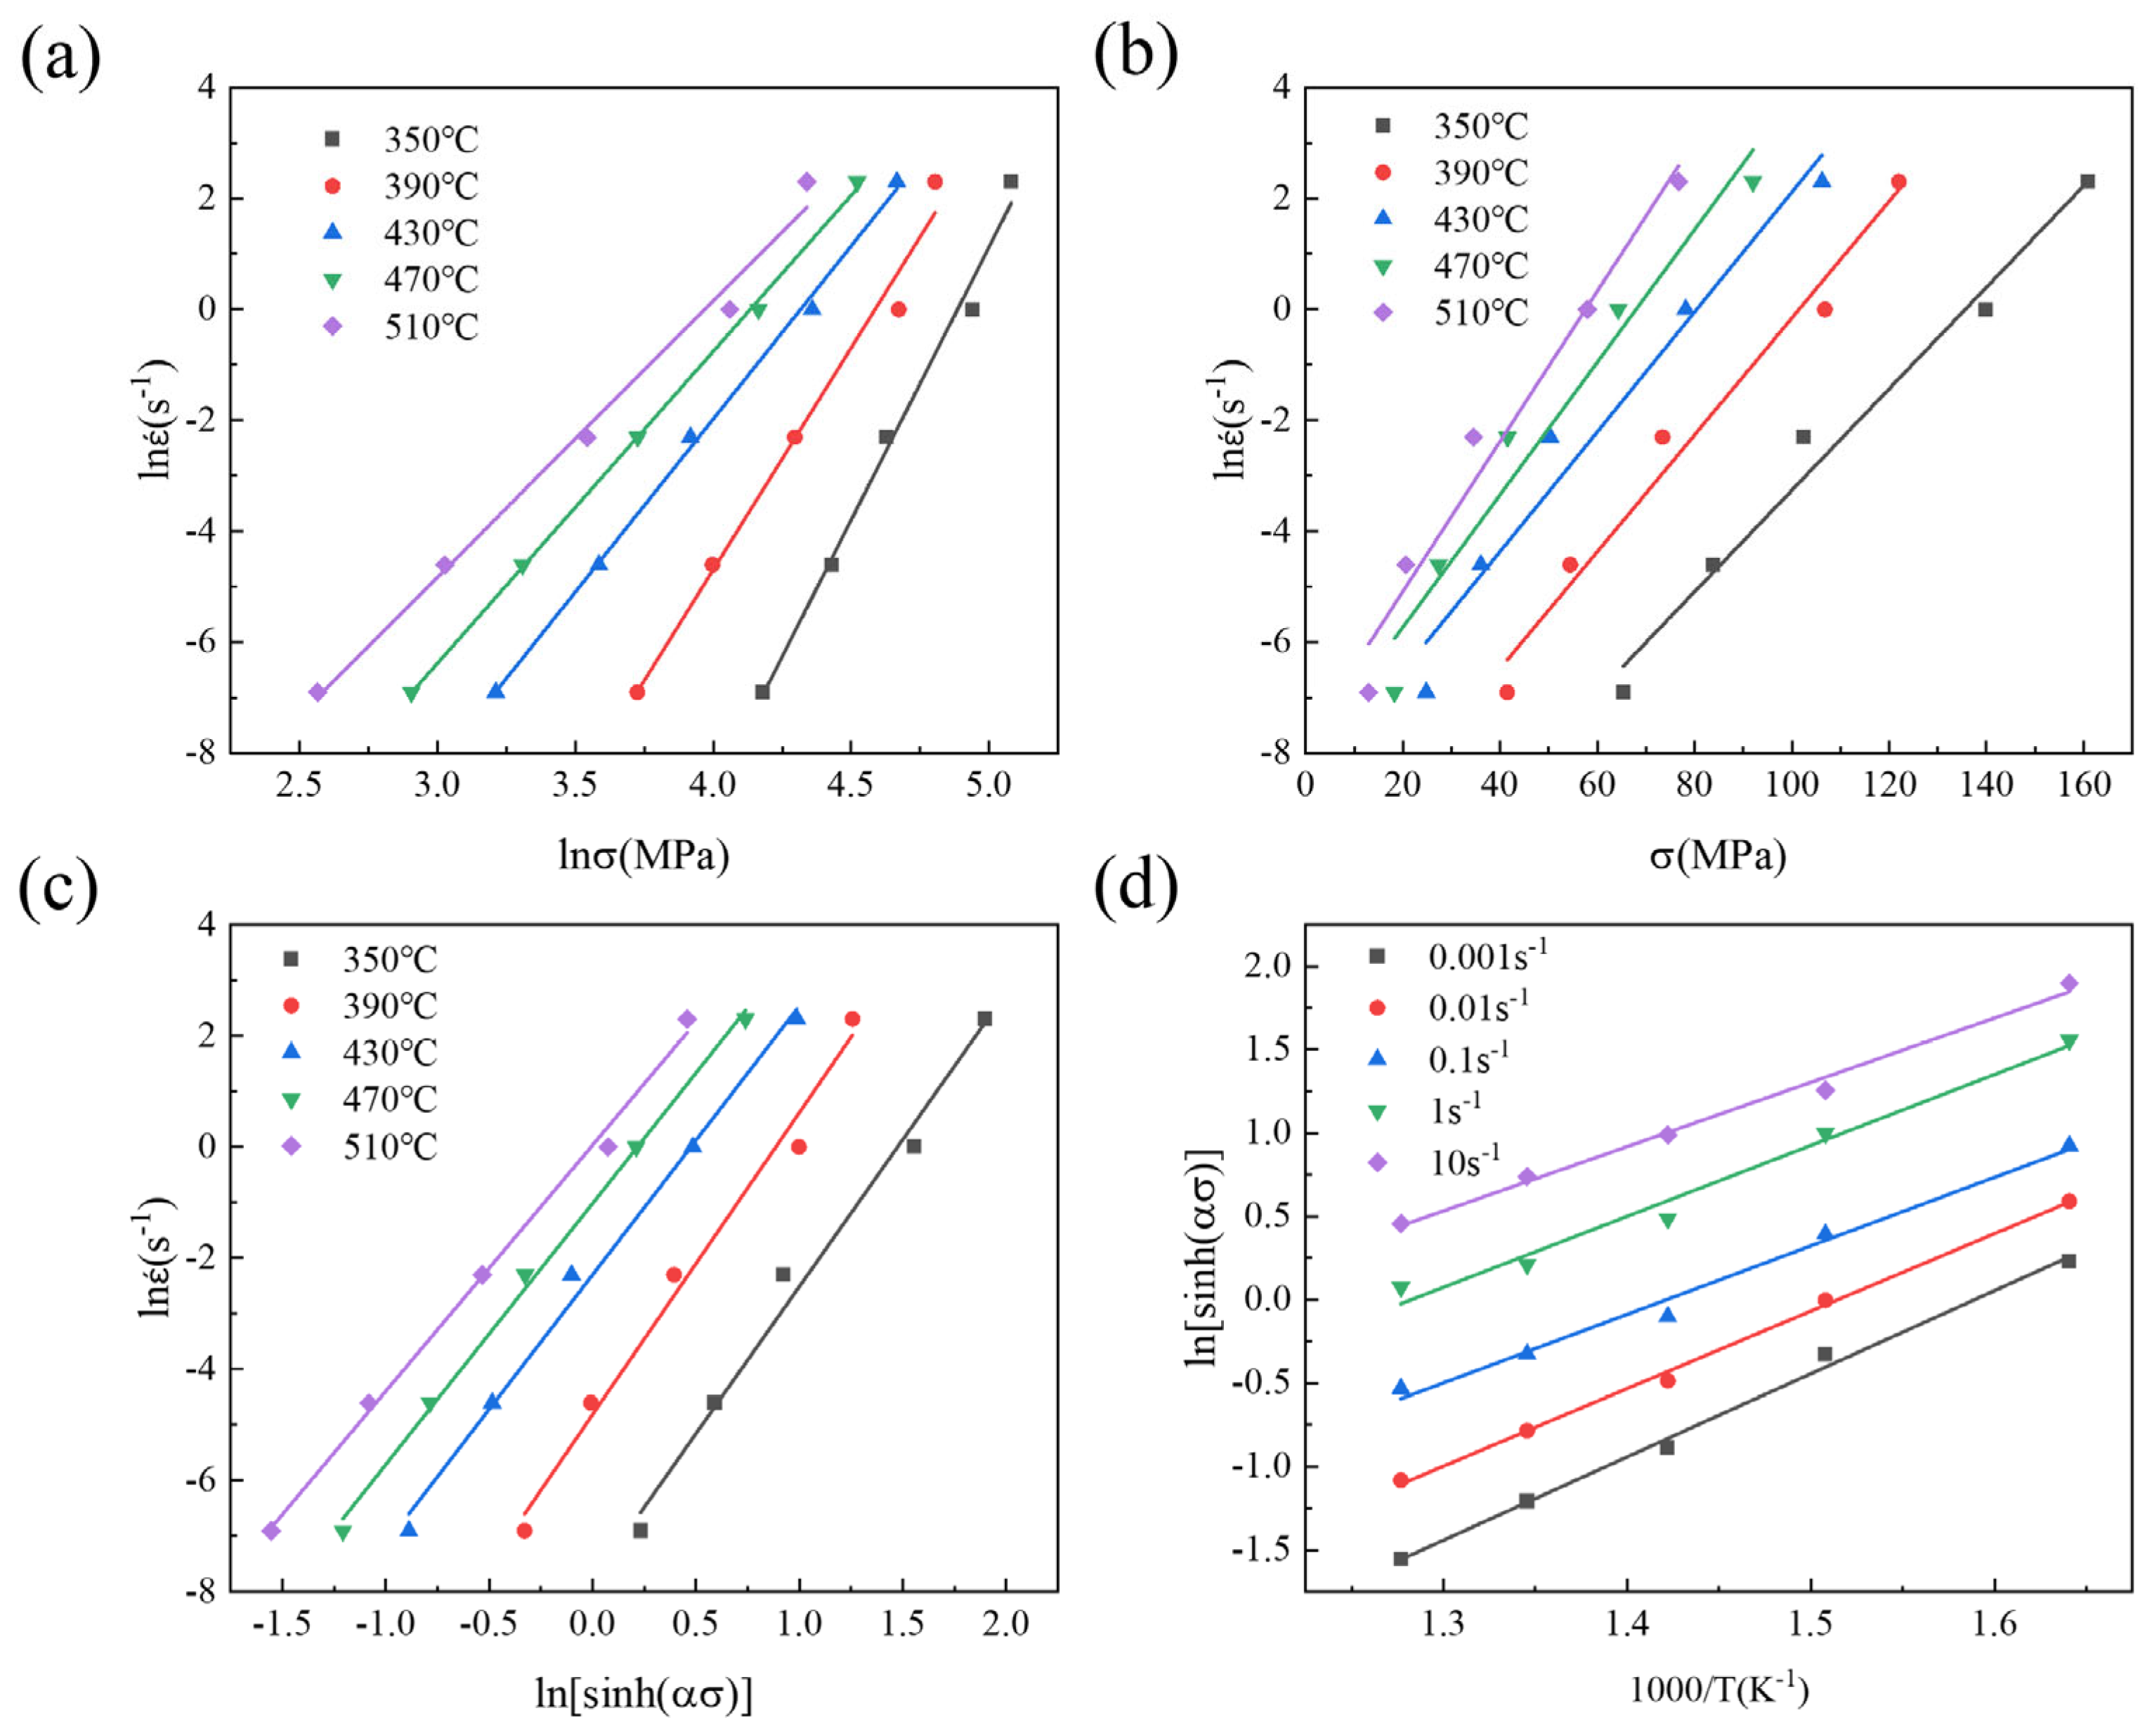
Using Equations (4)–(6), linear fitting was performed for the following relationships: l n ε ˙ l n σ (Figure 3a), l n ε ˙ σ (Figure 3b), l n ε ˙ l n s i n h α σ (Figure 3c), and l n s i n h α σ 1000 / T (Figure 3d). The average slopes of the fitted lines yielded the following material constants: n 1 = 6.9370, β = 0.1120 MPa−1, α = β/ n 1 = 0.0161, n = 4.9374, and S = 4.3714.
The hot deformation activation energy Q can be calculated from Equation (6) [33]:
Q = 1000 R l n s i n h α σ 1 T ε ˙ l n ε ˙ l n s i n h α σ T = R S n
S = l n s i n h α σ 1 T ε ˙ , n = l n ε ˙ l n s i n h α σ T
By substituting the obtained values of n, S, and R into Equation (7), the hot deformation activation energy Q of the Al-Cu-Mg alloy at ε = 0.5 was calculated to be 179.4438 kJ/mol. The activation energy Q is a critical parameter for predicting deformation mechanisms in alloys [30].
The Zener–Hollomon parameter (Z-parameter) is introduced as follows [31,34]:
Z = A s i n h α σ n = ε ˙ e x p Q R T
Taking logarithms on both sides of Equation (9), we have:
l n Z = l n A + n l n s i n h α σ
As shown in Table 2, substituting the parameters obtained for ε = 0.5 into Equation (10) yields the lnZ values under different deformation conditions. Figure 4 presents the linear fitting of lnZ versus ln[sinh(ασ)], with a slope (n) of 4.7079 and an intercept (lnA) of 27.9353, corresponding to A = 1.36 × 10¹².
In summary, the constitutive equation of thermal deformation of the Al-Cu-Mg alloy at ε = 0.5 is as follows:
ε ˙ = 1.2 × 10 12 s i n h α σ 4.7079 e x p 179 , 443.8 R T

3.3. Verifying the Constitutive Equation of the Alloy

The material parameters (α, β, n, lnA, and Q) corresponding to 18 strain levels (0.05–0.9) were determined. A 7th-order polynomial fitting was applied to these parameters at different strains using Equation (12), as shown in Figure 5, revealing a significant strain dependence. Figure 5e shows that the activation energy (Q) decreases with increasing strain. This trend arises because work hardening dominates in the early stages of hot deformation, requiring higher Q. As strain increases, dynamic recovery (DRV) and dynamic recrystallization (DRX) become dominant, softening the alloy and reducing the required activation energy [35,36]. The polynomial fitting coefficients for α, β, n, lnA, and Q as functions of strain are summarized in Table 3.
Y ε = B 0 + B 1 ε + B 2 ε 2 + B 3 ε 3 + B 4 ε 4 + B 5 ε 5 + B 6 ε 6 + B 7 ε 7
By establishing the relationship between strain and material parameters, the flow stress can be accurately determined for any given strain. Thus, the hot deformation constitutive equation of the alloy, based on the hyperbolic sine relationship, can be expressed in terms of stress and the Zener–Hollomon parameter [30]:
σ ε = 1 α ε l n Z Q ε A ε 1 n ε + Z Q ε A ε 2 n ε + 1 1 2 Z = ε ˙ e x p Q ε R T
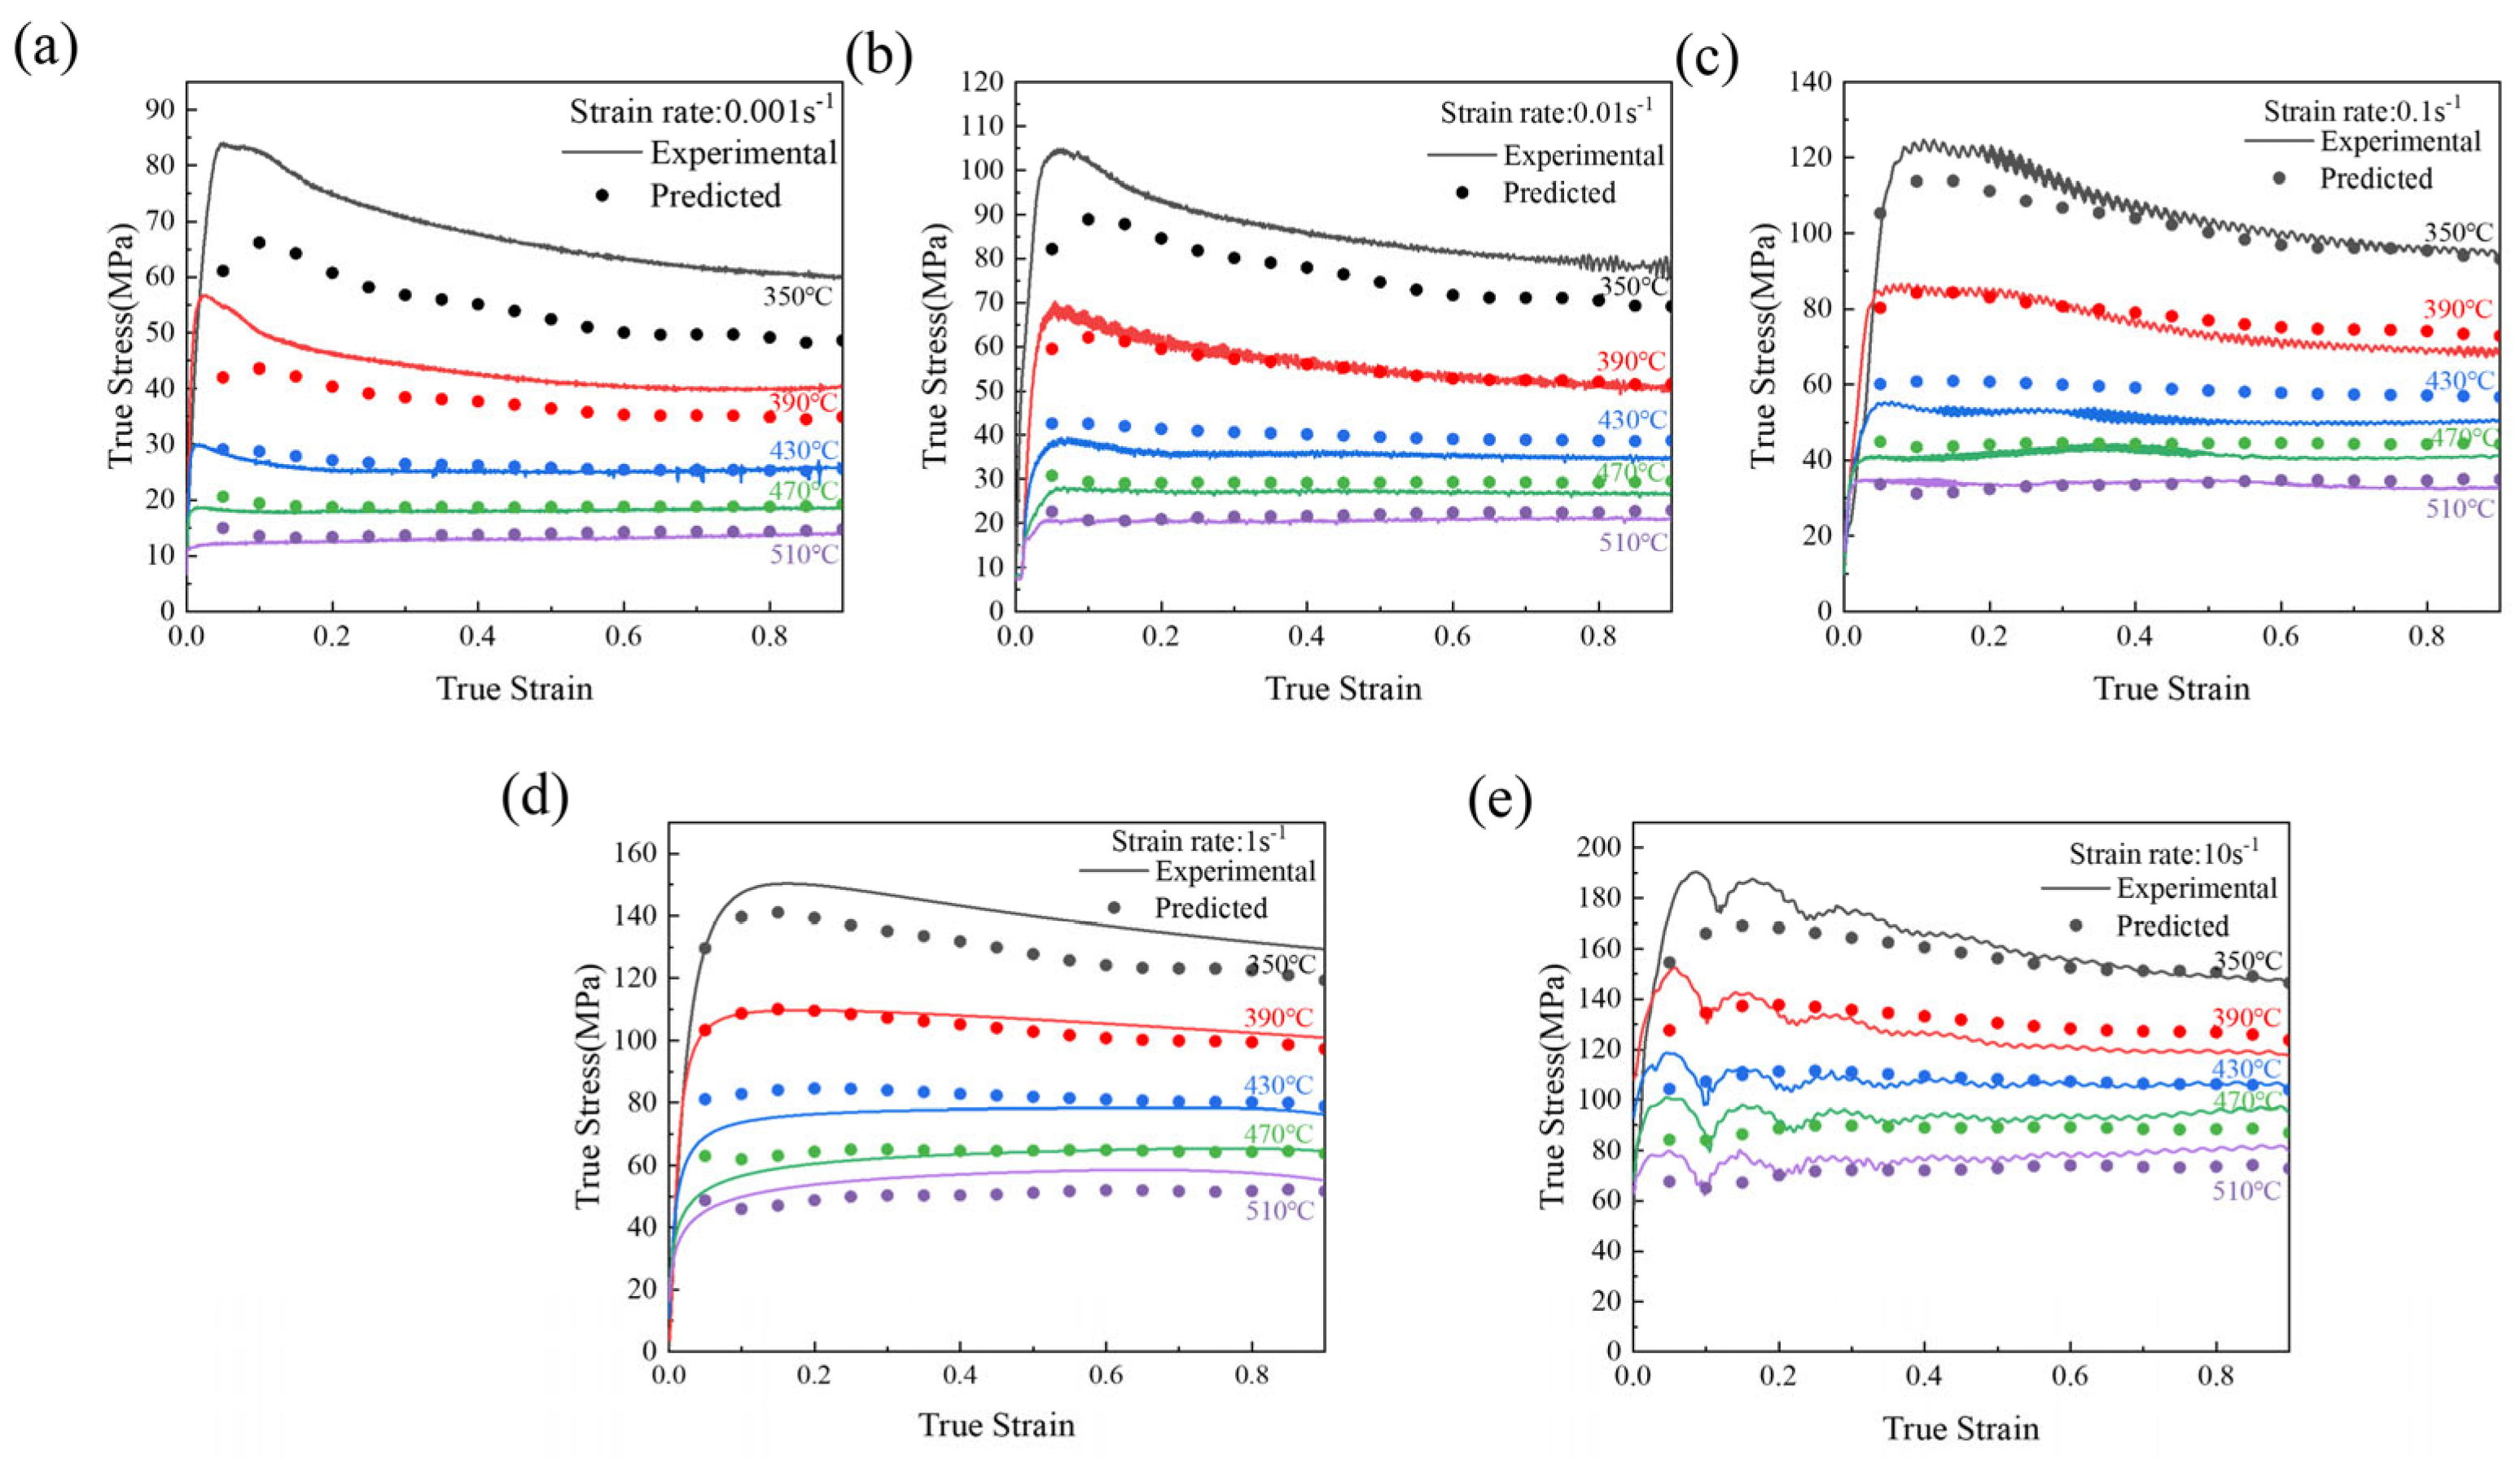
To verify the correctness of the developed constitutive model, Equation (13) was used to calculate the flow stresses at different strains by substituting the data in Table 3 into the equation. As shown in Figure 6, the calculated values exhibit good agreement with the experimental data across all deformation conditions, confirming the high accuracy of the strain-compensated Arrhenius-type constitutive equation established in this study.
The correlation coefficient (R) was introduced to further validate the prediction accuracy [21]. As shown in Figure 7, the experimental and predicted flow stress values exhibit excellent linear correlation with R = 0.979, demonstrating the strong predictive capability of the established equation.
R = i = 1 N E i E ¯ P i P ¯ i = 1 N E i E ¯ 2 i = 1 N P i P ¯ 2

3.4. Hot Processing Maps

Hot processing maps effectively elucidate the plastic deformation mechanisms and optimal parameter selection for alloys [35]. The dynamic materials model (DMM) [37] describes the deformation behavior, where hot deformation is an energy dissipation process. Total energy (P) = Power dissipated of plastic deformation (G) + Power dissipated of microstructural evolution and phase transition (J) is expressed as:
J P = l n σ l n ε ˙ = m
P = G + J = 0 ε ˙ σ d ε ˙ + 0 σ ε d σ ˙
The strain rate sensitivity exponent (m) is a key parameter for analyzing hot deformation mechanisms and microstructural evolution in aluminum alloys. The energy dissipation efficiency (η) is expressed as follows [29,36]:
η = 2 m m + 1
A high η value signifies superior hot workability of the alloy. However, to determine optimal processing parameters, both the energy dissipation efficiency (η) and the instability parameter ξ ε ˙ must be considered.
ξ ε ˙ = l n m m + 1 l n ε ˙ + m = m + 1 2 c + 6 d x m + m < 0
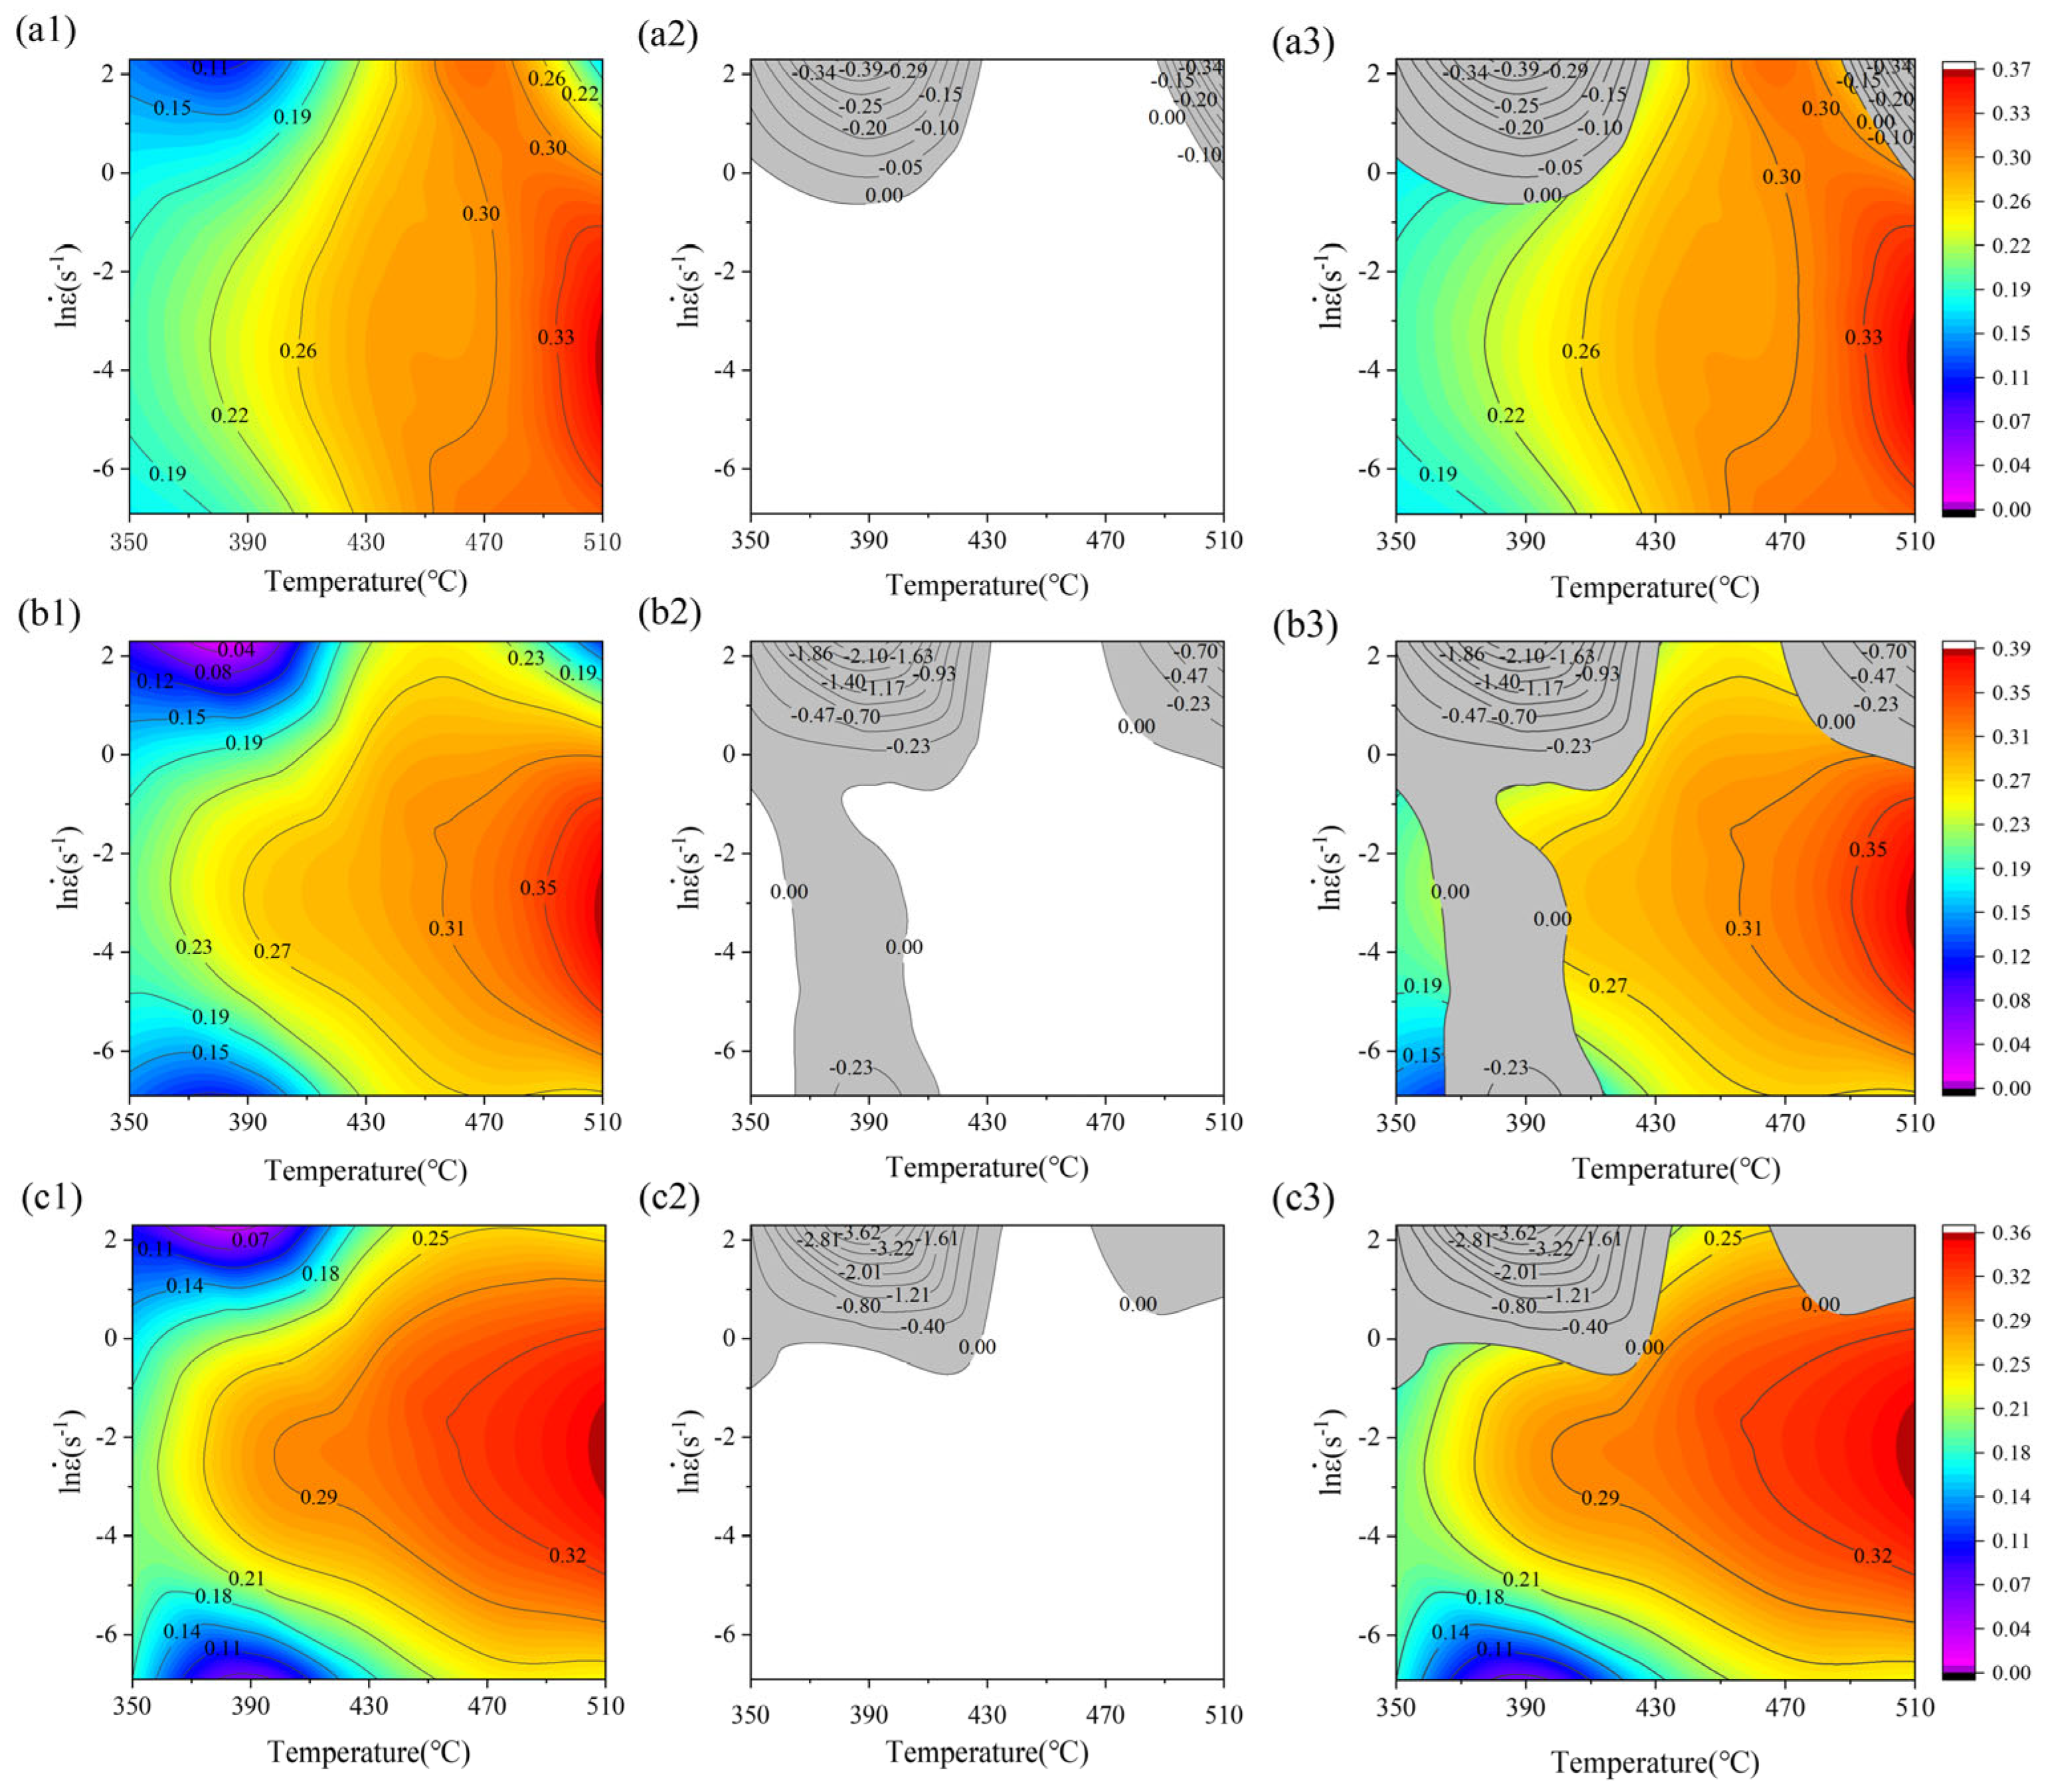
Figure 8 presents the power dissipation maps, instability maps, and hot processing maps of the Al-Cu-Mg alloy. The hot processing maps were constructed by superimposing the power dissipation and instability maps. The gray zones represent instability zones. Negative values represent the instability parameter ξ ε ˙ , where smaller values indicate unfavorable processing conditions for the alloy. Conversely, positive values denote the energy dissipation efficiency η, with larger values signifying more favorable processing conditions for the alloy. Strain significantly influences the processing maps, with different strains leading to distinct hot deformation behaviors. As shown in Figure 8, excessively low temperatures, excessively high strain rates, and excessively low strain rates all deteriorate workability. Thus, the optimal deformation temperature and strain rate for this alloy are 450–510 °C and 0.01–0.1 s−1.

3.5. Microstructural Evolution

Extensive research indicates that the lnZ value plays a critical role in determining the dominant dynamic softening mechanisms in aluminum alloys, controlling the occurrence of DRV and DRX during hot deformation [19,20]. Figure 9 presents inverse pole figure (IPF) maps, grain boundary (GB) maps, and grain orientation spread (GOS) maps at a true strain of 0.9 under different lnZ values. In the GB maps, boundaries with misorientation angles of 2–10°, 10–15°, and >15° are defined as low-angle, middle-angle, and high-angle grain boundaries, respectively. For GOS maps, values of 0–2°, 2–7°, and 7–18° correspond to recrystallized (blue area), recovered (yellow area), and deformed (red area) structures, respectively. The results demonstrate that lnZ significantly affects microstructural evolution. Shear bands (marked by black boxes in Figure 9(b1,c1,d1) are observed due to unstable deformation, consistent with the instability zone in the hot processing map (Figure 8(c3)) [19].

3.5.1. Effect of Deformation Temperature on Microstructure

Effect of Deformation Temperature on Microstructural Evolution at Strain Rate 0.001 s−1
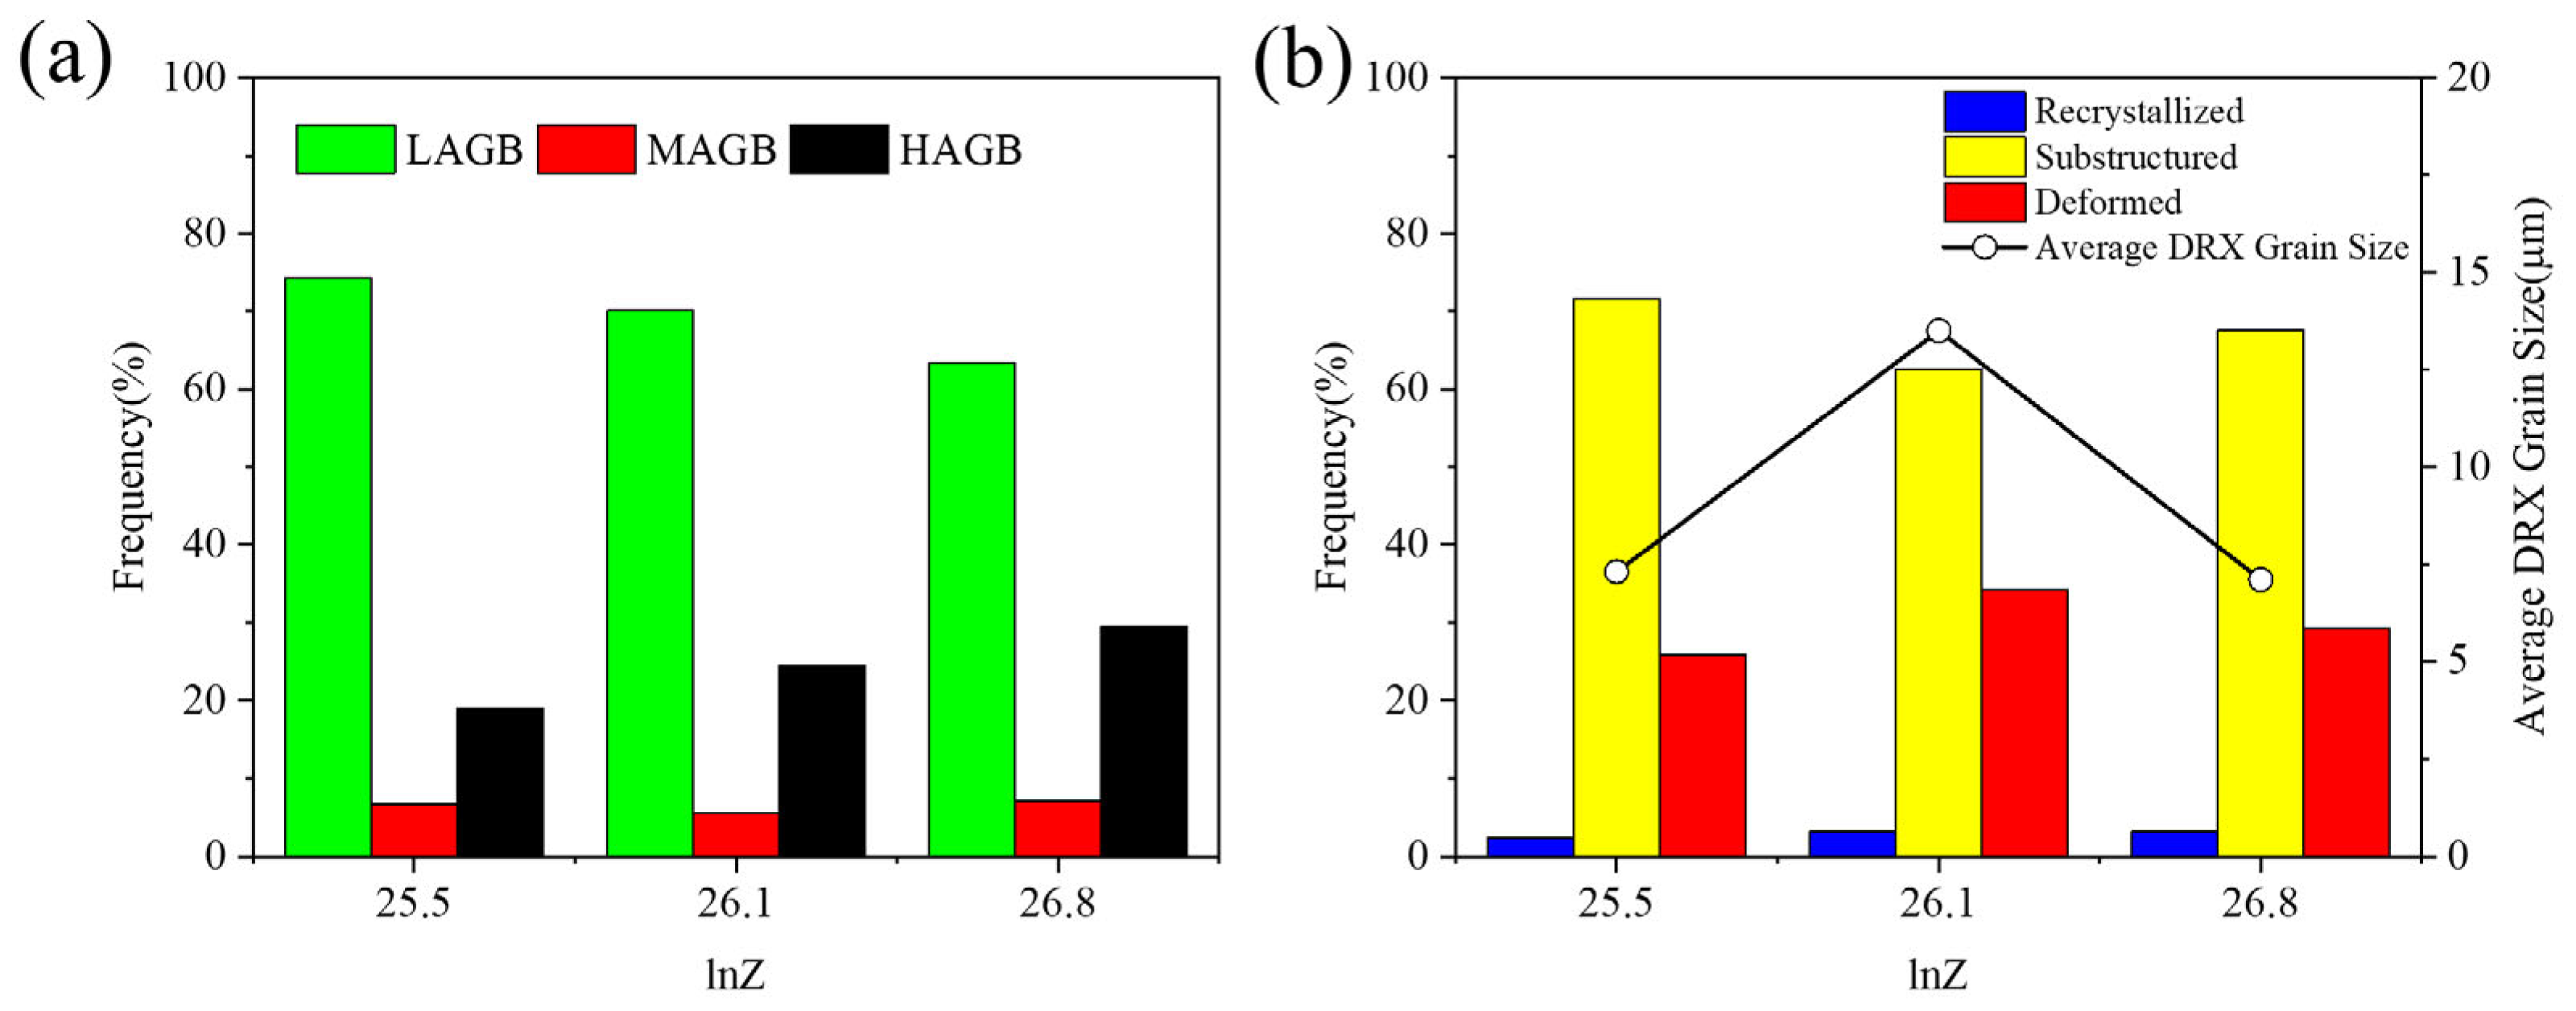
Figure 9(a1–a3,b1–b3) show the microstructures at different deformation temperatures (510 °C and 350 °C) under a strain rate of 0.001 s−1. As illustrated in Figure 10, the fraction of low-angle grain boundaries (LAGBs) increases from 64.6% to 73.8%, while that of high-angle grain boundaries (HAGBs) decreases from 27.2% to 20.0%. The DRX fraction drops from 7.9% to 3.6%, and the average DRX grain size decreases by 10.3 μm. Material anisotropy can also affect the volume fraction of DRX [38]. At 510 °C, the recrystallized fraction is more than twice that at 350 °C, and the average DRX grain size is significantly larger, indicating that higher temperatures promote both the nucleation and growth of recrystallized grains.
Effect of Deformation Temperature on Microstructural Evolution at Strain Rate 10 s−1
Figure 9(c1–c3,d1–d3) present the microstructures at different deformation temperatures (510 °C and 350 °C) under a high strain rate of 10 s−1. As shown in Figure 10, the fraction of LAGBs increases from 70.9% to 83.7%, while HAGBs decreases from 22.7% to 12.1%. The DRX fraction and average DRX grain size exhibit only minor reductions. The excessively high strain rate restricts sufficient time for DRX and DRV, leading to a significantly higher fraction of deformed structures compared to low-strain-rate conditions. Temperature exerts a more pronounced effect on DRX, with both the fraction and average size of DRX grains increasing at higher temperatures.
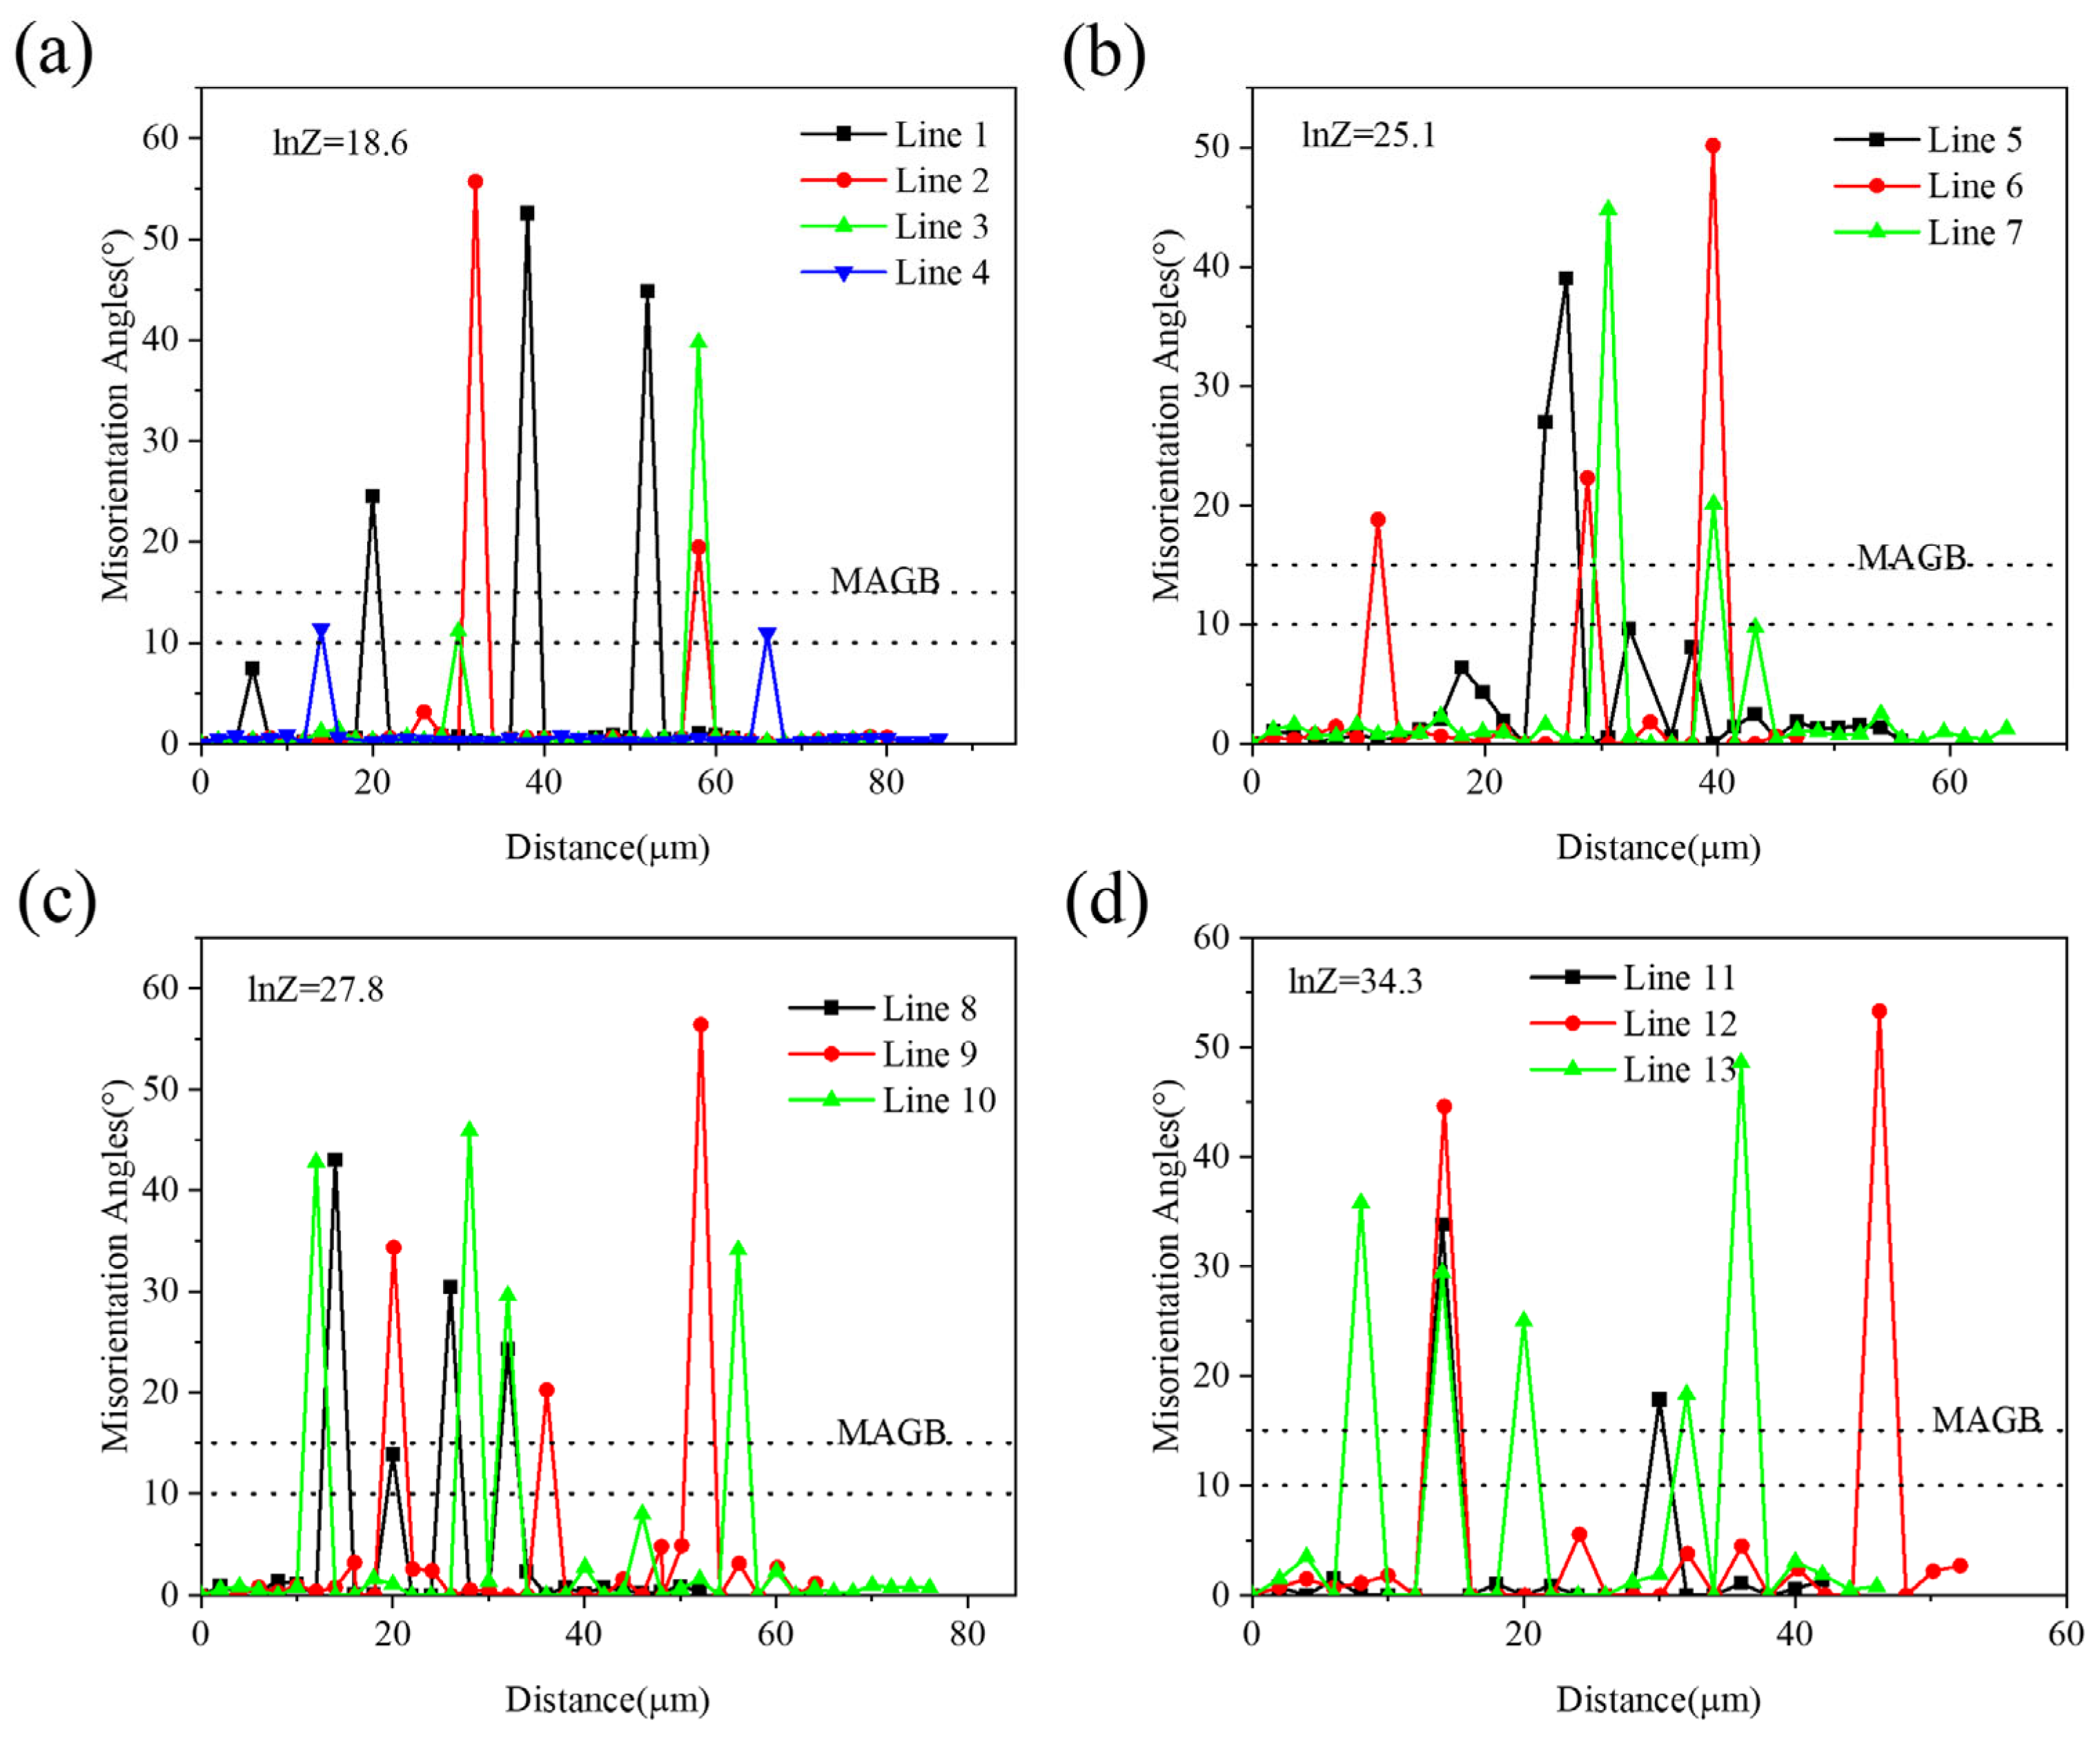
Figure 11 presents misorientation angle analyses for the locations marked by arrows in the IPF maps of Figure 9, showing their changes across different lnZ values. Arrows marked in Figure 9 denote the lines presented in Figure 11. The arrows were randomly selected. In Figure 11a,c, Lines 3 and 8 (crossing DRX grains) indicate misorientation evolution between adjacent grains. LAGBs first transformed into middle-angle grain boundaries (MAGBs) via subgrain rotation, then gradually evolved into HAGBs, ultimately forming CDRX grains. MAGBs served as a critical indicator for CDRX formation [39]. At 510 °C, the increased fractions of MAGBs and HAGBs, along with enhanced dislocation-induced misorientation at subgrain boundaries, promoted subgrain rotation, facilitating CDRX [40,41]. In contrast, Lines 1, 6, 9, and 12 exhibit direct LAGBs-to-HAGBs transitions, suggesting DDRX nucleation along grain boundaries. Compared with high-temperature (510 °C) microstructures, the fine necklace-like DRX grains near deformed zones at a low temperature of 350 °C are predominantly from DDRX, indicating that CDRX is the dominant mechanism at elevated temperatures. Line 4 traverses brick-shaped DRX grains within deformed zones, showing misorientations of 10–15 ° between adjacent grains with similar orientations, which confirms GDRX formation [42].

3.5.2. Effect of Strain Rate on Alloy Microstructure

Effect of Strain Rate on Microstructural Evolution at 510 °C
Figure 9 (a1–a3,c1–c3) show the microstructures at 510 °C under different strain rates (0.001 s−1 and 10 s−1). As illustrated in Figure 10, the fraction of LAGBs increases from 64.6% to 70.9%, while that of HAGBs decrease from 27.2% to 22.7%, and the DRX fraction drops from 7.9% to 3.9%, indicating that DRX depends not only on deformation temperature but also on strain rate. At higher strain rates (10 s−1), the reduced deformation time suppresses DRX nucleation and growth, whereas lower strain rates (0.001 s−1) allow sufficient time for complete grain boundary migration, promoting DRX grain formation [26]. Compared with those at 350 °C, the grains at 510 °C elongate perpendicular to the compression direction. Under high-temperature and low-strain-rate conditions, prolonged deformation enables DRV to occur, facilitating the nucleation of DRX.
Effect of Strain Rate on Microstructural Evolution at 350 °C
The microstructures of the alloy hot deformed at 350 °C under strain rates ranging from 0.001 s−1 to 10 s−1 are presented in Figure 9(b1–b3,d1–d3). The obtained fractions of LAGBs and HAGBs, together with the fractions of DRV and DRX, are summarized in Figure 10. As shown in Figure 10, with increasing lnZ value, the LAGBs fraction increases from 73.8% to 83.7%, while that of the HAGBs decreases from 20.0% to 12.1%, and the DRX fraction slightly declines from 3.6% to 2.8%. At the low temperature of 350 °C, varying the strain rate has no significant effect on suppression or promotion of DRX, suggesting inadequate thermal activation energy for recrystallization. The microstructure remains inhomogeneous, containing unstable deformation zones and shear bands [5].
Under a high strain rate (10 s−1), the fraction of DRX grains decreases significantly, but DRV is the dominant dynamic softening mechanism. As revealed by Figure 11a–d, both CDRX and DDRX can occur at either a high (10 s−1) or a low (0.001 s−1) strain rates; however, GDRX is rarely observed.

3.5.3. Effect of lnZ on Alloy Microstructure

Figure 12 presents IPF, GB and GOS maps at middle lnZ values (24.0–29.0), with low and high lnZ ranges defined as lnZ < 24.0 and lnZ > 29.0. The GOS analysis across all lnZ ranges from low (Figure 9(a1–a3)) to high (Figure 9(d1–d3)) reveals that recovered structures dominate, confirming that DRV is the primary dynamic softening mechanism regardless of the lnZ value.
High lnZ values (lnZ > 29.0) typically correspond to faster strain rates and lower deformation temperatures. Under the high lnZ conditions, microstructural deformation becomes inhomogeneous, with unstable zones promoting DDRX nucleation. Numerous fine DDRX grains are observed, confirming DDRX as the dominant DRX mechanism at high lnZ values [19].
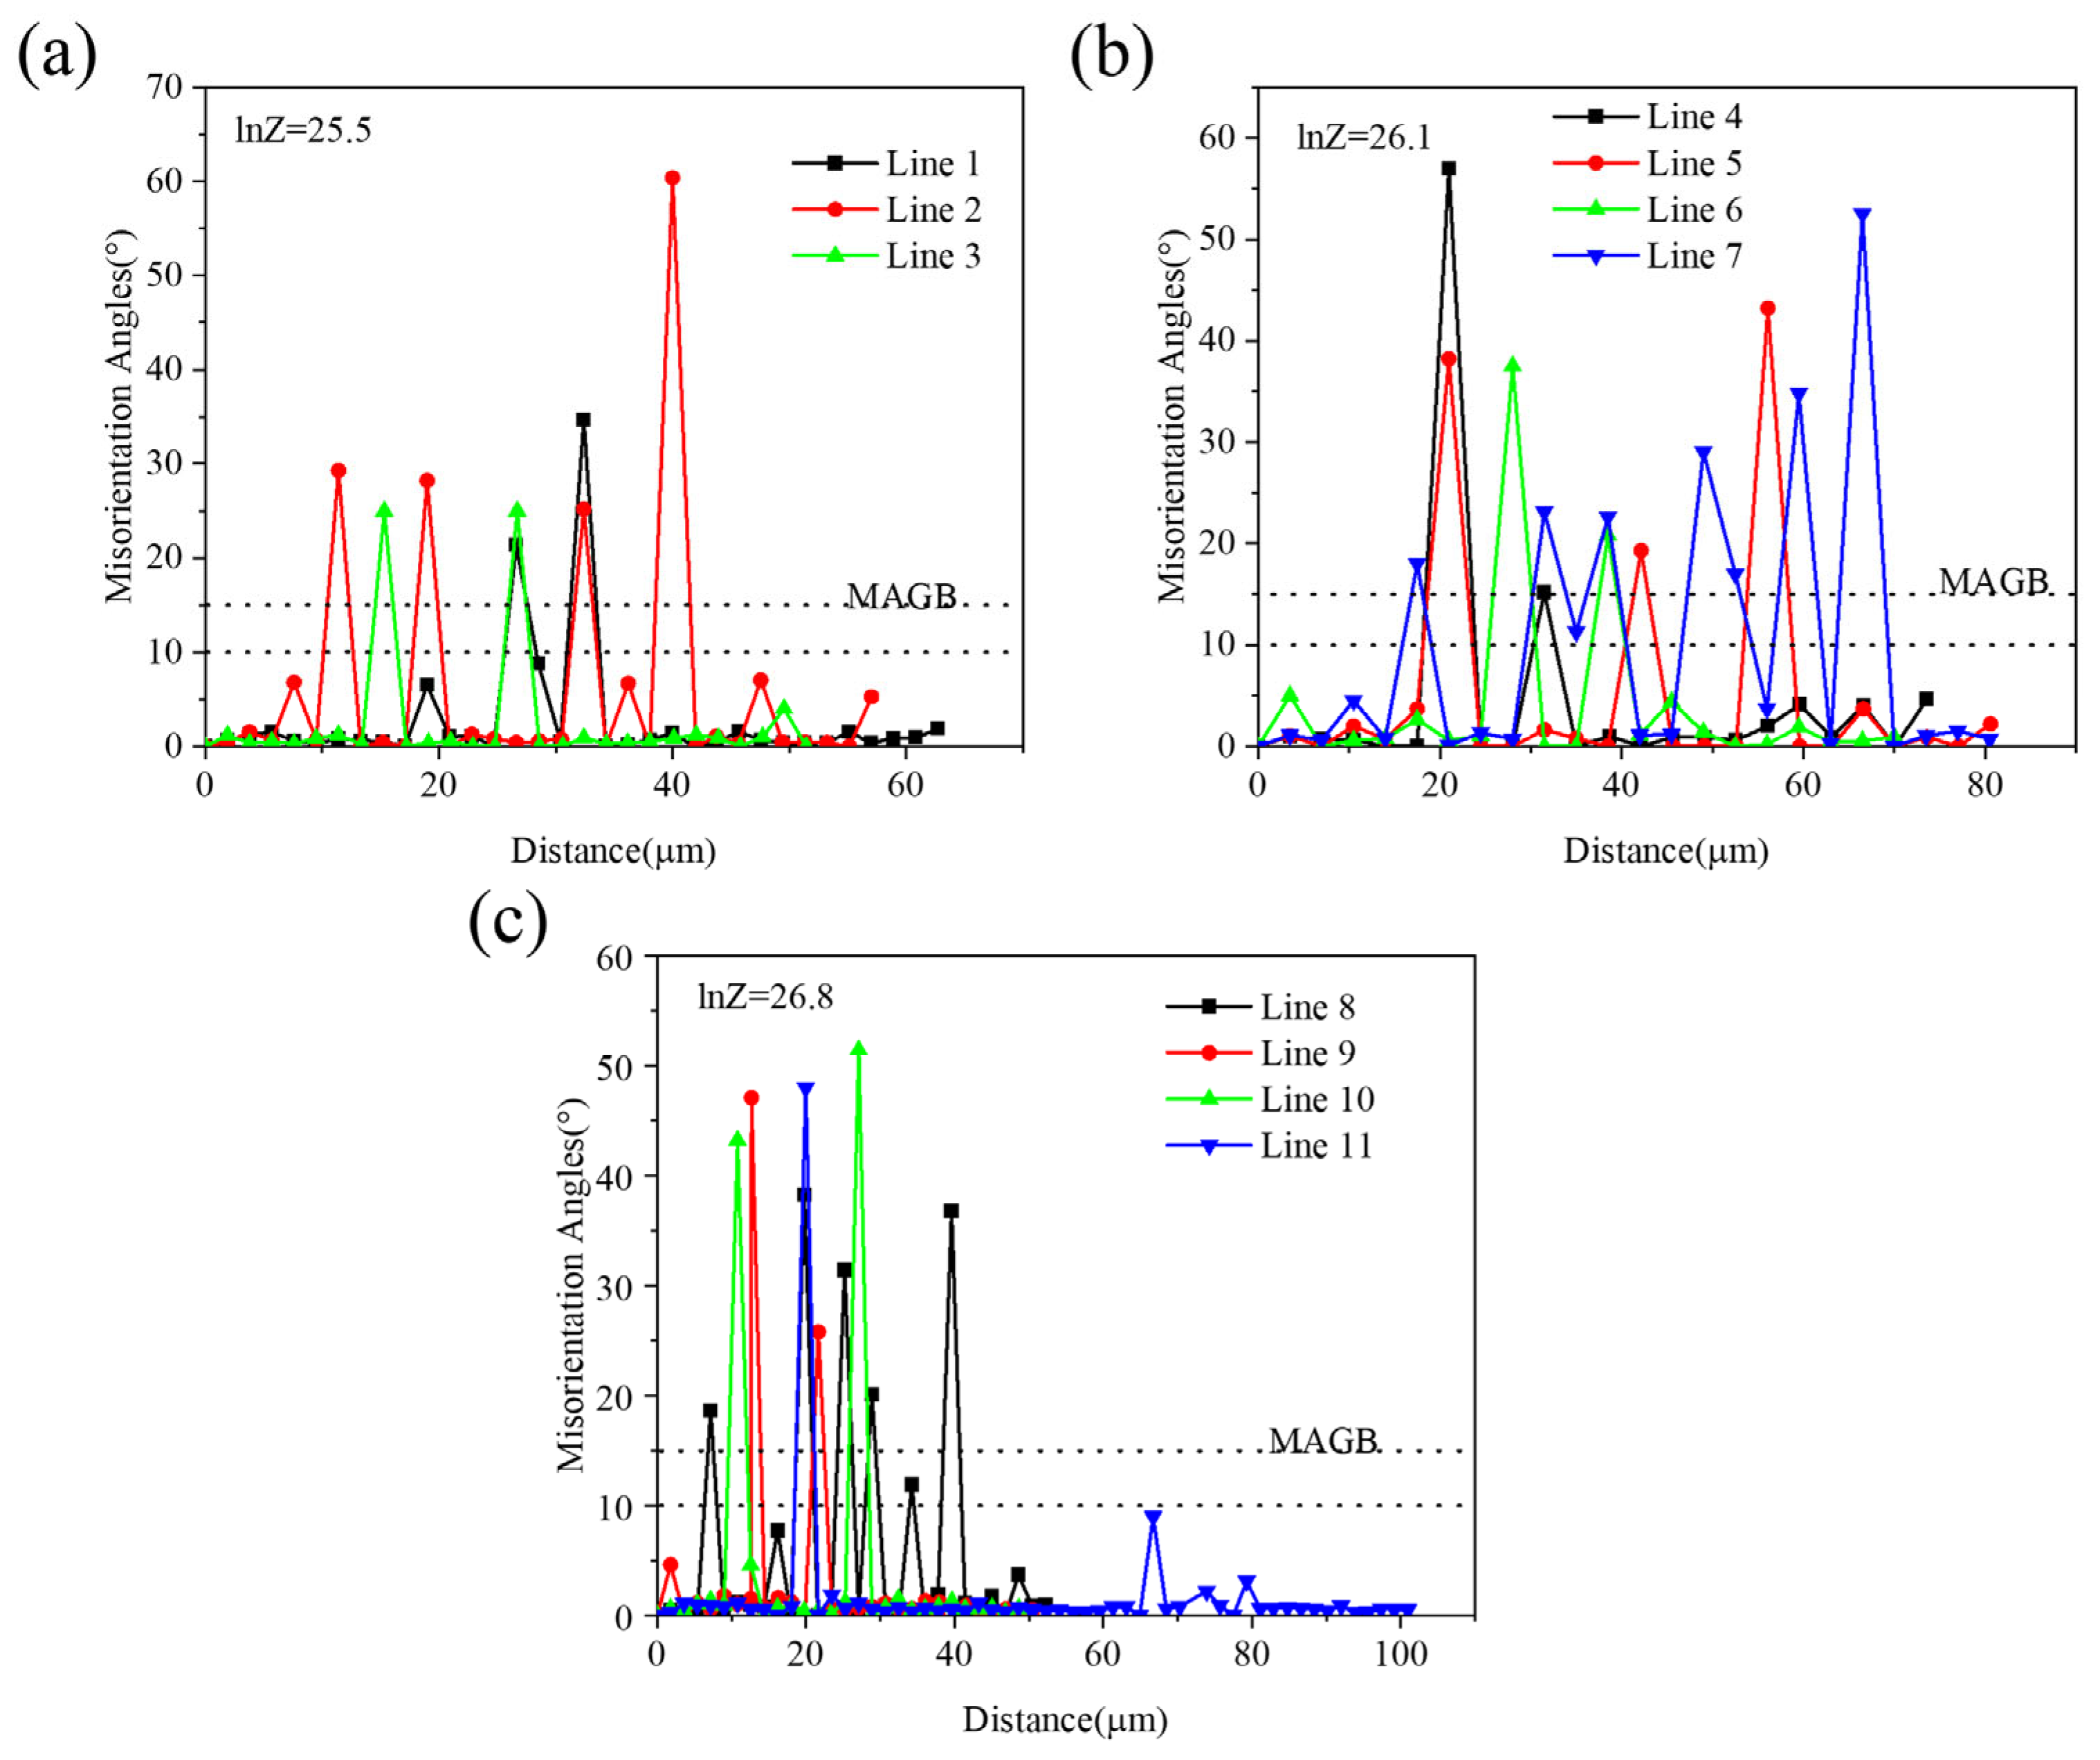
At middle lnZ values (24.0 < lnZ < 29.0), the microstructure exhibits elongated grains perpendicular to the compression direction, with a limited number of DRX grains and a predominant recovered deformed structure. Compared with high lnZ conditions, the deformed zones gradually decrease while the recovered structures increase, indicating DRV dominance. EBSD analysis (Figure 13) reveals that increasing lnZ reduces LAGBs but increases HAGBs, while MAGBs remain stable. Furthermore, middle lnZ conditions (higher temperatures and lower strain rates) enhance atomic diffusion and dislocation motion, facilitating DRX grain growth [43]. Misorientation analysis (Figure 14) shows LAGBs→MAGBs→HAGBs transitions (lines 4,7,8) and fine DDRX grains along grain boundaries, confirming CDRX/DDRX as the primary mechanisms. Line 11 displays serrated HAGBs enclosing brick-like DRX grains with low misorientation angles, which is — a signature of GDRX—though its overall contribution remains minor.
Under low lnZ values (lnZ < 24.0), which correspond to low strain rates and high deformation temperatures, CDRX and GDRX are the primary governing mechanisms [44]. Compared with middle lnZ conditions, the low lnZ microstructure exhibits more homogeneous recrystallized grains with significantly reduced deformation structures. Therefore, the low lnZ conditions are more favorable for the hot processing of Al-Cu-Mg alloys.

4. Conclusions

(1)
The flow stress of the Al-4.8Cu-0.25Mg-0.32Mn-0.17Si alloy decreases with increasing deformation temperature but increases with strain rate. After the peak stress is reached, a dynamic equilibrium between work hardening, DRV, and DRX is established, maintaining a steady-state flow stress that exhibits gradual softening.
(2)
The flow behavior of the experimental alloy during hot deformation was accurately predicted by a strain-compensated Arrhenius constitutive model. The constitutive equation at ε = 0.9 is: ε ˙ = 1.53 × 10 11 s i n h α σ 4.8503 e x p 165 , 759.2 R T , which shows excellent agreement with the experimental values (R = 0.979).
(3)
Based on the hot processing maps, the optimal hot processing parameters for the experimental alloy are determined to be 450–510 °C and 0.01–0.1 s−1. The lnZ analysis combined with microstructure characterization shows that superior workability is achieved at low lnZ values.
(4)
The softening mechanisms of the experimental alloy are dominated by DRV and DRX. At high lnZ values (high strain rate and low deformation temperature), DDRX is the primary mechanism. At middle lnZ values (low strain rate or high deformation temperature), CDRX and DDRX become dominant. At low lnZ values (low strain rate and high deformation temperature), CDRX and GDRX become dominant. The DRX mechanisms are controlled by deformation temperature and strain rate.

Author Contributions

Conceptualization, F.H., X.W., Z.R., X.Z., X.X., S.W., K.G., W.W., L.R., H.H. and Z.N.; Methodology, F.H., Z.R., X.Z. and X.W.; Validation, F.H., Z.R., X.Z. and X.W.; Formal Analysis, X.W., X.X., S.W., K.G., W.W., L.R., H.H. and Z.N.; Investigation, F.H., X.W., Z.R., X.Z., X.X., S.W., K.G., W.W., L.R., H.H. and Z.N.; Resources, X.W.; Data Curation, F.H. and X.W.; Writing—Original Draft Preparation, F.H.; Writing—Review and Editing, F.H. and X.W.; Visualization, F.H.; Supervision, X.W., X.X., S.W., K.G., W.W., L.R., H.H. and Z.N.; Project Administration, X.W., X.X., S.W., K.G., W.W., L.R., H.H. and Z.N.; Funding Acquisition, X.W., X.X., S.W., K.G., W.W., L.R., H.H. and Z.N. All authors have read and agreed to the published version of the manuscript.

Funding

This work was supported by the National Natural Science Foundation of China (52494943), National Key Research and Development Program of China (2022YFB3705802), Beijing Natural Science Foundation (2202009), Jiangsu Province Program for Commercialization of Scientific and Technological Achievements (BA2022029) and Program on Jiangsu Key Laboratory for Clad Materials (BM2014006).

Data Availability Statement

The original contributions presented in this study are included in the article. Further inquiries can be directed to the corresponding author.

Conflicts of Interest

The authors declare no conflicts of interest.

References

  1. Zhou, F.; Lu, Q.; Wang, J.; Xiao, N.; Li, X.; Chen, B.; Du, Y.; Li, K. Negative effect of nano-scale Al3(Sc, Zr) on strength of Sc-Zr micro-alloyed Al-Cu-Mg-Ag alloys. J. Alloys Compd. 2025, 1028, 180597. [Google Scholar] [CrossRef]
  2. Hu, H.; Zhao, F.; Yong, W.; Jiang, L.; Zhang, Z.; Xie, J. A machine learning strategy to achieve dual-synchronous property improvement of aviation Al-Cu-Mg alloy. J. Mater. Sci. Technol. 2026, 244, 208–230. [Google Scholar] [CrossRef]
  3. Starke, E.A.; Staley, J.T. Application of modern aluminum alloys to aircraft. Prog. Aeosp. Sci. 1996, 32, 131–172. [Google Scholar] [CrossRef]
  4. Ashkenazi, D. How aluminum changed the world: A metallurgical revolution through technological and cultural perspectives. Technol. Forecast. Soc. Change 2019, 143, 101–113. [Google Scholar] [CrossRef]
  5. Tang, J.; Yi, Y.; He, H.; Huang, S.; Zhang, J.; Dong, F. Hot deformation behavior and microstructural evolution of the Al-Cu-Li alloy: A study with processing map. J. Alloys Compd. 2023, 934, 167755. [Google Scholar] [CrossRef]
  6. Zhang, X.; Wu, X.; Zhao, P.; Xiong, X.; Zheng, Z.; Gao, K.; Wen, S.; Wei, W.; Rong, L.; Huang, H.; et al. Characterization of η’ and T′ precipitates in Al-Zn-Mg-Zr alloy using transmission electron microscopy and atom probe tomography. J. Mater. Sci. Technol. 2025, 252, 206–216. [Google Scholar] [CrossRef]
  7. Stachowicz, F. Influence of rolling speed on the temperature field during cold rolling of aluminum sheets. Acta Metall. Slovaca 2023, 29, 206–209. [Google Scholar] [CrossRef]
  8. Zeng, X.; Fan, X.G.; Li, H.W.; Zhan, M.; Li, S.H. Grain morphology related microstructural developments in bulk deformation of 2219 aluminum alloy sheet at elevated temperature. Mater. Sci. Eng. A 2019, 760, 328–338. [Google Scholar] [CrossRef]
  9. Jiang, H.; Dong, P.; Zhang, P.; Wang, Y.; Li, F.; Zhu, C.; Meng, D.-A.; Fan, S.; Zhao, S. Deformation behavior and microstructure characterization of the radially forged 2A50 aluminum alloy at high-temperature solid and semi-solid states. J. Alloys Compd. 2024, 989, 174392. [Google Scholar] [CrossRef]
  10. Kareem, S.A.; Anaele, J.U.; Aikulola, E.O.; Olanrewaju, O.F.; Omiyale, B.O.; Falana, S.O.; Oke, S.R.; Bodunrin, M.O. Hot deformation behavior of aluminum alloys: A comprehensive review on deformation mechanism, processing maps analysis and constitutive model description. Mater. Today Commun. 2025, 44, 112004. [Google Scholar] [CrossRef]
  11. Huang, K.; Logé, R.E. A review of dynamic recrystallization phenomena in metallic materials. Mater. Des. 2016, 111, 548–574. [Google Scholar] [CrossRef]
  12. Doherty, R.D.; Hughes, D.A.; Humphreys, F.J.; Jonas, J.J.; Jensen, D.J.; Kassner, M.E.; King, W.E.; McNelley, T.R.; McQueen, H.J.; Rollett, A.D. Current issues in recrystallization: A review. Mater. Sci. Eng. A 1997, 238, 219–274. [Google Scholar] [CrossRef]
  13. Ren, L.; Zhao, K.; Gao, T.; Liu, G.; Sun, Q.; Liu, S.; Liu, X. Constitutive equation and microstructural evolution of one distinctive Al–based hybrid composite reinforced by nano–AlN and micro–TiC particles during hot compression. Mater. Sci. Eng. A 2023, 888, 145830. [Google Scholar] [CrossRef]
  14. Cram, D.G.; Zurob, H.S.; Brechet, Y.J.M.; Hutchinson, C.R. Modelling discontinuous dynamic recrystallization using a physically based model for nucleation. Acta Mater. 2009, 57, 5218–5228. [Google Scholar] [CrossRef]
  15. Cram, D.G.; Fang, X.Y.; Zurob, H.S.; Bréchet, Y.J.M.; Hutchinson, C.R. The effect of solute on discontinuous dynamic recrystallization. Acta Mater. 2012, 60, 6390–6404. [Google Scholar] [CrossRef]
  16. Blum, W.; Zhu, Q.; Merkel, R.; McQueen, H.J. Geometric dynamic recrystallization in hot torsion of Al 5Mg 0.6Mn (AA5083). Mater. Sci. Eng. A 1996, 205, 23–30. [Google Scholar] [CrossRef]
  17. Zhang, R.; Zhang, J.S.; Wang, W.; Tang, Y.T.; Jiang, J.; Reed, R.C.; Lin, J. Mechanistic insights and kinetics of continuous and geometric dynamic recrystallisation in hot deformed aluminium alloy. Acta Mater. 2025, 289, 120893. [Google Scholar] [CrossRef]
  18. Humphreys, F.J. A unified theory of recovery, recrystallization and grain growth, based on the stability and growth of cellular microstructures—I. The basic model. Acta Mater. 1997, 45, 4231–4240. [Google Scholar] [CrossRef]
  19. Li, J.; Wu, X.; Cao, L.; Liao, B.; Wang, Y.; Liu, Q. Hot deformation and dynamic recrystallization in Al-Mg-Si alloy. Mater. Charact. 2021, 173, 110976. [Google Scholar] [CrossRef]
  20. Asgharzadeh, H.; Simchi, A.; Kim, H.S. Dynamic restoration and microstructural evolution during hot deformation of a P/M Al6063 alloy. Mater. Sci. Eng. A 2012, 542, 56–63. [Google Scholar] [CrossRef]
  21. Rong, Z.; Wu, X.; He, F.; Wen, S.; Xiong, X.; Gao, K.; Wei, W.; Huang, H.; Nie, Z. Hot deformation behavior, dynamic recrystallization and precipitation behavior of a novel Er, Zr-microalloyed Al–Cu–Mg alloy. J. Mater. Res. Technol. 2025, 36, 5381–5395. [Google Scholar] [CrossRef]
  22. Sellars, C.M.; McTegart, W.J. On the mechanism of hot deformation. Acta Metall. 1966, 14, 1136–1138. [Google Scholar] [CrossRef]
  23. Abbasi-Bani, A.; Zarei-Hanzaki, A.; Pishbin, M.H.; Haghdadi, N. A comparative study on the capability of Johnson–Cook and Arrhenius-type constitutive equations to describe the flow behavior of Mg–6Al–1Zn alloy. Mech. Mater. 2014, 71, 52–61. [Google Scholar] [CrossRef]
  24. Sun, Y.; Cao, Z.; Wan, Z.; Hu, L.; Ye, W.; Li, N.; Fan, C. 3D processing map and hot deformation behavior of 6A02 aluminum alloy. J. Alloys Compd. 2018, 742, 356–368. [Google Scholar] [CrossRef]
  25. Sajadi, S.A.; Toroghinejad, M.R.; Rezaeian, A. Characterization of dynamic recrystallization and development of a processing map during hot deformation of FeCoCrNi high-entropy alloy. J. Mater. Res. Technol. 2025, 37, 601–616. [Google Scholar] [CrossRef]
  26. Zhang, Y.; Zhang, X.; Wang, W.; Hou, J.; Qiang, F.; Liu, Y.; Huo, K.; Zheng, P.; Han, P.; Qiao, K.; et al. Dynamic precipitation behavior and recrystallization mechanism during hot deformation of 7E33 aluminum alloy. Mater. Charact. 2025, 227, 115328. [Google Scholar] [CrossRef]
  27. Sun, Z.C.; Wu, H.L.; Cao, J.; Yin, Z.K. Modeling of continuous dynamic recrystallization of Al-Zn-Cu-Mg alloy during hot deformation based on the internal-state-variable (ISV) method. Int. J. Plast. 2018, 106, 73–87. [Google Scholar] [CrossRef]
  28. Zhong, L.; Gao, W.; Feng, Z.; Lu, Z.; Zhu, C. Hot deformation characterization of as-homogenized Al-Cu-Li X2A66 alloy through processing maps and microstructural evolution. J. Mater. Sci. Technol. 2019, 35, 2409–2421. [Google Scholar] [CrossRef]
  29. Dong, Y.; Zhang, C.; Zhao, G.; Guan, Y.; Gao, A.; Sun, W. Constitutive equation and processing maps of an Al–Mg–Si aluminum alloy: Determination and application in simulating extrusion process of complex profiles. Mater. Des. 2016, 92, 983–997. [Google Scholar] [CrossRef]
  30. Alaneme, K.K.; Kareem, S.A.; Bodunrin, M.O. Hyperbolic–sine constitutive model determined hot deformation mechanisms and workability response of Al–Zn/Cu and Al–Zn/SiC based composites. Results Eng. 2023, 19, 101255. [Google Scholar] [CrossRef]
  31. Long, J.; Deng, L.; Jin, J.; Zhang, M.; Tang, X.; Gong, P.; Wang, X.; Xiao, G.; Xia, Q. Enhancing constitutive description and workability characterization of Mg alloy during hot deformation using machine learning-based Arrhenius-type model. J. Magnes. Alloys 2024, 12, 3003–3023. [Google Scholar] [CrossRef]
  32. Li, X.; Ren, L.; Le, Q.; Jin, P.; Cheng, C.; Wang, T.; Wang, P.; Zhou, X.; Chen, X.; Li, D. The hot deformation behavior, microstructure evolution and texture types of as-cast Mg–Li alloy. J. Alloys Compd. 2020, 831, 154868. [Google Scholar] [CrossRef]
  33. Karami, M.; Mahmudi, R. Hot shear deformation constitutive analysis of an extruded Mg–6Li–1Zn alloy. Mater. Lett. 2012, 81, 235–238. [Google Scholar] [CrossRef]
  34. Zener, C.; Hollomon, J.H. Effect of strain rate upon plastic flow of steel. J. Appl. Phys. 1944, 15, 22–32. [Google Scholar] [CrossRef]
  35. Li, C.; Huang, L.; Zhao, M.; Guo, S.; Su, Y.; Li, J. Characterization of hot workability of Ti-6Cr-5Mo-5V-4Al alloy based on hot processing map and microstructure evolution. J. Alloys Compd. 2022, 905, 164161. [Google Scholar] [CrossRef]
  36. Li, L.; Li, M. Constitutive model and optimal processing parameters of TC17 alloy with a transformed microstructure via kinetic analysis and processing maps. Mater. Sci. Eng. A 2017, 698, 302–312. [Google Scholar] [CrossRef]
  37. Prasad, Y.V.R.K.; Gegel, H.L.; Doraivelu, S.M.; Malas, J.C.; Morgan, J.T.; Lark, K.A.; Barker, D.R. Modeling of dynamic material behavior in hot deformation: Forging of Ti-6242. Metall. Trans. A 1984, 15, 1883–1892. [Google Scholar] [CrossRef]
  38. Spišák, E.; Majerníková, J.; Mulidrán, P.; Hajduk, J.; Ruda, F. The simulation of the anisotropy of aluminum alloy sheets by deep drawing: A crucial study for the automotive and materials engineering industries. Acta Metall. Slovaca 2024, 30, 90–99. [Google Scholar] [CrossRef]
  39. Zhang, J.; Yi, Y.; He, H.; Huang, S.; Mao, X.; Guo, W.; You, W.; Guo, Y.; Dong, F.; Tang, J. Kinetic model for describing continuous and discontinuous dynamic recrystallization behaviors of 2195 aluminum alloy during hot deformation. Mater. Charact. 2021, 181, 111492. [Google Scholar] [CrossRef]
  40. Sun, Y.; Pan, Q.; Wang, W.; Li, A.; Song, W. Microstructural evolution and constitutive analysis combined with weight optimization method of Al-7.82Zn-1.96Mg-2.35Cu-0.11Zr alloy during hot deformation. J. Alloys Compd. 2018, 732, 902–914. [Google Scholar] [CrossRef]
  41. Lei, C.; Wang, Q.; Ebrahimi, M.; Li, D.; Tang, H.; Zhang, N.; Cai, H. Hot Deformation Behavior and Processing Maps of an As-Cast Al-5Mg-3Zn-1Cu (wt%) Alloy. Materials 2023, 16, 4093. [Google Scholar] [CrossRef]
  42. Li, H.; Huang, Y.; Liu, Y. Dynamic recrystallization mechanisms of as-forged Al–Zn–Mg-(Cu) aluminum alloy during hot compression deformation. Mater. Sci. Eng. A 2023, 878, 145236. [Google Scholar] [CrossRef]
  43. Zang, Q.; Yu, H.; Lee, Y.-S.; Kim, M.-S.; Kim, H.-W. Hot deformation behavior and microstructure evolution of annealed Al-7.9Zn-2.7Mg-2.0Cu (wt%) alloy. J. Alloys Compd. 2018, 763, 25–33. [Google Scholar] [CrossRef]
  44. Kassner, M.E.; Barrabes, S.R. New developments in geometric dynamic recrystallization. Mater. Sci. Eng. A 2005, 410–411, 152–155. [Google Scholar] [CrossRef]
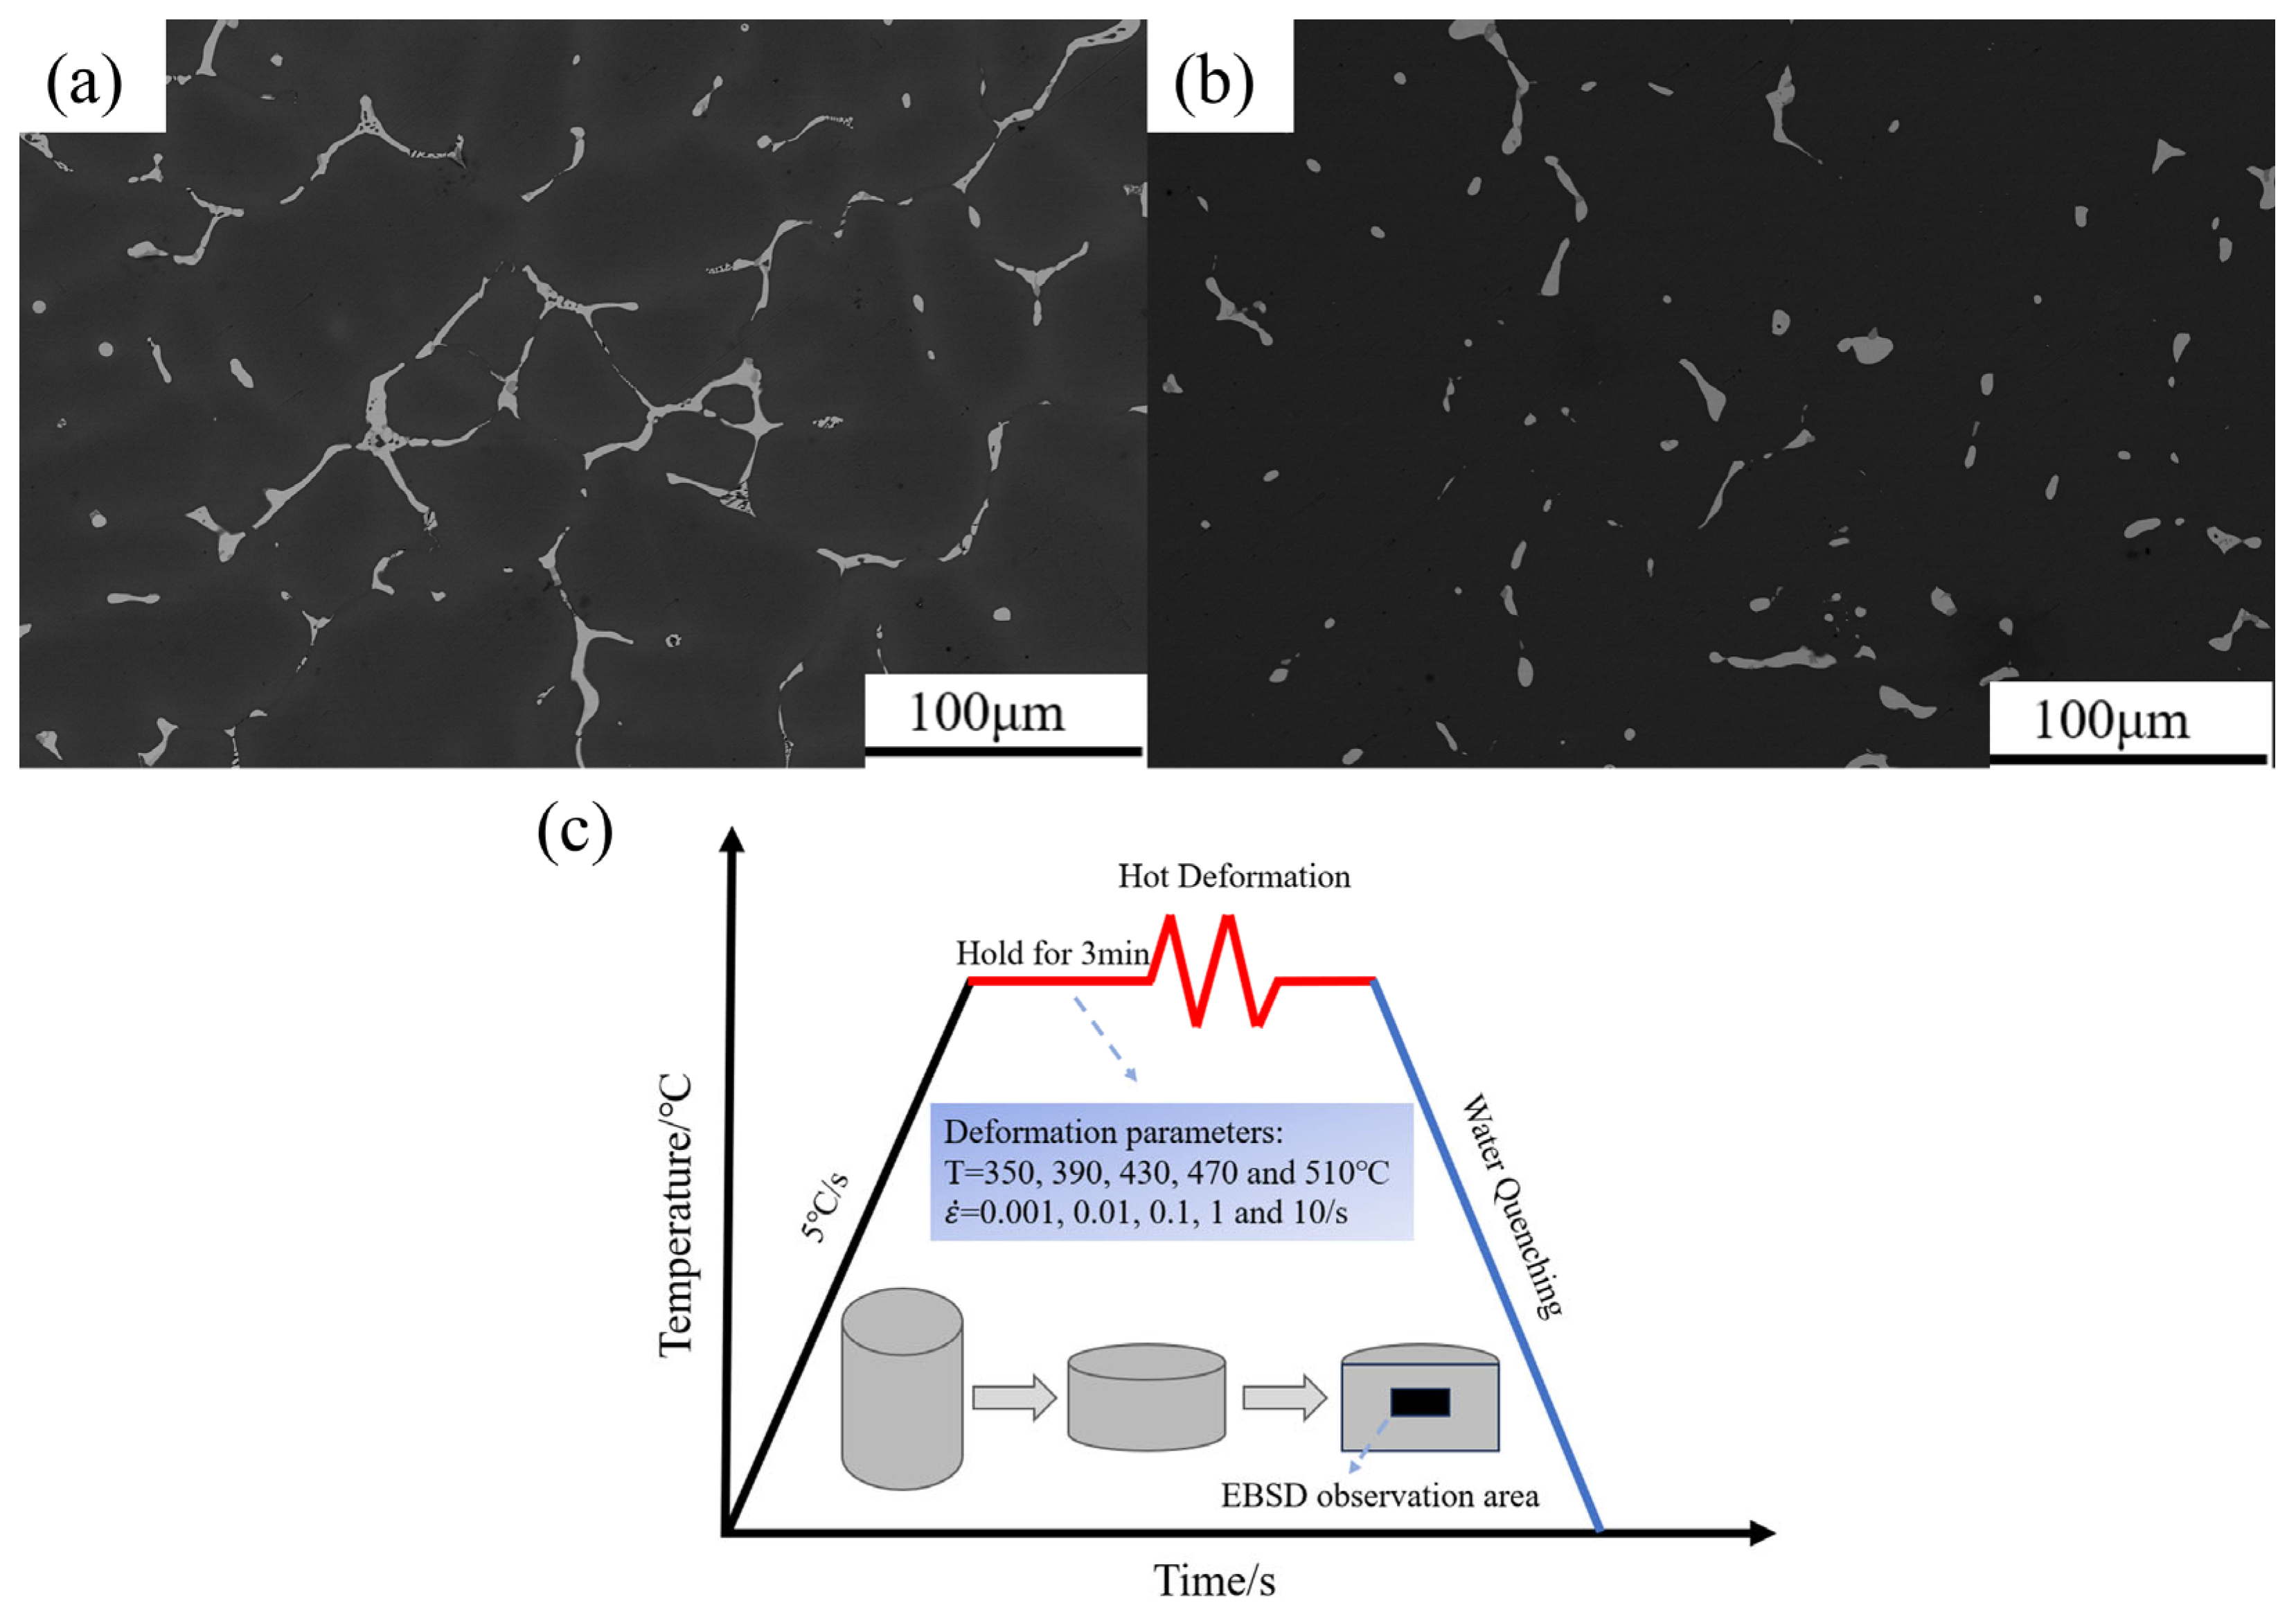
Figure 1. (a) SEM image of as-cast Al-4.8Cu-0.25Mg-0.32Mn-0.17Si alloy; (b) SEM image after single-stage homogenization at 530 °C for 18 h; (c) Thermal compression flow chart.
Metals 15 01100 g001
Figure 2. True stress–strain curves of Al-Cu-Mg alloys at different strain rates and temperatures: (a) 0.001 s−1; (b) 0.01 s−1; (c) 0.1 s−1; (d) 1 s−1; and (e) 10 s−1.
Metals 15 01100 g002
Figure 3. (a) l n ε ˙ l n σ fitting curve; (b) l n ε ˙ σ fitting curve; (c) l n ε ˙ l n s i n h α σ fitting curve; (d) l n s i n h α σ 1000 / T fitting curve.
Metals 15 01100 g003
Figure 4. l n Z l n s i n h α σ liner fitting curve.
Metals 15 01100 g004
Figure 5. Strain polynomial fitting curves: (a) α T r u e   S t r a i n fitting curve; (b) β T r u e   S t r a i n fitting curve; (c) l n A T r u e   S t r a i n fitting curve; (d) n T r u e   S t r a i n fitting curve; (e) Q T r u e   S t r a i n fitting curve.
Metals 15 01100 g005
Figure 6. Comparison of experimental and predicted values of flow stress for the flow: (a) 0.001 s−1; (b) 0.01 s−1; (c) 0.1 s−1; (d) 1 s−1; and (e) 10 s−1.
Metals 15 01100 g006
Figure 7. The fitting of the experimental value and the predicted value of the flow stress for the alloy.
Metals 15 01100 g007
Figure 8. Power dissipation maps, instability maps, and hot processing maps of the Al-Cu-Mg alloy: (a1a3) ε = 0.2; (b1b3) ε = 0.5; and (c1c3) ε = 0.9.
Metals 15 01100 g008
Figure 9. IPF maps, GB maps and GOS maps under different lnZ values: (a1a3) lnZ = 18.6 (510 °C, 0.001 s−1); (b1b3) lnZ = 25.1 (350 °C, 0.001 s−1); (c1c3) lnZ = 27.8 (510 °C, 10 s−1); (d1d3) lnZ = 34.3 (350 °C, 10 s−1).
Metals 15 01100 g009
Figure 10. EBSD analysis under different lnZ values: (a) Grain boundary frequency; and (b) Frequency of recrystallized, recovered, and deformed structures, along with average DRX grain size.
Metals 15 01100 g010
Figure 11. Misorientation analysis under different lnZ values: (a) lnZ = 18.6; (b) lnZ = 25.1; (c) lnZ = 27.8; and (d) lnZ = 34.3.
Metals 15 01100 g011
Figure 12. IPF maps, GB maps, and GOS maps at the middle lnZ value: (a1a3) lnZ = 25.5 (390 °C, 0.01 s−1); (b1b3) lnZ = 26.1 (430 °C, 0.1 s−1); (c1c3) lnZ = 26.8 (470 °C, 1 s−1).
Metals 15 01100 g012
Figure 13. EBSD analysis under middle lnZ values: (a) Grain boundary frequency; (b) Frequency of recrystallized, recovered, and deformed structures, along with average DRX grain size.
Metals 15 01100 g013
Figure 14. Misorientation analysis under middle lnZ values: (a) lnZ = 25.5; (b) lnZ = 26.1; (c) lnZ = 26.8.
Metals 15 01100 g014
Table 1. The chemical composition of the alloy (wt%).
ElementCuMgMnSiAl
-4.800.250.320.17Bal.
Table 2. lnZ value under different deformation conditions.
lnZ350 °C390 °C430 °C470 °C510 °C
ε ˙ = 0.001 s−127.025.023.221.520.1
ε ˙ = 0.01 s−129.327.325.523.822.4
ε ˙ = 0.1 s−131.629.627.826.124.7
ε ˙ = 1 s−133.931.930.128.427.0
ε ˙ = 10 s−136.234.232.430.829.3
Table 3. The fitting coefficients of the strain polynomial β, α, lnA, n and Q of each parameter of the alloy.
Parameter β α nlnAQ
B00.12560.01785.19513.840101.351
B10.2997−0.023510.286650.0203780.730
B2−5.35640.1195−164.793−6477.686−37,912.653
B329.5086−0.4113917.32829,714.088174,077.607
B4−78.80581.0309−2522.628−73,046.500−427,680.377
B5111.8490−1.57533692.80898,856.678578,173.082
B6−81.22231.2430−2755.284−69,337.586−405,073.637
B723.7708−0.3849824.15619,680.374114,859.791
Disclaimer/Publisher’s Note: The statements, opinions and data contained in all publications are solely those of the individual author(s) and contributor(s) and not of MDPI and/or the editor(s). MDPI and/or the editor(s) disclaim responsibility for any injury to people or property resulting from any ideas, methods, instructions or products referred to in the content.