Article

Numerical Analysis of the Three-Roll Bending Process of 6061-T6 Aluminum Profiles with Multiple Bending Radii Using the Finite Element Method

by
Mauricio da Silva Moreira
1,
Carlos Eduardo Marcos Guilherme
1,
João Henrique Corrêa de Souza
2,
Elizaldo Domingues dos Santos
1 and
Liércio André Isoldi
1,*
1
Federal University of Rio Grande—FURG, Itália Avenue km 8, Rio Grande 96203-900, RS, Brazil
2
TechnNova, Senador Pinheiro Street, 304, Passo Fundo 99070-220, RS, Brazil
*
Author to whom correspondence should be addressed.
Metals 2025, 15(10), 1097; https://doi.org/10.3390/met15101097
Submission received: 8 August 2025 / Revised: 18 September 2025 / Accepted: 24 September 2025 / Published: 1 October 2025
(This article belongs to the Special Issue Advances in Lightweight Material Forming Technology)

Abstract

The present work numerically investigates the mechanical behavior of six 6061-T6 aluminum profiles during roll bending, considering, in two specific cases, the application of the process in different bending directions (vertical and horizontal), totaling eight cases analyzed, with emphasis on the influence of multiple bending radii. Notably, two of the profiles are characterized by high geometric complexity, making their analysis particularly relevant within the scope of this study. Using the finite element method in ANSYS® (version 2022 R2) (SOLID187 element), the study expands the previously validated model to a broader range of geometries and includes an additional validation and verification stage. The results reveal: (i) an inverse relationship between bending radius and von Mises stress, with critical values close to the material’s strength limit at smaller radii; (ii) characteristic displacement patterns for each profile, quantified through specific curve fittings; and (iii) a systematic comparison among the six profiles, highlighting stress concentrations and deformations differentiated by geometry. The simulations provide criteria for predicting forming defects and optimizing process parameters, expanding the database for industrial designs with multiple extruded profiles.

1. Introduction

Extruded aluminum profiles have stood out as structural components in various engineering sectors, especially when combining lightness, mechanical strength, and corrosion resistance is desired. Applications in the naval, aeronautical, automotive, and civil construction industries benefit significantly from the geometric versatility provided by the extrusion process, as well as from the inherent properties of aluminum, such as good weldability and fatigue behavior. Among the most commonly used alloys in these contexts, 6061-T6 is widely recognized for presenting an efficient combination of mechanical strength and environmental durability, being frequently applied in structures that require reliability and low weight [1,2,3].
Despite the widespread use of these profiles in critical applications, studies aimed at understanding their mechanical behavior during forming processes, such as roll bending, are still scarce in the literature, especially when compared to research conducted on steel profiles. Computational modeling through the Finite Element Method (FEM) has proven to be an effective tool for accurately predicting the distribution of stresses, strains, and displacements during mechanical forming processes. Additionally, aspects such as the contact between tools and material, roll geometry, and friction parameters exert significant influence on the results and require refined modeling for a faithful representation of the phenomenon. Numerous studies have investigated the analytical and numerical modeling of the three-roll bending process, encompassing topics such as load prediction and the effects of machine configuration and material characteristics on the final quality of the formed component. These investigations demonstrate that the variability of operational parameters can substantially affect bending accuracy and residual stress distribution, making the development of robust models essential for reliably predicting these effects [4,5,6,7,8,9,10,11,12,13,14,15,16,17,18].
Among the most recent studies in the literature on the subject, it is possible to cite research that elucidates the challenges and solutions associated with the bending process of metal profiles and sheets. These works highlight the importance of numerical modeling and experimental validation to improve the prediction of mechanical performance and final product quality. One such study was conducted by Tomaszewski et al. [19], in which the effect of plastic deformation caused by roll bending on the fatigue properties of extruded 6063-T6 aluminum was investigated. Based on the observation that the deformation conditions during manufacturing can significantly alter the mechanical behavior of aluminum alloys, the authors analyzed the plastic stress in profiled regions subjected to bending. Using high-cycle fatigue experimental data fitted with a cumulative Weibull distribution, they developed a predictive model for fatigue life. The results indicated that higher levels of static deformation are associated with reduced fatigue life, evidenced by increased intergranular cracking on fracture surfaces, a consequence of dislocation accumulation near grain boundaries. Additionally, the numerical simulations using the LS-Dyna solver agreed well with the experiments, reaching an average error of 7.4% in fatigue life prediction.
In another study, Feng and Champliaud [20] proposed a numerical model for the asymmetric three-roll bending process, a technique widely used in metal forming, particularly in the manufacturing of steel cylinders. The model, which considers the rolls as rigid bodies and the sheet material as having bilinear elastic–plastic behavior, aimed to accurately predict the position of the side roll, a critical parameter for defining the final radius of the bent cylinder. The methodology involved the use of shell elements, automatic contacts, and explicit time integration in the ANSYS/LS-DYNA environment. Experimental validation showed errors below 6%, reinforcing the model’s potential to replace empirical methods and optimize production processes.
Feng, Zhu, and Ma [21] conducted an investigation on the three-roll bending technique applied to the forming of thick steel plates. Initially, the study revisited the geometric fundamentals of the process, highlighting the relationship between the workpiece curvature radius and the reduction applied by the upper roll. Using ABAQUS software (https://www.3ds.com/products-services/simulia/products/abaqus/, accessed on 29 September 2025), the authors simulated stress distribution and the springback phenomenon, which compromises the dimensional accuracy of the products. Through adjustments in process parameters (specifically increasing the upper roll displacement in a single pass) they demonstrated that it is possible to compensate for springback, considerably improving dimensional accuracy. Experimental validation of the results corroborated the effectiveness of the proposed optimizations, contributing significantly to the improvement of forming processes.
In Liu et al. [22], the authors proposed a new design for a three-roll bending machine aimed at overcoming the limitations of traditional machines in terms of precision and efficiency. The innovation covered the mechanical structure, hydraulic system, and electronic control of the machine. Using ABAQUS software, the authors analyzed the natural frequencies and vibration modes of the structure, establishing a mathematical model that relates the pressure applied by the lower roll to the formed curvature radius. In addition, they developed a nonlinear curve-fitting-based springback compensation algorithm applicable to both symmetric and asymmetric bending. The experiments showed that the proposed algorithm significantly reduced forming errors, with error rates below 0.5%, indicating a substantial improvement in roll bending process accuracy.
Moreira et al. [23] proposed and validated a computational model using the FEM via ANSYS® (version 2022 R2) to simulate the three-roll bending process of hot-rolled steel profiles. The study used a case involving an I-shaped rolled profile made of S235 steel, subjected to vertical loads during calendering operations. The authors compared results of residual stress generated through numerical modeling with experimental data available in the literature. As part of the evaluation, different types of three-dimensional finite elements—SOLID185, SOLID186, SOLID187, and SOLID285—were analyzed for their stability and accuracy in simulating the process. From the obtained results, SOLID186 and SOLID187, both featuring quadratic formulation, demonstrated superior performance in terms of accuracy, with SOLID186 yielding the most accurate results, followed closely by SOLID187. In contrast, SOLID185 and SOLID285, which are based on linear formulation, showed less precise outcomes.
In Zheng et al. [24], the optimization of the roll bending process for producing steel profiles with non-uniform curvature is addressed. The authors proposed a method that allows the dynamic adjustment of roll positions during the forming process, eliminating the need for multiple molds to manufacture components with variable curvatures. For this purpose, the lower rolls were anchored to a pyramid-shaped structure, and the vertical displacement of the top roll was actively adjusted in real time to attain the intended planar geometry. The theoretical foundation of the method was based on elastoplastic constitutive equations, which were integrated to calculate the reaction force on the upper roll. Finite element simulations resulted in a preliminary design protocol, which proved highly effective in approximating the actual curvature to the target curvature, demonstrating the potential of the approach for significant advances in metal forming techniques, despite the challenges inherent to their dynamic nature.
Finally, Moreira et al. [25] performed a numerical analysis of the mechanical behavior of 6061-T6 aluminum extruded profiles subjected to the three-roll bending process, employing the FEM with ANSYS® software (version 2022 R2) and SOLID187 elements, in the previously validated computational model from [23]. The findings indicate that reducing the bending radius leads to a significant increase in von Mises stress, reaching about 290 MPa, approaching the material’s strength limit, especially in the smallest simulated radii, which signals an approach to the safety limit and a potential risk of structural failure. In parallel, the displacements in the cross-section show that regions near the sharper curvatures present higher displacements, particularly in the upper part, reflecting the complexity of the material behavior during deformation and identifying areas susceptible to defects due to excessive strain. The displacement fitting curves as a function of radius were essential to understanding the relationship between curvature and deformation, enabling the definition of operational limits that ensure the structural integrity and safety of the processed profile. It is worth to mention that despite SOLID186’s overall better performance defined in [23], SOLID187 is more suitable for the simulation of complex geometries due to its capability to handle irregular mesh topologies more efficiently.
Additionally, the literature presents studies that analyze the forming characteristics of aluminum sheets with variable thickness, known as tailor-rolled blanks. These blanks are produced through controlled rolling to meet specific functional requirements, and the research also extends to the analytical modeling of the forces involved in the bending process. Investigations aimed at quantifying springback in extruded profiles and developing strategies to mitigate defects such as twisting in asymmetric sections also stand out [26,27,28,29].
Another research approach related to the three-roll bending process is the analytical one, where models are developed to predict curvature and deformation by relating process parameters to mechanical response. These studies typically incorporate variables such as wall thickness, material strength, roller geometry, spacing, bending forces, and residual stresses, providing closed-form relationships that complement numerical and experimental investigations. At the same time, they also demonstrate the challenges and inherent limitations of purely analytical modeling: while useful for simple geometries, the elastoplastic response becomes extremely difficult to represent, and in some cases not feasible for multi-connected or reinforced cross-sections. Discussing these contributions therefore reinforces and justifies the decision to adopt a fully numerical approach in the present work [30,31,32].
In this context, the present study aims to numerically analyze the mechanical behavior of six extruded 6061-T6 aluminum profiles during the three-roll bending process, considering, in two specific cases, the application of the process in different bending directions (vertical and horizontal), totaling eight different cases under analysis, with emphasis on the influence of different bending radii. Among the profiles studied, two stand out due to their high geometric complexity, which adds further relevance to their evaluation within the proposed context. The analysis, carried out through the FEM in ANSYS® software (version 2024 R2) using the SOLID187 finite element, expands the previously validated model by Moreira et al. [23] (with the experimental data by Spoorenberg et al. [33]) and employed in [25], now adapted for a broader range of geometries. Furthermore, new validation and verification procedures were carried out in this work, further enhancing the reliability and credibility of the proposed computational model.

2. Materials and Methods

The six 6061-T6 aluminum profile cross-sections considered in this work are depicted in Figure 1, whose applications extend across various industrial sectors.
Profile 1 (see Figure 1a), characterized by two parallel flat faces and curved lateral edges, is commonly used as a “hat channel” in metal roofing systems and façade claddings, where the flat faces allow for precise anchoring and the curved lateral shape provides mechanical strength and flexibility to accommodate thermal variations and small-scale structural movements. Profile 2 (see Figure 1b), with an asymmetrical geometry featuring flanges and an internal web, is typical in window frames and glass façades, offering a high moment of inertia to withstand wind loads and concentrated forces in sealing systems. In modular architectural applications, it serves as an interlocking element for panels and mullions, benefiting from flat surfaces for welding and mechanical fastening. Profile 3 (see Figure 1c), featuring multiple chambers and U-shaped flanges, is widely used in industrial and agricultural enclosure systems, serving as a structural support for tarpaulins in semi-trailers, where the combination of internal cavities provides lightness and stiffness control, and also in tray structures and supports for polycarbonate panels. Profiles 4 and 5 (see Figure 1d,e, respectively) are large-diameter tubes (Ø 127 mm) used in antenna masts, public lighting columns, and signage supports, applications that require good fatigue resistance under wind and cyclic loading conditions. Finally, profile 6 (see Figure 1f), with its double semicircular section and central flange, can be found in linear guides of machines and sliding systems, where the internal curvature allows the fitting of bearings or seals, ensuring precise motion and friction reduction in automated industrial equipment.

2.1. Roll Bending Process Fundamentals for a Pyramid Arrangement

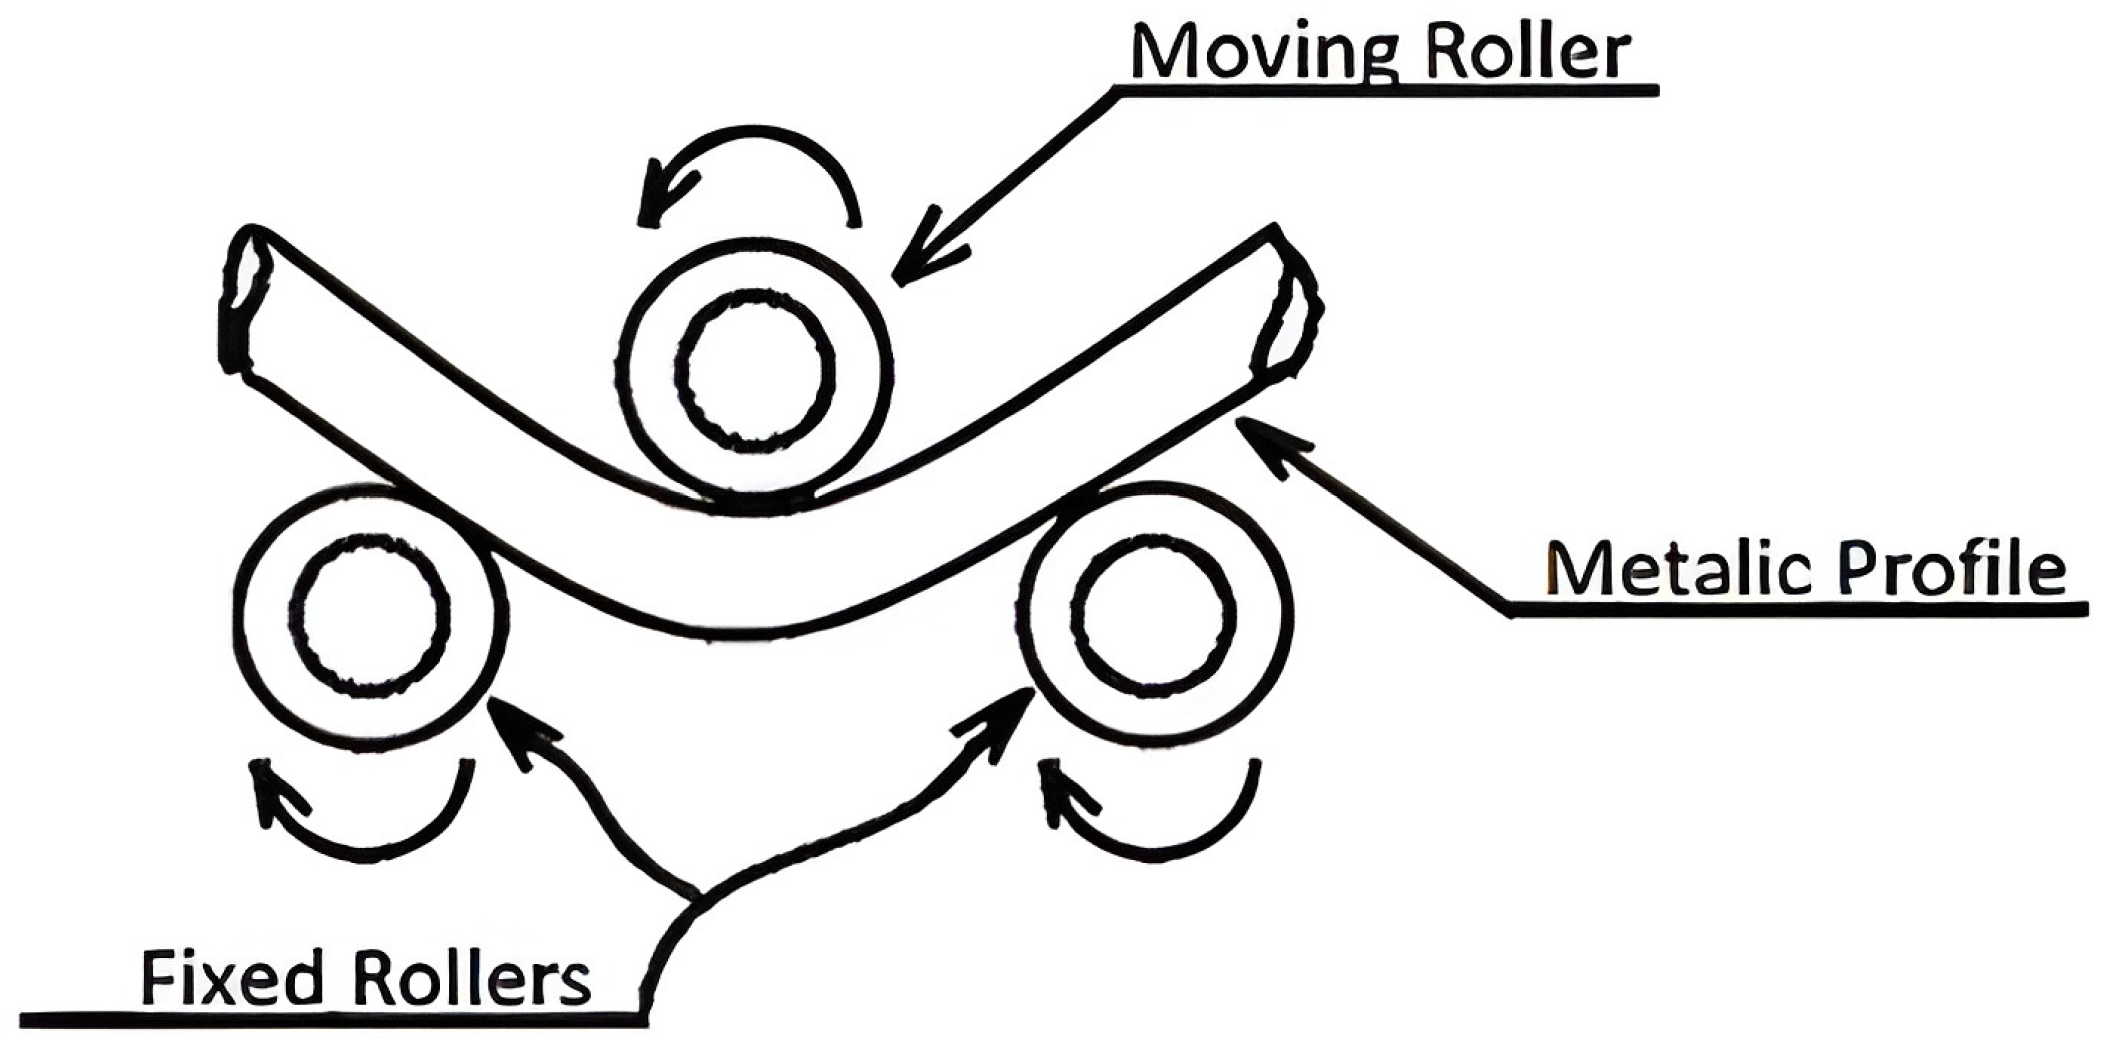
Figure 2 represents schematically a typical setup of a three-roll bending machine in a pyramid configuration, consisting of two fixed lower rolls mounted on rigid side supports and a central upper roll with adjustable vertical movement, usually driven by hydraulic or mechanical systems. In three-roll bending, the profile is fed longitudinally by the counter-rotating lower rolls, while the upper roll applies a controlled vertical displacement that induces progressive plastic bending. The combined action produces a constant bending radius, whereas variable radii can be obtained by adjusting the upper roll position during feeding. The final geometry is achieved through successive passes with accumulated deformation [34].
As described by Kissell and Ferry [36], metallic profiles made of materials like aluminum, copper, steel, and special alloys are frequently formed through the roll bending process. This manufacturing process is capable of generating complex geometries with a high degree of precision. The flexibility of this system, combined with the ability to faithfully repeat predefined configurations, makes it an ideal solution for structural and decorative components that require strict tolerances and smooth transition surfaces.

2.2. Origin, Typology, and Impact of Defects in Metal Profile Bending

Profiles with curved shapes are usually produced by applying bending operations to straight extruded elements obtained through standard billet extrusion. Similarly to what occurs in sheet metal forming, bending operations applied to profiles often lead to springback, a result of residual stresses generated during extrusion and cold deformation stages. These residual stresses, resulting from internal forces that persist in the material after the removal of external loads, can be induced by thermal gradients, variations in plastic deformation, or microstructural incompatibilities, and may significantly affect the final geometric accuracy of the bent profile [37,38].
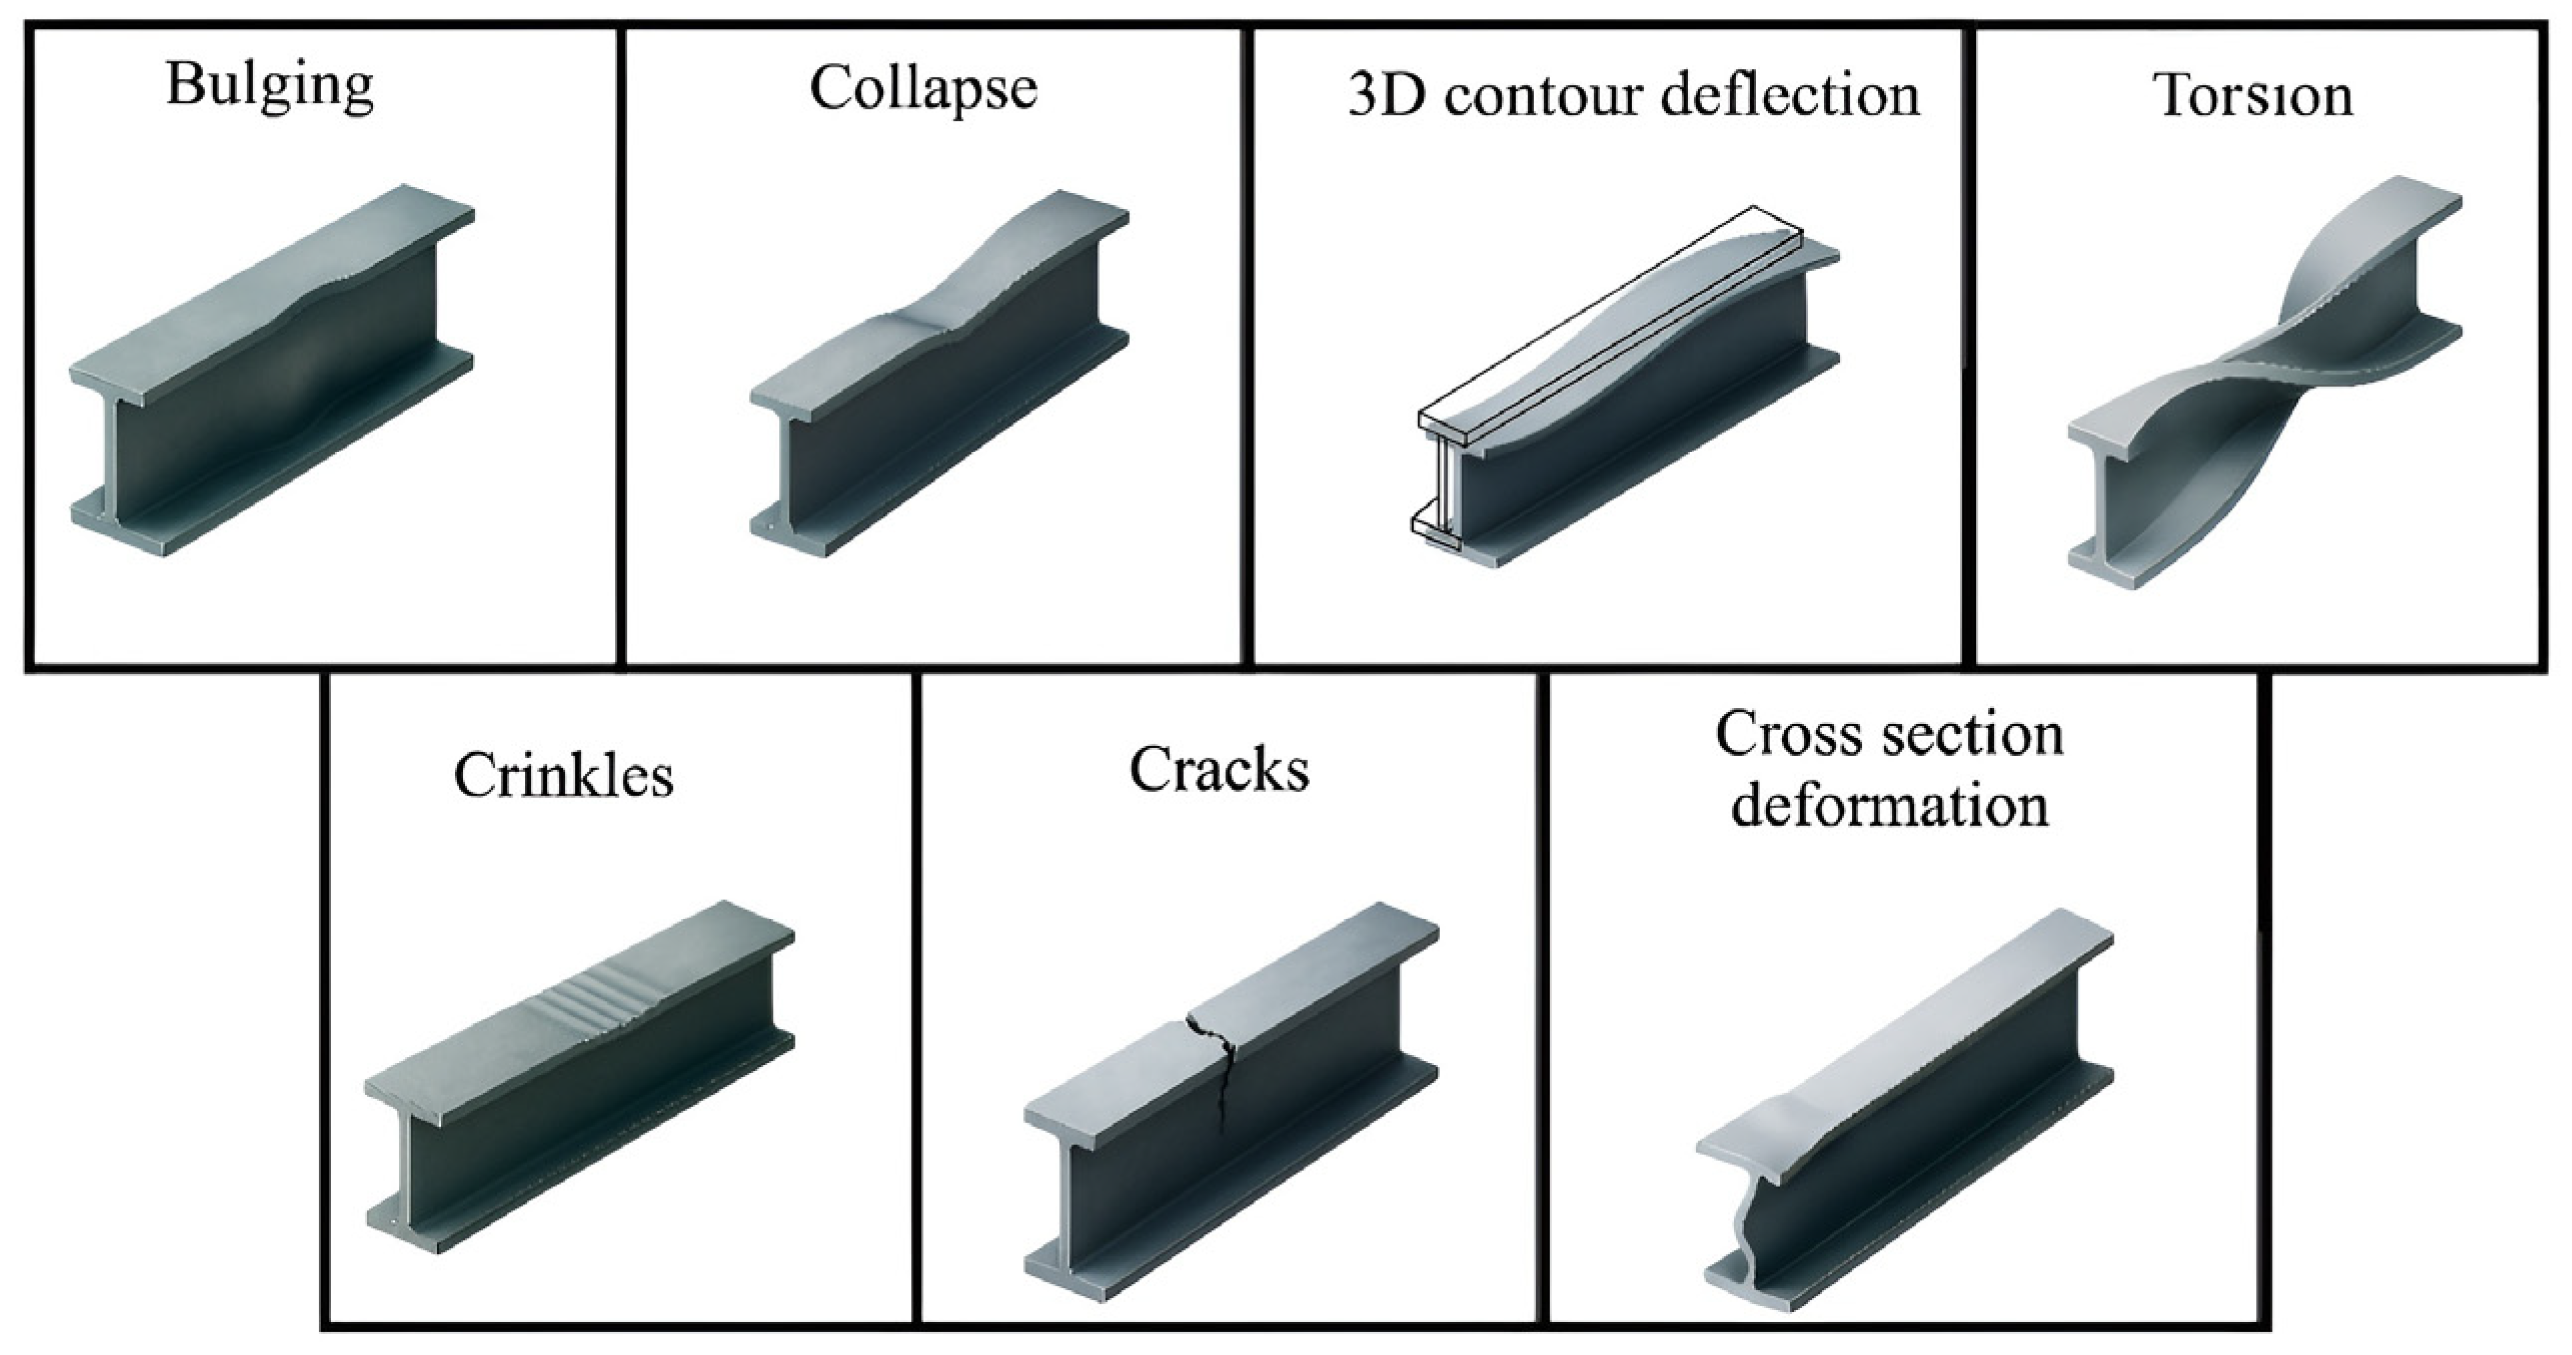
In addition to springback, the roll bending process can generate specific defects in the profile’s cross-section. Excessive reduction in the bending radius tends to cause ovalization or wall thickness reduction, compromising thickness and local stiffness [39]. In asymmetric profiles, the misalignment between the center of gravity and the shear center causes torsion of the section during bending, requiring special care in the geometric design and in the pass sequence [40]. Local buckling instability, or wrinkling of thin walls, constitutes another challenge, especially in profiles with a high width-to-thickness ratio, potentially leading to irreversible folding on the inner surface of the arc [10].
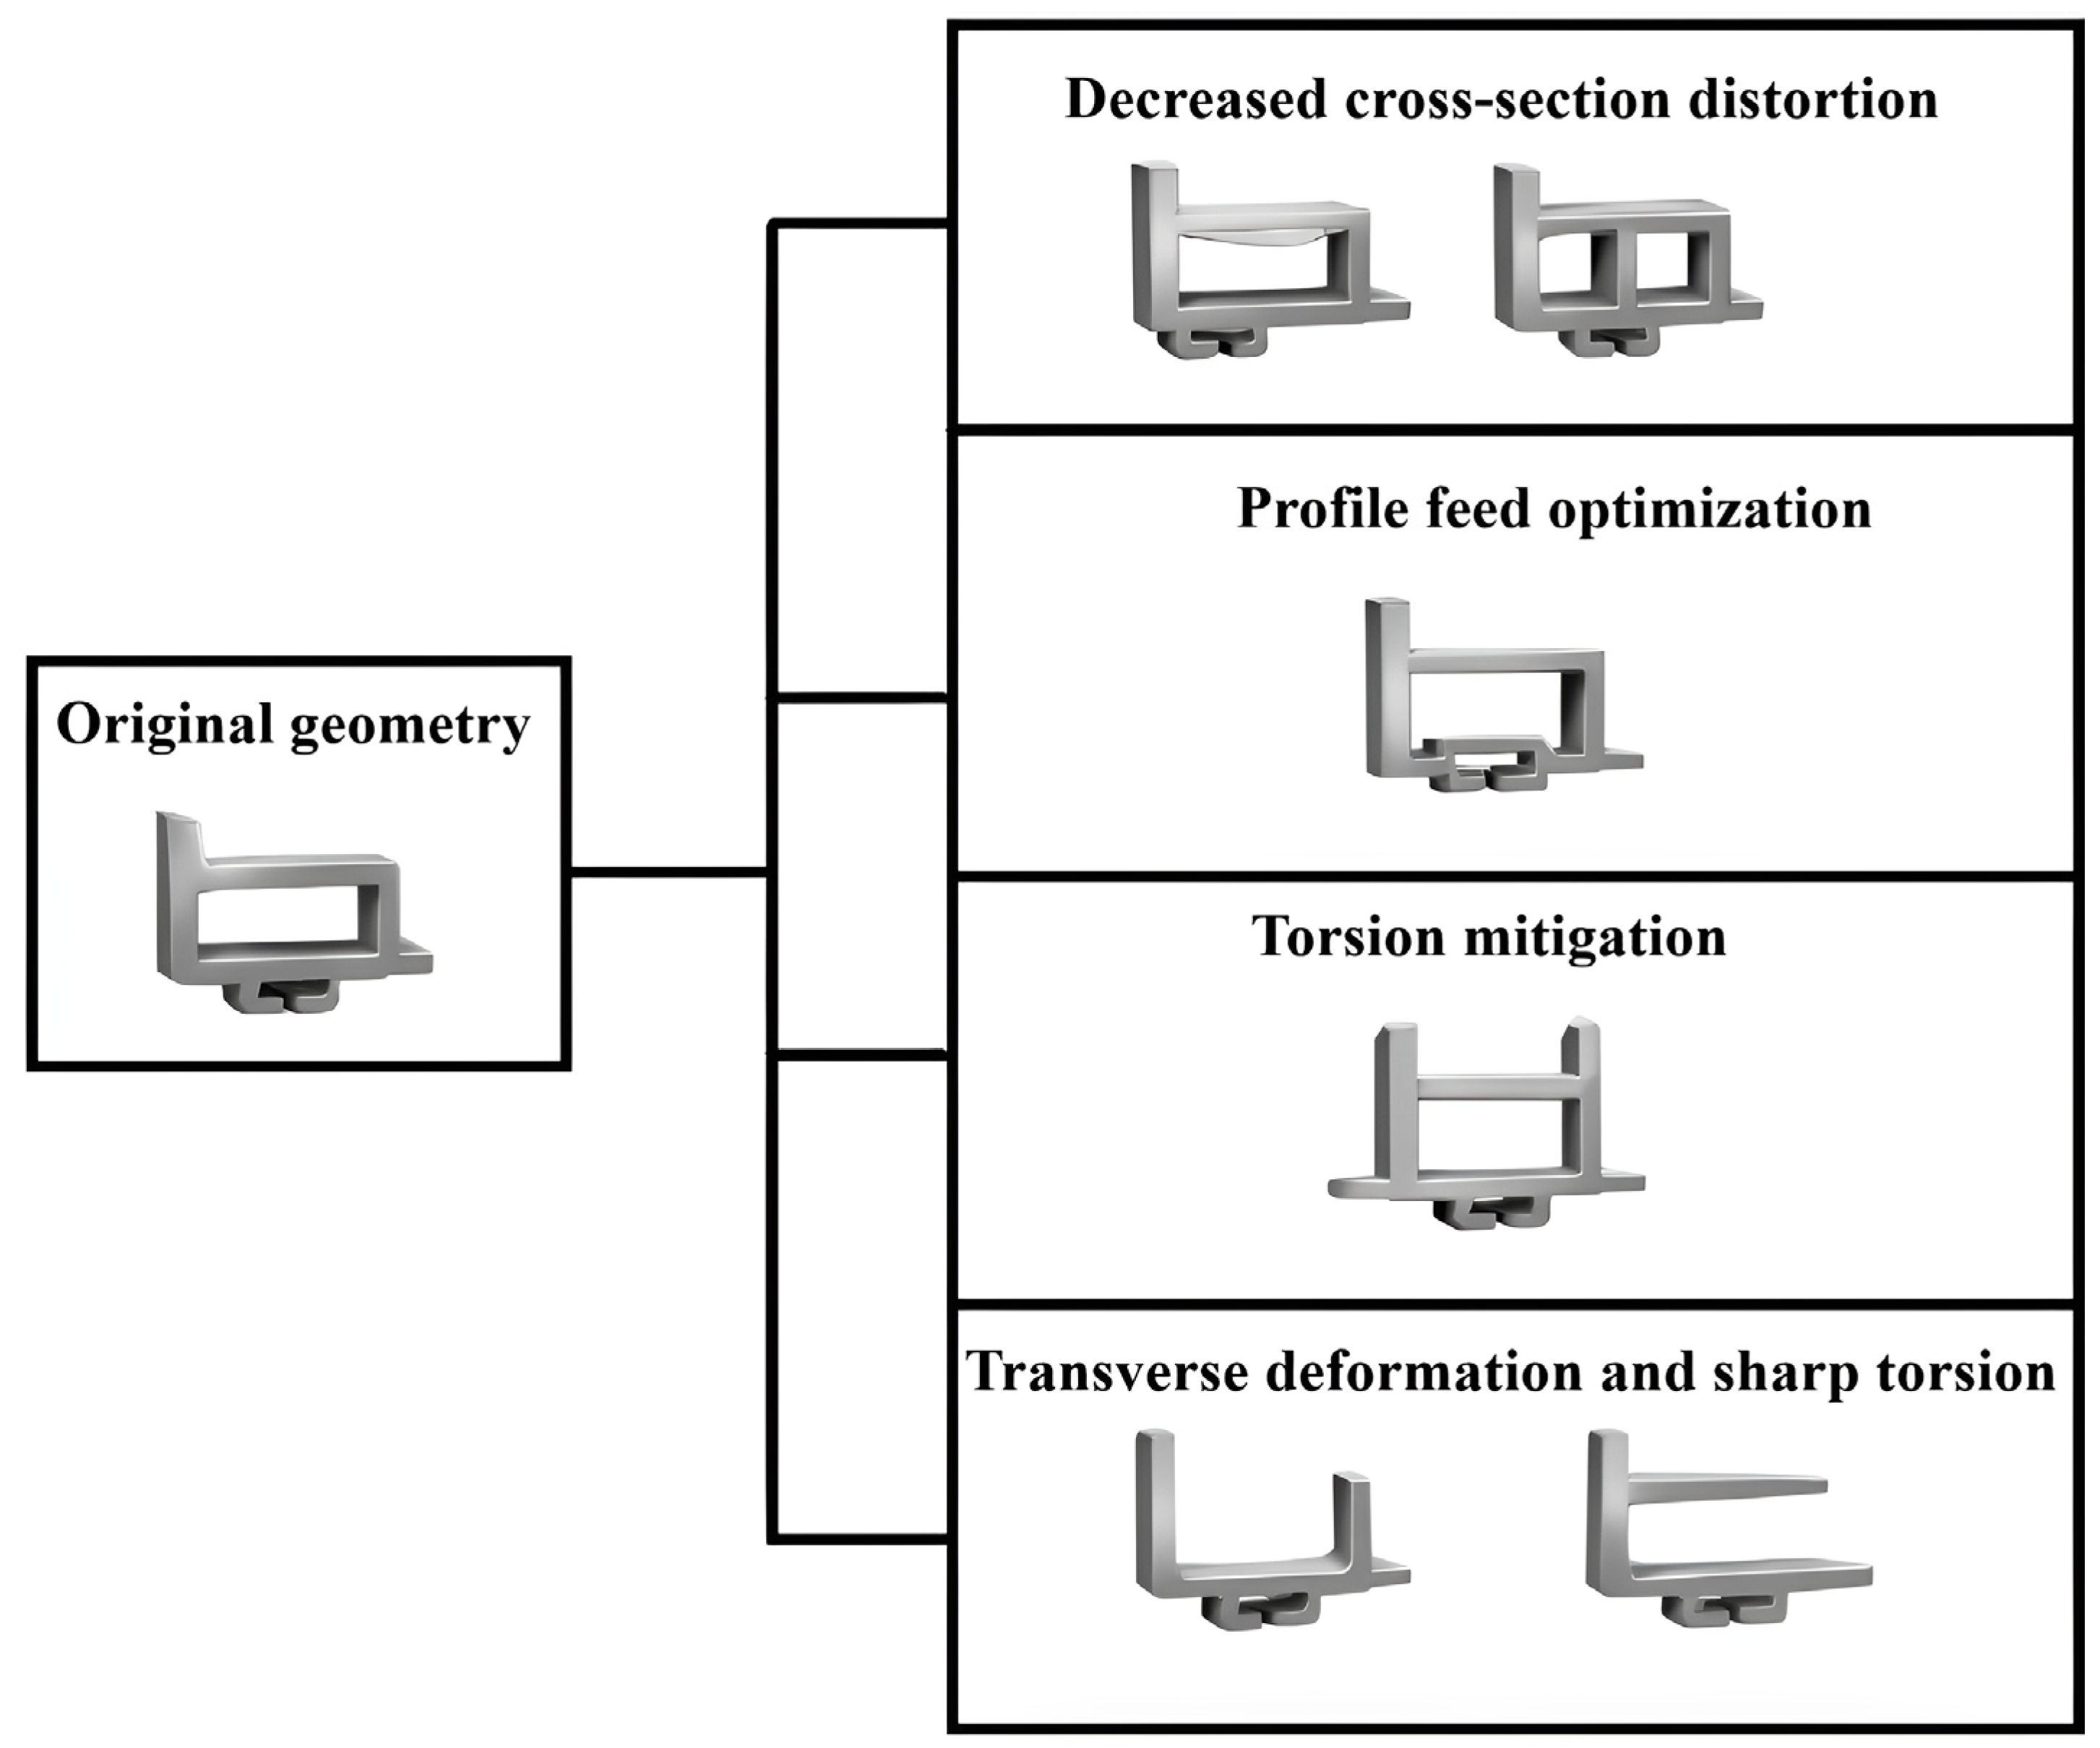
Under large deformations, especially on the extrados, microstructural alterations may also occur, such as grain elongation and dislocation accumulation, which can reduce the ductility and fatigue resistance of the bent component [41,42]. To mitigate these defects, studies propose modifications to the cross-sectional geometry (such as inclusion of internal reinforcements, localized thickness increases, corner radius adjustments, among others) capable of increasing stiffness and minimizing load asymmetries, thereby simultaneously reducing ovalization and torsion [35,43,44,45,46]. Based on Selvaggio et al. [35], Figure 3 and Figure 4 illustrate the mechanisms leading to the emergence of the most critical defects in the bending of extruded profiles, and the production solutions capable of mitigating them, respectively.
Regarding the allowable displacements in aluminum profiles, such limits exhibit wide variability depending on the application, structural geometry, and loading conditions. Eurocode 9 [43] establishes general design guidelines but does not set absolute values for strain or deflection, recognizing that these parameters depend on the specific usage context. Although ABNT does not have a specific standard for aluminum structures, NBR 8800 [44], which deals with the design of steel structures in buildings, provides stiffness and displacement admissibility guidelines that can be adapted to analyze aluminum profiles in Brazil. The Aluminum Design Manual [45] goes further with performance recommendations for different typologies, buildings, bridges, and industrial equipment, also including guidelines related to creep, fatigue, and user comfort.
Within this context, four determining factors stand out in defining displacement limits: (i) structural typology, where buildings, bridges, and machinery present diverse stiffness requirements; (ii) function and criticality, as systems where safety is paramount demand more restrictive criteria; (iii) service conditions, since permanent or variable loadings require specific approaches; and (iv) comfort and aesthetics, especially in inhabited environments or visible structures, where deflection must comply with limits ensuring well-being and visual quality.

2.3. Computational Modeling

Computational modeling was employed for the analysis of the three-roll bending process of the aluminum profiles presented in Figure 1. This numerical approach via the FEM, by predicting stresses, strains, and displacements in these profiles, becomes an effective tool to optimize process parameters, diagnose potential failures, and ensure adequate performance of each configuration in its specific application. The application of the FEM to the roll bending process not only allows mapping the distribution of stresses and plastic strains in each region of the profiles but also quantifies displacements and rotations resulting from different combinations of bending radii, roll speeds, and contact conditions. This predictive capability enables defining safe operating ranges, optimizing parameter selection such as rolling pressure, roll spacing, and pass sequence, and anticipating critical zones susceptible to cracks or forming defects. Additionally, by incorporating numerical analyses related to mechanical strength, the computational model provides support for design adjustments even before physical prototyping, reducing the number of experimental iterations, material consumption, and development time. Thus, currently, the use of computational modeling becomes practically indispensable not only to guarantee that each profile meets performance specifications in its final applications but also to promote efficiency, safety, and cost–benefit gains throughout the entire engineering and manufacturing cycle [46], factors that justify the undertaking of this work.
The FEM is a versatile numerical technique based on domain discretization into subdomains, widely applied in structural, materials, and other engineering fields to approximate solutions for complex problems [47,48,49,50]. Several commercial software packages incorporate the FEM within their computational environments, with ANSYS® Mechanical being one of the most widely used in mechanical and materials engineering. This software enables performing static structural analyses (linear and nonlinear), modal analyses, buckling, harmonic, transient, and spectral analyses, allowing precise evaluation of mechanical behavior under different loading conditions and constraints [51].
The adopted computational model was previously validated by Moreira et al. [23] and applied in Moreira et al. [25]. In the present work, a new validation and verification were performed: following Oñate [52], validation was conducted against experimental data and verification against the numerical results of Song et al. [53].
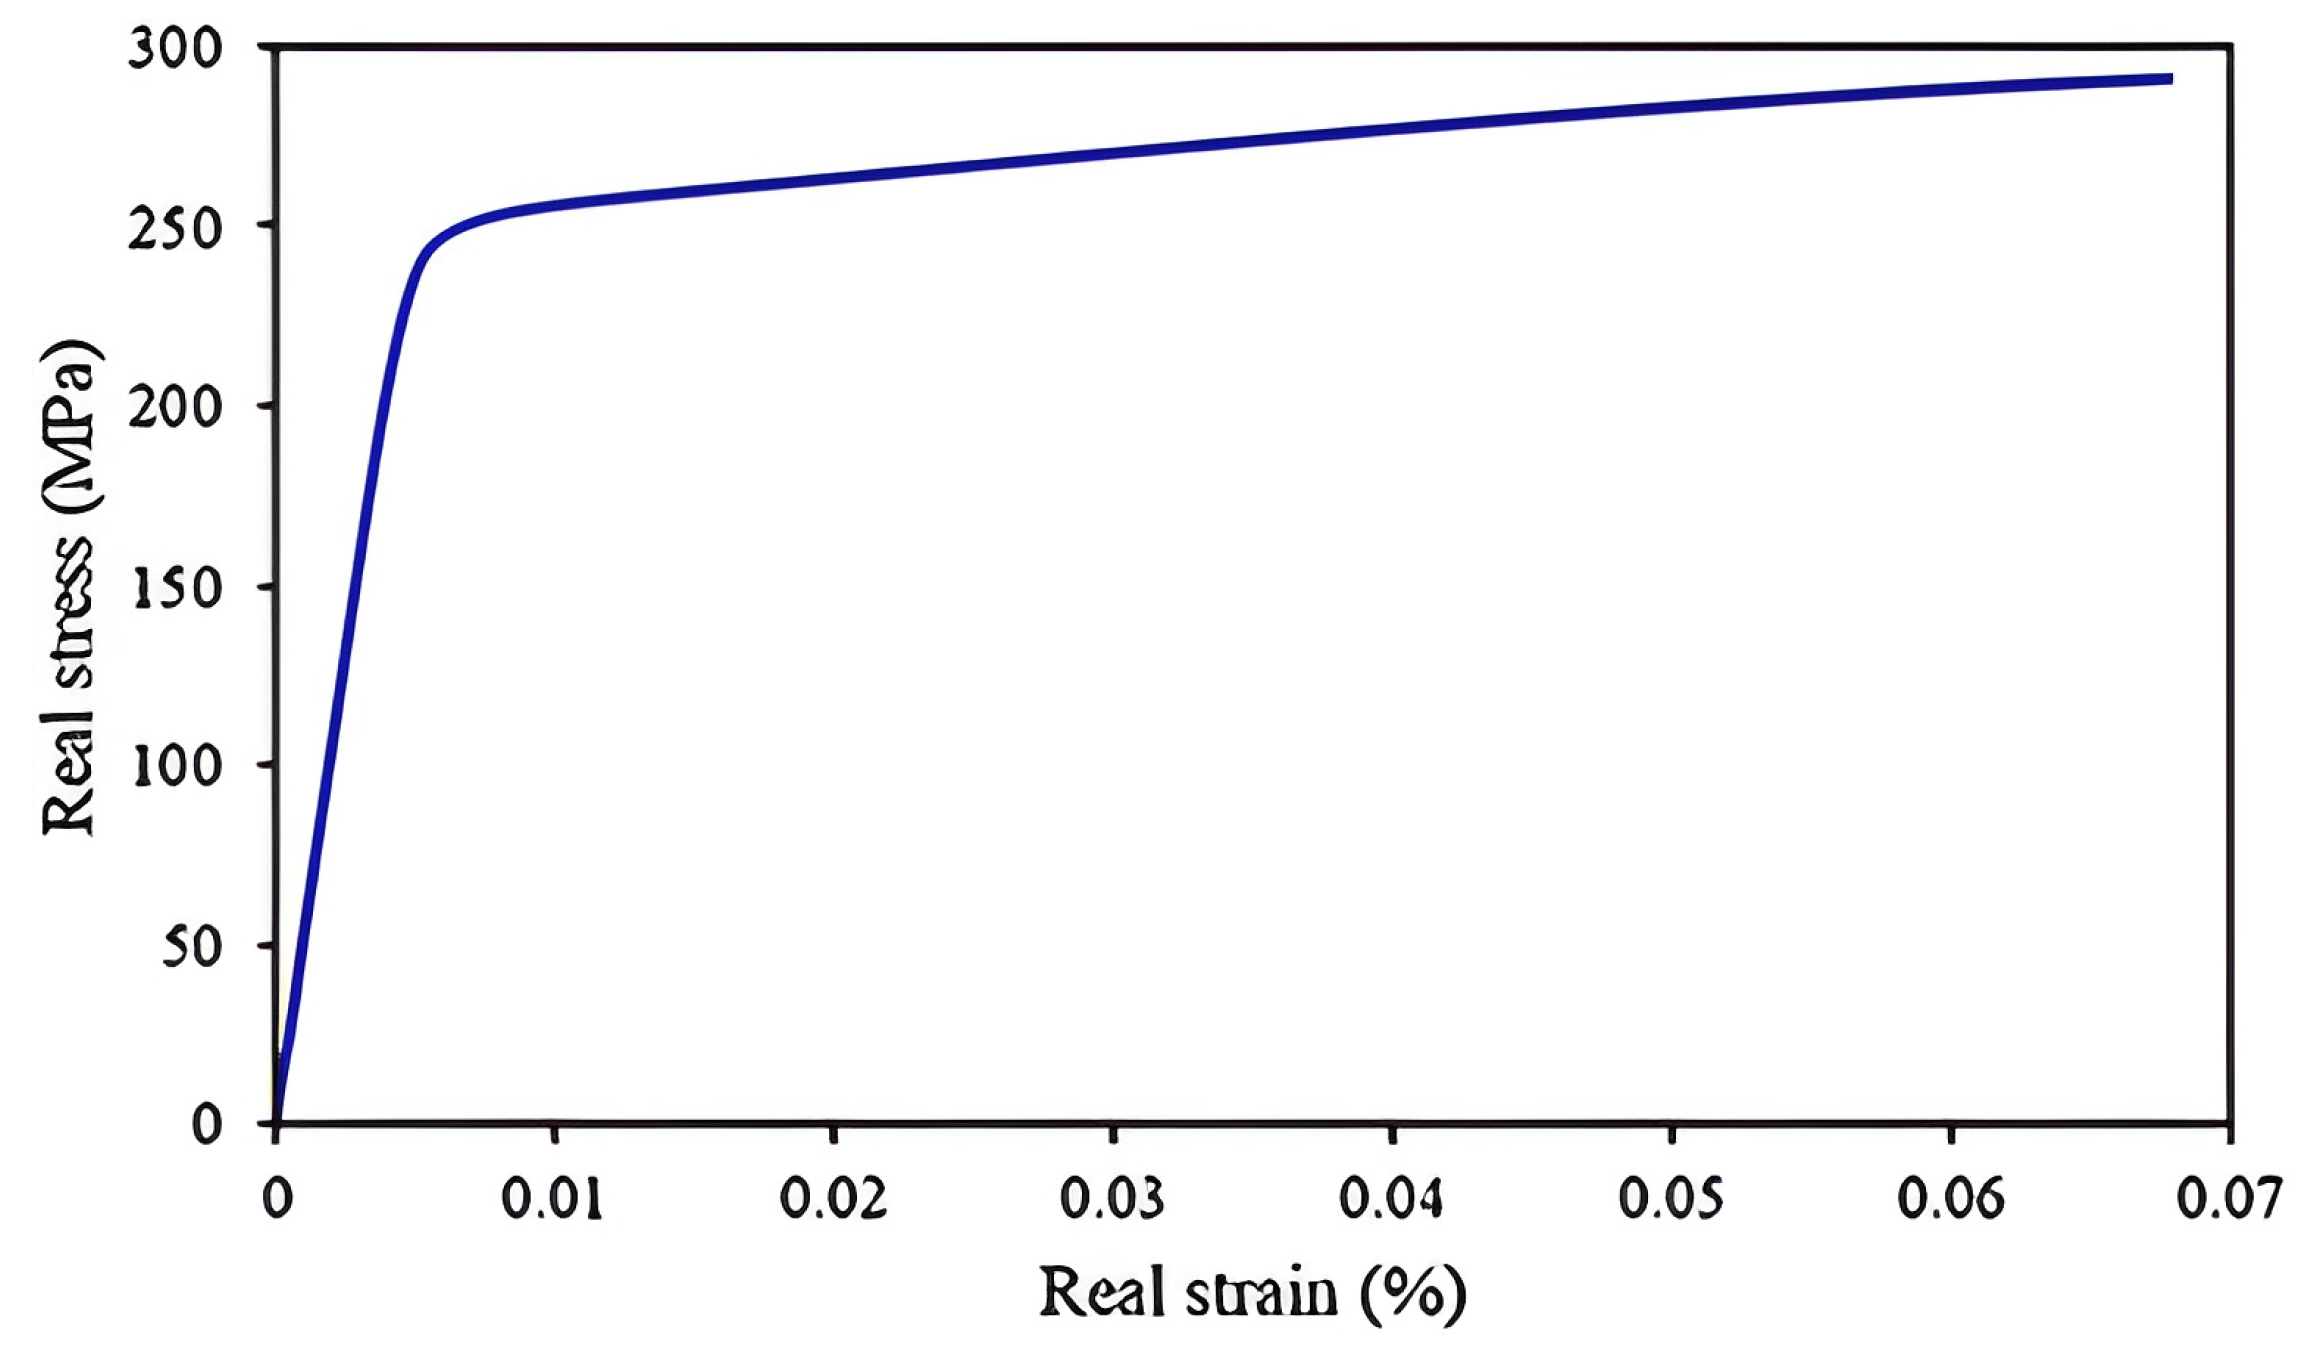
After that, for the numerical simulations of the aluminum profiles (see Figure 1), the material behavior of the extruded aluminum 6061-T6 was modeled using an isotropic elasto-plastic constitutive law with isotropic hardening, implemented through a multilinear true stress–strain curve extracted from the experimental data of Souza [54]. The choice of a multilinear representation, rather than a simplified bilinear approximation, was deliberate: it allows the progressive hardening branch and the detailed shape of the plastic regime to be captured, which is essential when analyzing highly nonlinear elastoplastic bending where large portions of the cross-section may enter the plastic domain. It is important to emphasize that the stress–strain relationship of aluminum 6061-T6 (Figure 5) used in this work was obtained under quasi-static loading conditions, which are consistent with the low roller speeds typically involved in three-roll bending processes. Consequently, strain-rate sensitivity was not explicitly considered in the present simulations. While this assumption is reasonable for the operating conditions addressed here, it should be noted that strain-rate effects may become relevant in high-speed forming operations. Therefore, future extensions of this work may incorporate constitutive models with strain-rate dependency to further expand the applicability of the numerical framework [54].
Geometric modeling and boundary conditions were defined to preserve physical realism while optimizing computational cost. For profiles exhibiting geometric symmetry (Profiles 1, 4, 5, and 6) symmetry boundary conditions were applied and only half the cross-section was modeled, while asymmetric profiles (Profiles 2 and 3) were modeled in full to properly capture non-symmetric loading and deformation patterns. The horizontal center-to-center distance between the rolls was fixed at 300 mm for all cases, a value chosen to reflect typical industrial practice and to maintain comparability across the set of profiles. Rolls were idealized as perfectly rigid bodies due to their much higher stiffness relative to the aluminum profiles and their action on the workpiece was reproduced by prescribing a constant rotational velocity about each roll axis. In the computational model, this motion was implemented via incremental angular displacements around the z-axis, perpendicular to the roll faces. A time step of 1 s was adopted for the transient solution, with the first step corresponding solely to the vertical displacement of the rolls to establish initial contact and curvature. In the subsequent steps, a rotational increment of 150° per step, corresponding to an angular velocity of 2.618 rad/s, was applied, ensuring progressive feeding of the aluminum profile through the roll gap and reproducing the kinematics observed in three-roll bending machines while avoiding numerical complications associated with explicit modeling of the drive mechanics.
The computational model explicitly accounts for the three principal nonlinearities relevant to the bending process: geometric nonlinearity (large displacements and rotations), material nonlinearity (elasto-plastic behavior with hardening), and contact nonlinearity (frictional, sliding contact).
Moreover, for the three-dimensional modeling of the aluminum profiles throughout the three-roll bending process, the SOLID187 finite element was employed. The choice was based on prior studies by Moreira et al. [23,25], where both SOLID186 and SOLID187 yielded accurate results for relatively simple geometries; however, for profiles with more complex cross-sections, only SOLID187 consistently achieved convergence and reliable predictions. This behavior was again confirmed in the present work through the validation and verification against the results of Song et al. [53]. SOLID187 is a second-order, ten-node tetrahedral solid element with isoparametric formulation and three translational degrees of freedom per node, particularly suitable for nonlinear structural analyses of metallic alloys such as 6061-T6 aluminum [51].
To represent the contact between the surfaces of the deformable 6061-T6 aluminum profiles and the machine’s rigid rolls, the finite interface elements CONTA174 and TARGE170 were used, respectively. CONTA174 was assigned to the outer surfaces of the SOLID187 elements composing the profile, allowing simulation of contact behavior with friction and sliding. The rolls were idealized as target surfaces using the TARGE170 element, characteristic of rigid bodies. Contact is established when the nodes of CONTA174 (active surface) intercept the geometry defined by TARGE170 (target surface), triggering the interaction between the bodies [51].
Figure 6 schematically illustrates the configuration of the finite elements [51] used in the computational model, including the geometry of SOLID187 (Figure 6a), the contact interface defined by CONTA174 (Figure 6b), and the rigid surface represented by TARGE170 (Figure 6c).
It worth to mention that this contact between the rolls and the profile was treated using ANSYS contact formulations (CONTA174/TARGE170) with an augmented Lagrangian algorithm to enforce the non-penetration constraint. The augmented Lagrangian method was selected because it provides a robust balance between accuracy and numerical conditioning in frictional contact problems involving large-deformation elasto-plastic simulations. It enforces contact constraints more accurately than a pure penalty formulation while avoiding the ill-conditioning that can result from excessive penalty stiffness [55]. A single effective friction coefficient µ = 0.8 was adopted at the roll–profile interface. This value should be interpreted as an effective traction parameter chosen after parametric trials: lower, more nominal dry-metal contact values (for example µ ≈ 0.2) produced persistent slip in the contact zones and failed to transmit the rotational motion of the rolls into axial feed of the profile in the numerical model (i.e., the profile slid under the rollers instead of being progressively fed and bent). The higher effective coefficient therefore models the combined action of friction plus additional practical factors that promote traction in industrial bending (local bite/indentation, surface roughness, absence of lubricant, or intentional process measures to increase grip). Parametric tests showed that, with µ = 0.8, the simulated axial feed, stress distributions and displacement patterns became consistent with experimental references used for validation.
Regarding the profiles analyzed in the present work, an individual mesh convergence study was initially performed for each profile (see Figure 1). Although this procedure may appear repetitive, it was essential given the significant differences in cross-sectional geometry (symmetries, asymmetries, thin walls, and reinforcements). The spatial discretization (mesh) considered as ideal for each case is the one for which the variation in simulated results becomes minimal with successive refinements, indicating stability in the predictions. To assess the independence of the results concerning the mesh, the absolute relative difference (RD) between the maximum stress values of two consecutive meshes was calculated by:
R D = 100 ( M j M j + 1 ) M j ,
where M j and M j + 1 are the maximum stresses of the coarse and refined meshes, respectively.
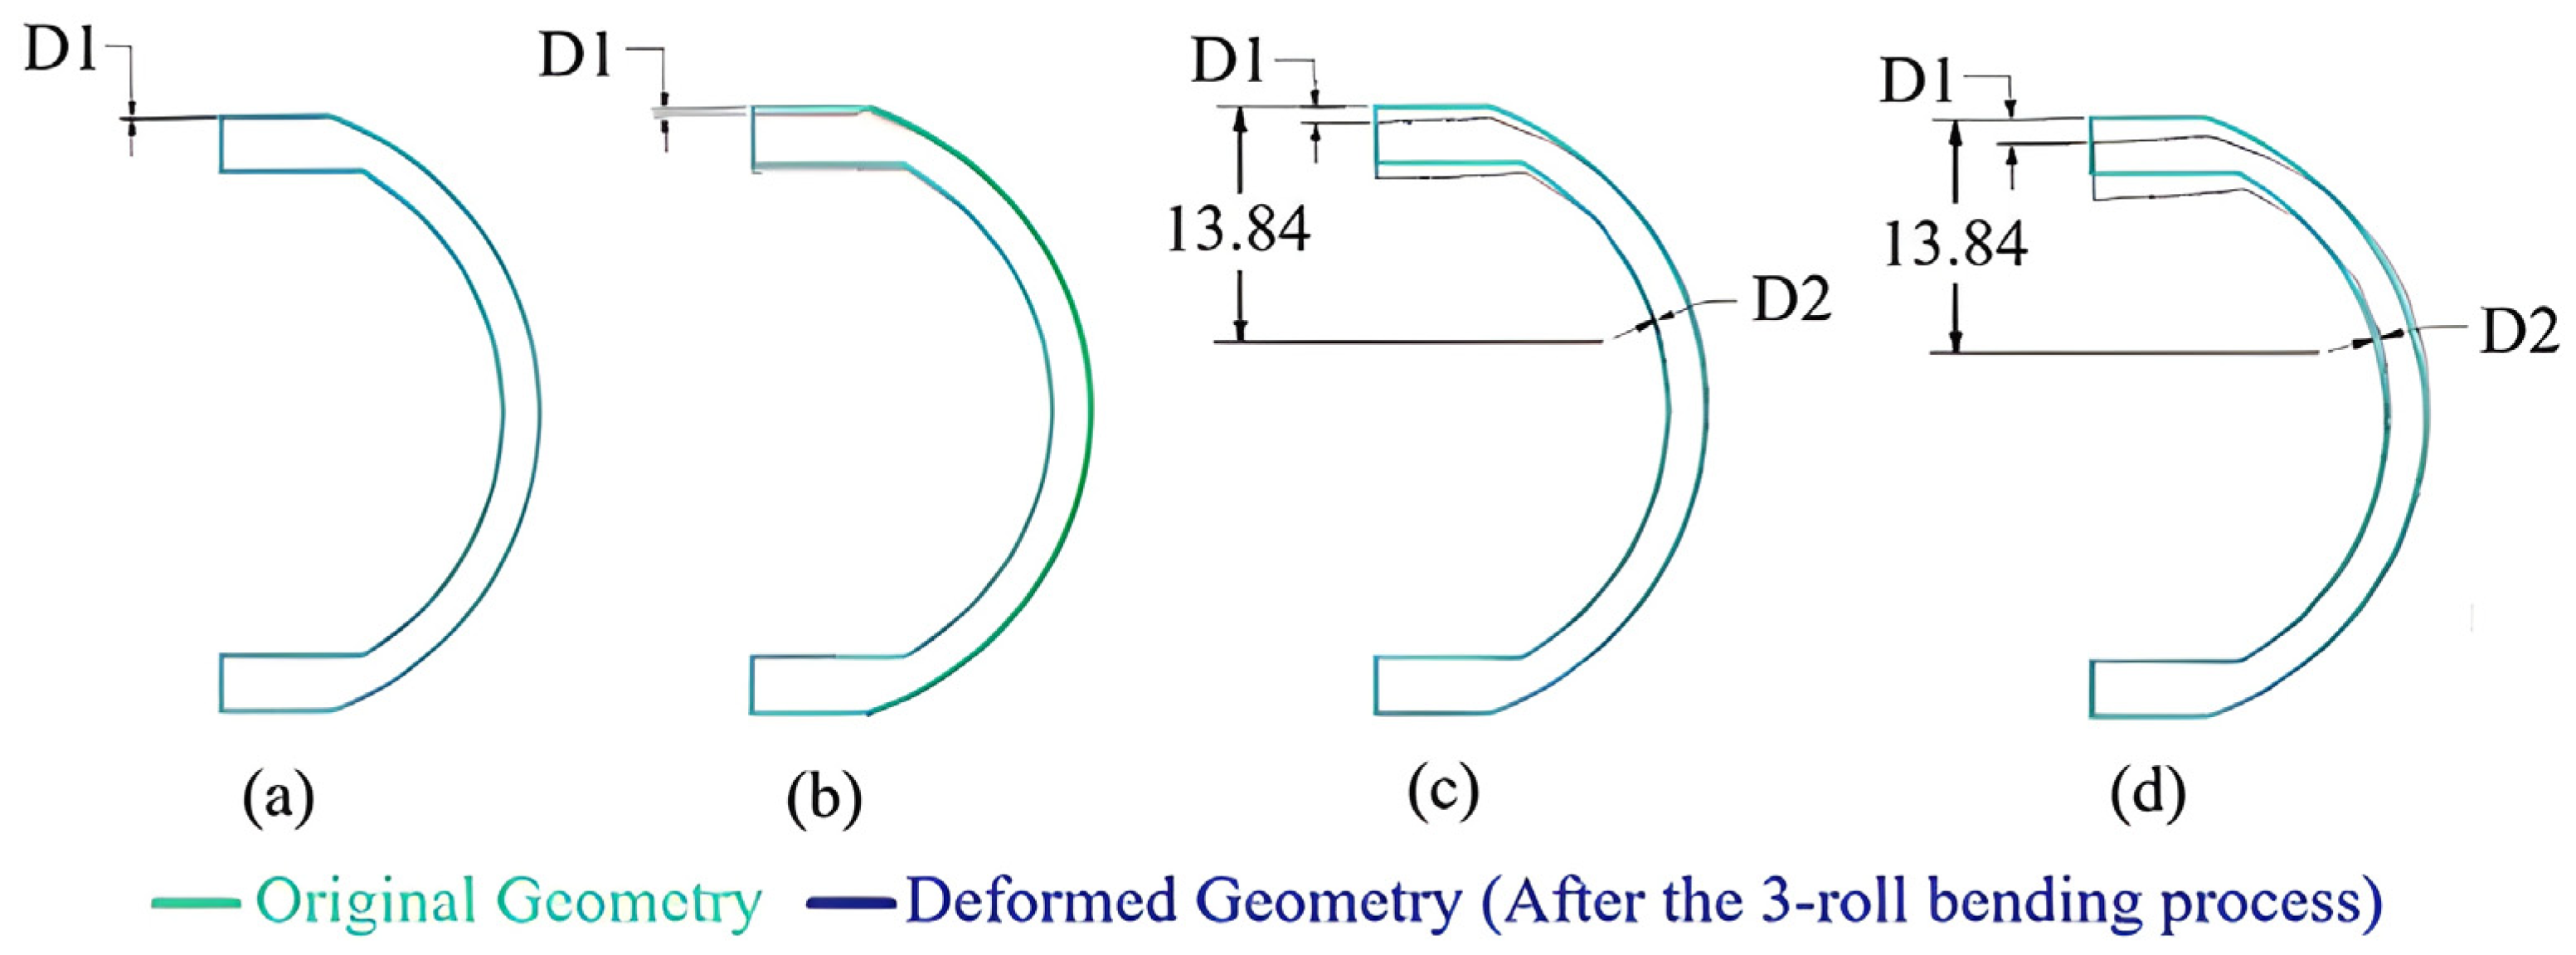
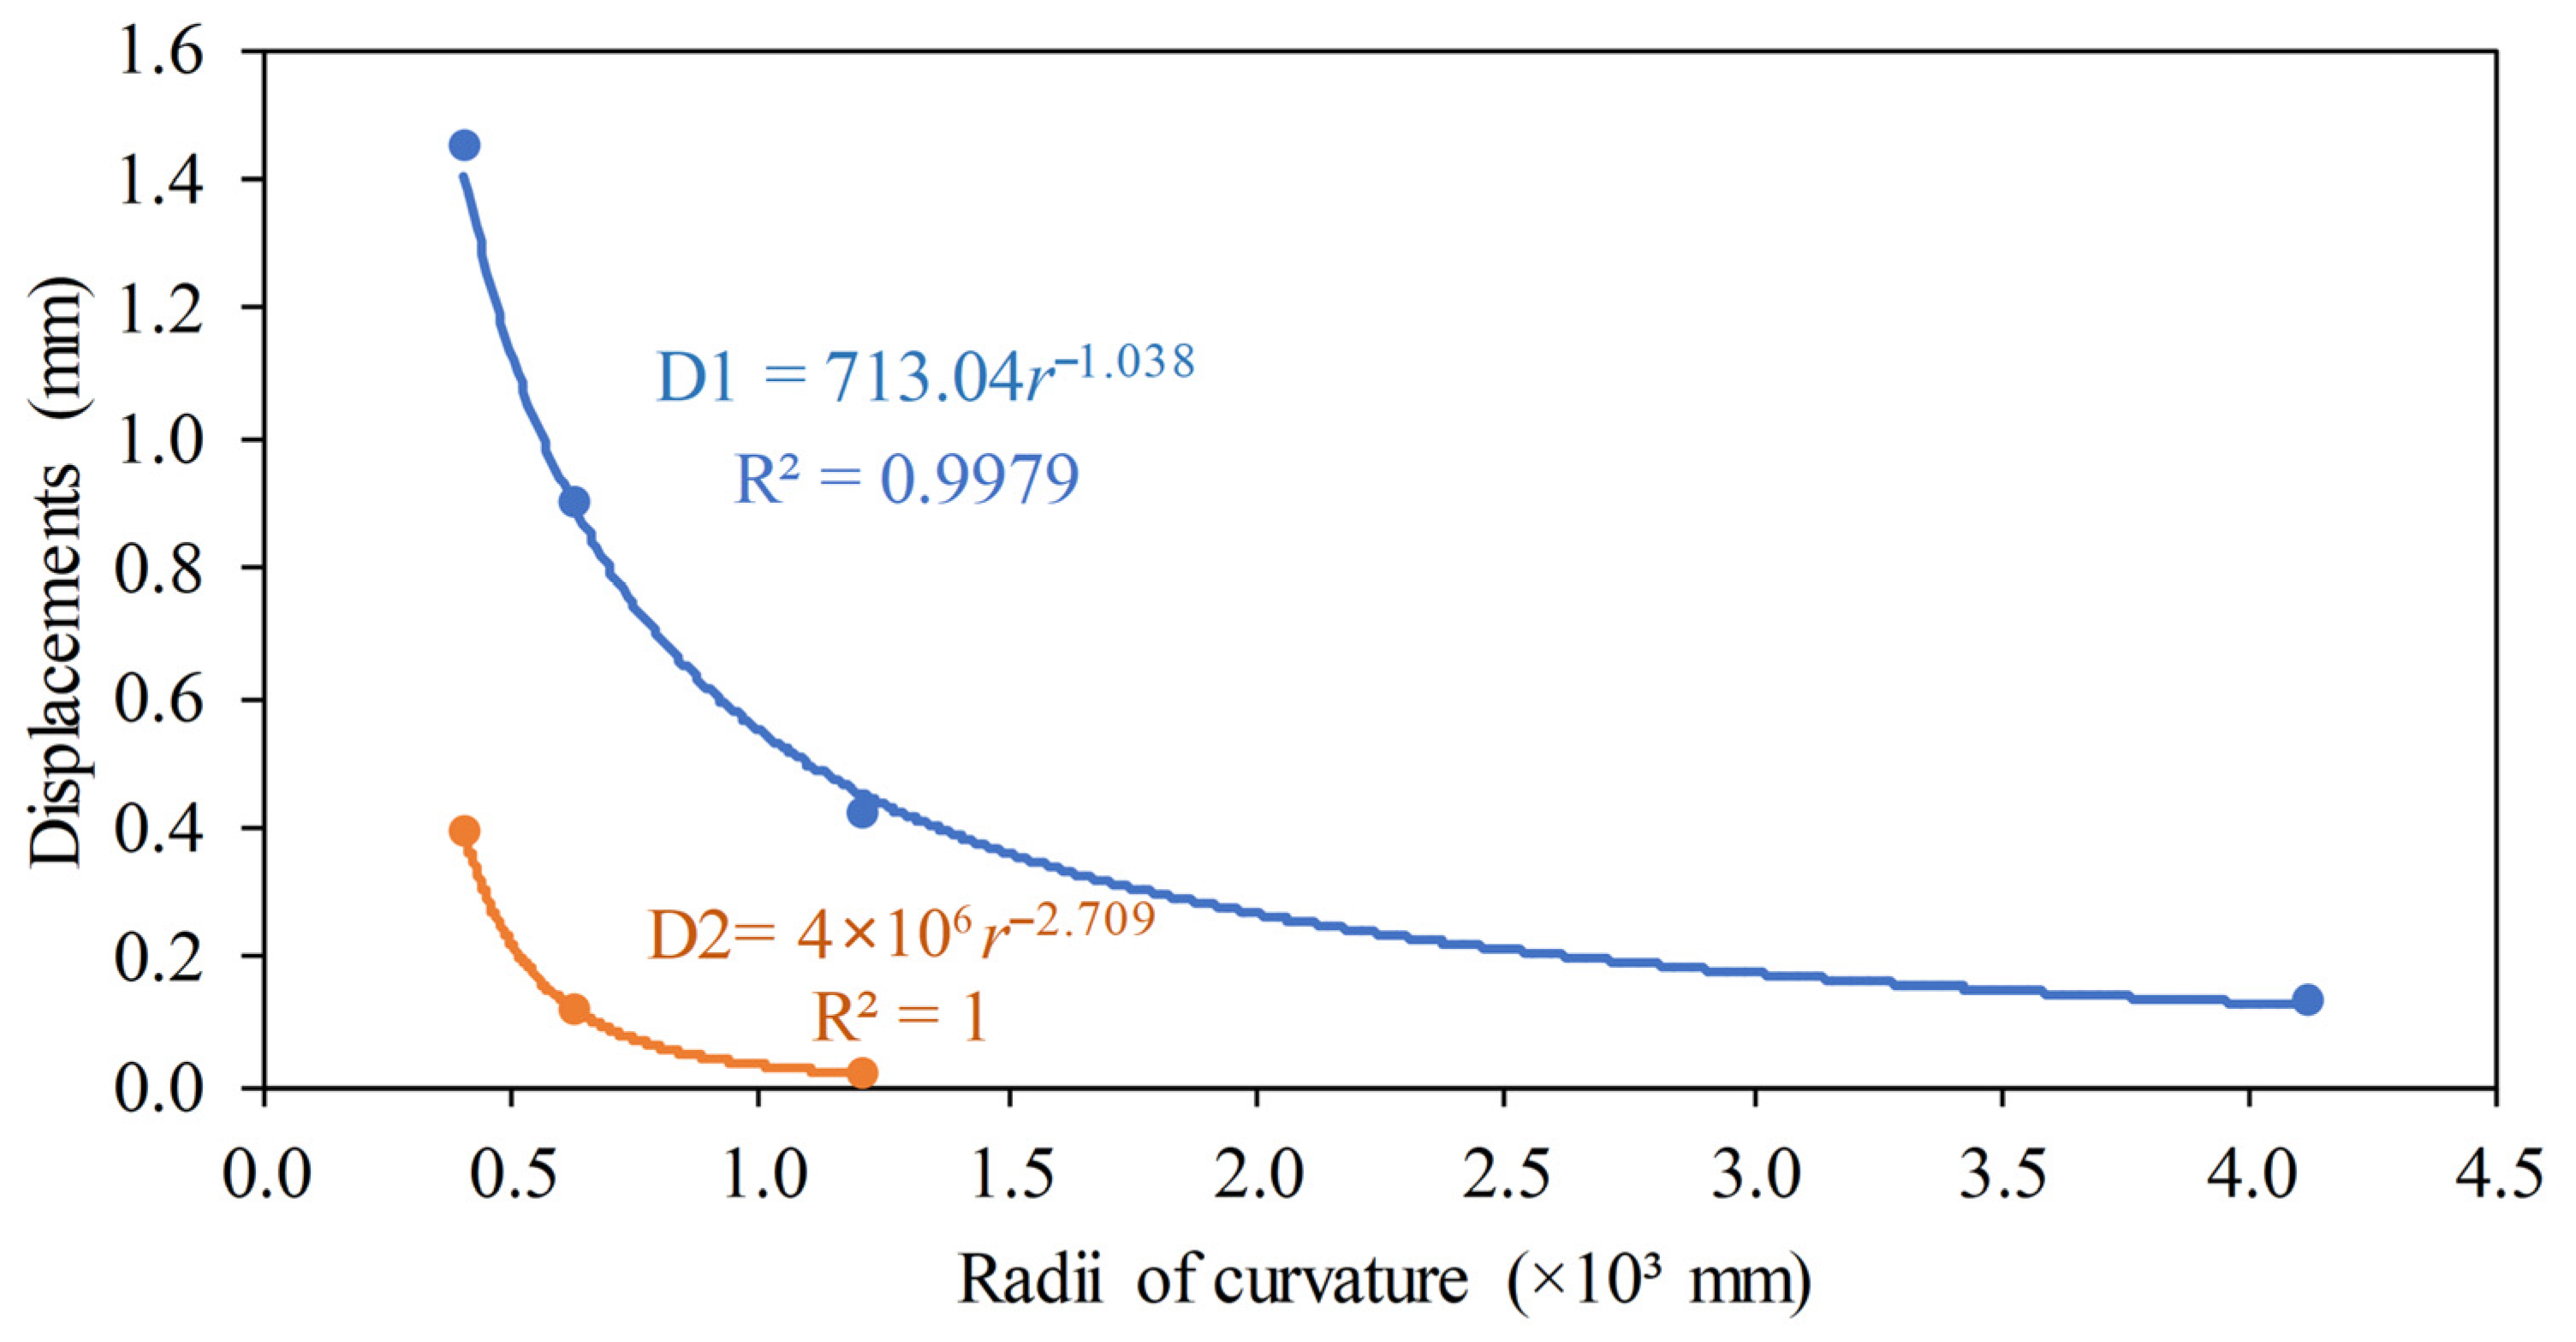
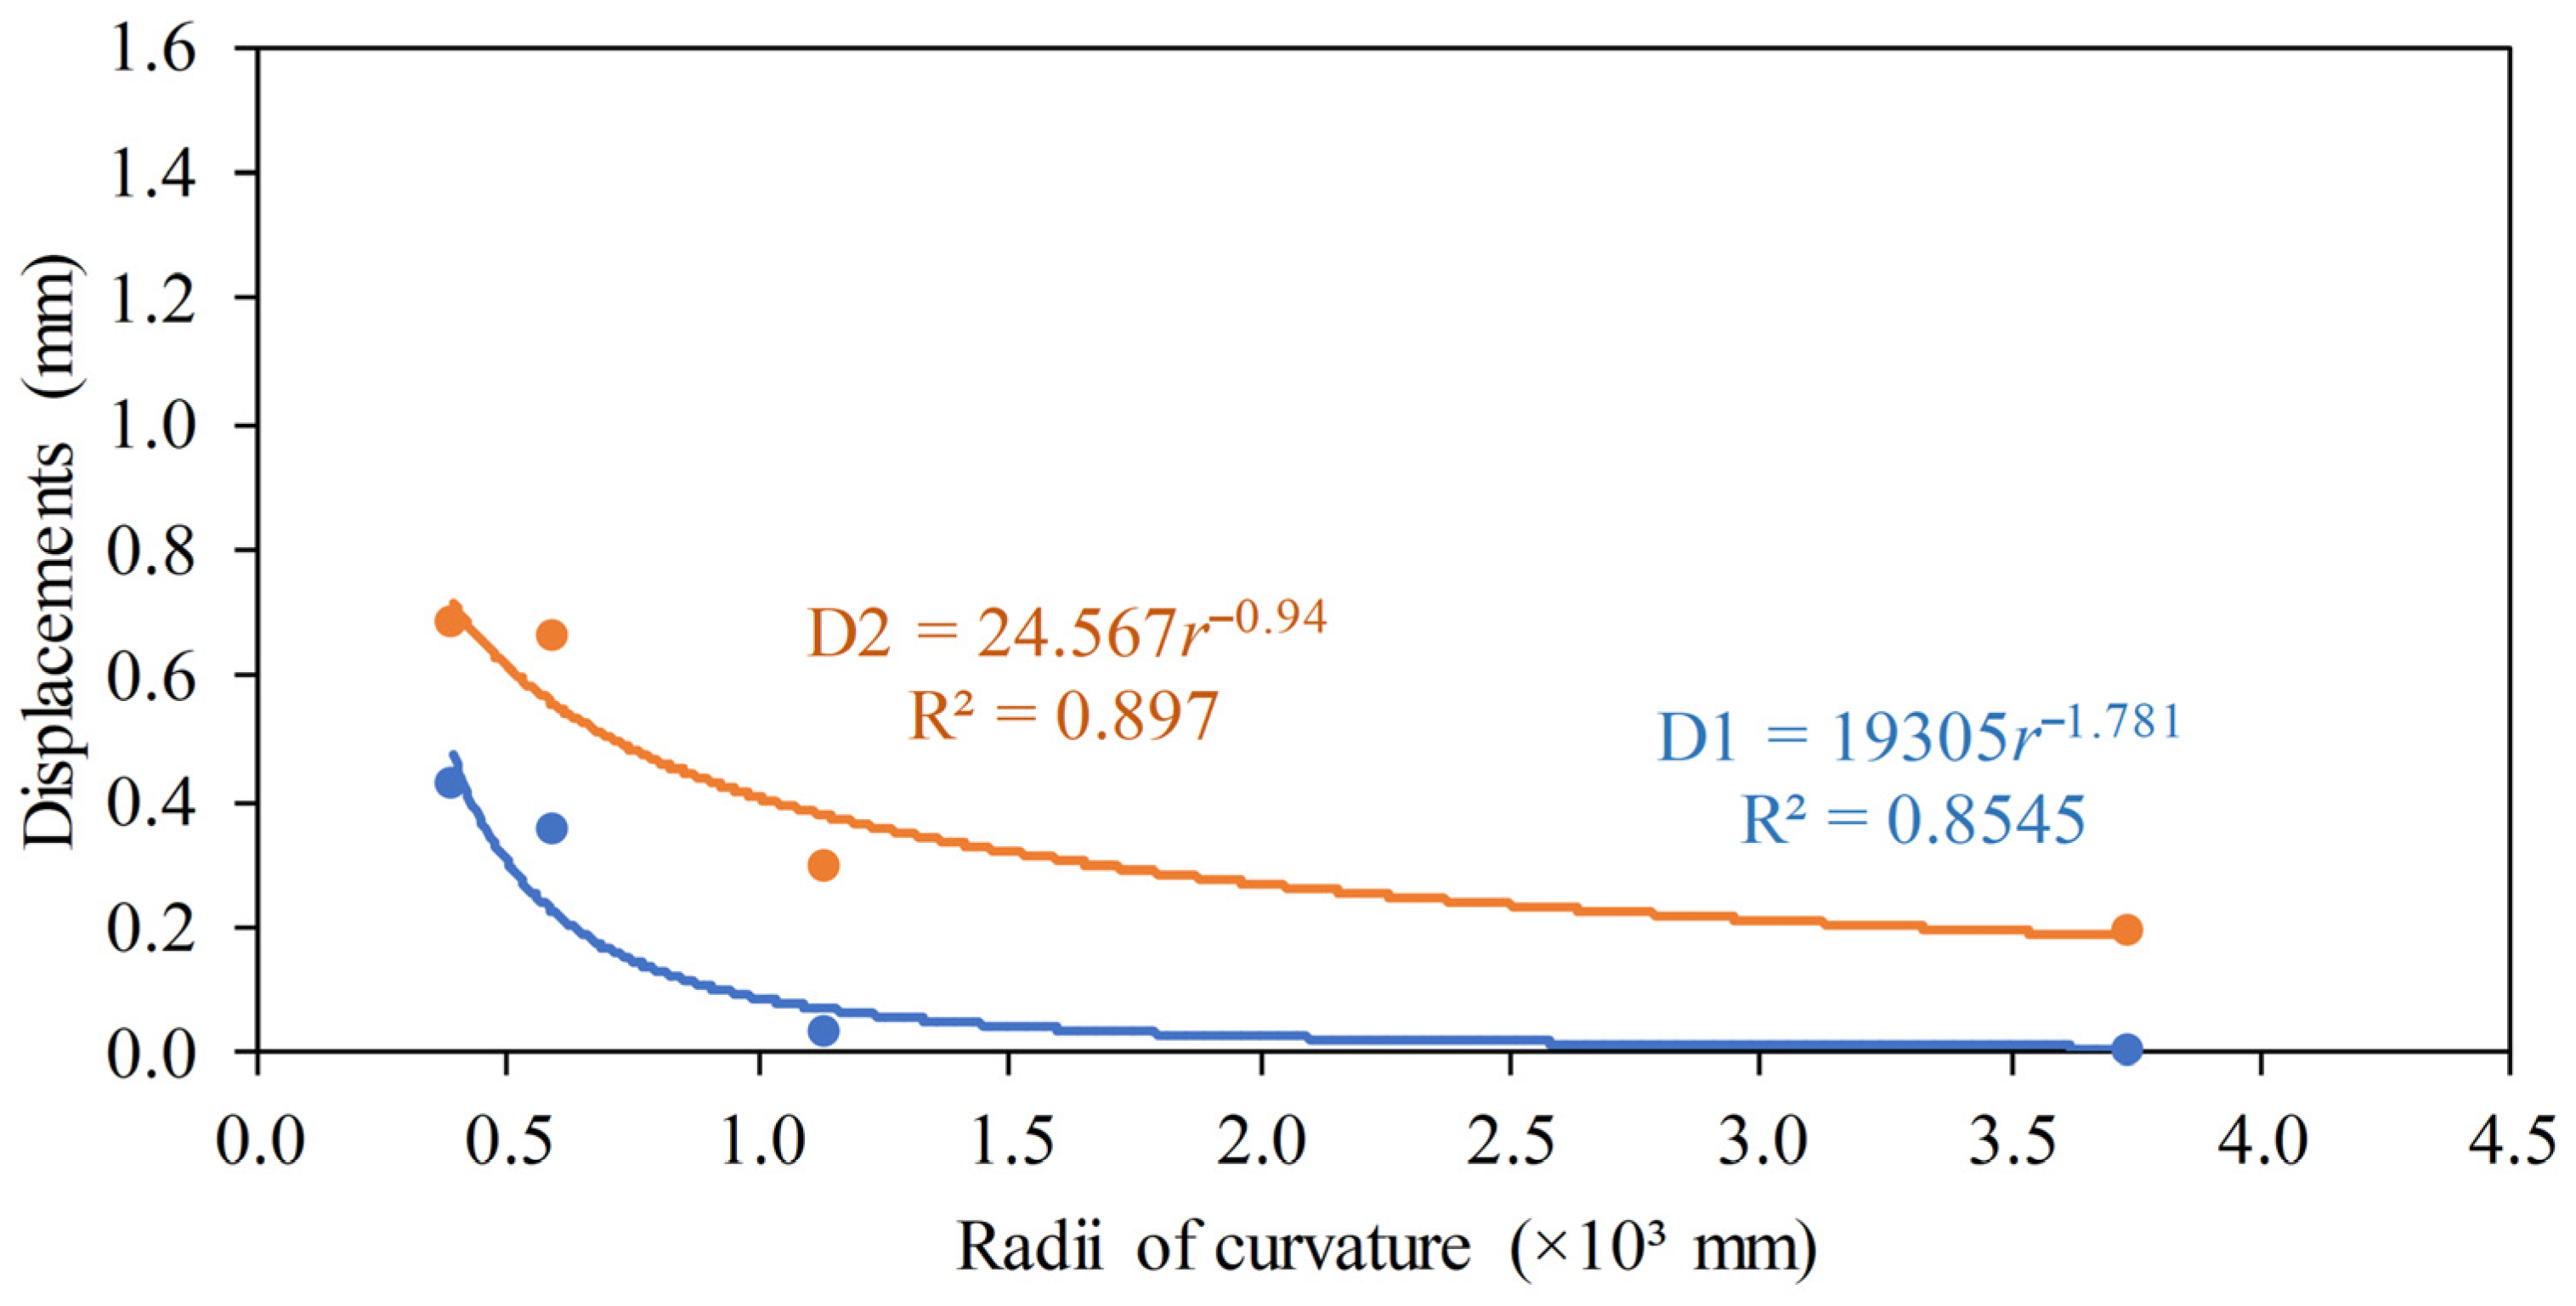
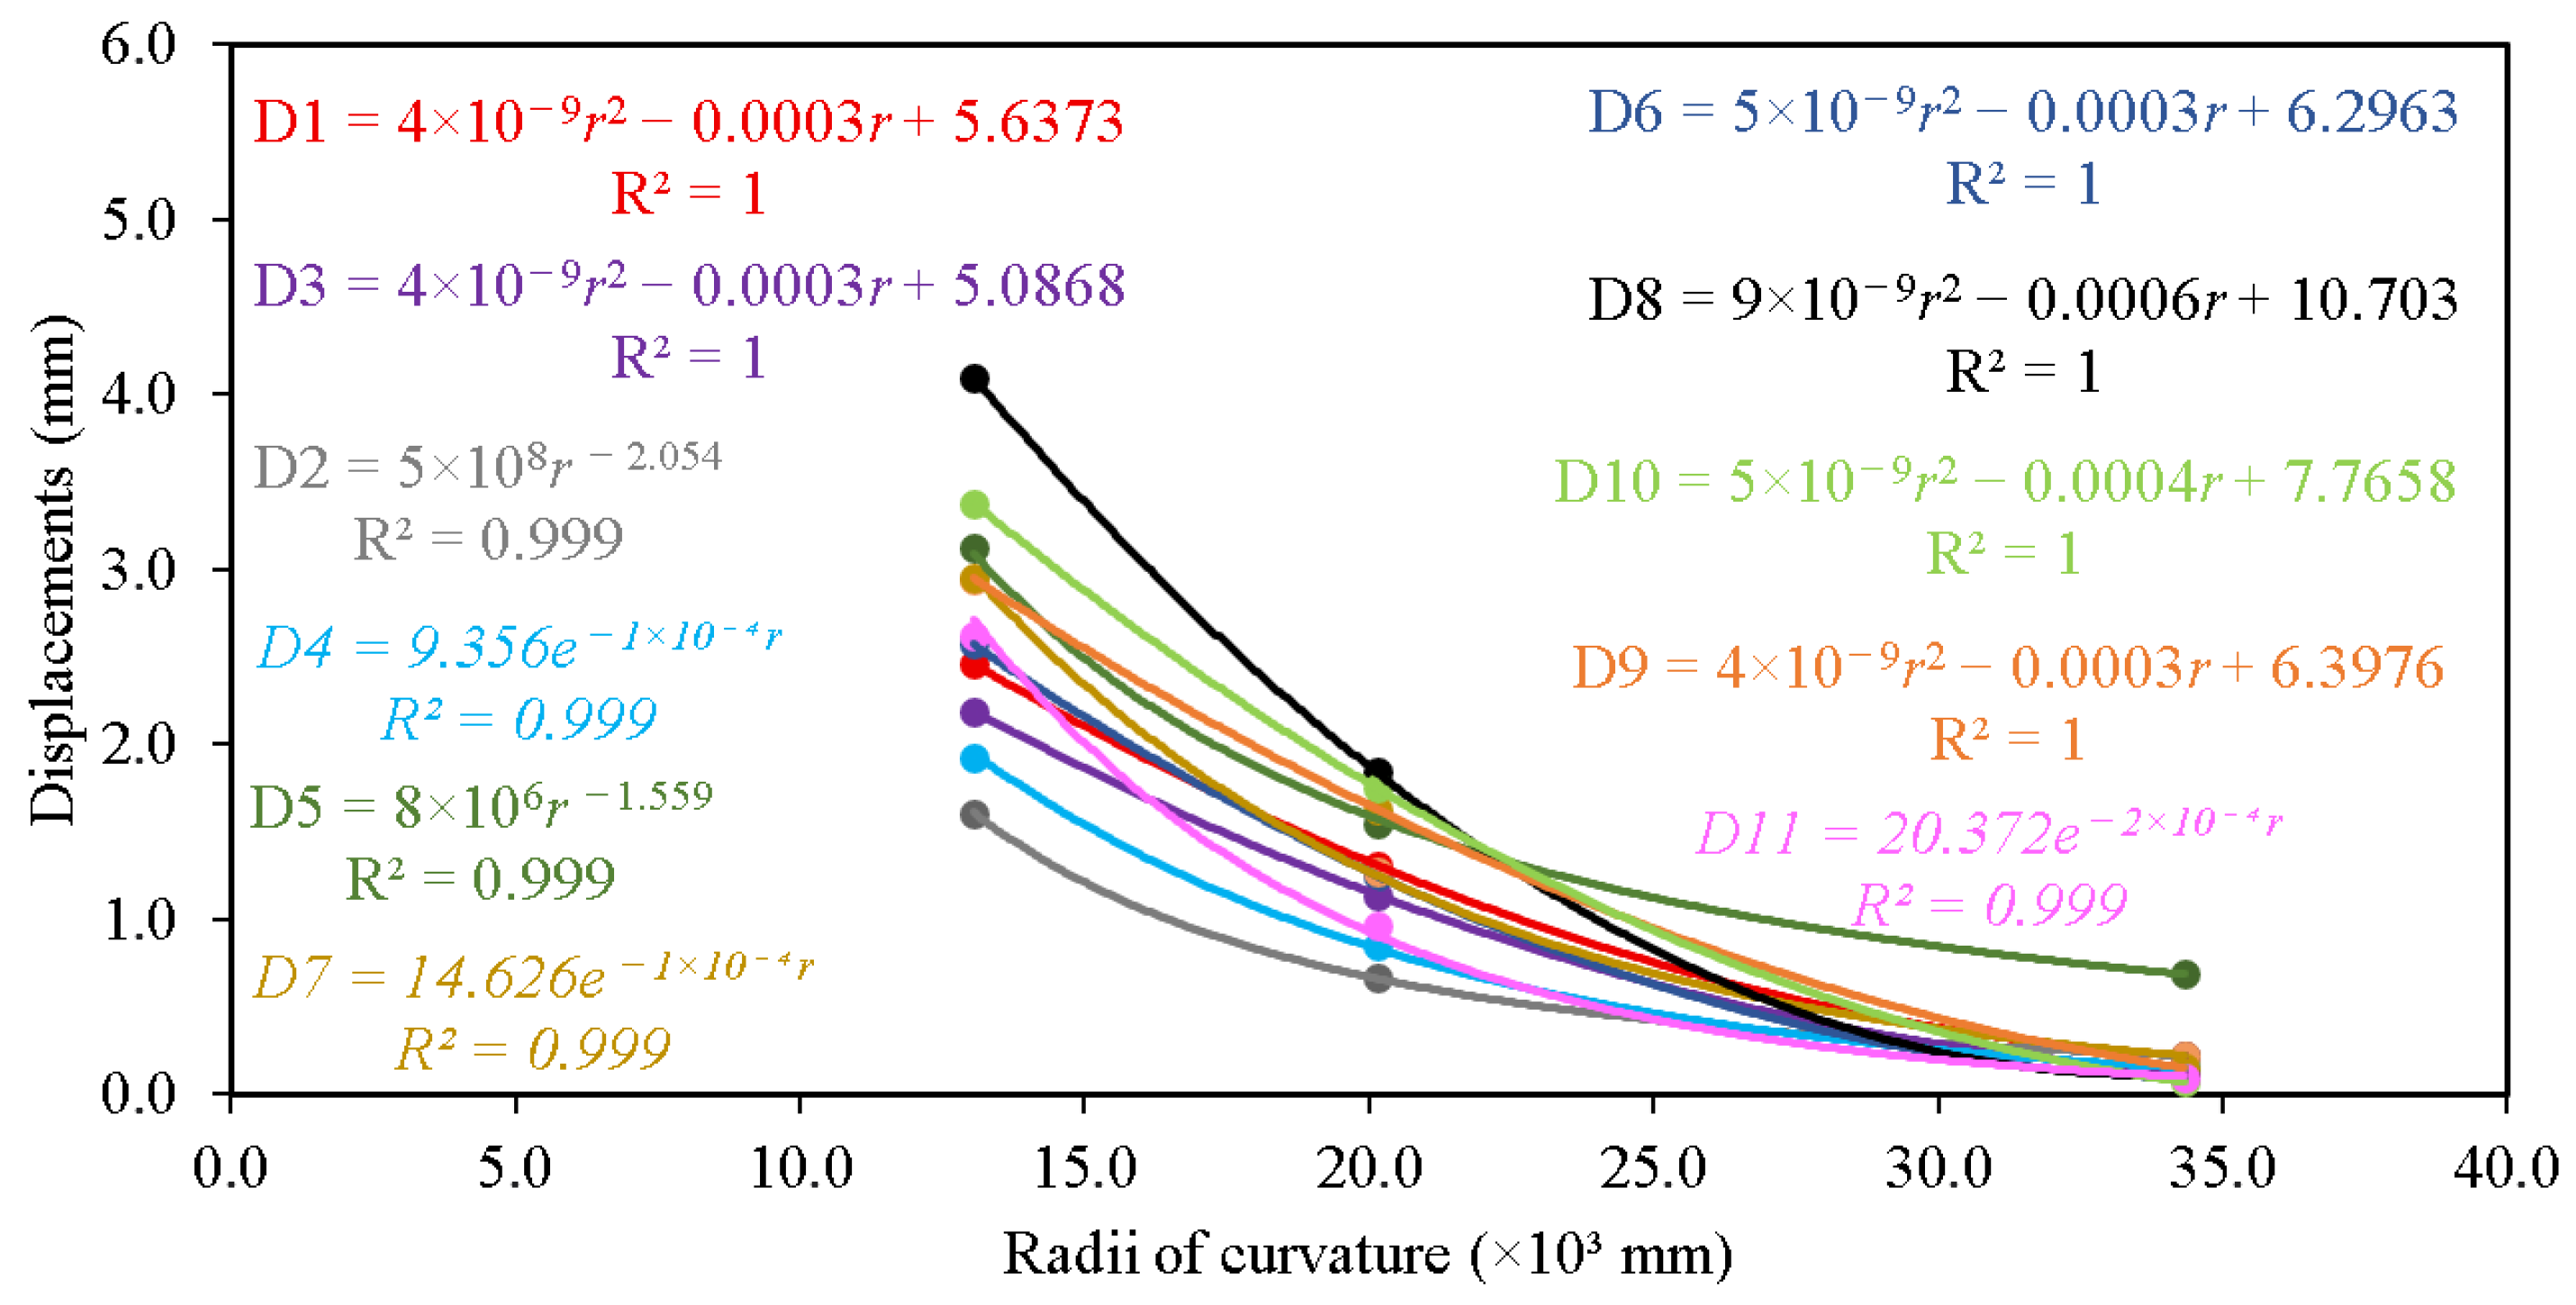
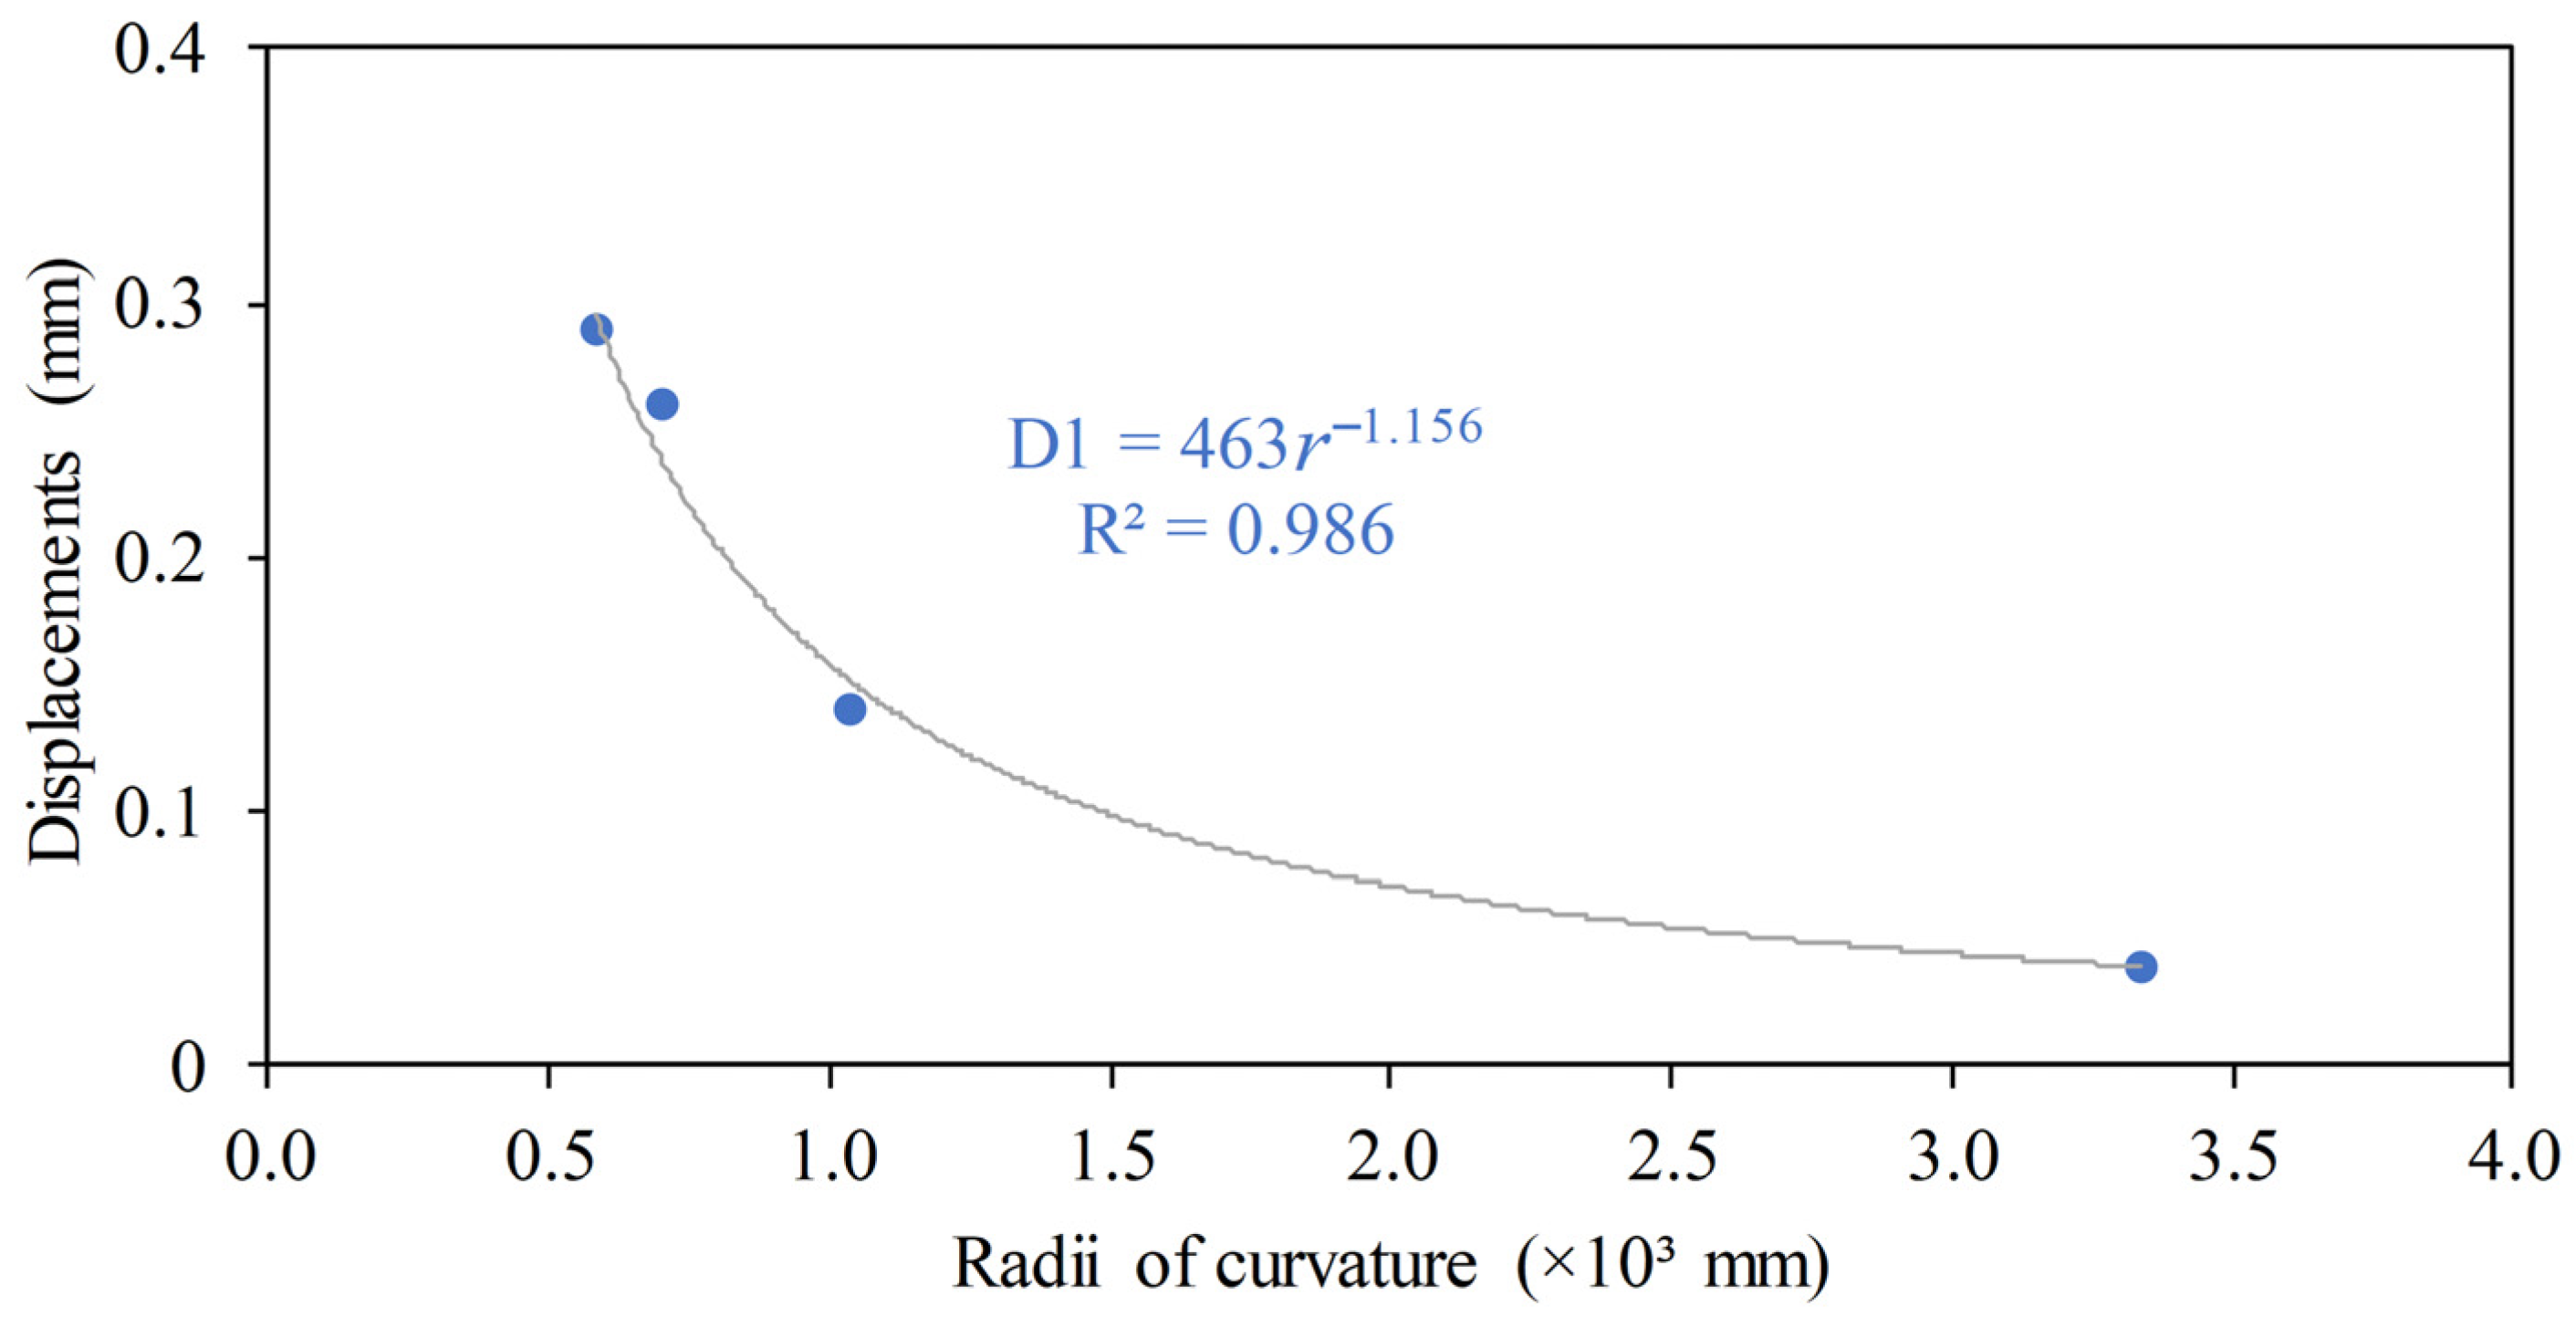
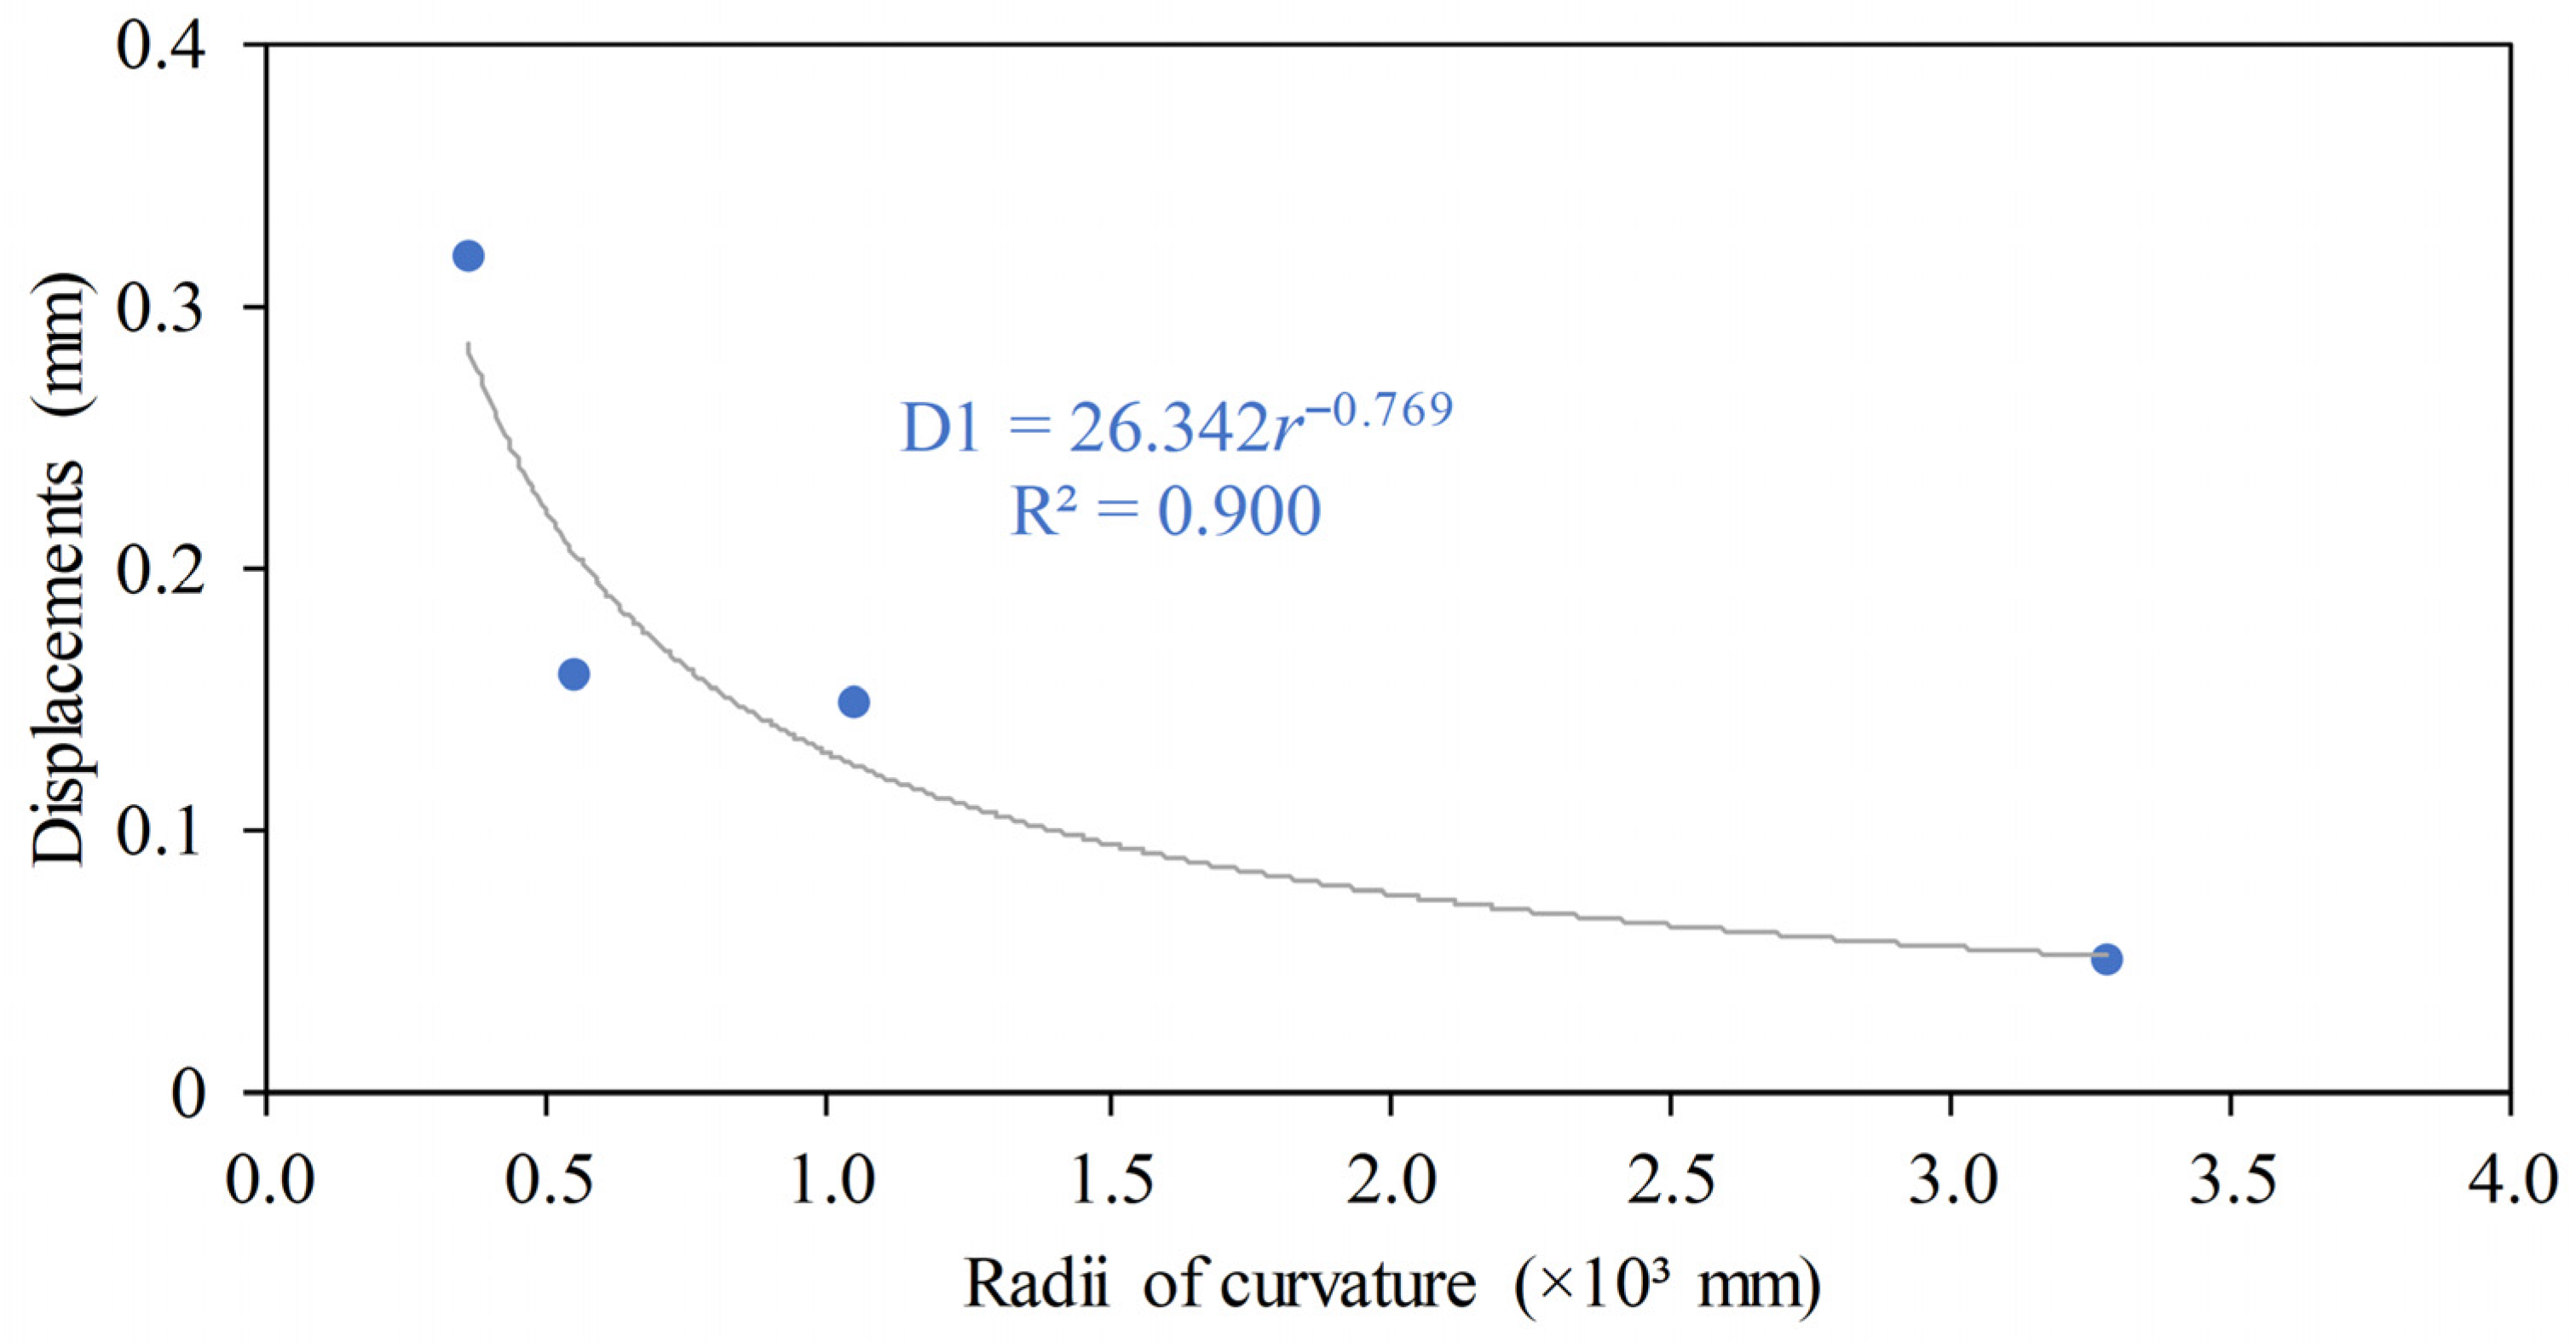
For a comprehensive understanding of the analyses presented in the next section, it is important to clarify some methodological aspects. In the result tables for each profile, the column referring to maximum displacements is associated with both the graphs and the approximate displacement prediction equations (Figures 12, 13, 19, 20, 24, 25, 29, 33, 38 and 39). The displacement values (D1, D2, D3, D4, etc.) indicated in the schematic representations refer to specific regions of the bent profile and are correlated with regression-fitted equations that describe the approximate evolution of displacements as a function of the variation in the bending radius imposed during the roll bending process.
The variable r, present in the curve-fitting equations for the displacements of each profile, represents the desired bending radius during the forming process. By inserting a specific value of r into the corresponding equation, the estimated approximate displacement value for that configuration is obtained, allowing an efficient prediction of the displacement response. It should be emphasized that the term “approximate displacement” is used because the equations were obtained through curve fitting based on the numerical simulation results for different predefined bending radii.
Still, in the result tables for each profile, the evaluation of the relationship between the maximum von Mises stress ( σ m a x v M ) and the material’s ultimate tensile strength (UTS), fixed at 290.66 MPa for the 6061-T6 aluminum alloy [54,56], stands out. This analysis allowed the determination of a safety factor for each simulated bending radius value. As described by Hibbeler [56], the UTS represents the maximum stress that a material can withstand before structural failure occurs. In turn, the von Mises stress is a measure that synthesizes the three-dimensional stress state in the material under external loadings. Thus, when the value of σ m a x v M approaches or reaches the UTS, it indicates that the material is operating at the limit of its mechanical strength, without a safety margin, signaling a high risk of failure due to yielding or structural collapse.
To reinforce the reliability of the fitted displacement equations, the coefficient of determination (R2) was calculated for each regression. The values obtained ranged from 0.85 to 1.00, with several cases achieving R2 = 1.00, indicating an exact match between the simulated data and the fitted equation. The lowest value, R2 = 0.85, still represents a strong correlation, which is noteworthy considering the highly nonlinear nature of the elastoplastic bending process, especially for complex and thin-walled cross-sections. Therefore, it can be stated that the regression models used in this study adequately capture the main displacement trends, providing a robust predictive tool for engineering applications.
Finally, it is important to mention that the numerical simulations were performed on a workstation equipped with an Intel® Core™ i7-7700 CPU and 32 GB RAM. The processing times presented in work refer to this computational platform. To ensure efficiency, mesh refinement was limited by a convergence criterion of RD ≤ 0.5%, avoiding unnecessary use of overly fine meshes. Additionally, geometric symmetries were exploited whenever possible to reduce the problem size. For industrial applications, further reductions in computational cost could be achieved through the use of adaptive meshing strategies, simplified geometric representations, or parallel computing resources.

3. Results and Discussions

This section is divided into two parts: the first presents the outcomes of the validation and verification procedures, and the second discusses the results of the case study.

3.1. Validation and Verification Results

As earlier mentioned, a first validation of the proposed computational model was performed by Moreira et al. [23], based on an experimental study of an I-shaped steel profile developed by Spoorenberg et al. [33]. Additionally, in the present work, a new validation and a verification were based on the results reported by Song et al. [53] for the three-roll bending process of an aluminum profile. Validation used their experimental data, while verification relied on their numerical results, which were obtained using the finite element software ABAQUS (version 2023).
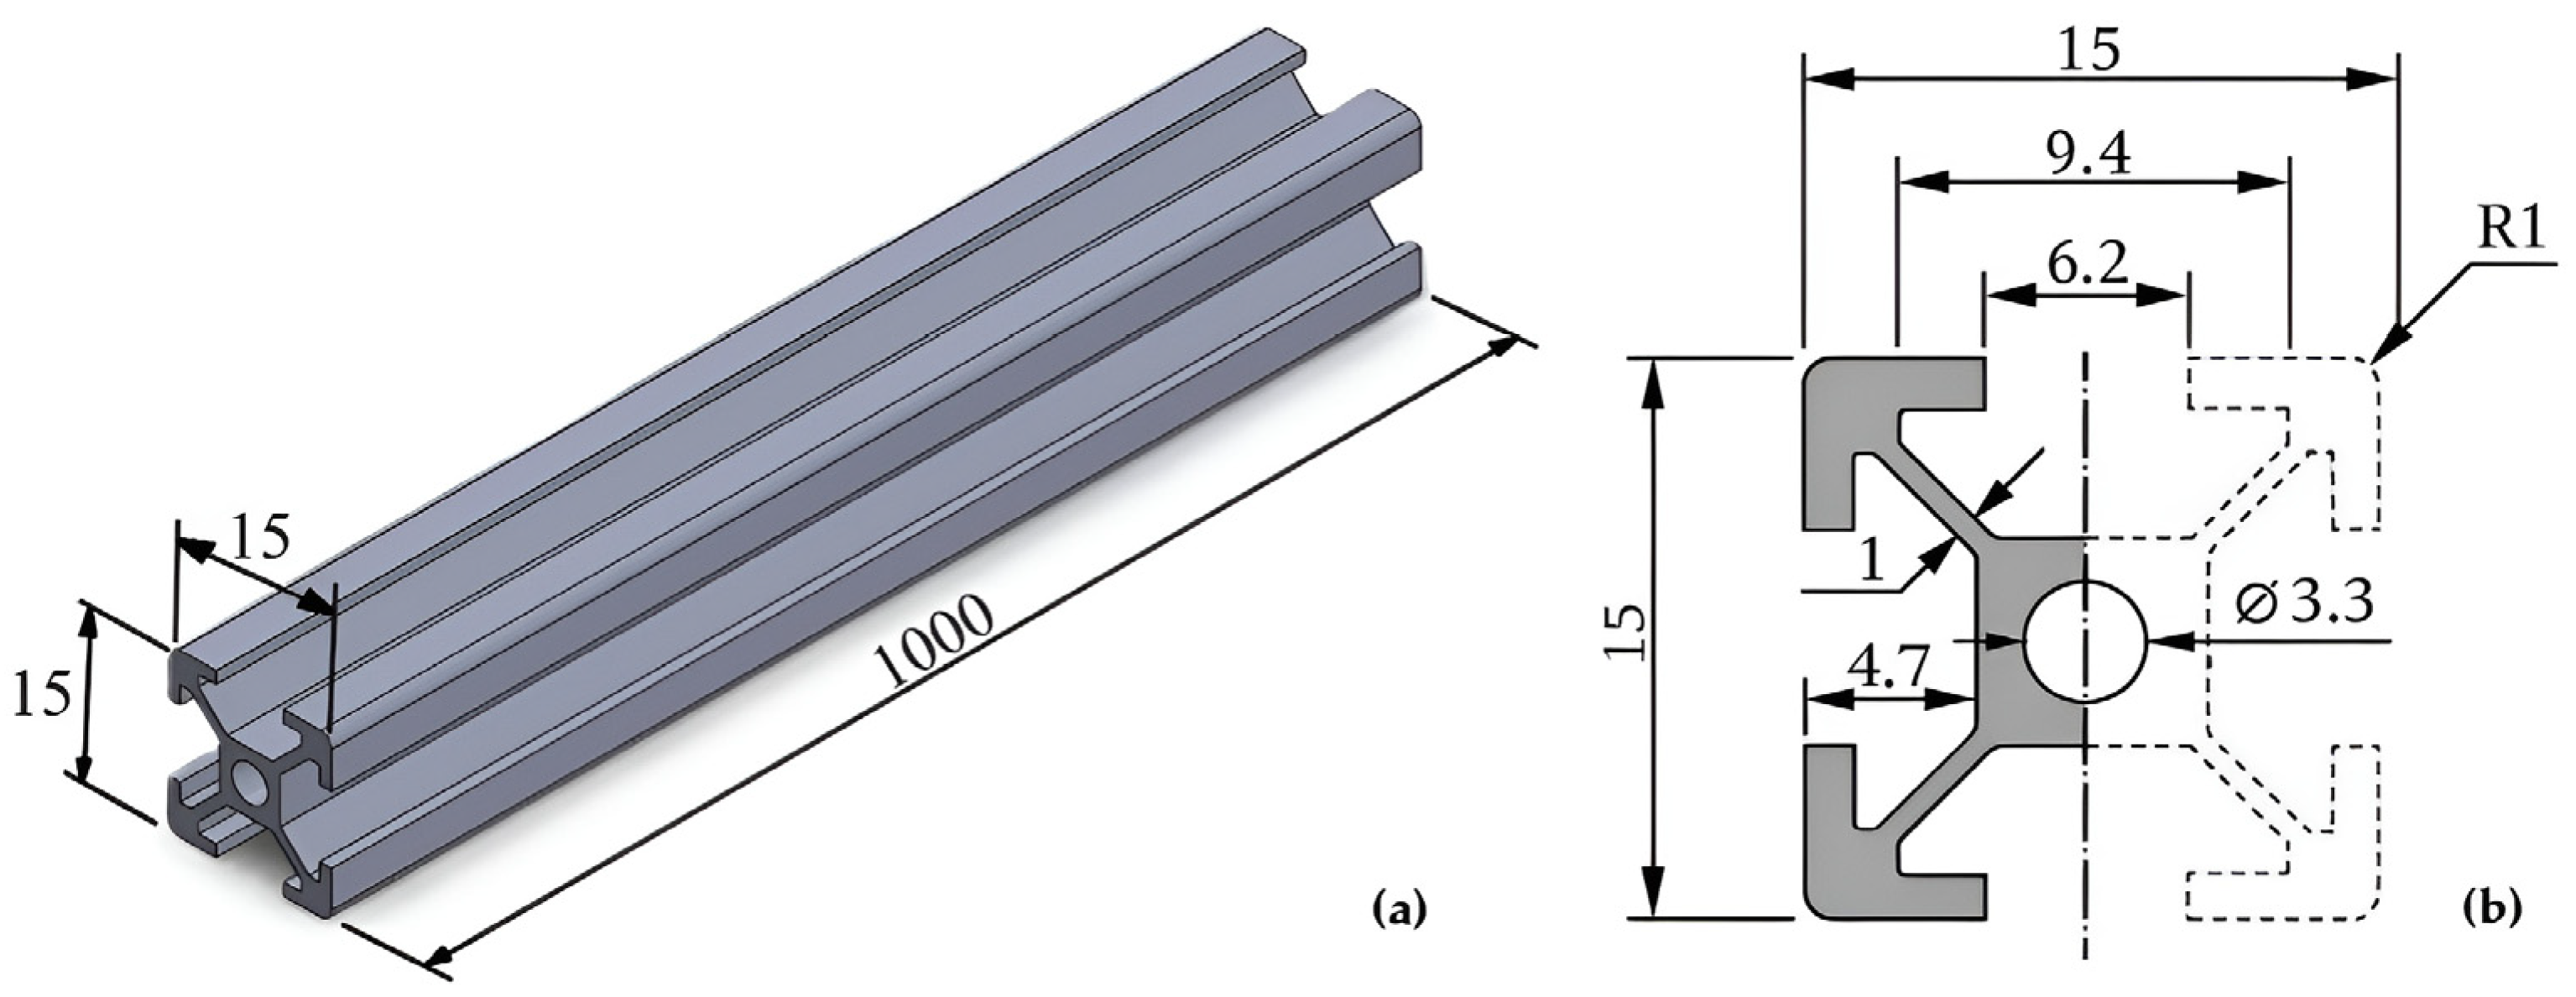
According Song et al. [53], the experimental sample was defined in agreement with the European standard aluminum profile with a cross-section size of 15 mm × 15 mm and a length of 1000 mm, as illustrated in Figure 7. The aluminum alloy 6063-T5 was used, with the following mechanical properties: density of 2700 kg/m3, Young’s modulus of 71 GPa, Poisson’s ratio of 0.33, and yield strength of 156 MPa. The upper roller has a diameter of 155 mm, while the two lower rollers have a diameter of 145 mm. The initial lower roller center distance was 382 mm. Six different vertical displacement values for the upper roller in the three-roll bending process were analyzed, ranging from 15 mm to 40 mm in 5 mm increments.
The proposed computational model was employed to numerically simulate the three-roll bending process of the profile, considering the symmetry boundary condition (see Figure 7b). The computational domain was discretized using SOLID187 tetrahedral finite elements. To achieve a mesh-independent solution, a convergence test was conducted for the case with 30 mm vertical displacement of the upper roller, and the results are presented in Table 1.
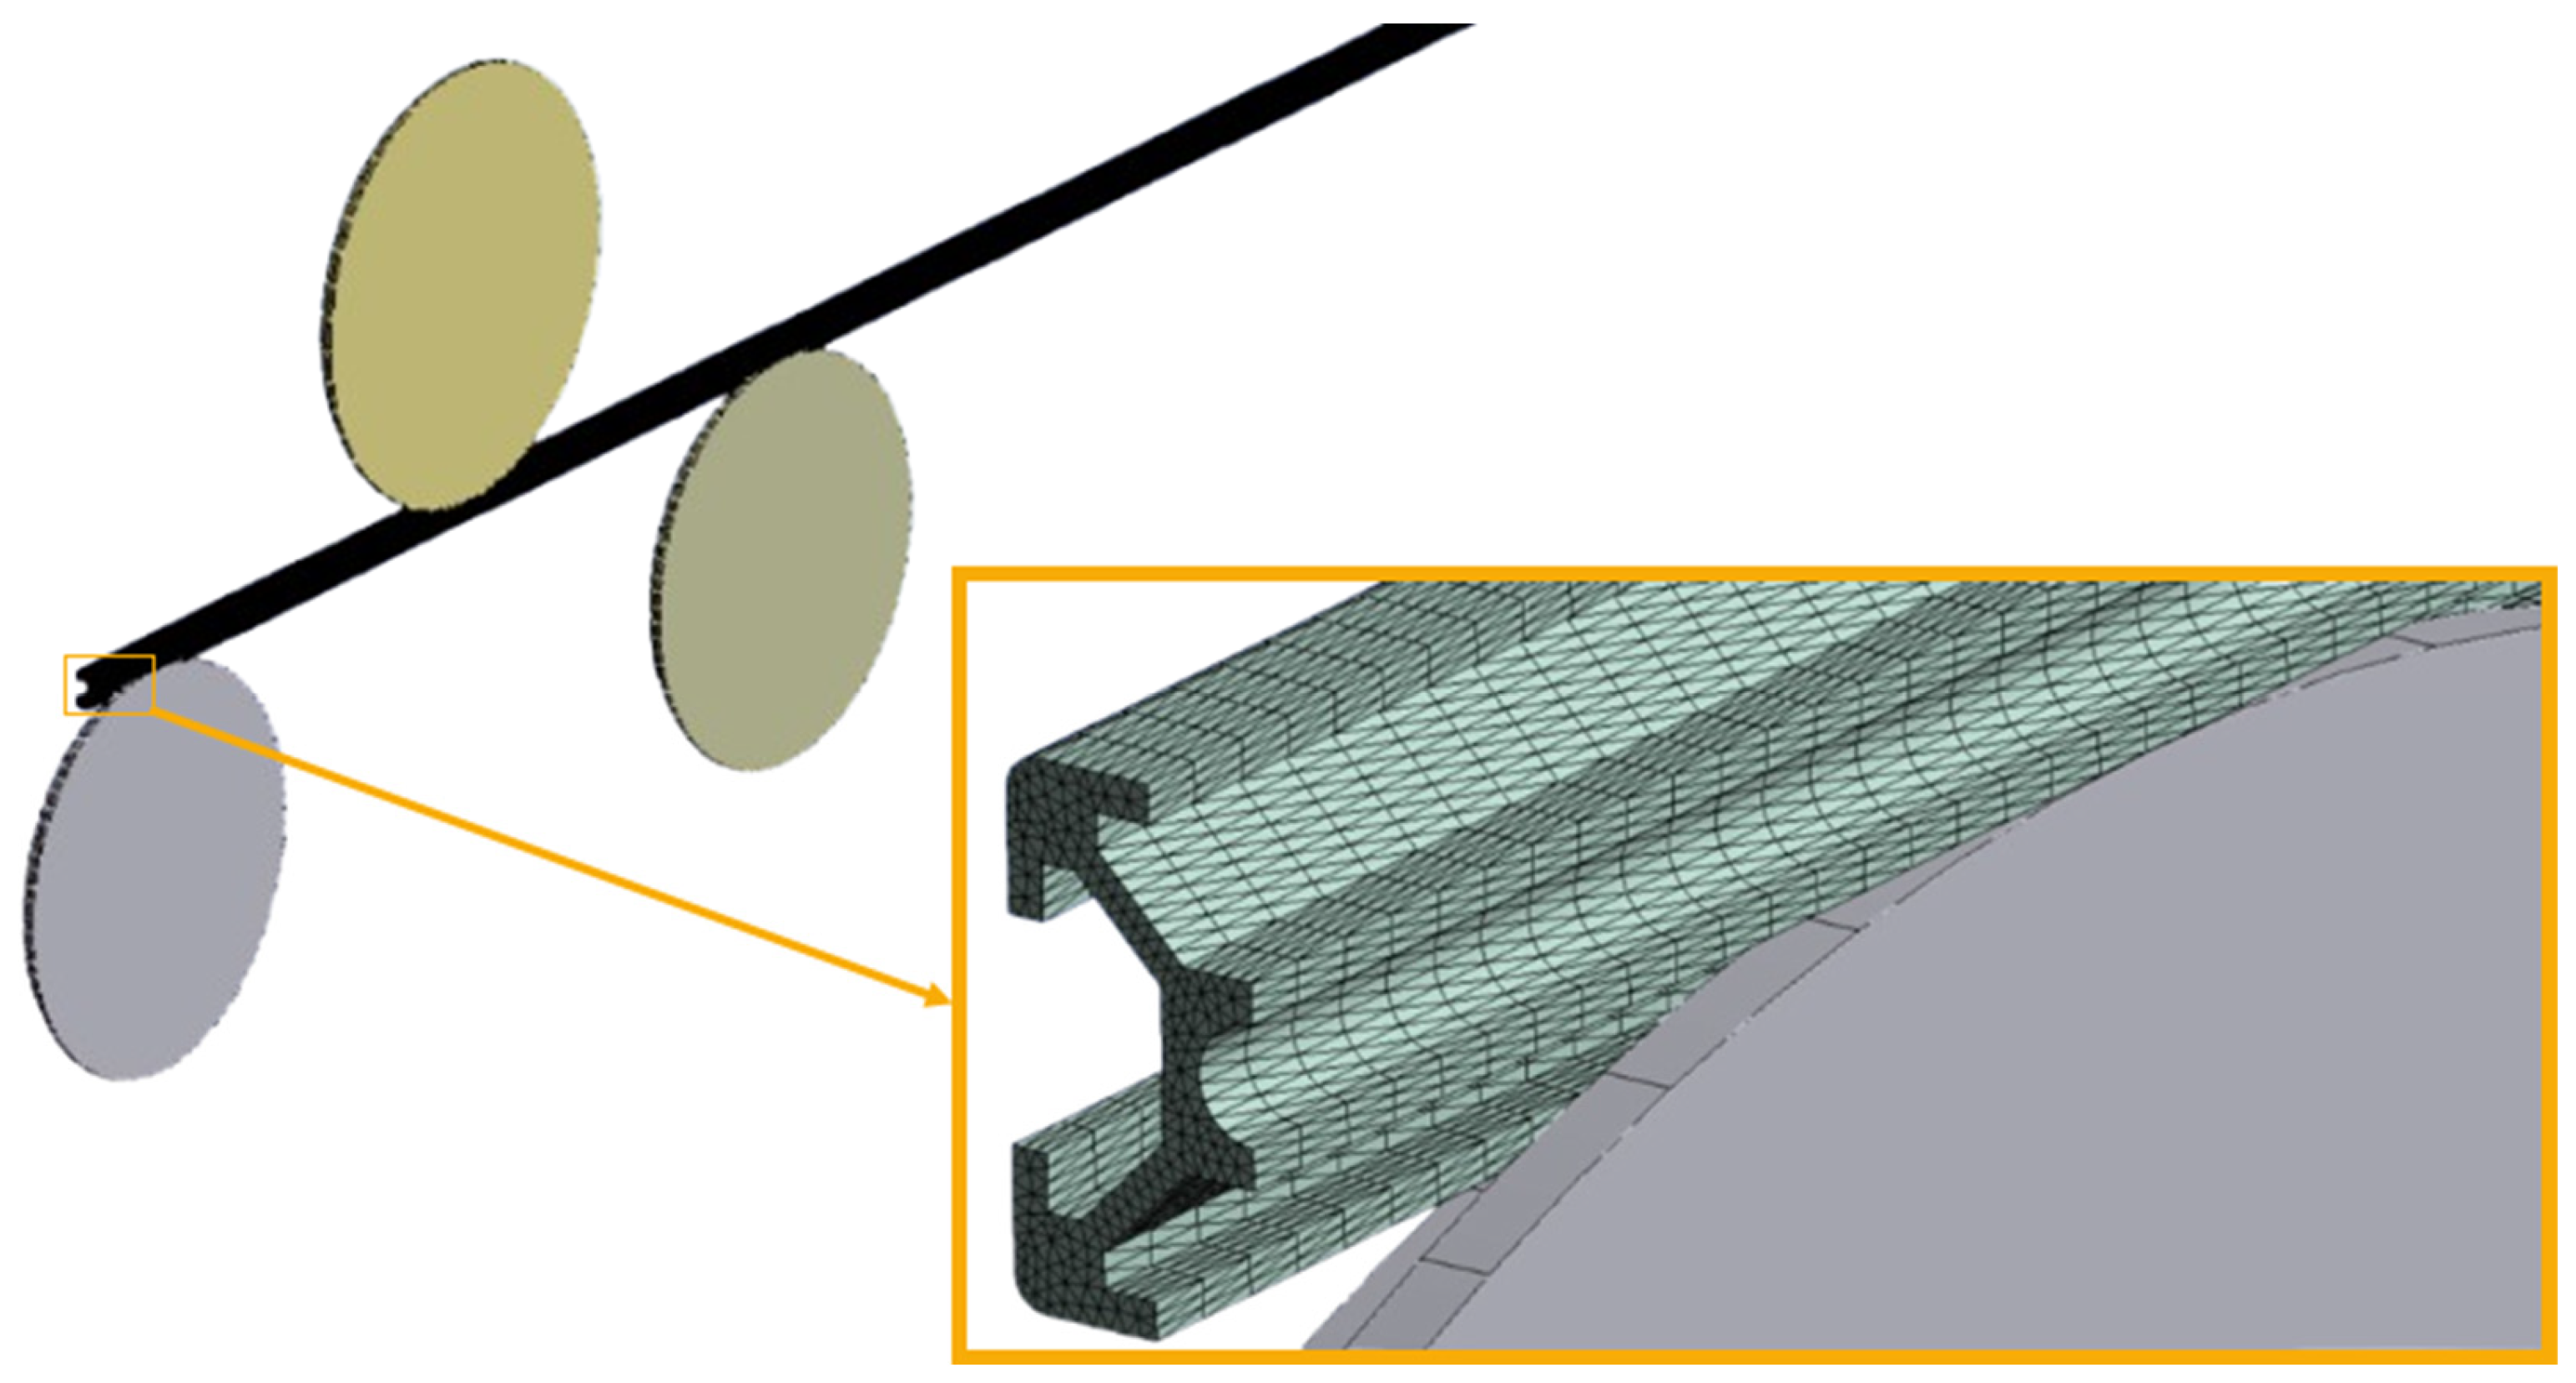
One can observe in Table 1 that the mesh with 261,271 finite elements achieved an absolute successive difference of 0.17% for the forming radius, indicating that the obtained numerical result is mesh-independent. Therefore, this spatial discretization was adopted for all cases considered in the validation and verification procedures. Figure 8 illustrates the computational domain along with a detail of the converged mesh.
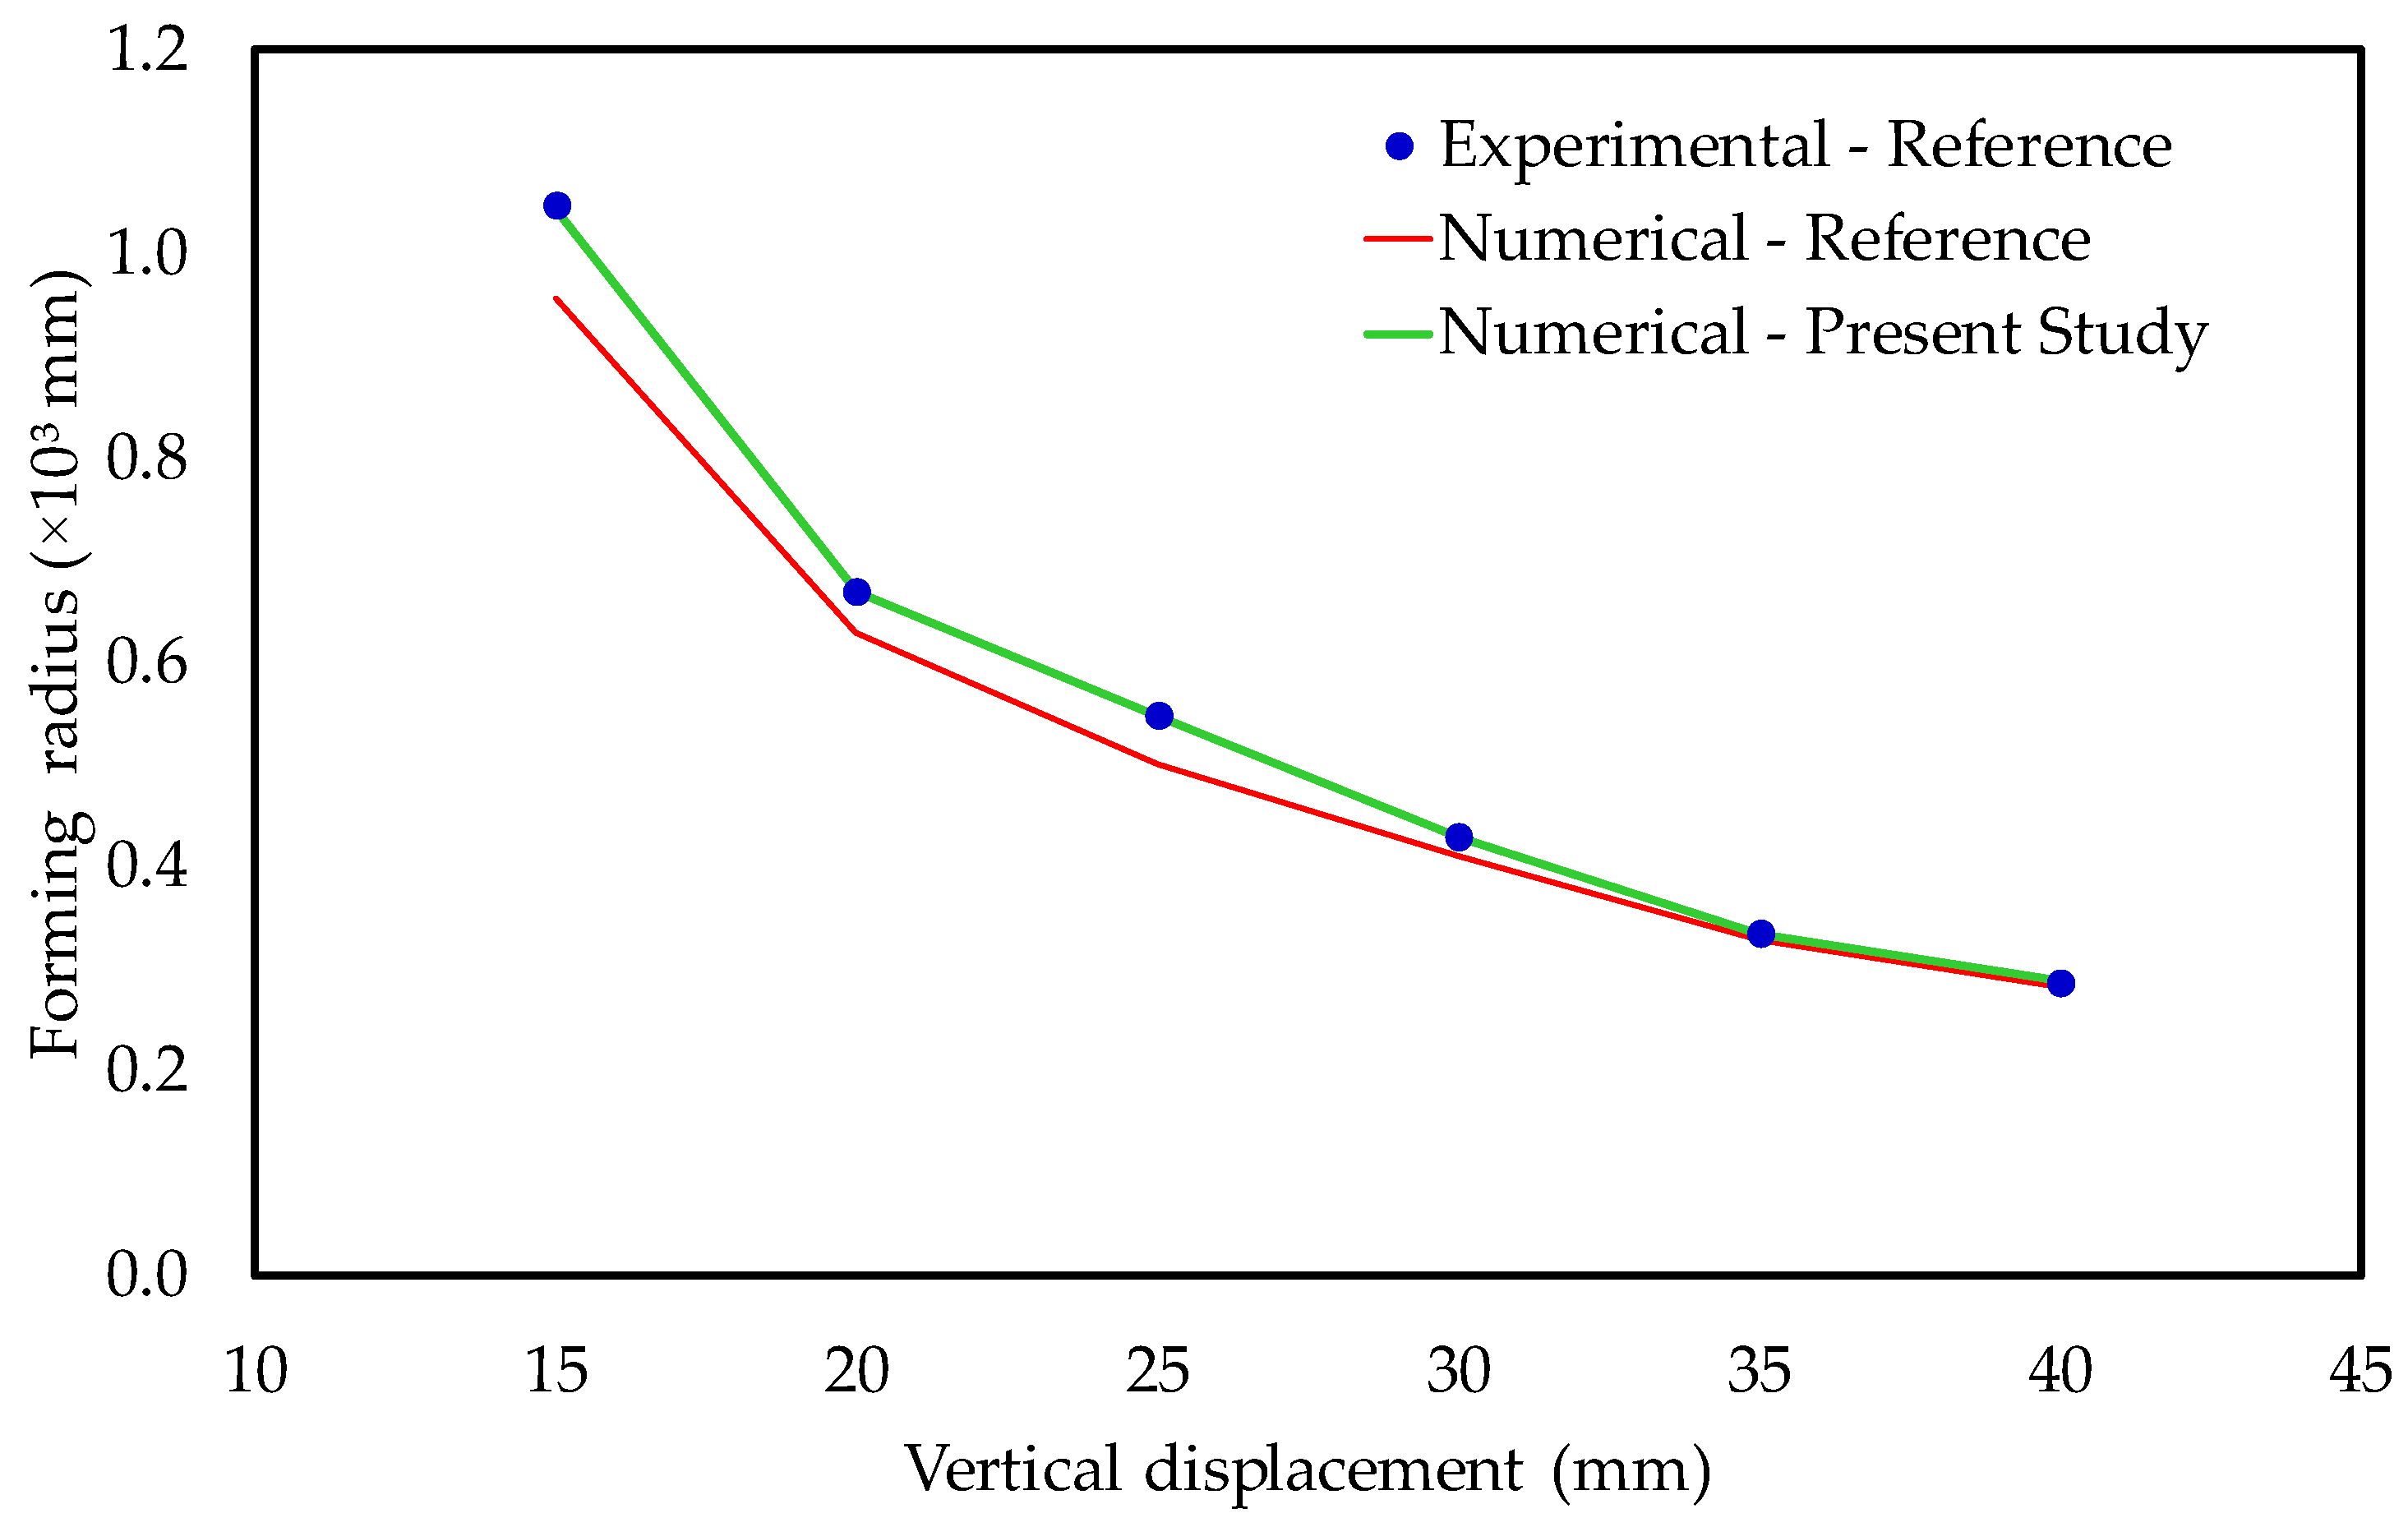
Then, the obtained numerical results for the forming radius were compared both with experimental data and with numerical results reported by Song et al. [53], using a graphical representation (Figure 9) to provide a qualitative visualization, and a tabular representation (Table 2) to enable a quantitative analysis. In Table 2, when the comparison is made with experimental data, the relative error is calculated; when the comparison is made with numerical reference results, the relative difference is determined. For the sake of terminological consistency throughout the paper, both comparisons will be referred to as relative deviation (RDev), given by:
R D e v =   O R R R R R × 100 ,
where OR is the obtained result with the proposed computational model and RR is the reference result (experimental or numerical).
From Figure 9, one can observe that the results from the present study closely follow the experimental trend, with small deviations across the range of vertical displacements. This agreement indicates a consistent validation of the numerical model, as the proposed computational model accurately reproduces the experimental behavior in terms of forming radius. Furthermore, when comparing the present numerical results with the reference numerical results, a similar response is observed throughout the entire range. This consistency confirms the verification of the model, showing that the present implementation is capable of reproducing previously established numerical results with fidelity. Overall, both the validation (against experimental data) and verification (against numerical data) demonstrate the reliability and accuracy of the proposed numerical model.
In turn, Table 2 allows a quantitative understanding of the obtained results. The comparison between the results of the present study and the experimental data (validation) shows relative deviations consistently below 0.5% in magnitude, with the highest deviation being −0.47% at a vertical displacement of 30 mm. This indicates excellent agreement with the experimental data of Song et al. [53]. On the other hand, the comparison with the numerical results from the reference (verification) reveals relative deviations ranging from 1.88% to 9.36%, which are significantly higher than those observed in the validation.
In summary, these results confirm not only the correctness of the present implementation (verification), but also demonstrate its excellent agreement with the experimental data (validation). Therefore, the proposed computational model is considered suitable for use in the numerical simulation of the three-roll bending process of aluminum profiles, based on its consistent performance in the verification procedure and, more importantly, its outstanding validation results.

3.2. Case Study Results

Before presenting the results for each profile, it is important to highlight a general trend that is intrinsic to the three-roll bending process. As the bending radius (r) decreases, both the von Mises stress and the displacements increase systematically, since smaller radii require larger plastic deformations and higher stress levels to achieve curvature. This behavior was consistently observed across all geometries and, therefore, will not be repeated in the discussion of each individual profile. Instead, the following subsections focus on the specific mechanical responses and distinctive features of each profile.

3.2.1. Numerical Analysis of the Mechanical Behavior of Profile 1 in Direction 1 (Vertical) and Direction 2 (Horizontal)

Table 3 presents the results of the mesh convergence test for Profile 1. It is observed that, from the mesh with 13,255 elements onward, the RD value is less than 0.50%, ensuring accuracy in the results without excessive computational cost.
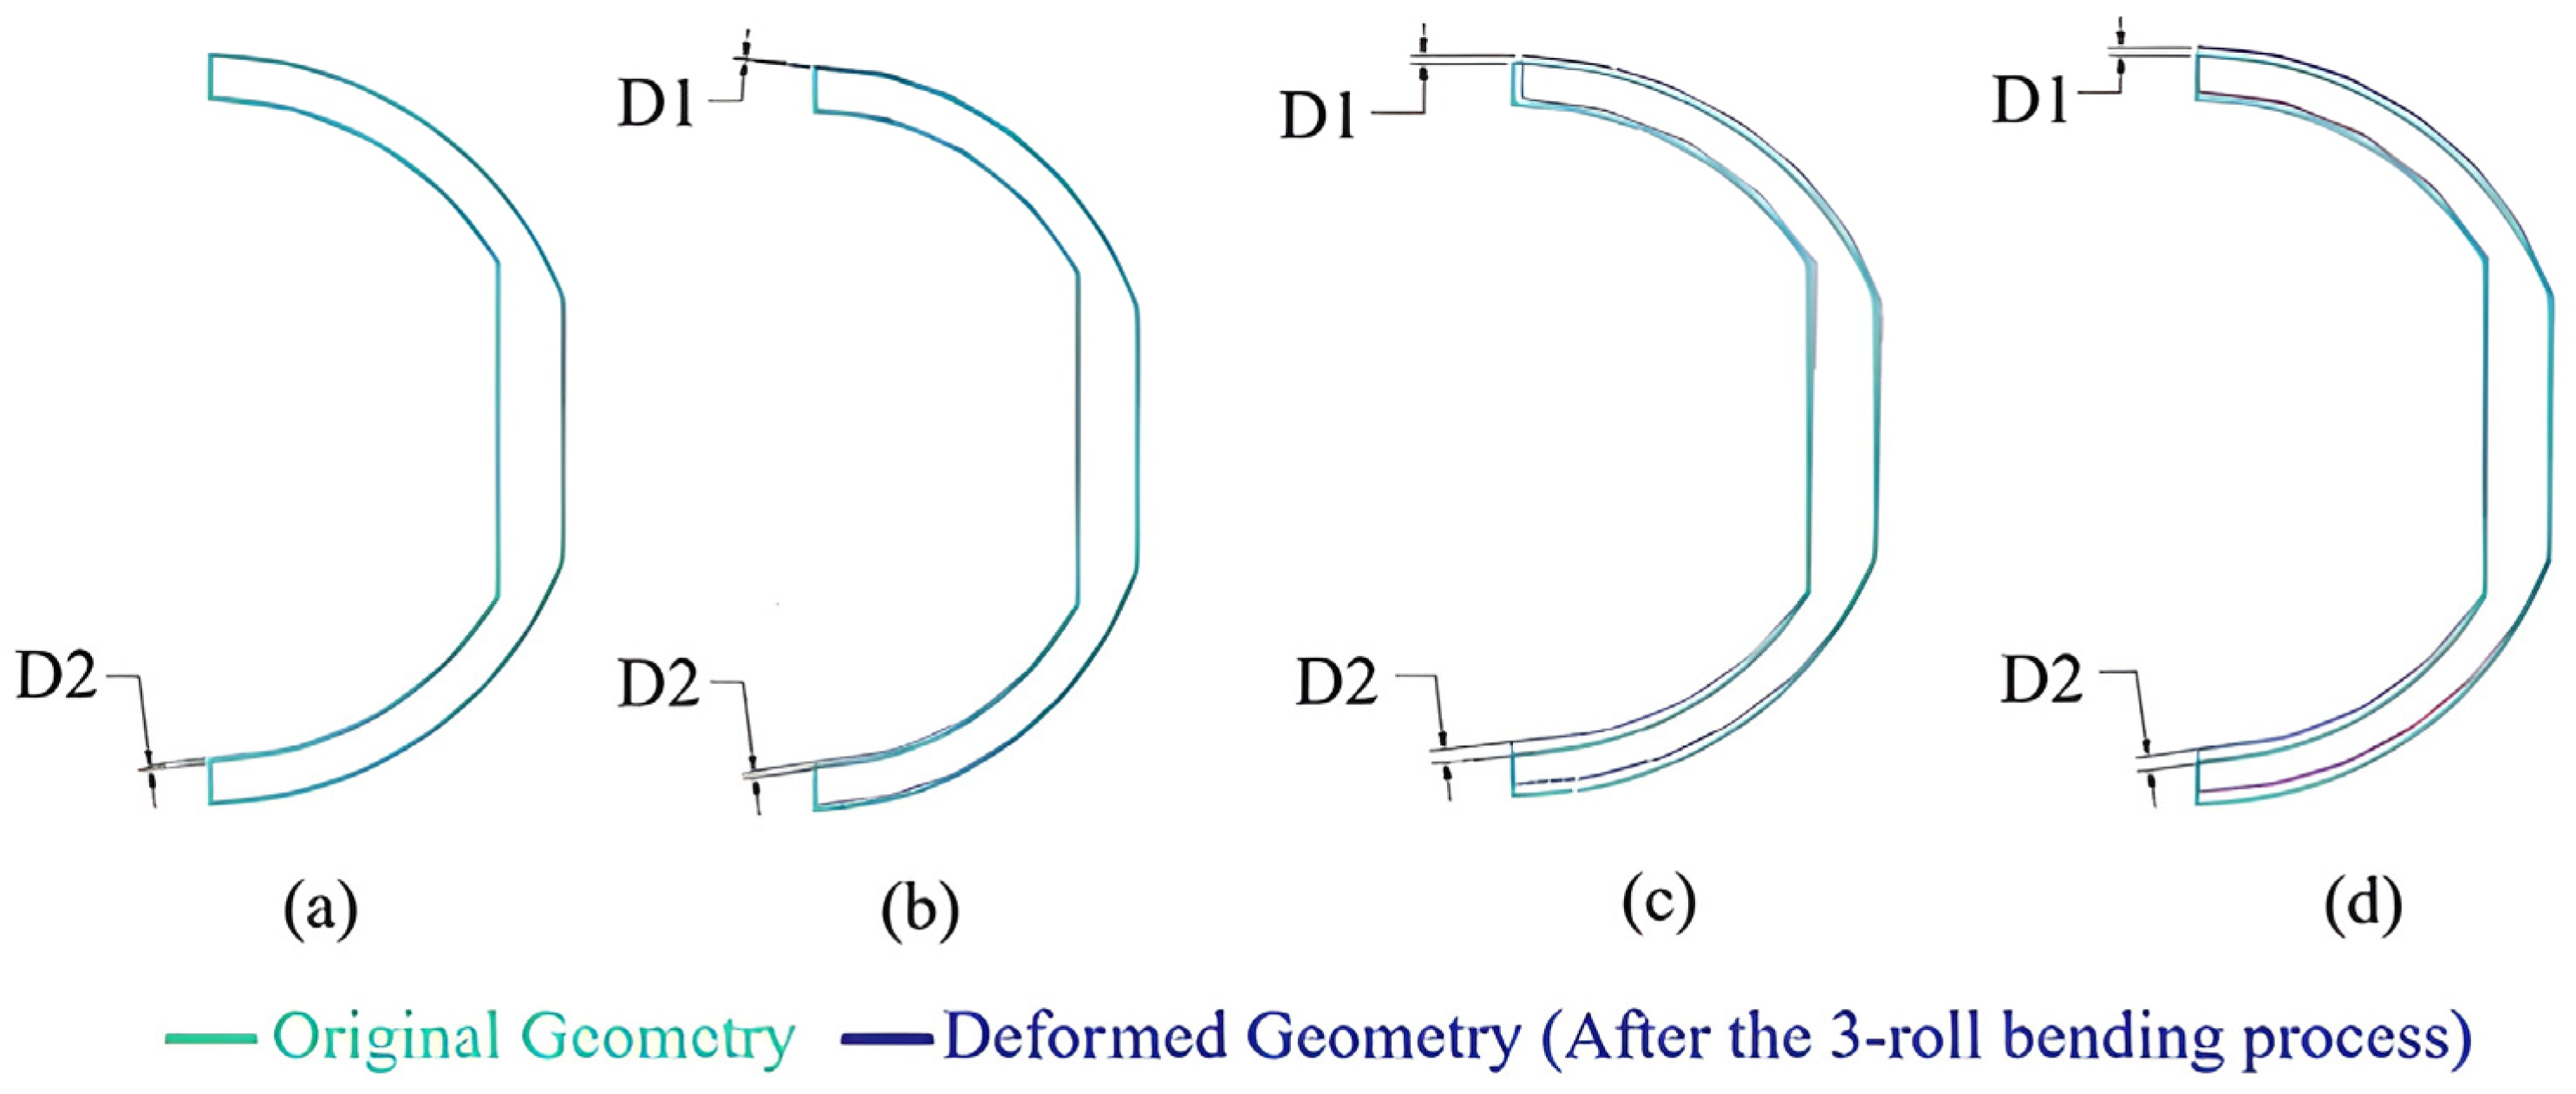
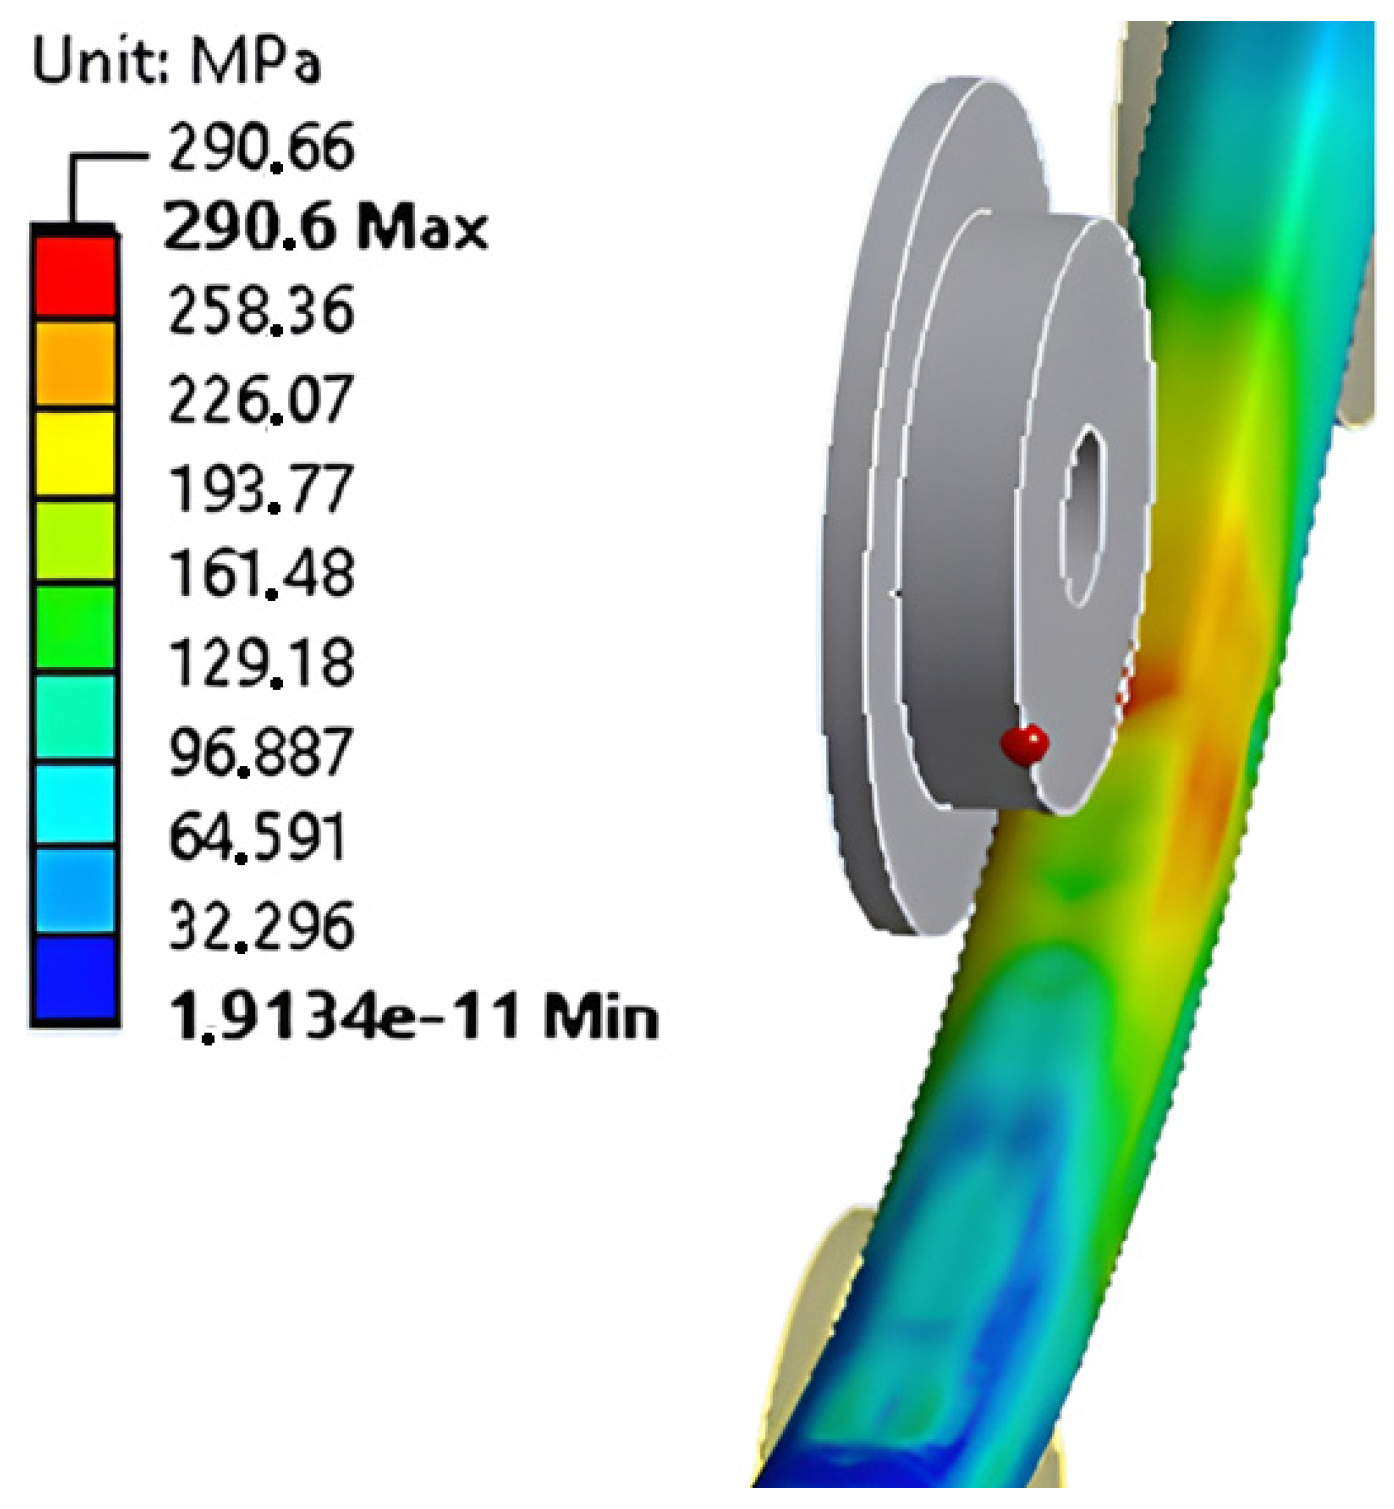
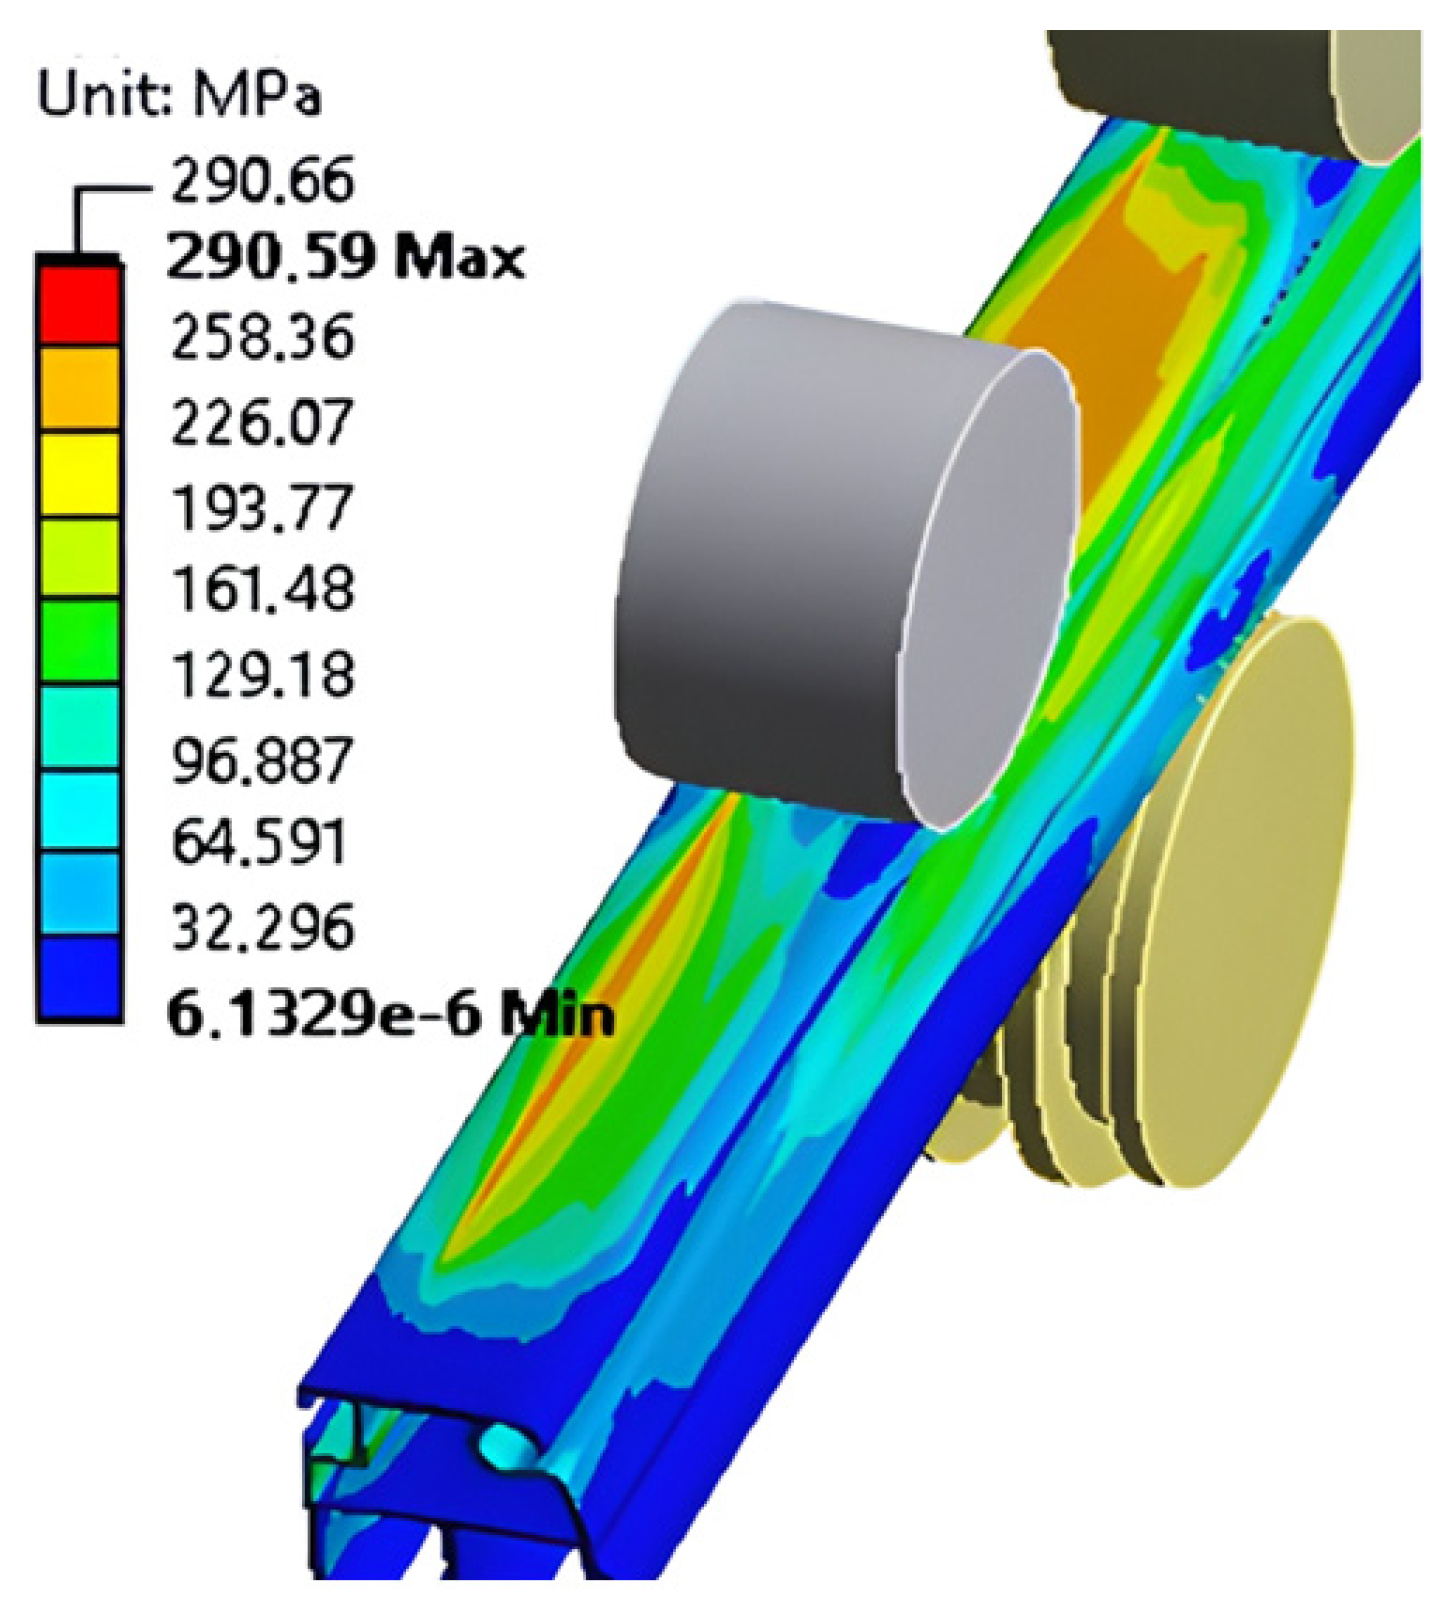
Table 4 compiles the results for Profile 1’s bending with its cross-section in the vertical position: for each bending radius r, the maximum von Mises stress, safety factor, and displacements at points D1 and D2 are presented. Figures 10, 12, 14, and 15 illustrate these cases, showing the deformed geometry and the corresponding stress maps.
Similarly, Table 5 presents the same parameters for the Profile 1’s bending with its cross-section in the horizontal position, while Figures 11, 13, 16, and 17 display the displacements and stress distribution for the same.
Based on the results presented in Table 4 and Table 5 and Figure 10, Figure 11, Figure 12, Figure 13, Figure 14, Figure 15, Figure 16 and Figure 17, the following observations can be highlighted:
For Profile 1, the stress distribution indicates that the maximum von Mises stresses are concentrated in the inner curved region, especially near the mid-span where the bending moment is highest. The flanges exhibited a relatively uniform stress field, suggesting efficient load transfer along the section.
Regarding the bending behavior, it was observed that, regardless of the orientation (vertical or horizontal), the overall curvature of the profile remained predominantly vertical and symmetric, with negligible lateral curvature (LR), confirming the geometric stability of the cross-section. In contrast, the local displacements of the cross-section showed a clear dependence on the bending orientation: under horizontal bending, the displacements were more pronounced in D2 and less significant in D1, whereas in vertical bending the opposite trend was observed. These results indicate that the structural response of Profile 1 is sensitive to the bending direction, which must be considered in practical applications.

3.2.2. Numerical Analysis of the Mechanical Behavior of Profile 2

Table 6 presents the Profile 2’s mesh sensitivity analysis results obtained through the computational modeling adopted in the present study. Based on these results, it was observed that, from 209,941 finite elements onwards, the relative difference between the maximum von Mises stresses obtained with successive meshes becomes lower than 0.5% (RD ≤ 0.5%), indicating satisfactory numerical convergence. Therefore, this mesh was employed as adequate for the numerical simulations of Profile 2, balancing accuracy and processing time (80 h and 49 min).
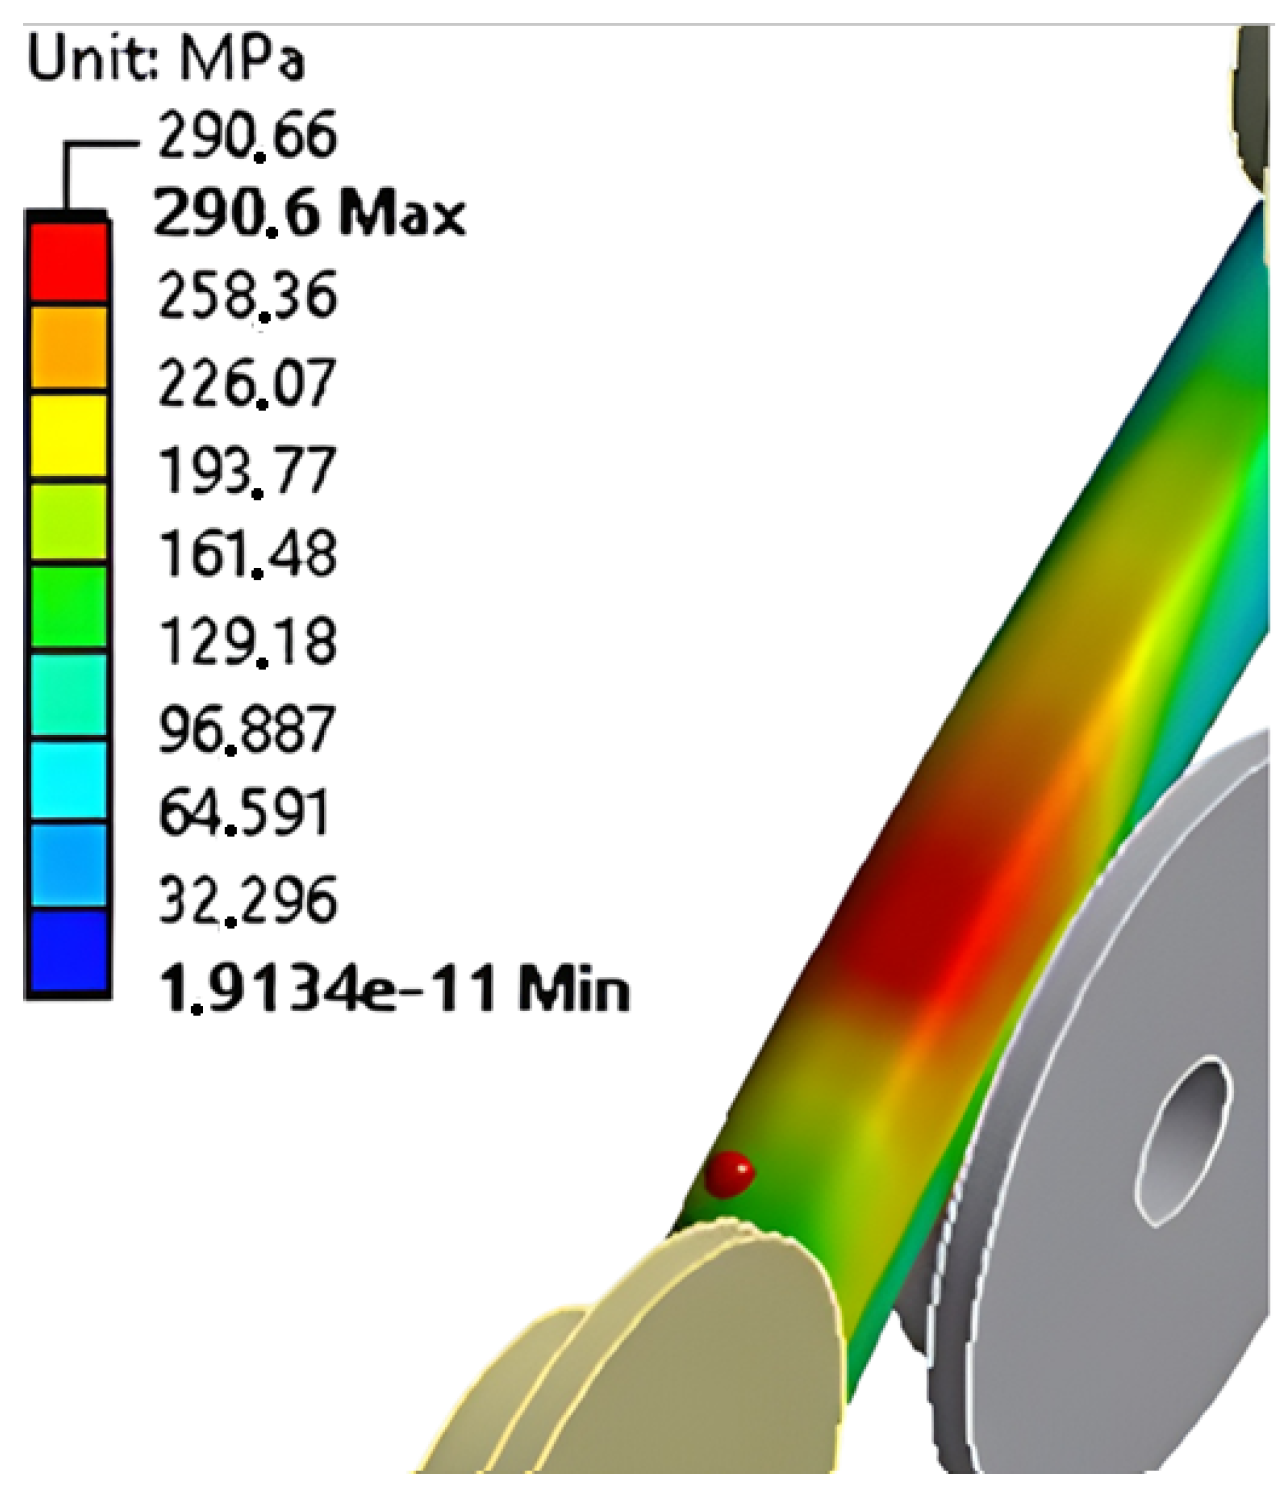
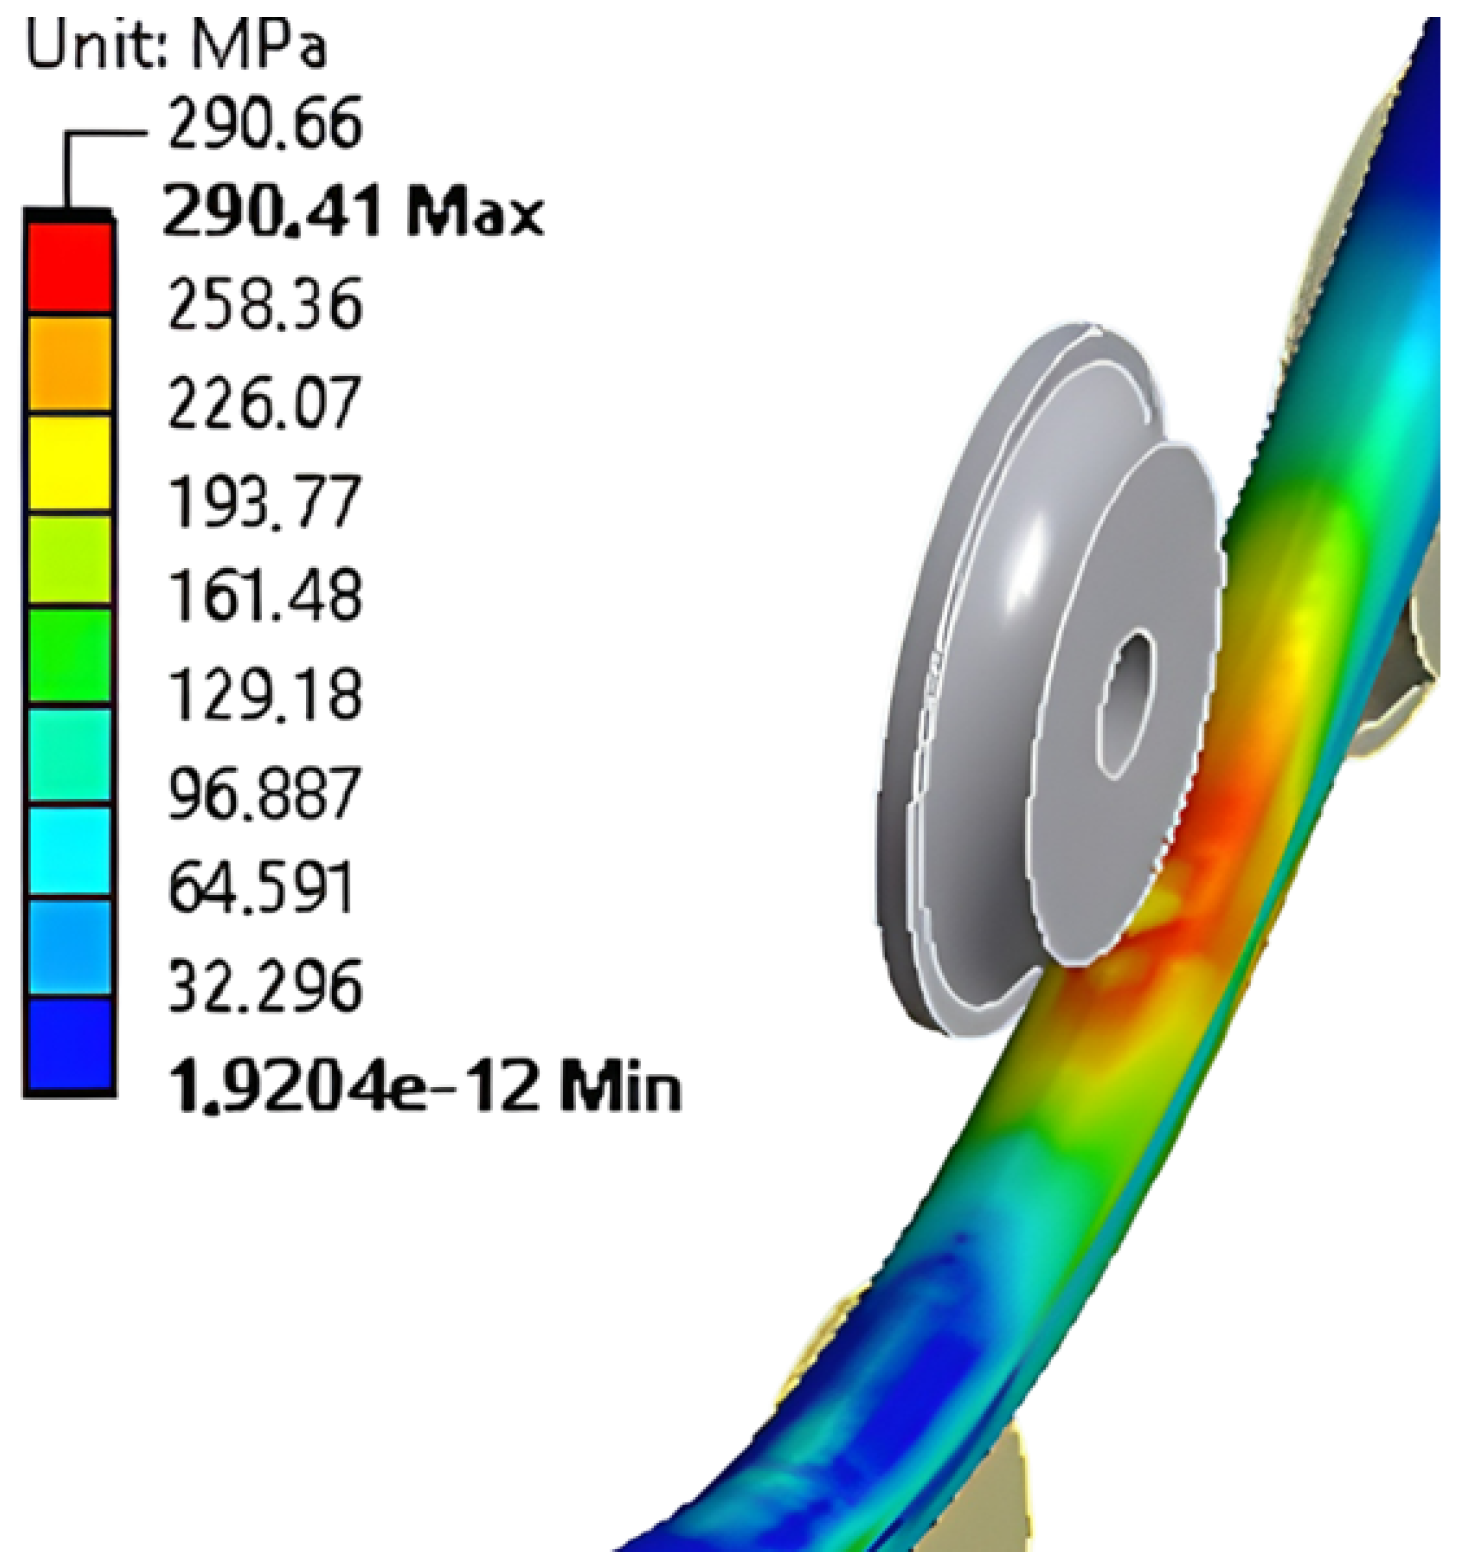
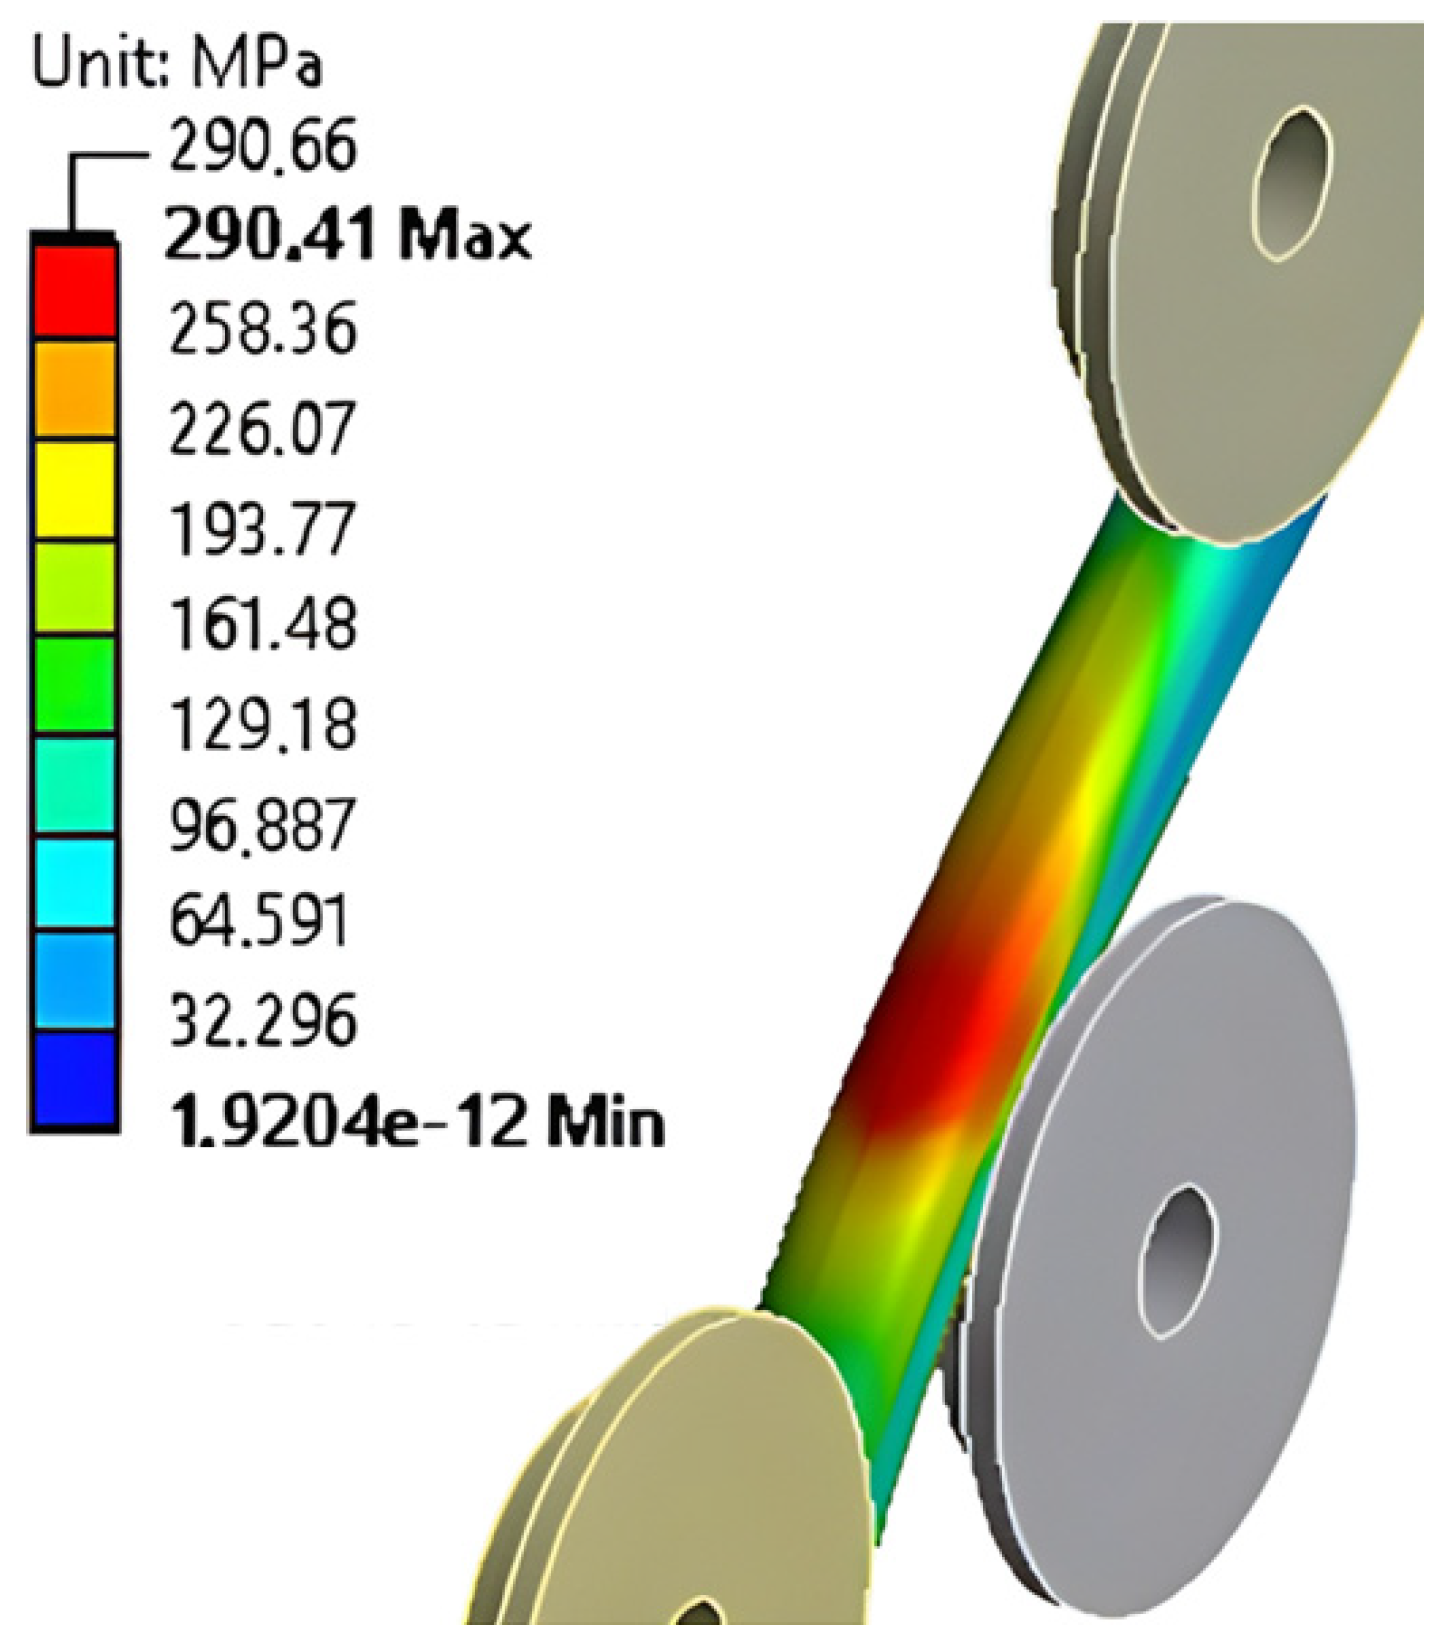
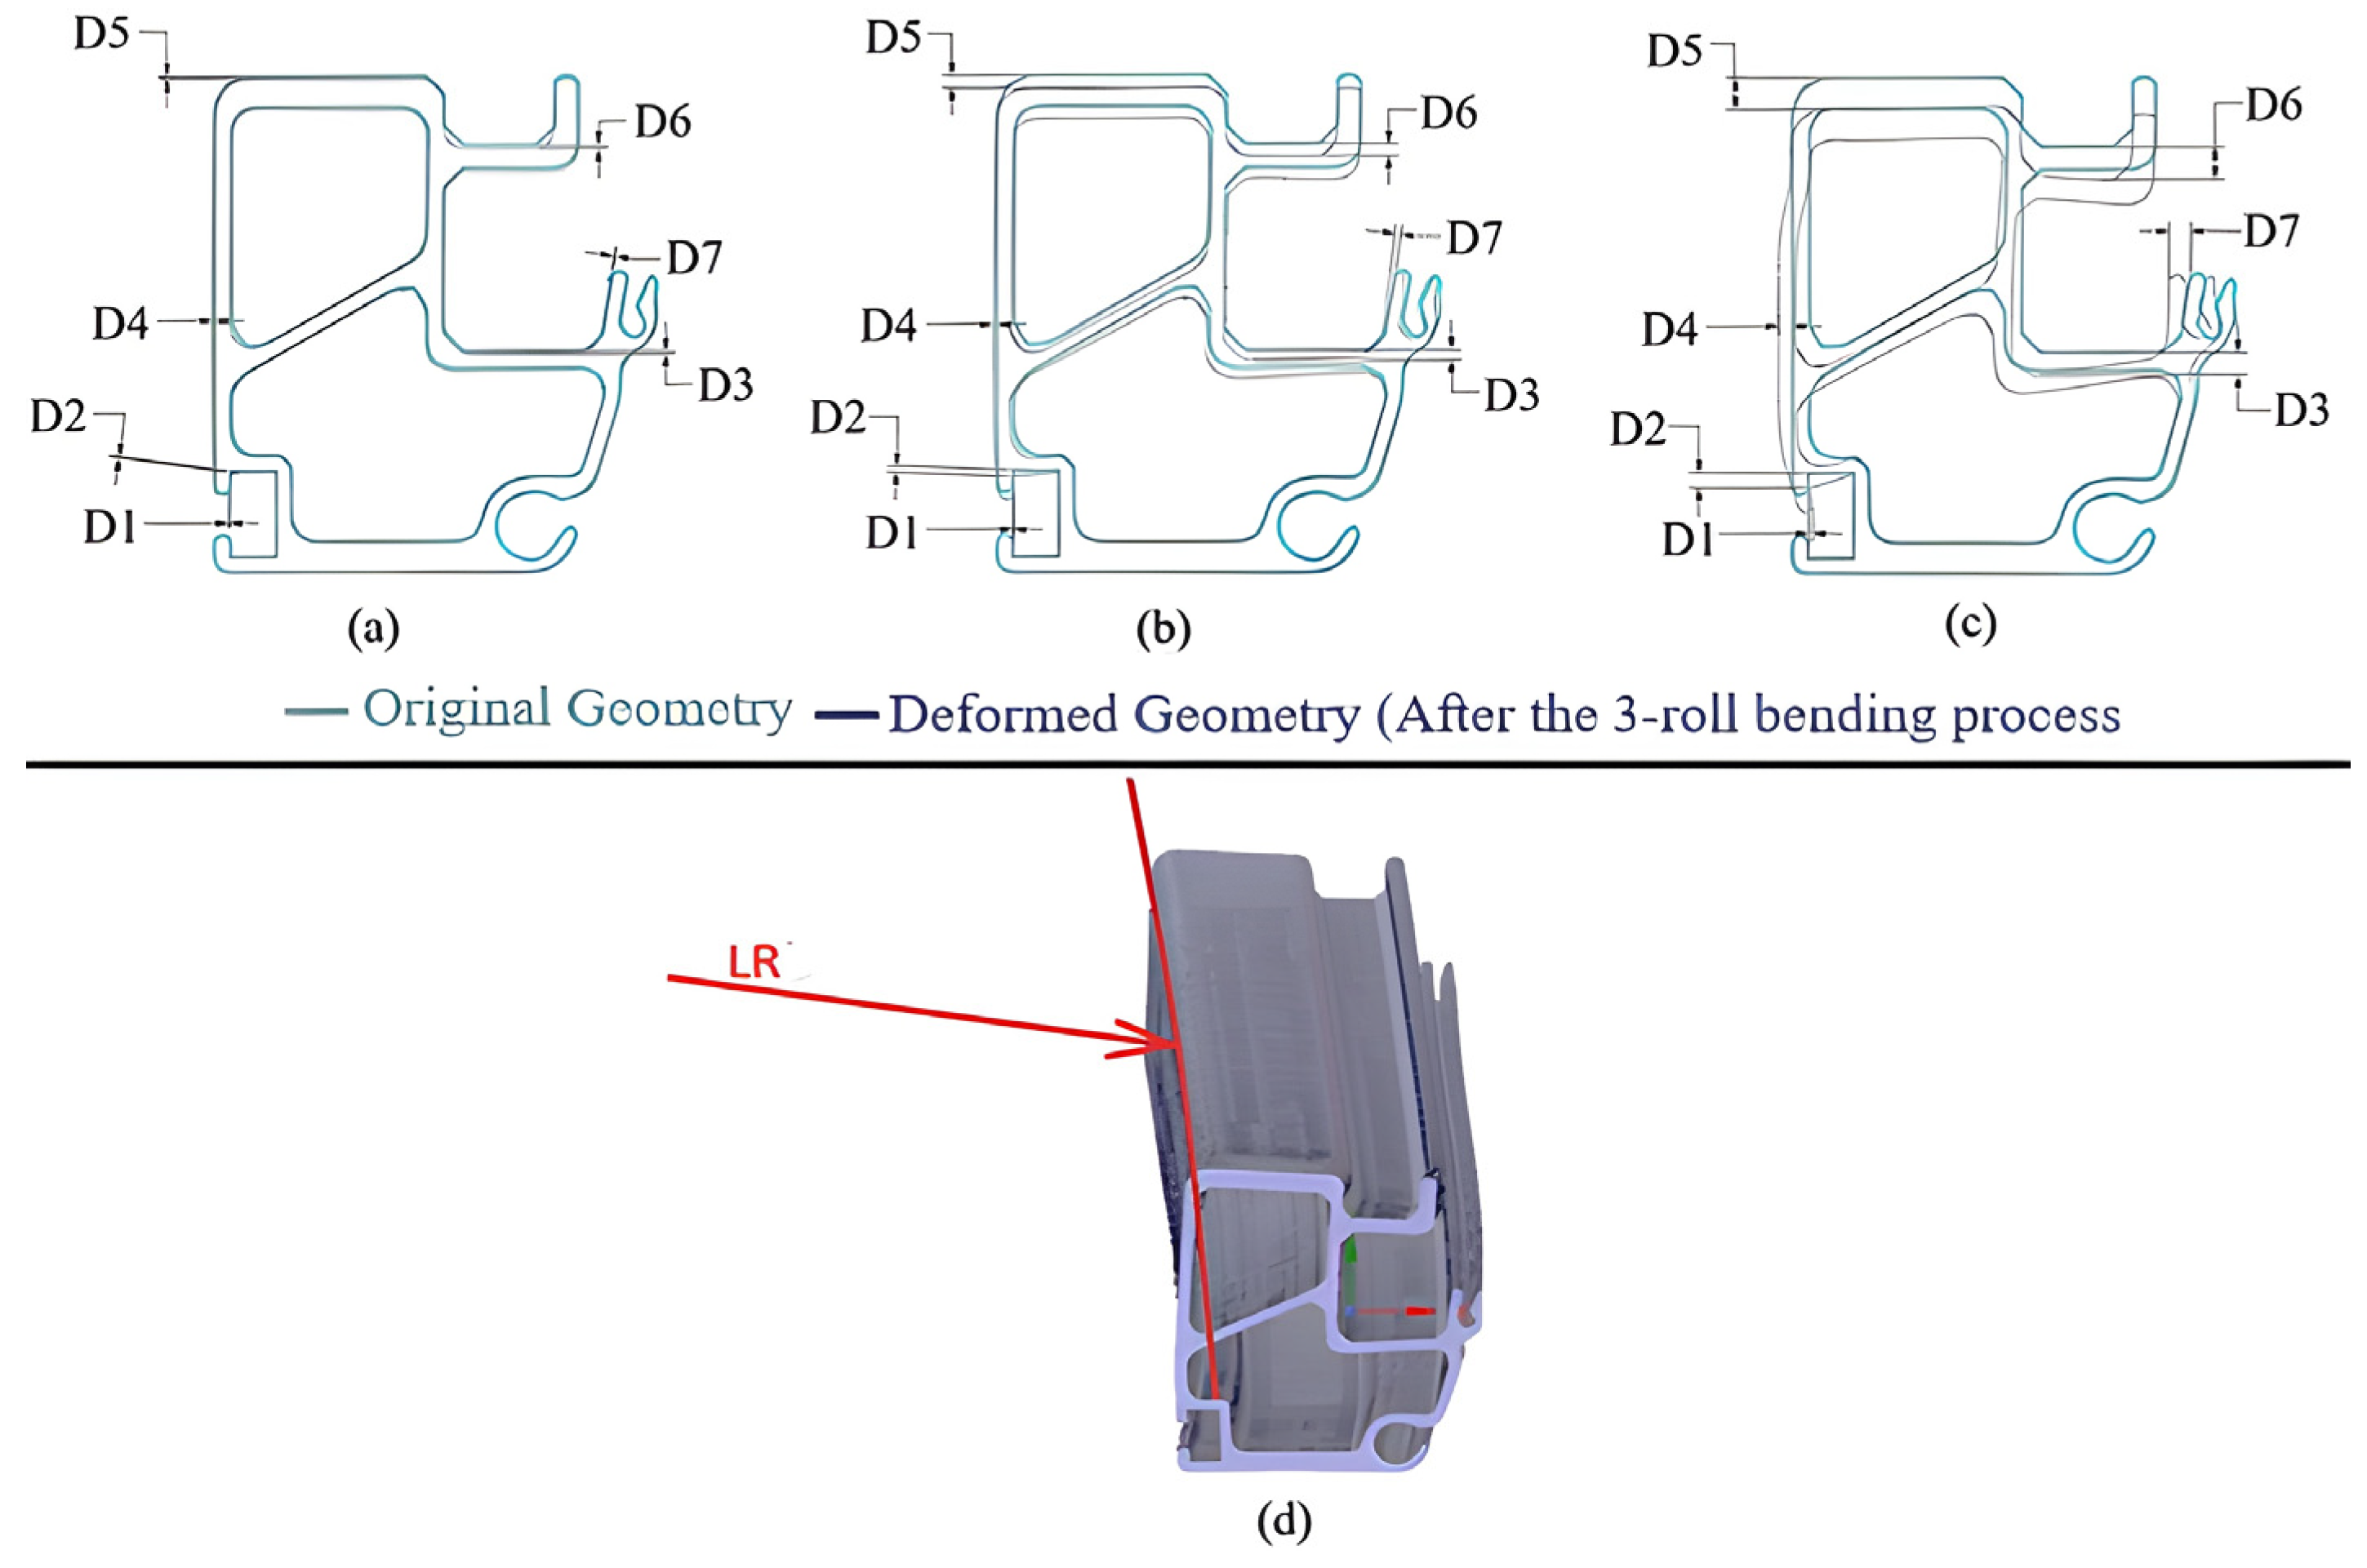
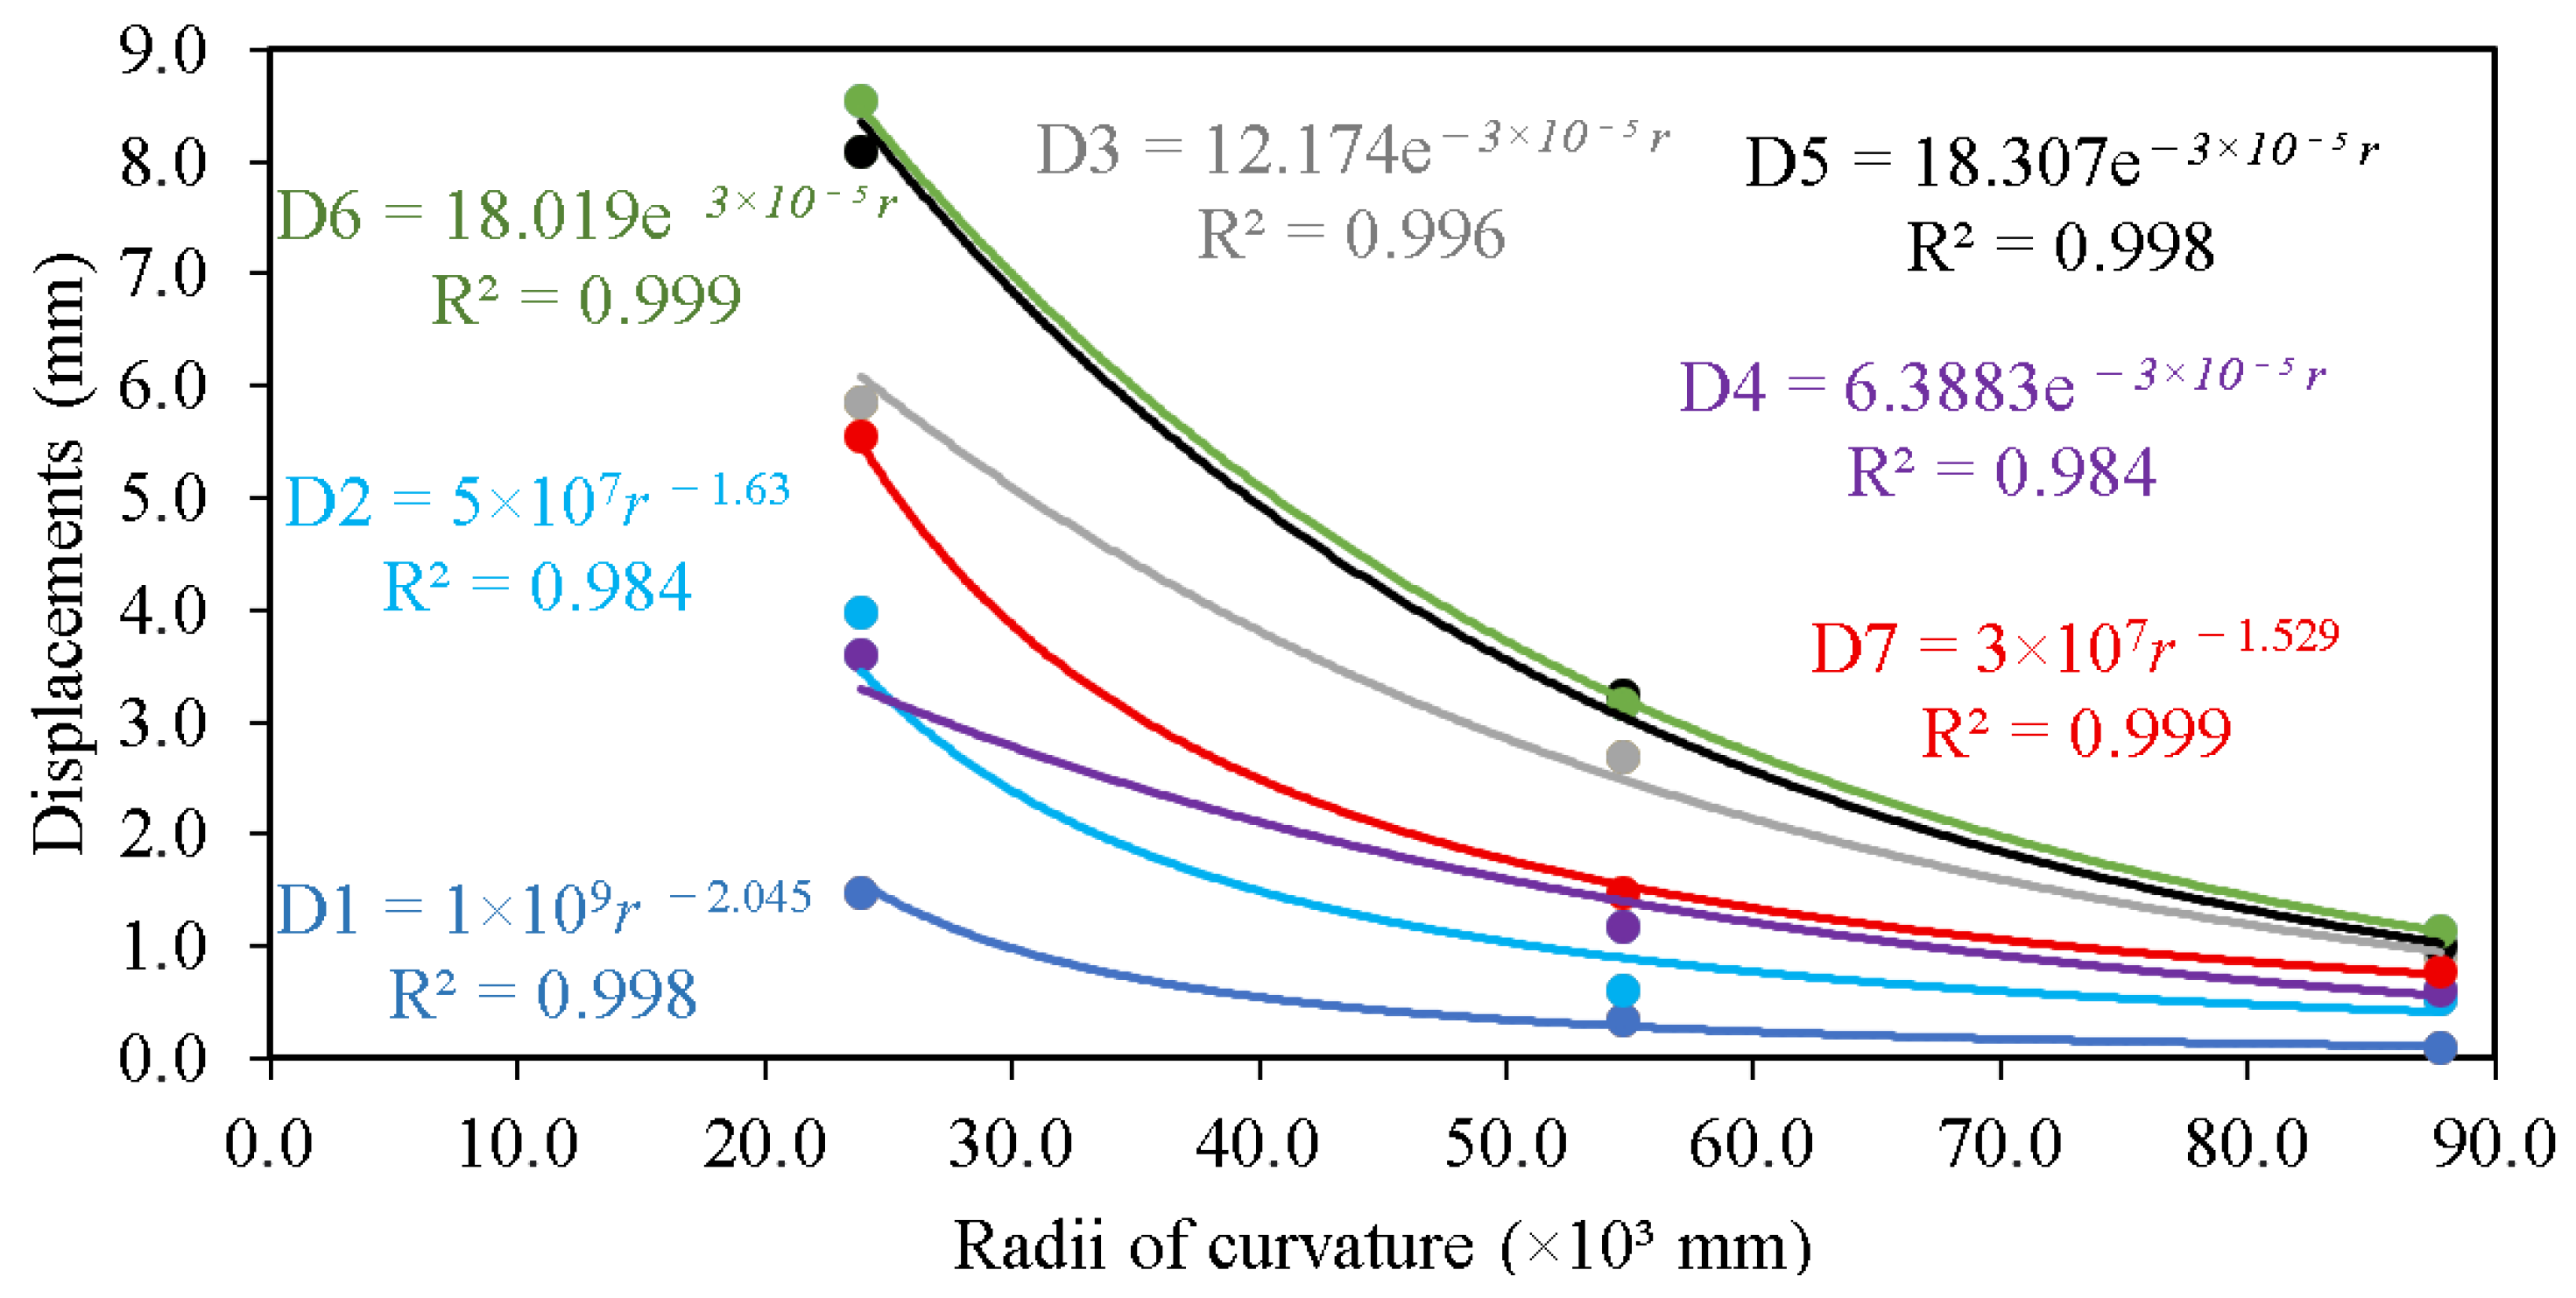
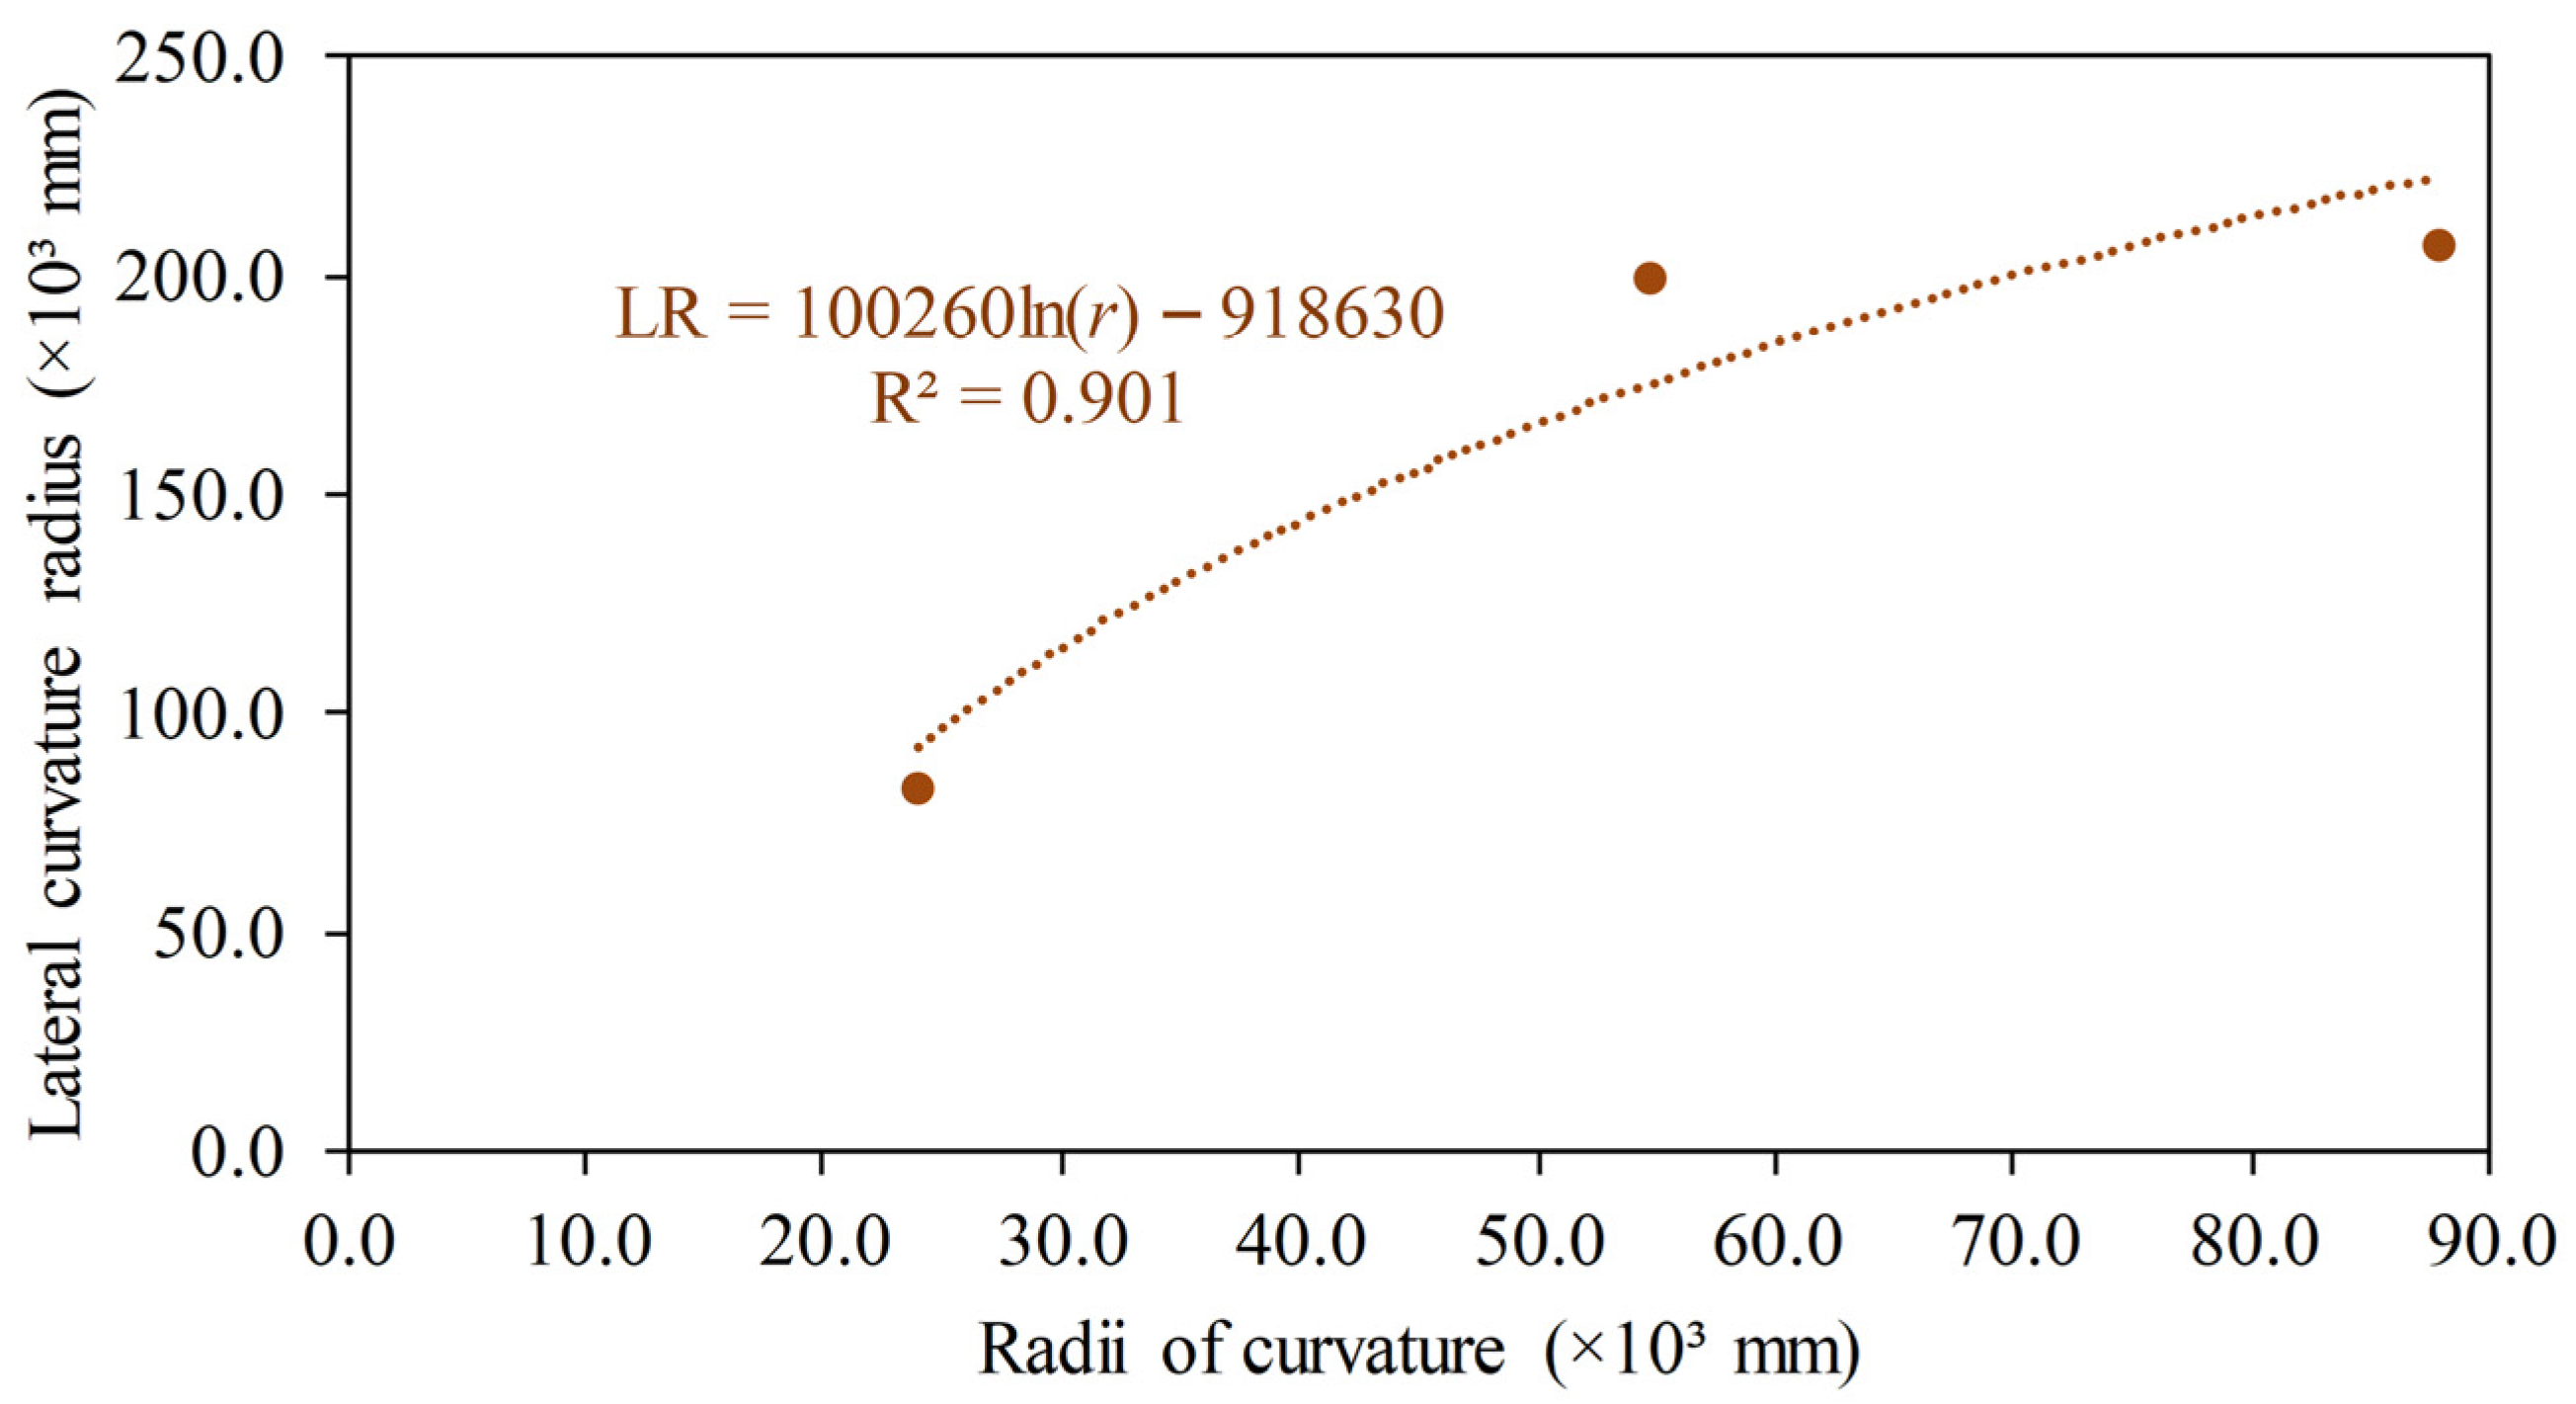
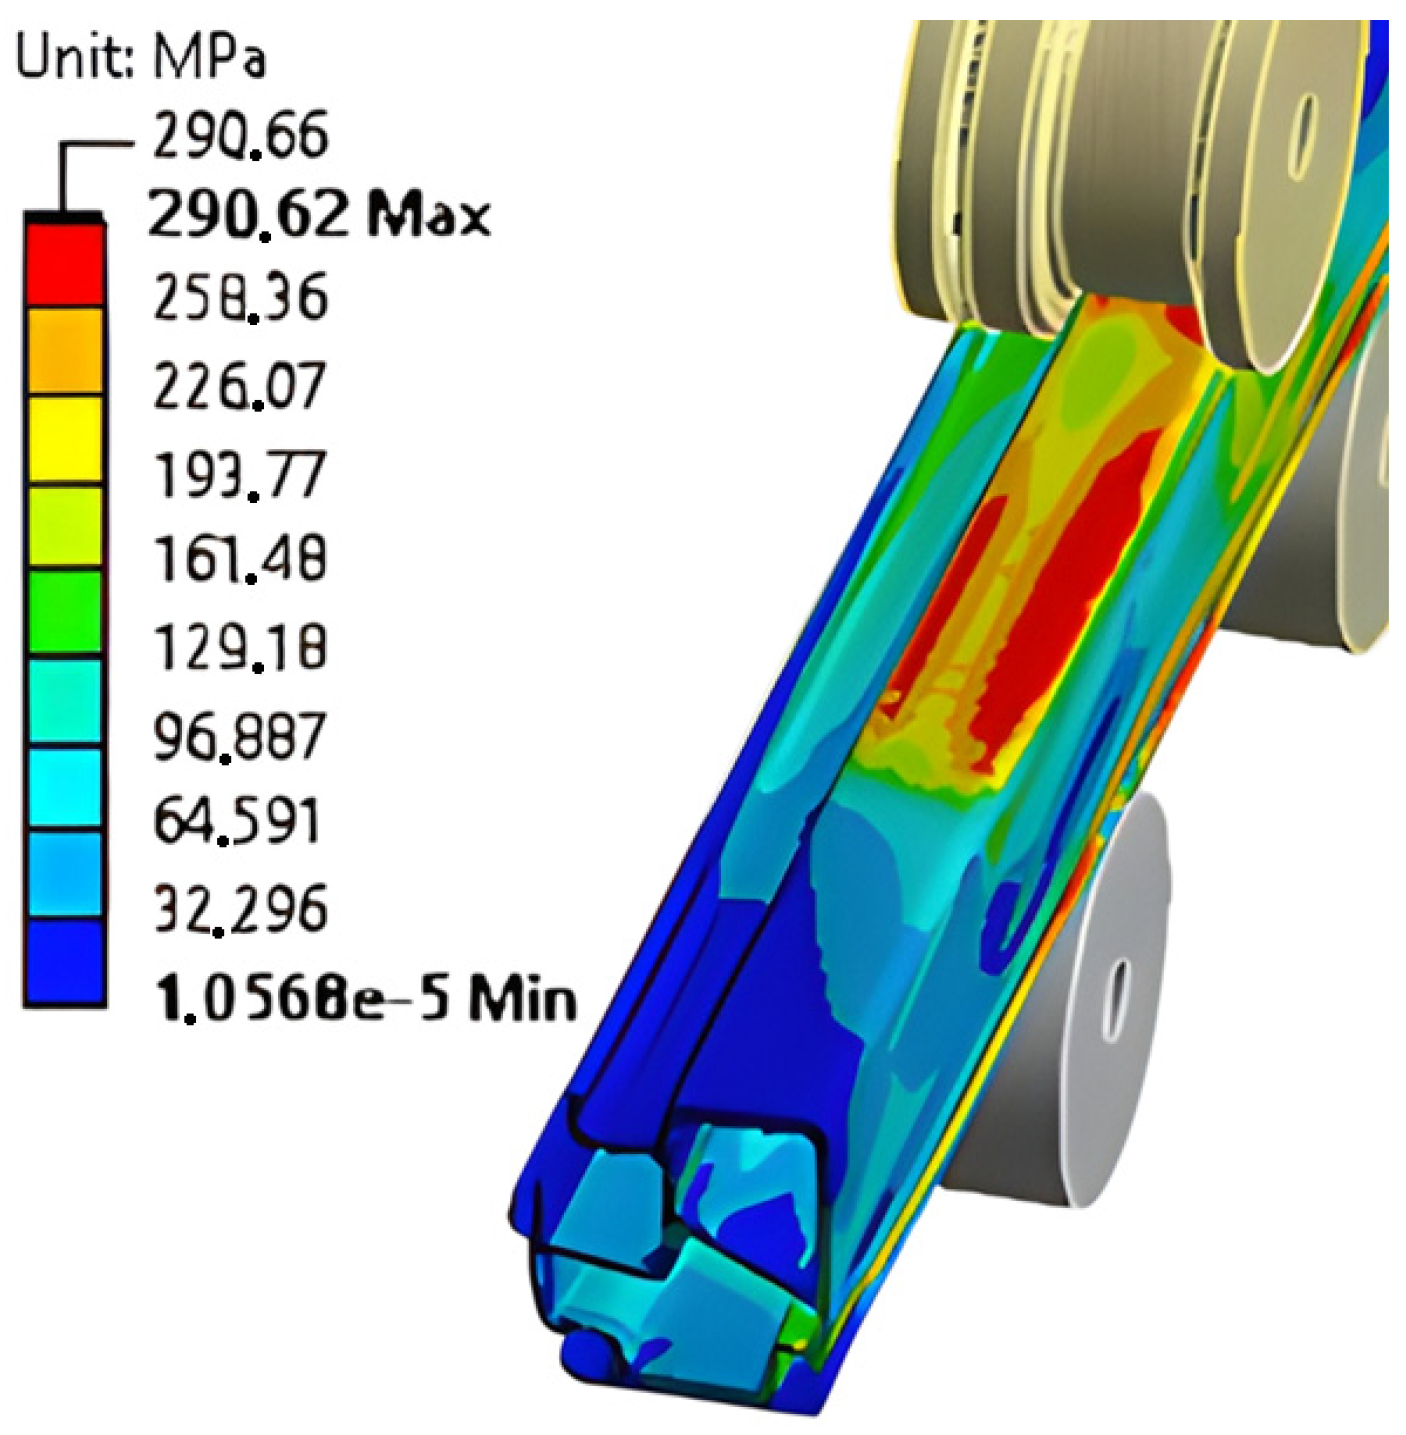
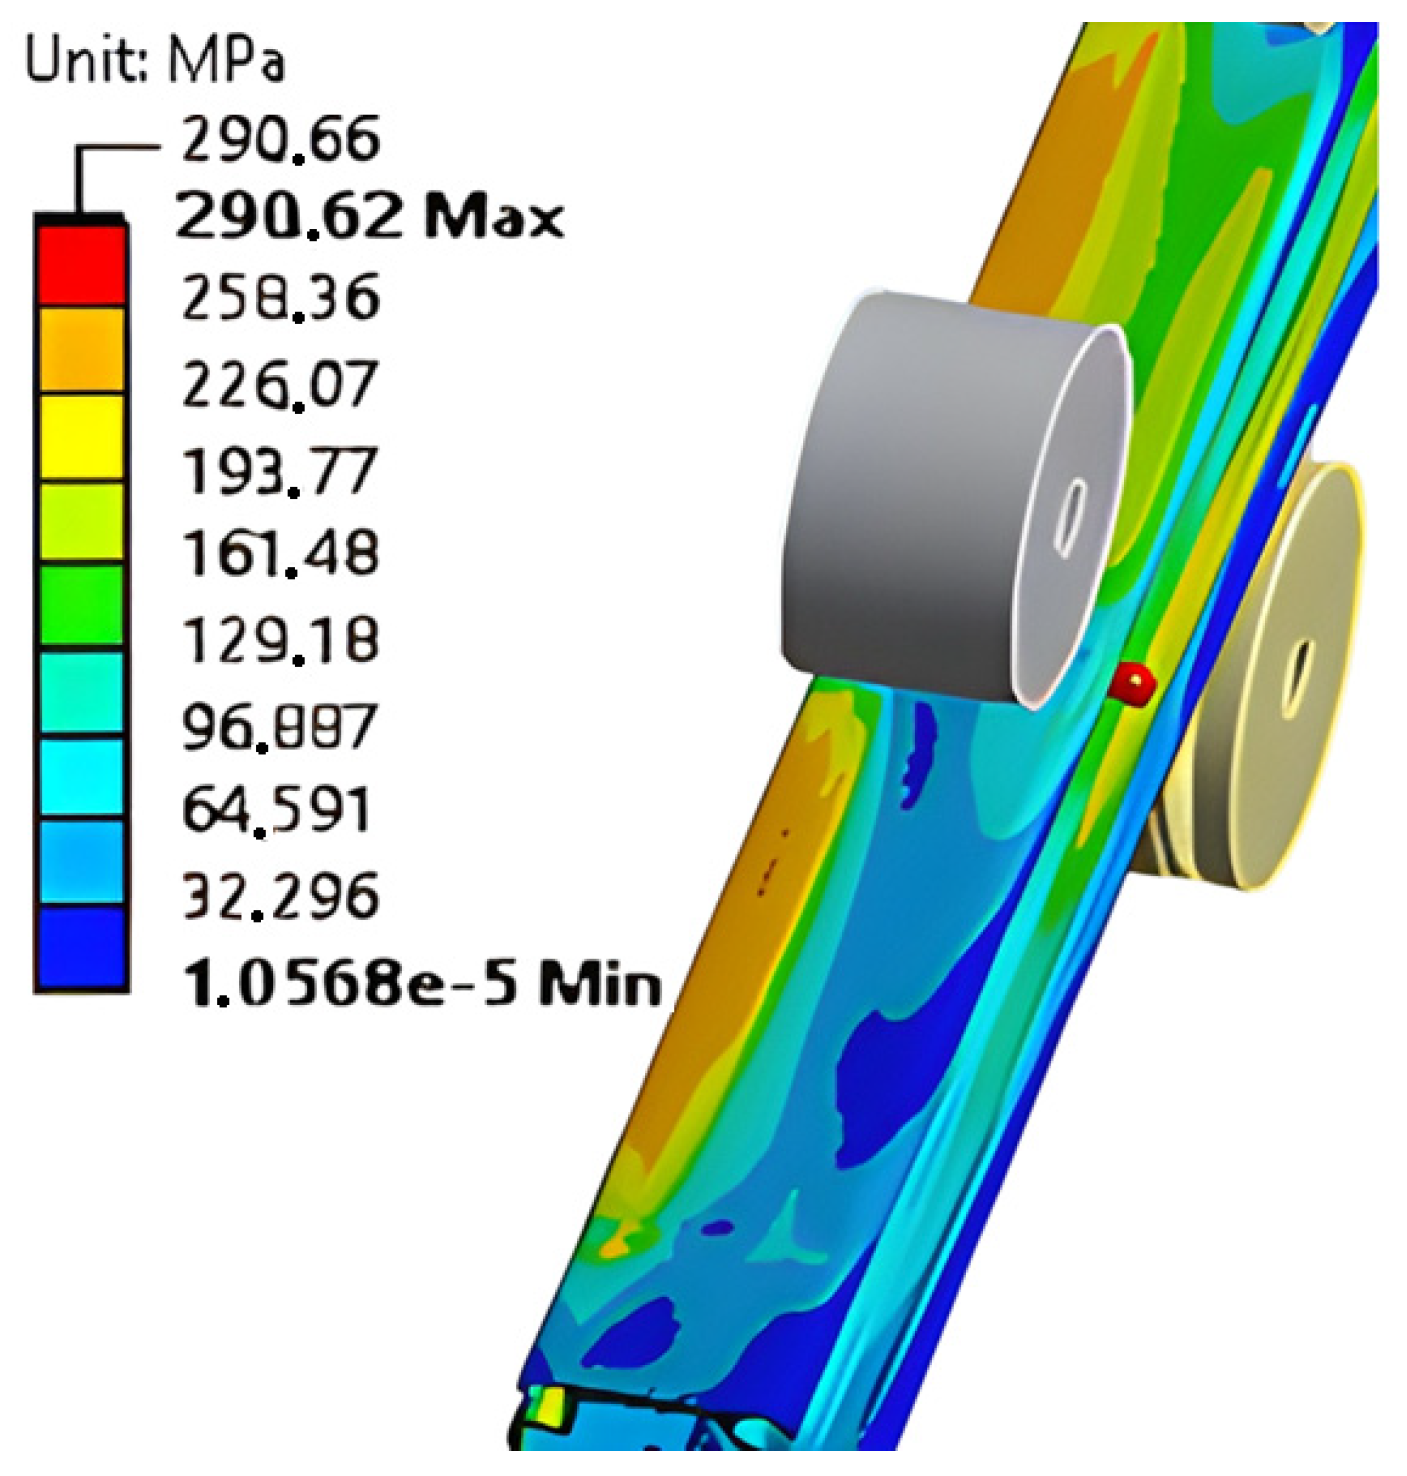
Table 7, together with Figure 18, presents the displacements obtained in the cross-sections of Profile 2 (denoted by D1 to D7), as well as the lateral bending radius (LR), for three different bending radii applied in the three-roll bending process. Figure 19 and Figure 20 illustrate the curve fittings obtained for the displacements and for the lateral bending radius, respectively. Figure 21 and Figure 22 show the von Mises stress distribution in the superior and inferior regions of Profile 2 for the smallest simulated bending radius.
Based on the results obtained and presented in Table 7 and Figure 18, Figure 19, Figure 20, Figure 21 and Figure 22, the following observations can be highlighted:
For Profile 2, the maximum von Mises stresses concentrated near the roller contact regions and at the web–flange transitions, where geometric discontinuities intensified stress gradients. At the smallest bending radius analyzed (r = 2335.39 mm), the peak stress reached 290.62 MPa, practically coinciding with the UTS of aluminum 6061-T6. Even at an intermediate radius (r = 54,688.19 mm), the stress level approached 290.37 MPa, which indicates that the safe operating window for this profile is extremely narrow. Therefore, the minimum applicable bending radius without compromising the structural integrity must be substantially greater than 54,688 mm, unless additional measures such as post-forming stress relief or geometric reinforcement are considered.
The displacement field reflected the asymmetric geometry of the profile. The outermost points (e.g., D5 and D6) experienced the largest deformations, exceeding 8 mm at the smallest radii, while more central regions (D1 and D2) showed moderate but increasing displacements as the curvature intensified. A critical effect of this asymmetry was the development of a lateral bending radius (LR), caused by an imbalance of stresses between the two sides of the cross-section. This torsional distortion reduced LR to values as low as 20,676 mm in the most critical cases, producing a global twist of the profile rather than localized warping. This phenomenon is characterized as a torsional defect, as illustrated in Figure 3, and represents a global distortion of the profile along its length, not just a localized deformation of the section. In practical terms, this lateral twist can cause warping, misalignment, and fitting issues in applications requiring geometric precision. It is therefore especially important to consider these effects in designs involving profiles with asymmetric cross-sections.

3.2.3. Numerical Analysis of the Mechanical Behavior of Profile 3

The results of the mesh convergence analysis for Profile 3 are shown in Table 8. One can observe that the relative difference between the maximum von Mises stresses obtained for the last two meshes (with 109,857 and 125,054 elements) is only 0.34%, indicating stability in the results. This value is below the limit previously adopted in earlier cases (RD ≤ 0.50%), characterizing a satisfactory mesh convergence. Therefore, the mesh with 109,857 computational cells was chosen for the numerical simulation of Profile 3, as it represents a good balance between accuracy and processing time.
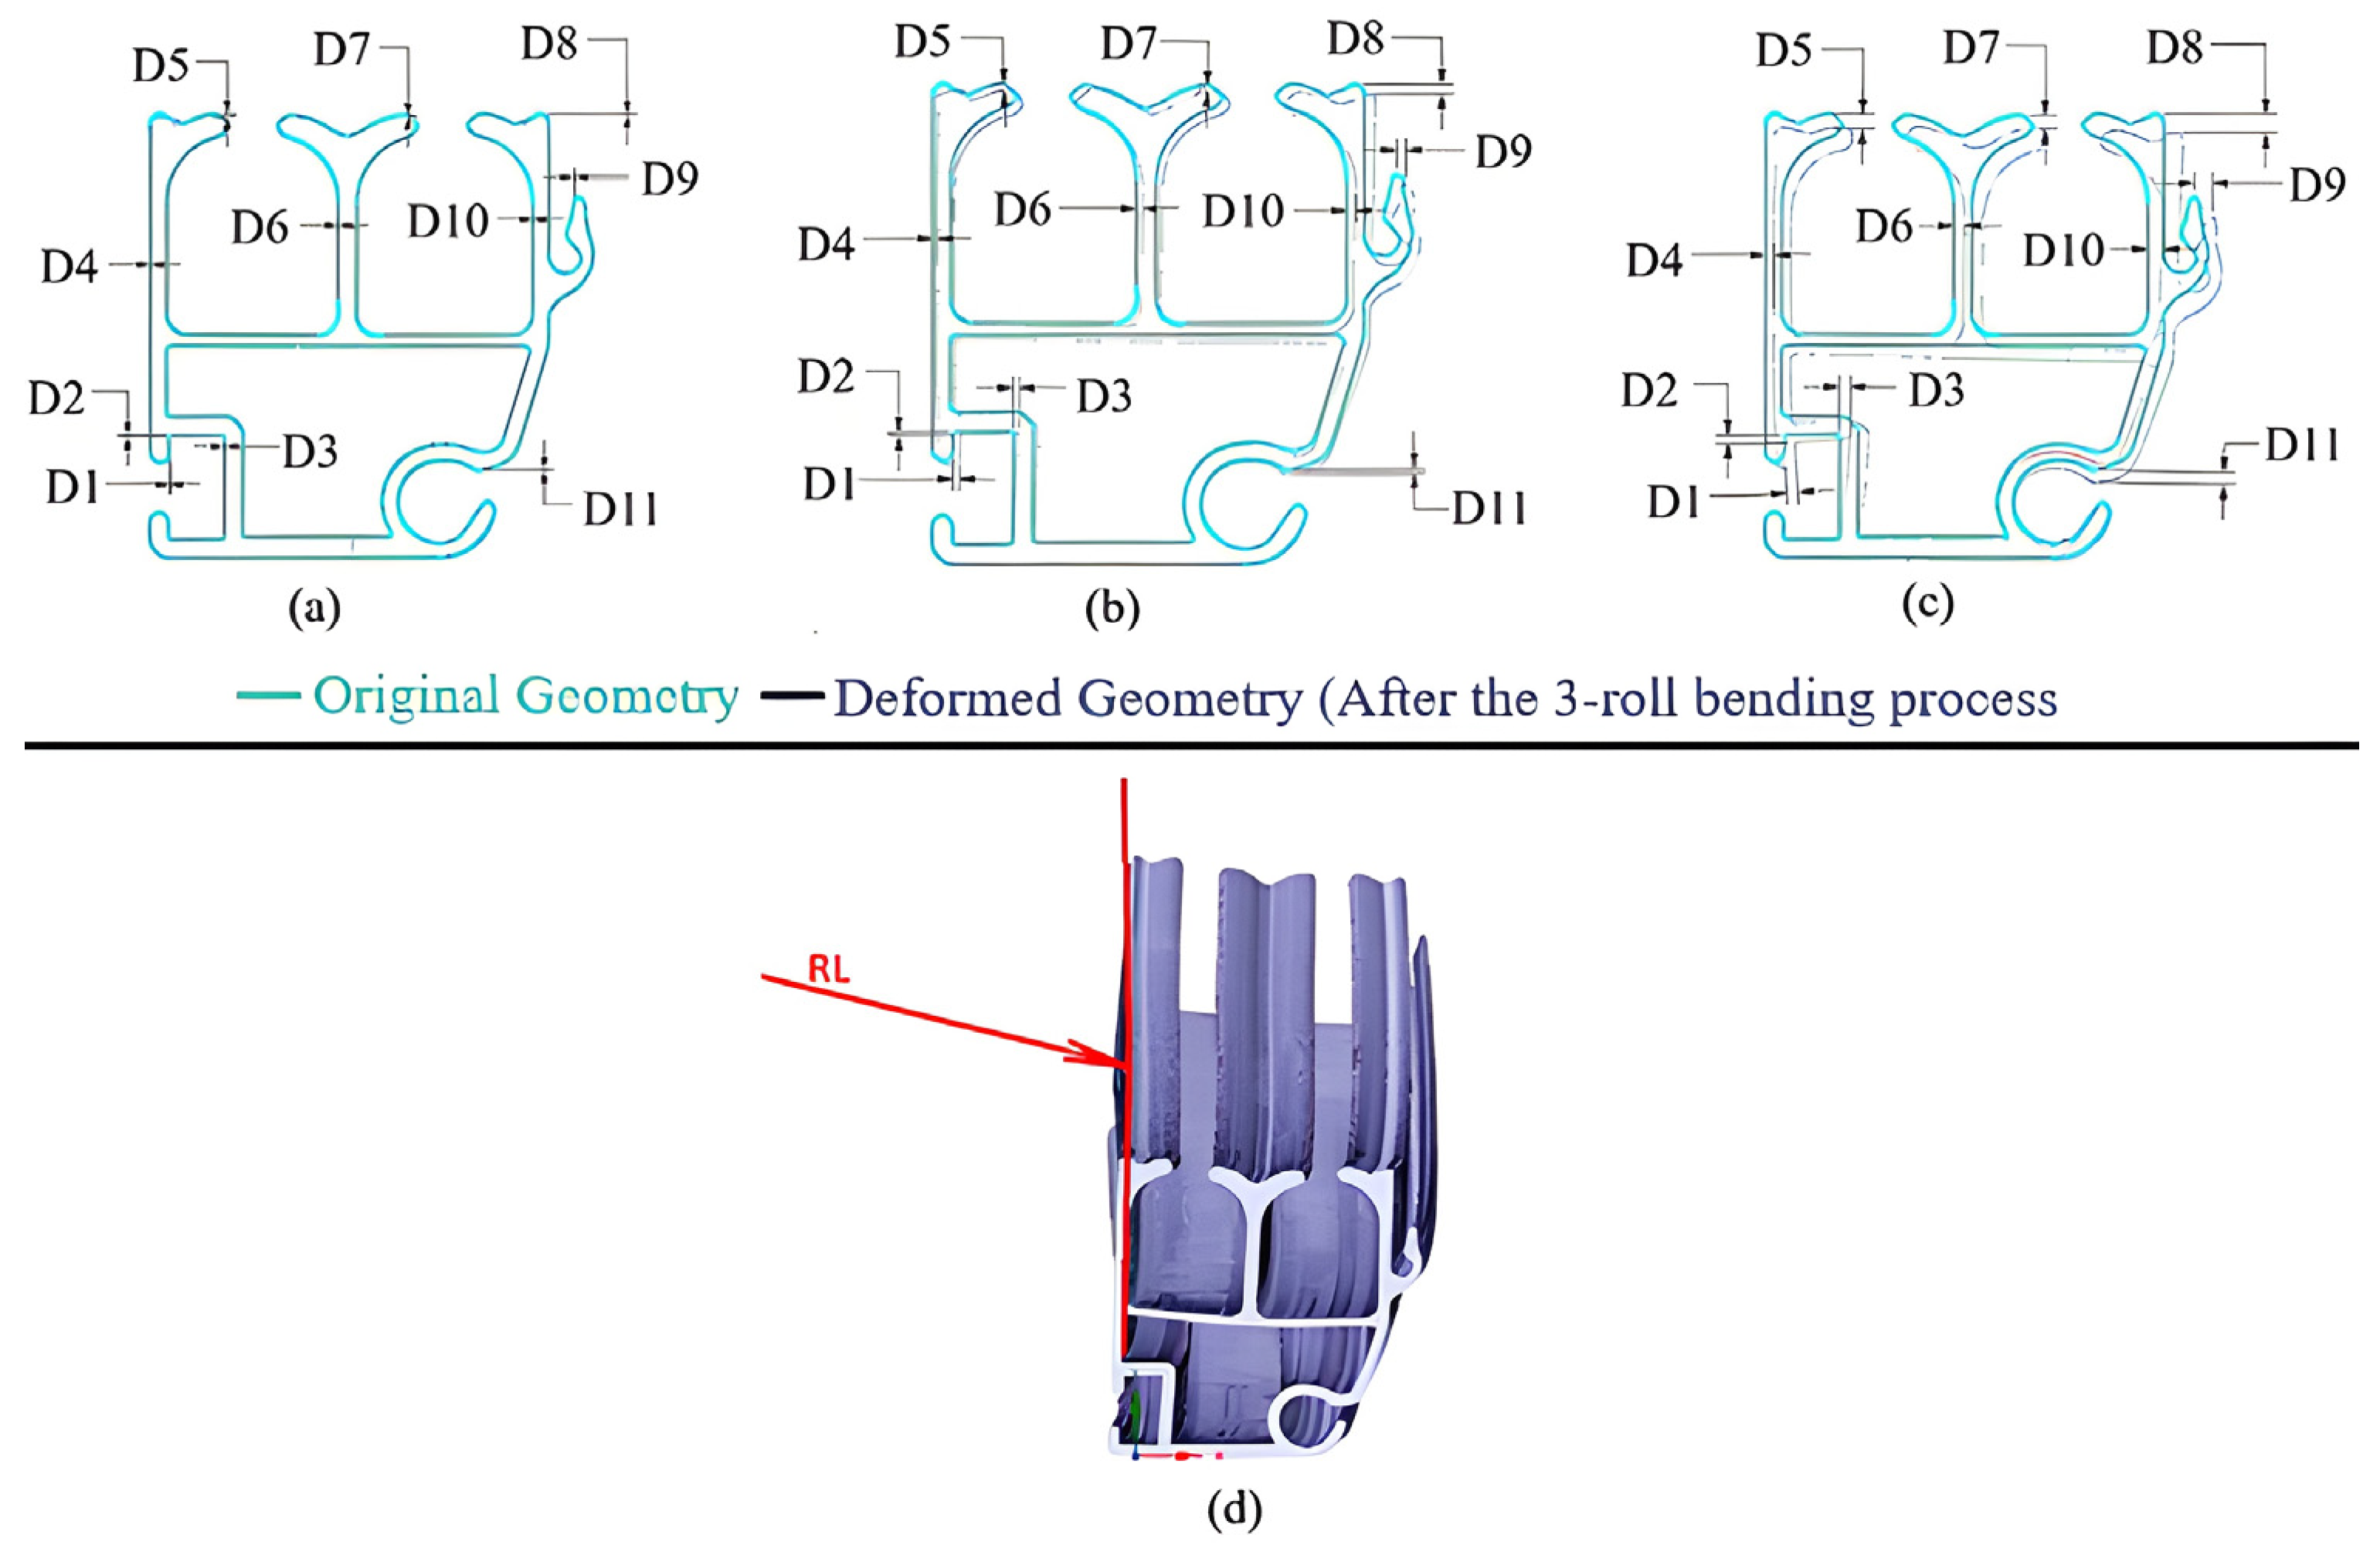
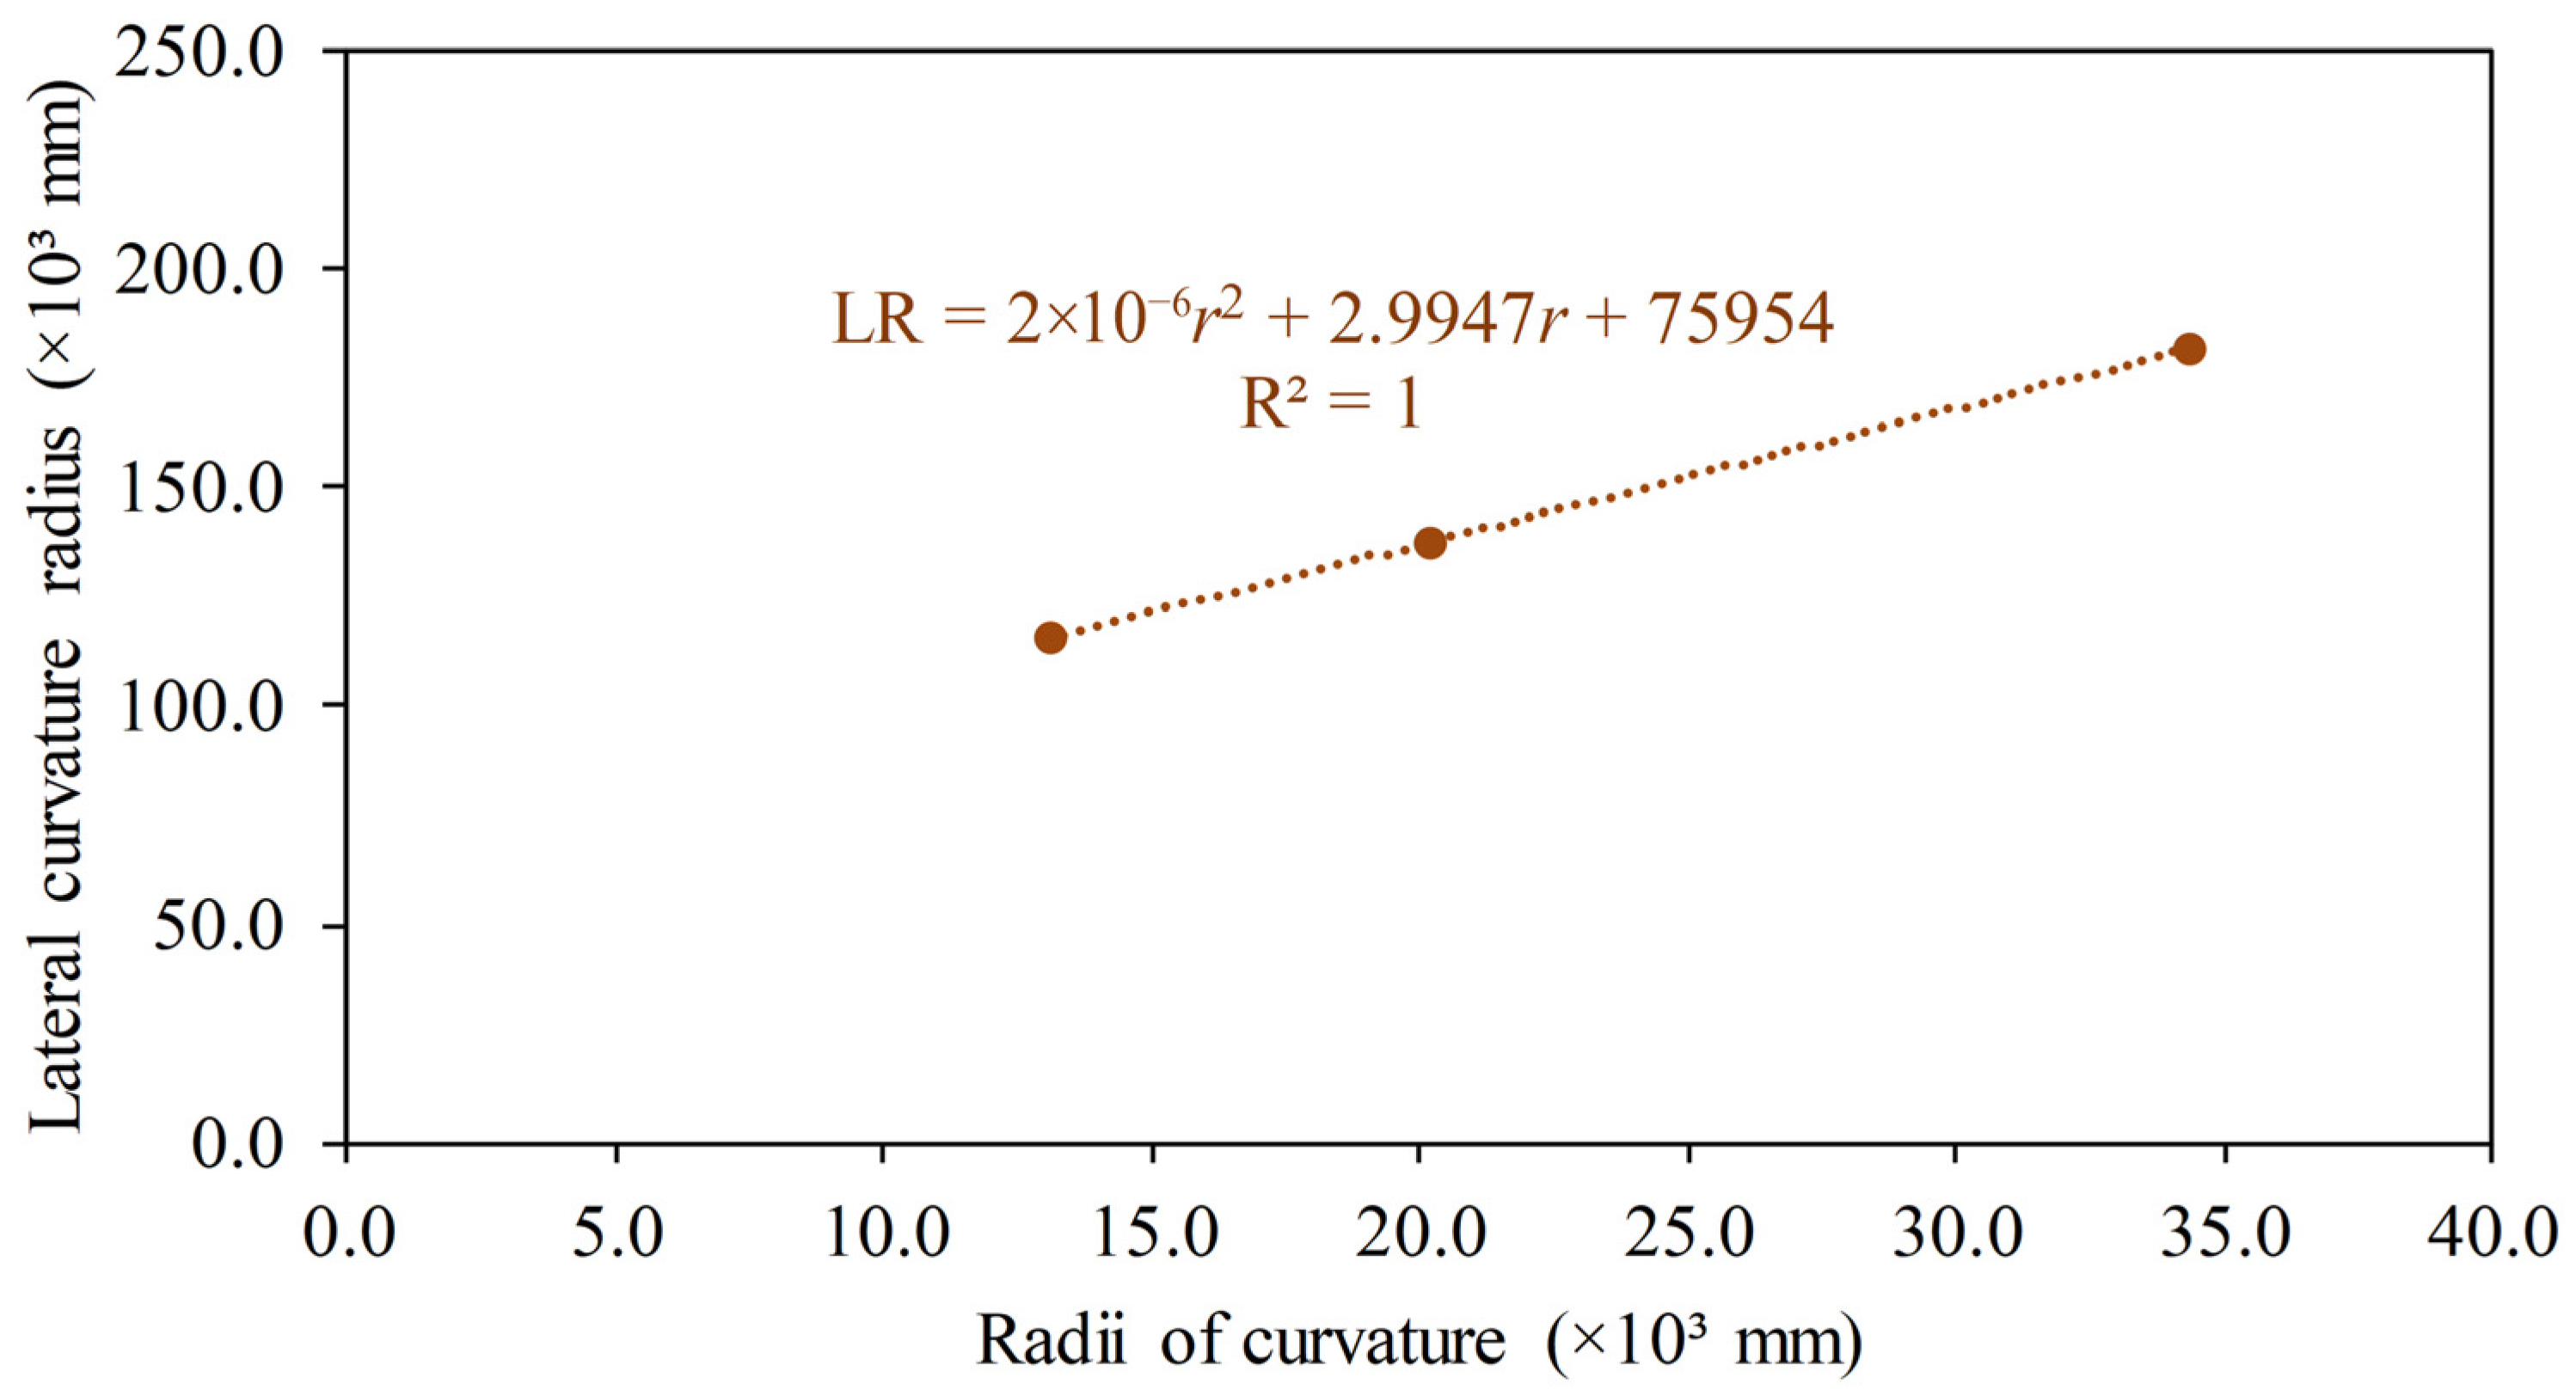
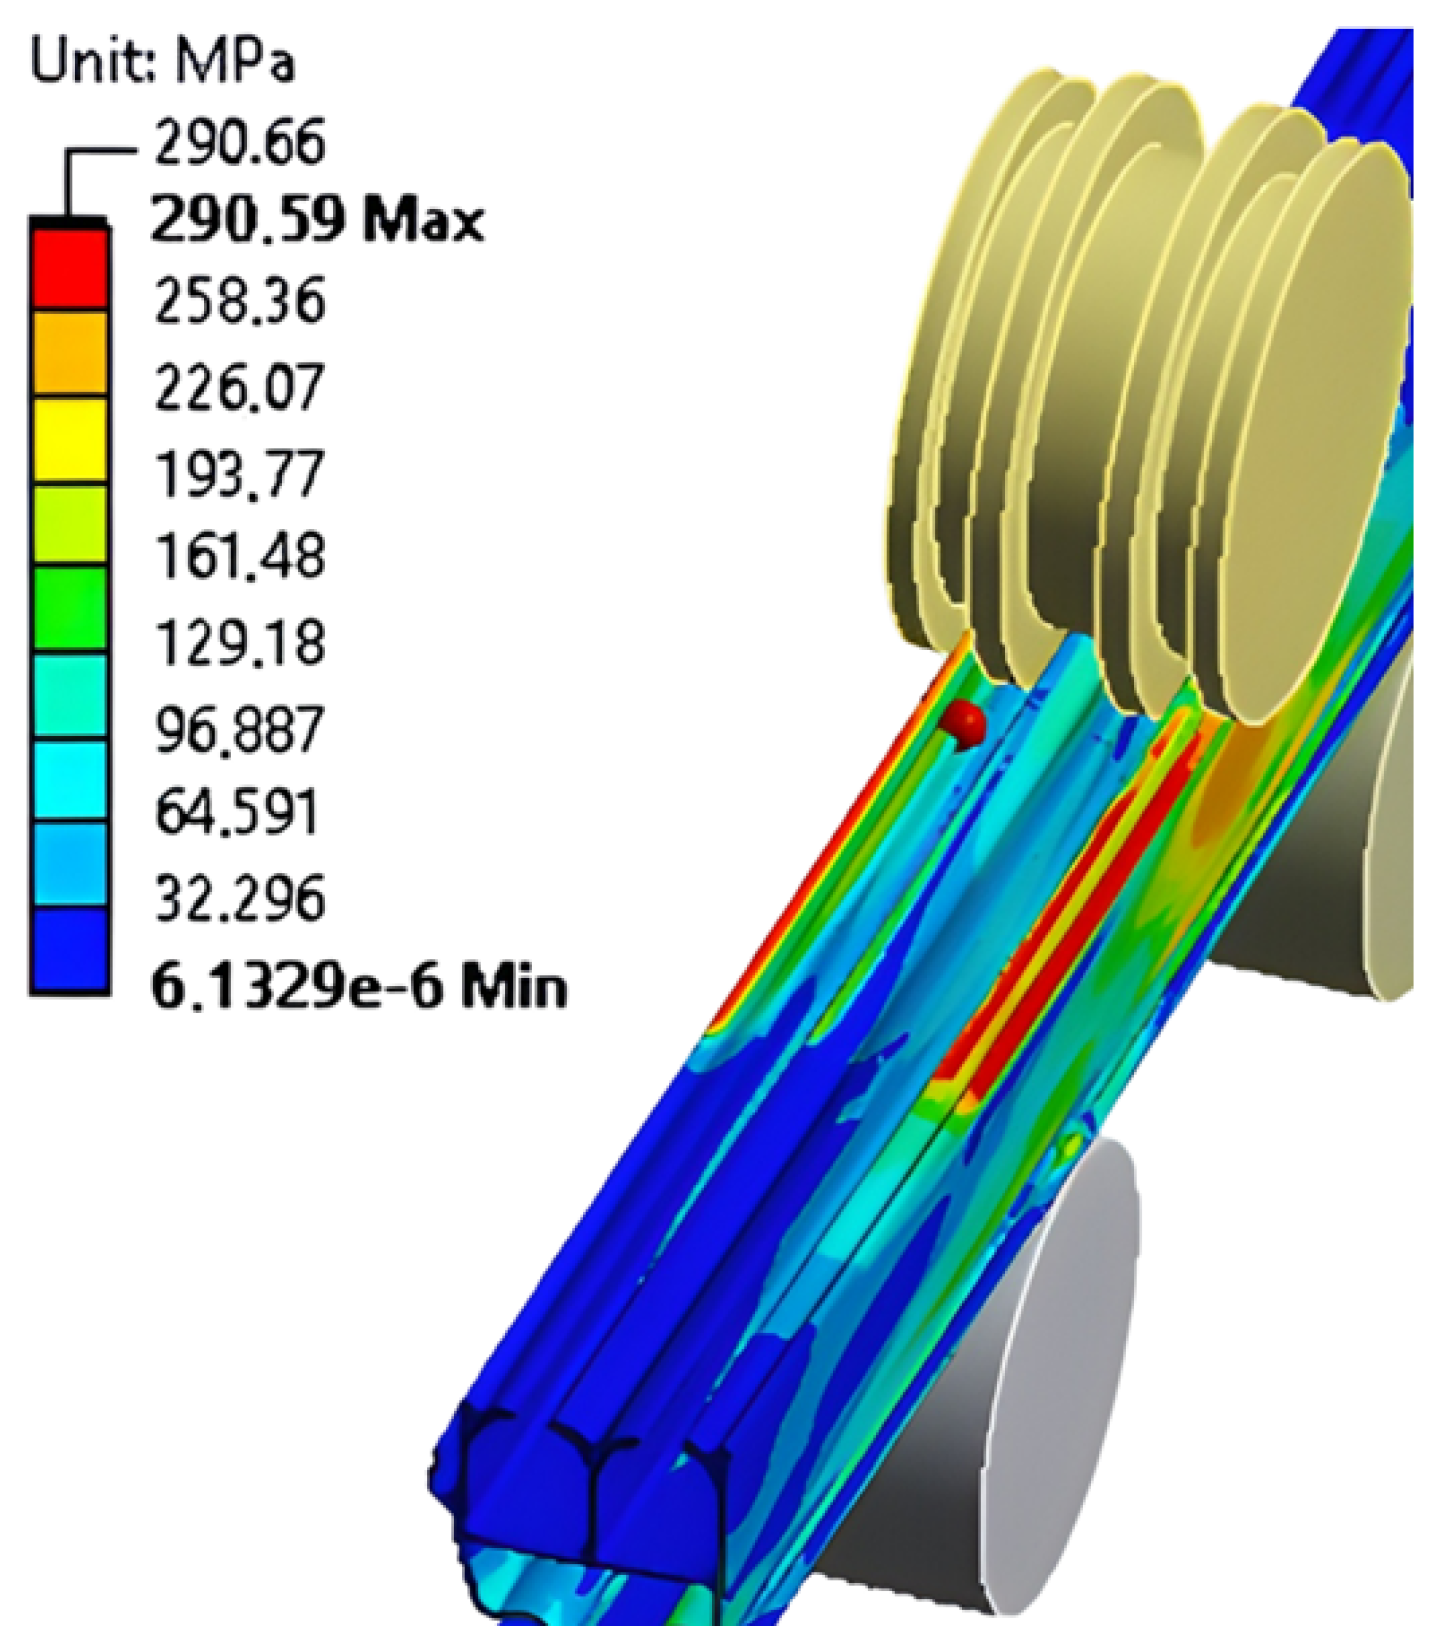
Table 9 and Figure 23 present the displacements obtained in different regions of the profile’s cross-section (indicated as D1 to D11), as well as the lateral bending radius (LR), for three different bending radii applied in the three-roller bending process. Figure 24 and Figure 25 illustrate the curve fittings generated for the displacements and the lateral bending radius, respectively. Finally, Figure 26 and Figure 27 show the von Mises stress distribution on the top and bottom regions of Profile 3, considering the smallest bending radius simulated.
Based on the results presented in Table 9 and Figure 23, Figure 24, Figure 25, Figure 26 and Figure 27, the following main observations can be highlighted:
For Profile 3, the stress distribution indicated values consistently close to the material limit across all bending radii. At the largest radius analyzed (r = 34,321.23 mm), the maximum von Mises stress was 288.17 MPa, while at r = 20,133.95 mm and r = 13,052.88 mm the stresses increased to 289.93 MPa and 290.59 MPa, respectively. These values are practically coincident with the UTS of aluminum 6061-T6, showing that the profile operates at the threshold of collapse under all investigated conditions. Even minor uncertainties, such as local thickness variations or geometric imperfections, could trigger premature failure. Therefore, the safe structural application of this profile should be limited to radii greater than 20,000 mm, unless stress relief treatments or design modifications are adopted.
The displacement response reflected the profile’s complex geometry. For r = 34,321.23 mm, displacements remained below 1 mm across the section, but at r = 13,052.88 mm values exceeded 4 mm in several locations (e.g., D3 = 4.22 mm, D7 = 4.10 mm, D10 = 3.62 mm). These deformations are linked to local instabilities such as ovalization and partial buckling of the thin vertical and horizontal branches, which reduce sectional stiffness and amplify asymmetric displacements (see Figure 3). Additionally, the profile developed a marked lateral curvature (LR), with the lateral bending radius decreasing from 160,326 mm to 45,782 mm between the largest and smallest radii. This torsional distortion arises from the uneven stiffness distribution along the cross-section and can compromise dimensional tolerances, alignment, and flatness in applications requiring precision. These results confirm that Profile 3 is highly sensitive to the applied bending radius and must be carefully evaluated in terms of both local stresses and global distortions before practical implementation.

3.2.4. Numerical Analysis of the Mechanical Behavior of Profile 4

Table 10 presents the outcomes of the Profile 4’s mesh independence study. It is observed that, from the mesh with 54,142 finite elements, the relative difference between the values of σ m a x v M obtained from successive meshes drops to 0.25%, a value below the conventionally adopted threshold (RD ≤ 0.5%). Thus, this discretization was considered converged and was used for the subsequent simulations.
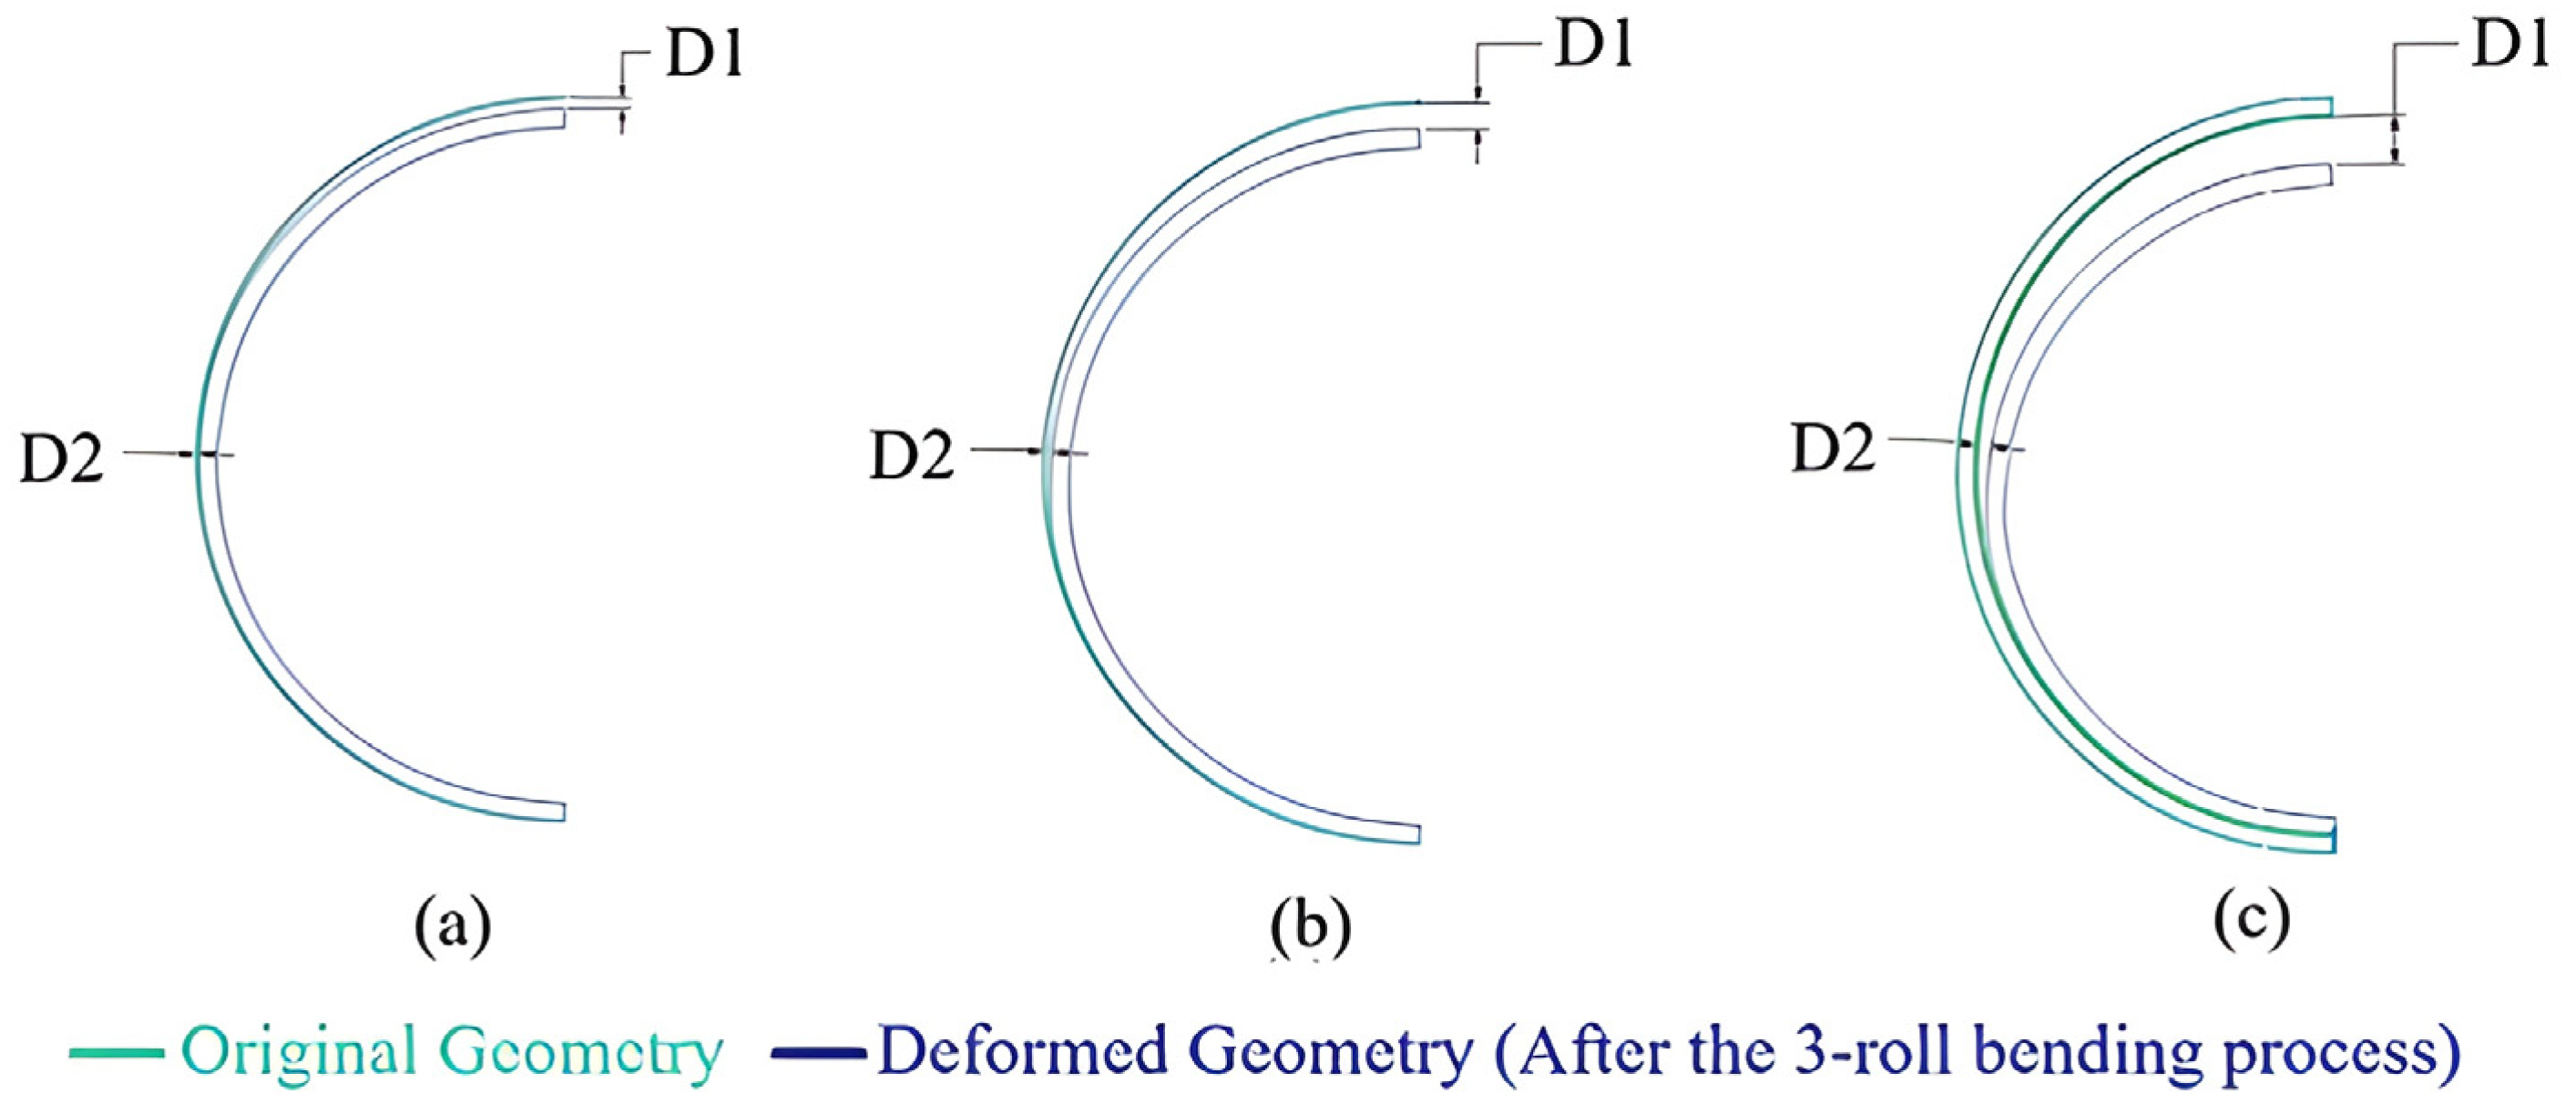
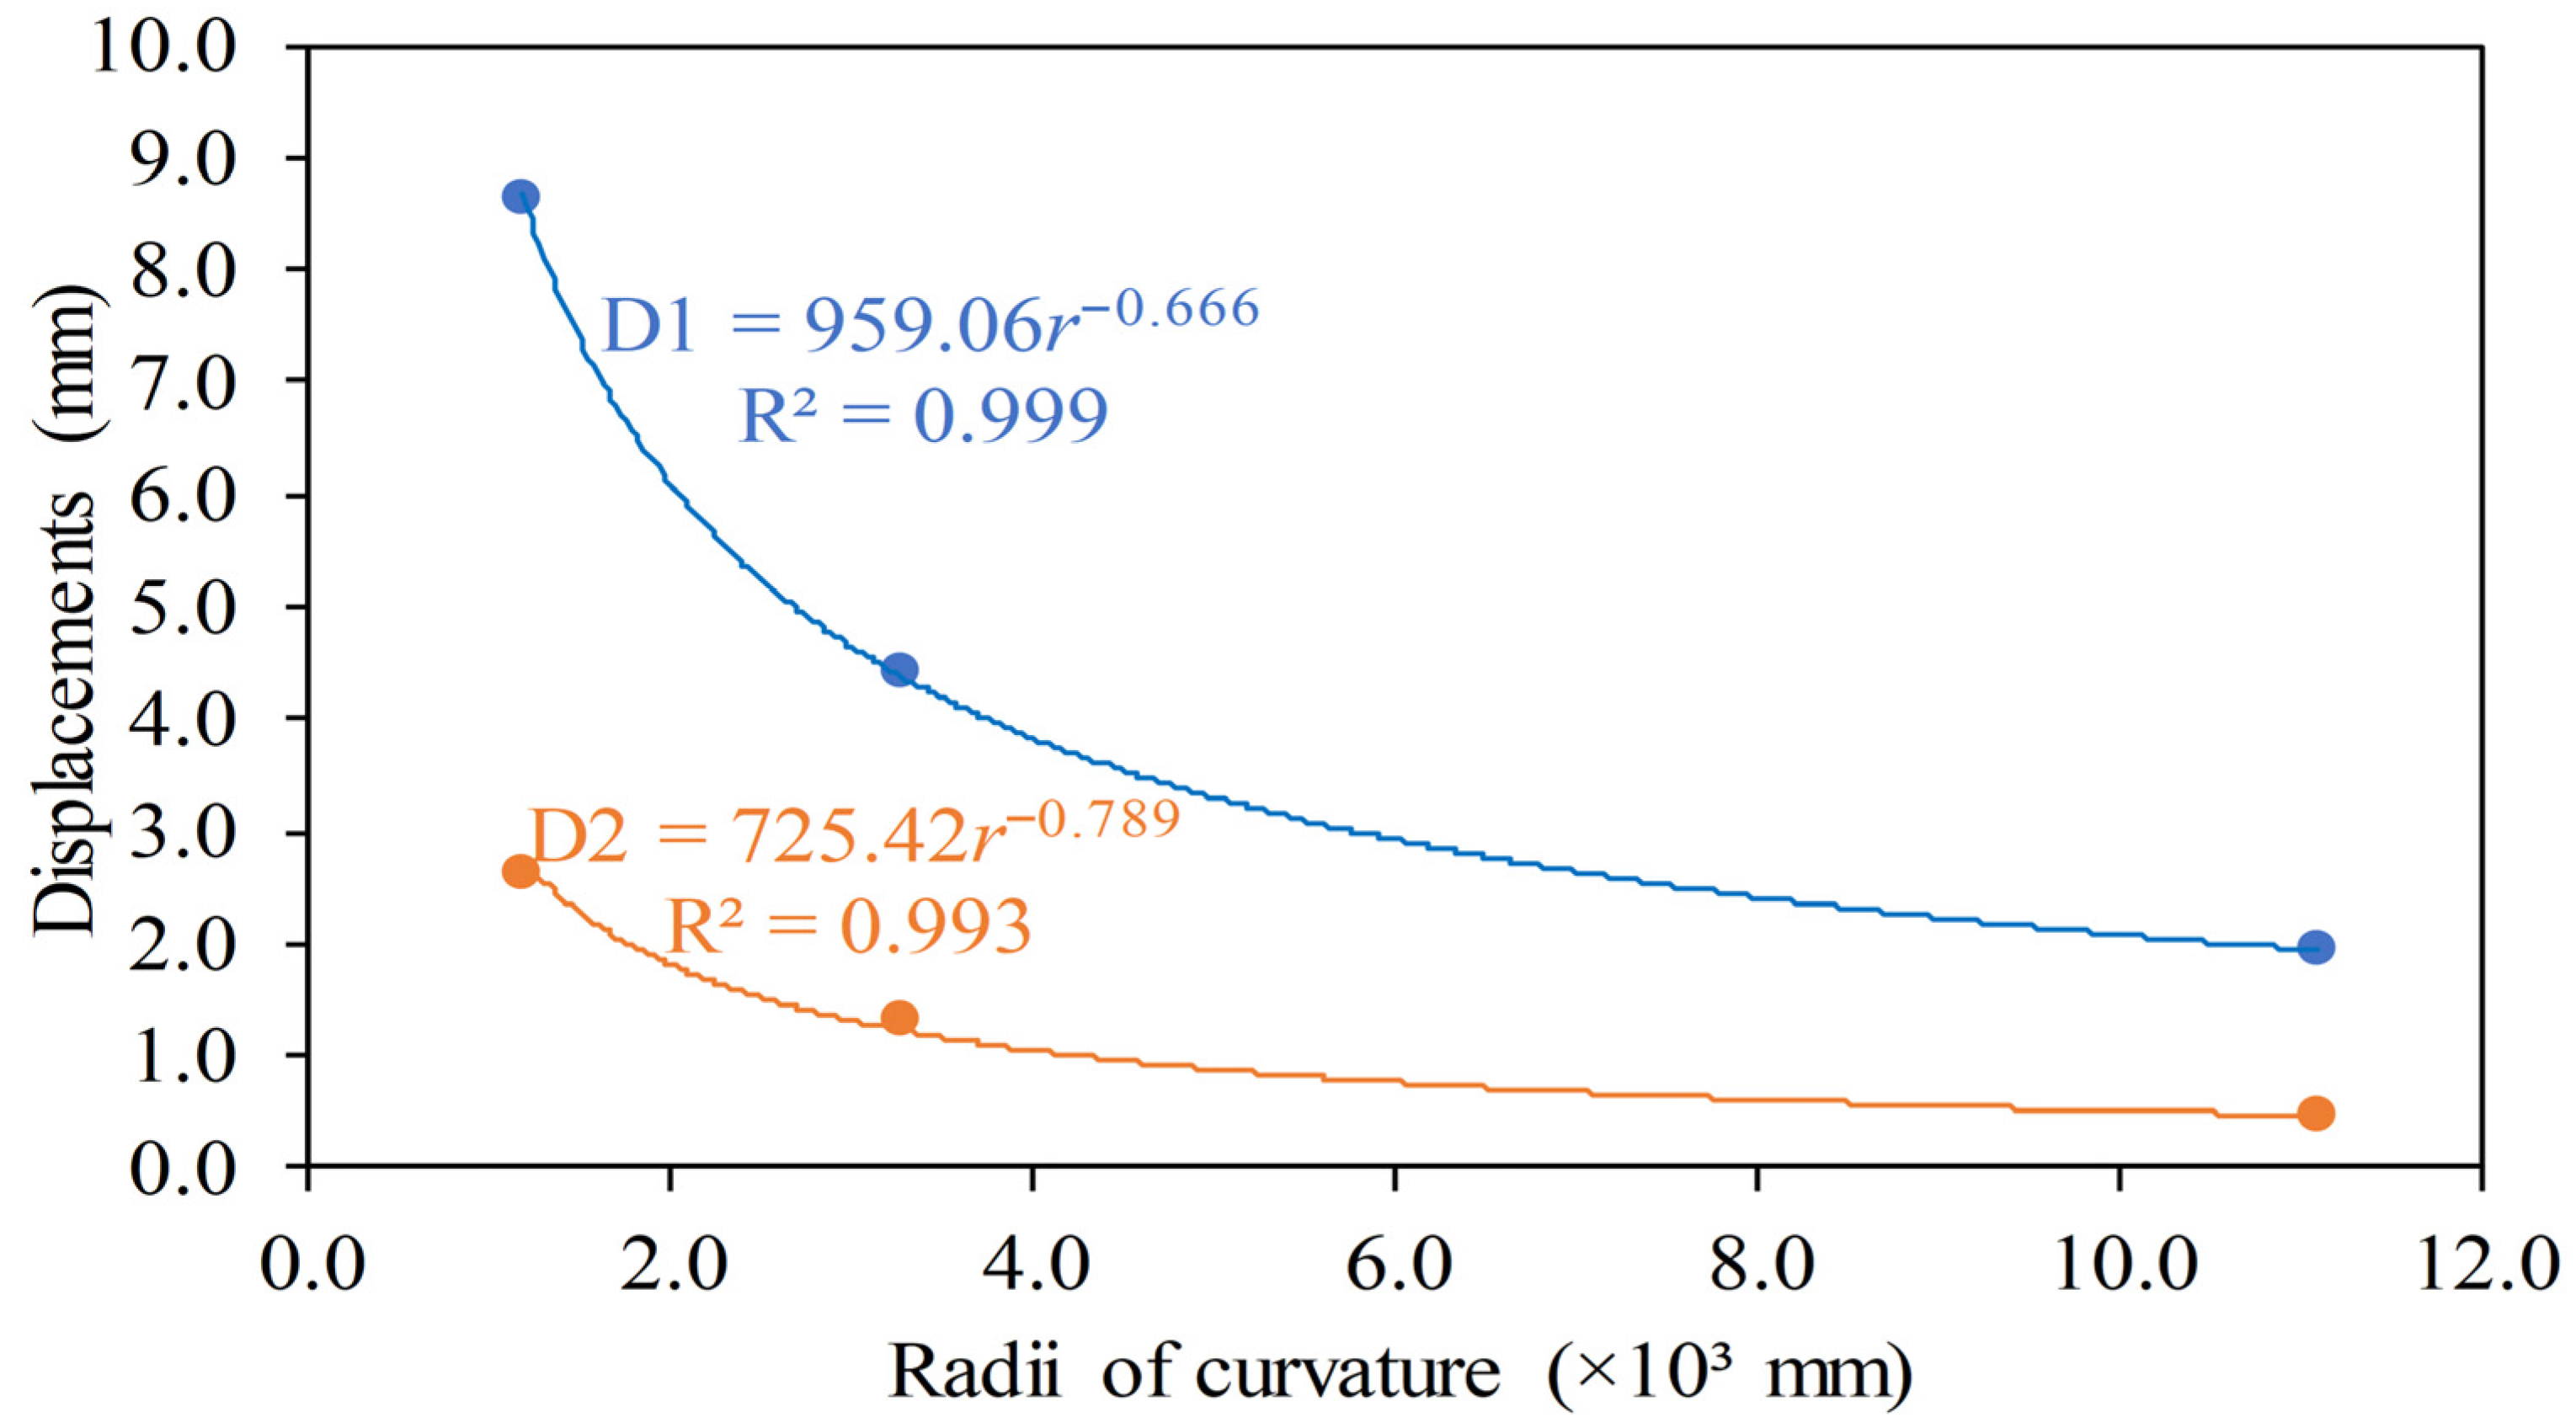
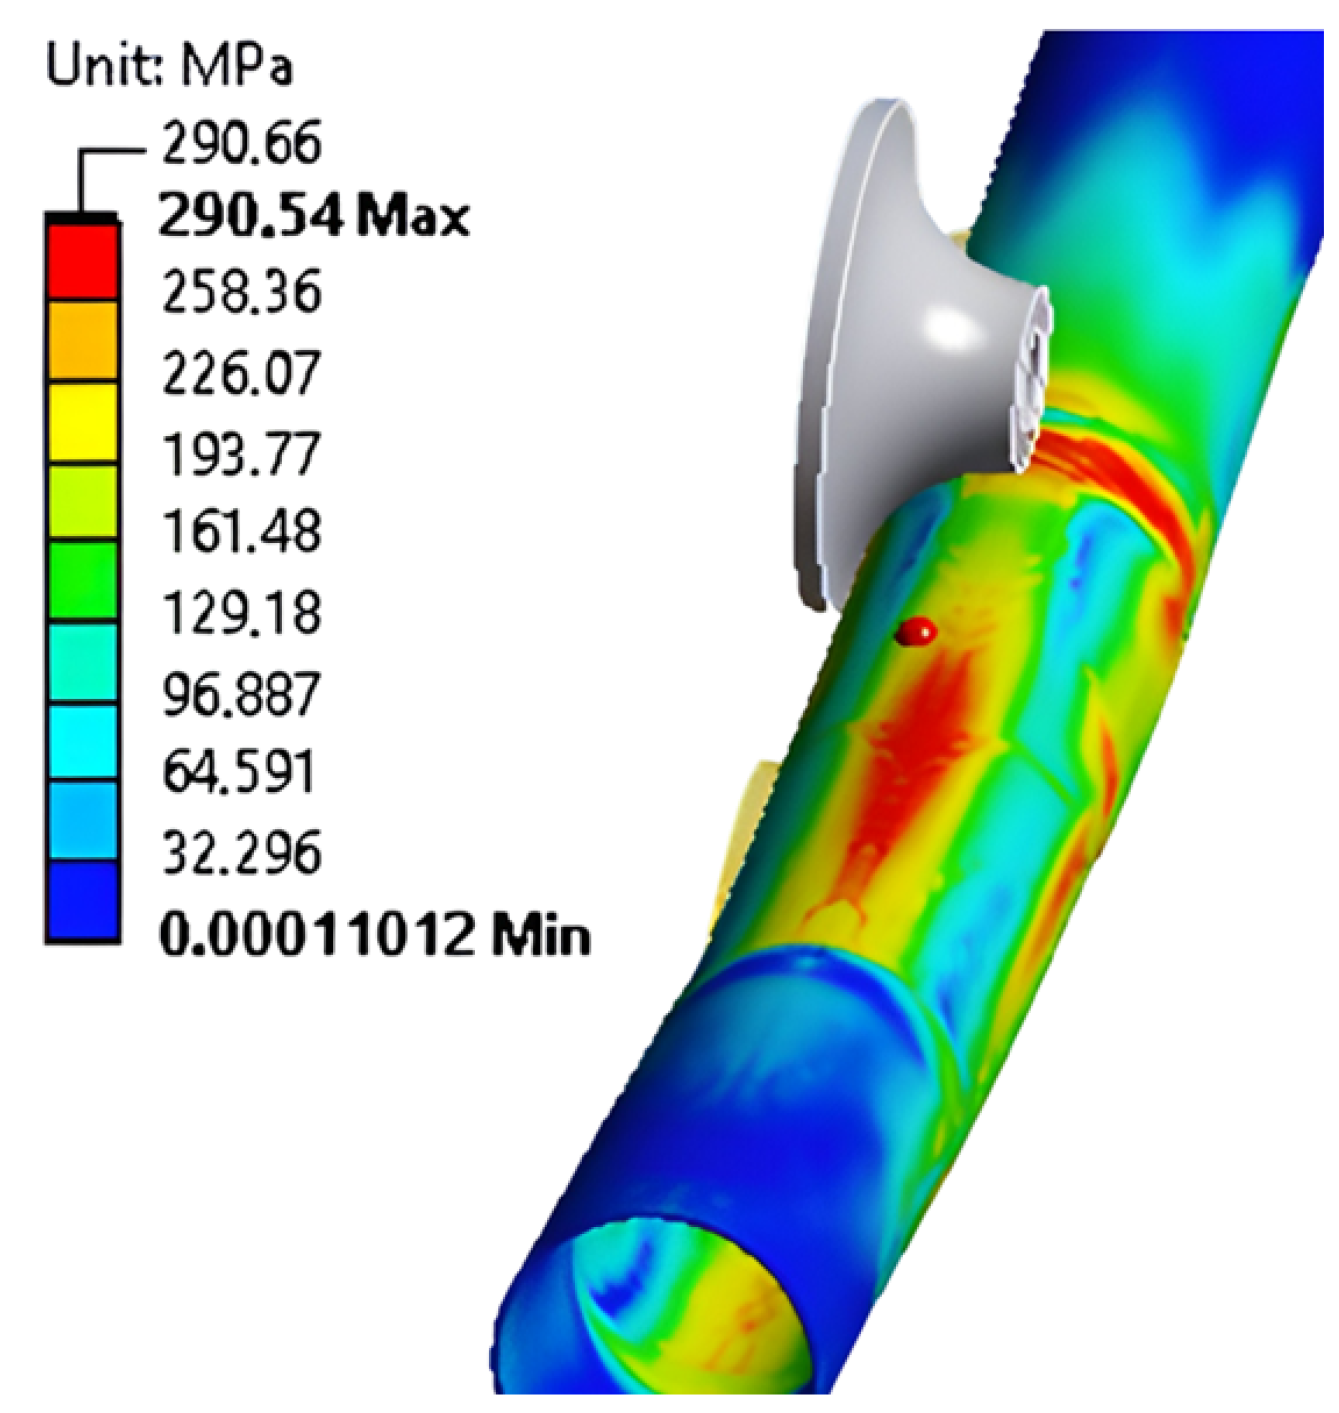
Table 11, together with Figure 28, Figure 29, Figure 30 and Figure 31, presents the numerical results obtained for Profile 4, subjected to the three-roll bending process. Three different bending radii were simulated for the purpose of analyzing the mechanical behavior of the profile subjected to different levels of imposed bending.
Based on Table 11 and Figure 28, Figure 29, Figure 30 and Figure 31, the following insights were derived from the analysis of the results:
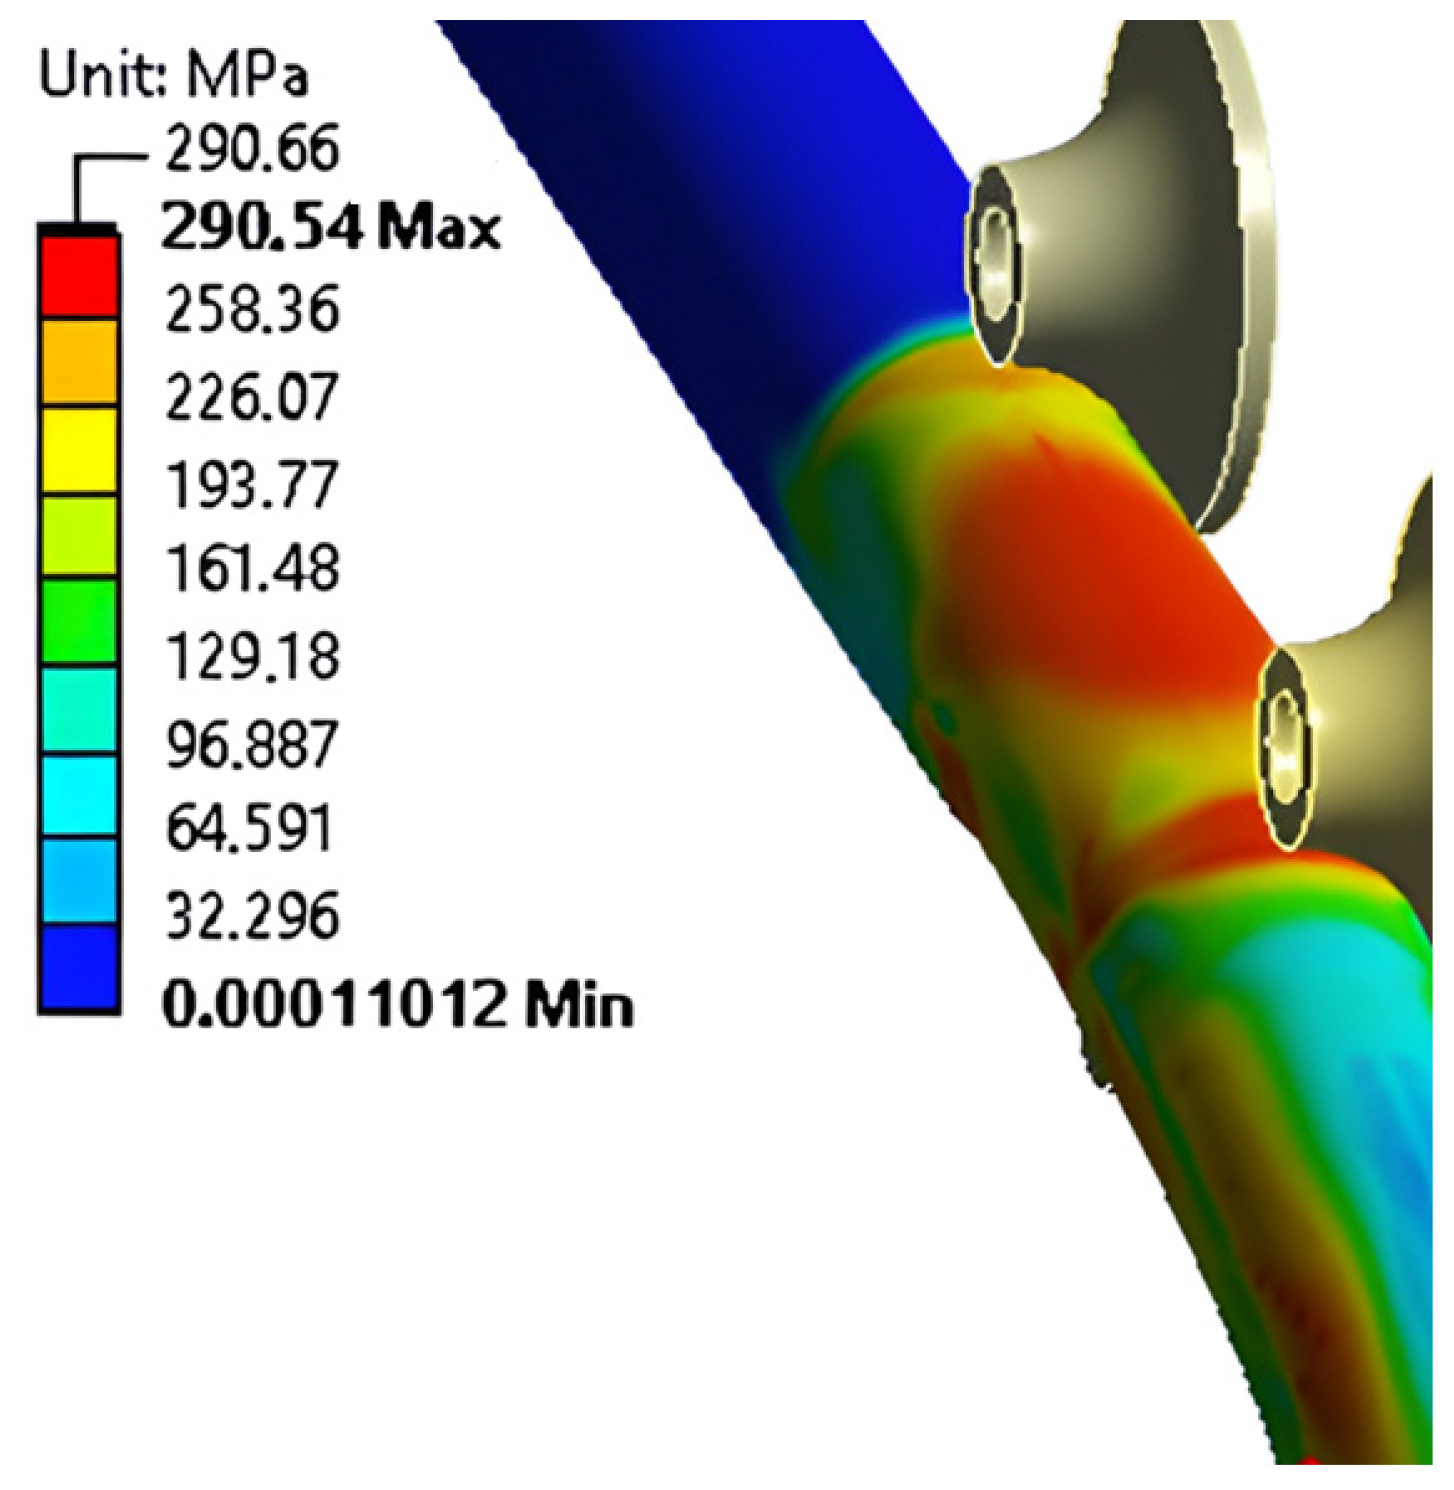
For Profile 4, the stress distribution indicated values close to the material limit across all investigated radii. At the largest bending radius (r = 11,084.39 mm), the maximum von Mises stress was 286.72 MPa, while at r = 3267.92 mm and r = 1166.53 mm the stresses increased to 290.26 MPa and 290.54 MPa, respectively, practically coinciding with the UTS of aluminum 6061-T6. Stress concentrations were observed in the upper and lower walls of the tubular section, corresponding to the compressed and tensioned regions under bending, as shown in Figure 30 and Figure 31.
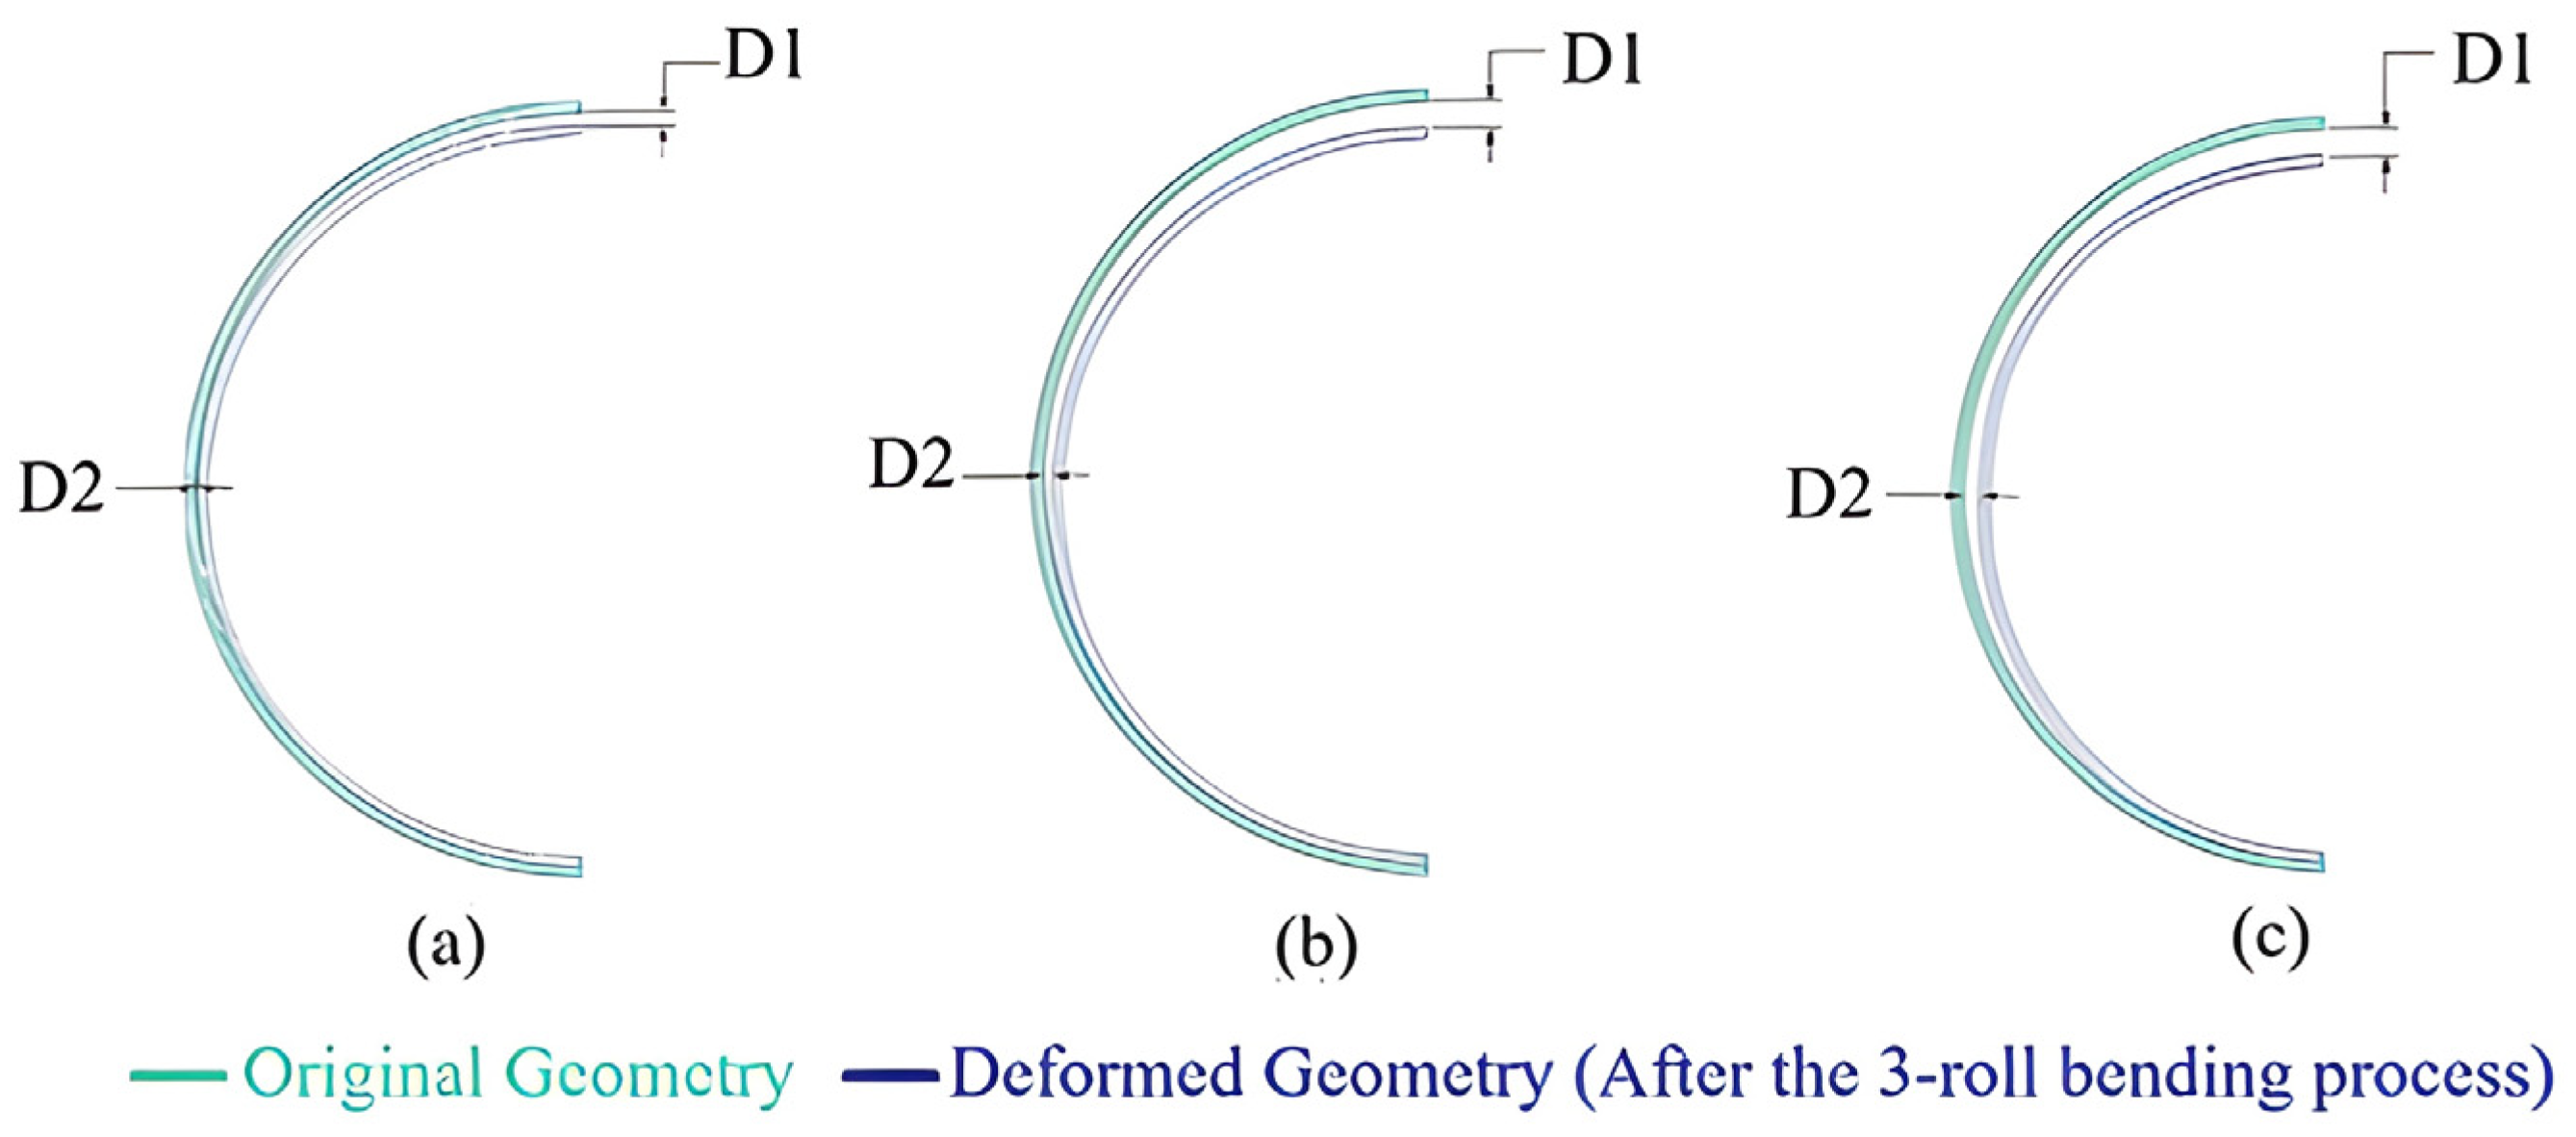
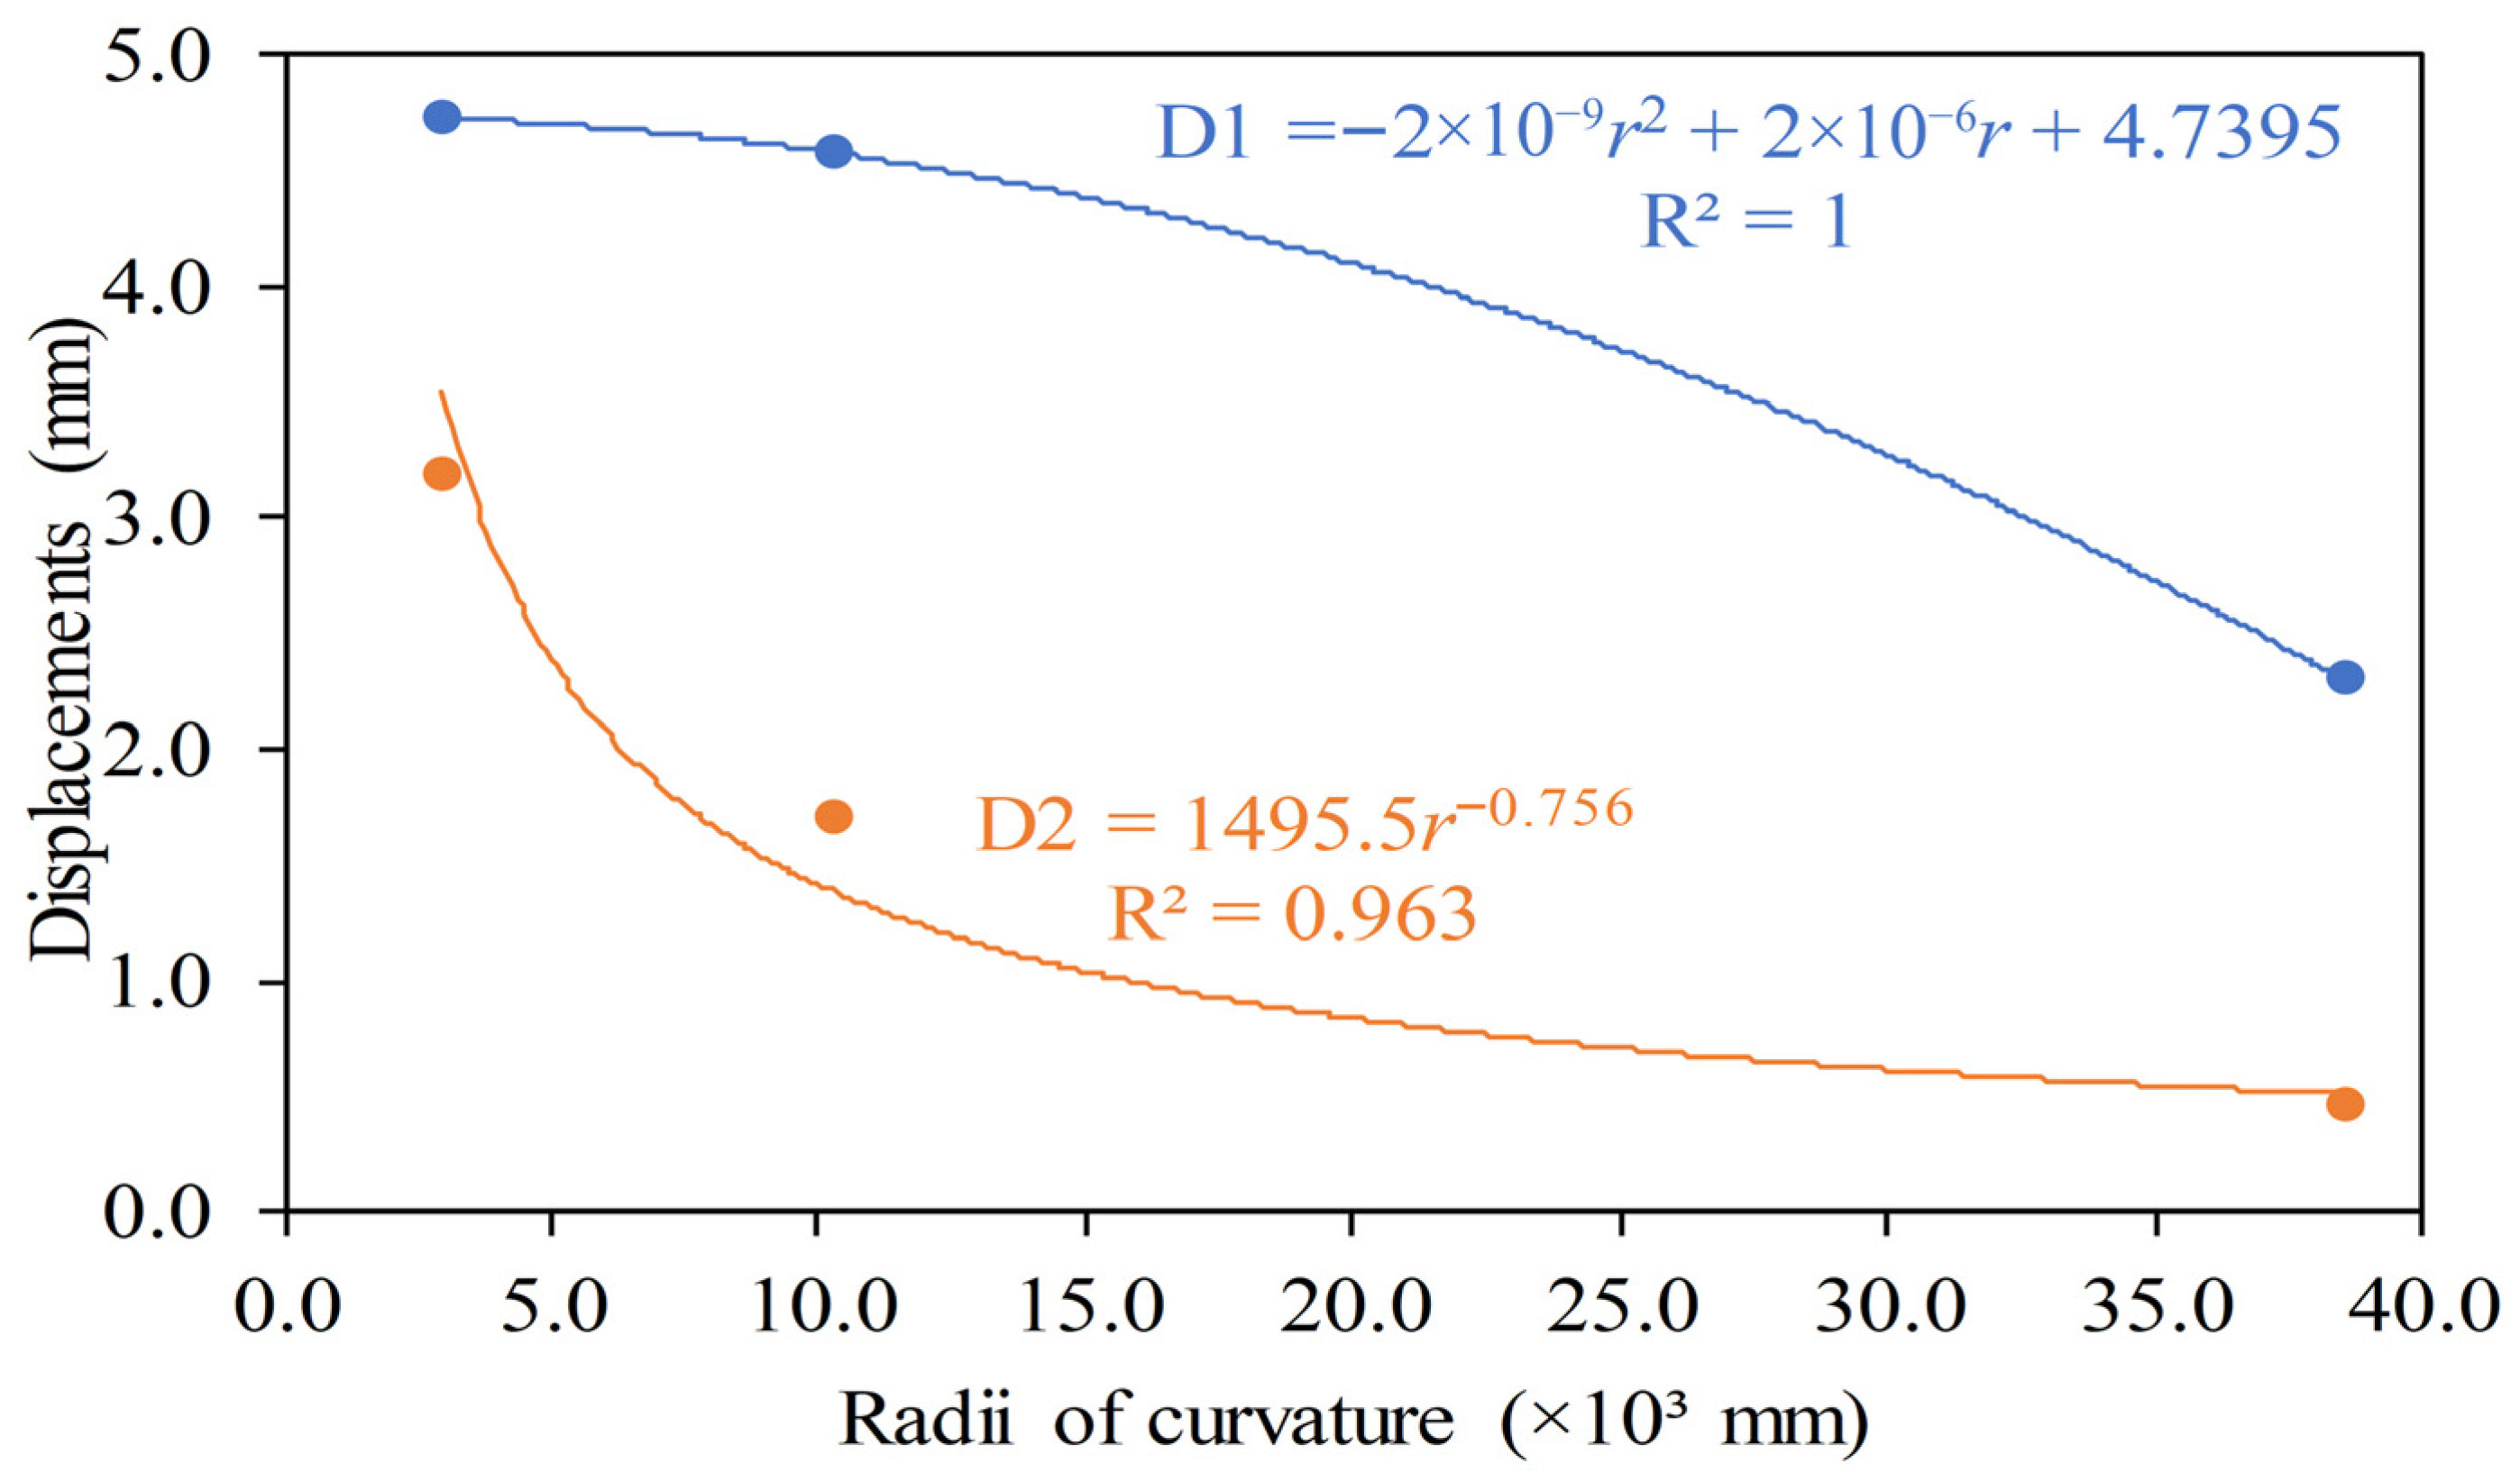
The displacement response reflected the thin-walled tubular geometry of the profile. Regions D1 and D2 exhibited exponential growth in displacements as the bending radius decreased, reaching critical values at r = 1166.53 mm (Table 11, Figure 29). This behavior is associated with the high diameter-to-thickness ratio, which reduces sectional stiffness and promotes large elastic–plastic deformations even under moderate loading. Furthermore, ovalization of the cross-section was clearly observed, with the initially circular shape deforming into an elliptical contour, as illustrated in Figure 28. This ovalization explains the asymmetric displacement response between D1 and D2: while D1 is mainly influenced by longitudinal strain components, D2 is affected by circumferential stresses accumulated in the wall. Finally, it is noteworthy that the regions with the highest displacements coincided with the areas of maximum von Mises stresses, reinforcing the need to evaluate the deformed geometry when assessing the structural integrity of thin-walled tubular profiles.

3.2.5. Numerical Analysis of the Mechanical Behavior of Profile 5

Table 12 presents the results of the mesh convergence test for Profile 5. It is observed that, starting from the mesh with 34,147 elements, the relative difference between the maximum von Mises stresses obtained from successive meshes is reduced to 0.50%, coinciding with the limit value of the conventionally adopted criterion (RD ≤ 0.5%). Thus, this mesh was considered adequate and was used in the subsequent simulations for this profile.
Table 13, together with Figure 32, Figure 33, Figure 34 and Figure 35, presents the numerical results obtained for Profile 5, subjected to the three-roll bending process. Three bending radii were simulated aiming to analyze the structural behavior of the profile when subjected to different levels of imposed flexion. It is worth noting that, although Profile 5 has the same cross-sectional geometry as Profile 4, it differs by having a significantly thinner wall thickness (1.5 mm versus 3.18 mm), which directly impacts its stiffness and mechanical response to the forming process.
Based on the results from Table 13 and Figure 32, Figure 33, Figure 34 and Figure 35, the following observations were made.
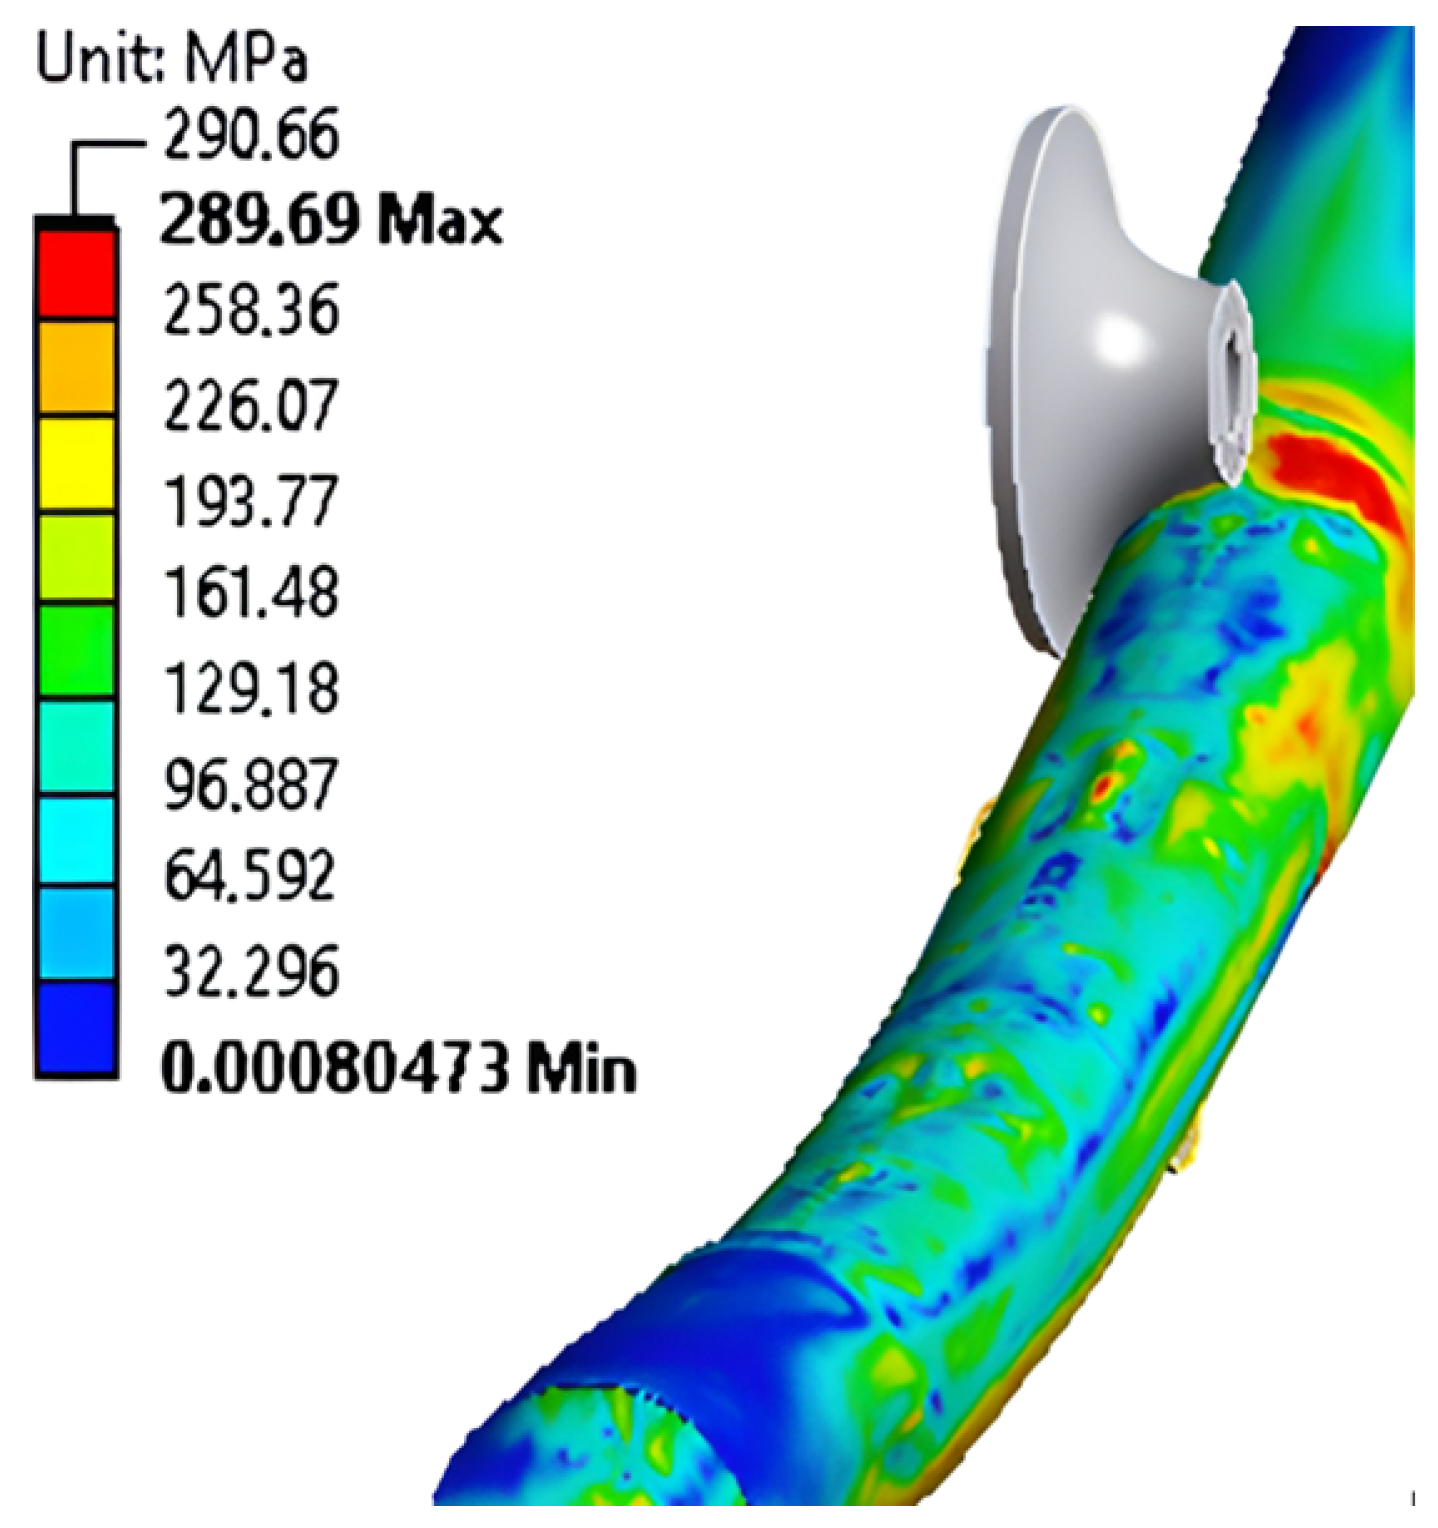
For Profile 5, the reduced wall thickness (1.50 mm) led to high stress levels even at the largest bending radius (r = 38,517.83 mm), where the maximum von Mises stress reached 285.61 MPa. For smaller radii (10,257.22 mm and 2961.42 mm), the stresses increased to 289.37 MPa and 289.69 MPa, respectively, approaching the UTS of aluminum 6061-T6. Compared to Profile 4 (wall thickness 3.18 mm), Profile 5 exhibited stronger local intensification of stresses, meaning that similar global deformations generated higher internal stresses. The distributions shown in Figure 32 and Figure 34 confirmed this trend, with concentrations at the upper and lower walls corresponding to tensioned and compressed zones, respectively. These results indicate that Profile 5 operates under structurally critical conditions, leaving a very narrow safety margin for practical applications.
The displacement analysis at points D1 and D2 (Table 13, Figure 32 and Figure 33) revealed severe cross-sectional instabilities. As the bending radius decreased, displacements grew substantially, exceeding the magnitudes observed in thicker profiles. This behavior is not merely a scaled version of Profile 4, but rather a change in structural response: due to slenderness, stresses were redistributed more diffusely, producing generalized deformations instead of sharply localized peaks. The cross-sectional ovalization was markedly stronger, with the circular geometry collapsing into an elliptical shape even at moderate curvatures (Figure 32b,c). The asymmetry between D1 and D2 also became more pronounced. While D1 reflected axial displacements of the curved axis, D2 exhibited exponential growth associated with local collapse of the thin wall. The von Mises stress distributions further supported this interpretation, showing broader plasticized regions rather than highly localized concentrations. These results characterize Profile 5 as prone to global instabilities and cross-sectional collapse, typical of thin-walled tubes under bending, which severely limits its structural applicability.

3.2.6. Numerical Analysis of the Mechanical Behavior of Profile 6 in Direction 1 (Vertical) and Direction 2 (Horizontal)

The mesh independence test results for Profile 6 are related in Table 14. One can note that, with 54,629 computational cells, the RD value is below 0.5%, characterizing a numerically converged mesh. Therefore, this mesh was adopted for the simulations of Profile 6, ensuring a satisfactory equilibrium between numerical accuracy and computational cost.
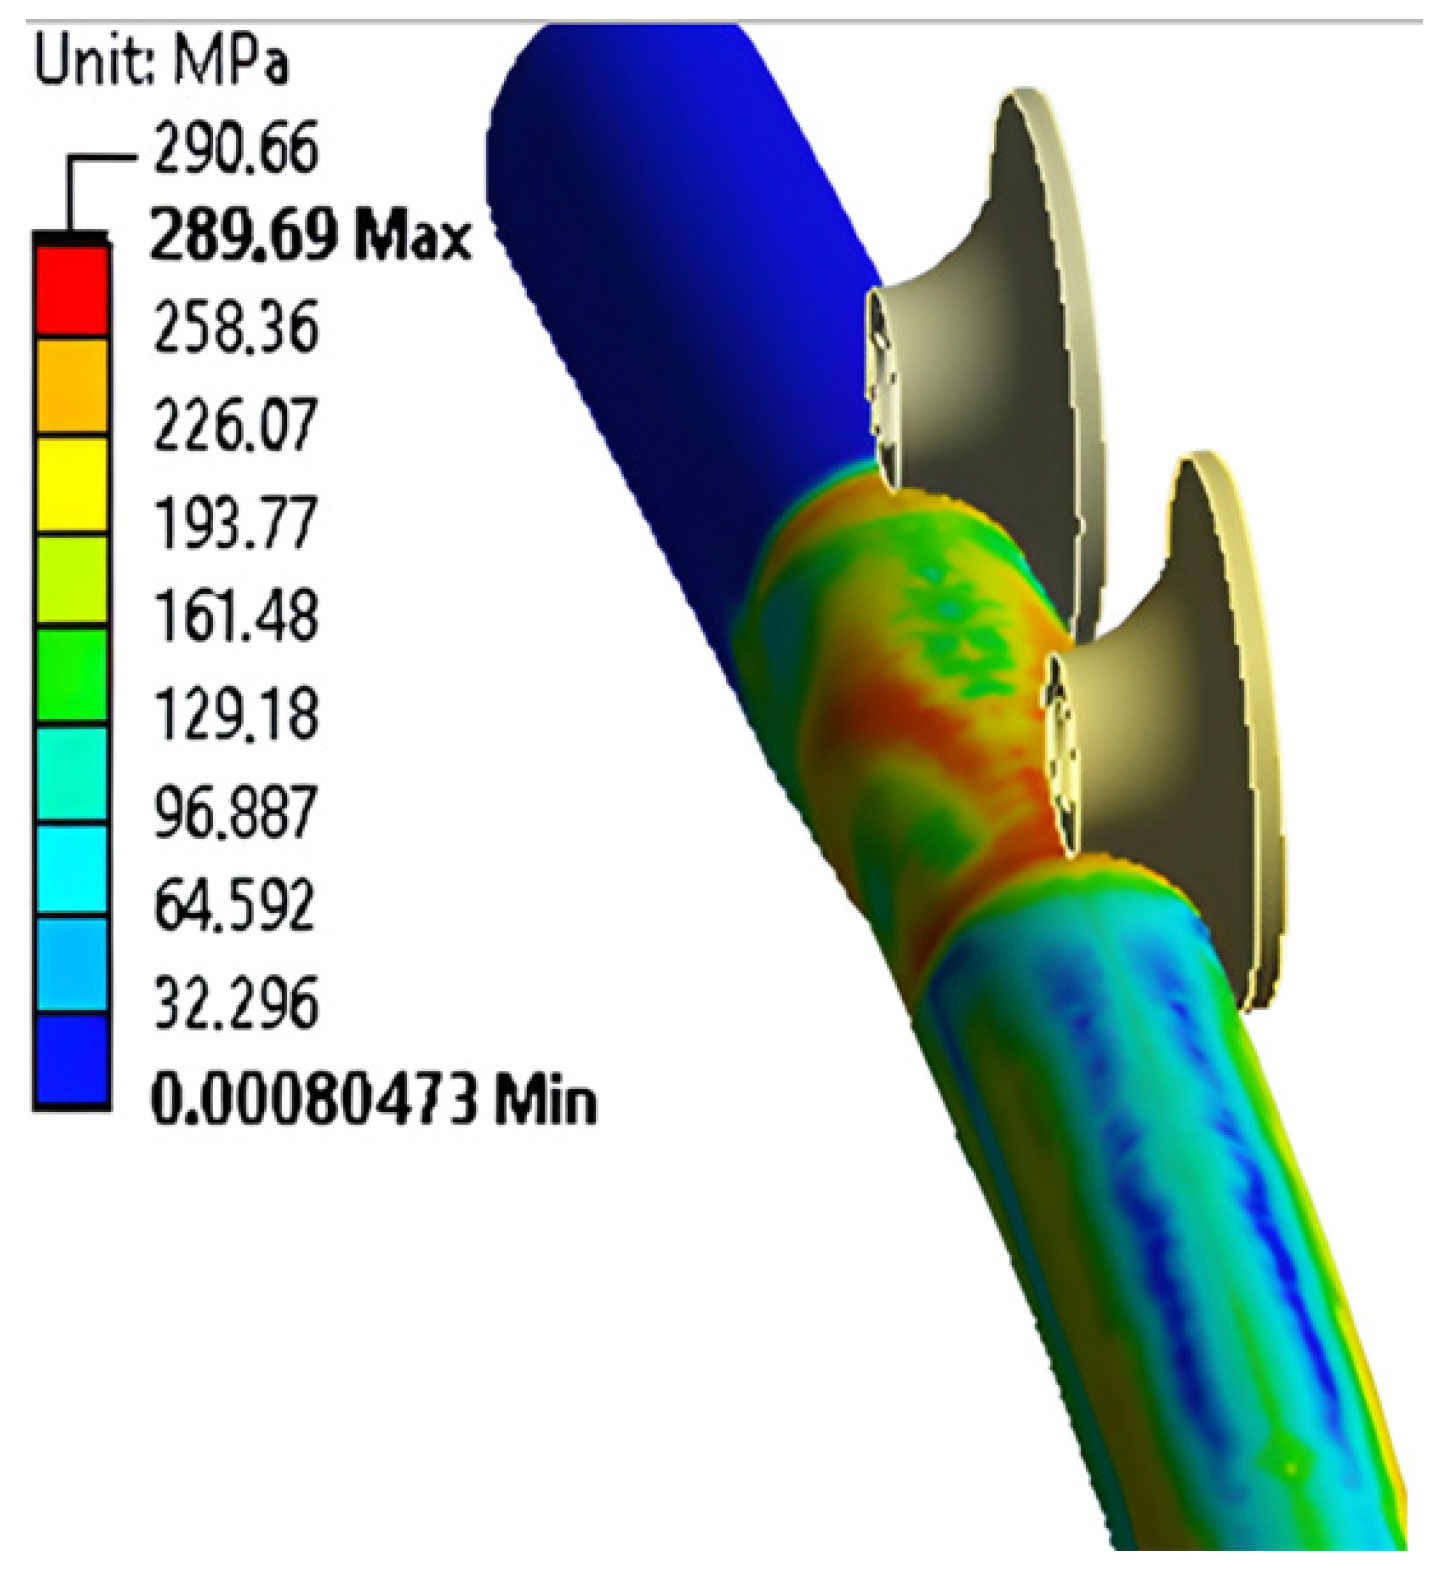
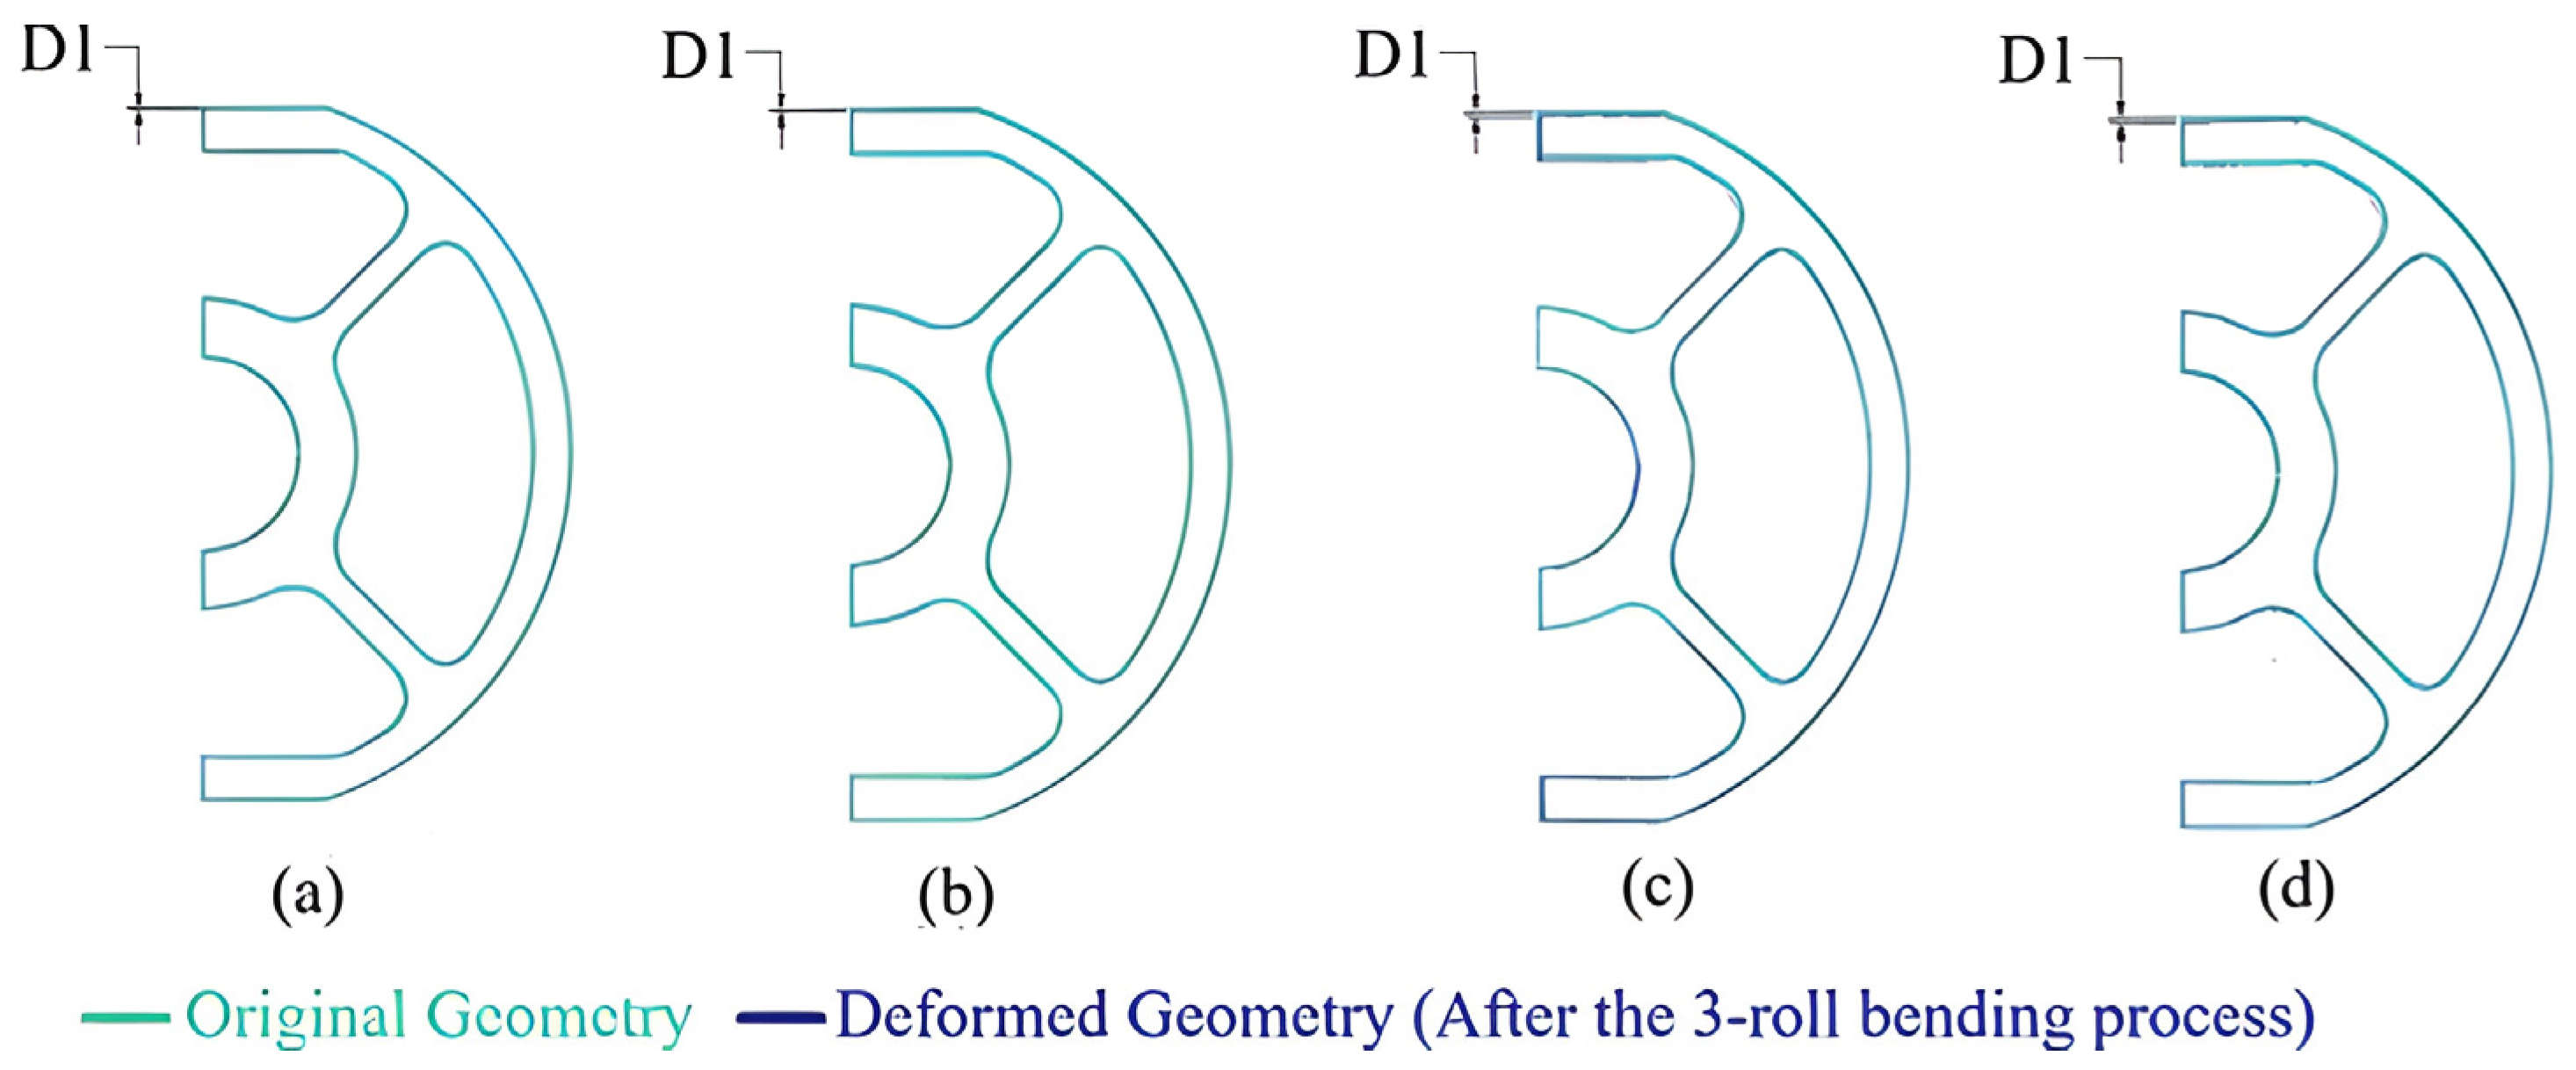
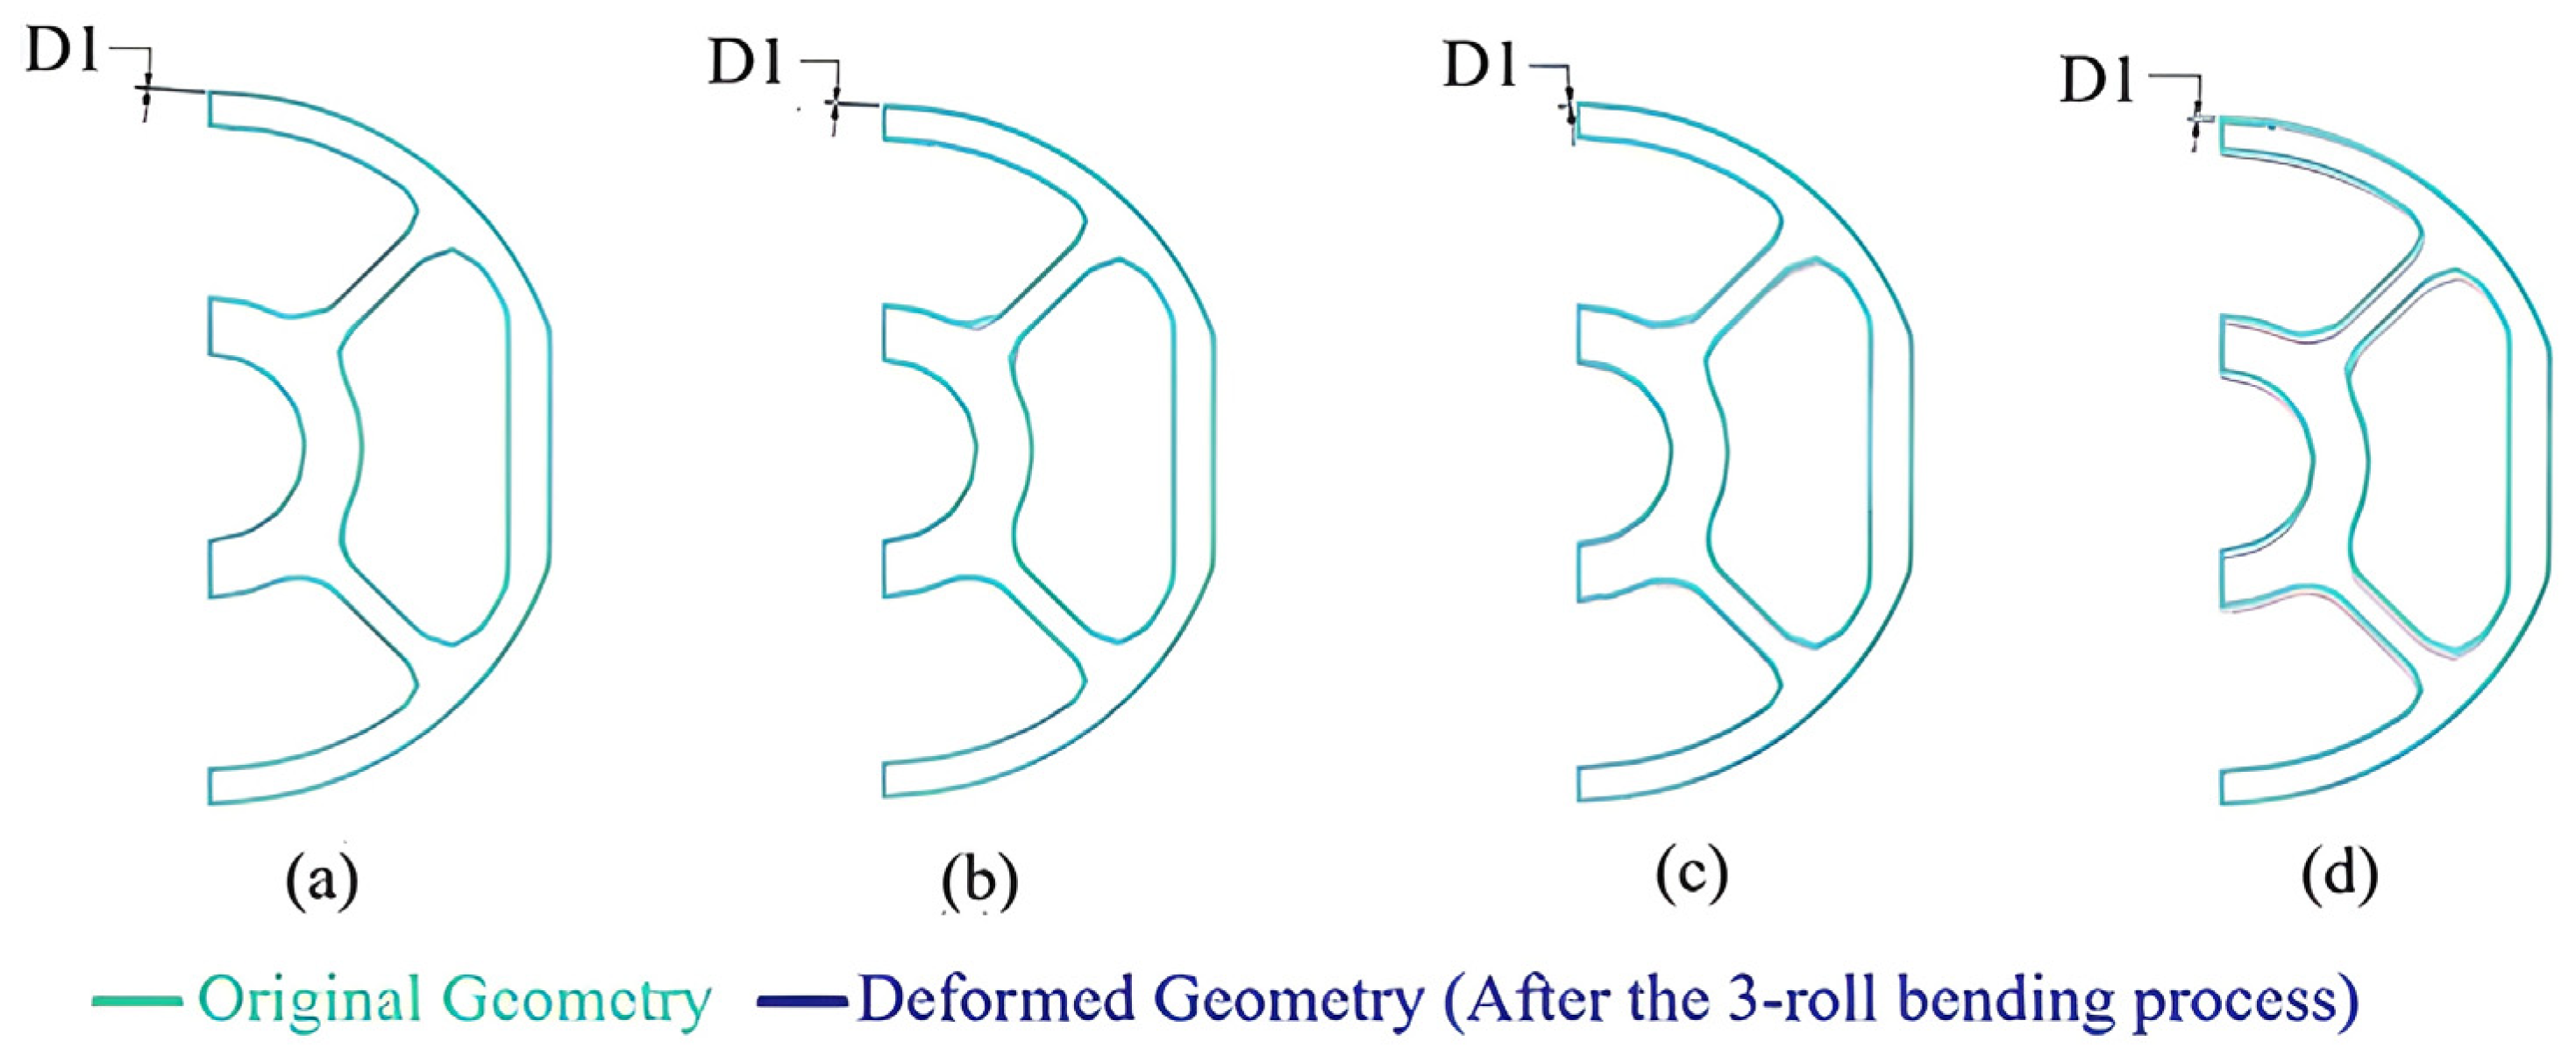
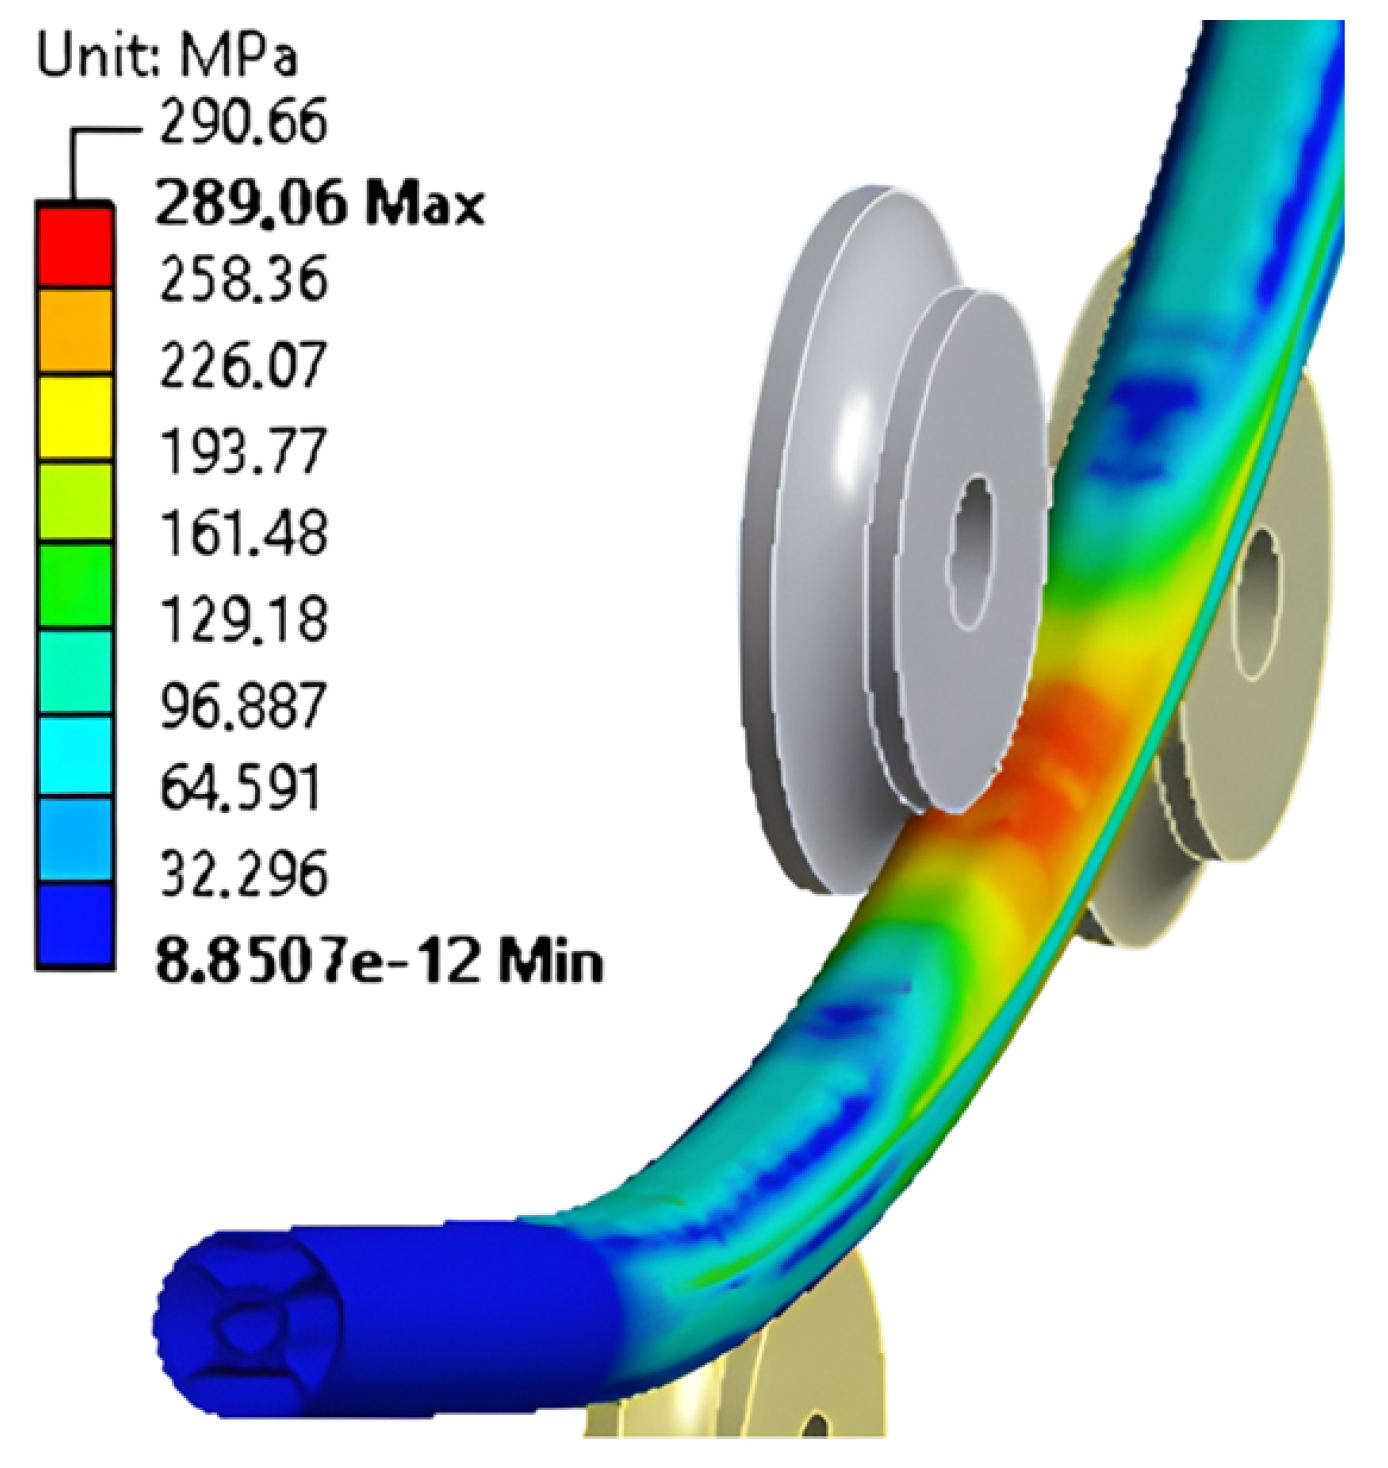
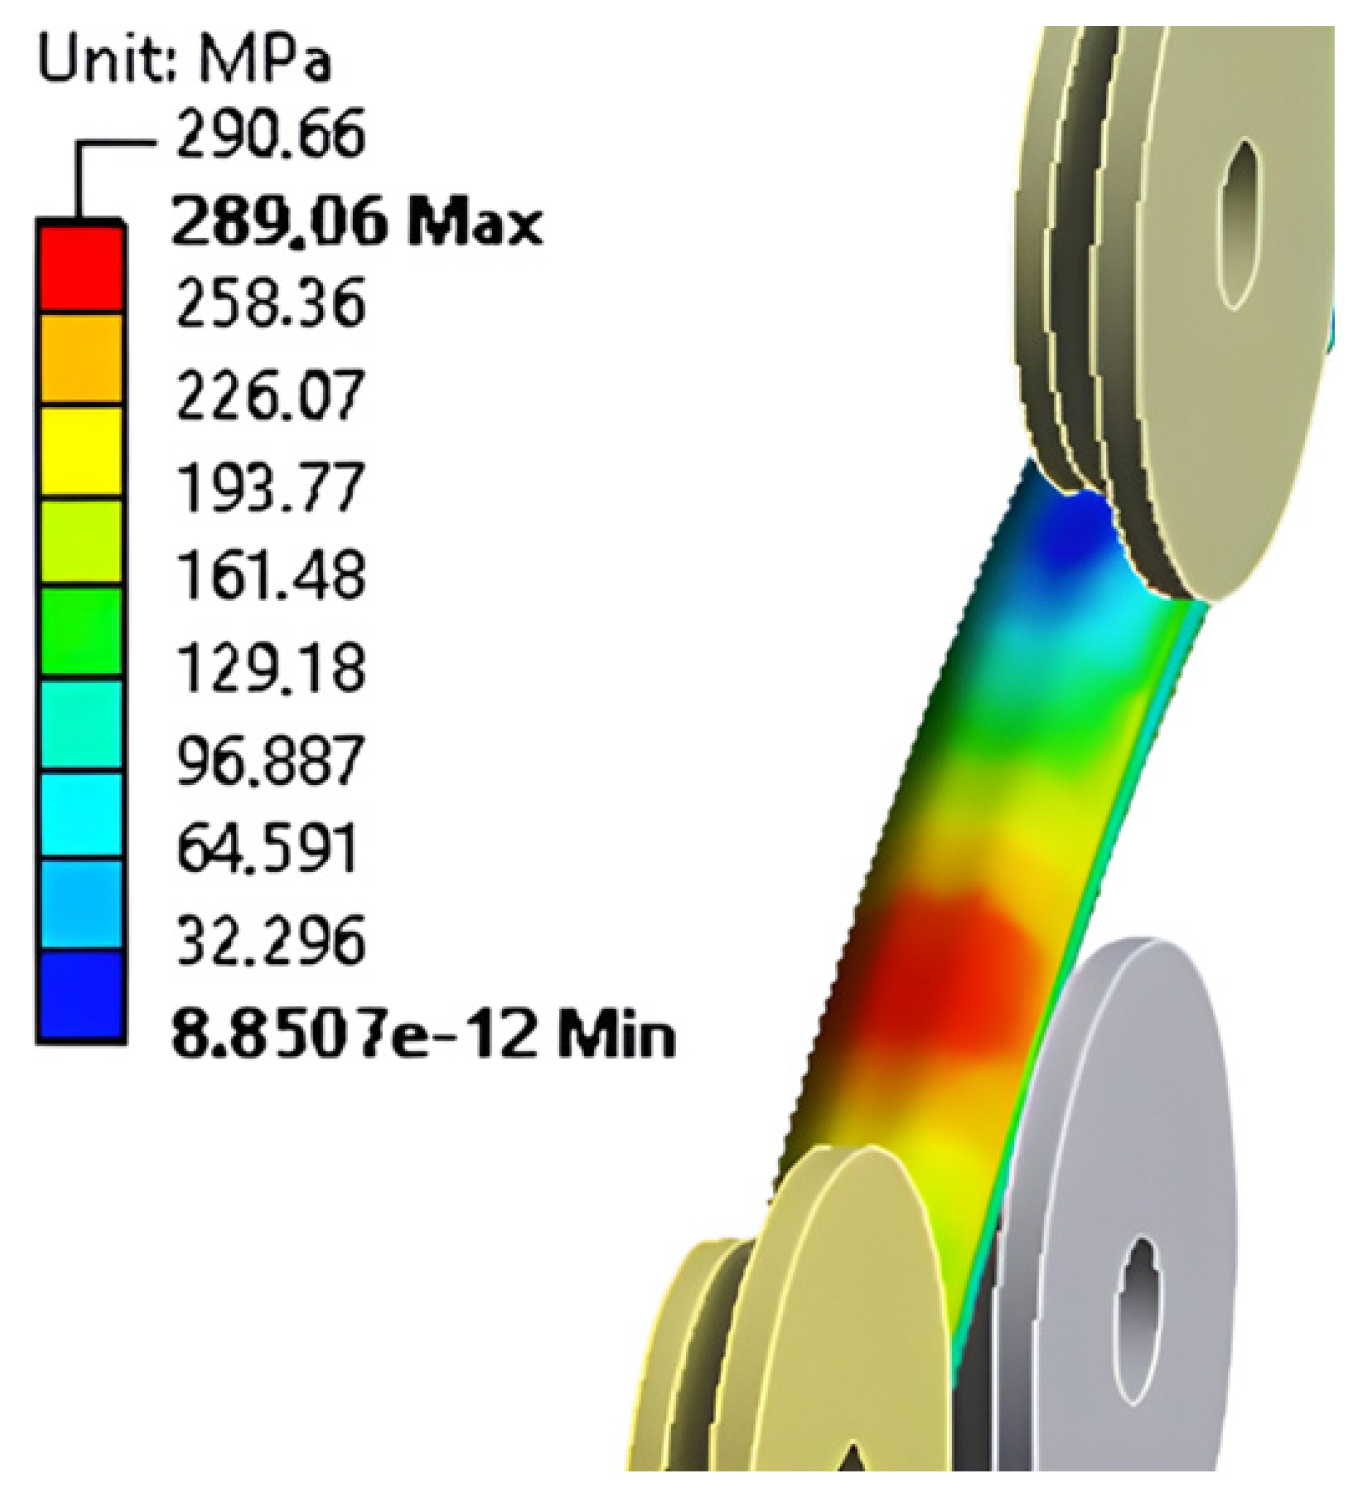
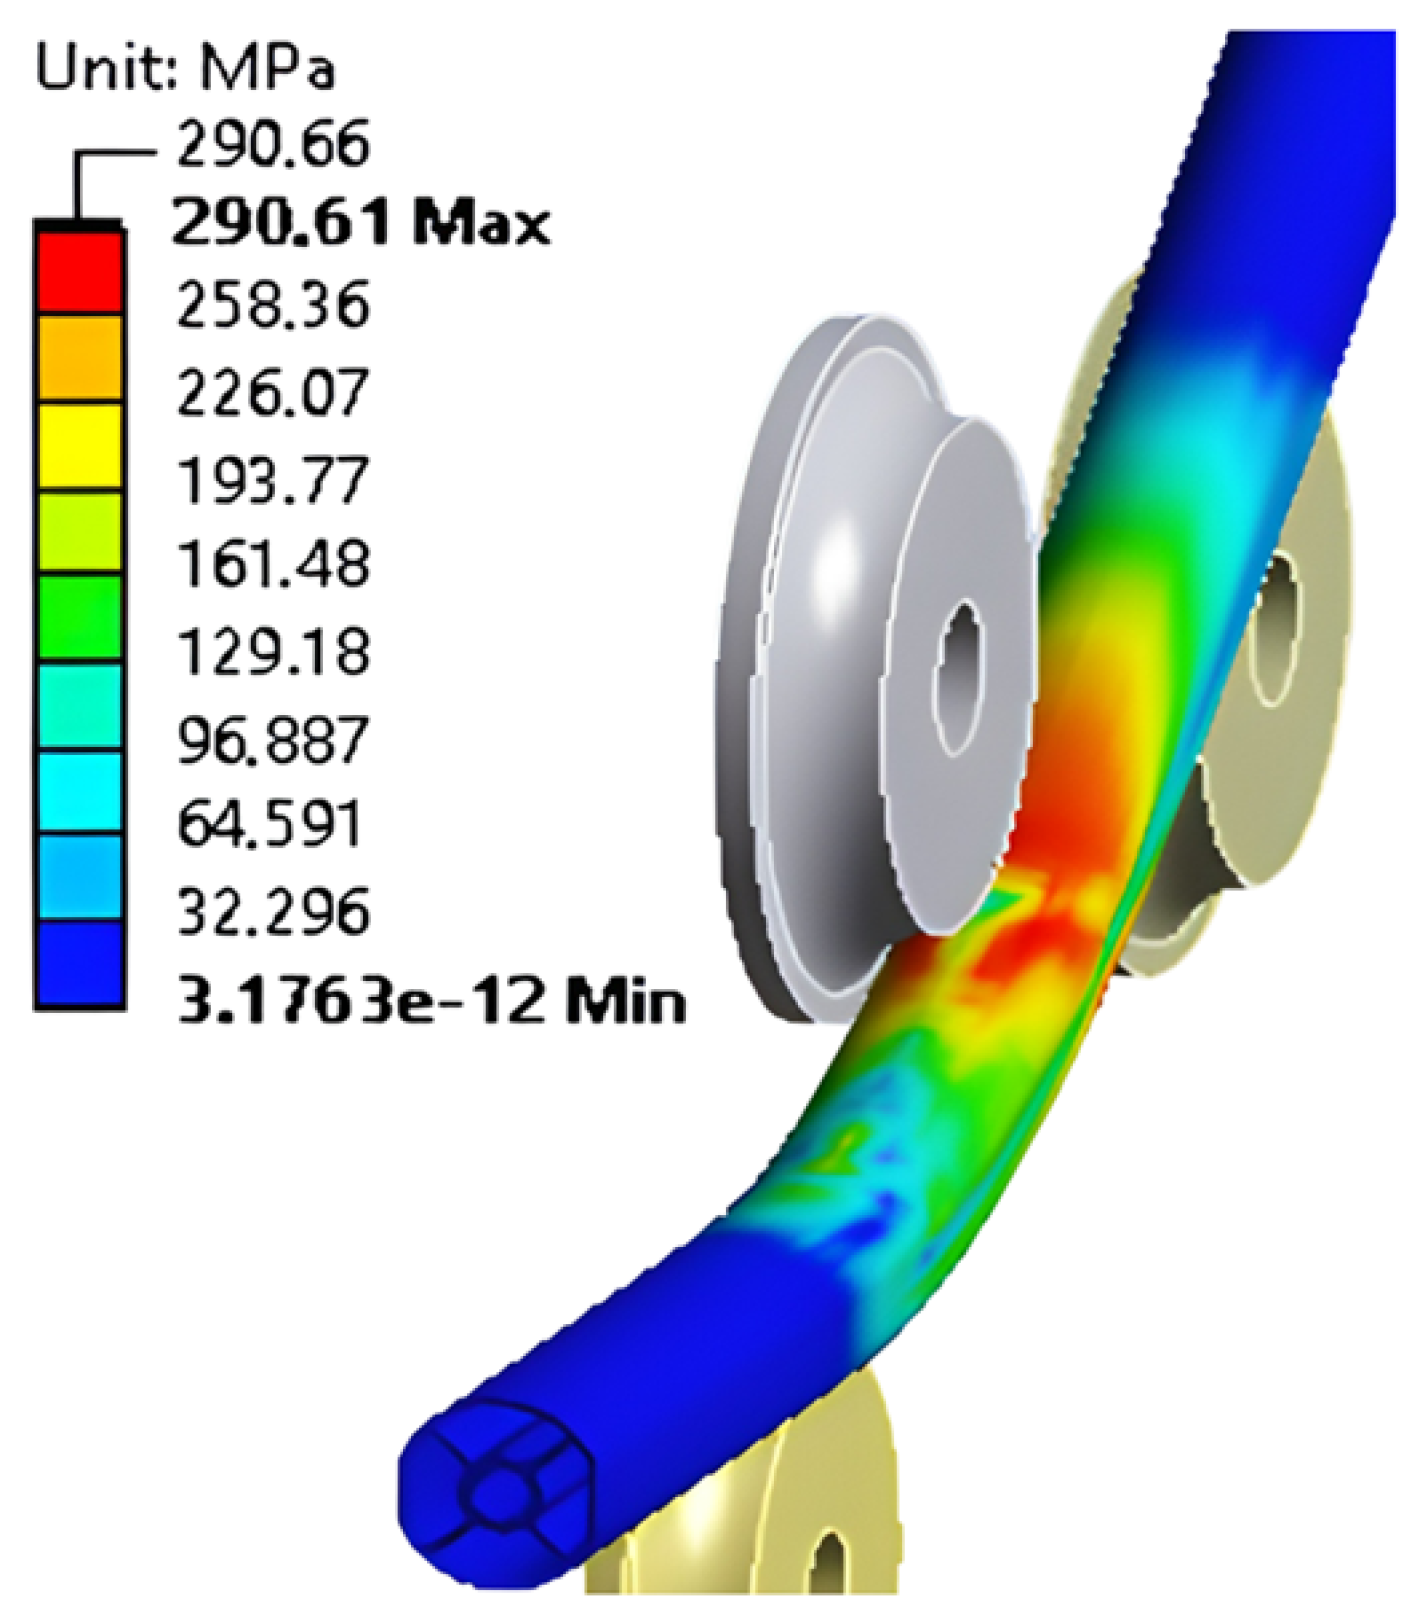
Table 15 and Table 16 compile the numerical results obtained for different bending radii, considering the cross-section of the profile positioned in the vertical and horizontal directions, respectively. In each case, the imposed bending radius, the maximum equivalent von Mises stress, the corresponding safety factor, and the displacement at point D1 are presented. Figure 36, Figure 37, Figure 38, Figure 39, Figure 40, Figure 41, Figure 42 and Figure 43 illustrate the displacements, stress distributions, and deformed geometries obtained by numerical simulation for both bending orientations.
Based on the results from Table 15 and Table 16 and Figure 35, Figure 36, Figure 37, Figure 38, Figure 39, Figure 40, Figure 41, Figure 42 and Figure 43, the following observations were made:
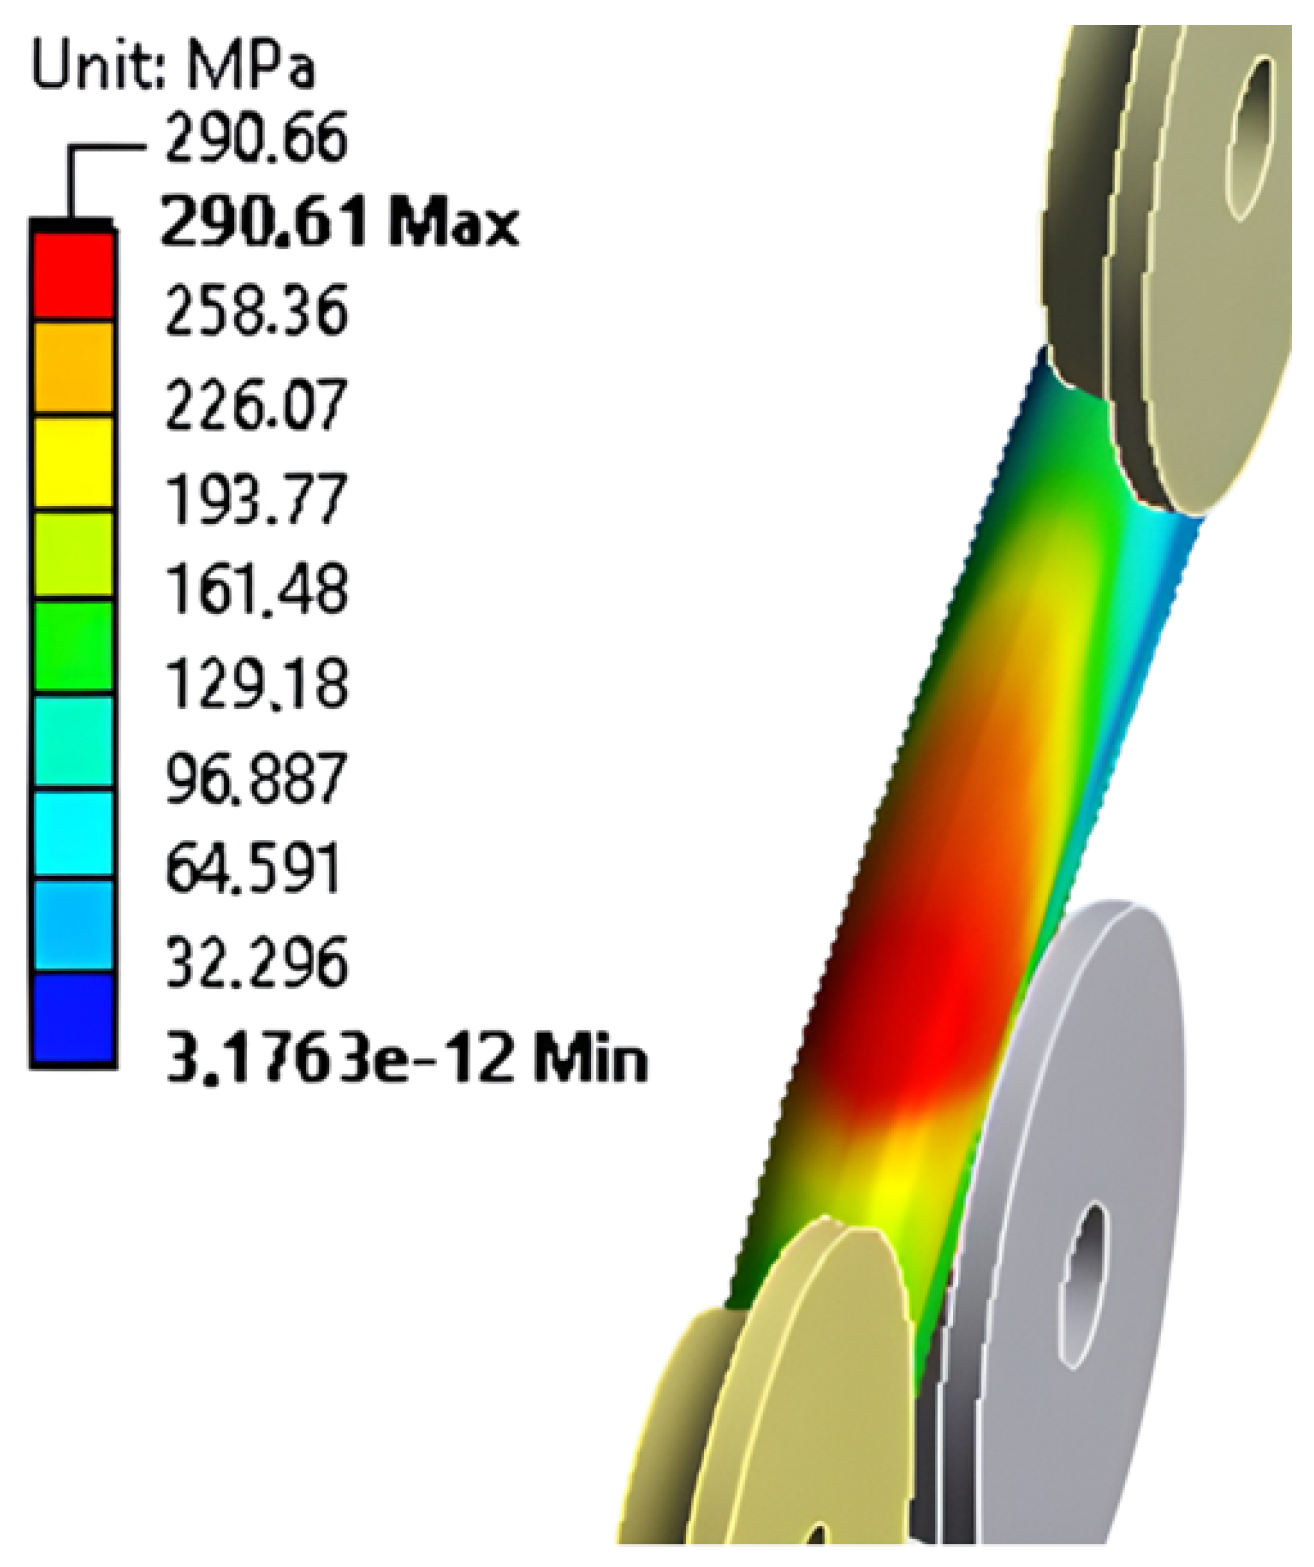
For Profile 6, the reinforced internal structure provided geometric stability even under severe bending conditions. At the smallest radius analyzed (r = 356.16 mm), the maximum von Mises stresses reached 289.06 MPa in vertical bending and 290.61 MPa in horizontal bending, both values close to the UTS of aluminum 6061-T6. The stress distributions (Figure 40, Figure 41, Figure 42 and Figure 43) showed plasticization concentrated at the outer surfaces, propagating laterally as curvature increased. However, unlike conventional tubular profiles, the reinforcement effectively limited excessive deformations. Displacements remained modest, with D1 = 0.29 mm (vertical bending) and D1 = 0.32 mm (horizontal bending), even at the smallest radius. Thus, the limiting factor for Profile 6 is not cross-sectional instability but the risk of reaching the material strength limit.
Despite the presence of internal reinforcement, the profile’s response varied significantly between vertical and horizontal bending due to differences in the distribution of the cross-sectional moment of inertia. In vertical bending, the flat walls were aligned parallel to the neutral axis, contributing little to the bending stiffness, which resulted in relatively larger displacements. In horizontal bending, the cross-section rotated 90°, placing the flat walls perpendicular to the neutral axis. This configuration increased the effective moment of inertia, supported by the curved and thicker walls, leading to greater stability and smaller displacements at the same radii. Therefore, although Profile 6 maintained overall symmetry and reinforcement, its bending stiffness was strongly dependent on orientation. Proper control of section orientation during bending is therefore essential to ensure dimensional accuracy and minimize geometric defects in practical applications.

3.2.7. Synthesis of Minimum Safe Bending Radii

To provide a clearer and more concise overview of the numerical findings, Table 17 summarizes the minimum safe bending radii identified for each profile. Therefore, Table 17 compiles the smallest radius analyzed, the corresponding maximum von Mises stress, and the limiting factors governing the structural response. The results highlight the strong influence of geometry and wall thickness on the safe operating window of each profile, making it evident that different cross-sectional configurations impose distinct constraints on the bending process.
It is important to note that the limiting factor identified for each profile is not restricted to stress-based criteria, but also includes instability-related mechanisms observed in the simulations. Specifically, cross-sectional ovalization (captured by displacements), lateral curvature (LR), and localized stiffness loss (incipient local buckling) were considered when determining the safe bending radius of each profile. Therefore, the synthesis presented in Table 17 already reflects the combined influence of both material strength and geometric instabilities. While a full nonlinear buckling analysis with imperfections lies beyond the scope of the present work, the results demonstrate that instability indicators are essential to establish practical forming limits and should be explicitly considered in future investigations.

4. Conclusions

The new validation of the computational model conducted in this work confirmed its accuracy and its capability to reproduce the three-roll forming process of aluminum profiles numerically. Additionally, a verification was carried out, demonstrating the consistency of the proposed model.
The results from the case study revealed that the cross-sectional geometry is the key factor influencing stress distribution, residual displacements, and the occurrence of secondary deformations, allowing both quantitative and qualitative performance criteria to be established for each analyzed profile. In general, the reduction in the bending radius intensifies the strain gradient between the intrados and extrados, leading to von Mises stress values close to the strength limit of aluminum 6061-T6 (290.66 MPa), especially in Profiles 2, 3, and 4. These profiles showed operation under critical safety conditions, with Profile 2 reaching 290.62 MPa at r = 2335.39 mm, accompanied by displacements above 8 mm in external regions and pronounced lateral curvature, evidencing unstable behavior and unsuitability for precision applications or cyclic loading.
Profiles with asymmetric geometry, such as Profiles 2 and 3, were further affected by lateral curvature (LR) resulting from stiffness imbalances across the section. This three-dimensional torsional effect compromises both dimensional control and functional integrity, with Profile 3 presenting a lateral bending radius of 45,782 mm for a primary radius of 13,052 mm, highlighting the emergence of second-order instabilities caused by irregular thickness distribution and localized buckling.
For tubular profiles, the comparison between Profiles 4 and 5 demonstrated the strong effect of wall thickness. Although subjected to similar radii (r ≈ 3000 mm), Profile 5, with thinner walls (1.50 mm), exhibited more severe displacements (D2 = 3.18 mm versus 1.33 mm in Profile 4), indicating pronounced ovalization and reduced bending stiffness. This behavior increases the susceptibility of Profile 5 to fatigue failure and dimensional deviations, while Profile 4, with greater thickness, preserved geometric integrity under high curvature, being more suitable for applications requiring dimensional control and structural stability.
Profiles 1 and 6, despite geometric similarity, revealed different behaviors. Profile 6, with an additional central reinforcement, significantly reduced displacements compared to Profile 1 under identical bending conditions. The reinforcement redistributed stresses more uniformly, delaying plasticization and increasing global stiffness. This highlights the decisive role of geometric refinements, such as localized thickening or reinforcement, in enhancing performance during bending.
A global synthesis of the minimum safe bending radii, presented in Table 17, reinforces these findings. Profiles with thin walls or asymmetries (Profiles 2, 3, and 5) displayed very limited safety margins, governed by instabilities such as ovalization, torsion, or local collapse. Conversely, profiles with symmetric cross-sections, thicker walls, or internal reinforcements (Profiles 1, 4, and 6) demonstrated greater resilience, tolerating smaller bending radii without compromising structural integrity. This comparative analysis confirms that the safe performance of extruded aluminum profiles under bending is determined not only by the imposed curvature but also by the interaction between geometry, thickness distribution, and reinforcement design.
Future work should address the structural behavior of bent profiles under service conditions, particularly regarding residual stresses, fatigue, and localized buckling in plastified regions. Further developments may also extend the computational model to other metallic alloys with different formability characteristics, as well as integrate computational optimization strategies for cross-section design. Additionally, transient simulations with multiple passes and varying roller speed would contribute to more accurately representing the industrial bending process. Parametric analyses of the friction coefficient between rollers and profiles could be performed to evaluate its role under different forming conditions and extend the applicability of the numerical framework. Finally, another important aspect not addressed in the present work, but which should be investigated in future studies, is the springback phenomenon. As extensively discussed in the literature, springback significantly influences dimensional accuracy after bending.

Author Contributions

Conceptualization, M.d.S.M., C.E.M.G., J.H.C.d.S., E.D.d.S. and L.A.I.; Methodology, M.d.S.M., C.E.M.G., J.H.C.d.S., E.D.d.S. and L.A.I.; software, M.d.S.M., C.E.M.G., J.H.C.d.S. and L.A.I.; Validation, M.d.S.M., C.E.M.G., J.H.C.d.S. and L.A.I.; Formal Analysis, C.E.M.G., J.H.C.d.S., E.D.d.S. and L.A.I.; Investigation, M.d.S.M., C.E.M.G., J.H.C.d.S., E.D.d.S. and L.A.I.; Resources, C.E.M.G., J.H.C.d.S., E.D.d.S. and L.A.I.; Data curation, M.d.S.M., J.H.C.d.S. and L.A.I.; Writing—original draft preparation, M.d.S.M. and L.A.I.; Writing—review and editing, M.d.S.M., C.E.M.G., J.H.C.d.S., E.D.d.S. and L.A.I.; Visualization, C.E.M.G., J.H.C.d.S., E.D.d.S. and L.A.I.; Supervision, J.H.C.d.S., C.E.M.G. and L.A.I.; Project administration, J.H.C.d.S. and L.A.I.; Funding acquisition, C.E.M.G., J.H.C.d.S., E.D.d.S. and L.A.I. All authors have read and agreed to the published version of the manuscript.

Funding

This research was supported by TechnNova—Industrial Technology Research and Development Company and by Brazilian National Council for Scientific and Technological Development (CNPq).

Data Availability Statement

The original contributions presented in this study are included in the article. Further inquiries can be directed to the corresponding author.

Acknowledgments

M. S. Moreira thank TechnNova for master’s scholarships. E. D. dos Santos (processes 308396/2021-9) and L. A. Isoldi (process 309648/2021-1) acknowledge CNPq for their research productivity grants.

Conflicts of Interest

Author João Henrique Corrêa de Souza was employed by the company TechnNova. The remaining authors declare that the research was conducted in the absence of any commercial or financial relationships that could be construed as a potential conflict of interest.

Abbreviations

The following abbreviations are used in this manuscript:
FEMFinite Element Method
RDRelative Difference between maximum stresses of two successive meshes
UTSUltimate Tensile Strength
M j   and   M J + 1 Number of elements in mesh j and mesh j + 1 in the mesh-convergence test
rBending radius applied in the forming process
D1, D2, D3…Displacement measurement points on specific regions of the profile
LRLateral curvature radius
hHour
minMinute
ABNTBrazilian Association of Technical Standards
CNPqNational Council for Scientific and Technological Development

References

  1. KUMAR, Ritesh. 6061-T6 Aluminum Properties and Its Uses. Available online: https://www.zetwerk.com/resources/knowledge-base/aluminum-extrusions/6061-t6-aluminum-properties-and-its-uses/ (accessed on 7 April 2025).
  2. HUAWEI ALUMINUM. Introduction to 6061 t6 Aluminum Properties. Available online: https://aludepot.com/blog/introduction-to-6061-t6-aluminum-properties/ (accessed on 7 April 2025).
  3. THE WORLD MATERIAL. Aluminum 6061, Al 6061-T6 Alloy Properties, Density, Tensile & Yield Strength, Thermal Conductivity, Modulus of Elasticity, Welding. Available online: https://www.theworldmaterial.com/al-6061-t6-aluminum-alloy/ (accessed on 7 April 2025).
  4. Wang, H.; Lee, H.-W.; Kang, S.-H.; Kim, D.-K. Crystal Plasticity Finite Element Analyses on the Formability of AA6061 Aluminum Alloy with Different Ageing Treatments. Metals 2024, 14, 503. [Google Scholar] [CrossRef]
  5. Huang, X.; Yu, G.; Zhao, J.; Mu, Z.; Zhang, Z.; Ma, R. Numerical simulation and experimental investigations on a three-roller setting round process for thin-walled pipes. Int. J. Adv. Manuf. Technol. 2020, 107, 355–369. [Google Scholar] [CrossRef]
  6. Yu, G.; Zhao, J.; Zhai, R.; Ma, R.; Wang, C. Theoretical analysis and experimental investigations on the symmetrical three-roller setting round process. Int. J. Adv. Manuf. Technol. 2018, 94, 45–56. [Google Scholar] [CrossRef]
  7. Ancellotti, S.; Fontanari, V.; Slaghenaufi, S.; Cortelletti, E.; Benedetti, M. Forming rectangular tubes into complicated 3D shapes by combining three-roll push bending, twisting and rotary draw bending: The role of the fabrication loading history on the mechanical response. Int. J. Mater. Form. 2019, 12, 907–926. [Google Scholar] [CrossRef]
  8. Merklein, M.; Hagenah, H.; Cojutti, M. Investigations on Three-Roll Bending of Plain Tubular Components. Key Eng. Mater. 2009, 410, 325–334. [Google Scholar] [CrossRef]
  9. Kamaş, T.; Sarıkaya, M. Explicit dynamics finite element analyses of asymmetrical roll bending process. Int. Adv. Res. Eng. J. 2021, 5, 435–443. [Google Scholar] [CrossRef]
  10. Cheng, X.; Zhao, Y.; Abd El-Aty, A.; Guo, X.; You, S. Deformation behavior of convolute thin-walled AA6061-T6 rectangular tubes manufactured by the free bending forming technology. Int. J. Adv. Manuf. Technol. 2022, 118, 2933–2948. [Google Scholar] [CrossRef]
  11. Li, T.; Wang, H.; El-Aty, A.A.; Li, J.; Zhang, Y.; Wei, W.B.; Chen, H.; Cheng, X.; Tao, J.; Guo, X.Z. Theoretical modelling and finite element simulation of AA6061 involute components based on 3D free bending process. Int. J. Mech. Sci. 2020, 178, 105607. [Google Scholar] [CrossRef]
  12. Dev, G.P.; Livingston, P.S.; Shunmuganathan, M.; Surendar, R.; Subramanian, A.S.; Simon Christopher, A.; Ganesh, K.C. Analysis of 6061 aluminium alloy sheet metal bending process for various thickness using finite element modelling. Int. J. Theor. Appl. Math. 2016, 2, 93–99. [Google Scholar]
  13. Khan, Z.; Khan, M.; Yook, S.-J.; Khan, A.; Younas, M.; Zahir, M.Z.; Asad, M. Dynamic Analysis of Closed Die Electromagnetic Sheet Metal Forming to Predict Deformation and Failure of AA6061-T6 Alloy Using a Fully Coupled Finite Element Model. Materials 2022, 15, 7997. [Google Scholar] [CrossRef]
  14. Gavrilescu, I.; Boazu, D.; Stan, F. Estimating of Bending Force and Curvature of the Bending Plate in a Three-Roller Bending System Using Finite Element Simulation and Analytical Modeling. Materials 2021, 14, 1204. [Google Scholar] [CrossRef]
  15. Wang, Y.; Zhao, L.; Cui, X.; Zhu, X. Research on numerical simulation and process parameters of three-roll bending based on thickness characteristics of extra-thick plate. Adv. Mech. Eng. 2019, 11, 168781401984786. [Google Scholar] [CrossRef]
  16. Kong, Q.S.; Yu, Z.Q.; Zhao, Y.X.; Li, S.H. The Finite Element Analysis for Dimensional Accuracy in Roll Bending of Aluminum-Polymer Laminated Sheet. Appl. Mech. Mater. 2013, 390, 574–578. [Google Scholar] [CrossRef]
  17. Chung, C.-C.; Lee, K.-L.; Pan, W.-F. Finite element analysis on the response of 6061-T6 aluminum alloy tubes with a local sharp cut under cyclic bending. J. Vibro Eng. 2016, 18, 5691–5703. [Google Scholar] [CrossRef]
  18. Saai, A.; Westermann, I.; Dumoulin, S.; Hopperstad, O.S. Crystal plasticity finite element simulations of pure bending of aluminium alloy AA7108. Int. J. Mater. Form. 2016, 9, 457–469. [Google Scholar] [CrossRef]
  19. Tomaszewski, T.; Stopek, M.; Skibicki, A.; Seyda, J.; Piątkowski, T. Effect of plastic strain under roller bending on fatigue properties of extruded 6063 T66 aluminium alloy profile. Trans. Nonferrous Met. Soc. China 2023, 33, 3282–3294. [Google Scholar] [CrossRef]
  20. Feng, Z.; Champliaud, H. Modeling and simulation of asymmetrical three-roll bending process. Simul. Model. Pract. Theory 2011, 19, 1913–1917. [Google Scholar] [CrossRef]
  21. Shi, L.; Zhu, C.; Ma, R. Numerical simulation and optimization on three-roll bending based on thick plate. Forg. Stamp. Technol. 2022, 47, 1–7. [Google Scholar]
  22. Liu, H.; Sun, Q.; Zhao, Y.; Song, Z.; Wang, J. Design of three-roll bending machine tool and research on compensation algorithm. Adv. Mech. Eng. 2023, 15, 1–12. [Google Scholar] [CrossRef]
  23. Moreira, M.S.; Souza, J.H.C.; Guilherme, C.E.M.; Isoldi, L.A. Computational model validation of the rolled shapes calendaring process. Ciência E Nat. 2023, 45, e74455. [Google Scholar] [CrossRef]
  24. Zheng, Z.; Shao, J.; Zhang, Z.; Li, C. Roller Position Design in the Roll Bending Process of a Non-Uniform Curvature Profile. Axioms 2024, 13, 613. [Google Scholar] [CrossRef]
  25. da Silva Moreira, M.; Guilherme, C.E.M.; Corrêa de Souza, J.H.; dos Santos, E.D.; Pavlovic, A.; Isoldi, L.A. Influence of Curvature Radius on Mechanical Behavior of Extruded 6061-T6 Aluminum in Roll Bending. J. Appl. Comput. Mech. 2025, 11, 120–133. [Google Scholar]
  26. Gao, E.; Xue, D.; Li, Y. Springback angle prediction for high-strength aluminum alloy bending via multi-stage regression. Metals 2025, 15, 358. [Google Scholar] [CrossRef]
  27. Wang, T.; Fang, W.; Jiang, Y.; Weng, H.; Qian, Y.; Zhang, D. Research on springback compensation method of roll forming based on improved fuzzy PID control. Appl. Sci. 2025, 15, 3748. [Google Scholar] [CrossRef]
  28. Zhi, Y.; Feng, Y.; Wang, D.; Hu, X.; Sun, T.; Liu, X. Forming characteristics of tailor rolled blank of aluminum alloy during three-point bending. Materials 2024, 17, 591. [Google Scholar] [CrossRef]
  29. Boazu, D.; Gavrilescu, I.; Stan, F. Analytical and finite element analysis of the rolling force for the three-roller cylindrical bending process. Materials 2024, 17, 5230. [Google Scholar] [CrossRef]
  30. Li, X.M.; Liu, Y.; Wu, H.; Ding, C.Y.; Dong, J.; Peng, W.; Zhang, D.H.; Sun, J. A comprehensive analytical model for tensile-bending straightening in strip processing by coupling residual stress and buckling deformation. J. Mater. Process. Technol. 2025, 339, 118802. [Google Scholar] [CrossRef]
  31. Iandiorio, C.; Salvini, P. A geometrically nonlinear shell theory for thin-walled tubes and beams subjected to large displacements and cross-section deformation. Thin-Walled Struct. 2025, 216 Pt A, 113583. [Google Scholar]
  32. Erisov, Y.; Kuzin, A.; Sedelnikov, A. An Analytical Model for the Plastic Bending of Anisotropic Sheet Materials, Incorporating the Strain-Hardening Effect. Technologies 2024, 12, 236. [Google Scholar] [CrossRef]
  33. Spoorenberg, R.C.; Snijder, H.H.; Hoenderkamp, J.C.D. Finite element simulations of residual stresses in roller bent wide flange sections. J. Constr. Steel Res. 2010, 67, 737–747. [Google Scholar]
  34. Mercury, A.; Fanelli, P.; Giorgetti, F.; Rubino, G.; Stefanini, C. Experimental and numerical analysis of roll bending process of thick metal sheets. IOP Conf. Ser. Ciência E Eng. Mater. 2021, 1038, 012067. [Google Scholar] [CrossRef]
  35. Selvaggio, A.; Dirksen, U.; Tekkaya, A.E.; Schikorra, M.; Kleiner, M. Increasing the Production Accuracy of Profile Bending withMethods of Computational Intelligence. Evol. Comput. 2009, 17, 561–576. [Google Scholar] [CrossRef]
  36. Kissell, J.T.; Ferry, R.J. Aluminum Structures: A Guide to Their Specifications and Design, 2nd ed.; John Wiley Sons: Hoboken, NJ, USA, 2010. [Google Scholar]
  37. Vollertsen, F.; Sprenger, A.; Kraus, J.; Arnet, H. Extrusion, channel, and profile bending: A review. J. Mater. Process. Technol. 1999, 87, 1–27. [Google Scholar] [CrossRef]
  38. Zhou, W.; Shao, Z.; Yu, J.; Lin, J. Advances and Trends in Forming Curved Extrusion Profiles. Materials 2021, 14, 1603. [Google Scholar] [CrossRef]
  39. Hashemi, R.; Niknam, S.A. Flexible bending of rectangular profiles: Numerical and experimental investigations. J. Manuf. Process. 2020, 56, 390–399. [Google Scholar] [CrossRef]
  40. Wang, A.; Xue, H.; Bayraktar, E.; Yang, Y.; Saud, S.; Chen, P. Analysis and Control of Twist Defects of Aluminum Profiles with Large Z-Section in Roll Bending Process. Metals 2020, 10, 31. [Google Scholar] [CrossRef]
  41. Hosford, W.F.; Caddell, R.M. Metal Forming: Mechanics and Metallurgy, 3rd ed.; Cambridge University Press: Cambridge, UK, 2007. [Google Scholar]
  42. Suresh, S. Fatigue of Materials, 2nd ed.; Cambridge University Press: Cambridge, UK, 1998. [Google Scholar]
  43. EN 1999; Eurocode 9—Design of Aluminium Structures. European Committee for Standardization: Brussels, Belgium, 2020.
  44. NBR 8800; NBR 8800: Projeto de Estruturas de Aço em Edificações. Associação Brasileira de Normas Técnicas: Rio de Janeiro, Brazil, 2008.
  45. The Aluminum Association. Aluminum Design Manual; The Aluminum Association: Arlington, VA, USA, 2021. [Google Scholar]
  46. Chapra, S.C.; Canale, R.P. Numerical Methods for Engineers (Métodos Numéricos para Engenheiros), 7th ed.; McGraw Hill: New York, NY, USA, 2014. [Google Scholar]
  47. Zienkiewicz, O.C.; Taylor, R.L. The Finite Element Method: Its Basis and Fundamentals, 7th ed.; Butterworth-Heinemann: Oxford, UK, 2013. [Google Scholar]
  48. Bathe, K.J. Finite Element Procedures, 2nd ed.; Klaus-Jürgen Bathe: Cambridge, MA, USA, 2021. [Google Scholar]
  49. Cook, R.D.; Malkus, D.S.; Plesha, M.E.; Witt, R.J. Concepts and Applications of Finite Element Analysis, 4th ed.; John Wiley & Sons: Hoboken, NJ, USA, 2001. [Google Scholar]
  50. Hughes, T.J.R. The Finite Element Method: Linear Static and Dynamic Finite Element Analysis; Dover Publications: Garden City, NY, USA, 2000. [Google Scholar]
  51. Ansys Inc. ANSYS User’s Manual; Ansys, Inc.: Canonsburg, PA, USA, 2022. [Google Scholar]
  52. Oñate, E. Structural Analysis with the Finite Element Method—Linear Statics, 2nd ed.; Springer: Dordrecht, The Netherlands, 2009. [Google Scholar]
  53. Song, Z.; Xu, L.; Zhao, Y.; Sun, Q. Research on three-roller bending of aluminum profiles considering roller center distance and radius. Res. Sq. 2024; preprint. [Google Scholar] [CrossRef]
  54. Souza, J.H.C. Curso de Fundamentos de Estamparia. TechnNOVA. 2022. Available online: https://www.technnova.com.br/Engsuperficies.html#portfolio (accessed on 15 May 2023).
  55. Belytschko, T.; Liu, W.K.; Moran, B. Nonlinear Finite Elements for Continua and Structures, 2nd ed.; Wiley: Hoboken, NJ, USA, 2013. [Google Scholar]
  56. Hibbeler, R.C. Mechanics of Materials, 11th ed.; Pearson: London, UK, 2022. [Google Scholar]
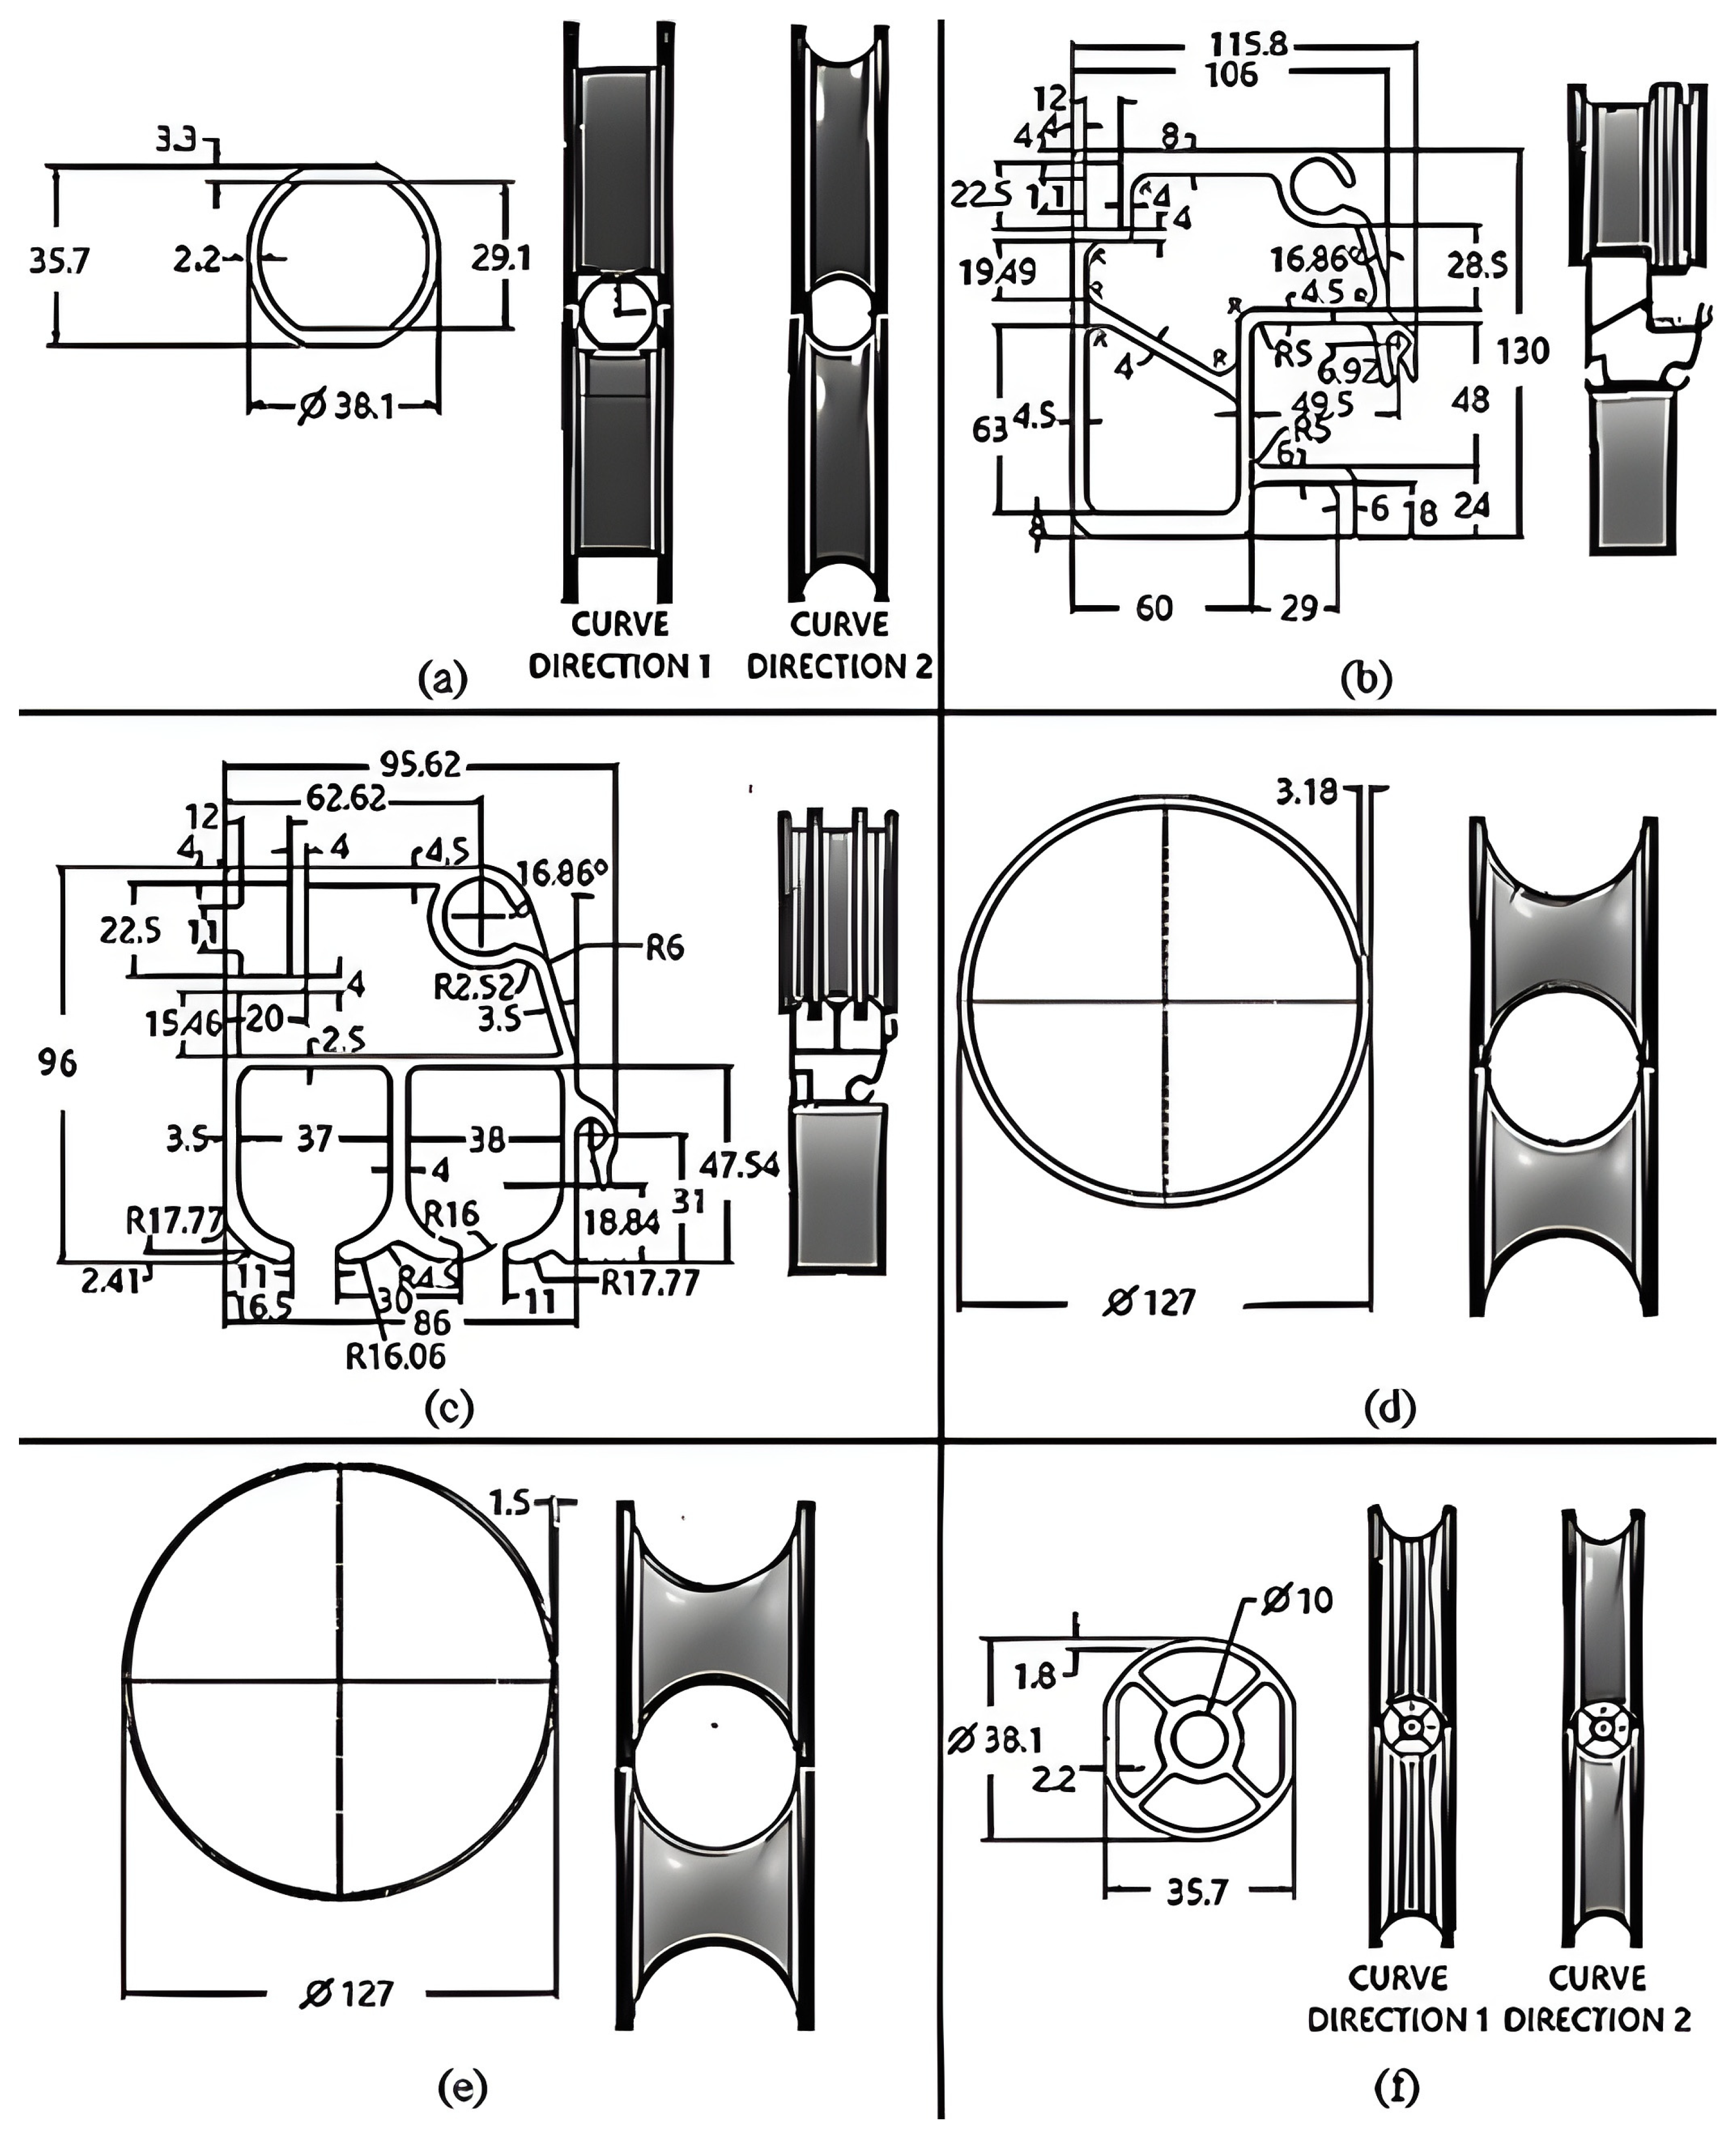
Figure 1. Geometry and dimensions, in mm, of the extruded 6061-T6 aluminum profiles: (af) represent profiles 1–6.
Metals 15 01097 g001
Figure 2. Three-roll bending process: schematic representation. Adapted with permission from ref. [35]. 2009, Alessandro Selvaggio.
Metals 15 01097 g002
Figure 3. Schematic representation of the main types of defects observed during the bending process of extruded profiles. Adapted with permission from ref. [35]. 2009, Alessandro Selvaggio.
Metals 15 01097 g003
Figure 4. Geometric modification strategies of the cross-section aimed at correcting and mitigating defects during profile bending. Adapted with permission from ref. [35]. 2009, Alessandro Selvaggio.
Metals 15 01097 g004
Figure 5. True stress–strain curve of 6061-T6 aluminum.
Metals 15 01097 g005
Figure 6. Finite elements composing the numerical model: (a) SOLID187; (b) CONTA174; and (c) TARGE170.
Metals 15 01097 g006
Figure 7. Schematic representation of the 6063-T5 aluminum profile used for validation and verification (in mm): (a) perspective and (b) cross-section detail. Adapted from Ref. [53]. 2024, Song, Z.
Metals 15 01097 g007
Figure 8. Computational domain of the three-roll bending process for the validation and verification and a detail of the converged mesh.
Metals 15 01097 g008
Figure 9. Validation and verification: graphical representation.
Metals 15 01097 g009
Figure 10. Displacements, in mm, for Profile 1 in the vertical direction for: (a) r = 4120.40 mm; (b) r = 1208.00 mm; (c) r = 624.35 mm; and (d) r = 403.38 mm.
Metals 15 01097 g010
Figure 11. Displacements, in mm, for Profile 1 in the horizontal direction for: (a) r = 3730.00 mm; (b) r = 1127.50 mm; (c) r = 591.92 mm; and (d) r = 388.21 mm.
Metals 15 01097 g011
Figure 12. Curve fitting for displacements of Profile 1 in the vertical direction.
Metals 15 01097 g012
Figure 13. Curve fitting for displacements of Profile 1 in the horizontal direction.
Metals 15 01097 g013
Figure 14. Distribution of von Mises stresses in the top region of Profile 1 in the vertical direction with r = 403.38 mm.
Metals 15 01097 g014
Figure 15. Distribution of von Mises stresses in the lower region of Profile 1 in the vertical direction with r = 403.38 mm.
Metals 15 01097 g015
Figure 16. Distribution of von Mises stresses in the top region of Profile 1 in the horizontal direction with r = 388.21 mm.
Metals 15 01097 g016
Figure 17. Distribution of von Mises stresses in the lower region of Profile 1 in the horizontal direction with r = 388.21 mm.
Metals 15 01097 g017
Figure 18. Displacements, in mm, for Profile 2 when: (a) r = 87,762.94 mm; (b) r = 54,688.19 mm; (c) r = 2335.39 mm; and (d) r = 2335.39 mm.
Metals 15 01097 g018
Figure 19. Curve fitting for displacements of Profile 2.
Metals 15 01097 g019
Figure 20. Curve fitting for the lateral bending radius of Profile 2.
Metals 15 01097 g020
Figure 21. Distribution of von Mises stressesin the top region of Profile 2 with r = 2335.39 mm.
Metals 15 01097 g021
Figure 22. Distribution of von Mises stresses (MPa) in the lower region of Profile 2 with r = 2335.39 mm.
Metals 15 01097 g022
Figure 23. Displacements, in mm, for Profile 3 when: (a) r = 34,321.23 mm; (b) r = 20,133.95 mm; (c) r = 13,052.88 mm; and (d) r = 13,052.88 mm.
Metals 15 01097 g023
Figure 24. Curve fitting for the displacements of Profile 3.
Metals 15 01097 g024
Figure 25. Curve fitting for the lateral bending radius of Profile 3.
Metals 15 01097 g025
Figure 26. Distribution of von Mises stresses in the top region of Profile 3 with r = 13,052.88 mm.
Metals 15 01097 g026
Figure 27. Distribution of von Mises stresses in the lower region of Profile 3 with r = 13,052.88 mm.
Metals 15 01097 g027
Figure 28. Displacements, in mm, for Profile 4 when: (a) r = 11,084.39 mm; (b) r = 3267.92 mm; and (c) r = 1166.53 mm.
Metals 15 01097 g028
Figure 29. Curve fitting for displacements of Profile 4.
Metals 15 01097 g029
Figure 30. Distribution of von Mises stresses in the top region of Profile 4 with r = 1166.53 mm.
Metals 15 01097 g030
Figure 31. Distribution of von Mises stresses in the lower region of Profile 4 with r = 1166.53 mm.
Metals 15 01097 g031
Figure 32. Displacements, in mm, for Profile 5 when: (a) r = 38,517.83 mm; (b) r = 10,257.22 mm; and (c) r = 2961.42 mm.
Metals 15 01097 g032
Figure 33. Curve fitting for displacements of Profile 5.
Metals 15 01097 g033
Figure 34. Distribution of von Mises stresses in the top region of Profile 5 with r = 2961.42 mm.
Metals 15 01097 g034
Figure 35. Distribution of von Mises stresses in the lower region of Profile 5 with r = 2961.42 mm.
Metals 15 01097 g035
Figure 36. Displacements, in mm, for Profile 6 in the vertical direction when: (a) r = 3332.62 mm; (b) r = 1035.73 mm; (c) r = 696.30 mm; and (d) r = 581.53 mm.
Metals 15 01097 g036
Figure 37. Displacements, in mm, for Profile 6 in the horizontal direction when: (a) r = 3280.12 mm; (b) r = 1045.88 mm; (c) r = 548.58 mm; and (d) r = 356.16 mm.
Metals 15 01097 g037
Figure 38. Curve fitting for displacements of Profile 6 in the vertical direction.
Metals 15 01097 g038
Figure 39. Curve fitting for displacements of Profile 6 in the horizontal direction.
Metals 15 01097 g039
Figure 40. Distribution of von Mises stresses in the top region of Profile 6 in the vertical direction with r = 581.53 mm.
Metals 15 01097 g040
Figure 41. Distribution of von Mises stresses in the lower region of Profile 6 in the vertical direction with r = 581.53 mm.
Metals 15 01097 g041
Figure 42. Distribution of von Mises stresses in the top region of Profile 6 in the horizontal direction with r = 356.16 mm.
Metals 15 01097 g042
Figure 43. Distribution of von Mises stresses in the lower region of Profile 6 in the horizontal direction with r = 356.16 mm.
Metals 15 01097 g043
Table 1. Convergence mesh test for the validation and verification.
Discretization
(Cross-Section Size/Length Size/R1 Divisions)
Number of Finite ElementsForming
Radius
(mm)
Absolute Successive Difference (%)
2 mm/8 mm/3 div23,890485.116.69
1 mm/5 mm/3 div65,372452.673.55
0.6 mm/4 mm/4 div109,320436.611.94
0.5 mm/2 mm/5 div261,271428.150.17
0.3 mm/1.5 mm/7 div614,195428.88---
Table 2. Validation and verification: tabular representation.
Vertical
Displacement
(mm)
Experimental
Reference
(mm)
Numerical
Reference
(mm)
Numerical
Present
Study (mm)
RDev
(%)
Validation
RDev
(%)
Verification
151047.61955.551044.34−0.319.29
20669.84628.57668.78−0.166.40
25549.21500.00546.79−0.449.36
30430.16411.11428.15−0.474.14
35334.92326.92334.27−0.192.25
Table 3. Mesh convergence test for Profile 1 (Figure 1a).
N° of Finite Elements σ m a x (MPa)RD (%)Processing Time
4265207.9710.4300 h 07 min
5817229.679.2800 h 10 min
8258250.991.8700 h 19 min
13,255255.680.0300 h 34 min
17,153255.590.2401 h 01 min
24,571254.97-01 h 51 min
Table 4. Results for Profile 1 in the vertical direction.
r (mm) σ m a x v M (MPa)Safety FactorDisplacement (mm)
D1D2
4120.40253.431.150.13-
1208.00278.311.040.42-
624.35286.541.010.900.12
403.38290.601.001.450.39
Table 5. Results for Profile 1 in the horizontal direction.
r (mm) σ m a x v M (MPa)Safety FactorDisplacement (mm)
D1D2
3730.00251.501.16-0.20
1127.50274.151.060.040.30
591.92288.561.000.360.67
388.21290.411.000.430.69
Table 6. Mesh convergence test for Profile 2.
N° of Finite Elements σ m a x (MPa)RD (%)Processing Time
41,444203.2923.3616 h 41 min
71,949250.777.9923 h 10 min
81,082270.825.4729 h 03 min
102,073285.631.0438 h 11 min
158,954288.610.5360 h 22 min
209,941290.150.0580 h 49 min
293,825289.99-121 h 12 min
Table 7. Results for Profile 2.
r (mm) σ m a x v M (MPa)Safety FactorDisplacement and Lateral Curvature Radius (mm)
D1D2D3D4D5D6D7LR
87,762.94271.581.070.100.530.920.611.001.140.77206,761.20
54,688.19290.371.000.330.612.681.183.243.161.48200,010.10
2335.39290.621.001.483.975.853.608.098.545.5583,255.08
Table 8. Mesh convergence test for Profile 3.
N° of Finite Elements σ m a x (MPa)RD (%)Processing Time
49,532211.8713.3845 h 44 min
66,571240.2210.6032 h 21 min
78,522265.693.4655 h 27 min
90,054274.881.1979 h 33 min
109,857278.150.34107 h 22 min
125,054279.09-159 h 56 min
Table 9. Results for Profile 3.
r (mm) σ m a x v M (MPa)Safety FactorDisplacement (mm)
D1D2D3D4D5D6D7D8D9D10D11LR
34,321.23288.171.010.220.220.140.150.690.090.220.110.150.070.10181,603.26
20,133.95289.931.001.310.671.140.851.551.251.271.841.631.750.96137,235.65
13,052.88290.591.002.461.602.191.923.122.572.944.102.953.382.62115,457.82
Table 10. Mesh convergence test for Profile 4.
N° of Finite Elements σ m a x (MPa)RD (%)Processing Time
7900158.1516.7701 h 01 min
12,723184.6817.9001 h 22 min
17,214217.7412.1802 h 04 min
20,255244.267.3902 h 51 min
29,736262.307.0804 h 21 min
36,012243.720.7105 h 32 min
47,667245.450.5208 h 28 min
54,142246.730.2509 h 37 min
84,611246.12-14 h 55 min
Table 11. Results for Profile 4.
r (mm) σ m a x v M (MPa)Safety FactorDisplacement (mm)
D1D2
11,084.39286.721.011.930.45
3267.92290.261.004.421.33
1166.53290.541.008.642.64
Table 12. Mesh convergence test for Profile 5.
N° of Finite Elements σ m a x (MPa)RD (%)Processing Time
9029178.2511.8801 h 01 min
17,875199.426.5902 h 20 min
20,488212.572.2703 h 13 min
28,843207.741.3204 h 29 min
34,147209.440.5005 h 27 min
43,436210.49-08 h 21 min
Table 13. Results for Profile 5.
r (mm) σ m a x v M (MPa)Safety FactorDisplacement (mm)
D1D2
38,517.83285.611.022.30.46
10,257.22289.671.004.581.71
2961.42289.691.004.733.18
Table 14. Mesh convergence test for Profile 6.
N° of Finite Elements σ m a x (MPa)RD (%)Processing Time
17,471147.4796.4502 h 31 min
25,110289.7816.8803 h 22 min
33,423240.8610.3604 h 46 min
42,260215.891.7806 h 21 min
54,629212.050.4908 h 45 min
87,469213.09-13 h 33 min
Table 15. Results for Profile 6 in the vertical direction.
r (mm) σ m a x v M (MPa)Safety FactorDisplacement (mm)
D1
3332.62249.491.160.04
1035.73274.251.060.14
696.30286.441.010.26
581.53289.061.000.29
Table 16. Results for Profile 6 in the horizontal direction.
r (mm) σ m a x v M (MPa)Safety FactorDisplacement (mm)
D1
3280.12256.171.130.05
1045.88280.551.040.15
548.58290.151.000.16
356.16290.611.000.32
Table 17. Synthesis of minimum safe bending radii for each profile.
ProfileSmallest
Radius
Analyzed (mm)
Maximum
Stress at
Smallest r
(MPa)
Safe Minimum Bending
Radius
(mm)
Limiting Factor
14120.40253.43≈4000Orientation effects (D1 vs. D2)
22335.39290.62>54,688Stresses at UTS and strong LR
313,052.88290.59>20,000Thin branches, ovalization, local buckling and strong LR
41166.53290.54>3200Thin-walled tube, ovalization
52961.42289.69>10,000Very thin wall (1.50 mm), global ovalization
6356.16290.61≈500Risk of failure despite small displacements
Disclaimer/Publisher’s Note: The statements, opinions and data contained in all publications are solely those of the individual author(s) and contributor(s) and not of MDPI and/or the editor(s). MDPI and/or the editor(s) disclaim responsibility for any injury to people or property resulting from any ideas, methods, instructions or products referred to in the content.