Article

Wear Behavior and Friction Mechanism of Titanium–Cerium Alloys: Influence of CeO2 Precipitate

1
Department of Metallurgical Engineering, Pukyong National University, 45, Yongso-ro, Nam-Gu, Busan 48513, Republic of Korea
2
Korea Institute of Ceramic Engineering and Technology, 101 Soho-ro, Jinju-si 52851, Republic of Korea
3
Korea Institute of Materials Science, 797, Changwon-daero, Seongsan-Gu, Changwon-si 51508, Republic of Korea
*
Author to whom correspondence should be addressed.
These authors equally contributed to this work.
Metals 2025, 15(10), 1094; https://doi.org/10.3390/met15101094
Submission received: 14 August 2025 / Revised: 21 September 2025 / Accepted: 26 September 2025 / Published: 30 September 2025
(This article belongs to the Special Issue Advanced Ti-Based Alloys and Ti-Based Materials)

Abstract

This work investigated the effect of cerium (Ce) addition on the wear behavior of commercially pure titanium (CP-Ti) by varying the Ce content to 0.8, 1.4, and 2.0 wt.%. Alloys were fabricated using plasma arc melting, and wear resistance was evaluated under loads of 1 N and 5 N dry sliding condition. Microstructural characterization confirmed the formation of CeO2 precipitates, whose size and distribution varied with the Ce content. The Ti-0.8Ce alloy exhibited the highest hardness (203 HV), showing a 35% increase compared to CP-Ti, and the lowest wear rate reduced by approximately 47% and 22% under 1 N and 5 N loads, respectively. In contrast, Ti-1.4Ce and Ti-2.0Ce formed coarse CeO2 precipitates, which acted as third-body abrasives. Although these alloys showed lower average friction coefficients than CP-Ti (up to 22% reduction), the enhanced abrasive interaction promoted material removal and increased wear rates. Notably, Ti-2.0Ce exhibited the most severe degradation in wear resistance, with wear rates increases of 21% and 27% under 1 N and 5 N loads, respectively. These findings demonstrate that while CeO2 precipitates reduce friction by suppressing direct metal–metal contact, their abrasive nature adversely affects wear resistance when the particle size and volume fraction are excessive. Therefore, 0.8 wt.% Ce was identified as the optimal composition for improving the wear resistance, achieving the best combination of high hardness, low wear rate without excessive third-body abrasion.

Graphical Abstract

1. Introduction

Titanium (Ti) and its alloys are widely utilized in various industrial fields such as aerospace, automotive, and medical applications, owing to their excellent corrosion resistance, high-temperature stability, high specific strength and stiffness, and biocompatibility [1]. In particular, titanium alloys, as lightweight metallic materials, possess a higher strength-to-weight ratio than aluminum, making them essential structural materials for aircraft that require high reliability. However, Ti and its alloys have been reported to lack the wear resistance essential for application in mechanical components owing to their low hardness, work-hardening exponent, and shear strength [2]. Furthermore, oxide layers formed on the surface during friction can induce adhesive wear, resulting in increased vulnerability to wear [3]. These wear resistance issues limit the use of Ti alloys not only in the aerospace and automotive industries but also in the medical field.
To overcome these limitations, various studies have been conducted to improve the mechanical properties and wear resistance of Ti alloys through alloying and plastic deformation techniques [4]. Recently, research has been conducted to improve the physical, chemical, and mechanical properties of Ti alloys by adding trace amounts of rare earth elements (REEs) such as Ce, La, Nd, Sc, Dy, and Y [5]. REEs refine grains within metals to increase strength and hardness and are also effective as oxygen scavengers owing to their higher chemical affinity for oxygen than for Ti [6]. As a major impurity in Ti alloys, the oxygen degrades mechanical properties by increasing brittleness and lowering ductility [7]. For example, Lim et al. [8] reported that when the oxygen content in Ti-8Al alloy increases from 600 ppm to 1200 ppm, the tensile elongation decreases drastically from 20% to 1%. Therefore, the effective removal of oxygen from Ti alloys is a key factor in improving mechanical performance [8].
Among the REEs that can effectively remove oxygen, cerium (Ce), which forms oxides such as CeO and CeO2 owing to its strong oxygen affinity in Ti alloys, is relatively abundant and economical compared to other REEs. Rare earth oxides formed in Ti alloys exist at grain boundaries and induce the Zener pinning effect, suppressing grain boundary migration and inhibiting grain growth to induce grain refinement [9,10]. Therefore, the formation of CeO and CeO2 in Ti alloys can lead to improved machinability and mechanical properties [11,12]. Additionally, the formation of CeO2 precipitates fixed at α-Ti grain boundaries suppresses the diffusion of impurities (e.g., P, S, Cl, and Ca) and contributes to microstructural stabilization. This purification effect also has a positive impact on mechanical property improvement. Li et al. [12] reported that by adding Ce, the maximum tensile strength of Ti-6Al–4V alloy increases from 787 to 957 MPa, and elongation increases from 8.88% to 12.33%.
Recent studies have demonstrated that minor additions of REE can effectively improve the microstructural stability and mechanical performance of titanium alloys. Scandium (Sc) and yttrium (Y) were shown to enhance hardness and wear resistance in β-type Ti alloys, while Sc alloying refined grains and improved recrystallization stability in commercial pure Ti [13,14]. Erbium (Er) additions simultaneously increased tensile strength and machinability through precipitation strengthening and grain refinement, and Ce additions in cast Ti produced both grain refinement and superior tensile properties via the formation of Ce-based particles [15,16]. Moreover, Ce oxide dispersion in Ti-6Al-4V was reported to significantly reduce chip length and cutting torque, thereby lowering machining costs [17]. Although such findings demonstrate that REE addition can significantly improve the grain refinement and mechanical performance of Ti alloys, systematic research on wear resistance and mechanical friction is still insufficient.
Therefore, this study aims to investigate the friction and wear behavior of Ti alloys according to the concentration of trace-added Ce. Samples were fabricated by adding 0.8, 1.4, and 2.0 wt.% of Ce to CP-Ti Grade 1, and the friction and wear characteristics were analyzed in dry sliding wear (ball-on-disk) experiments. The study aims to elucidate changes in friction mechanisms owing to Ce addition and determine the optimal composition according to Ce addition amount by analyzing the friction wear mechanisms. We found that the Ti-0.8Ce alloy exhibited the most favorable combination of wear resistance and hardness, providing important insight for extending the applicability of Ti alloys, which have mainly been considered for biomedical applications such as implants, to a broader range of structural and functional components, including moving parts in engines and mechanical systems of automobiles and aircrafts.

2. Materials and Methods

2.1. Materials Preparation

CP-Ti Grade 1-based alloys were designed by adding 0.8, 1.4, and 2.0 wt.% Ce to CP-Ti Grade 1, and specimens were fabricated via plasma arc melting (PAM). The PAM process was performed under high-vacuum conditions of 5.0 × 10⁻⁵ Torr using a vacuum plasma melting apparatus (Samhan Vacuum, Paju, Republic of Korea), and each alloy was melted three times under identical conditions for composition homogenization. To confirm the consistency between the nominal and actual compositions, analyses were conducted using a fluorescence X-ray analyzer (XRF, ZSX Primus II, Rigaku Corp., Tokyo, Japan), and the sample names and chemical compositions are presented in Table 1. The chemical composition measured by XRF shows that the sample was well-made as we designed.

2.2. Material Characterization

The phases of the fabricated Ti alloys were analyzed using X-ray diffraction (XRD; X’Pert3-Powder, PANalytical, Malvern, UK) with a Cu Kα radiation source, and were measured at a scan rate of 2°/min in the range of 20°~80°. For microstructural observation, specimens were ground with SiC abrasive papers up to 4000 grit and then polished with 1 μm alumina powder. Subsequently, the microstructure was revealed by etching in a solution containing 2 mL of hydrofluoric acid (HF), 5 mL of hydrogen peroxide (H2O2), and 100 mL of distilled water. The microstructure was observed using field-emission scanning electron microscopy (FE-SEM, SU5000, Hitachi, Tokyo, Japan) and energy-dispersive X-ray spectroscopy (EDS). The micrographs were analyzed using a quantitative image analysis program (Image-Pro-Plus, Media Cybernetics, Rockville, MD, USA) to measure the size, distribution, and area fraction of the precipitates. The hardness of the Ti-Ce alloy specimens was measured using a Vickers hardness tester (FM-810, FUTURE-TECH CORP, Kawasaki, Japan) applying a load of 0.1 kg∙f for 15 s.

2.3. Tribological Tests

Wear tests were performed using a ball-on-disk tribometer (Tribometer, Ansan-si, Republic of Korea) (Figure 1). The experimental conditions are presented in Table 2. The tests were conducted at room temperature under the wear loads of 1 N and 5 N, at a linear sliding speed of 0.1 m/s, with a total sliding distance of 300 m. The wear tests for each condition were performed seven times to ensure repeatability, and the wear rate was calculated by averaging the results, excluding the maximum and minimum values. An AISI 52100 steel ball (HV 700–900) was used as the counterbody material, with a ball diameter (Rb) of 5.556 mm.
Prior to wear tests, specimens were cut to dimensions of 15 × 15 × 3 mm3, and they were ground up to 4000 grit using SiC abrasive paper. Subsequently, the specimens were maintained under vacuum conditions for 24 h to completely remove surface moisture. After testing, the wear rates were calculated based on the densities and weight losses of the specimens, and their true densities were determined using Archimedes’ method; Table 1 lists the average of seven measurements. The wear volume (λ) was calculated using the following formula:
λ = ∆V/L = ∆m/(p∙L),
where ΔV, Δm, p, and L indicate the volume loss, weight loss, true density, and track distance, respectively. During the tests, the friction coefficient was continuously recorded, and the weight loss of specimen was calculated by measuring the weight before and after tests. Wear tracks were analyzed using scanning electron microscopy (SEM). The surface tophography of the wear tracks was precisely analyzed using a white light interferometer (Profilm 3D, FILMETRICS, San Diego, CA, USA), and the track depth was obtained by averaging 30 measurements.
The surface tophography of the wear tracks was precisely analyzed using a white light interferometer and the track depth was obtained by averaging 30 measurements. After the wear test, wear debris generated from the wear track on the sample surface was collected using carbon tape and analyzed for its morphological characteristics.

3. Results and Discussion

3.1. Microstructure and Phase Analysis

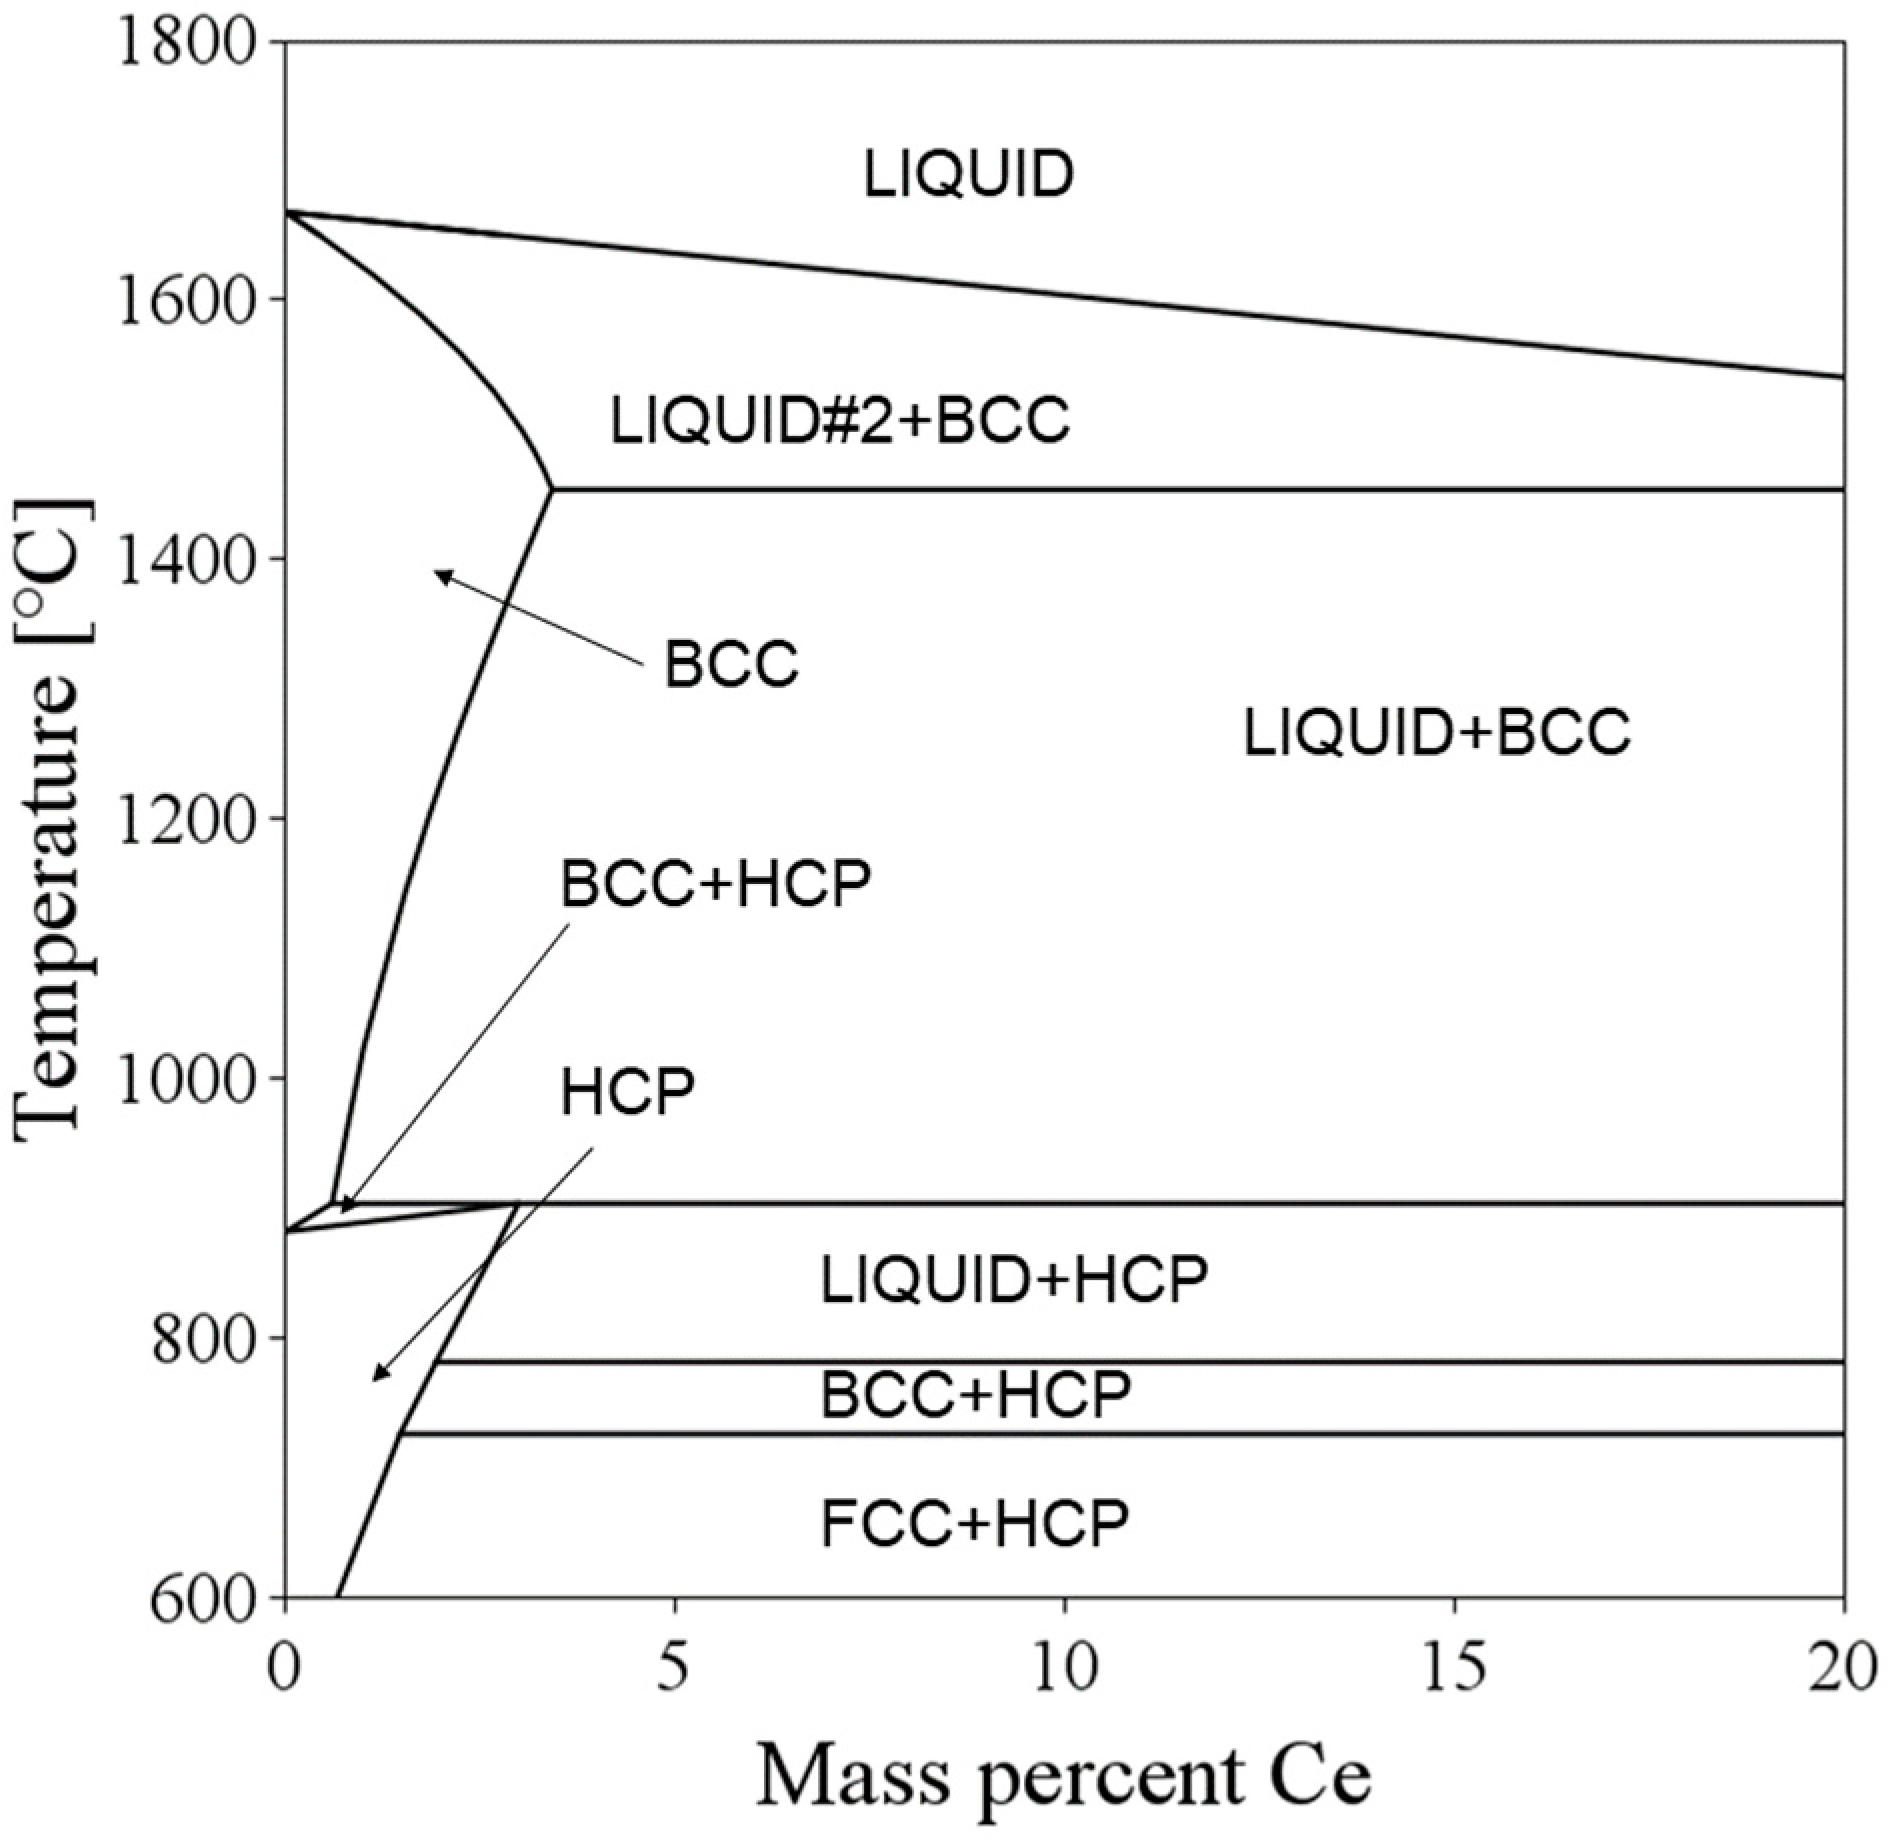
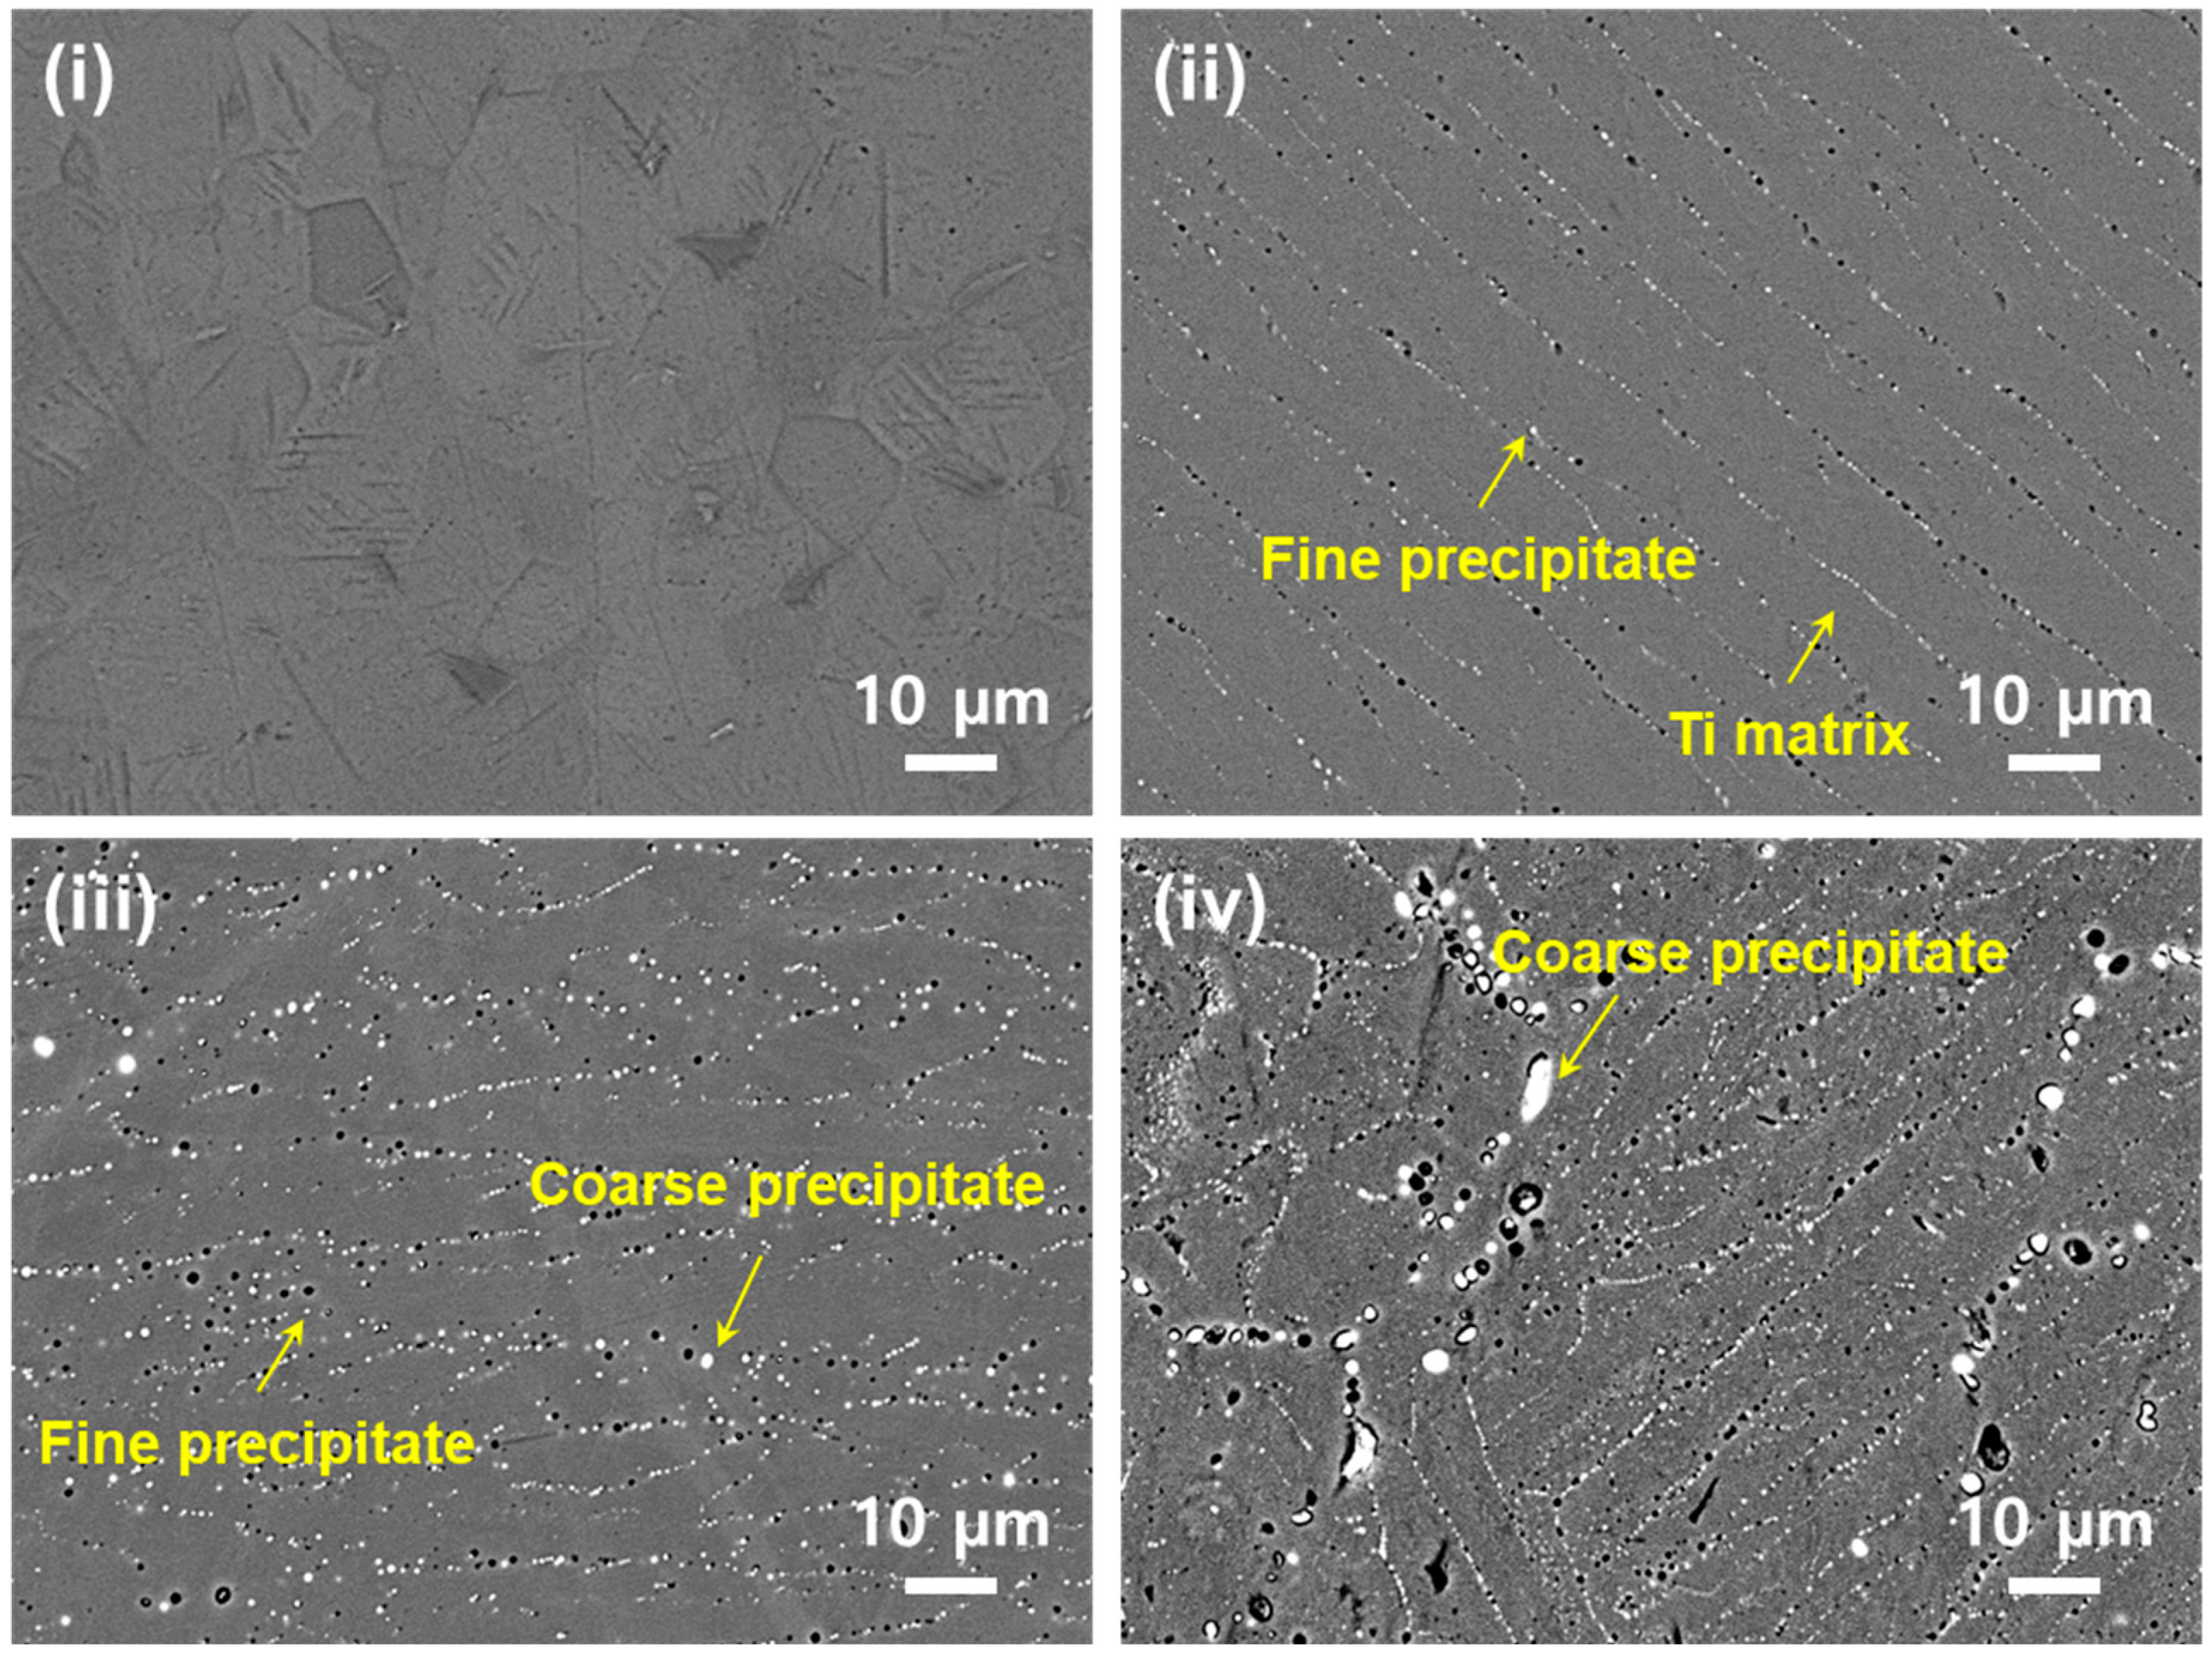
The Ti-Ce binary phase diagram is presented in Figure 2. According to the diagram, the solubility of Ce in β-Ti is less than 1 wt.% and decreases even more sharply in the α-Ti region, reaching approximately 0.68 wt.% at 600 °C and dropping further with decreasing temperature. Therefore, alloys containing 0.8–2.0 wt.% Ce remain supersaturated throughout the entire composition range of these alloys, inevitably leading to the formation of stable CeO2 precipitates. The microstructures of CP-Ti and Ti-Ce alloys were observed using SEM, and the results are shown in Figure 3. CP-Ti Grade 1 comprised equiaxed grains of uniform size (Figure 3i), corresponding to the α-Ti phase according to the Ti phase-equilibrium diagram [18,19,20]. Upon Ce addition, precipitates were formed within the matrix and along the grain boundaries, where their size and distribution changed distinctly according to the addition amount. In the Ti-0.8Ce alloy, fine precipitates linearly aligned within the grains were observed (Figure 3ii), indicating that the solid solubility limit of Ce is lower than 0.8 wt.% [9]. As the Ce content increased to 1.4 wt.% and 2.0 wt.%, precipitates were formed not only within grains but also at grain boundaries (Figure 3iii,iv).
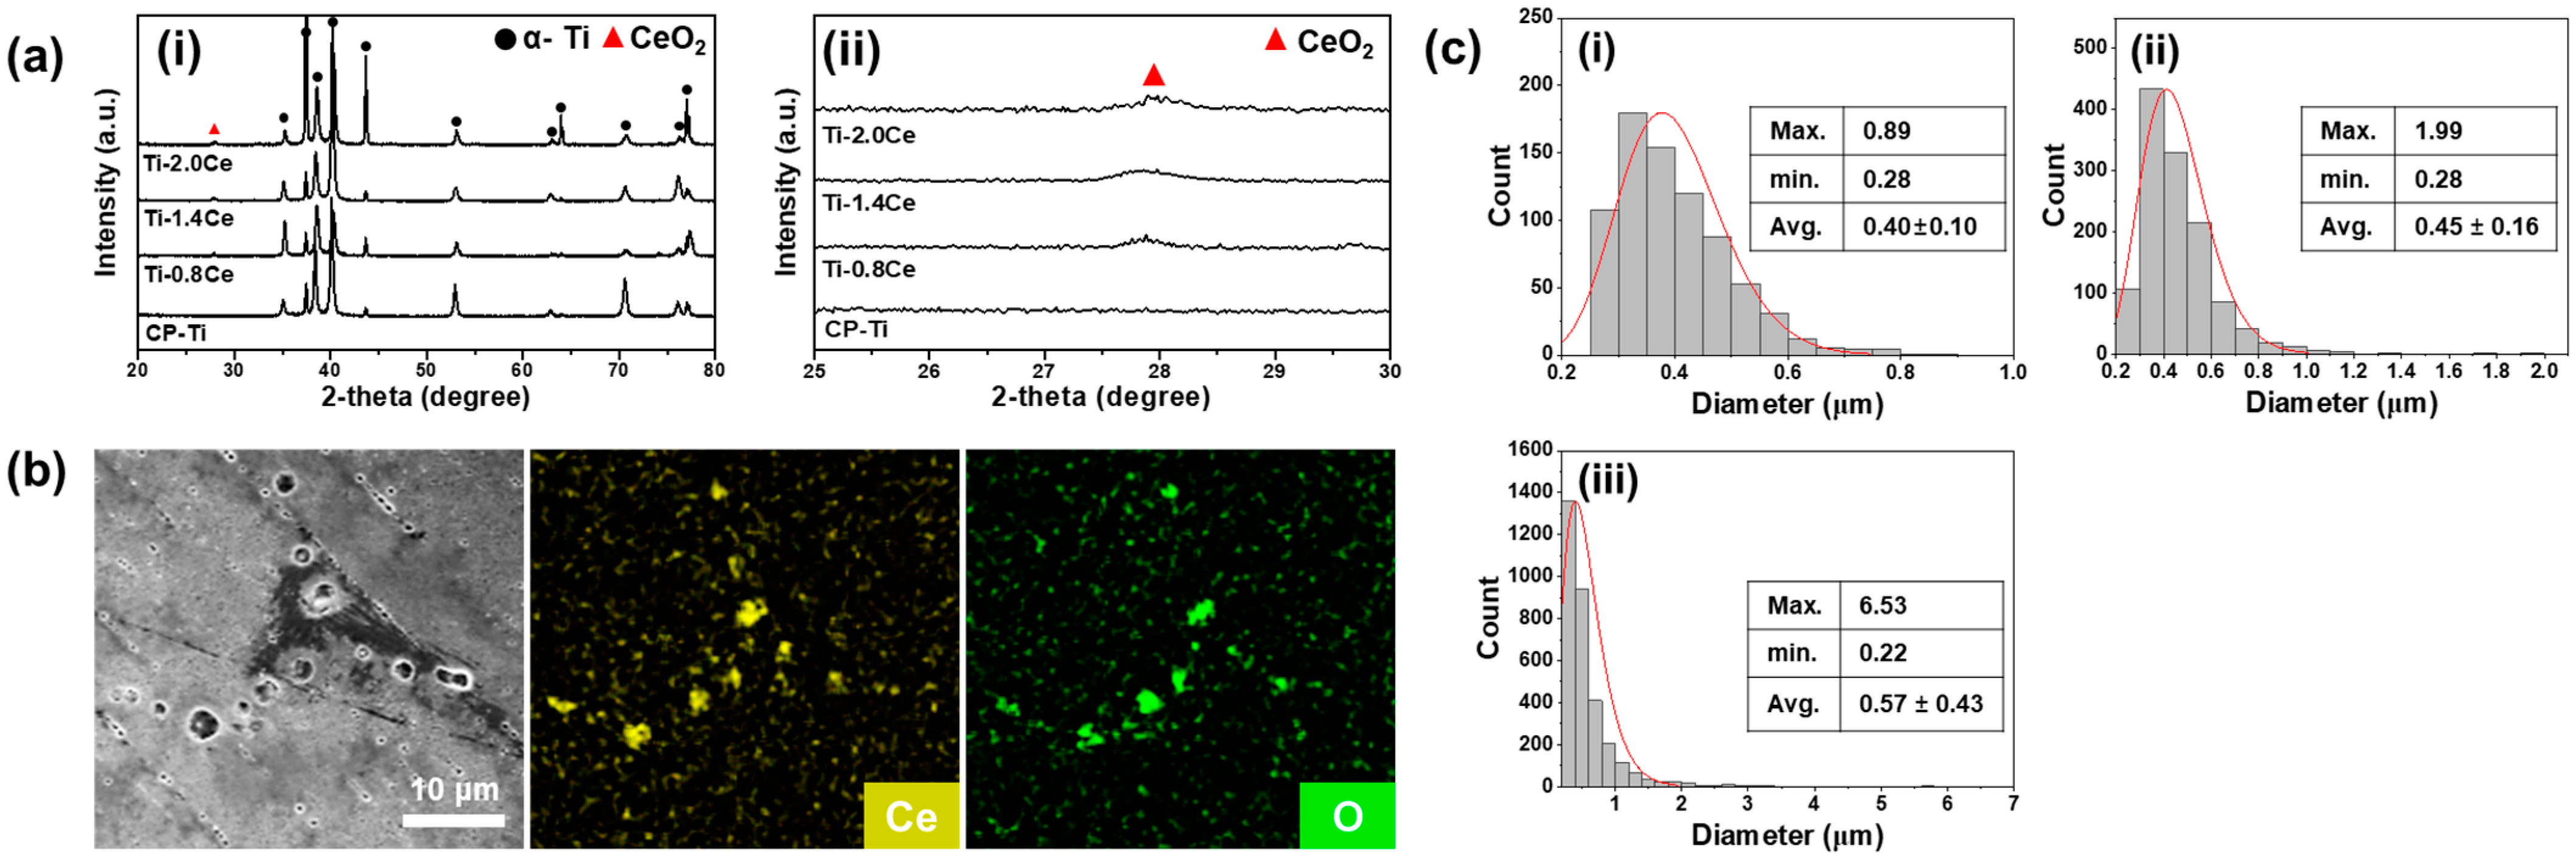
XRD and EDS mapping were performed to analyze the qualitative characteristics of the formed precipitates related to Ce and the results are presented in Figure 4. In the XRD patterns, the Ti and Ti-Ce alloys mainly consist of the α-Ti phase, and a diffraction peak corresponding to CeO2 appears at ~27.8°. This indicates that Ce exceeding the solid solubility limit reacted with oxygen in Ti matrix to precipitate as oxides, since the CP-Ti Grade 1 contains 0.18% of oxygen at interstitial sites [19]. EDS mapping analysis further revealed that Ce and O signals were co-located, indicating the formation of CeO2 precipitates. This is attributed to the high oxygen affinity of Ce, a typical characteristic of REEs [21,22]. Such CeO2 precipitates, which are reacted with a significant formation Gibbs free energy (−1024 kJ/mol), cannot be reduced to cerium metal and oxygen in Ti matrix, thus the size and distribution of CeO2 are hardly changed by the heat treatments [23]. Ti-Ce intermetallic compounds were not observed, and no new Ti phases were formed. In addition to the XRD and EDS analyses confirming the formation of CeO2 precipitates in Ti-Ce alloys, their size and distribution were examined from backscattered electron (BSE) images as shown in Figure 4c, and their quantitative results, including maximum, minimum, and average sizes as well as area fractions, are summarized in Table 3. The average diameter of CeO2 precipitates in Ti-0.8Ce was 0.40 ± 0.10 μm, with a maximum of 0.89 μm and a minimum of 0.28 μm. In addition, the average diameter of CeO2 precipitate in Ti-1.4Ce was 0.45 ± 0.16 μm, with a maximum of 1.99 μm and a minimum of 0.28 μm. In contrast, Ti-2.0Ce exhibited a broader distribution, with an average size of 0.57 ± 0.43 μm, a maximum of 6.53 μm, and a minimum of 0.22 μm. Moreover, the number of CeO2 precipitates was also significantly increased with the increase in Ce contents in Ti. In particular, the number of CeO2 precipitates in Ti-0.8Ce was less than 63% of those in Ti-1.4Ce. Along with this increase, the precipitate morphology evolved from fine, equiaxed particles dispersed within grains at 0.8 wt.% Ce to coarser, irregular particles preferentially segregated along grain boundaries at 1.4 and 2.0 wt.% Ce. Consistently, the measured area fraction (Area) of CeO2 precipitates increased markedly with Ce content, from 0.44% (Ti-0.8Ce) to 1.37% (Ti-1.4Ce), and 2.42% (Ti-2.0Ce), indicating a substantial increase in precipitate content. These results demonstrate a progressive increase in both size and area fraction of CeO2 precipitates with increasing Ce content. These results indicate that an increase in Ce content leads not only to a greater volume fraction and number of CeO2 precipitates but also to coarsening and morphological irregularity.
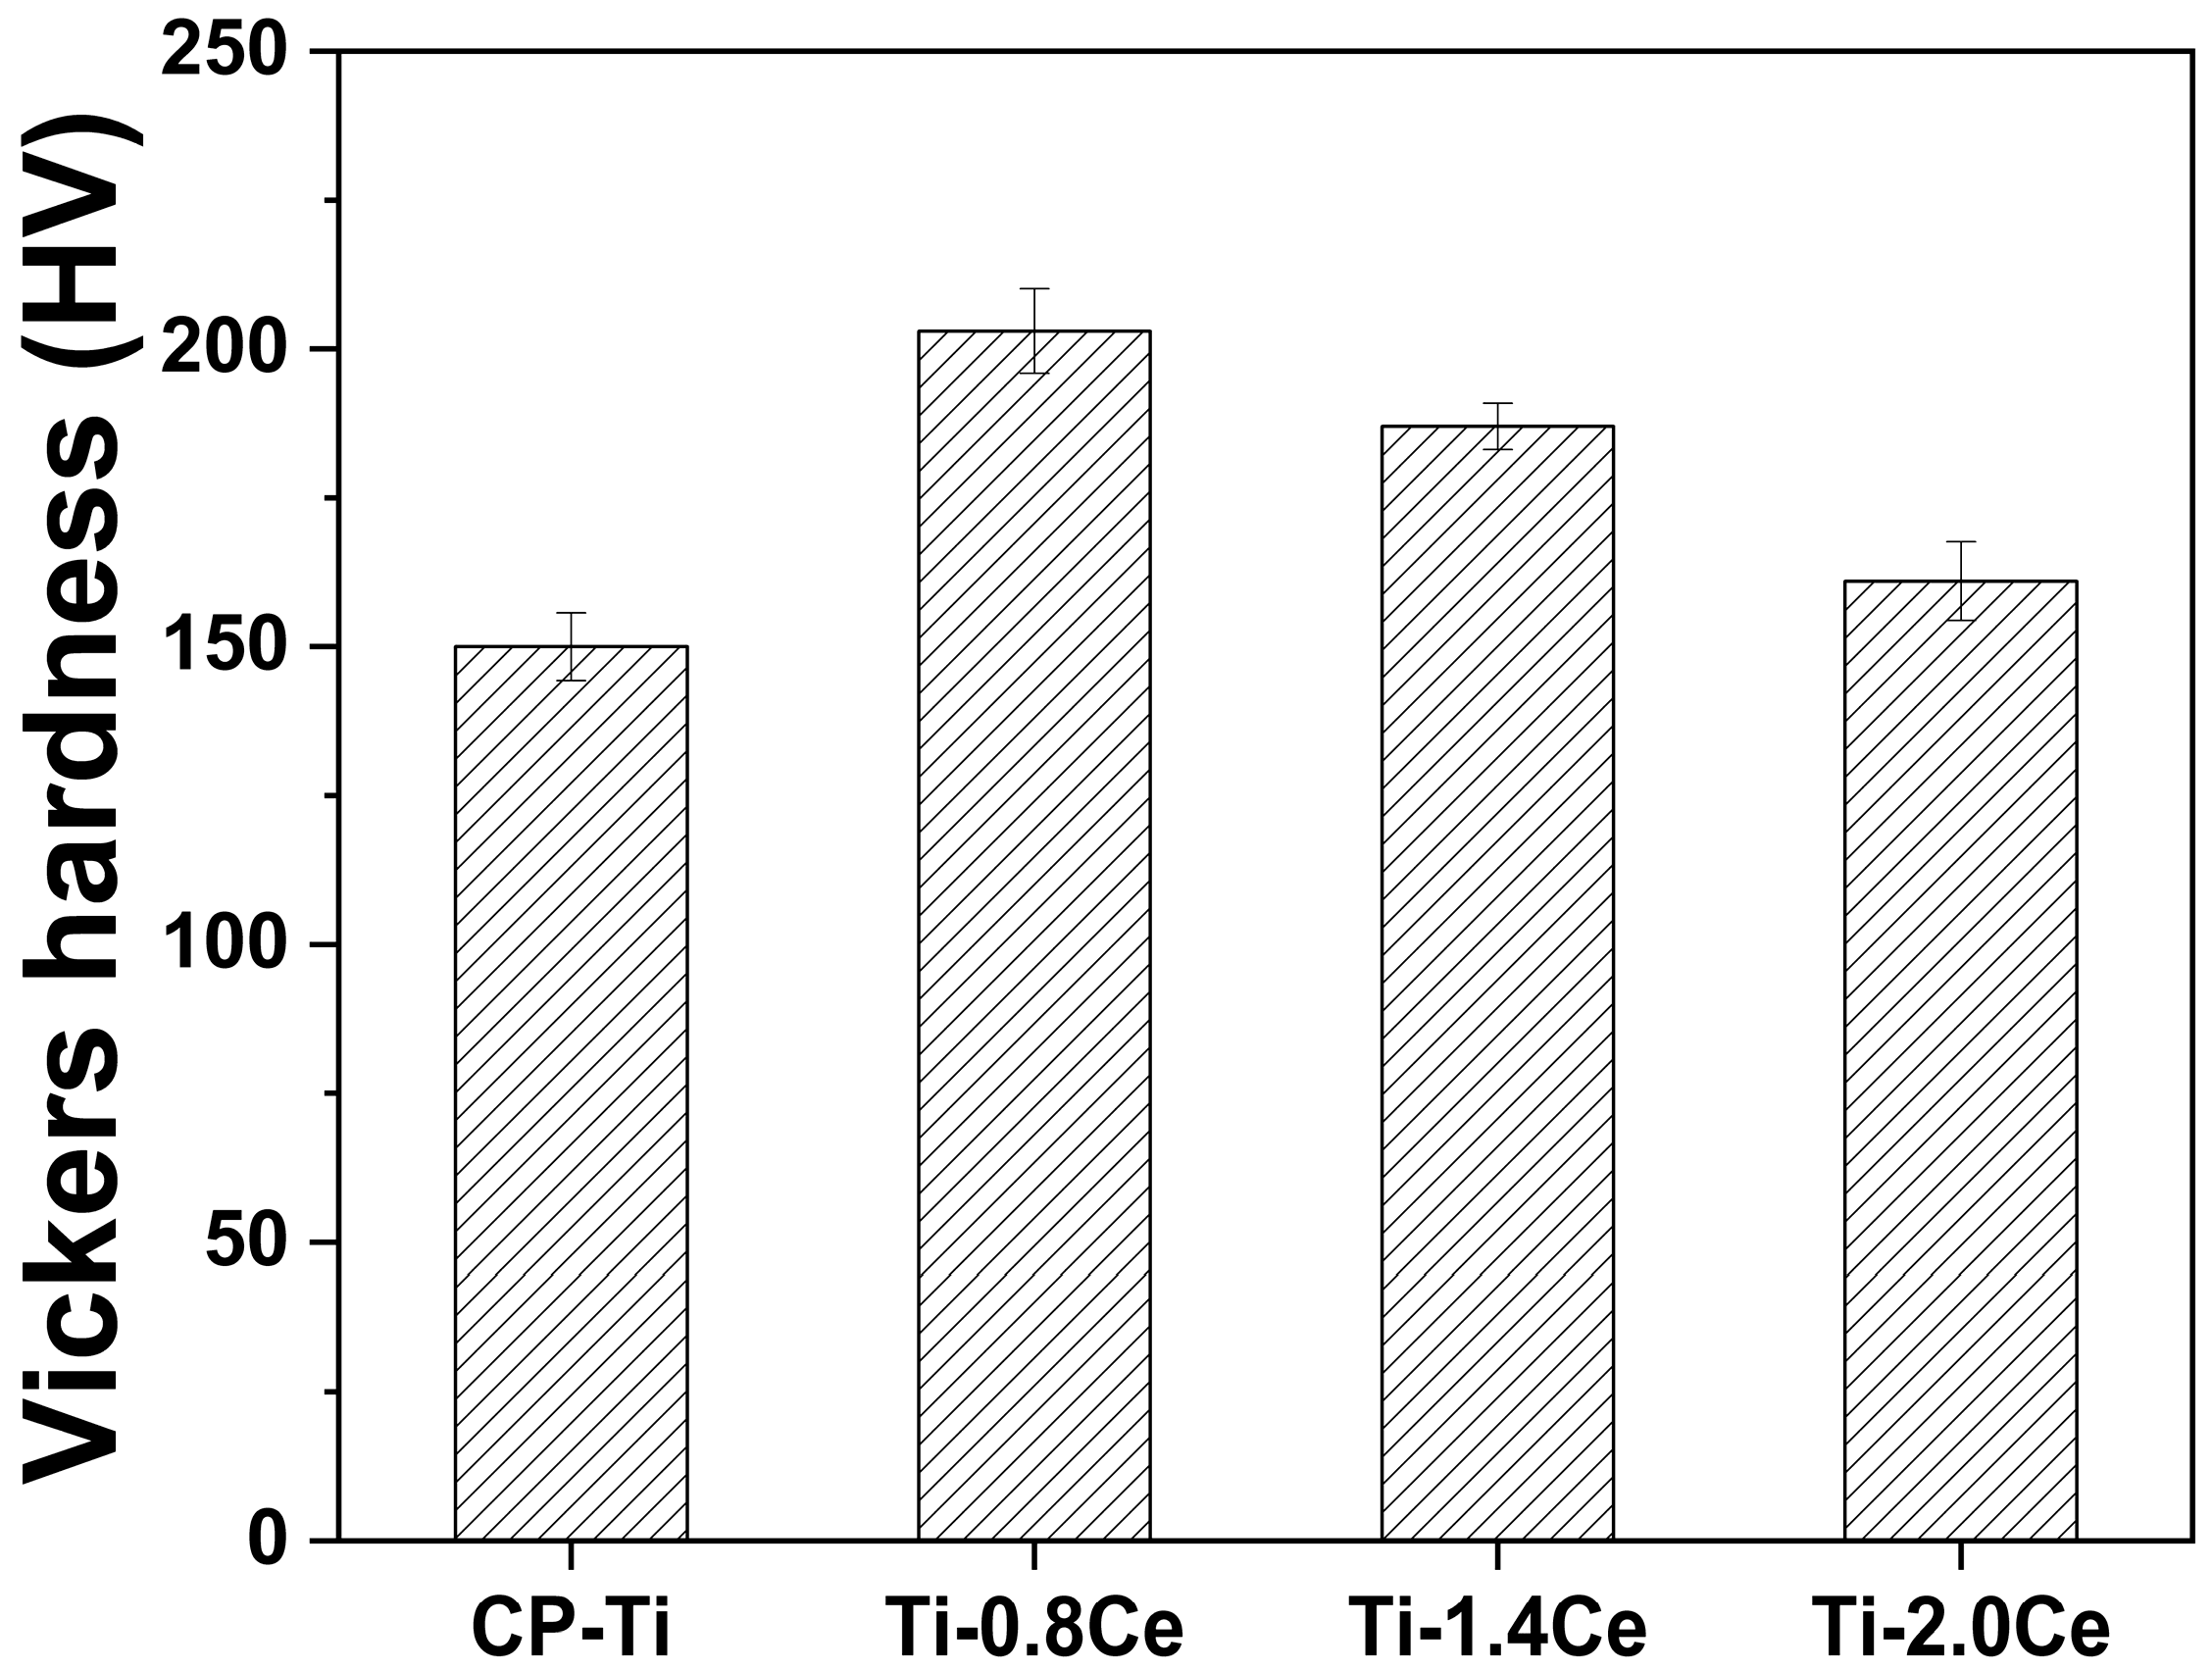
To quantitatively analyze the effect of Ce-induced changes in precipitate morphology and distribution on hardness, the Vickers hardness (HV) of Ti and Ti-Ce alloys was measured and the results are shown in Figure 5. The hardness of Ti was 150 ± 5.7 HV, while that of Ti-0.8Ce was 203 ± 7.1 HV, representing an ~35% improvement in hardness by 0.8 wt.% of Ce addition. This is attributed to the solid solution strengthening effect of Ce as well as the precipitation strengthening effect by fine CeO2 precipitates [24,25]. However, as the Ce content increased, the hardness tended to decrease, with Ti-1.4Ce and Ti-2.0Ce exhibiting hardness of 187 ± 3.9 HV and 161 ± 6.6 HV, respectively. The hardness was decreased because Ce exceeding the solid solubility limit formed coarse CeO2 precipitates within grains and at grain boundaries, weakening the dispersion strengthening effect [11,26].
The hardness increases with Ce addition of 0.8 wt.% due to the combined effects of precipitation hardening and solid solution strengthening. However, when the Ce content exceeds 0.8 wt.% (i.e., 1.4 and 2.0 wt.% Ce), the hardness decreases owing to the formation of coarse oxide precipitates. Nevertheless, the slightly higher hardness than Ti-2.0Ce compared to CP-Ti is attributed to the grain refinement effect commonly reported in REE-alloys. Several studies have demonstrated that REE additions can suppress grain growth during solidification, resulting in microstructural refinement and improved mechanical properties [11,27]. For instance, Li et al. [12] reported that Ce addition suppresses grain growth of the α-Ti matrix to induce grain refinement, thereby improving tensile strength and yield strength. However, Xu et al. [22] reported that adding more than 0.7 wt.% Ce to Ti-6Al–4V alloy results in mechanical property deterioration owing to coarse oxide precipitation. Similar to previous reports, we observed significant changes in microstructure by the addition of Ce in Ti alloy; thus, their effect on the wear and tribology should be explored for optimizing the wear resistance.

3.2. Wear Rate

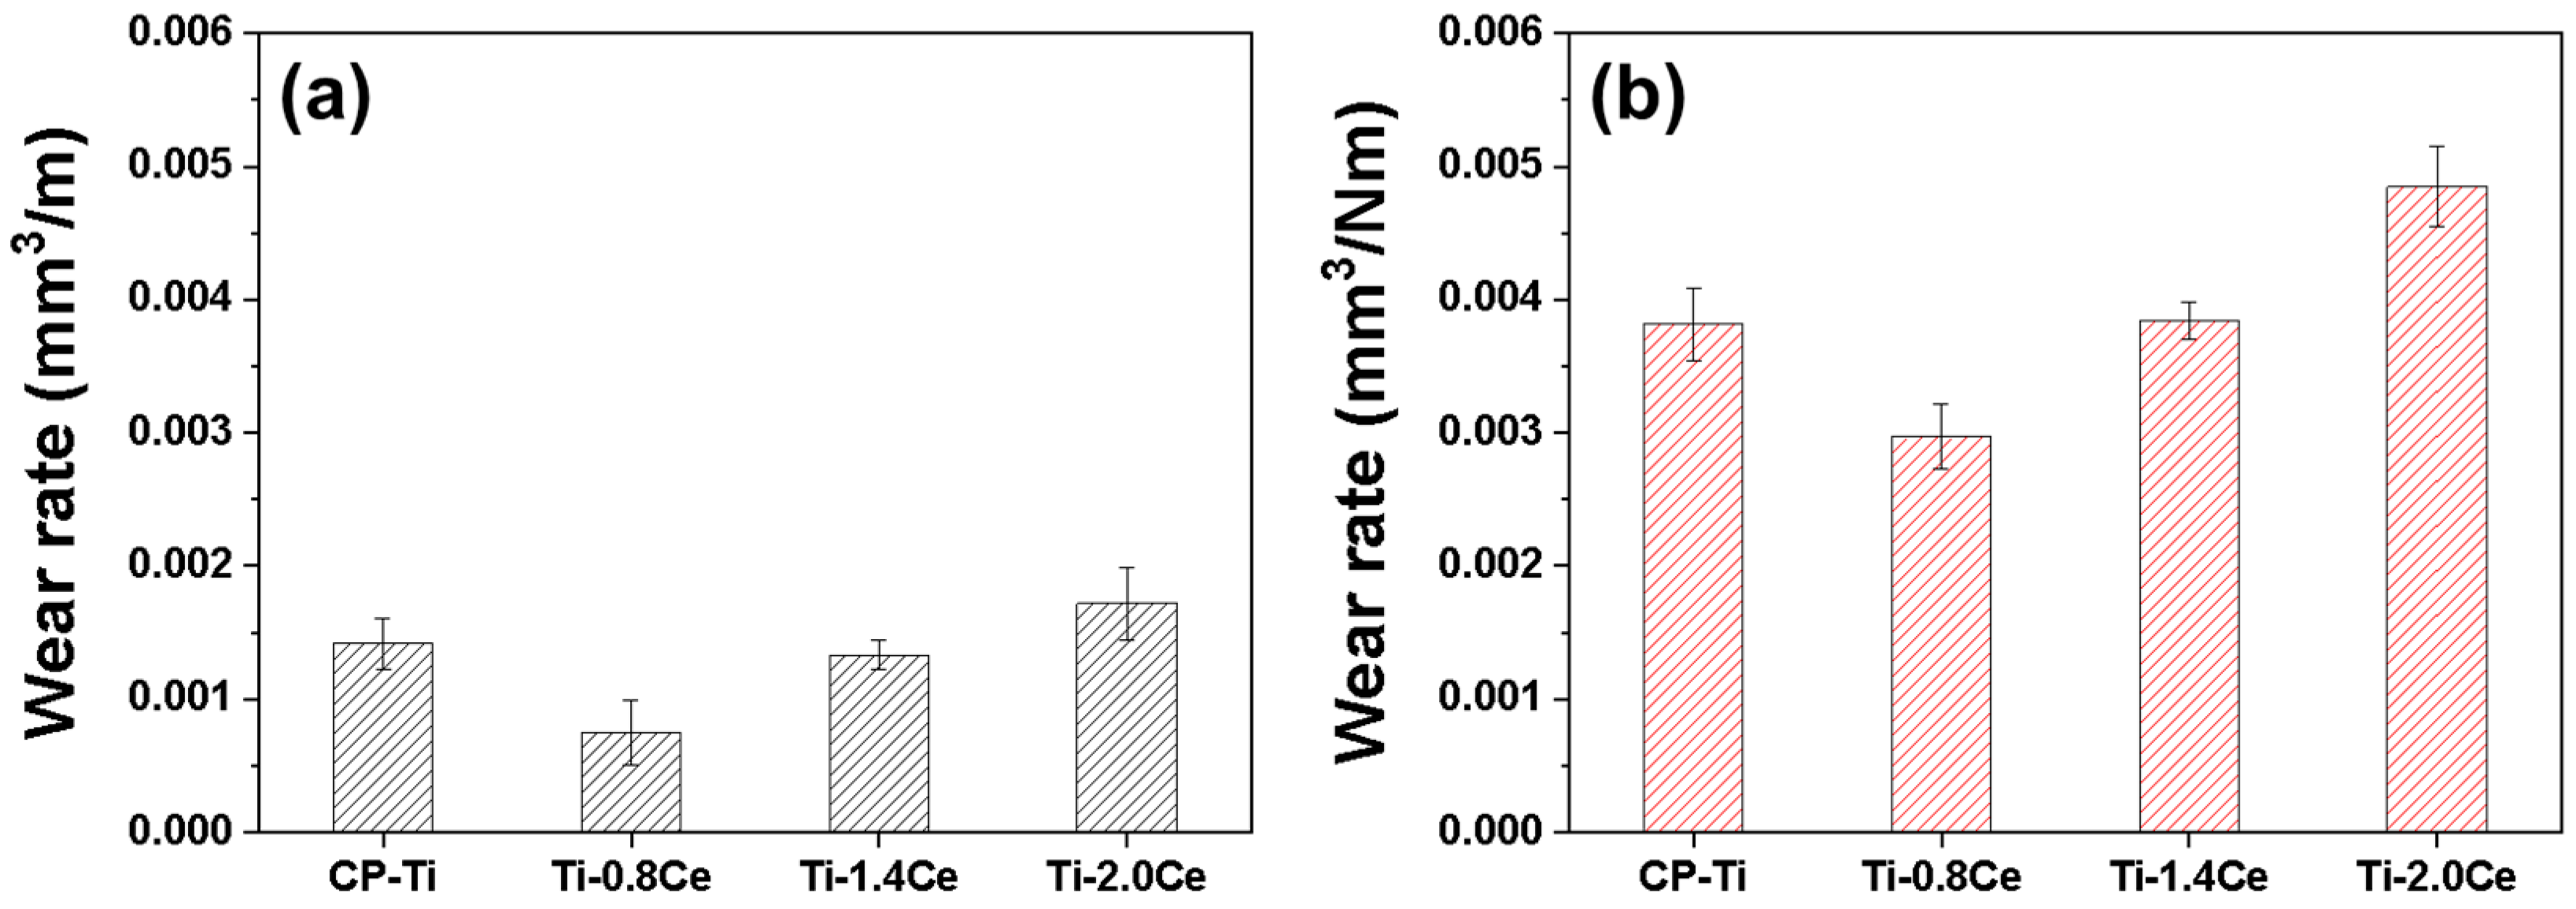
To evaluate the effect of Ce addition on the wear resistance of Ti alloys, the wear rates were compared under two different loads (1 N and 5 N), and the results are presented in Figure 6. Generally, according to Archard’s law, the volumetric loss of a material is inversely proportional to its hardness [28], where higher hardness tends to result in a lower wear rate. Ti-0.8Ce exhibited a hardness of 203 ± 7.1 HV, which is approximately 35% higher than that of CP-Ti. As a result, its wear rates were significantly reduced to 0.00075 mm3/m under a 1 N load and 0.00297 mm3/m under a 5 N load, compared to 0.00142 mm3/m and 0.00382 mm3/m for CP-Ti, respectively. These results indicate that wear resistance of Ti-0.8Ce is predominantly determined by the increase in surface hardness. However, the wear behavior of Ti-1.4Ce and Ti-2.0Ce could not be explained by hardness alone. Although Ti-1.4Ce (187 ± 3.9 HV) is harder than Ti (150 ± 5.7 HV), its wear rates under 1 N and 5 N loads were 0.00133 and 0.00383 mm3/m, respectively, showing a similar wear rate to CP-Ti. Furthermore, Ti-2.0Ce showed higher hardness (161 ± 6.6 HV) than Ti; however, it exhibited higher wear rates of 0.00172 mm3/m at 1 N and 0.00485 mm3/m at 5 N, indicating lower wear resistance.
These results indicate that the wear behavior cannot be sufficiently explained solely by the generally expected correlation between hardness and wear rate. Wear is generally known to be a complex phenomenon in which various mechanisms, such as abrasive and adhesive wear, detachment and accumulation of particles formed during friction, and re-adhesion, act in combination [29]. In this study, the microstructural characteristics of the CeO2 precipitates formed upon Ce addition are found to have decisively influenced the wear mechanism. Fine precipitates uniformly distributed within the grains contribute to mitigating surface damage by effectively dispersing the frictional load and suppressing stress concentration [22,30]. On the other hand, coarse and non-uniformly distributed precipitates can induce abrasive action, thereby accelerating wear [31,32,33,34]. Accordingly, the wear behavior upon Ce addition is predominantly governed by the number, size, distribution, and detachment pattern of the CeO2 precipitates, which cannot be solely explained by hardness changes. This precipitate-based wear mechanism was examined in more detail by qualitatively analyzing the wear track morphology and wear particles.

3.3. Wear Track and Debris

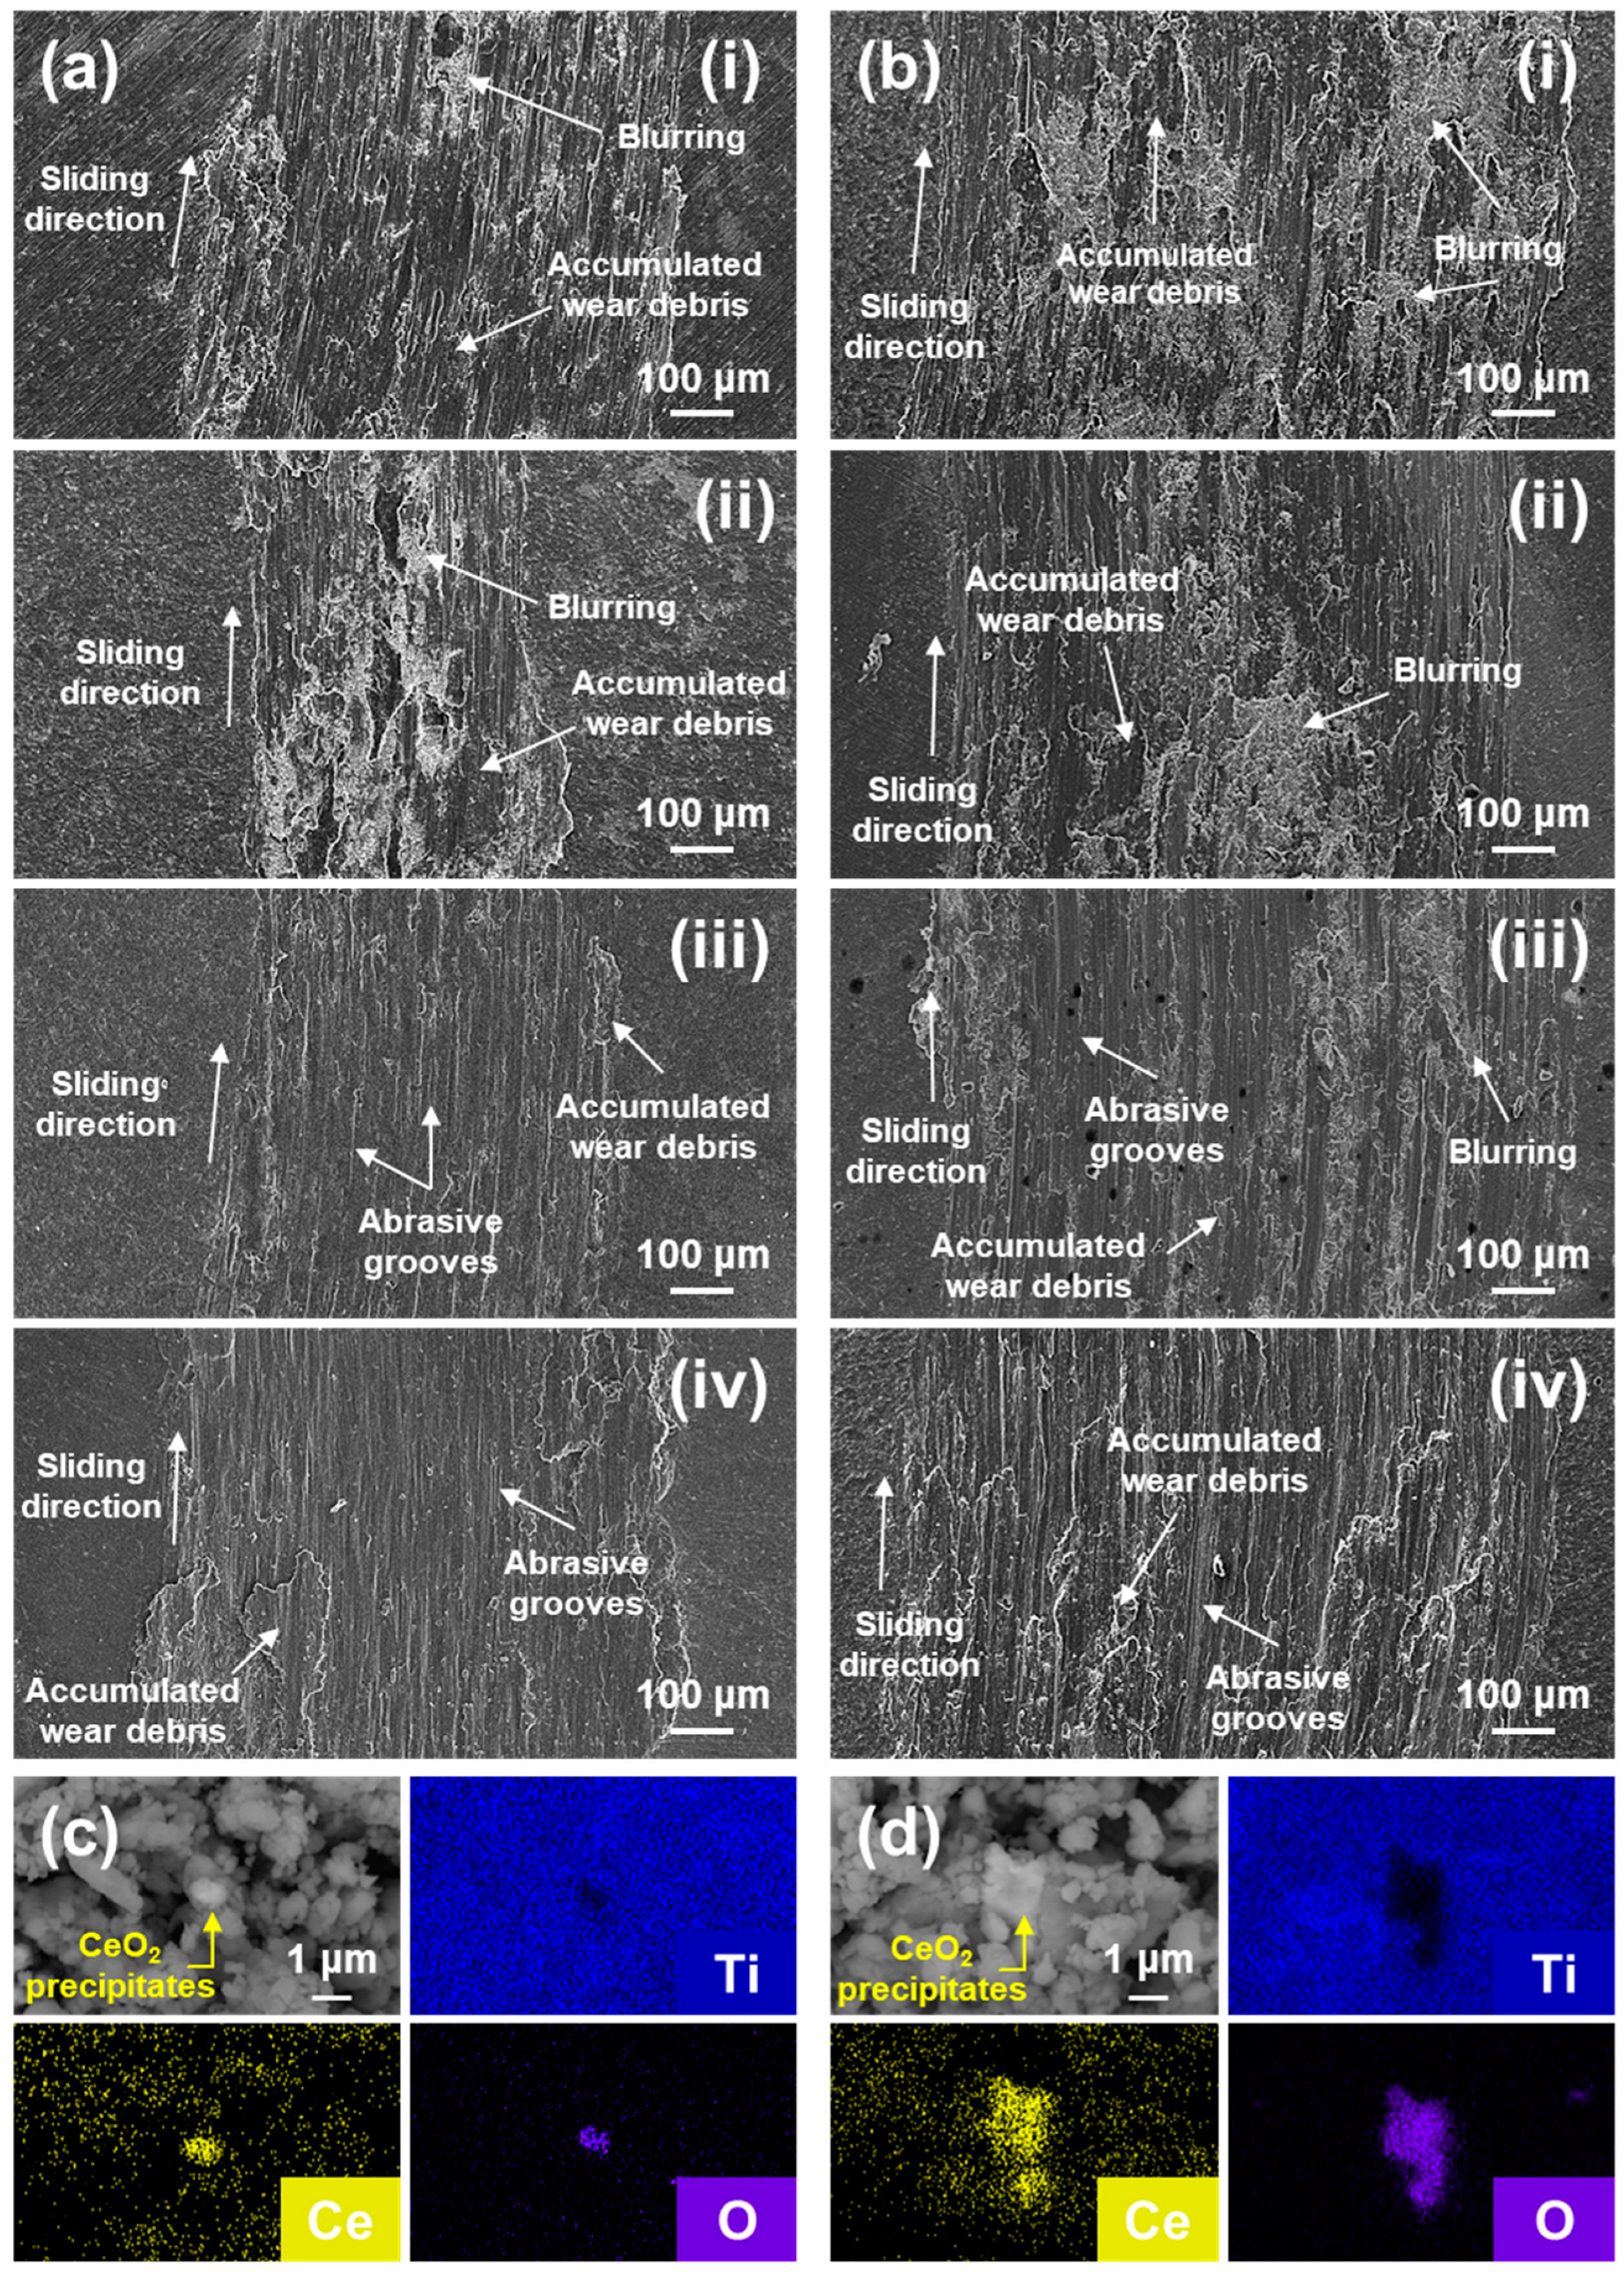
To investigate the effect of Ce addition on the wear mechanism, the wear tracks and wear debris under 1 N and 5 N load conditions were analyzed using SEM and EDS. This allowed the influence of the morphology and distribution of CeO2 precipitates on the wear behavior of Ti-Ce alloys to be determined; the results are presented in Figure 7. CP-Ti, known for its high ductility and chemical reactivity, typically exhibits pronounced adhesive wear [4,35]. During sliding contact, detached wear debris tends to re-adhere to the worn surface, leading to increased surface roughness and progressive damage accumulation [36]. In the wear tracks of CP-Ti and Ti-0.8Ce, a substantial amount of accumulated debris was observed, suggesting a dominant adhesive wear mechanism, wherein wear debris remains on the surface and is re-adhering during sliding, resulting in localized stress concentration and heterogeneous surface damage [37,38]. These results also indicate that the number and size of CeO2 precipitates in Ti-0.8Ce were not effective in changing the wear mechanism of Ti. In contrast, the wear track of Ti-1.4Ce and Ti-2.0Ce exhibited fewer accumulated debris, and the primary features were grooves aligned parallel to the sliding direction, indicating a dominant abrasive wear mechanism. However, features associated with adhesive wear, such as localized blurring and debris reattachment, were also observed on the wear tracks of Ti-1.4Ce and Ti-2.0Ce. This combined wear behavior can be attributed to the hard CeO2 precipitates dispersed throughout the microstructure, which acted as third-body abrasives [39]. Although these CeO2 precipitates effectively redistributed the applied load across the contact surface, reducing severe localized damage, their intrinsic hardness simultaneously promoted material removal, thereby contributing to an increased wear rate compared to Ti-0.8Ce. SEM and EDS characterization of the wear debris (Figure 7c,d) revealed that the Ti-1.4Ce contained uniformly distributed spherical CeO2 precipitates smaller than 1 μm, while Ti-2.0Ce exhibited significantly larger (~3 μm), irregularly shaped precipitates predominantly located at grain boundaries. In Ti-1.4Ce, the fine precipitates effectively dispersed the applied contact load and partially mitigated severe localized damage. Nevertheless, due to their hardness, CeO2, these precipitates accelerated material removal, thereby increasing the wear rate. Thus, the wear rate of Ti-1.4Ce was significantly higher than that of Ti-0.8Ce. Ti-2.0Ce showed more severe abrasive and adhesive wear, characterized by pronounced grooves and accumulated debris. This intensified wear behavior in Ti-2.0Ce is attributed to the presence of coarse and irregularly shaped CeO2 precipitates [38,40].
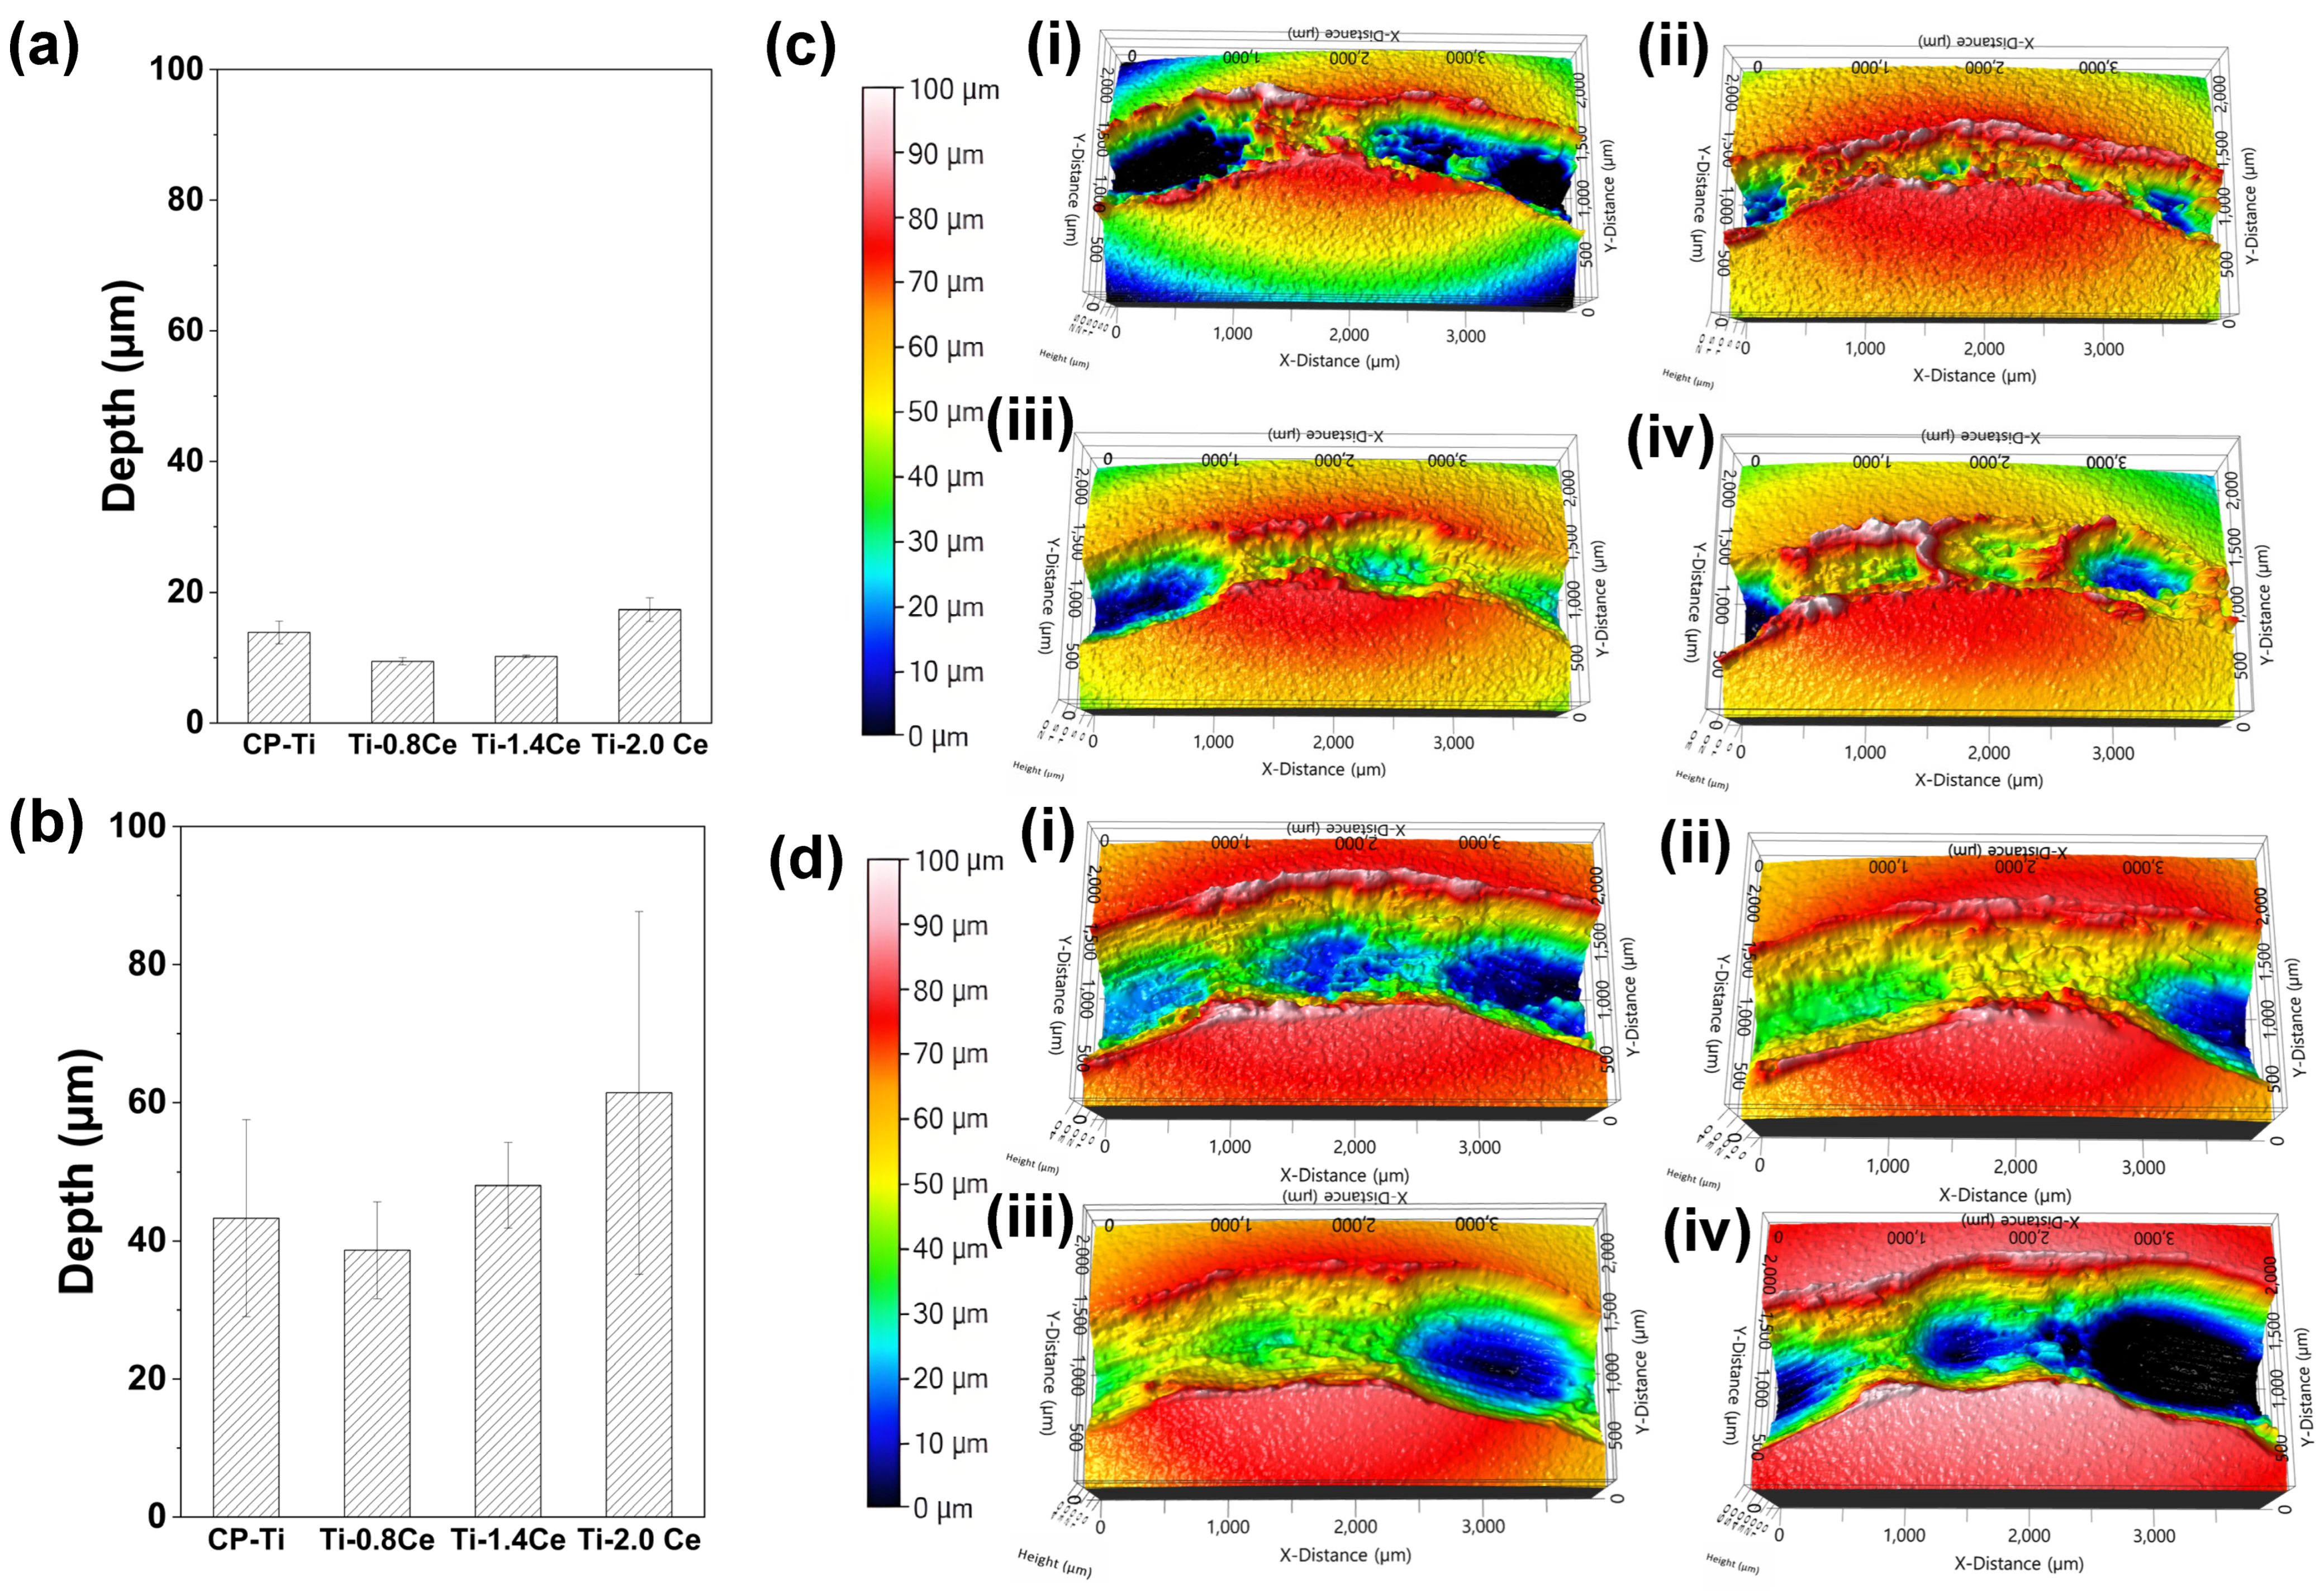
To quantitatively compare the morphological differences in wear tracks resulting from Ce addition and to evaluate the progression of friction surface damage with changing loads, the track depth was analyzed using a white light interferometer, and the results are presented in Figure 7. Under a 1 N load, both Ti-0.8Ce (9.5 ± 0.6 µm) and Ti-1.4Ce (10.2 ± 0.2 µm) exhibited shallower depth compared to CP-Ti (13.9 ± 1.7 µm), indicating improved wear resistance. In contrast, Ti-2.0Ce showed a significantly increased depth of 17.4 ± 1.8 µm, suggesting that excessive Ce addition deteriorated the wear resistance. These differences are attributed to changes in the morphology and distribution of CeO2 precipitates, which altered the dominant wear mechanisms and influenced the extent of surface damage during sliding. Under the 5 N load, the wear track depth of Ti-0.8Ce was 38.7 ± 7.0 µm, which is significantly shallower than that of CP-Ti (43.3 ± 14.3 µm), indicating improved wear resistance. In contrast, Ti-1.4Ce and Ti-2.0Ce exhibited greater depths of 48.0 ± 6.2 µm and 61.4 ± 26.3 µm, respectively. These results suggest that while a small addition of Ce (0.8 wt.%) enhances wear resistance by increasing surface hardness, higher Ce contents lead to the formation of coarse CeO2 precipitates, which promote a combination of abrasive and adhesive wear mechanisms. This results in more severe surface damage and deeper wear tracks, despite the relatively higher hardness of these alloys with more than 1.4 wt.% of Ce compared to CP-Ti. Additionally, the greater volume fraction and coarsening of CeO2 precipitates at higher Ce contents enhance third-body abrasive interactions during sliding. This intensified grinding action contributes to elevated material removal, thereby resulting in both an increased wear rate and more pronounced wear track depth.

3.4. Friction

Figure 8 shows the friction coefficient during the wear test. CP-Ti and Ti-Ce alloys exhibited typical friction behavior consisting of an initial break-in stage followed by a steady-state stage.
The break-in stage, in which surface asperities and defects are worn away or plastically deformed [41,42], was shorter under the 5 N load condition (30–80 m) compared to 1 N (75–130 m). This is because the higher applied load generates greater contact pressure, which promotes rapid flattening of surface irregularities, leading to an earlier transition into the steady-state stage [43].
To quantitatively analyze only the intrinsic friction behavior, the average friction coefficients in the steady-state stage were compared, as shown in Figure 9. Under 1 N, the average friction coefficient for CP-Ti was the highest at 1.235. Ti-0.8Ce exhibited a slightly reduced value of 1.083, while Ti-1.4Ce showed the lowest value at 0.963. Ti-2.0Ce exhibited a moderate increase to 1.014 compared to Ti-1.4Ce. A similar trend was observed under the 5 N condition. CP-Ti showed the highest value of 0.887, Ti-0.8Ce decreased to 0.802, Ti-1.4Ce further decreased to 0.776, and Ti-2.0Ce slightly increased to 0.794. Overall, Ti-Ce alloys demonstrated lower friction coefficients than CP-Ti across both loads, with Ti-1.4Ce consistently showing the lowest average values.
As discussed in the wear track and debris analysis, the reduced friction coefficients in Ti-1.4Ce and Ti-2.0Ce can be attributed to the transition from adhesive to abrasive wear conditions induced by CeO2 precipitates. In contrast, CP-Ti and Ti-0.8Ce showed relatively higher friction coefficients due to dominant adhesive wear with limited third-body interaction. However, as previously discussed, these precipitates did not enhance wear resistance. Instead, their abrasive nature, particularly in Ti-2.0Ce, accelerated material removal. These findings confirm that while Ce addition lowers friction by altering contact conditions, excessive amounts promote wear via intensified abrasive effects. Among the alloys, Ti-0.8Ce demonstrated the most favorable balance, exhibiting both moderate friction reduction and the highest wear resistance.

4. Conclusions

In this study, the effect of cerium (Ce) addition on the dry sliding wear behavior of commercially pure titanium (CP-Ti) was investigated by varying the Ce content to 0.8, 1.4, 2.0 wt.%. The results demonstrated that the wear resistance and friction characteristics were significantly affected by the morphology and distribution of CeO2 precipitates.
  • The Ti-0.8Ce alloy showed the highest hardness and lowest wear rate, achieving reductions of 47.2% (1 N) and 22.2% (5 N) compared to CP-Ti improvements, which are attributed to the solid solution and precipitation strengthening effect of fine CeO2 precipitates.
  • In the Ti-1.4Ce and Ti-2.0Ce, the formation of coarser CeO2 precipitates led to increased wear rates compared to Ti-0.8Ce, despite their higher hardness than CP-Ti. This is due to third-body abrasion and composite wear behavior induced by the hard precipitates.
  • Although Ti-1.4Ce showed the lowest average friction coefficients (0.963 at 1 N, 0.776 at 5 N), this was a result of increased abrasive interaction with the precipitates rather than improved wear resistance. The elevated material removal due to this mechanism ultimately reduced wear performance.
  • Ti-2.0Ce, containing coarse and irregular precipitates, exhibited the highest wear rate and deepest wear track, indicating a deterioration of wear resistance with excessive Ce addition.
In conclusion, 0.8 wt.% Ce was identified as the optimal addition level, offering the best balance of mechanical properties and wear resistance. Higher Ce contents promoted the formation of large, abrasive CeO2 precipitates that increased material removal and reduced wear performance.

Author Contributions

Conceptualization, J.W.W., C.H.P. and J.L.; methodology, J.W.W., C.H.P. and J.L.; validation, S.Y., D.S., K.B., N.P. and J.L.; formal analysis, S.Y., D.S., K.B. and N.P.; investigation, S.Y., D.S., K.B., N.P. and J.L.; resources, J.W.W. and C.H.P.; data curation, S.Y. and D.S.; writing—original draft preparation, S.Y. and D.S.; writing—review and editing, K.B. and J.L.; visualization, S.Y. and D.S.; project administration, J.L.; funding acquisition, C.H.P. and J.L. All authors have read and agreed to the published version of the manuscript.

Funding

This work was supported by the Fundamental Research Program of Korea Institute of Materials Science, Republic of Korea (grant number PNKA500). J. Lee also acknowledges the support from the Technology Innovation Program (Material component technology development (R&D)) (RS-2024-00432250) funded by the Ministry of Trade, Industry & Energy (MOTIE, Korea), KEIT (Korea Planning & Evaluation institute of industrial technology).

Data Availability Statement

The original contributions presented in the study are included in the article. Further inquiries can be directed to the corresponding author.

Conflicts of Interest

The authors declare no conflicts of interest.

References

  1. Geetha, M.; Singh, A.K.; Asokamani, R.; Gogia, A.K. Ti based biomaterials, the ultimate choice for orthopaedic implants—A review. Prog. Mater. Sci. 2009, 54, 397–425. [Google Scholar] [CrossRef]
  2. Niemeyer, T.C.; Grandini, C.R.; Pinto, L.M.C.; Angelo, A.C.D.; Schneider, S.G. Corrosion behavior of Ti-13Nb–13Zr alloy used as a biomaterial. J. Alloys Compd. 2009, 476, 172–175. [Google Scholar] [CrossRef]
  3. Zhou, Y.L.; Niinomi, M.; Akahori, T.; Fukui, H.; Toda, H. Corrosion resistance and biocompatibility of Ti-Ta alloys for biomedical applications. Mater. Sci. Eng. A 2005, 398, 28–36. [Google Scholar] [CrossRef]
  4. Budinski, K.G. Tribological properties of titanium alloys. Wear 1991, 151, 203–217. [Google Scholar] [CrossRef]
  5. Dong, H.; Bell, T. Enhanced wear resistance of titanium surfaces by a new thermal oxidation treatment. Wear 2000, 238, 131–137. [Google Scholar] [CrossRef]
  6. Alam, M.O.; Haseeb, A. Response of Ti-6Al–4V and Ti-24Al–11Nb alloys to dry sliding wear against hardened steel. Tribol. Int. 2002, 35, 357–362. [Google Scholar] [CrossRef]
  7. Wasz, M.L.; Brotzen, F.R.; McLellan, R.B.; Griffin, A.J. Effect of oxygen and hydrogen on mechanical properties of commercial purity titanium. Int. Mater. Rev. 1996, 41, 1–12. [Google Scholar] [CrossRef]
  8. Lim, J.Y.; McMahon, C.J.; Pope, D.P.; Williams, J.C. The effect of oxygen on the structure and mechanical behavior of Aged Ti-8 Wt pct Al. Metall. Trans. A 1976, 7, 139–144. [Google Scholar] [CrossRef]
  9. Peng, H.; Liu, W.; Hou, H.; Liu, F. Pinning effect of coherent particles on moving planar grain boundary: Theoretical models and molecular dynamics simulations. Materialia 2019, 5, 100225. [Google Scholar] [CrossRef]
  10. Vega, M.; Medina, S.; Quispe, A.; Gómez, M.; Gómez, P. Recrystallisation driving forces against pinning forces in hot rolling of Ti-microalloyed steels. Mater. Sci. Eng. A 2006, 423, 253–261. [Google Scholar] [CrossRef]
  11. Yang, Y.F.; Luo, S.; Schaffer, G.; Qian, M. Impurity scavenging, microstructural refinement and mechanical properties of powder metallurgy titanium and titanium alloys by a small addition of cerium silicide. Mater. Sci. Eng. A 2013, 573, 166–174. [Google Scholar] [CrossRef]
  12. Li, K.; Liu, Y.; Liu, X.; Wu, X.; Zhou, S.; Zhang, L.; Li, W.; Zhang, W. Simultaneous strength-ductility enhancement in as-cast Ti6Al4V alloy by trace Ce. Mater. Des. 2022, 215, 110491. [Google Scholar] [CrossRef]
  13. Weng, W.; Biesiekierski, A.; Lin, J.; Li, Y.; Wen, C. Impact of rare earth elements on nanohardness and nanowear properties of beta-type Ti-24Nb-38Zr-2Mo alloy for medical applications. Materialia 2020, 12, 100772. [Google Scholar] [CrossRef]
  14. Tian, Y.; Xue, R.; Xie, B.; Wang, K.; Xiao, G.; Yuan, Z.; Xu, X.; Zhang, L.; Liu, L. Influence of scandium and yttrium on mechanical properties, corrosion behavior, and martensitic transformation of near-β titanium alloys. J. Rare Earths, 2025; in press. [Google Scholar] [CrossRef]
  15. Won, J.W.; Oh, J.M.; Kim, W.C.; Park, C.H.; Park, I.; Hyun, Y.-T. Simultaneous high tensile strength and high ductility in cast Ce-alloyed Ti. Mater. Sci. Eng. A 2024, 918, 147487. [Google Scholar] [CrossRef]
  16. Choi, Y.S.; Oh, J.M.; Park, C.H.; Lee, W.J.; Park, Y.H.; Won, J.W. Development of Highly Machinable Ti Alloy with Exceptional Tensile Properties by Er Alloying Element Addition. Korean J. Met. Mater. 2024, 62, 171–179. [Google Scholar] [CrossRef]
  17. Kim, N.Y.; Lee, W.; Park, C.H. Effect of Ce Addition on the Machinability of Ti-6Al-4V Alloy. Korean J. Met. Mater. 2025, 63, 75–84. [Google Scholar] [CrossRef]
  18. Handbook, A. Alloy phase diagrams. ASM Int. 1992, 3, 2. [Google Scholar]
  19. Lütjering, G.; Williams, J.; Gysler, A. Microstructure and mechanical properties of titanium alloys. In Microstructure and Properties of Materials; Technical University Hamburg-Harburg: Hamburg, Germany, 2000; Volume 2, pp. 1–77. [Google Scholar]
  20. Welsch, G.; Boyer, R.; Collings, E.W. Materials Properties Handbook: Titanium Alloys; ASM international: Materials Park, OH, USA, 1993. [Google Scholar]
  21. Xu, Y.; Gao, L.; Hou, Q.; Wu, P.; Zhou, Y.; Ding, Z. Enhanced oxygen storage capacity of porous CeO2 by rare earth doping. Molecules 2023, 28, 6005. [Google Scholar] [CrossRef]
  22. Xu, Y.; Liu, Z.; Zhu, X.; Jiang, Z.; Chen, H.; Wang, N. Effect of rare earth Ce addition on microstructure and mechanical properties of titanium alloy Ti-6Al-4V. Mater. Lett. 2023, 330, 133244. [Google Scholar] [CrossRef]
  23. Ismail, M.; Talib, I.; Rana, A.M.; Akbar, T.; Jabeen, S.; Lee, J.; Kim, S. Effect of bilayer CeO2−x/ZnO and ZnO/CeO2−x heterostructures and electroforming polarity on switching properties of non-volatile memory. Nanoscale Res. Lett. 2018, 13, 318. [Google Scholar] [CrossRef]
  24. Wang, H.; Bao, Y.; Duan, C.; Lu, L.; Liu, Y.; Zhang, Q. Effect of rare earth Ce on deep stamping properties of high-strength interstitial-free steel containing phosphorus. Materials 2020, 13, 1473. [Google Scholar] [CrossRef]
  25. Asanuma, H.; Polcik, P.; Kolozsvari, S.; Klimashin, F.; Riedl, H.; Mayrhofer, P. Cerium doping of Ti-Al-N coatings for excellent thermal stability and oxidation resistance. Surf. Coat. Technol. 2017, 326, 165–172. [Google Scholar] [CrossRef]
  26. Yang, Y.F.; Luo, S.; Qian, M. The effect of lanthanum boride on the sintering, sintered microstructure and mechanical properties of titanium and titanium alloys. Mater. Sci. Eng. A 2014, 618, 447–455. [Google Scholar] [CrossRef]
  27. Xiao, W.; Wu, S.Q.; Ping, D.H.; Murakami, H.; Yamabe-Mitarai, Y. Effects of Sc addition on the microstructure and tensile properties of Ti-6.6 Al–5.5 Sn–1.8 Zr alloy. Mater. Chem. Phys. 2012, 136, 1015–1021. [Google Scholar] [CrossRef]
  28. Archard, J. Contact and rubbing of flat surfaces. J. Appl. Phys. 1953, 24, 981–988. [Google Scholar] [CrossRef]
  29. Hu, J.; Song, H.; Sandfeld, S.; Liu, X.; Wei, Y. Breakdown of Archard law due to transition of wear mechanism from plasticity to fracture. Tribol. Int. 2022, 173, 107660. [Google Scholar] [CrossRef]
  30. Wang, N.; Choi, Y.; Matsugi, K. Effect of C content on the microstructure and properties of in-situ synthesized TiC particles reinforced Ti composites. Sci. Rep. 2023, 13, 22206. [Google Scholar] [CrossRef] [PubMed]
  31. Yildirim, M.; Özyürek, D.; Gürü, M. The effects of precipitate size on the hardness and wear behaviors of aged 7075 aluminum alloys produced by powder metallurgy route. Arab. J. Sci. Eng. 2016, 41, 4273–4281. [Google Scholar] [CrossRef]
  32. Singhal, V.; Shelly, D.; Babbar, A.; Lee, S.-Y.; Park, S.-J. Review of Wear and Mechanical Characteristics of Al-Si Alloy Matrix Composites Reinforced with Natural Minerals. Lubricants 2024, 12, 350. [Google Scholar] [CrossRef]
  33. Hesterberg, W.G.; Donahue, R.J.; Cleary, T.M. Evaporable Foam Casting System Utilizing a Hypereutectic Aluminum-Silicon Alloy. U.S. Patent No. 4,966,220, 30 October 1990. [Google Scholar]
  34. Xu, Y.; Jiang, J.; Yang, Z.; Zhao, Q.; Chen, Y.; Zhao, Y. The effect of copper content on the mechanical and tribological properties of hypo-, hyper-and eutectoid Ti-Cu alloys. Materials 2020, 13, 3411. [Google Scholar] [CrossRef] [PubMed]
  35. Miller, P.; Holladay, J. Friction and wear properties of titanium. Wear 1958, 2, 133–140. [Google Scholar] [CrossRef]
  36. Rigney, D. Transfer, mixing and associated chemical and mechanical processes during the sliding of ductile materials. Wear 2000, 245, 1–9. [Google Scholar] [CrossRef]
  37. Fillot, N.; Iordanoff, I.; Berthier, Y. Wear modeling and the third body concept. Wear 2007, 262, 949–957. [Google Scholar] [CrossRef]
  38. Gahr, K.-H. Microstructure and Wear of Materials; P.O. Box 211, 1000 AE; Elsevier Science Publishers: Amsterdam, The Netherlands, 1987. [Google Scholar]
  39. Xiong, Z.; Timokhina, I.; Pereloma, E. Clustering, nano-scale precipitation and strengthening of steels. Prog. Mater. Sci. 2021, 118, 100764. [Google Scholar] [CrossRef]
  40. Torgerson, T.; Mantri, S.; Banerjee, R.; Scharf, T. Room and elevated temperature sliding wear behavior and mechanisms of additively manufactured novel precipitation strengthened metallic composites. Wear 2019, 426, 942–951. [Google Scholar] [CrossRef]
  41. Stachowiak, G.; Batchelor, A.W. Batchelor, Engineering Tribology; Butterworth-Heinemann: Oxford, UK, 2013. [Google Scholar]
  42. Blau, P.J. Interpretations of the friction and wear break-in behavior of metals in sliding contact. Wear 1981, 71, 29–43. [Google Scholar] [CrossRef]
  43. Long, M.; Rack, H. Friction and surface behavior of selected titanium alloys during reciprocating-sliding motion. Wear 2001, 249, 157–167. [Google Scholar] [CrossRef]
Figure 1. (a) Ball-on-disk method tribometer and (b) image of wear test setup.
Metals 15 01094 g001
Figure 2. The binary phase diagram of Ti-Ce.
Metals 15 01094 g002
Figure 3. SEM images of etched (i) CP-Ti, (ii) Ti-0.8Ce, (iii) Ti-1.4Ce and (iv) Ti-2.0Ce.
Metals 15 01094 g003
Figure 4. (a) XRD patterns of Ti-Ce alloys in (i) broad range and (ii) range for CeO2. (b) EDS mapping of Ce and O for CeO2 precipitates in Ti alloy. (c) Size distribution of CeO2 precipitates from SEM image in Figure 2 for (i) Ti-0.8Ce, (ii) Ti-1.4Ce and (iii) Ti-2.0Ce.
Metals 15 01094 g004
Figure 5. Vickers hardness of CP-Ti and Ti-Ce alloys.
Metals 15 01094 g005
Figure 6. Wear rates of CP-Ti and Ti-Ce alloys under loads of (a) 1 N and (b) 5 N.
Metals 15 01094 g006
Figure 7. SEM images of wear tracks under loads of (a) 1 N and (b) 5 N; (i) CP-Ti, (ii) Ti-0.8Ce, (iii) Ti-1.4Ce, and (iv) Ti-2.0Ce. EDS maps of Ti, Ce, and O distributions in wear debris of (c) Ti-1.4Ce and (d) Ti-2.0Ce.
Metals 15 01094 g007
Figure 8. Wear track depth of sample under (a) 1 N and (b) 5 N. Surface profile images for wear track under (c) 1 N and (d) 5 N load on (i) CP-Ti, (ii) Ti-0.8Ce, (iii) Ti-1.4Ce, and (iv) Ti-2.0Ce.
Metals 15 01094 g008
Figure 9. Friction coefficient curves of CP-Ti and Ti-Ce alloys under (a) 1 N and (b) 5 N loads. (c) averaged friction coefficient in the steady-state stage.
Metals 15 01094 g009
Table 1. Chemical compositions of CP-Ti and Ti-Ce alloys.
SamplesChemical Composition (wt.%)True Density (g/cm3)
TiNCOCe
CP–Ti Grade 1Bal.0.020.010.09-4.501
Ti-0.8CeBal.0.020.010.090.794.519
Ti-1.4CeBal.0.020.010.091.374.528
Ti-2.0CeBal.0.020.010.102.024.537
Table 2. Test conditions of ball-on-disk method.
Testing ConditionsValue
Sliding distance300 m
Linear speed 0.1 m/s
Wear radius5 mm
Wear load1 N, 5 N
Counterpart material AISI 52100 steel ball (diameter = 5.556 mm)
Testing temperature25 °C ± 2 °C
Table 3. Quantitative characterization of CeO2 precipitates in Ti-Ce alloys: size distribution parameters and area fraction.
SamplesMax. (μm)Min. (μm)Avg. (μm)Area (%)
Ti-0.8Ce0.890.280.40 ± 0.100.44
Ti-1.4Ce1.990.280.45 ± 0.161.37
Ti-2.0Ce6.530.220.57 ± 0.432.42
Disclaimer/Publisher’s Note: The statements, opinions and data contained in all publications are solely those of the individual author(s) and contributor(s) and not of MDPI and/or the editor(s). MDPI and/or the editor(s) disclaim responsibility for any injury to people or property resulting from any ideas, methods, instructions or products referred to in the content.