Abstract
The corrosion of welded joints creates widespread issues for the ocean engineering, petrochemical, and nuclear power industries. Geometric discontinuity of the weld reinforcement height plays an important role in weld corrosion, but the mechanism is still unclear. The corrosion behavior of flat and convex SA106B welded joints is investigated at different flow velocities by experiments and simulation. The damage components of the material and geometric discontinuity are quantified. Electrochemical measurements, morphology observations, and flow field simulations are conducted. The results show that the corrosion of the welded joints is influenced by mass transfer and galvanic corrosion. The corrosion of the welded joints is aggravated by geometric discontinuity and increased flow velocity. The damage component introduced by the material of the welded joint decreases with increasing flow velocity, and the maximum value is 91.56% at 0.5 m/s. The damage component introduced by the geometry of the weld reinforcement height increases with increasing flow velocity, reaching up to 45.77% at 6.9 m/s. The corrosion mechanism is also discussed.
1. Introduction
Welds have been widely used in pipelines with the development of the petroleum, ocean engineering, and nuclear power industries. However, weld corrosion remains a key issue that affects the service reliability of components [1,2,3,4,5,6]. The welding processes and differences in material compositions lead to uneven microstructures and compositions in the base metal (BM), heat-affected zone (HAZ), and weld zone (WZ) [1,7,8,9,10,11]. The weld reinforcement height leads to geometric discontinuity of the welded joint. It should be noted that the local turbulence introduced by the weld reinforcement height could further influence the corrosion behavior of the welded joint [12,13]. The combined effects of material inhomogeneity and flow field discontinuity contribute to the complex corrosion of the welded joints.
Most of the research mainly focused on corrosion caused by the heterogeneous material of welded joints. It was generally found that corrosion was caused by electrochemical differences from the material heterogeneity in the BM, HAZ, and WZ [14,15,16]. Moreover, the flow velocity and flow state also had effects on corrosion in a flowing solution [17]. A fluid will experience local disturbance due to the weld reinforcement height. The corrosion behavior of the welded joint with the weld reinforcement height is influenced by the local disturbance introduced by the geometric discontinuity and the galvanic corrosion caused by material non-uniformity. The flow velocity, wall shear stress, and flow state near the weld seam will fluctuate due to the influence of the weld reinforcement height. Previous simulation results showed that the local disturbance introduced by the weld reinforcement height caused a higher flow velocity in the upstream and top regions and a lower flow velocity in the downstream region [18]. The turbulent kinetic energy, wall shear stress, and flow velocity increased with an increase in weld residual height, accelerating the corrosion of WM [3]. However, limited research has focused on evaluating the impact of weld reinforcement height on local corrosion. Additionally, the damage components caused by the geometric discontinuity of SA106B welded joints have not been quantified.
The corrosion behavior of welded joints is influenced by flow velocity in a flowing solution [19,20]. Previous studies have reported the effect of flow velocity on the corrosion behavior of welded joints [3,17,20]. The corrosion resistance of welded joints decreased with increased flow velocity. The turbulent kinetic energy, wall shear stress, and flow velocity increased with increased flow velocity. At high flow velocities, wall shear stress could be large enough to damage the integrity of the corrosion product layer, leading to severe corrosion of X80 pipeline steel welded joints [15]. Moreover, the polarity of the BM, WM, and HAZ regions was reversed under high flow velocity [15]. The erosion–corrosion rate increased with increased flow velocity and particle impact velocity in a liquid–solid two-phase solution [20]. However, there are relatively few relevant studies on the influence of geometric discontinuities on the corrosion behavior of welded joints. The research on the corrosion behavior of SA106B welded joints is very limited when considering the combined effect of composition, microstructure, and fluid disturbances introduced by geometric discontinuities. The contribution of local disturbance introduced by the geometric discontinuity of SA106B welded joints has not been quantified under different flow velocities. It is important to clarify the corrosion mechanism of welded joints to inhibit their corrosion at different flow velocities.
In this paper, the corrosion behavior of SA106B welded joints was studied experimentally and numerically. A rotating disk with and without a simulated “weld reinforcement height” was constructed to simulate the geometry of the convex welded joint and flat welded joint. Different from previous studies, the material-induced corrosion component and the geometric discontinuity-induced corrosion component were decoupled and quantified at different flow velocities. The electrochemical tests of flat and convex welded joints were carried out in situ at different flow velocities. The effects of local disturbance introduced by geometric discontinuity on the corrosion behavior of SA106B welded joints were analyzed in combination with computational fluid dynamics (CFD) technology and morphology observation. The material component and geometric discontinuity component of the weld reinforcement height of the welded joints were quantified by electrochemical impedance spectroscopy (EIS) tests. This paper analyzes the corrosion mechanism of the SA106B welded joint, providing a theoretical basis for the study of the corrosion behavior of SA106B welded joints.
2. Materials and Methods
2.1. Materials
The materials for this experiment were purchased from China Nuclear Power Operation Management Co., Ltd. (Haiyan, China). The BM was a SA106B pipe with a thickness of 5mm and a Y-shaped welding groove. The 2 mm diameter ER70S-6 welding wire was deposited onto a SA106B carbon steel substrate at 11.8 V–12.4 V, 95 A–105 A, with a welding speed of 50 mm/min–65 mm/min. The compositions of the SA106B carbon steel and ER70S-6 welding wire are given in Table 1. The hardness of the welded joint was analyzed by an HVS-1000M Vickers hardness tester (Shanghai yanrun optical machine technology Co., Ltd., Shanghai, China) at room temperature. The hardness of the WZ, BM, and HAZ is 167.9 ± 4.0 HV, 154.9 ± 3.9 HV, and 167.7 ± 4.2 HV, respectively.

Table 1.
Composition of materials of the welded joint (wt.%).
The metallographic microstructures of the welded joint were observed by optical metallographic microscopy (Carl Zeiss Axio Observer, Z1m, Oberkochen, Germany). Before the observation, the samples were polished with 2.0 abrasive paste and then etched by a 4% Nital solution. The abrasive paste and Nital agents were supplied by Zhengzhou Abrasive Grinding Research Institute Co., Ltd. (Zhengzhou, China) and Sinopharm Chemical Reagent Co., Ltd. (Shanghai, China).
The samples taken from the welded joint were cylinders with a diameter of 2 mm. The back of the samples was welded with copper wire and sealed with epoxy resin. To ensure the repeatability of the experiment, microstructure observations of the samples were conducted before the experiment to be consistent with the WZ, BM, and HAZ. The mold and all sample dimensions were also measured and verified. Before the experiment, the exposed surfaces of the samples were polished with # 800 sandpaper.
2.2. Rotating Disk Electrode Corrosion Tests and Electrochemical Measurements
The rotating disk test system was utilized to study the corrosion behavior of the weld joint. The rotating disks with or without simulated weld reinforcement heights are shown in Figure 1 and Figure 2, respectively. To further ensure the reproducibility of the test results, three groups of parallel samples were used in the experiments. The flat rotating disk was used to simulate the corrosion of flat welds (Figure 1a). The corrosion of the flat weld was influenced by the materials of the welded joint. The rotating disk with the simulated weld reinforcement height was used to simulate the corrosion of the convex weld (Figure 2a). The samples of the BM, HAZ, and WZ were placed at the same radius of the disk with the same linear velocity (Figure 1b and Figure 2b). Each surface of the sample remained on the plane of the disk where the sample was. Five samples were coupled during the corrosion tests to simulate the actual welded joints. In addition, the width-to-height ratio of the weld reinforcement height was 16:5. The experiments were carried out in 0.5 M NaCl solution at 0.5 m/s, 1.2 m/s, 3.2 m/s, and 6.9 m/s.
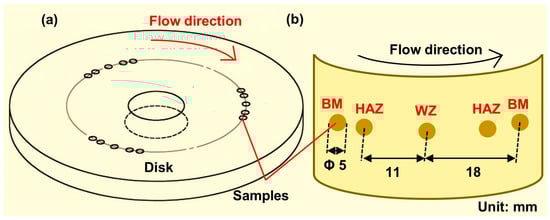
Figure 1.
(a) The rotating disk with the flat surface for simulating the flat weld, and (b) the samples’ positions on the disk.
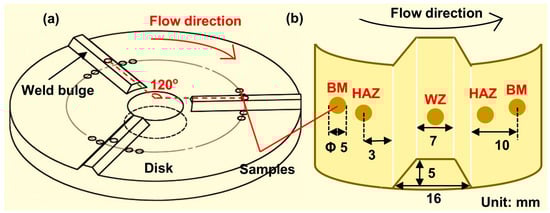
Figure 2.
(a) The rotating disk with weld reinforcement height for simulating the convex weld, and (b) the samples’ positions on the disk.
Electrochemical tests were performed with a Gamry Interface 1010E (Gamry Instruments, Inc., Warminster, PA, USA) workstation in the three-electrode system. Open-circuit potential (OCP) tests were conducted on the samples. The OCP remained in a relatively stable state after a 6 h experiment, and the electrochemical test was conducted. A diagram of the samples used in the electrochemical tests is shown in Figure 3. For the EIS tests, the working electrode was composed of five coupled samples (Figure 3b,c). The counter electrode was a graphite rod, and the reference electrode was a saturated calomel electrode with a salt bridge. Due to the limitations of dynamic experimental conditions, the EIS tests were performed from 100,000 Hz to 0.1 Hz, with a points/decade of 10 and a 10 mV sinusoidal alternating amplitude. Although the lowest frequency domain was adopted at 0.1 Hz, due to limitations of the equipment and accuracy of the experimental data obtained, no deleterious effect was attained in order to evaluate the phenomena that occurred at the surface of the examined samples. Galvanic corrosion tests were carried out to reveal the effect of flow velocity and local disturbance after the 6 h corrosion test. The WZ was the working electrode, and the connected BM and HAZ were the counter electrode at different flow velocities. Electrochemical measurements were repeated at least three times to ensure the representativeness of the data.
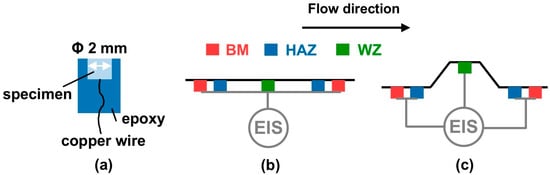
Figure 3.
The diagram of the (a) electrochemical sample and EIS tests for simulating the (b) flat weld and (c) convex weld.
2.3. Characterization of the Corroded Surface
After the 6 h experiment, the corrosion morphology was observed by scanning electron microscopy (SEM) with energy dispersive spectroscopy (EDS). The EDS test was conducted with secondary backscattered electrons, a potential acceleration of 20 keV, a pressure of 8 × 10⁻⁵ Pa, and a dwell time of 20 s. Before SEM (Quattro S, FEI, Hillsboro, OR, USA), the samples were cleaned with deionized water and ethanol. The surface profile of each sample was analyzed with a white light interferometer (MicroXAM-3D, KLA, Milpitas, CA, USA) after the corrosion products were removed by an acid washing solution (500 mL hydrochloric acid, 3.5 g hexamethylenetetramine, and 500 mL deionized water) [21]. The effect of flow velocity and local disturbance was analyzed based on the corrosion morphology after removing the corrosion products.
2.4. Computational Fluid Dynamics Simulation
In addition to the experiments, a simulation was also conducted to obtain the local flow characteristics around the flat and convex welds with different flow velocities using ANSYS Fluent 14.5. A flow channel of 1800 mm × 100 mm × 40 mm was established. The inlet/outlet length was more than 10 times the hydraulic diameter to avoid the inlet/outlet effect. The middle area of the flow channel was the position of the simulated welds. The simulated flow field was consistent with the experimental flow field, both flowing horizontally through the concerned area. The simulated weld reinforcement height was consistent with the rotating disk used in the experiment (Figure 2). The inlet flow velocities were 0.5 m/s, 1.2 m/s, 3.2 m/s, and 6.9 m/s, which were consistent with those in the rotating disk experiment. The outlet was set as the pressure outlet. The fluid was assumed to be incompressible and had no slip between the walls. The standard k-epsilon turbulence model and the standard wall function were used to solve the dynamics simulation. The SIMPLEC algorithm, with better convergence and stability, was chosen to solve the momentum equation. Continuous flow is described by the continuity equation below:
where , and are the volume fraction, density, and velocity of the i phase, respectively.
The momentum equation is shown below:
where and are the molecular viscosity and disturbance viscosity for the i phase, respectively, is the momentum source terms for the i phase, is the gravitational acceleration vector, and is the interphase drag force for the i phase.
3. Results
3.1. Metallographic Structure
Figure 4 shows the microstructure of the SA106B welded joint. The WZ is composed of a ferrite matrix and secondary pearlite [22] (Figure 4b). The microstructures of the BM and HAZ are both composed of ferrite and pearlite phases, but the ferrite phases are different from each other (Figure 4c,d). Acicular ferrites only exist in the HAZ, which was also observed in reference [23]. The proportion of ferrite in the WZ, BM, and HAZ is 77.75%, 68.56%, and 44.33%, respectively.
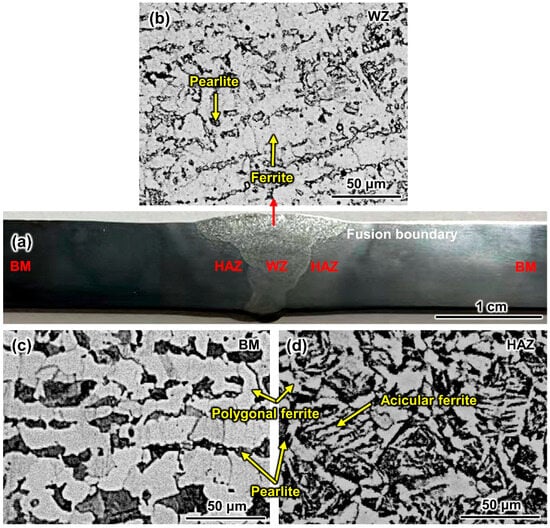
Figure 4.
Optical micrograph image of the welded joint: (a) overall profile; local magnified images of (b) the WZ, (c) the BM, and (d) the HAZ.
3.2. Electrochemical Impedance Spectrum Analysis
Figure 5 presents the Nyquist and Bode plots of the five connected samples in flat and convex welds at different flow velocities. The Nyquist plots show that the capacitive semicircles of flat and convex welds decrease with increased flow velocity (Figure 5a). The results indicate that the corrosion of the SA106B welded joint is accelerated by increased flow velocity, which is also reflected in the Bode plots (Figure 5b,c). The maximum phase angle in the Bode plots is less than 60 degrees, which indicates that non-protective surface corrosion products have formed on the sample surfaces.
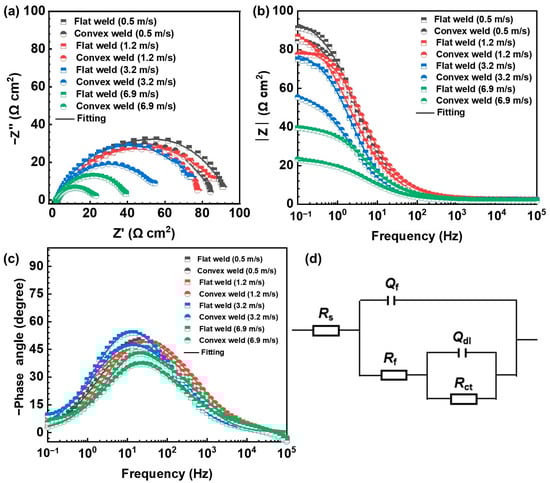
Figure 5.
(a) Nyquist plots and (b,c) Bode plots of flat and convex welds after the 6 h corrosion test. (d) Equivalent circuits used for EIS fitting curves.
The EIS fitting was performed using Gamry Echem Analyst 7.8.4 software with the built-in complex nonlinear least squares algorithm. The equivalent circuit with two time constants was used to fit the EIS curve (Figure 5d). The fitting results are summarized in Table 2. Rs is the solution resistance, Rct is the charge transfer resistance, Qdl is the double layer capacitance, and Rf and Qf are the resistance and capacitance of the corrosion products, respectively. The Chi-square (χ2) value indicates the quality of the fitting results. The results show that the quality of most of the fitting results is good [24]. Due to the heterogeneity in the metal surface caused by the coating of corrosion products, the capacitance was replaced by a constant phase element (CPE) [24]. The impedance expression of the CPE component is ZCPE = [C(jω)n]−1, where the range of the n value is −1~1. When n = −1, it indicates pure inductive reactance, and when n = 1, it indicates pure capacitance. To observe the impact of flow velocity on the corrosion behavior of the welded joints clearly, the Rf + Rct values in Table 2 are plotted in Figure 6.
Table 2.
Electrochemical parameters fitted from the EIS spectra with equivalent circuits.
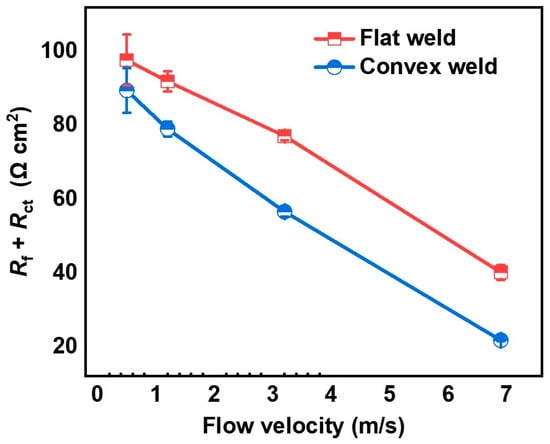
Figure 6.
Rct value of flat and convex welds after the 6 h corrosion test.
The Rf + Rct value of the flat weld decreases with increased flow velocity (Table 2 and Figure 6). The Rf + Rct value of the flat weld is maximum at 0.5 m/s (97.69 Ω cm2) and minimum at 6.9 m/s (40.14 Ω cm2), with a difference of 57.55 Ω cm2. For the convex weld with different flow velocity, the variation trend of the Rf + Rct value is the same as that of the flat weld. The difference between the maximum value (89.45 Ω cm2 at 0.5 m/s) and the minimum value (21.77 Ω cm2 at 6.9 m/s) is 67.68 Ω cm2. The above results show that increased flow velocities lead to severe corrosion of SA106B welded joints, similar to the results of the Nyquist plots.
The Nyquist plots corresponding to the samples tested at 6.9 m/s reveal a slight strength line at 45 degrees, which suggests a porous electrode behavior [25]. This does not correspond to a Warburg element, as evidenced by the EIS parameters shown in Table 2, which control this behavior. Also, this is confirmed by the microstructural morphologies (roughness) obtained, as subsequently evaluated. Based on this, it can be deduced that electrochemical behavior is controlled by both planar and porous electrode behavior [25].
The capacitive semicircle and Rf + Rct value of the convex weld are smaller than those of the flat weld at the same flow velocity (Table 2). It indicates that the local disturbance introduced by the weld reinforcement height enhances the corrosion of the welded joint.
The contribution of local disturbance introduced by geometric discontinuity to the corrosion of the welded joints was evaluated quantitatively. The damage components introduced by the material factor (PM) and geometric discontinuity of the weld reinforcement height (PG) under flow conditions were calculated by the following formula [26].
where and represent the Rf + Rct values of the flat weld and the convex weld, respectively. The calculated results are presented in Figure 7. The damage components caused by local disturbance introduced by the geometry of the weld reinforcement height are 8.44%, 14.05%, 26.62%, and 45.77% at 0.5 m/s, 1.2 m/s, 3.2 m/s, and 6.9 m/s, respectively. The contribution of geometric discontinuity to the corrosion of welded joints increases with increased flow velocity. Therefore, the influence of the geometric discontinuity of the welded joints could not be ignored in the high-velocity fluid.
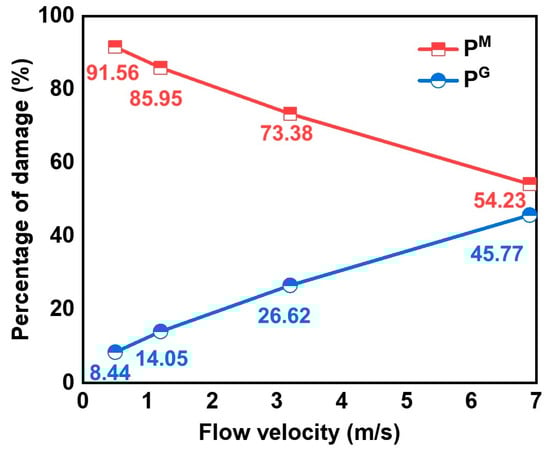
Figure 7.
The percentage of damage caused by the material inhomogeneity in the flat weld and the geometry of the convex weld at different flow velocities.
3.3. Surface Characterization Analysis
3.3.1. Corrosion Morphologies Before Removing Corrosion Products
The morphologies of the samples were characterized after experiments at minimum (0.5 m/s) and maximum (6.9 m/s) flow velocities to determine the influence of local disturbance on the welded joints. The materials at different positions of the flat weld were in the same flow environment. The different corrosion morphologies only depended on the materials. Therefore, only one BM, HAZ, and WZ sample of the flat weld was selected for morphological observation.
Figure 8 shows the corrosion morphology of the flat and convex welds at 0.5 m/s. The corrosion products develop along the flow direction, indicating that corrosion behavior is related to the flow field [27]. The BM and HAZ surfaces of the flat weld have a small amount of corrosion products (Figure 8(a1,b1)), indicating slight corrosion. Although the corrosion products on the WZ are partially spalling off, the area without corrosion products is severely damaged (Figure 8(c1)). It can be deduced that the WZ of the flat weld suffered the worst corrosion.
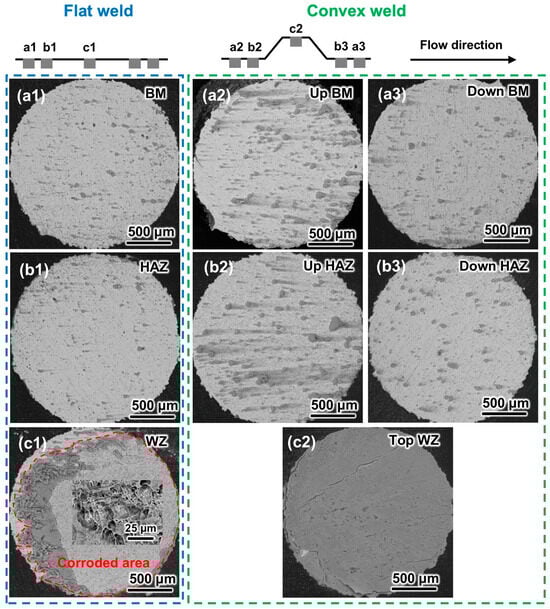
Figure 8.
SEM images of the flat and convex welds after the 6 h corrosion test at 0.5 m/s: (a1–a3) BM, (b1–b3) HAZ, and (c1,c2) WZ.
The corrosion morphology of the convex weld is different from that of the flat weld. There are more corrosion products with longer tails on the upstream BM and HAZ surfaces of the convex weld (Figure 8(a2,b2)) than those on the flat weld (Figure 8(a1,b1)). The morphology of the corrosion products on the downstream BM and HAZ surfaces of the convex weld (Figure 8(a3,b3)) is similar to that of the flat weld (Figure 8(a1,b1)). The coverage area of corrosion products on the WZ surface of the convex weld is larger than that of the flat weld (Figure 8(c1,c2)). The results show that the corrosion of the upstream and top surfaces is intensified by the local disturbance introduced by geometric discontinuity, while the corrosion of the downstream samples is not significantly changed. The presence of weld reinforcement height changes the corrosion morphology of welded joints. However, the most severe corrosion still occurs in the WZ.
Figure 9 displays the corrosion morphology of the flat and convex welds after the 6 h corrosion test at 6.9 m/s. The corrosion products on the surface of each sample are still distributed along the flow direction (Figure 8). Compared with the BM and HAZ (Figure 9(a1–a3,b1–b3)), there are more corrosion products on the WZ for both the flat and convex welds (Figure 9(c1,c2)). The area covered by corrosion products on each sample of the convex weld is larger than that on the flat weld (Figure 8(a1–c2)), indicating more severe corrosion of the convex weld.
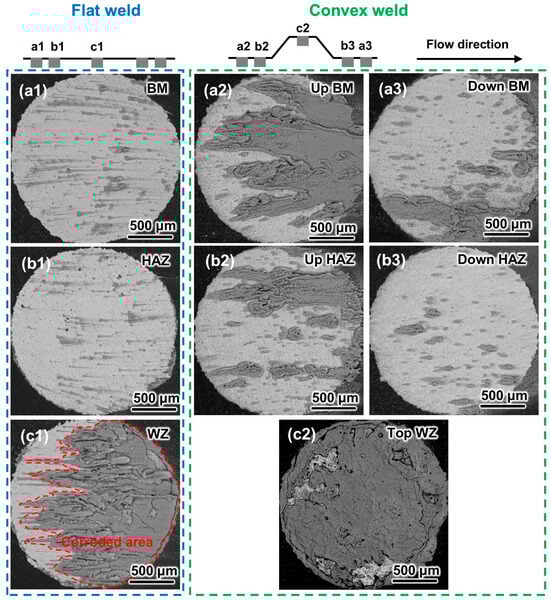
Figure 9.
SEM images of the flat and convex welds after the 6 h corrosion test at 6.9 m/s: (a1–a3) BM, (b1–b3) HAZ, and (c1,c2) WZ.
Compared with the morphology at 0.5 m/s, the corrosion products on the WZ of the flat weld are more distinctly distributed along the flow direction at 6.9 m/s (Figure 8(c1) and Figure 9(c1)). This could be attributed to the morphological characteristics caused by increased flow velocity. It is noteworthy that the characteristic of the most severe corrosion in the WZ is not changed by higher flow velocity (Figure 8(c1,c2) and Figure 9(c1,c2)). There are more corrosion products on the BM and HAZ surfaces at 6.9 m/s than at 0.5 m/s, indicating that the increased flow velocity exacerbates the corrosion of the samples. Additionally, the morphology results also indicate the porous and non-dense characteristics of the corrosion products, which are consistent with the EIS results.
The magnified morphology and the composition of the corrosion products on the flat and convex welds under experimental flow velocities were analyzed. It was found that all the materials of the welded joints had similar oxide components. Therefore, samples from the BM, HAZ, and WZ of the flat weld at 0.5 m/s were selected as the representative morphologies, as shown in Figure 10. The head of the corrosion products on the BM and HAZ surfaces is circular, and the corrosion products distribute along the flow direction (Figure 10a,b). The coverage area of corrosion products on the WZ surface is the largest (Figure 10c). The EDS results indicate that the corrosion products are mainly iron oxides, which are similar to those in other positions. It can be inferred that the types of elements are not changed by the flow state.
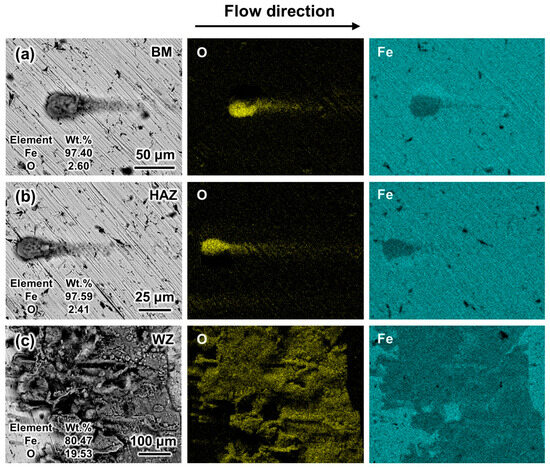
Figure 10.
Local SEM and EDS morphologies of the flat weld after the 6 h corrosion test at 0.5 m/s: (a) BM, (b) HAZ, and (c) WZ.
3.3.2. Corrosion Morphologies After Removing Corrosion Products
Figure 11 shows the corrosion morphology after removing the corrosion products at 0.5 m/s. A low-magnification image could not reveal the damage profile in the BM and HAZ with slight corrosion. Therefore, a high-magnification view was chosen to reflect the corrosion morphology at the central area of the BM and HAZ sample (Figure 11(a1–a3,b1–b3)). In contrast, for the severely damaged WZ, only a low-magnification view can reveal the entire characteristics of the corrosion morphology of the WZ (Figure 11(c1,c2)). Grinding traces and pits with slight corrosion can be observed on the BM and HAZ surfaces of the flat weld (Figure 11(a1,b1)). The depth of the pits in the BM (10.43 μm) is deeper than that in the HAZ (6.00 μm), which indicates more severe corrosion of the BM. The corrosion depth (14.19 μm) in the WZ is deeper than that in the BM and HAZ (Figure 11(c1)). This characteristic is consistent with the results of the most severe corrosion of the WZ obtained by SEM morphology (Figure 8).
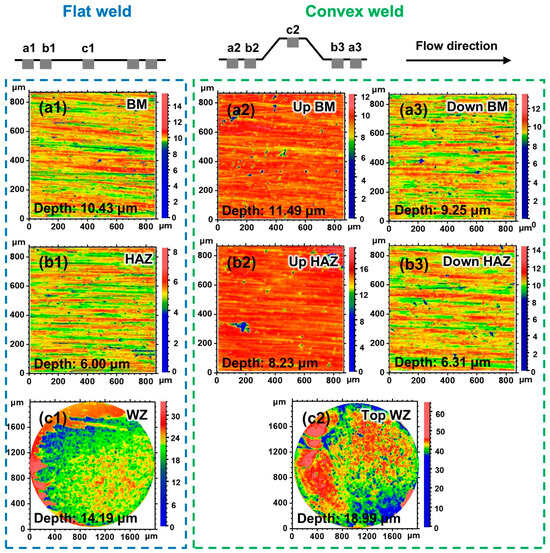
Figure 11.
Two-dimensional projection images of the flat and convex welds after the 6 h corrosion test at 0.5 m/s: (a1–a3) BM, (b1–b3) HAZ, and (c1,c2) WZ.
Compared with the flat weld, pits are larger and deeper in the upstream BM and HAZ of the convex weld at 0.5 m/s (Figure 11(a2,b2)). However, the corrosion of the downstream BM and HAZ of the convex weld is not significantly different from that of the flat weld (Figure 11(a3,b3)). The WZ surface of the convex weld turned into the corrosion region. The WZ has a larger corrosion area, deeper corrosion depth (18.99 μm), and more severe corrosion than the flat weld (Figure 11(c1,c2)). The corrosion of the upstream samples is more severe than that of the downstream samples of the convex weld due to geometric discontinuity [17,20]. The comparative results from the two-dimensional projection images also indicate that the corrosion behavior in different parts of the convex weld is affected by local disturbance introduced by the weld reinforcement height.
The morphology of the flat weld and the convex weld without corrosion products at 6.9 m/s is displayed in Figure 12. A low-magnification view was used to represent the corrosion morphology of the samples in the convex weld with severe corrosion. The types of corrosion are pit corrosion for the BM and HAZ of the flat weld, and the corrosion develops along the flow direction for the WZ (Figure 12(a1–c1)). The corrosion depths of the BM, HAZ, and WZ are 13.62 μm, 12.59 μm, and 29.03 μm, respectively. The results indicate that the most severe corrosion occurs in the WZ. The corrosion area develops along the flow direction, and the corrosion morphology shows the shape of a “flow trace” on the upstream and downstream surfaces of the convex weld (Figure 12(a2,b2,a3,b3)). Compared with the BM and HAZ, the damage area on the top WZ surface is larger (Figure 12(c1,c2)). The depth of the damaged area was also quantified. It can be observed that the damage of the WZ (Figure 12(c2)) is more severe than that of the BM and HAZ of the convex weld (Figure 12(a2,a3,b2,b3)). At the flow velocity of 6.9 m/s, the corrosion of the BM, HAZ, and WZ of the convex weld is more severe than that of the flat weld. It suggests that local disturbance introduced by geometric discontinuity significantly exacerbates the corrosion of the convex weld at high flow velocities of 6.9 m/s.
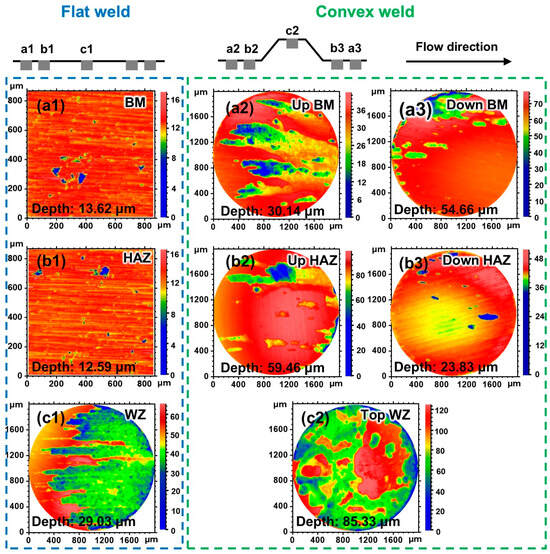
Figure 12.
Two-dimensional projection images of the flat and convex welds after the 6 h corrosion test at 6.9 m/s: (a1–a3) BM, (b1–b3) HAZ, and (c1,c2) WZ.
Compared with the corrosion morphology at 0.5 m/s, the corrosion depth of each sample increases for both the flat and convex welds at 6.9 m/s (Figure 11 and Figure 12). The morphological results combined with the results of the electrochemical tests indicate that an increased flow velocity accelerates the corrosion of both the flat and convex welds (Figure 5).
3.4. Galvanic Behavior
According to the corrosion morphology, it could be observed that the corrosion of the WZ is significantly more severe than that of the BM and HAZ. It can be inferred that galvanic corrosion may exist between the samples. The galvanic corrosion test was conducted to verify this speculation. The WZ was used as the working electrode, and the connected BM and HAZ with slight corrosion were used as the counter electrode in this test.
Figure 13 presents the stabilized galvanic current density of both the flat and convex welds at 0.5 m/s, 1.2 m/s, 3.2 m/s, and 6.9 m/s. The galvanic current densities are positive values for both the flat and convex welds at all flow velocities. Based on the results of galvanic corrosion and the morphology of severe corrosion in the WZ (Figure 8, Figure 9, Figure 10, Figure 11 and Figure 12), it can be determined that the WZ is the anode, while the connected BM and HAZ are the cathode. They are not altered by the geometric discontinuity and flow velocity. This implies that the most severe corrosion of the WZ is not affected by the flow state. Galvanic current densities reached the mA/cm2 level, which was significantly higher than those considered indicative of galvanic corrosion (less than 10 μA/cm2), according to the literature [28]. Therefore, it is confirmed that galvanic corrosion occurs.
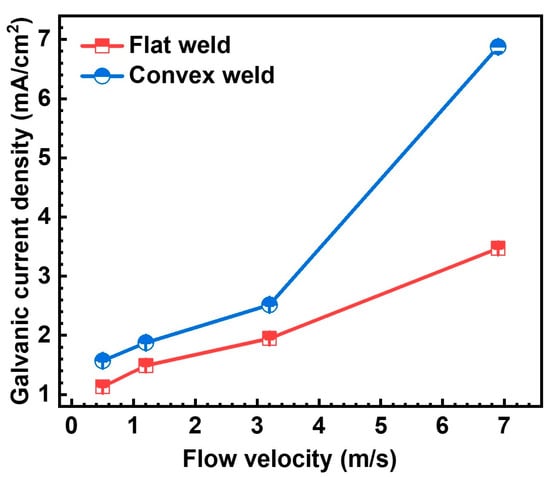
Figure 13.
The galvanic current density of the flat and convex welds after the 6 h corrosion test at different flow velocities.
The galvanic current density for both the flat and convex welds increased progressively at flow velocities of 0.5 m/s, 1.2 m/s, 3.2 m/s, and 6.9 m/s. At the same flow velocity, the galvanic current density of the convex weld is greater than that of the flat weld. The results indicate that increased flow velocity and local disturbance introduced by geometric discontinuity can intensify galvanic corrosion.
3.5. Flow Field Analysis
The flow state around the welded joint is affected by flow velocity and geometric discontinuity [17]. The flow velocity and flow state around the convex weld are disturbed by the weld reinforcement height, intensifying the degree of fluid disturbance. It was simulated to further clarify the corrosion mechanisms. The flow velocity was monitored at a distance of 1 mm from the sample surface, and the wall shear stress on the sample surface was obtained, as shown in Figure 14. The flow velocity of the flat weld is stable, while it fluctuates significantly around the convex weld (Figure 14a). At different flow velocities, the upstream BM and top WZ regions of the convex weld have higher flow velocities than those of the flat weld. The downstream region has lower velocities compared with the flat weld. The flow velocity of the upstream HAZ of the convex weld is smaller than that of the flat weld at 0.5 m/s and 6.9 m/s. The flow velocity of the downstream HAZ of the convex weld is almost the same as that of the flat weld at 1.2 m/s and 3.2 m/s. Previous studies found that high flow velocity could accelerate mass transfer, leading to severe corrosion [29,30], which is consistent with the trend observed in this paper (Figure 11 and Figure 12).
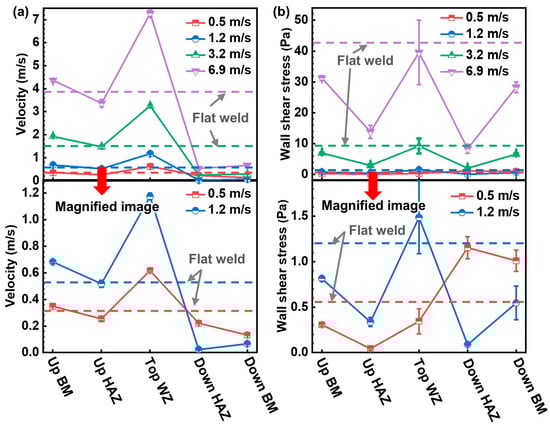
Figure 14.
(a) The flow velocity at 2 mm from the wall and (b) wall shear stress on the wall of the samples at different positions of the welded joint. “Up” represents upstream, and “Down” represents downstream.
The wall shear stress for the flat weld is the same at each position, but it fluctuates around the convex weld (Figure 14b). Both the flat and convex welds experience relatively lower wall shear stress at low flow velocities (0.5 m/s and 1.2 m/s) than at higher flow velocities (3.2 m/s and 6.9 m/s). Compared with the flat weld at 3.2 m/s and 6.9 m/s, there is lower wall shear stress on the upstream and downstream regions of the convex weld. However, the wall shear stress of the top region is similar to that of the flat weld. It is generally considered that a higher flow velocity is related to a higher corrosion rate [31]. A high wall shear stress can destroy corrosion products [32]. The influence of fluids on corrosion behavior still needs to be further analyzed in combination with stream traces.
Figure 15 shows the stream traces around the welded joint. Around the flat weld, the flow state is stable, and the stream trace is the same as the initial flow direction. However, the flow was significantly disturbed due to the convex weld, leading to a swirling vortex downstream. The simulation results further confirmed that the fluid was disturbed under the influence of the weld reinforcement height. Yang et al. [17] found that a swirling vortex increased the concentration of corrosive media and accelerated the diffusion of corrosive media and mass transfer processes near the surface.
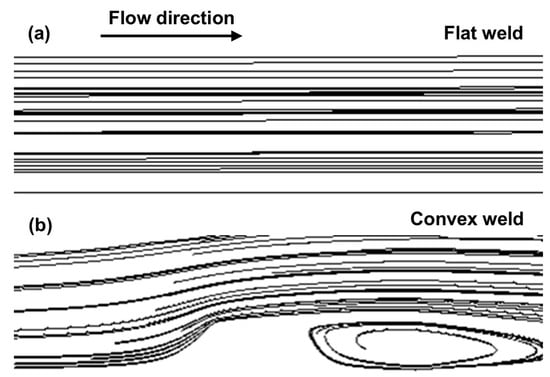
Figure 15.
The stream traces around the (a) flat weld and (b) convex weld.
4. Discussion
Figure 16 displays the corrosion mechanisms of welded joints. The flow state at different regions of the flat weld is similar under the same flow velocity. Therefore, the difference in corrosion behavior is mainly caused by the material properties. Both the BM and HAZ contain 0.36 wt.% Cr, while the WZ contains no Cr (Table 1). The literature suggests that Cr could enhance the corrosion resistance of materials [33]. The composition factors contributed to a higher corrosion sensitivity of the WZ. Moreover, pearlite structures are composed of both ferrite and cementite. Studies indicated that ferrite dissolves more preferentially than cementite [34,35]. The ferrite content in the BM was 24.23% higher than that in the HAZ (Figure 4). Therefore, the BM suffered more severe corrosion than the HAZ. Additionally, the galvanic effects between the samples exacerbated the corrosion of the WZ (Figure 13). Therefore, material properties and galvanic effects lead to different corrosion sensitivity of the flat weld, which can be ranked in positive order of WZ > BM > HAZ (Figure 11 and Figure 13).
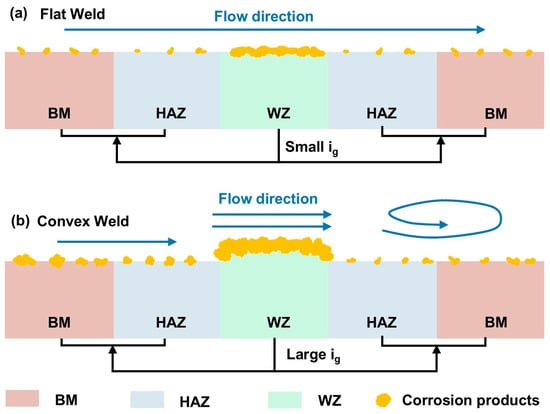
Figure 16.
Corrosion mechanism diagram of (a) the flat weld and (b) the convex weld.
Different from the flat weld, geometric discontinuity should be considered for the convex weld. The high flow velocity on the top surface of the convex weld resulted in a faster flow velocity and mass transfer (Figure 14a). The low wall shear stress weakened the removal effect of corrosion products on the upstream BM and HAZ surfaces [29,32]. These conditions promoted further development of corrosion at the top WZ and upstream BM and HAZ regions. Additionally, the accelerated mass transfer due to the vortex also exacerbated corrosion (Figure 15). The corrosion at the downstream BM and HAZ regions of the convex weld was more severe than that of the flat weld. Moreover, the higher flow velocity of the upstream region caused severe corrosion than that of the downstream region for the convex weld at 6.9 m/s. Furthermore, flow-induced galvanic corrosion also aggravated the corrosion of the WZ (Figure 13). The local disturbance introduced by the convex weld at 6.9 m/s caused the upstream and top specimens to experience more severe corrosion than the downstream specimens.
For the convex weld at 0.5 m/s, 1.2 m/s, and 3.2 m/s, the higher flow velocity and faster mass transfer in the WZ area caused more severe galvanic corrosion between the WZ and the connected BM and HAZ (Figure 13). Flow-induced mass transfer and galvanic effects promoted the corrosion of the WZ, ultimately leading to more severe corrosion of the convex weld than the flat weld at the same flow velocity (Figure 5 and Figure 13).
The corrosion of the flat weld was different from that of the convex weld at 0.5 m/s, 1.2 m/s, 3.2 m/s, and 6.9 m/s (Figure 5 and Figure 13). The mass transfer increased with the increasing setting flow velocity at the welded joint, leading to more severe corrosion of the welded joints. The most severe corrosion of both the flat and convex welds occurred at 6.9 m/s (Figure 5). The differences in flow velocities, mass transfer, and galvanic corrosion current between the convex weld and the flat weld increased with increasing flow velocities (Figure 13 and Figure 14). Moreover, the damage caused by the geometric discontinuity of the weld reinforcement height was also exacerbated with increased flow velocity.
5. Conclusions
The corrosion behavior of SA106B welded joints was investigated in 0.5 M NaCl solution at 0.5 m/s, 1.2 m/s, 3.2 m/s, and 6.9 m/s. Electrochemical tests, corrosion morphology observations, and CFD simulations were conducted to analyze the corrosion mechanisms of flat and convex welds under different flow velocities. The conclusions are as follows:
- (1)
- At the same flow velocity, the local disturbance due to the convex weld caused more severe corrosion than the flat weld. However, the characteristic of preferred corrosion in the WZ was not changed by flow velocity.
- (2)
- The corrosion rate of both the flat and convex welds increased with increasing experimental flow velocity. It was more obvious for the convex weld, which contributed a maximum of 45.77% to the entire corrosion at 6.9 m/s.
- (3)
- The corrosion behavior of SA106B welded joints was influenced by the combined effects of mass transfer, wall shear stress, and galvanic corrosion. The aggravating effect of geometric discontinuity on the corrosion of the downstream BM and HAZ was far less than that of the upstream BM and HAZ. The corrosion of the downstream samples was not significantly aggravated at a low flow velocity of 0.5 m/s.
Author Contributions
Conceptualization, K.Z., H.H. and Y.Z.; methodology, K.Z. and H.H.; validation, K.Z., H.H., Z.W., Y.Z., P.Z. and C.Y.; formal analysis, K.Z. and H.H.; investigation, K.Z., Y.M. and Z.W.; resources, Y.Z.; data curation, K.Z. and Y.M.; writing—original draft preparation, K.Z. and Y.M.; writing—review and editing, Y.M., H.H., Z.W., Y.Z., N.M. and C.Y.; supervision, H.H., Y.Z., N.M., P.Z. and C.Y.; project administration, H.H.; funding acquisition, H.H. and K.Z. All authors have read and agreed to the published version of the manuscript.
Funding
This research was funded by the National Key R&D Program of China, grant number 2024YF3013702.
Data Availability Statement
The data presented in this study are available on request from the corresponding author due to privacy (the data also forms part of an ongoing study).
Conflicts of Interest
Authors Ning Ma, Peng Zhang and Chunguang Yang were employed by the company Inner Mongolia First Machinery Group Co., Ltd. The remaining authors declare that the research was conducted in the absence of any commercial or financial relationships that could be construed as a potential conflict of interest.
References
- Okonkwo, B.O.; Ming, H.; Zhang, Z.; Wang, J.; Rahimi, E.; Hosseinpour, S.; Davoodi, A. Microscale investigation of the correlation between microstructure and galvanic corrosion of low alloy steel A508 and its welded 309/308L stainless steel overlayer. Corros. Sci. 2019, 154, 49–60. [Google Scholar] [CrossRef]
- Daud, N.M.R.N.M.; Eng, K.K.; Jumbri, K.; Nor, A.M.; Suhor, M.F.; Borhan, N.; Abas, A.Z.; Aizamddin, M.F.; Mohd Pu’ad, M.J.; Muhammad, M.F. Benchmarking the impact of nickel filler addition, weld hardness, environmental pH, and corrosion inhibitors on A333 carbon steel pipe weld corrosion. Results Eng. 2023, 20, 101633. [Google Scholar] [CrossRef]
- Zhang, D.L.; Liu, R.; Liu, Y.S.; Xing, S.-H.; He, Z.-H.; Qian, Y.; Liu, J.-Z.; Dou, X.-H.; Zhang, X.-W. Combined experimental and simulation study on corrosion behavior of B10 copper-nickel alloy welded joint under local turbulence. J. Iron Steel Res. Int. 2023, 30, 1598–1612. [Google Scholar] [CrossRef]
- Ma, Q.; Wang, Q.; Zhou, X.; Liu, M.; Wu, T.; Dong, Z. Desulfovibrio desulfuricans induced corrosion of welded joint in X80 pipeline steel below delaminated coating. Constr. Build. Mater. 2024, 411, 134335. [Google Scholar] [CrossRef]
- Sun, Y.; Liu, Y.; Luan, D.; Yang, Y.; Li, L.; Zhang, X.; Guo, Y.; Zeng, H.; Zhao, X. Effect of CO2 pressure on the corrosion behavior of base metal and welded joint of L415 pipeline steel in coalbed methane produced water. Mater. Today Commun. 2025, 48, 113677. [Google Scholar] [CrossRef]
- Liu, Z.-H.; Yang, L.; Wang, Y.-Z.; Du, X.-L. Compression behavior and reliability of welded stainless-steel tube column with random corrosion. J. Constr. Steel Res. 2025, 235, 109865. [Google Scholar] [CrossRef]
- Nofrizal, N.; Wulandari, M.; Impey, S.; Georgarakis, K.; Papanikolaou, M.; Raja, P.B. An experimental and simulation screening of X-65 steel weldment corrosion in high flow rate conditions. Mater. Today Commun. 2024, 39, 108793. [Google Scholar] [CrossRef]
- Huang, Y.; Wei, J.; Huang, T.; Yang, Z.; Zhang, S.; Zhu, Z.; Fan, K.; Luo, X.; Li, X.; Zhou, Q.; et al. Effects of radial bending stress on hot corrosion behaviour of dissimilar martensitic heat-resistant steel weldments in ultra-supercritical unit. Int. J. Press. Vessel. Pip. 2024, 209, 105205. [Google Scholar] [CrossRef]
- Zhang, L.; Wu, Z.; Li, Y.; Feng, Y.; Zhao, F. Study on microstructure, mechanical and corrosion behavior of Ti-6Al-4V titanium alloy by Keyhole gas tungsten arc welding. Mater. Today Commun. 2024, 40, 109530. [Google Scholar] [CrossRef]
- Ilman, M.N.; Muslih, M.R.; Triwibowo, N.A.; Sehono; Purwaningrum, Y. Analyses of tensile, fatigue crack growth and corrosion properties of dissimilar welded AA6061-T6/AA5083-H112 joints fabricated by GMAW and FSW: A comparison. Next Mater. 2025, 9, 101139. [Google Scholar] [CrossRef]
- Cao, J.; Wang, Y.; Xu, G.; Liu, X.; Zeng, X.; Wei, K. Effect of post-weld induction heat treatment on single-pass high-power laser-arc hybrid welded thick stainless steel clad plate: Microstructure, mechanical properties and corrosion resistance. J. Mater. Res. Technol. 2025, 38, 2623–2635. [Google Scholar] [CrossRef]
- ISO 5817:2023; Welding-Fusion-Weld Joints in Steel, Nickel, Titanium and Their Alloys (Beam Welding Excluded)-Quality Levels for Imperfectins. ISO: Geneva, Switzerland, 2014.
- Shirinzadeh-Dastgiri, M.; Mohammadi, J.; Behnamian, Y.; Eghlimi, A.; Mostafaei, A. Metallurgical investigations and corrosion behavior of failed weld joint in AISI 1518 low carbon steel pipeline. Eng. Fail. Anal. 2015, 53, 78–96. [Google Scholar] [CrossRef]
- Han, Q.H.; Wang, X.; Lu, Y. Experimental investigation on the corrosion behavior of G20Mn5QT cast steel and butt weld with Q345D steel. Corros. Sci. 2018, 132, 194–203. [Google Scholar] [CrossRef]
- Dou, X.; He, Z.; Zhang, X.; Liu, Y.; Liu, R.; Tan, Z.; Zhang, D.; Li, Y. Corrosion behavior and mechanism of X80 pipeline steel welded joints under high shear flow fields. Colloids Surf. A Physicochem. Eng. Asp. 2023, 665, 131225. [Google Scholar] [CrossRef]
- Chen, G.; Ju, N.; Yan, T.; Liu, Y.; Xia, J.; Zhang, R.; Zhu, Q. The influence of post-weld heat treatment on the corrosion resistance of CLAM steel weld bead in flowing LBE at 550 °C. Nucl. Eng. Des. 2025, 444, 114418. [Google Scholar] [CrossRef]
- Yang, L.; Zhang, D.; Fan, H.; Fu, X.; Yan, R.; Wei, Z.; Wu, H. In-situ electrochemical testing and fluid dynamics simulation of pipeline defects under flow accelerated corrosion. Exp. Therm. Fluid Sci. 2024, 150, 111048. [Google Scholar] [CrossRef]
- Barker, R.; Hu, X.; Neville, A. The influence of high shear and sand impingement on preferential weld corrosion of carbon steel pipework in CO2-saturated environments. Tribol. Int. 2013, 68, 17–25. [Google Scholar] [CrossRef]
- Ramesh, N.R.; Kumar, V.S.S. Experimental erosion-corrosion analysis of friction stir welding of AA 5083 and AA 6061 for sub-sea applications. Appl. Ocean Res. 2020, 98, 102121. [Google Scholar] [CrossRef]
- Dou, X.; Xiang, W.; Li, B.; Ju, M.; Li, A.; Zhang, D.; Li, Y. CFD-DPM modelling of solid particle erosion on weld reinforcement height in liquid-solid high shear flows. Powder Technol. 2023, 427, 118773. [Google Scholar] [CrossRef]
- Yang, J.; Wang, Z.B.; Qiao, Y.X.; Zheng, Y.G. Synergistic effects of deposits and sulfate reducing bacteria on the corrosion of carbon steel. Corros. Sci. 2022, 199, 110210. [Google Scholar] [CrossRef]
- Ermakova, A.; Ganguly, S.; Razavi, N.; Berto, F.; Mehmanparast, A. Corrosion-fatigue crack growth behaviour of wire arc additively manufactured ER70S-6 steel parts in marine environments. Eur. J. Mech. A/Solids 2022, 96, 104739. [Google Scholar] [CrossRef]
- Song, Z.H.; Song, H.Y.; Liu, H.T. Effect of cooling route on microstructure and mechanical properties of twin-roll casting low carbon steels with an application of oxide metallurgy technology. Mater. Sci. Eng. A 2021, 800, 140282. [Google Scholar] [CrossRef]
- Hirschorn, B.; Orazem, M.E.; Tribollet, B.; Vivier, V.; Frateur, I.; Musiani, M. Determination of effective capacitance and film thickness from constant-phase-element parameters. Electrochimica Acta 2010, 55, 6218–6227. [Google Scholar] [CrossRef]
- Hirschorn, B.; Orazem, M.E.; Tribollet, B.; Vivier, V.; Frateur, I.; Musiani, M. Constant-Phase-Element Behavior Caused by Resistivity Distributions in Films II. J. Electrochem. Soc. 2010, 157, C458. [Google Scholar] [CrossRef]
- Pang, L.; Wang, Z.B.; Lu, M.H.; Lu, Y.; Liu, X.; Zheng, Y.G. Inhibition performance of benzimidazole derivatives with different heteroatoms on the under-deposit corrosion of carbon steel in CO2-saturated solution. Corros. Sci. 2021, 192, 109841. [Google Scholar] [CrossRef]
- Xu, Y.; Tan, M.Y. Visualising the dynamic processes of flow accelerated corrosion and erosion corrosion using an electrochemically integrated electrode array. Corros. Sci. 2018, 139, 438–443. [Google Scholar] [CrossRef]
- Zhu, G.Y.; Li, Y.Y.; Zhang, G.A. Interaction between crevice and galvanic corrosion of X65 carbon steel in the CO2-saturated NaCl solution under the coupling of crevice and galvanic effects. J. Electroanal. Chem. 2022, 918, 116482. [Google Scholar] [CrossRef]
- Zhang, D.; Yang, L.; Tan, Z.; Xing, S.; Bai, S.; Wei, E.; Tang, X.; Jin, Y. Corrosion behavior of X65 steel at different depths of pitting defects under local flow conditions. Exp. Therm. Fluid Sci. 2021, 124, 110333. [Google Scholar] [CrossRef]
- Wang, Y.; Wang, B.; Xing, X.; He, S.; Zhang, L.; Lu, M. Effects of flow velocity on the corrosion behaviour of super 13Cr stainless steel in ultra-HTHP CO2-H2S coexistence environment. Corros. Sci. 2022, 200, 110235. [Google Scholar] [CrossRef]
- Zhong, X.; Shang, T.; Zhang, C.; Hu, J.; Zhang, Z.; Zhang, Q.; Yuan, X.; Hou, D.; Zeng, D.; Shi, T. In situ study of flow accelerated corrosion and its mitigation at different locations of a gradual contraction of N80 steel. J. Alloys Compd. 2020, 824, 153947. [Google Scholar] [CrossRef]
- Tan, Z.; Zhang, D.; Yang, L.; Wang, Z.; Cheng, F.; Zhang, M.; Jin, Y.; Zhu, S. Development mechanism of local corrosion pit in X80 pipeline steel under flow conditions. Tribol. Int. 2020, 146, 106145. [Google Scholar] [CrossRef]
- Jiang, S.; Chai, F.; Su, H.; Yang, C. Influence of chromium on the flow-accelerated corrosion behavior of low alloy steels in 3.5% NaCl solution. Corros. Sci. 2017, 123, 217–227. [Google Scholar] [CrossRef]
- Gu, Y.; Lu, N.; Xu, Y.; Shi, Y.; Zhang, G.; Sun, Q. Microstructure characteristics of Q345R-steel welded joints and their corrosion behavior in a hydrofluoric acid environment. J. Nucl. Mater. 2023, 574, 154214. [Google Scholar] [CrossRef]
- Hu, Y.; Xin, L.; Hong, C.; Han, Y.; Lu, Y. Microstructural understanding of flow accelerated corrosion of SA106B carbon steel in high-temperature water with different flow velocities. Materials 2023, 16, 3981. [Google Scholar] [CrossRef] [PubMed]
Disclaimer/Publisher’s Note: The statements, opinions and data contained in all publications are solely those of the individual author(s) and contributor(s) and not of MDPI and/or the editor(s). MDPI and/or the editor(s) disclaim responsibility for any injury to people or property resulting from any ideas, methods, instructions or products referred to in the content. |
© 2025 by the authors. Licensee MDPI, Basel, Switzerland. This article is an open access article distributed under the terms and conditions of the Creative Commons Attribution (CC BY) license (https://creativecommons.org/licenses/by/4.0/).