Article

Emissivity Measurements of Metals Used in Wire-Arc-Directed Energy Deposition Processes

by
Kevin Mullaney
* and
Ralph P. Tatam
Centre for Engineering Photonics, Cranfield University, College Road, Bedford MK43 0AL, UK
*
Author to whom correspondence should be addressed.
Metals 2025, 15(10), 1078; https://doi.org/10.3390/met15101078
Submission received: 14 June 2025 / Revised: 18 September 2025 / Accepted: 22 September 2025 / Published: 26 September 2025

Abstract

Accurate temperature measurement is a key parameter that determines the quality of additive manufactured components in directed energy deposition processes. Optical pyrometers which are used to provide in-process temperature data require accurate emissivity data of the metal surface. Process-specific emissivity data for metals used in these processes is not readily available. This paper provides the emissivity of a variety of metals used in wire-arc directed energy deposition processes. For the first time, the test samples were fabricated using typical deposition processes and systems. The metals evaluated were titanium alloy (Ti-6Al-4V), Inconel 718, mild steel, aluminum alloy 2319, and nickel aluminum bronze. At ambient temperature, the measured normal emissivity was 0.26–0.28 for Ti-6Al-4V; for Inconel 718, it was 0.45–0.54; for mild steel, it was 0.4–0.72; for aluminum 2319, it was 0.14; and for nickel aluminum bronze, it was 0.35. The approximate emissivity values are also given over the temperature range 20–1400 °C. The effect of residual oxygen in the shield gas on emissivity is explored for the first time. The spectrophotometric technique was used to measure the metal thermo-optical properties.

1. Introduction

Metal additive manufacturing (AM) of large components will have a major impact on the production of high-performance components due to its cost and material savings as well as offering design flexibility and component customization [1,2,3,4,5,6]. One of the two principal AM processes is wire-arc-directed energy deposition (DED-Arc). Here, metal wire is fed into an electric arc, which is then moved to deposit molten metal in predetermined positions, and a structure is built by implementing this in repeating layers [7,8]. Structures built using this technique can have excellent material properties, but due to variations in the thermal field within the vicinity of the melt pool, anisotropic microstructures often arise with undesirable variations in the final mechanical properties [9,10,11]. Temperature measurements of the wire DED-Arc layers address this challenge by ensuring the production of reproducible material microstructures, layer geometry and part thermal history. Thermal camera and pyrometer measurement of the layer surface is challenging as the intense optical radiation environment (arc or laser) can saturate the optical sensor or degrade measurement accuracy [12]. These instruments also require specific knowledge of the emissivity of the metal surface to provide accurate temperature data [13,14,15], especially as they can operate in a defined wavelength band. Published emissivity data can be inaccurate as the emissivity can depend on both the sample preparation process and measurement technique employed. The emissivity of the metals is also dependent on the properties of the radiating surface, namely its surface roughness, viewing angle, temperature, chemical composition of the metal being deposited, phase transition effects, surface oxidation, reactivity, and process repeatability [16,17,18].
There have been a variety of techniques described in the literature to measure the emissivity of metals commonly used in additive manufacturing. Recent research has been undertaken on titanium alloy (Ti-6Al-4V) using a variety of processes and measurement techniques. Hagqvist et al. [19] used an induction heater, in a very-low-oxygen atmosphere, to heat a sample fabricated using laser metal deposition. The surface emissivity at elevated temperatures was determined using a narrow band pyrometer (operating between 1.45 and 1.8 µm) and thermocouples. Shur et al. [20] used electron kinetic energy heating of a polished sample in a high vacuum environment. This ensured the polished surface had minimal oxidation present. Three pyrometers were then employed to determine the sample emissivity at elevated temperatures. Mohr et al. [21] used the electromagnetic levitator instrument on-board the International Space Station to heat the alloy to elevated temperatures in an argon environment, so the oxygen level was minimized. The sample surface was in the form of a sphere which had a specular surface. The modulation calorimetry method was then used to determine the Ti-6Al-4V emissivity. Baier et al. [22] used a thermal camera together with thermocouples to determine the emissivity of a DED-Arc deposited wall. They also compensated for transmission losses affecting the temperature measurements, when using a protective window in conjunction with the camera.
Limited emissivity data has been published for Inconel 718 using DED-Arc; however, Keller et al. [23] used a calorimetric technique on a variety of differently processed sheet samples and measured the emissivity to be 0.2–0.7 depending on surface finish and oxidation state over a temperature range of 377–1027 °C. Curry et al. [24] determined the spectral emissivity of Inconel 718 samples using a direct laser sintering system process to produce an AM sample, which was then polished to produce a specular surface. The samples’ optical properties were measured using Fourier transform infrared (FTIR) reflectivity and ellipsometry techniques over the spectral measurement range 0.35–8.3 µm. Li et al. [25] measured the spectral emissivity of a 3D-printed Inconel 718 rocket nozzles using an induction heater and fiber optic spectrometer over the temperature range 700–1000 °C.
Ren et al. [13] using a selective laser melting additive manufacturing technique, determined the emissivity of steel using a heat transfer simulation model coupled with thermocouples for experimental confirmation. Jones et al. [26] reports the emissivity measurements of oxidized evaporated aluminum using the spectrophotometric reflectance technique. Wade [27] determined the emissivity of mild steel by fine-polishing samples and then oxidizing them in a heated chamber while using a pyrometer and thermocouple arrangement. Touloukian et al. [28] determined the emissivity of highly oxidized mild steel at 816 °C using the reflectance technique. Sadiq et al. [29] determined the emissivity of carbon steel by heating in a furnace to 600 °C and using thermocouples and a calibrated thermal model. Table 1 summarizes the previously published results together with the results from this study.
Table 1 shows that there is limited current data on the emissivity of typical metals processed using DED-Arc techniques. Given the sensitivity of emittance measurements to sample preparation conditions and the requirement to make accurate pyrometer measurements, this work is focused on deriving emittance data for typical metals processed using DED-Arc techniques, which AM process engineers can then use in their activities.
Test samples of the metals to be investigated were fabricated using DED-Arc processes using standard operating parameters. The samples were fabricated from Ti-6Al-4V, aluminum 2319, Inconel 718, mild steel, and nickel aluminum bronze (NAB). The former alloys are commonly used in aerospace applications whereas NAB is used in maritime applications due to its combination of high strength, wear, corrosion, and bio-fouling resistance [30,31]. No data on the emissivity of NAB has been identified in the literature.
Due to the high temperatures of AM processes, oxidation is usually observed as a non-uniform discoloration of the finished part. This tends to be most common with Ti-6Al-4V, Inconel 718 and mild steel. The discoloration is due to the formation of a thin oxide scale or layer on the metal surface but also results in oxides being distributed throughout the component [32,33] due to the layer-by-layer deposition process. As well as forming a surface scale, a brittle oxygen-rich (TiOx) layer is formed near the surface which is a concern for the end user. For steel, the oxide (FeOx) layer [27] impacts on the reproducibility of the AM deposition process and can influence the mechanical properties [33], as the oxides are distributed throughout the material. To assess the sensitivity of emissivity to variations in the oxide layer, Ti-6Al-4V, Inconel 718, and mild steel alloys were deposited under different residual oxygen levels in the gas shielding environment.

2. Theory

The emissivity of a surface is defined as the ratio of radiance from the surface to that from a black body viewed under identical optical and geometrical conditions and at the same temperature [26,34]. There are a variety of techniques for measuring the emissivity of surfaces: visible/infrared spectrophotometry, calorimetric techniques, and thermal balance methods [28,34,35]. Each method has its specific advantages and limitations. The simplest method to measure emissivity is calculation using a reflectance versus wavelength curve of the surface. The total normal emissivity ε(T), is then determined by weighting the surface spectral reflectivity R(λ) with the Planck function Ib (λ,T), as shown in Equation (1):
ε T = 1   λ 1 λ 2   ( R ( λ ) ) I b λ , T d λ λ 1 λ 2   I b ( λ , T ) d λ
The wavelength interval (λ1 − λ2), is ideally chosen such that ~95% of the emitted Planck energy spectrum is included in the calculation [34].

3. Materials and Methods

Measurement of the normal emissivity of a metal surface requires a measurement of reflectivity [34] at a near normal incidence angle (0 ± 8°), over a wavelength interval within the visible and infrared (IR) spectrum. The specific wavelength band is determined by the spectral response of the pyrometer/thermal camera and the spectral distribution of the black body emitter at a specific temperature. The visible reflectance test sample measurements were undertaken using a Jasco V670 UV–visible spectrometer (Jasco UK, Heckmondwike, UK), which has a wavelength range of 0.19–2.7 µm and 60 mm diameter Spectralon integrating sphere. The IR measurements employed a Jasco FTIR 6200 Fourier transform infrared spectrometer (Jasco UK, Heckmondwike, UK), which has a wavelength range of 1.28–28.5 µm and a 76 mm diameter gold-coated Pike integrating sphere (Figure 1) (Pike Technologies, Madison, WI, USA). The dimensions of the metal samples were 25 × 25 × 10 mm given the space constraints within the spectrometers. In this study, one sample was fabricated and tested for each metal/process variant, which was investigated.

3.1. Titanium Alloy

Ti-6Al-4V components fabricated using DED-Arc have been shown to exhibit varying degrees of surface coloration depending on the level of oxygen present in the argon deposition environment [32] and the thermal cycling, which the part undergoes as layers are successively added [33]. The coloration is caused by a varying thickness of an optically thin titanium oxide layer on the surface of the component, which can range from no coloration, to a straw color, to a deep blue/violet [32], depending on the process conditions and oxide layer thickness. The presence of the titanium oxide layer modifies the wavelength specific reflectance of the metal surface via the optical interference mechanism [36] and hence its emissivity. As pyrometers and thermal cameras, which use single wavelength channel detectors, assume the object’s emissivity is constant, variations caused by oxidation effects, can result in increased errors in temperature measurements during use [37]. Thiessen et al. has compared the temperature deviation between a pyrometer and a thermocouple for a progressively oxidizing steel sample and recorded a deviation of 52 °C at 850 °C [38].
To quantify these effects, four samples of Ti-6Al-4V were deposited under different residual oxygen levels within the AM machine enclosure to assess the influence on emissivity. A Viper MC plasma torch (supplied by PWP Industrial, Bedford, UK), 1.2 mm feedstock wire (supplied by Perryman, Houston, PA, USA) and substrate were contained within an argon gas-filled enclosure to provide “global” shielding (Figure 2a,c). The plasma torch parameters were 190 A @ 23.6 V powered by a Fronius TransTig 5000 welder and Plasma module 10 (supplied by Fronius UK, Milton Keynes, UK). The torch travel speed was 6 mm/s and the wire feed rate was 1.75 m/ min. using 10 L/min. of argon shield gas. The individual metal layer width and height was 6.2 mm and 1.4 mm, respectively. The plasma torch was programmed to follow an oscillation path, shown in Figure 2b, generating a rectangular weld with a flat top surface profile.
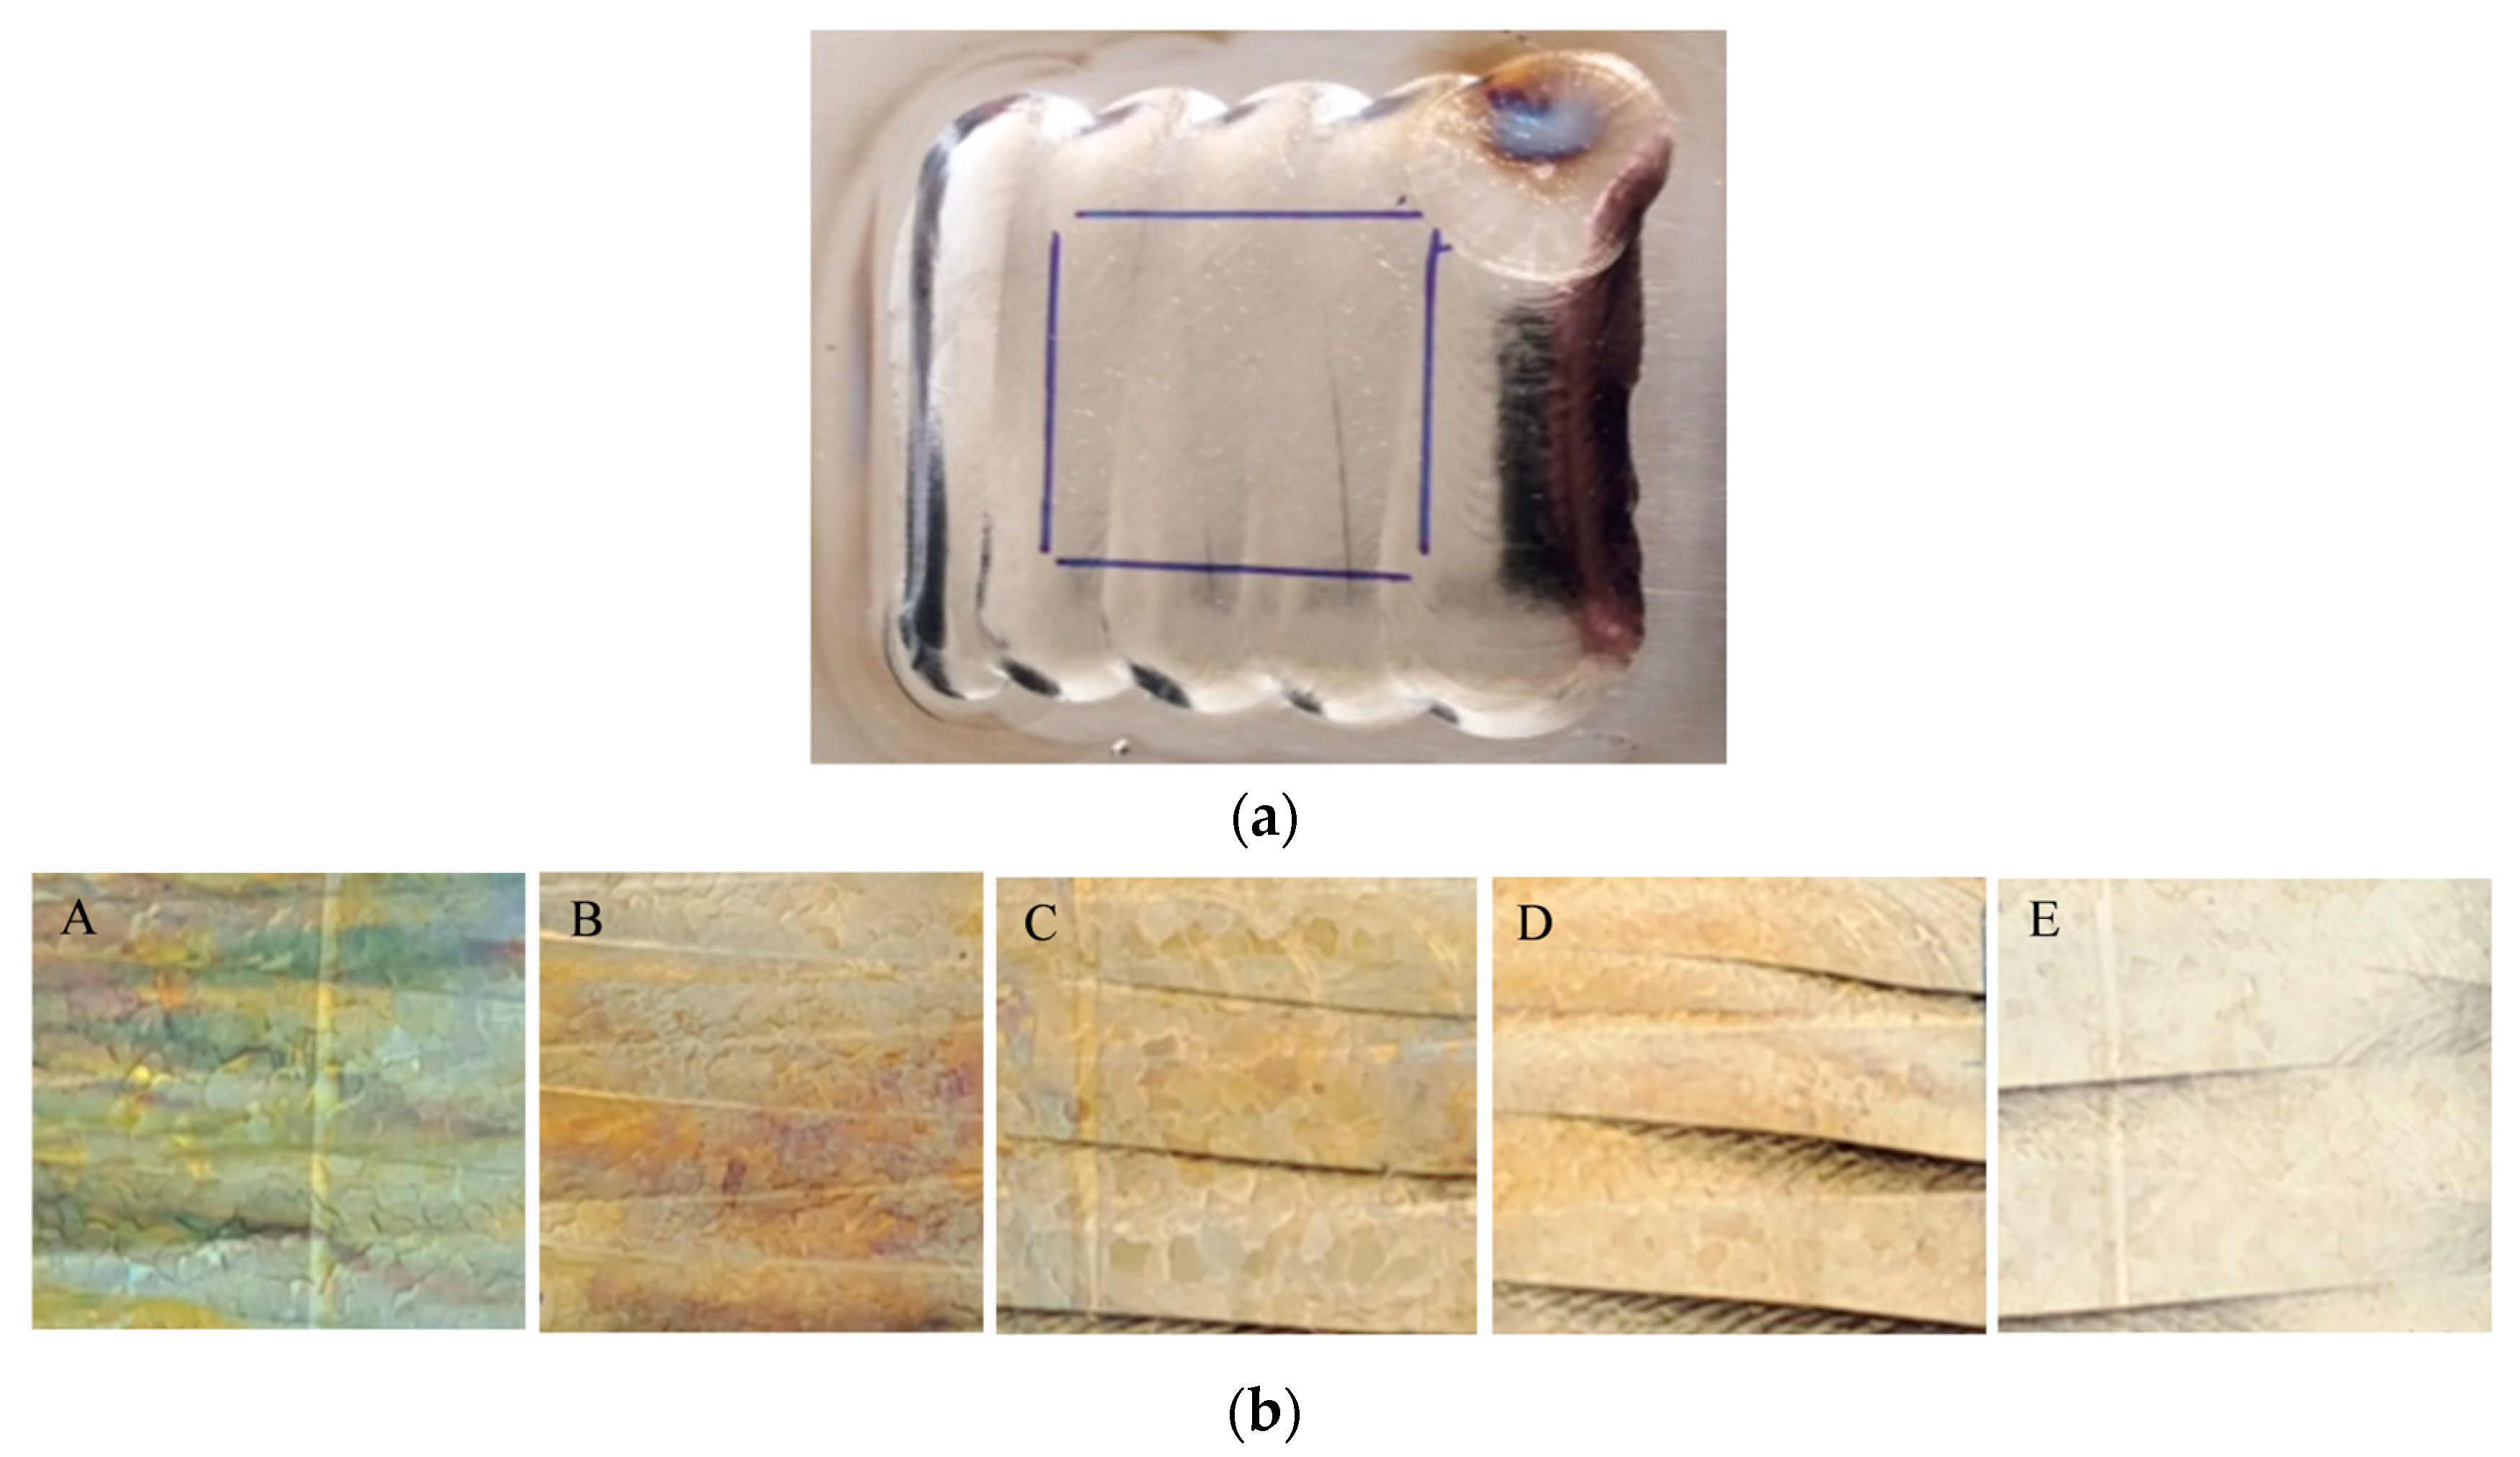
For each sample deposition, the residual oxygen atmosphere in the enclosure was adjusted from 1850 to 5 ppm, measured using a PurgEye 600 weld monitor from Huntingdon Fusion Techniques, Letchworth Garden City, UK. The enclosure gas was sampled from a location within 100 mm of the titanium alloy melt pool for samples A–D. Sample E was fabricated separately, using a local gas shielding end-effector [5] attached to a multi-axis robot. The end-effector provides a “local” shielding environment to limit oxidation during the deposition. The aim of this trial was to compare the effectiveness of global versus local gas shielding. Flat test samples (25 × 25 × 10 mm) were then cut from each rectangular weld using an electrical discharge machine (EDM) due to the hardness of the material Figure 3a,b). The measured surface was protected during cutting to preserve the deposited surface. The samples were then cleaned with an acetone wipe. The visual appearance of the sample top surface is shown in Figure 3b, illustrating the color change with oxygen level. Table 2 summarizes the different oxygen deposition conditions. The typical melting point of Ti-6Al-4V is 1650 °C [16].

3.2. Inconel 718

Inconel 718 was DED-Arc deposited on a steel substrate (S355) in an argon filled enclosure. The same equipment and conditions were used as described in the previous section. Two residual oxygen partial concentrations were used: 41 ppm for sample F and 464 ppm for sample G. In both cases, the plasma torch current was 180 A, wire feed speed was 1.1 m/min., and a torch travel speed of 5 mm/ s was employed. The typical melting range of Inconel 718 is 1260–1336 °C [16].

3.3. Mild Steel

Mild steel wire (SupraMig Ultra—supplied by Lincoln Electric, Sheffield, UK) was deposited using an end-effector attached to a robot so providing a local argon gas shielding environment [5]. The robot was programmed to follow a “square” wave oscillation path, thus generating adjacent overlapping walls with a flat surface profile. The residual oxygen level around the mild steel melt pool was limited by the high argon gas flow rate within the trailing shield of the end-effector. For the low oxygen deposition (sample H), the argon flow rate was 70 L/min. In the higher oxygen process (sample I), the argon flow rate was reduced to 20 L/ min. In both cases, the deposition travel speed was 4 mm/s, plasma current was 205 A and the wire feeding speed was 1.9 m/min. The typical melting temperature of mild steel is greater than 1450 °C [16].

3.4. Aluminum Alloy 2319

Aluminum 2319 was deposited using the Fronius cold metal transfer (advance) process [39]. This alloy consists of ~6% copper. The samples were fabricated in an open environment with argon gas torch shielding of 25 L/min. The aluminum wire feed rate was 7 m/min. with a work piece travel speed of 10 mm/s. The effect of differing oxygen levels was not explored for this material. The aluminum 2319 samples (J) were then EDM cut to the dimensions indicated earlier. The typical melting temperature of this alloy is greater than 543 °C [16].

3.5. Nickel Aluminum Bronze (NAB)

The NAB alloy (UNS C63280) wire was supplied by Bohler Welding, Oldbury, UK. The material was deposited using a cold wire metal inert gas welding process (CW MIG) [40] with argon gas shielding at 18 L/min. The two wire feed speeds were <10 m/min, and the torch travel speed was 0.7 m/min. The effect of differing residual oxygen levels was not explored for this material. The typical melting temperature range of this material is 1040–1077 °C [16]. The NAB sample (K) was then EDM post-machined to the dimensions indicated in the previous section.
A summary of the parameters used in the fabrication of the AM samples investigated in this study is provided in Table 3 and the composition of the metals studied is given in Table 4.
The test samples had their reflectance measured at near normal incidence from 0.4 to 2.5 µm in the visible and near infrared (NIR) spectrum and from 1.35 to 18 μm in the infrared (IR) spectrum. The visible spectrometer was referenced using a Labsphere Spectralon diffuse reflectance standard (R~99%) (supplied by Pro-lite Technology, Bedford, UK), and the IR spectrometer was referenced using a Labsphere infra-gold diffuse reflectance standard (R~94%). From the processed sample reflectance data, the normal emissivity was then calculated using Equation (1) at various black body temperatures. The wavelength range used for the calculations was 0.4–15 µm.

4. Results

4.1. Titanium Alloy

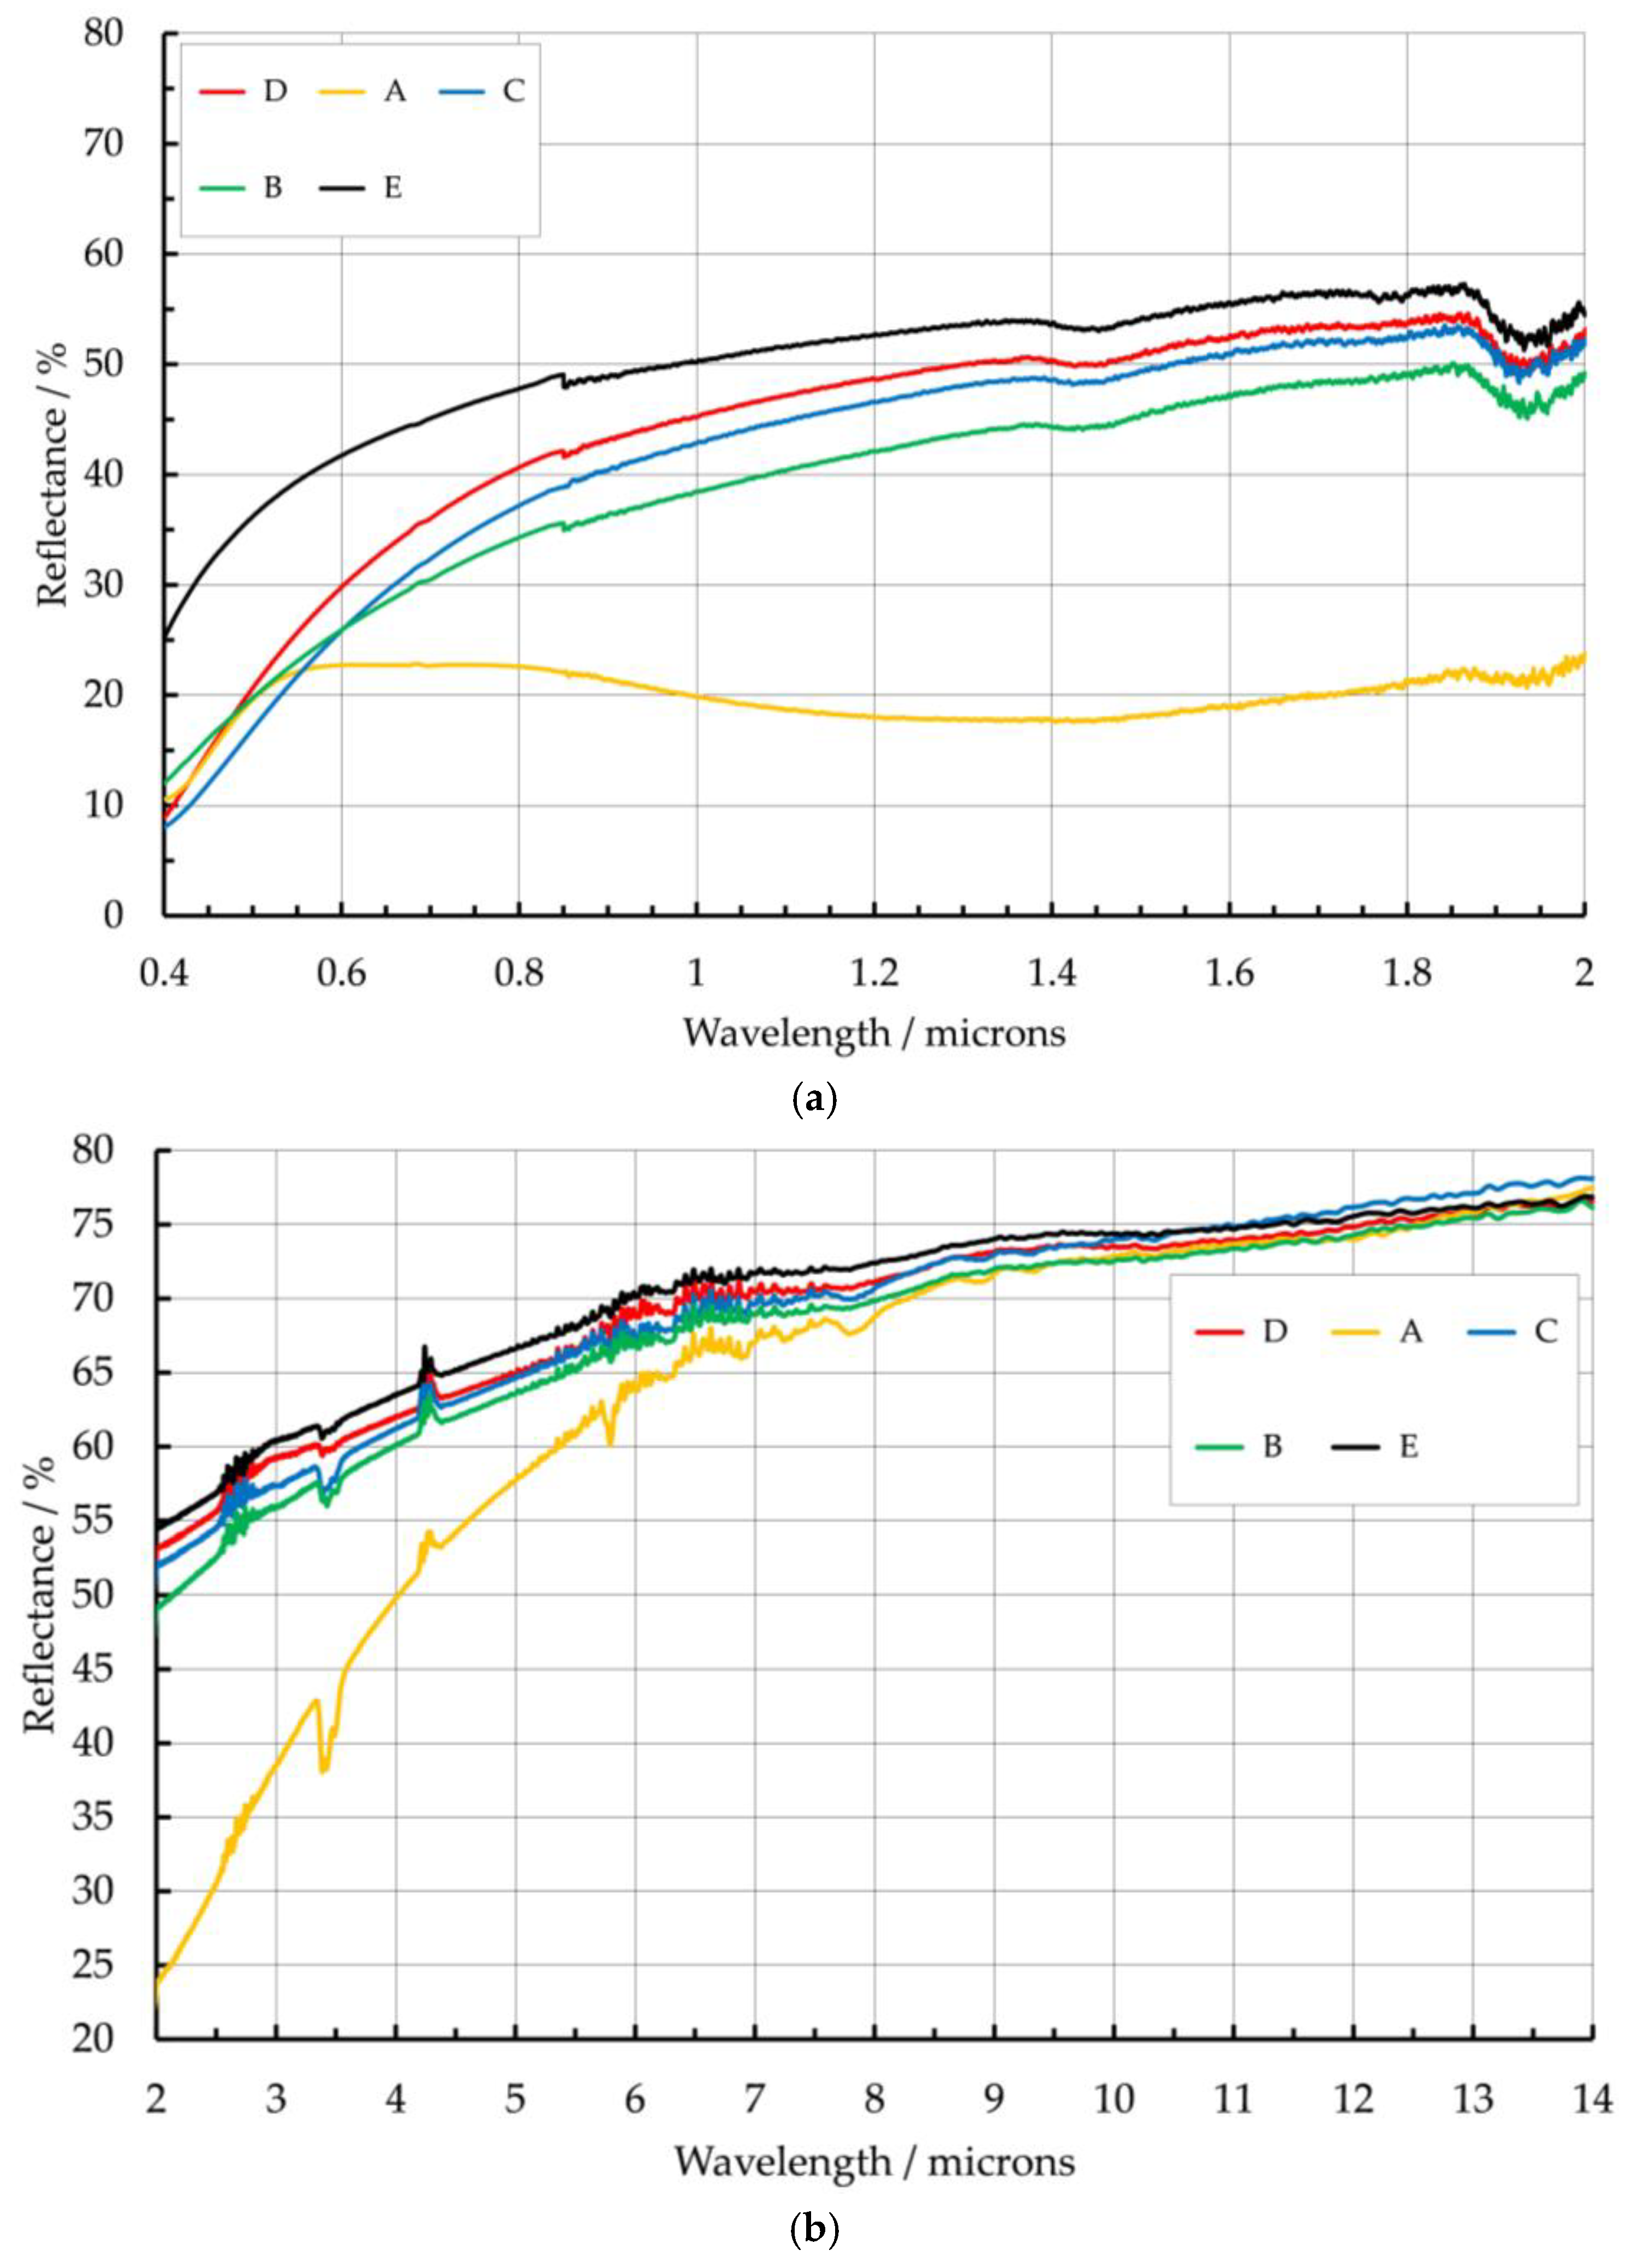
The reflectance of the Ti-6Al-4V samples, deposited with differing residual oxygen levels (Table 2), is shown in Figure 4a,b. Sample A, deposited under the highest level of oxygen, has the lowest reflectivity (R) in the visible and NIR compared to the other samples but increases at wavelengths longer than 8 μm. Sample A has the most oxidized surface as it was deposited with the highest residual background of oxygen. This results in the formation of a relatively thick semi-transparent titanium oxide layer [41] on the surface of the metal, which reduces the reflectance of the underlying metal, producing a local reflectance minimum at ~1.35 µm. A thinner oxide layer would cause a displacement of this minimum to shorter wavelengths, and a thicker layer will shift the minimum to longer wavelengths.
Sample E was deposited with the lowest oxygen level and has the least coloration (Figure 3b), which is evidenced in Figure 4a. For sample E, the reflectance is high over the visible spectrum (0.4–0.75 µm) with more blue light being reflected, giving a silver-white color. For samples C, B, and D, there is a progressive reduction in blue light (0.4–0.47 µm) being reflected. This changes the sample color perceived by the eye, giving the samples a straw color with increasing hue as shown in Figure 3b. For sample A, which appears green/blue in Figure 3b, the orange/red (0.59–0.75 µm) reflectance has now decreased in Figure 4a. This latter effect changes the perceived color of sample A, as green light is emphasized.
There are several measurement artifacts and absorption peaks evident on these reflectance curves. These are primarily due to atmospheric water (e.g., curve A at 2.7 µm, 3.4 µm, and 5–8 µm) and carbon dioxide (~4.2 µm) absorption bands, because the spectrophotometers were not purged with dry gas during the measurements [41,42]. In Figure 4a, there is also a spectrometer grating change at 0.85 µm giving a characteristic step in the reflectance curve.
The effect of differing residual oxygen levels on sample reflectance/emissivity is most evident over the wavelength range 0.4–1.8 µm. As most commercial pyrometers and cameras used in AM processes operate within the wavelength band 0.8–1.7 µm, it would be advantageous to limit oxygen variations within the process, to reduce temperature measurement errors caused by Ti-6Al-4V emissivity variations.
Using the reflectance data from Figure 4a,b and Equation (1), the total emissivity at 20 °C was calculated for samples A, B, C, D, and E, and the results are presented in Table 5. At a temperature of 20 °C, the black body emission curve peaks at ~10 µm and so the reflectance values, at longer wavelengths, weight the emissivity calculation more. As total emissivity is approximately proportional to (1-R), samples A and B have the highest emissivity and sample E had the lowest emissivity at room temperature. Samples C, D, and E were deposited under low levels of oxygen and thus have higher levels of reflectivity and lower emissivity compared to samples A and B. Table 5 gives the calculated total emissivity values for these samples, at a black body temperature of 20 °C.
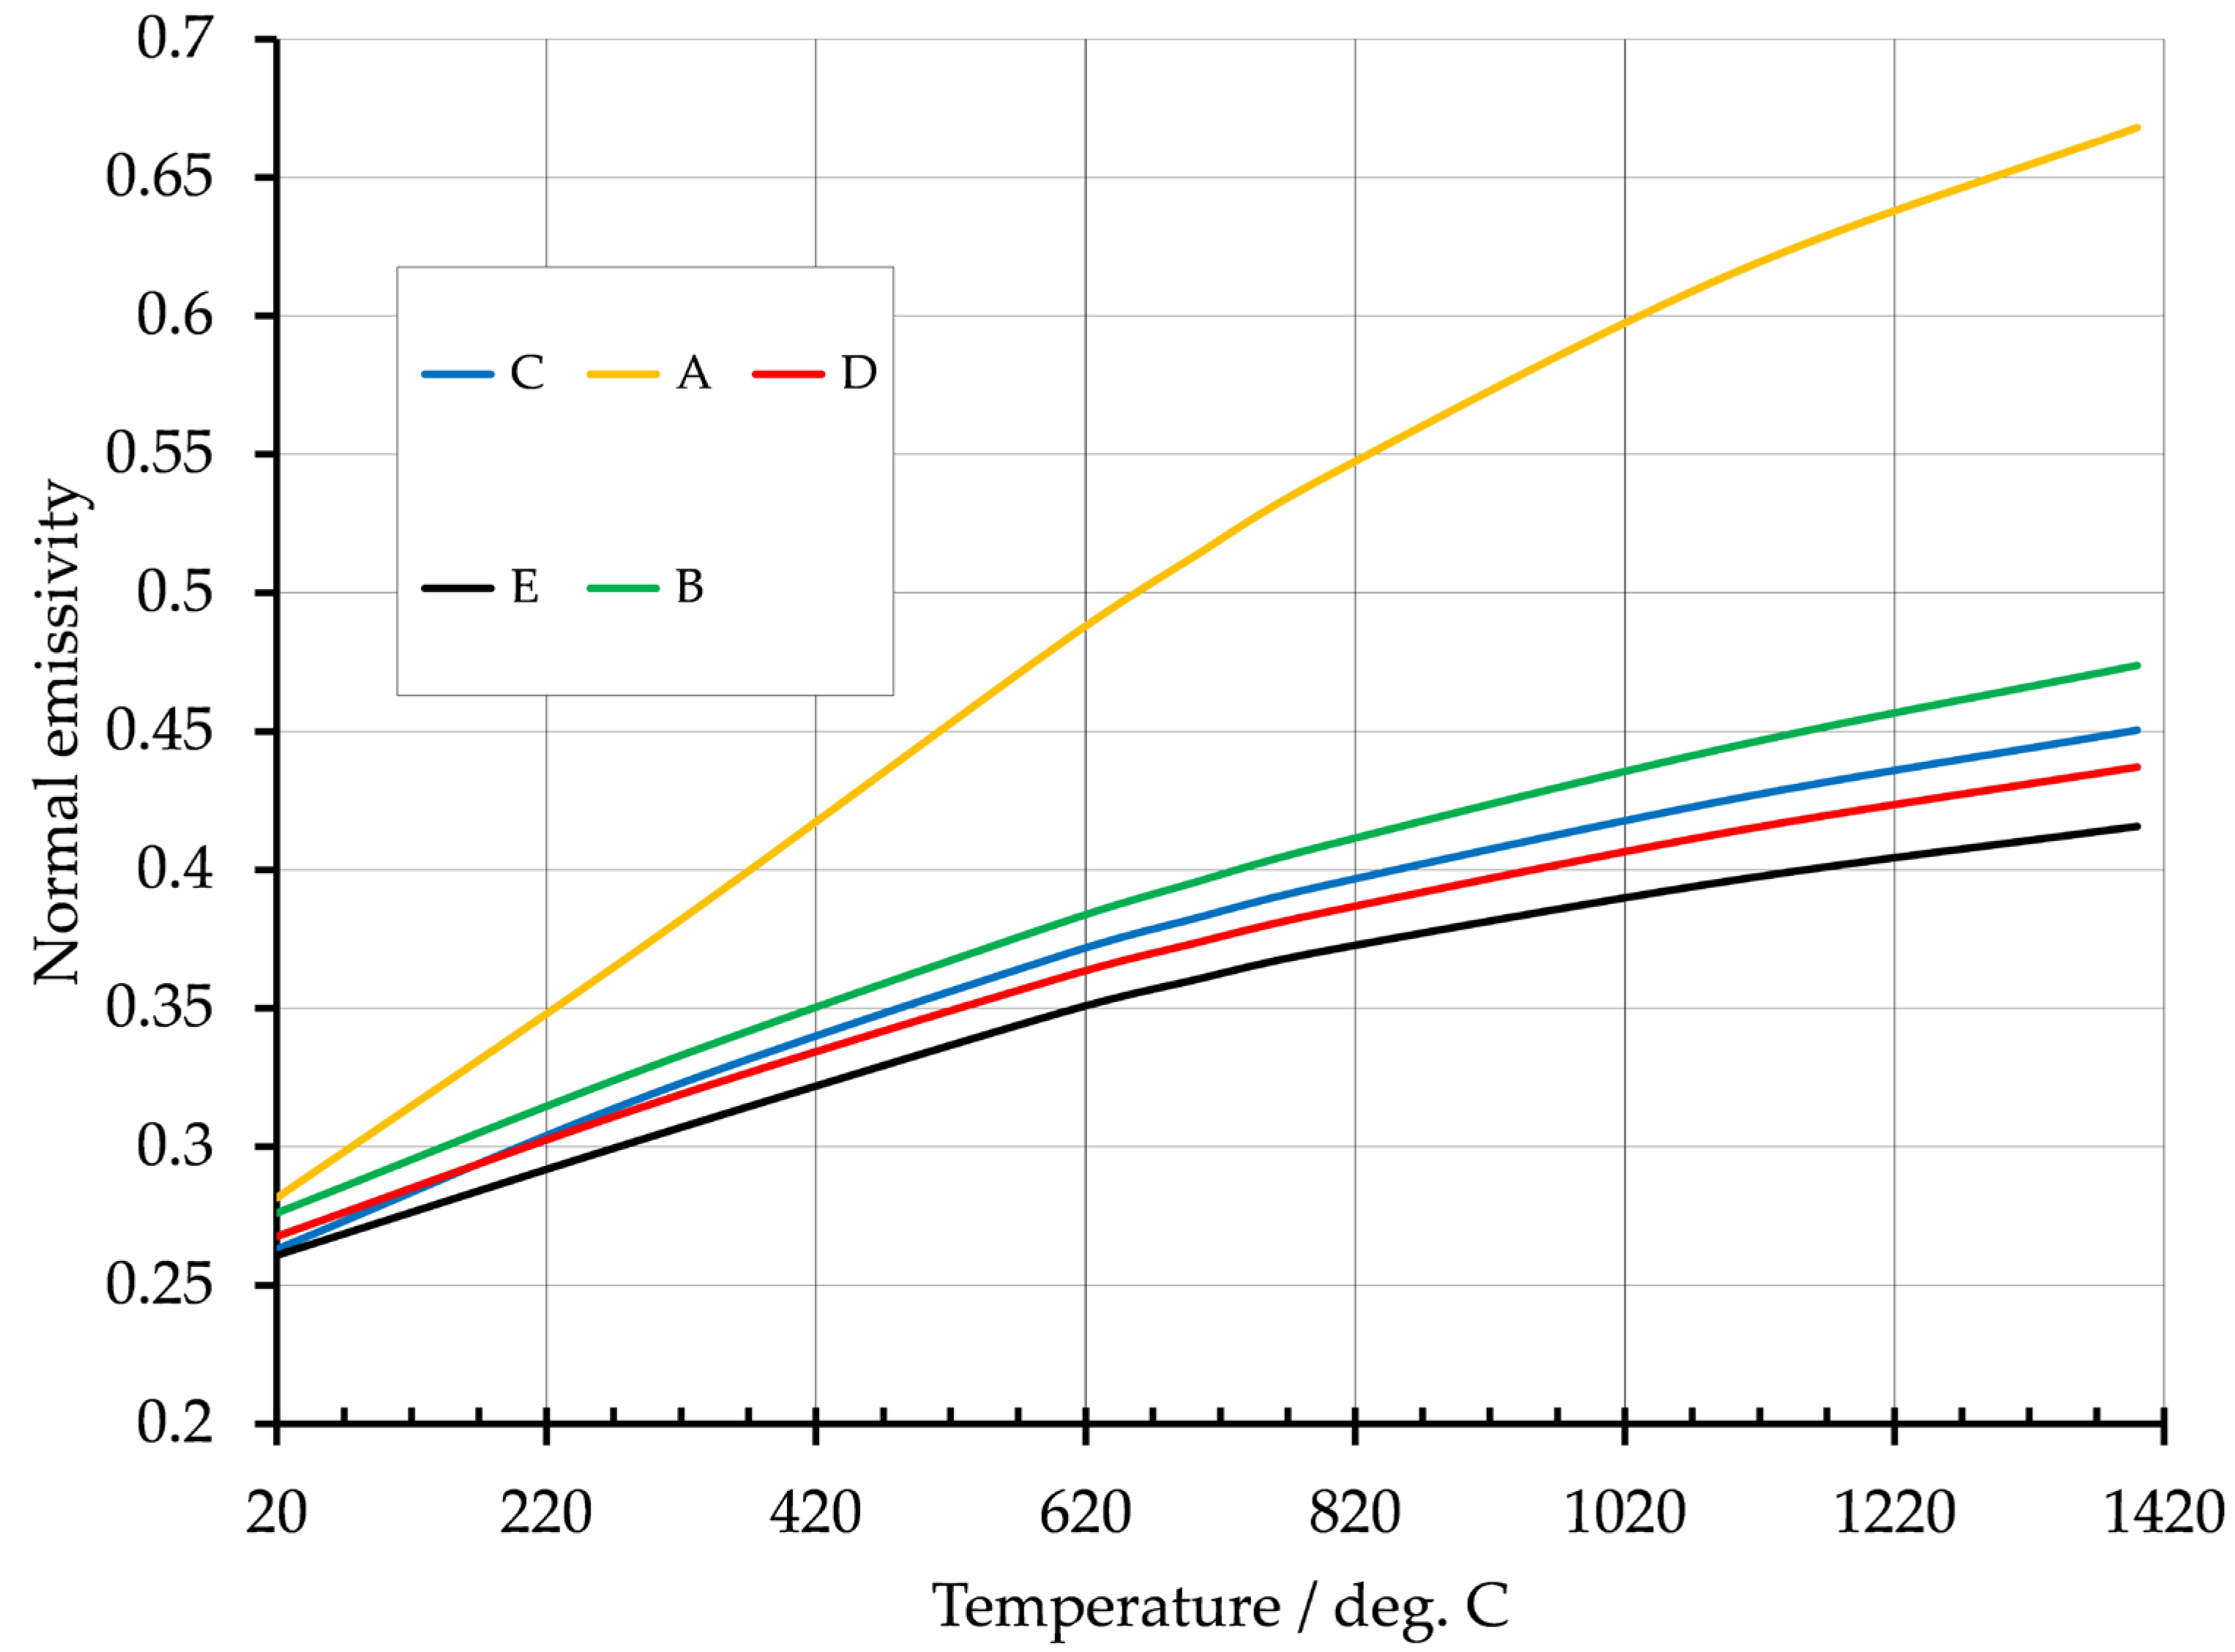
When the surface temperature of a metal increases, its emissivity can change, as its black body emission spectrum translates to shorter wavelengths, if there are significant wavelength dependent reflectance and surface absorption variations. The reflectance measurement method used in this study does not have the capability of varying the sample temperature within the spectrophotometer sphere and so the effect of temperature increases was approximated, by recalculating the emissivity at successively higher black body temperatures [32], using Equation (1) [43]. This approach assumes the reflectance/temperature properties of the underlying metal and any surface oxide layer are constant [28] and that micro-structural and/or phase changes in the metal are ignored [16]. The results from Table 5, calculated at higher black body temperatures, are shown in Figure 5. The temperature range was limited to the region where Ti-6Al-4V is solid as it is known there can be abrupt changes in emissivity in the solidus/liquidus region (~1650 °C) [16,19]. The curves shown in Figure 5 show the increasing emissivity of Ti-6Al-4V to both surface temperature [43] and residual oxygen level increases.
As the surface temperature increases, the black body emission peak translates from 10 µm to shorter wavelengths (~1.5 µm) which corresponds to regions on the sample reflectance curves which are comparatively low and the emissivity thus increases. Sample E has the smallest emittance change because its reflectance is higher over a wider wavelength. Sample A exhibits the highest emittance change because its reflectance reduces more rapidly than the other samples, especially below 6 µm in Figure 4b.
Table 1 shows the literature data for Ti-6Al-4V emissivity. Previous researchers have focused on emissivity measurement at very low oxygen levels. In this study, sample E deposited with less than 5 ppm oxygen in the argon shielding environment is the most comparable to their work. The range of emissivity values reported in the literature is 0.26–0.36, which is to be expected, as the measurement temperature ranges varies from 200 to 1487 °C. This study suggests a comparable range of 0.29–0.42 over a temperature range of 200–1400 °C. The gradient of the sample E emissivity curve in Figure 5 is representative of that seen in the published data, indicating the emissivity–temperature approximation can produce similar results.

4.2. Inconel 718, Mild Steel, Aluminum 2319, and NAB

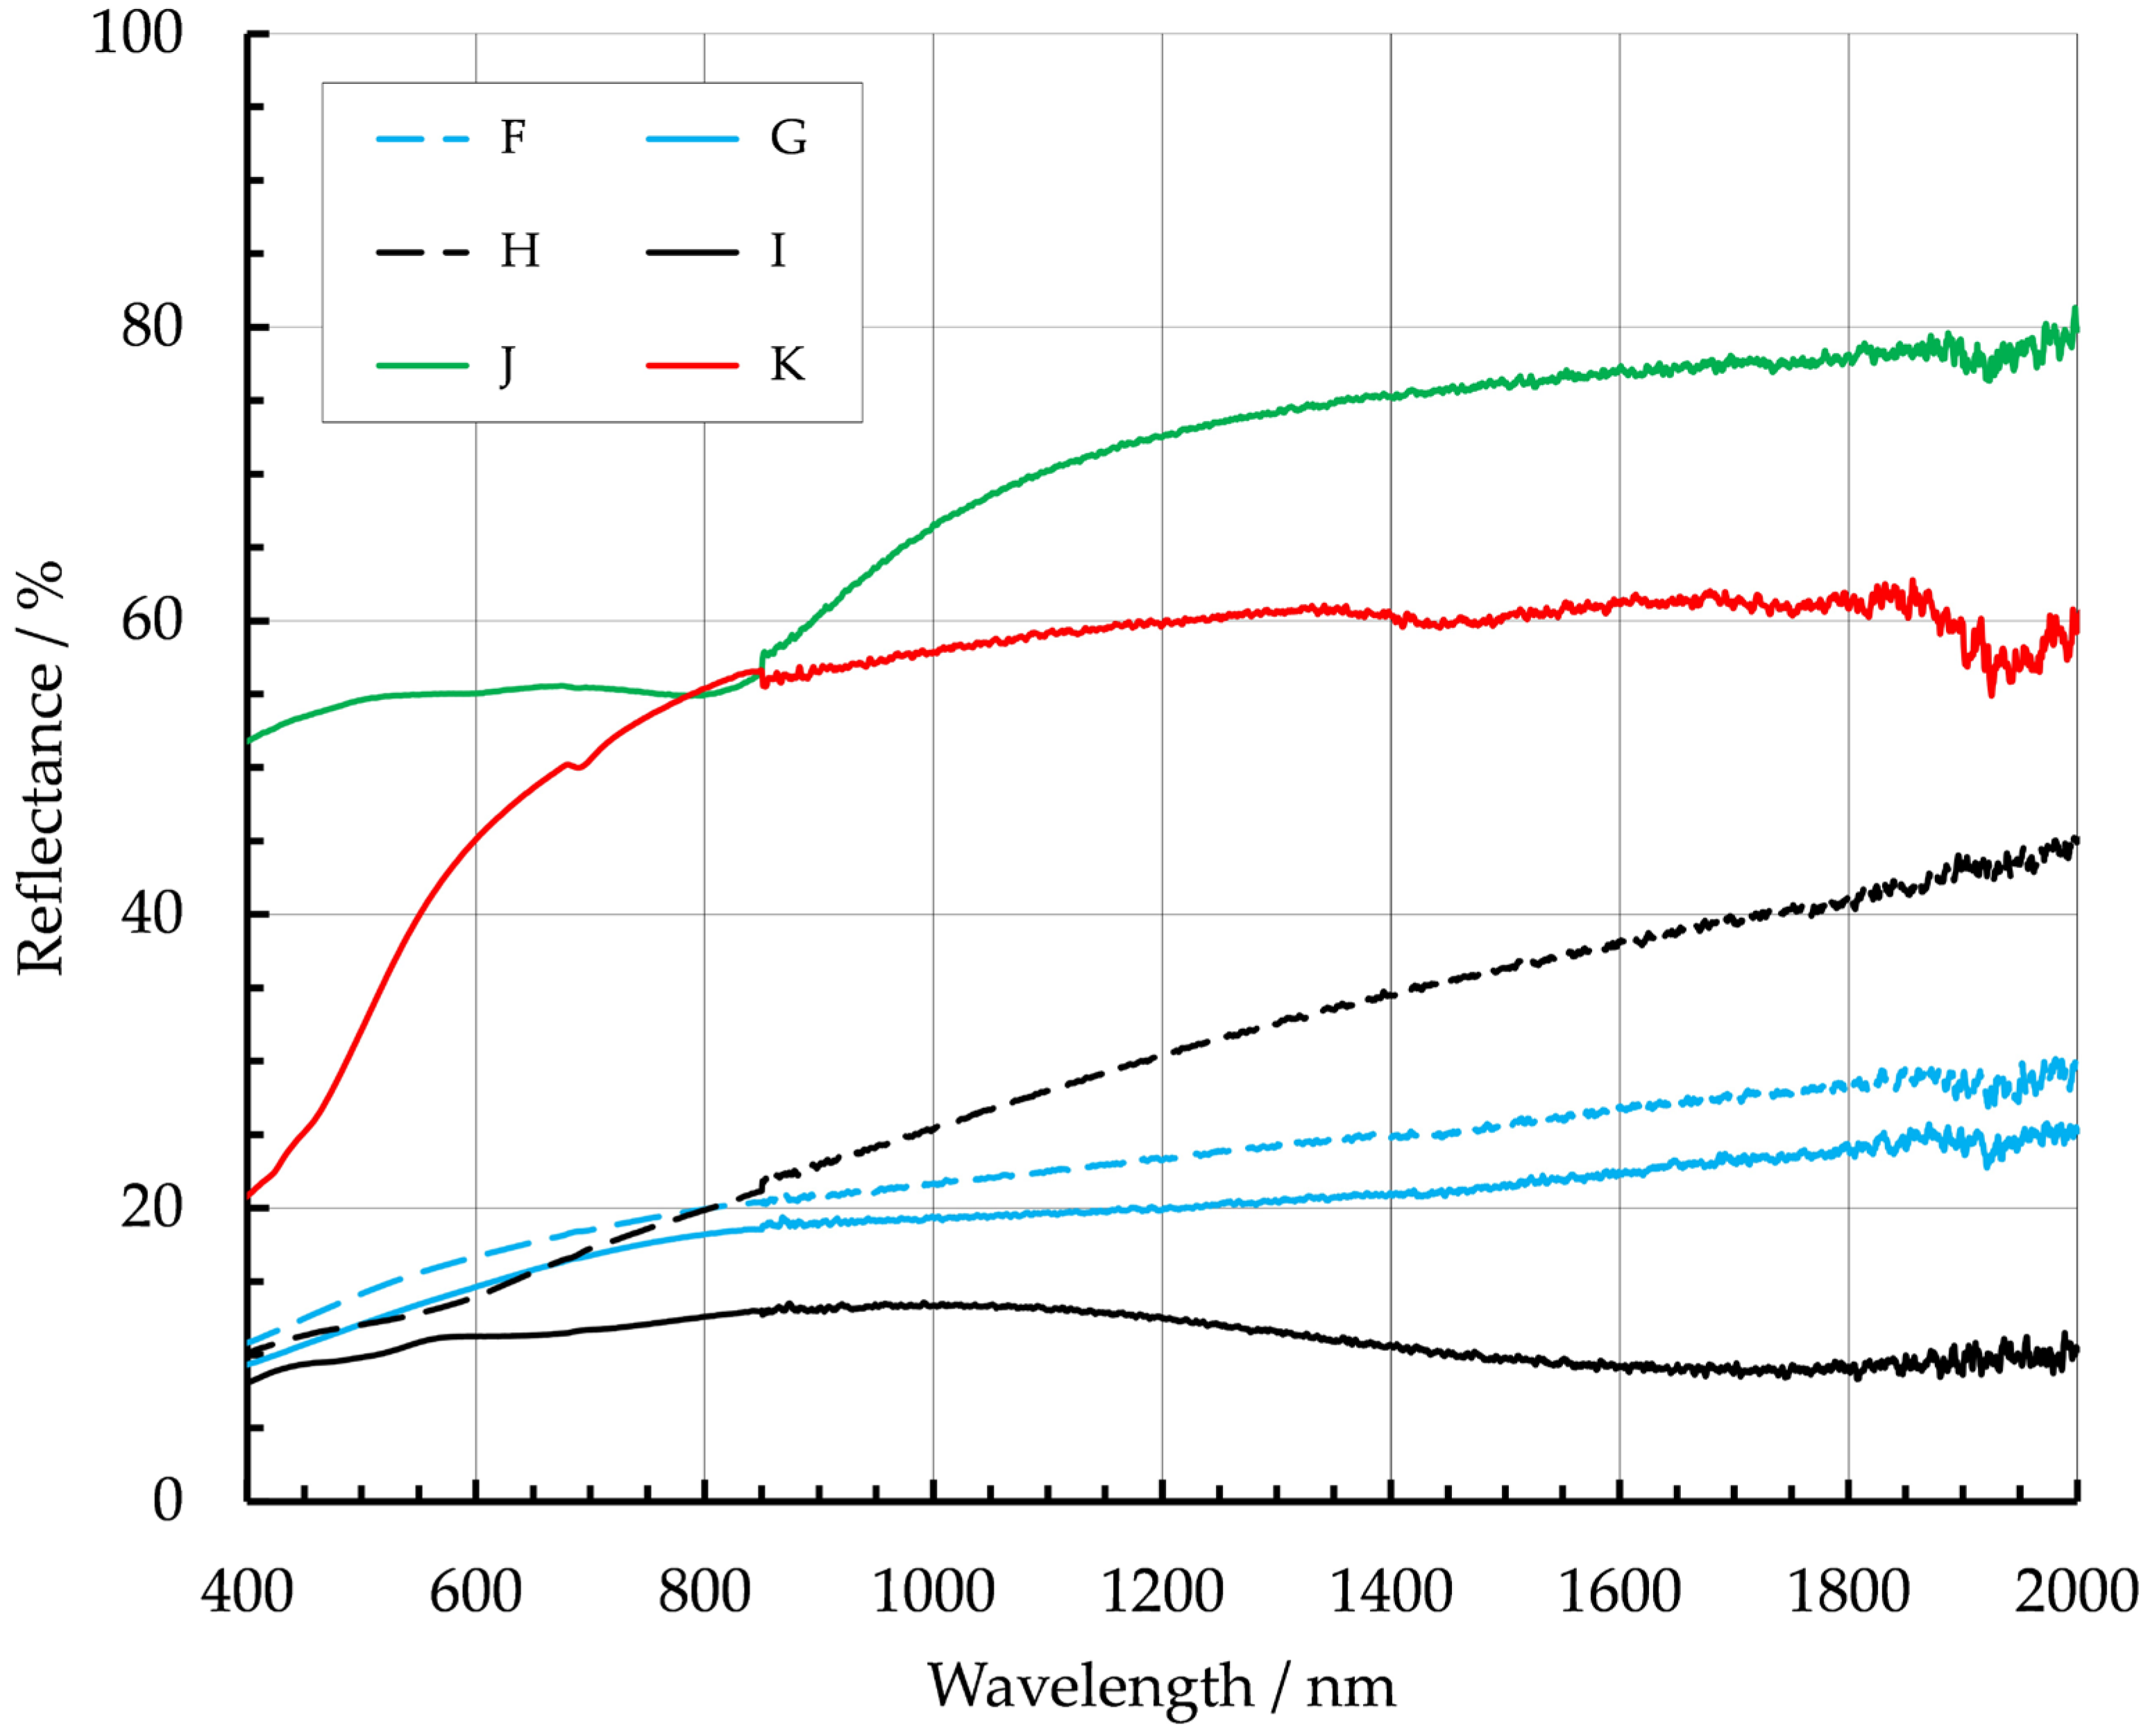
The visible and NIR reflectance of Inconel 718 and mild steel, deposited under differing oxygen levels, is shown in Figure 6. Aluminum 2319 and NAB samples are also shown in Figure 6 but with no variation in oxygen levels. The aluminum 2319 alloy has the highest reflectance of the samples but is lower than expected. This was most likely due to the formation of an aluminum oxide surface layer in combination with the ~6% copper present in this alloy, which lowers the reflectance in the visible spectrum. There is a dip in the reflectance at ~800 nm, which is typical for aluminum metal.
The highly oxidized mild steel sample (I—black solid line) has the lowest reflectivity both in the visible and NIR spectrum. This is indicative that a surface iron oxide layer has formed and is partially transparent and relatively thick at these wavelengths [27,29]. The less oxidized mild steel sample (H—black dashed line) has a higher reflectivity than I, which is indicative that the surface oxide layer is physically thinner and therefore has less optical absorption at these wavelengths. For Inconel 718, higher oxygen levels reduce the reflectance and hence increase the measured emissivity value. For both these materials, oxidation affects the NIR region more than the visible spectrum and suggests that temperature measurements should be undertaken using shorter wavelength detectors if possible. NAB has a relatively high constant reflectance curve over the NIR spectrum.
Using Equation (1) and these reflectance curves, Table 6 gives the calculated emissivity values for these metals at a black body temperature of 20 °C.
The reflectance curves shown in Figure 6 correlate well with Table 6, with higher sample reflectance associated with low emissivity, e.g., aluminum 2319 and NAB. The low reflectance samples being associated with higher-emissivity metals, e.g., oxidized Inconel 718 and oxidized mild steel. For the oxidized metals Inconel 718 and mild steel, the Inconel 718 samples are less sensitive to oxidation than mild steel, which exhibits an emissivity change from 0.4 to 0.72.
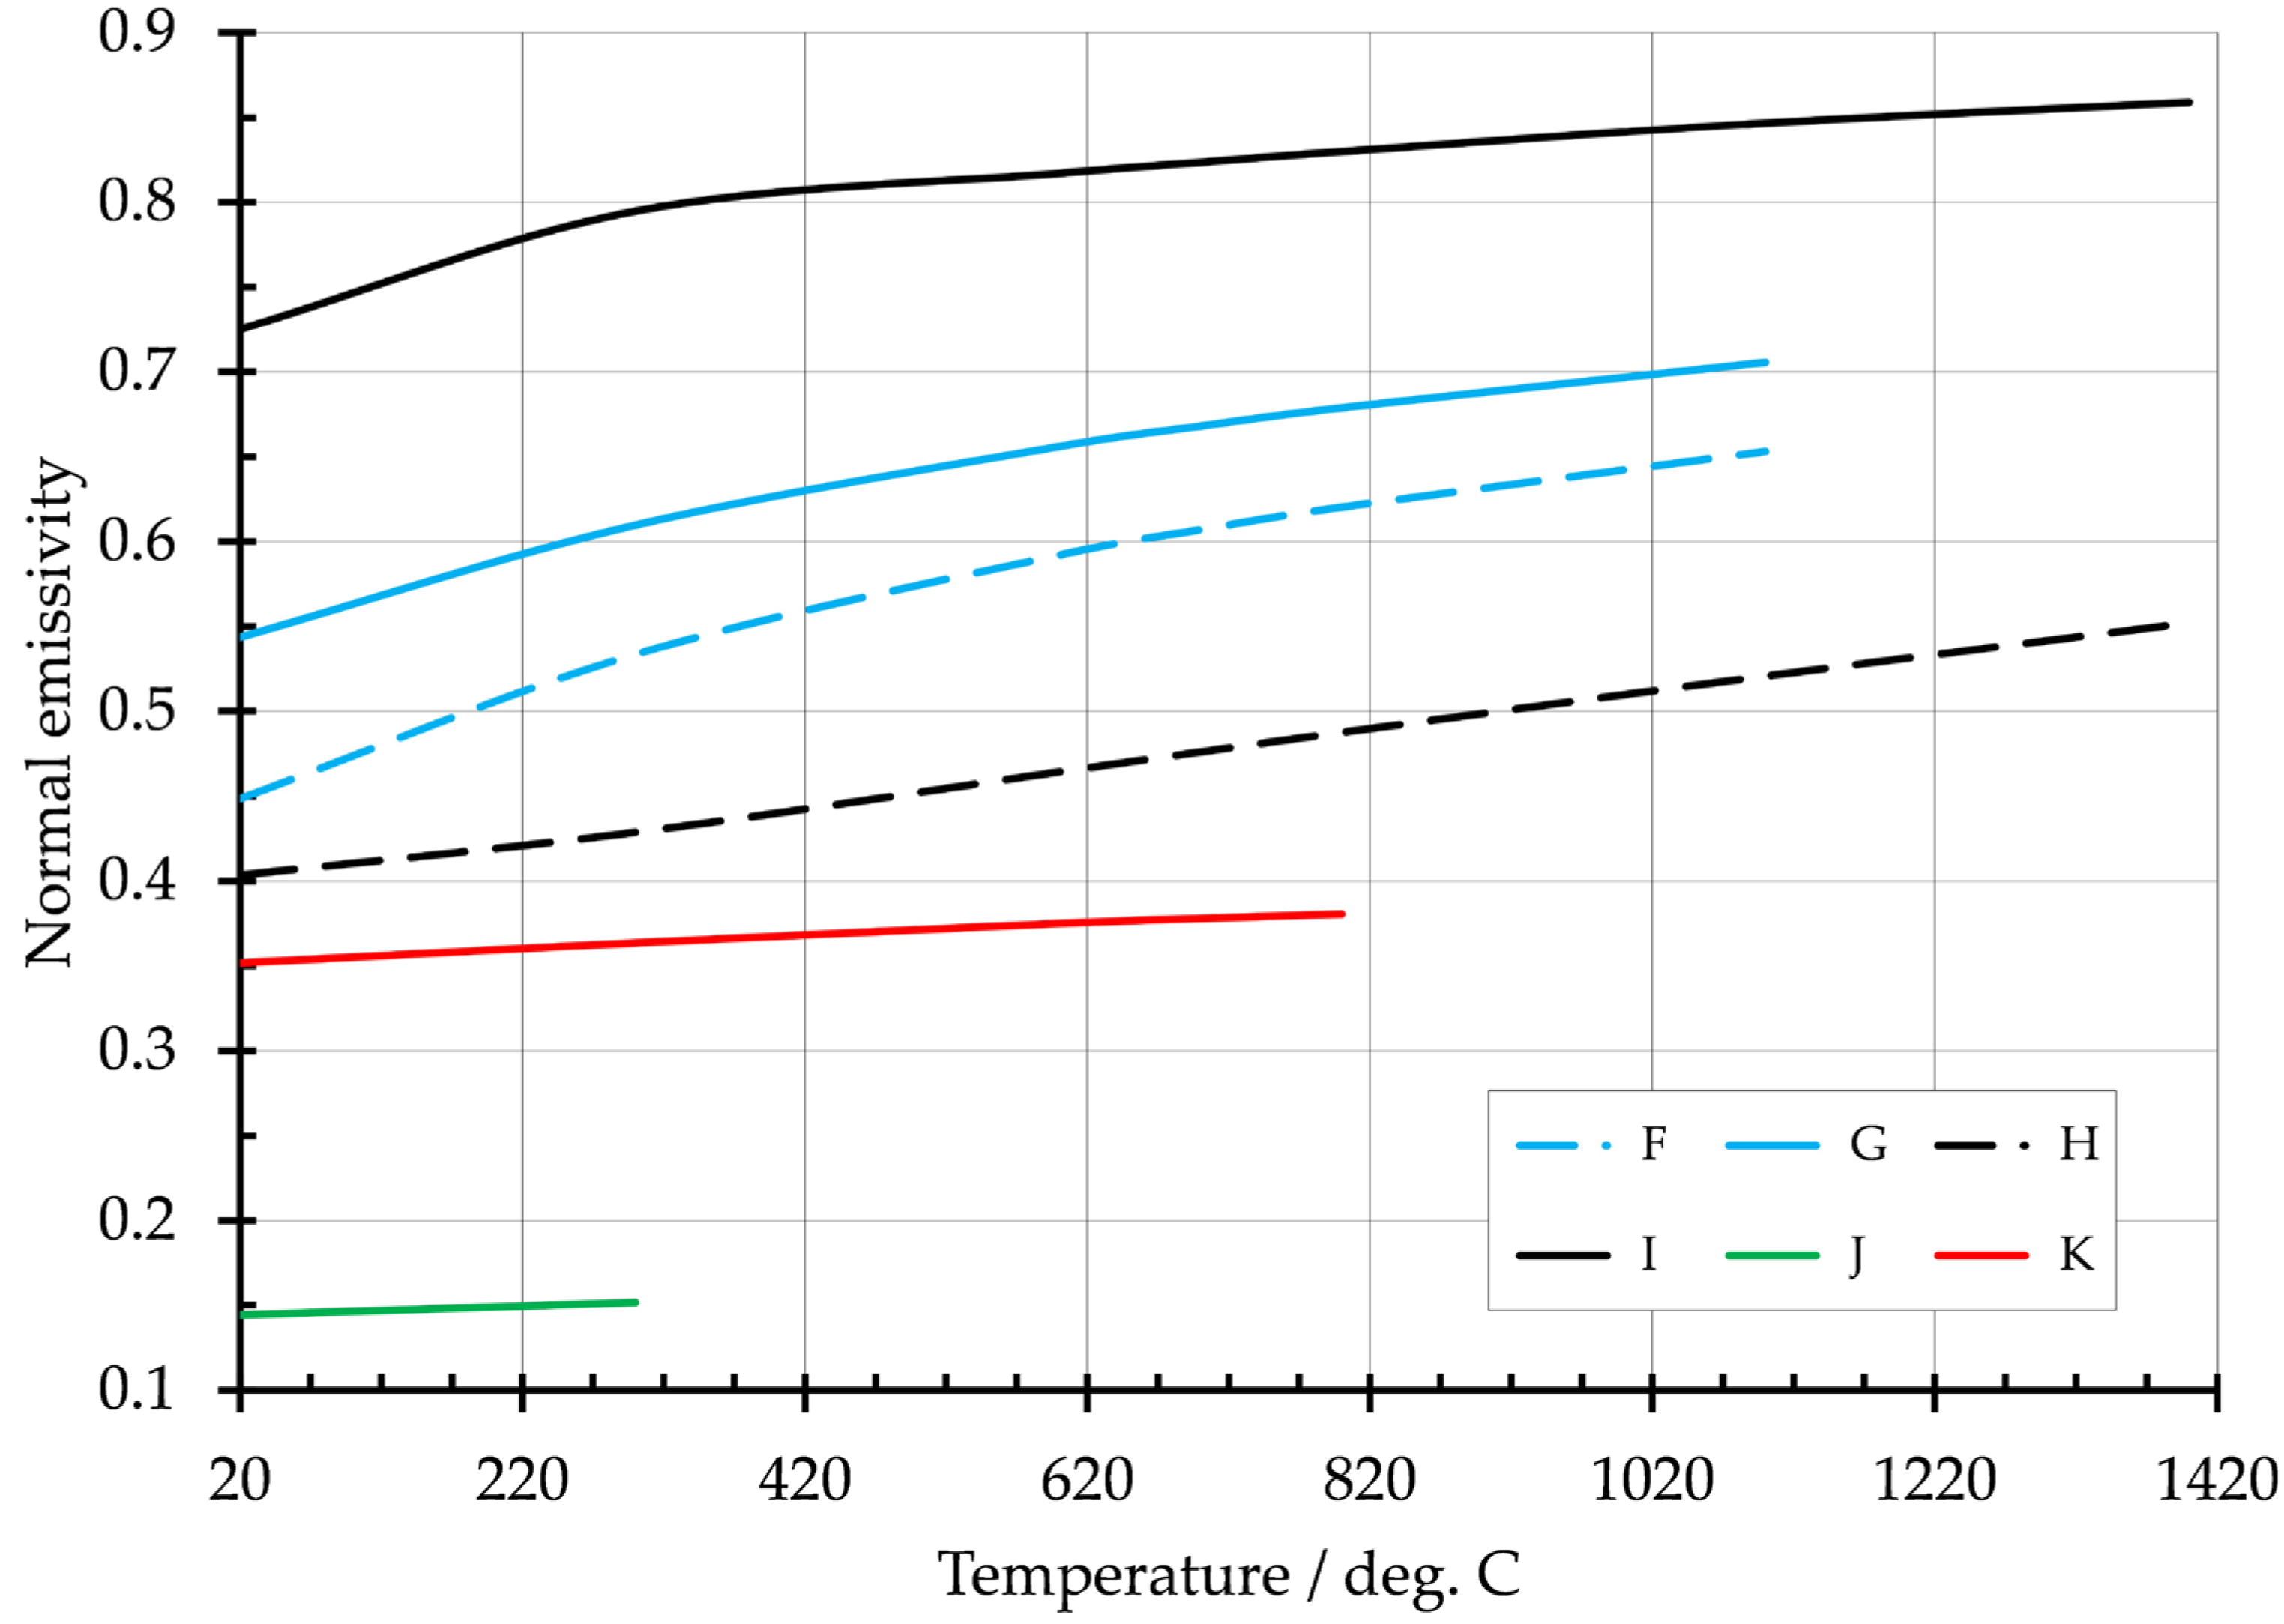
From the results shown in Table 6, the approximate emissivity as a function of temperature was then calculated for each metal and the results are shown in Figure 7. The background assumptions with this approach were discussed in Section 4.1. The samples exhibit, to varying degrees, increasing emissivity as their temperature increases due to a reduction in surface reflectivity at shorter wavelengths (Figure 6). The NAB and aluminum 2319 samples exhibit a minimal change in emissivity with temperature, as their reflectance is more constant with wavelength variation. Process oxidation markedly affects the emissivity of mild steel, but Inconel 718 to a lesser degree [25].
Sadiq et al. [29] measured the increase in mild steel emissivity in a progressively heated atmospheric environment (50–600 °C) and identified an emissivity transition region (~450 °C), which showed a step change in emissivity around this temperature.
Such an effect could not be observed in this study as the two specimens were separately manufactured in different argon gas environments using an AM deposition technique and heated to ~2500 °C during fabrication; thus there is no progressive increase in temperature. It is difficult to compare the magnitude of the emissivity values derived from these two studies as the gas environment and sample processing temperatures are dissimilar. The gas environment, fabrication temperature, and processing time interval influences the degree of surface oxidation and directly impacts on the emissivity value for mild steel. That said, the emissivity values follow the same trend and are comparable for both studies. In Sadiq’s work the measured emissivity was 0.28 below 380 °C, whereas in this study, it was 0.4 (sample H). At temperatures above 520 °C, Sadiq measured the emissivity to be 0.69, whereas in this study, the calculated emissivity is 0.82 (sample I) at 520 °C. Table 1 summarizes the mild steel results achieved by Touloukian et al. and Wade and illustrates the same trend and emissivity values.
As no emissivity data on aluminum 2319 alloy could be identified in the literature, data on oxidized aluminum coating on glass (Jones et al. [26]) was used as a comparison. It was expected that the emissivity of the alloy would be higher than oxidized pure aluminum, due to the alloy having an addition of 6.3% copper, which should reduce reflectance in the visible spectrum. However, both metals had a similar average emissivity of ~0.15. No emissivity data could be found in the literature for the NAB alloy, as a comparison.
Both the highly oxidized and less oxidized Inconel 718 samples have higher emissivites at 20 °C than Keller et al. [23] and Curry et al. [24] in Table 1. This may be due to the surface finish of the components, as one was in sheet form and the other was highly polished. However, the results from the Inconel 718 samples are comparable with the components measured by Li et al., which were additively manufactured and oxidized. Over the 700–1000 °C range, which Li et al. [25] took measurements; Figure 7 curve G (blue solid line) suggests the emissivity variation will be 0.67–0.7. This compares well with the Li-measured range of 0.55–0.7. It also appears from the existing literature and this study that ~0.71 is the typical upper value for the emissivity of this material at ~1100 °C.
The results from this study compare well with the literature (Table 1) and provide process specific emissivity values for these metals. This data is most useful when developing accurate thermal models for DED-Arc processes and using optical pyrometers and thermal cameras for in-process temperature measurements.

5. Conclusions

The emissivity of metals commonly used in DED-Arc processes have been measured using the spectrophotometer technique. The results are summarized in Table 1 and compared to the results obtained by other researchers. For the first time, the test samples were fabricated using typical AM deposition parameters and processes. The effect of residual oxygen in the argon shielding gas on emissivity values was explored for some of the materials. Approximate emissivity values at higher temperatures are also given and compare well to published data. The results for Ti-6Al-4V provide a more complete understanding of the interplay between emissivity, residual oxygen and surface temperature. The results obtained for aluminum 2319 and NAB are new, as limited information has been published for these materials. The emissivity data from this study can be used when accurate finite element thermal modeling of DED-Arc processes is required. The reflectance curves presented in Section 4 can also be used by process engineers as spectral emissivity data when using pyrometers for precise in-process temperature measurements. In both cases, this results in improvements in the accuracy of thermal measurements, with concomitant improvements in the overall quality of the finished parts.

Author Contributions

Conceptualization, K.M. and R.P.T.; methodology, K.M.; validation, K.M.; formal analysis, K.M.; investigation, K.M.; resources, R.P.T.; data curation, K.M.; writing—original draft preparation, K.M.; writing—review and editing, K.M. and R.P.T.; visualization, K.M.; supervision, R.P.T.; project administration, R.P.T.; funding acquisition, R.P.T. All authors have read and agreed to the published version of the manuscript.

Funding

The authors acknowledge support from the Engineering and Physical Sciences Research Council (EPSRC), UK under grant EP/R027218/1, New Wire Additive Manufacturing (NEWAM).

Data Availability Statement

The original contributions presented in the study are included in the article, further data inquiries should be directed to the corresponding author.

Acknowledgments

The authors also thank the technical support from the staff and NAB samples from R. Biswal and V. Selvakumar of the Welding Engineering and Laser Processing Centre, Cranfield University.

Conflicts of Interest

The authors declare no conflict of interest.

References

  1. Frazier, W.E. Metal additive manufacturing: A review. J. Mater. Engin. Perform. 2014, 23, 1917–1928. [Google Scholar] [CrossRef]
  2. Williams, S.W.; Martina, F.; Addison, A.C.; Ding, J.; Pardal, G.; Colegrove, P. Wire + Arc additive manufacturing. Mater. Sci. Technol. 2016, 32, 641–647. [Google Scholar] [CrossRef]
  3. Xu, F.; Dhokia, V.; Colegrove, P.; McAndrew, A.; Williams, S.; Henstridge, A.; Newman, S.T. Realisation of a multi-sensor framework for process monitoring of the wire arc additive manufacturing in producing Ti-6Al-4V parts. Int. J. Comput. Integr. Manuf. 2018, 31, 785–798. [Google Scholar] [CrossRef]
  4. Wang, C.; Suder, W.; Ding, J.; Williams, S. Wire based plasma arc and laser hybrid additive manufacture of Ti-6Al-4V. J. Mater. Process. Technol. 2021, 293, 117080. [Google Scholar] [CrossRef]
  5. Ding, J.; Colegrove, P.; Martina, F.; Williams, S.; Wiktorowicz, R.; Palt, M.R. Development of a laminar flow local shielding device for wire+arc additive manufacture. J. Mater. Process. Technol. 2015, 226, 99–105. [Google Scholar] [CrossRef]
  6. Köhler, M.; Fiebig, S.; Hensel, J.; Dilger, K. Wire and arc additive manufacturing of aluminum components. Metals 2019, 9, 608. [Google Scholar] [CrossRef]
  7. Seow, C.E.; Coules, H.E.; Wu, G.; Khan, R.H.U.; Xu, X.; Williams, S.W. Wire + Arc Additively Manufactured Inconel 718: Effect of post-deposition heat treatments on microstructure and tensile properties. Mater. Des. 2019, 183, 108157. [Google Scholar] [CrossRef]
  8. Caballero, A.; Ding, J.; Ganguly, S.; Williams, S. Wire + Arc Additive Manufacture of 17-4 PH stainless steel: Effect of different processing conditions on microstructure, hardness, and tensile strength. J. Mater. Process. Technol. 2019, 268, 54–62. [Google Scholar] [CrossRef]
  9. WAAMMat, Recapitulation of Mechanical Properties. Available online: https://waammat.com/documents/recap-of-waam-mechanical-properties (accessed on 20 June 2023).
  10. Lunt, D.; Ho, A.; Davies, A.; Harte, A.; Martina, F.; Quinta da Fonseca, J.; Prangnell, P. The effect of loading direction on strain localization in wire arc additively manufactured Ti-6Al-4V. Mater. Sci. Engin. A 2020, 788, 139608. [Google Scholar] [CrossRef]
  11. Davis, A.; Kennedy, J.; Ding, J.; Prangnell, P. The effect of processing parameters on rapid-heating β recrystallization in inter-pass deformed Ti-6Al-4V wire-arc additive manufacturing. Mater. Charact. 2020, 163, 110298. [Google Scholar] [CrossRef]
  12. da Silva, L.J.; Reis, R.P.; Scotti, A. The Potential of IR Pyrometry for Monitoring Interpass Temperature in Wire + Arc Additive Manufacturing. Evol. Mech. Eng. 2019, 3, 1–4. [Google Scholar] [CrossRef]
  13. Ren, C.G.; Lo, Y.; Tran, H.C.; Lee, M.H. Emissivity calibration method for pyrometer measurement of melting pool temperature in selective laser melting of stainless steel 316L. Int. J. Adv. Manuf. Technol. 2019, 105, 637–649. [Google Scholar] [CrossRef]
  14. Gulyaev, I.P.; Dolmatov, A.V. Spectral-brightness pyrometry: Radiometric measurements of non-uniform temperature distributions. Int. J. Heat Mass Transf. 2018, 116, 1016–1025. [Google Scholar] [CrossRef]
  15. Araujo, A. Multi-spectral pyrometry—A review. Meas. Sci. Technol. 2017, 28, 082002. [Google Scholar] [CrossRef]
  16. Valencia, J.J.; Quested, P.N. Thermophysical Properties. In ASM Handbook, 15: Casting; ASM International: Materials Park, OH, USA, 2008; pp. 468–481. [Google Scholar]
  17. Teng, S.; Dehgahi, S.; Henein, H.; Wolfe, T.; Qureshi, A. Effect of surface texture, viewing angle, and surface condition on the emissivity of wire arc directed energy deposition manufactured 7075 nano treated aluminium alloy. Int. J. Adv. Manuf. Technol. 2023, 126, 2175–2189. [Google Scholar] [CrossRef]
  18. Turquais, B.; Sans, J.L.; Davoust, L.; Delacroix, J.; Journeau, C.; Piluso, P.; Chikhi, N. Pyroreflectometry as a technique for the accurate measurement of very high temperatures in molten materials. Rev. Sci. Instrum. 2022, 93, 094901. [Google Scholar] [CrossRef]
  19. Hagqvist, P.; Sikström, F.; Christiansson, A.K. Emissivity estimation for high temperature radiation pyrometry on Ti-6Al-4V. Measurement 2013, 46, 871–880. [Google Scholar] [CrossRef]
  20. Shur, B.A.; Peletskii, V.E. The effect of alloying additions on the emissivity of titanium in the neighborhood of polymorphous transformation. High Temp. 2004, 42, 414–420. [Google Scholar] [CrossRef]
  21. Mohr, M.; Wunderlich, R.; Novakovic, R.; Ricci, E.; Fecht, H.J. Precise Measurements of Thermophysical Properties of Liquid Ti-6Al-4V (Ti64) Alloy On Board the International Space Station. Adv. Eng. Mater. 2020, 22, 2000169. [Google Scholar] [CrossRef]
  22. Baier, D.; Weckenmann, T.; Wolf, F.; Wimmer, A.; Zaeh, M.F. Underlying Methodology for a Thermal Process Monitoring System for Wire and Arc Additive Manufacturing. J. Manuf. Mater. Process. 2023, 7, 10. [Google Scholar] [CrossRef]
  23. Keller, B.P.; Nelson, S.E.; Walton, K.L.; Ghosh, T.K.; Tompson, R.V.; Loyalka, S.K. Total hemispherical emissivity of Inconel 718. Nucl. Eng. Des. 2015, 287, 11–18. [Google Scholar] [CrossRef]
  24. Curry, E.B.; Sahoo, S.; Herrara, C.; Sochnikov, I.; Pamir Alpay, S.; Herbert, R.J.; Willis, B.G.; Qi, J.; Handcock, J.N. Optical response of nickel-based super alloy Inconel-718 for applications in additive manufacturing. J. Appl. Phys. 2020, 127, 245111. [Google Scholar] [CrossRef]
  25. Li, Y.; Li, L.; Yu, K.; Liu, Y.; Liu, Y. Emissivity measurement device for manufactured parts based on induction heating. Appl. Therm. Eng. 2025, 279, 127648. [Google Scholar] [CrossRef]
  26. Jones, J.M.; Mason, P.E.; Williams, A. A compilation of data on the radiant emissivity of some materials at high temperatures. J. Energy Inst. 2019, 92, 523–534. [Google Scholar] [CrossRef]
  27. Wade, W. Measurements of total hemispherical emissivity of various oxidized metals at high temperature. In National Advisory Committee for Aeronautics; TN 4206; Langley Aeronautical Laboratory: Hampton, VA, USA, 1958. [Google Scholar]
  28. Touloukian, Y.; DeWitt, D. Thermal radiative properties of metallic elements and alloys. In Thermophysical Properties of Matter—The TPRC Data Series; Defence Technical Information Center: Fort Belvoir, VA, USA, 1970; Volume 7. [Google Scholar]
  29. Sadiq, H.; Wong, M.B.; Tashan, J.; Al-Mahaidi, R.; Zhao, X.-L. Determination of Steel Emissivity for the Temperature Prediction of Structural Steel Members in Fire. J. Mater. Civ. Eng. 2013, 25, 167–173. [Google Scholar] [CrossRef]
  30. Dharmendra, C.; Hadadzadeh, A.; Amirkhiz, B.S.; Janaki Ram, G.D.; Mohammadi, M. Microstructural evolution and mechanical behavior of nickel aluminum bronze Cu-9Al-4Fe-4Ni-1Mn fabricated through wire-arc additive manufacturing. Addit. Manuf. 2019, 30, 100872. [Google Scholar] [CrossRef]
  31. Murray, T.; Thomas, S.; Wu, Y.; Neil, W.; Hutchinson, C. Selective laser melting of nickel aluminum bronze. Addit. Manuf. 2020, 33, 101122. [Google Scholar] [CrossRef]
  32. Caballero, A.; Ding, J.; Bandari, Y.; Williams, S.W. Oxidation of Ti-6Al-4V during Wire and Arc Additive Manufacture. 3D Print. Addit. Manuf. 2019, 6, 91–98. [Google Scholar] [CrossRef]
  33. Xu, X.; Ding, J.; Ganguly, S.; Diao, C.; Williams, S.W. Oxide accumulation effects on wire + arc layer-by-layer additive manufacture process. J. Mater. Process. Technol. 2018, 252, 739–750. [Google Scholar] [CrossRef]
  34. Kauder, L. Spacecraft Thermal Control Coatings References, NASA/TP-2005-212792; NASA Center for Aerospace Information: Hanover, MD, USA, 2005. [Google Scholar]
  35. Giulietti, N.; Cosoli, G.; Napolitano, R.; Pandarese, G.; Revel, G.M.; Chiariotti, P. Spectral emissivity measurement for high-temperature applications: A systematic review. Acta IMEKO 2025, 14, 1–17. [Google Scholar] [CrossRef]
  36. Diamanti, M.V.; Del Curto, B.; Pedeferri, M.P. Interference colours of thin oxide layers on titanium. Colour Res. Appl. 2008, 33, 221–228. [Google Scholar] [CrossRef]
  37. Bauer, W.; Moldenhauer, A.; Rogge, F. Influence of a growing oxide layer on band-emissivities used for optical temperature measurements. In Thermosense XXXI; Proceedings of SPIE; SPIE: Bellingham, WA, USA, 2009; Volume 7299, pp. 1–3. [Google Scholar] [CrossRef]
  38. Thiessen, R.G.; Bocharova, E.; Mattissen, D.; Sebald, R. Temperature measurement deviation during annealing of multiphase steels. Metall. Mater. Trans. B Process Metall. Mater. Process. Sci. 2010, 41, 857–863. [Google Scholar] [CrossRef]
  39. Selvi, S.; Vishvaksenan, A.; Rajasekar, E. Cold metal transfer (CMT) technology—An overview. Def. Technol. 2018, 14, 28–44. [Google Scholar] [CrossRef]
  40. Bento, J.B.; Wang, C.; Ding, J.; Williams, S.W. Process Control Methods in Cold Wire Gas Metal Arc Additive Manufacturing. Metals 2023, 13, 1334. [Google Scholar] [CrossRef]
  41. Usategui, L.; López-Ferreño, I.; Echániz, T.; Sainz-Menchón, M.; Musi, M.; Clemens, H.; López, G.A. Emissivity measurements conducted on intermetallic γ-TiAl-based alloys for aeronautical applications. J. Mater. Res. Technol. 2023, 27, 3170–3179. [Google Scholar] [CrossRef]
  42. Hsu, C.P.S. Infrared spectroscopy. In Handbook of Instrumental Techniques for Analytical Chemistry; Settle, F., Ed.; Prentice Hall PTR: Englewood Cliffs, NJ, USA, 1997; pp. 249–277. [Google Scholar]
  43. Watanabe, M.; Funada, S.; Ohtsuka, M.; Adachi, M.; Fukuyama, H. Density, Normal Spectral Emissivity, Heat Capacity, and Thermal Conductivity of the Ti6Al4V Melt Measured by Electromagnetic Levitation with a Static Magnetic Field. Int. J. Thermophys. 2025, 46, 1–22. [Google Scholar] [CrossRef]
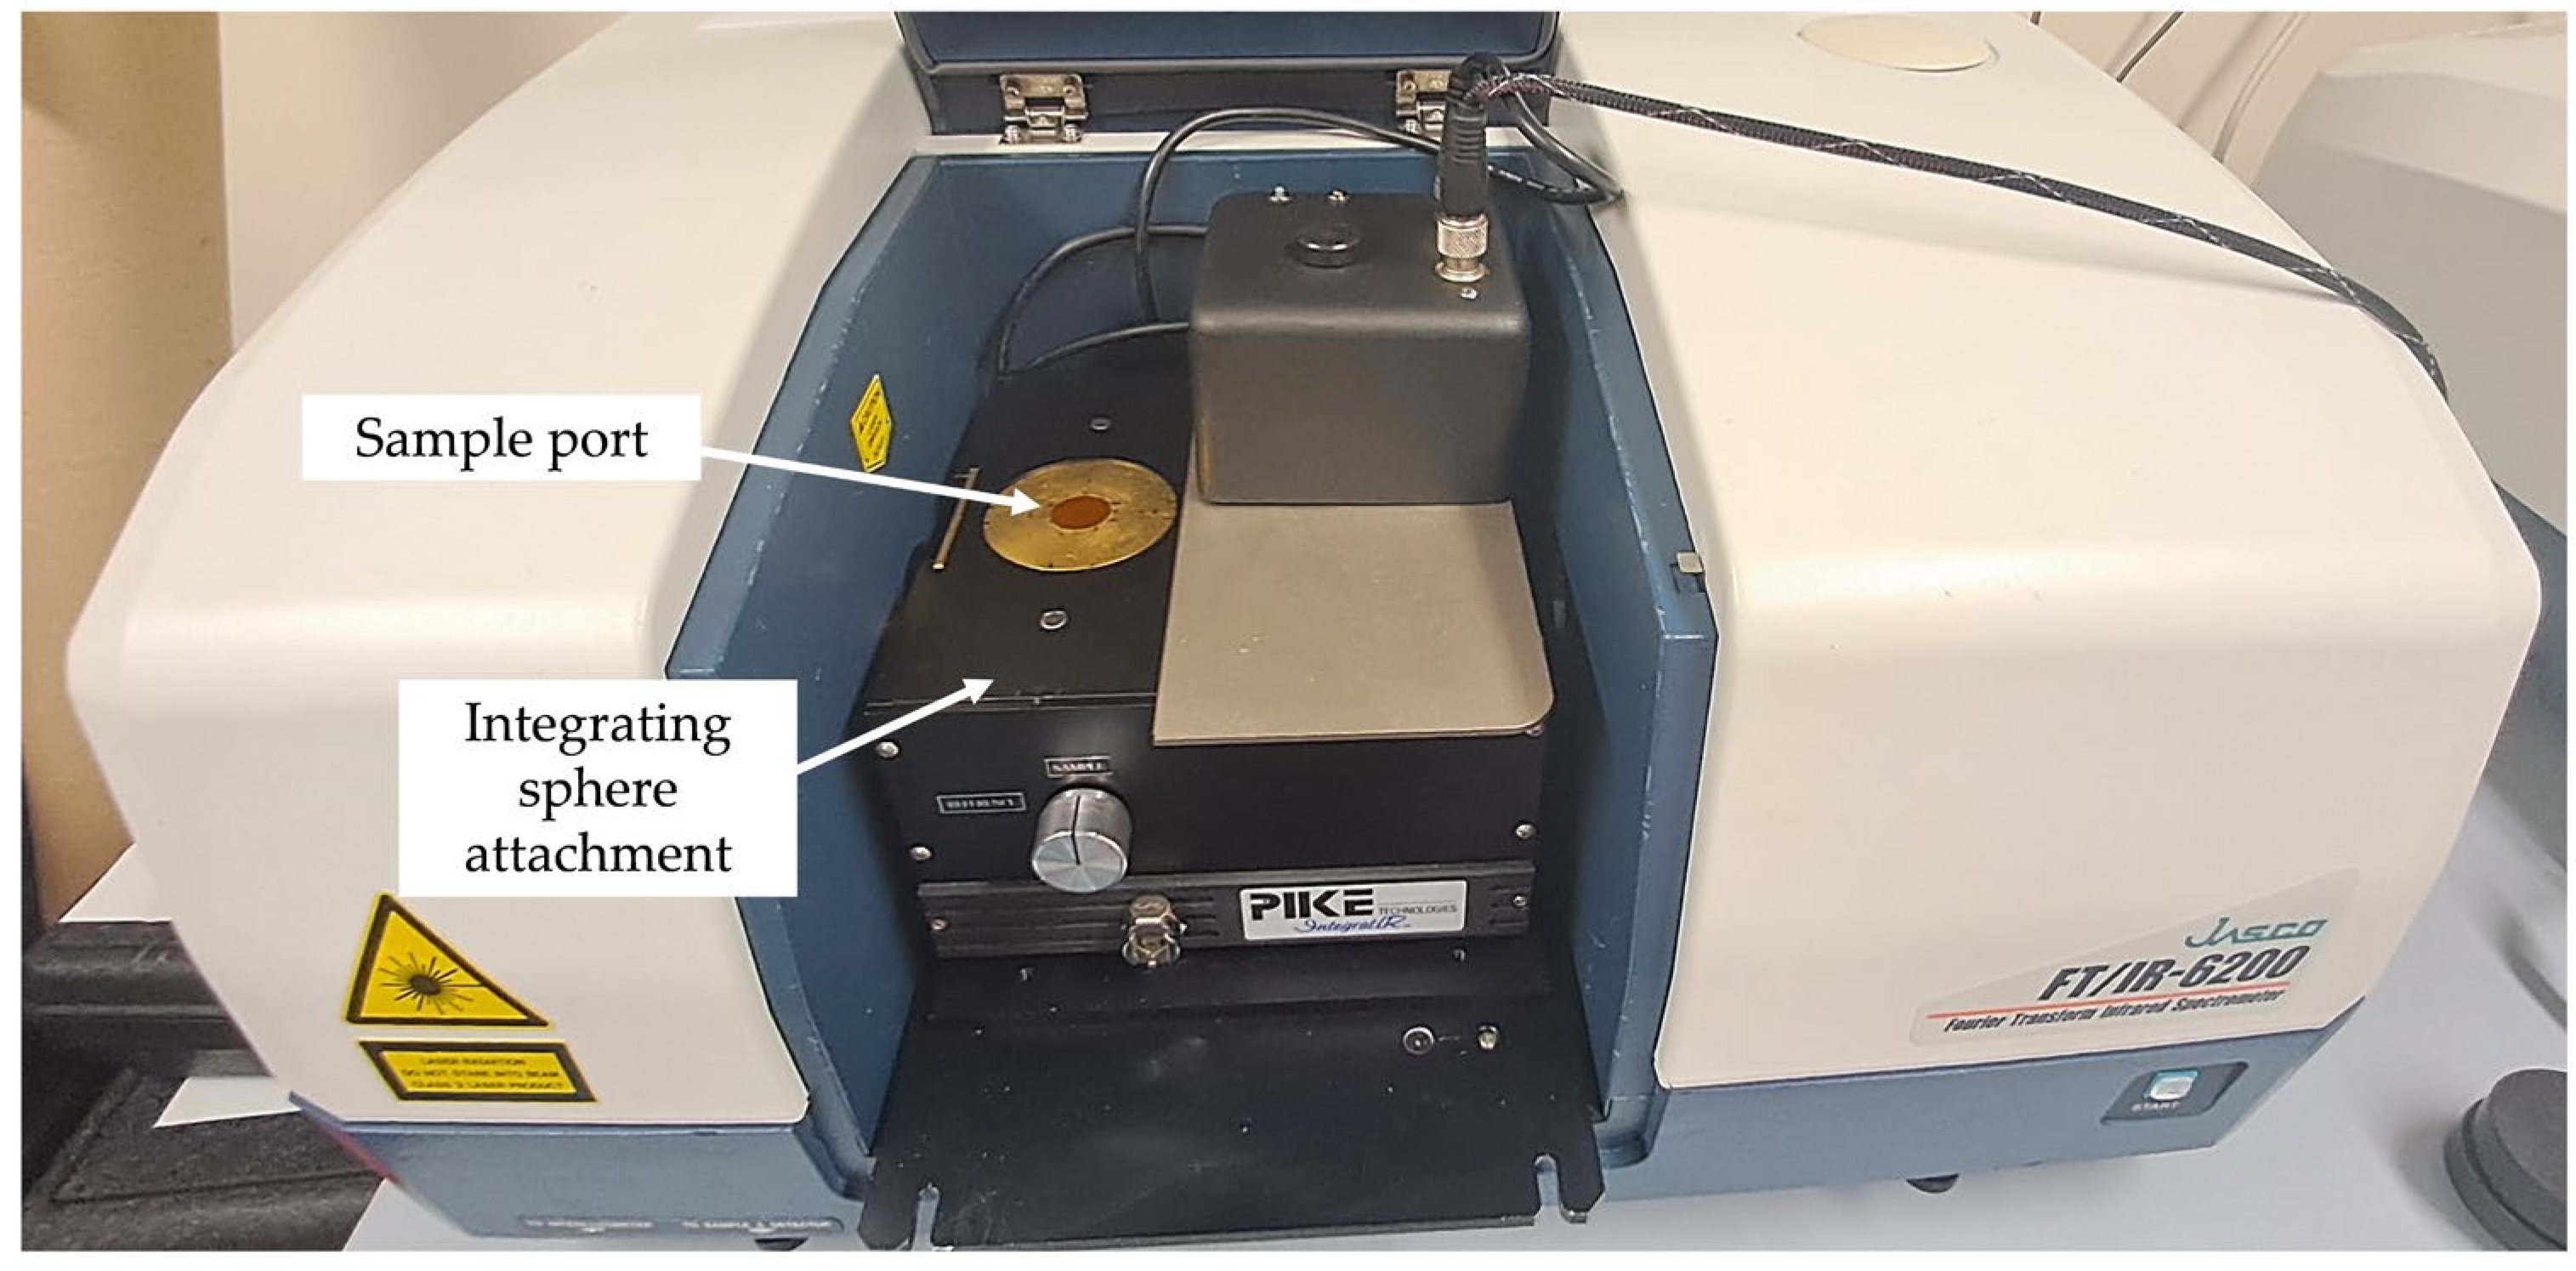
Figure 1. FTIR 6200 spectrometer used for measuring surface reflectivity.
Metals 15 01078 g001
Figure 2. (a) shows the DED-Arc arrangement used to fabricate the AM samples. (b) shows the oscillation path of the plasma torch. (c) Schematic of the AM experimental arrangement showing process control elements.
Metals 15 01078 g002aMetals 15 01078 g002b
Figure 3. (a) Three-layer Ti-6Al-4V weld. Sample E was EDM cut from the indicated blue square, dimensions 25 × 25 mm. (b) Images of Ti-6Al-4V samples with differing levels of oxygen ((A)—1850 ppm, (B)—85 ppm, (C)—12 ppm, (D)—5 ppm, (E)—<5 ppm) in the environment. Sample dimensions are 25 × 25 mm.
Metals 15 01078 g003
Figure 4. (a) Visible and NIR reflectance of Ti-6Al-4V samples with differing levels of oxygen (A—1850 ppm, B—85 ppm, C—12 ppm, D—5 ppm, E—<5 ppm) in the deposition environment. (b) IR reflectance of Ti-6Al-4V samples with differing levels of oxygen (A—1850 ppm, B—85 ppm, C—12 ppm, D—5 ppm, E—<5 ppm) in the deposition environment.
Metals 15 01078 g004
Figure 5. Emissivity of Ti-6Al-4V with differing levels of oxygen (A—1850 ppm, B—85 ppm, C—12 ppm, D—5 ppm, E—<5 ppm) in the deposition environment, as a function of black body temperature.
Metals 15 01078 g005
Figure 6. Visible and NIR reflectance of Inconel 718 (F, G)*, mild steel (H, I)*, aluminum 2319 (J), and nickel aluminum bronze (K), [*: See Table 4 for O2 levels].
Metals 15 01078 g006
Figure 7. Normal emissivity as a function of black body temperature for Inconel 718 (F, G), mild steel (H, I), aluminum 2319 (J), and NAB (K).
Metals 15 01078 g007
Table 1. Published emissivity of metals used in AM processes compared with results from this study.
MetalFabrication ProcessReferenceTemp. Range/°CEmissivity
Aluminum 2319Cold metal transfer
DED-Arc
This study20–5000.14–0.16
AluminumOxidized sheetJones et al. [26]200–6000.11–0.19
Inconel 718Low O2, DED-ArcThis study20–12000.45–0.66
Inconel 718High O2, DED-ArcThis study20–12000.54–0.71
Inconel 718Processed sheetsB. Keller et al. [23]377–10270.2–0.7
Inconel 718Powder bed fusion,
then fine polish
Curry et al. [24]>13000.3 (~λ = 1 µm)
Inconel 7183D-printed, oxidized
component
Li et al. [25]700–10000.55–0.72
Nickel alum. bronzeCold wire MIG DED-ArcThis study20–10000.35–0.38
Mild steelLow O2, DED-ArcThis study20–14000.4–0.55
Mild steelHigh O2, DED-ArcThis study20–14000.72–0.86
Mild steelPolish, low oxidationWade [27]315–4270.3–0.6
Mild SteelPolish, high oxidationTouloukian et al. [28]316–8160.85–0.945
Carbon steelSteel rod, low oxidationSadiq et al. [29]60–6000.28–0.69
Ti-6Al-4VLow O2, DED-ArcThis study20–14000.26–0.42
Ti-6Al-4VMedi. O2, DED-ArcThis study20–14000.28–0.47
Ti-6Al-4VHigh O2, DED-ArcThis study20–14000.28–0.67
Ti-6Al-4VLow O2, inductive heatingHagqvist et al. [19]477–10770.3–0.35
Ti-6Al-4VVery low O2, polished barsShur et al. [20]827–14270.26–0.3
Ti-6Al-4VVery low O2, heating coilMohr et al. [21]1327–14870.3–0.36
Ti-6Al-4VMedium O2, DED-ArcBaier et al. [22]2000.35
Table 2. Ti-6Al-4V sample deposition conditions.
Sample Ref.Layer Number, Residual Oxygen Level/ppm.Visual Appearance
A2 layers, 1850Green/blue color
B2 layers, 85Dark straw color
C2 layers, 12Straw color
D2 layers, 5Light straw color
E3 layers, <5Clear, no color
Table 3. Summary process parameters used for the deposition of the metal samples.
Parameter Ti-6AL-4VInconel 718Mild SteelAluminum 2319NAB
Travel speed, mm/s65410700
Wire feed speed, m/min.1.751.11.9710 and 6 (2 wires)
Arc current, A190180205--
Argon gas, liter /min101020–702518
AC plasma---yes-
CW MIG----yes
Table 4. Summary chemical compositions for the metal wires used in this study.
Element (%)Ti-6AL-4VInconel 718Mild SteelAluminum 2319NAB
Mn--1.70.31.0
Ni-balance--4.5
Fe0.1817.16balance-3.5
Al6.140.53-balance9.0
Cu---6.3balance
Zr---0.17-
Tibalance1.03-0.15-
C0.0210.030.08--
Si0.012-0.85--
Cr-19.31---
Nb-4.88---
Mo-3.02---
O0.15----
V3.94----
Table 5. Normal emissivity of Ti-6Al-4V deposited under various residual oxygen levels.
Sample ReferenceResidual O2 Atmosphere
During Deposition/ppm
Normal Emissivity
@ 20 °C
A18500.28
B850.28
C120.26
D50.27
E<50.26
Table 6. Normal emissivity of metals at 20 °C deposited with differing residual oxygen levels.
Sample ReferenceMetal, (O2 Level)—If VariedNormal Emissivity @ 20 °C
FInconel 718 (41 ppm O2)0.45
GInconel 718 (464 ppm O2)0.54
Hmild steel (low oxygen) 0.4
Imild steel (high oxygen)0.72
Jaluminum 23190.14
Knickel aluminum bronze0.35
Disclaimer/Publisher’s Note: The statements, opinions and data contained in all publications are solely those of the individual author(s) and contributor(s) and not of MDPI and/or the editor(s). MDPI and/or the editor(s) disclaim responsibility for any injury to people or property resulting from any ideas, methods, instructions or products referred to in the content.