Article

Enhanced Mechanical and Corrosion Properties of As-Extruded Mg-12Gd-2Zn-0.4Zr Alloy by Nd Additions

1
School of Materials Science and Engineering, Nanjing Institute of Technology, Nanjing 211167, China
2
Jiangsu JITRI Surface Engineering Technology Research Institute, Taizhou 225309, China
*
Authors to whom correspondence should be addressed.
Metals 2025, 15(10), 1077; https://doi.org/10.3390/met15101077
Submission received: 27 July 2025 / Revised: 18 September 2025 / Accepted: 24 September 2025 / Published: 26 September 2025

Abstract

The microstructures and mechanical and corrosion properties of Mg-12Gd-2Zn-xNd-0.4Zr (x = 0, 0.5, and 1.0 wt.%) alloys after hot-extrusion have been studied by scanning electron microscope (SEM), transmission electron microscope (TEM), electron back scattered diffraction (EBSD), X-ray diffractometer (XRD), electronic universal testing machine, atomic force microscope (AFM), immersion, and electrochemical tests. The results show that all the alloys consist of an α-Mg matrix, β phase, and stacking faults (SFs). Obvious texture (< 1 ¯ 2 1 ¯ 0 > parallel to the extrusion direction and the direction close to <0001>) can be found due to the introduction of the Nd element. The yield strength (YS) of the alloys with Nd additions in different testing conditions is higher than that without Nd addition. The addition of 0.5 wt.% Nd achieves the highest tensile YS at room temperature (262 MPa) and 180 °C (251 MPa), along with compression YS (246 MPa), attributable to grain refinement, stacking faults, texture, and solute atom strengthening. Moreover, the compression YS to tensile YS ratio of the as-extruded alloy increases from 0.87 to 0.98, indicating a significant improvement of tension–compression YS asymmetry. The Nd addition also plays a great role in the enhanced corrosion resistance of the alloys. Specifically, the corrosion potential of the different phases in the alloys shows the following order: β phase > SFs > α-Mg matrix. The alloy with 0.5 wt.% Nd addition exhibits the best corrosion resistance owing to its lower corrosion potential difference between the β phase and α-Mg matrix.

1. Introduction

Magnesium (Mg) and its alloys have a wide application prospect in the automotive, aerospace, and power transmission fields owing to their light weight, high specific strength, good machinability, and other attractive properties [1,2,3]. However, they still suffer from inherent limitations, including inadequate plasticity and low absolute yield strength. In addition, their poor corrosion resistance, caused by low standard electrode potential, significantly restricts broader applications. Therefore, enhancing the comprehensive properties of Mg alloys is crucial. Recent studies have reported the main methods for optimizing Mg alloys’ mechanical and corrosion performance; for instance, alloying, deformation, and heat treatment [4,5,6,7].
In fact, Mg alloys are also required to maintain good mechanical properties at high temperatures in specific applications. However, the yield strength of Mg alloys tends to decrease while the elongation increases with the increased temperature. It has been found that the second phase in Mg alloys may affect the high temperature tensile properties and reduce the yield strength loss at high temperature [8,9]. In addition to the requirement of stable high-temperature mechanical properties, Mg alloys face the additional challenge of tension–compression yield asymmetry. This phenomenon, arising from poor deformation capacity and strong anisotropy, poses significant threats to component stability and safety. Generally, Mg alloys’ tensile and compression yield strengths should be as close as possible to weaken the tension–compression yield asymmetry [10,11].
Due to the relatively high solid solubility, rare earth (RE) elements are prospective alloying elements in Mg alloys since they could significantly enhance mechanical properties by precipitation strengthening and solid solution strengthening, as well as grain refinement strengthening mechanisms [3,4]. Alloying RE elements have also been reported to be beneficial for the heat resistance and creep resistance of Mg alloys [12,13]. For example, yttrium (Y), gadolinium (Gd), and neodymium (Nd) are common RE alloying elements utilized for Mg alloys [4,14,15,16,17,18]. Dai et al. have found that the Y addition played an important role in improving the as-cast Mg-Gd-Y-Zn-Ca-Zr alloys’ yield strength, and one reason for the enhancement was the introduction of the long period stacking ordered (LPSO) structures and stacking faults (SFs) structures. Additionally, LPSO and/or SFs structures have been noticed in the other Mg-RE-Zn/Ni/Cu alloys [19,20,21,22,23,24]. These lamellar structures exhibit strong anisotropy and act as barriers to basal slip motion, thereby enhancing Mg alloys’ mechanical properties [25,26]. Furthermore, lamellar LPSO and/or SFs structures display transitional corrosion potential between the α-Mg matrix and eutectic phases, potentially decelerating corrosion rates in Mg alloys [27,28].
On the basis of the improvements by alloying, hot extrusion deformation is often further carried out to obtain higher strength and better corrosion resistance [29,30]. On the one hand, hot extrusion exhibits the typical advantage of grain refinement. In addition, microstructural evolution in as-extruded Mg alloys, such as dynamic recrystallization (DRX), texture strength, and dynamic precipitation, is dependent on extrusion parameters including temperature, ratio, and speed [31,32]. Significantly, dynamic precipitation preferentially nucleates at dislocations, a process directly governed by these extrusion parameters [33]. Recent investigations have indicated that grain size and the dispersion of precipitation phases caused by the hot extrusion have significant influences on the mechanical and corrosion performance of as-extruded Mg alloys [34,35].
Generally, it is necessary to illustrate comprehensive effects of the addition of alloying elements and hot extrusion on Mg alloys’ mechanical properties and elaborate the roles in the corrosion resistance evolution. Our previous studies have indicated that small amounts of Nd addition into a Mg-Gd-Zn-Zr alloy were beneficial for improving the mechanical properties, but aggravated corrosion [36,37]. In this work, Mg-12Gd-2Zn-xNd-0.4Zr (x = 0, 0.5, and 1.0 wt.%) alloys were selected as the target alloys and an extrusion process was conducted on the alloys to clarify the influences of Nd on the microstructural evolution and mechanical and corrosion performance of the alloys under extruded conditions.

2. Materials and Methods

2.1. Materials Preparation

The nominal Mg-12Gd-2Zn-xNd-0.4Zr alloys (x = 0, 0.5, and 1.0 wt.%, designated as Alloy 1, Alloy 2, and Alloy 3, respectively) were gravity-cast in an electric resistance furnace using pure Mg (99.99%), pure Zn (99.99%), Mg-30 wt.%Gd, Mg-30 wt.%Zr, and Mg-30 wt.%Nd master alloys, as mentioned in previous works [36,37]. Subsequent hot extrusion at 430 °C converted the initial ingots with dimension of Φ60 mm × 50 mm into Φ20 mm rods, achieving an extrusion ratio of 9:1.
The wire electric discharge machine was utilized to prepare the specimens for microstructural observations and mechanical and corrosion properties analyses. The specimens were cut perpendicularly and parallel to the extrusion direction, respectively, ground progressively by silicon carbide sandpaper up to 3000#, polished, then etched by the solution with the composition of 1 g oxalic acid, 1 mL nitric acid, 1 mL acetic acid, and 150 mL distilled water.

2.2. Microstructure Characterization

The alloys’ microstructures were observed using a scanning electron microscope (SEM, Zeiss Merlin Compact, Carl Zeiss AG, Oberkochen, Germany) coupled with an energy dispersive spectrometer (EDS, Oxford Atec X-Max 50, Oxford Instruments, Oxford, UK). The as-extruded samples for electron backscatter diffraction (EBSD) characterizations were mechanically ground, sandpaper polished, and then electrolytically polished at 15 V and −45 °C using a 10% perchloric acid alcohol solution. Grains and textures were characterized via SEM (Tescan-s8000, Tescan Orsay Holding, a.s., Brno, Czech Republic) equipped with an Oxford Instruments EBSD system. EBSD data were processed using HKL-Channel 5 and Azteccrystal 2.0 software. Phases analysis was conducted by X-ray diffraction (XRD, Rigaku Ultima-IV, Rigaku Corporation, Tokyo, Japan) with a Cu target operated at 40 kV, scanning 20° to 80° at 6 °/min. For transmission electron microscopical (TEM) analysis, samples were mechanically ground to 70 μm thickness, punched into 3 mm diameter disks, and ion-milled using a Gatan precision ion polishing system. TEM images and selected area electron diffraction (SAED) patterns were obtained on a JEOL JEM-2100F (Japan Electron Optics Laboratory Ltd., Tokyo, Japan) operated at 200 kV.

2.3. Mechanical Properties and Corrosion Resistance

Ambient-temperature and high-temperature (180 °C) tensile tests as well as ambient-temperature compression on the alloys were conducted with an electronic material testing machine (Zwick/Roell Z030TH, ZwickRoell GmbH & Co. KG, Ulm, Germany). Tensile specimens had a 15 mm gauge length, 3.5 mm width, and 1.8 mm thickness. Compression samples measured Φ8 mm × 12 mm. All tests were conducted at 1 mm/min strain rate. Fracture surfaces were subsequently examined by SEM.
Corrosion specimens (Φ14 mm × 3.5 mm) were mechanically ground through successive SiC papers up to 3000 grit, polished, ultrasonically cleaned in ethanol, and warm-air dried. An immersion test was performed in 3.5 wt.% NaCl solution at room temperature for 60 h. Hydrogen evolution volume was recorded at the following intervals: (i) 0.5 h interval during 0–2 h, (ii) 2 h interval during 2–12 h, and (iii) 12 h interval thereafter. The NaCl solution was renewed every 12 h to maintain pH stability. Post-immersion, corrosion products were removed by boiling in 200 g/L CrO3 solution. The surface morphologies of corroded samples (with/without corrosion products) were characterized by SEM, with elemental compositions of the selected areas analyzed by EDS.
Electrochemical impedance spectroscopy (EIS) tests of the as-extruded specimens were performed using an Ametek PARSTAT 3000A-DX (Ametek, Inc., Oak Ridge, NJ, USA) electrochemical workstation employing a standard three-electrode cell sample with 1 cm2 exposed area as the working electrode, a saturated calomel electrode (SCE) as the reference electrode, and a platinum wire as the counter electrode. Real-time EIS measurements were acquired from 100 kHz to 100 mHz, with a perturbing signal of 10 mV. Data were modeled using physical equivalent circuits in ZSimpWin 3.60 software.
To measure corrosion potential difference among various phases, a Bruker Multimode 8 atomic force microscope (AFM) was used, and the data were analyzed by Nanoscope Analysis 1.7 software.

2.4. Statistical Analysis

All tests employed ≥4 parallel specimens to ensure reproducibility. Results are expressed as mean ± standard deviation (SD). Statistical significance was evaluated through one-way ANOVA using OriginPro 2021 software (Learning Edition).

3. Results

3.1. Microstructures and Phases

Figure 1 shows the as-extruded Mg alloys’ SEM microstructures perpendicular and parallel, respectively, to the extrusion direction (ED). All alloys are composed of the equiaxed α-Mg matrix, blocky eutectic phases, and lamellar structures, as marked by yellow arrows in Figure 1. The OM micrographs are shown in Figure S1. Fine recrystallized grains appear as equiaxed grains owing to the occurrence of dynamic recrystallization during the hot extrusion process and elongated eutectic phases can be observed parallel to the extrusion direction, as shown in Figure 1(a2–c2). Furthermore, volume fractions of the eutectic phase and lamellar structures increase with the addition of the Nd element.
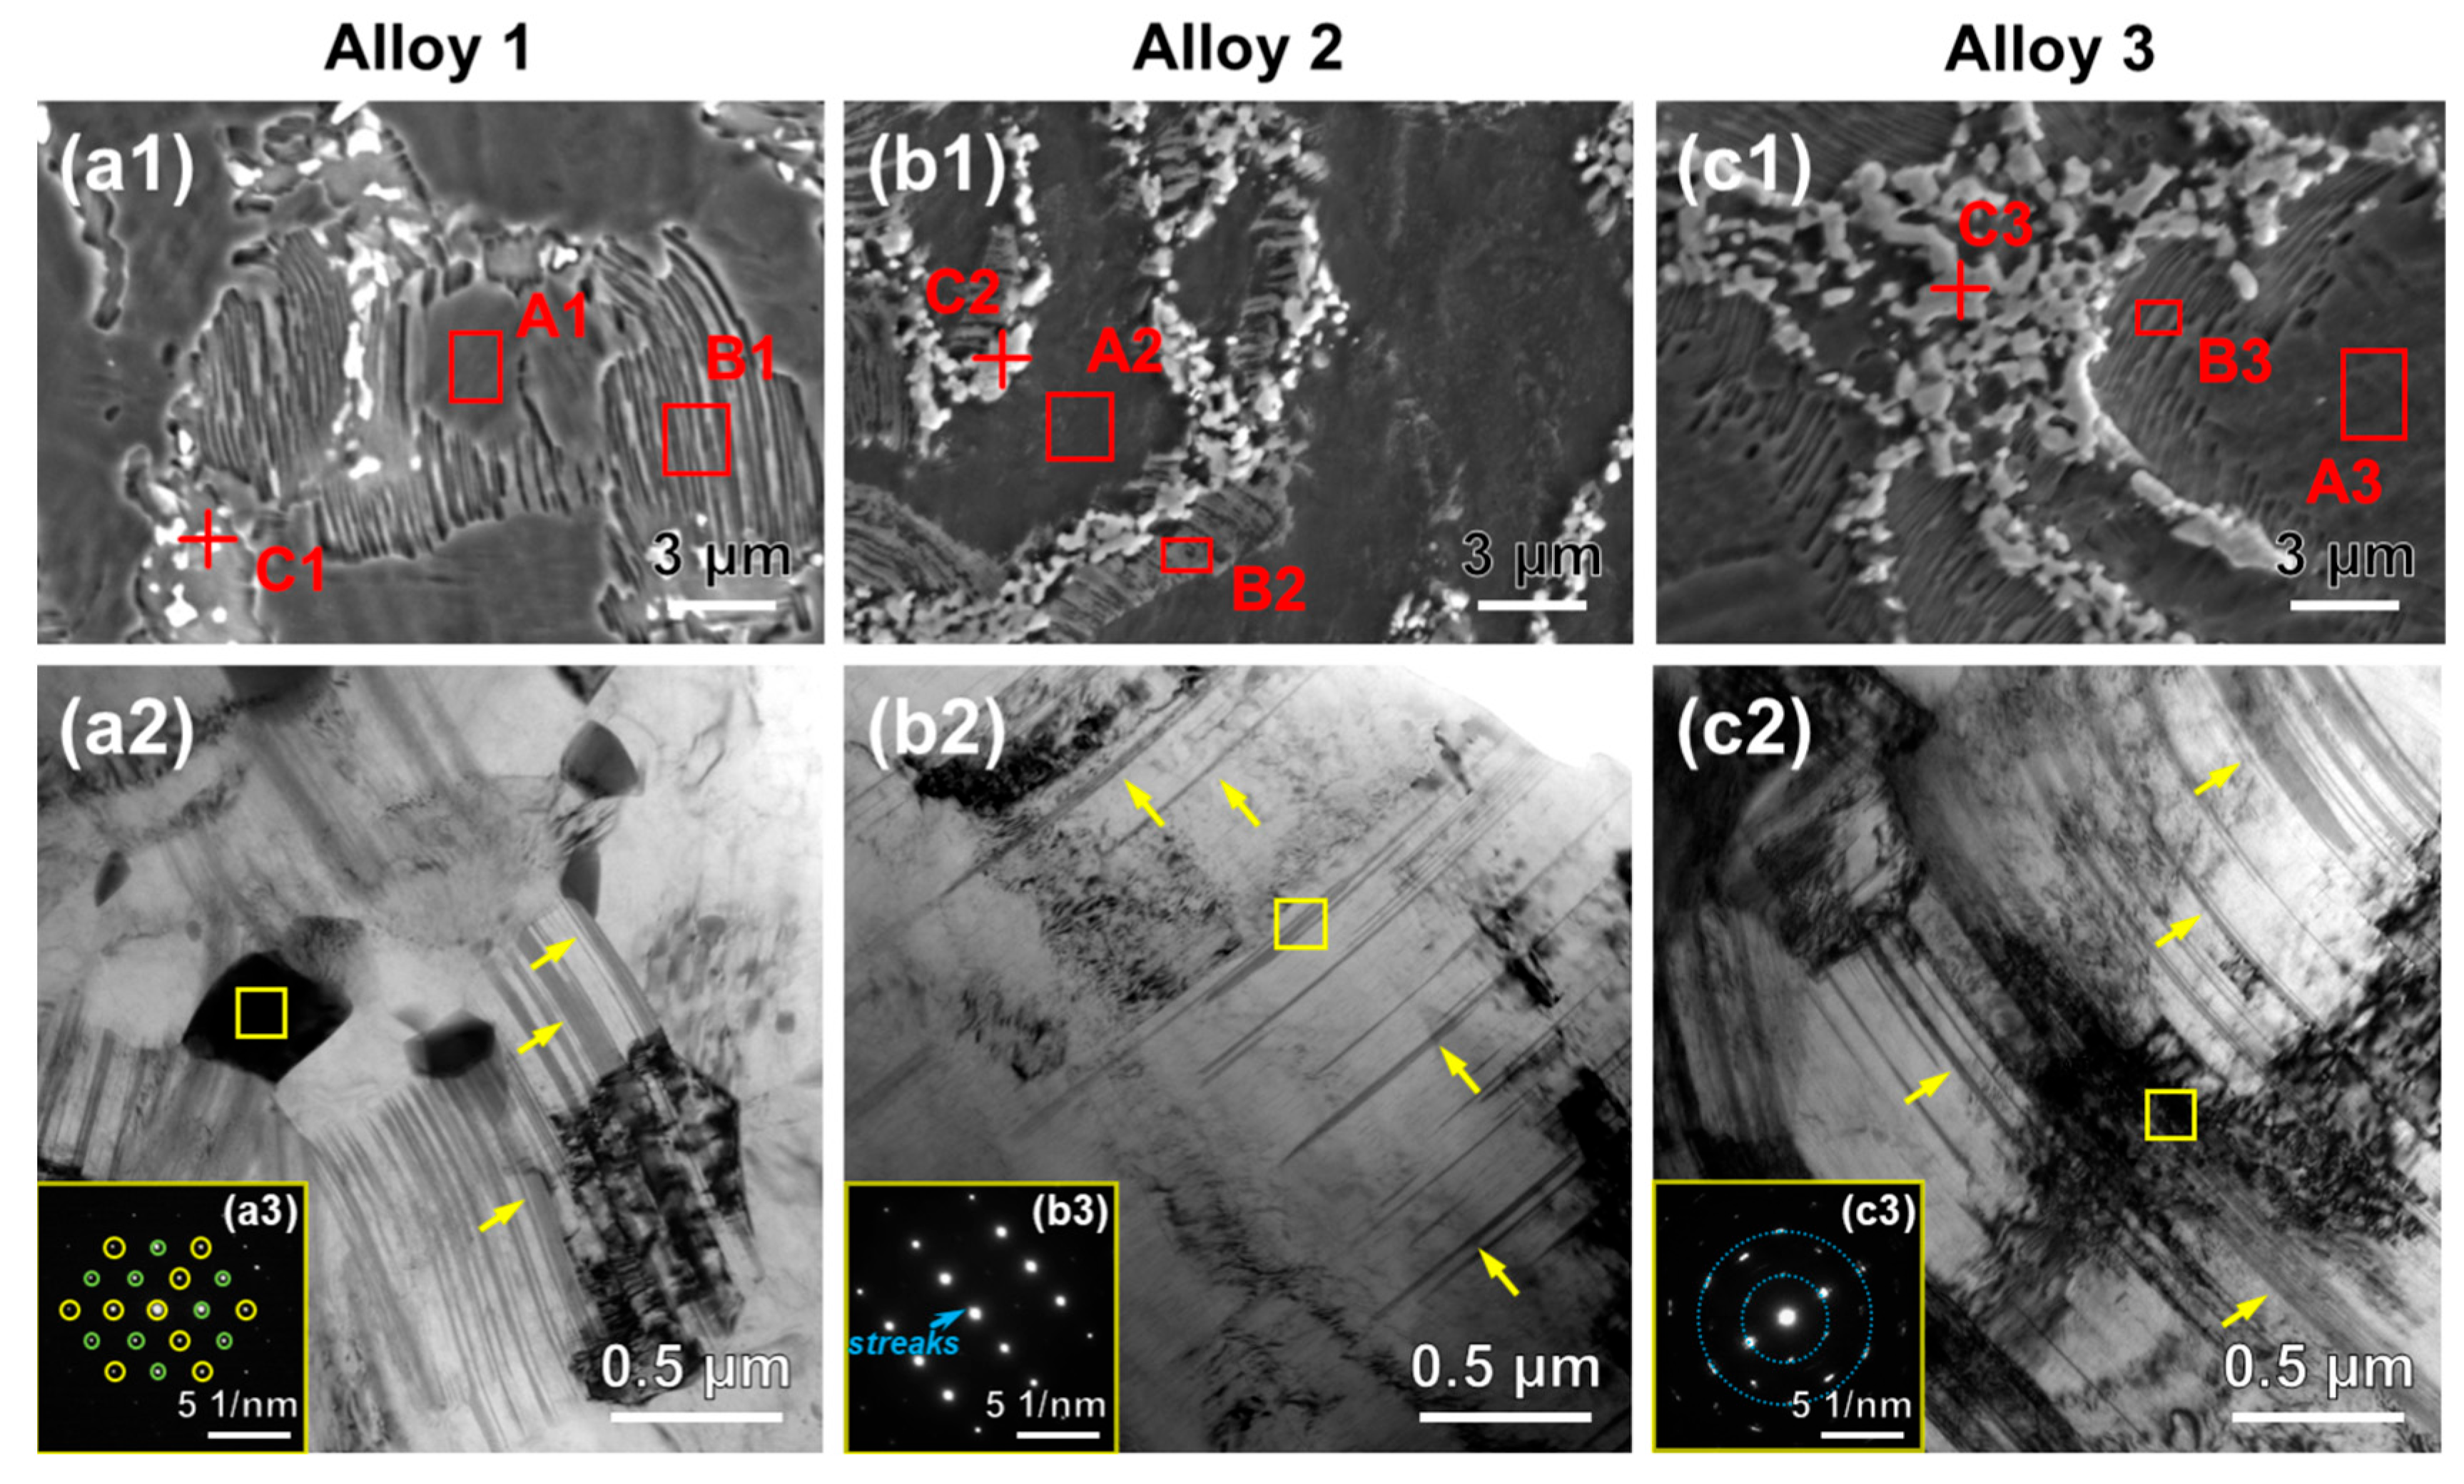
SEM images with high magnification of the alloys are presented in Figure 2 for further clarification of the microstructures. The lamellar structures are mainly distributed at outer edge of grain boundaries and adjacent to the eutectic phases. Figure 2(a2–c2,a3–c3) show bright-field TEM images and corresponding SAED patterns. Parallel and kinked lines are detected. The corresponding SAED pattern of these lines marked by the yellow square in Figure 2(b2) reveals existence of solute-segregated SFs because of typical features of strong streaks, which is in accordance with the findings of previous studies [4,36]. The SAED pattern presented in Figure 2(a3) is representative of a cubic eutectic phase. In addition, typical concentric diffraction rings can be found in Figure 2(c3), which are caused by the amorphous structures formed during extrusion.
Table 1 lists chemical compositions measured by the EDS of the α-Mg matrix (marked as regions A1, A2, and A3), lamellar SFs (marked as regions B1, B2, and B3), and eutectic phase (marked as regions C1, C2, and C3), respectively, in Figure 2. Gd and Zn elements are mainly distributed in eutectic phases. The total contents of Gd and Zn in SFs are less than those in eutectic phases but higher than those in the α-Mg matrix. In Alloy 2 and Alloy 3 with Nd additions, Nd elements present no significant change in α-Mg matrix while they are mainly distributed in the eutectic phases. In addition, the eutectic phases and lamellar SFs present higher Gd and Zn contents compared to those corresponding phases, marked as regions B1 and C1. The mentioned EDS results indicate that Nd atoms substitute the original Mg atoms in these phases.
The XRD spectra of the as-extruded alloys are displayed in Figure 3. The diffraction peaks of α-Mg and (Mg, Zn)3Gd phases are identified. The eutectic phase can be recognized as the β-(Mg, Zn)3Gd, combined with the diffraction peak and the previous SAED result. It has been reported that Nd mainly existed as a Mg12Nd phase in the as-extruded Mg-xNd (x = 2, 4) binary alloys [17]. However, XRD analysis revealed no detectable Nd-containing phase peaks in Alloy 2 and Alloy 3, attributable to their low Nd concentrations.
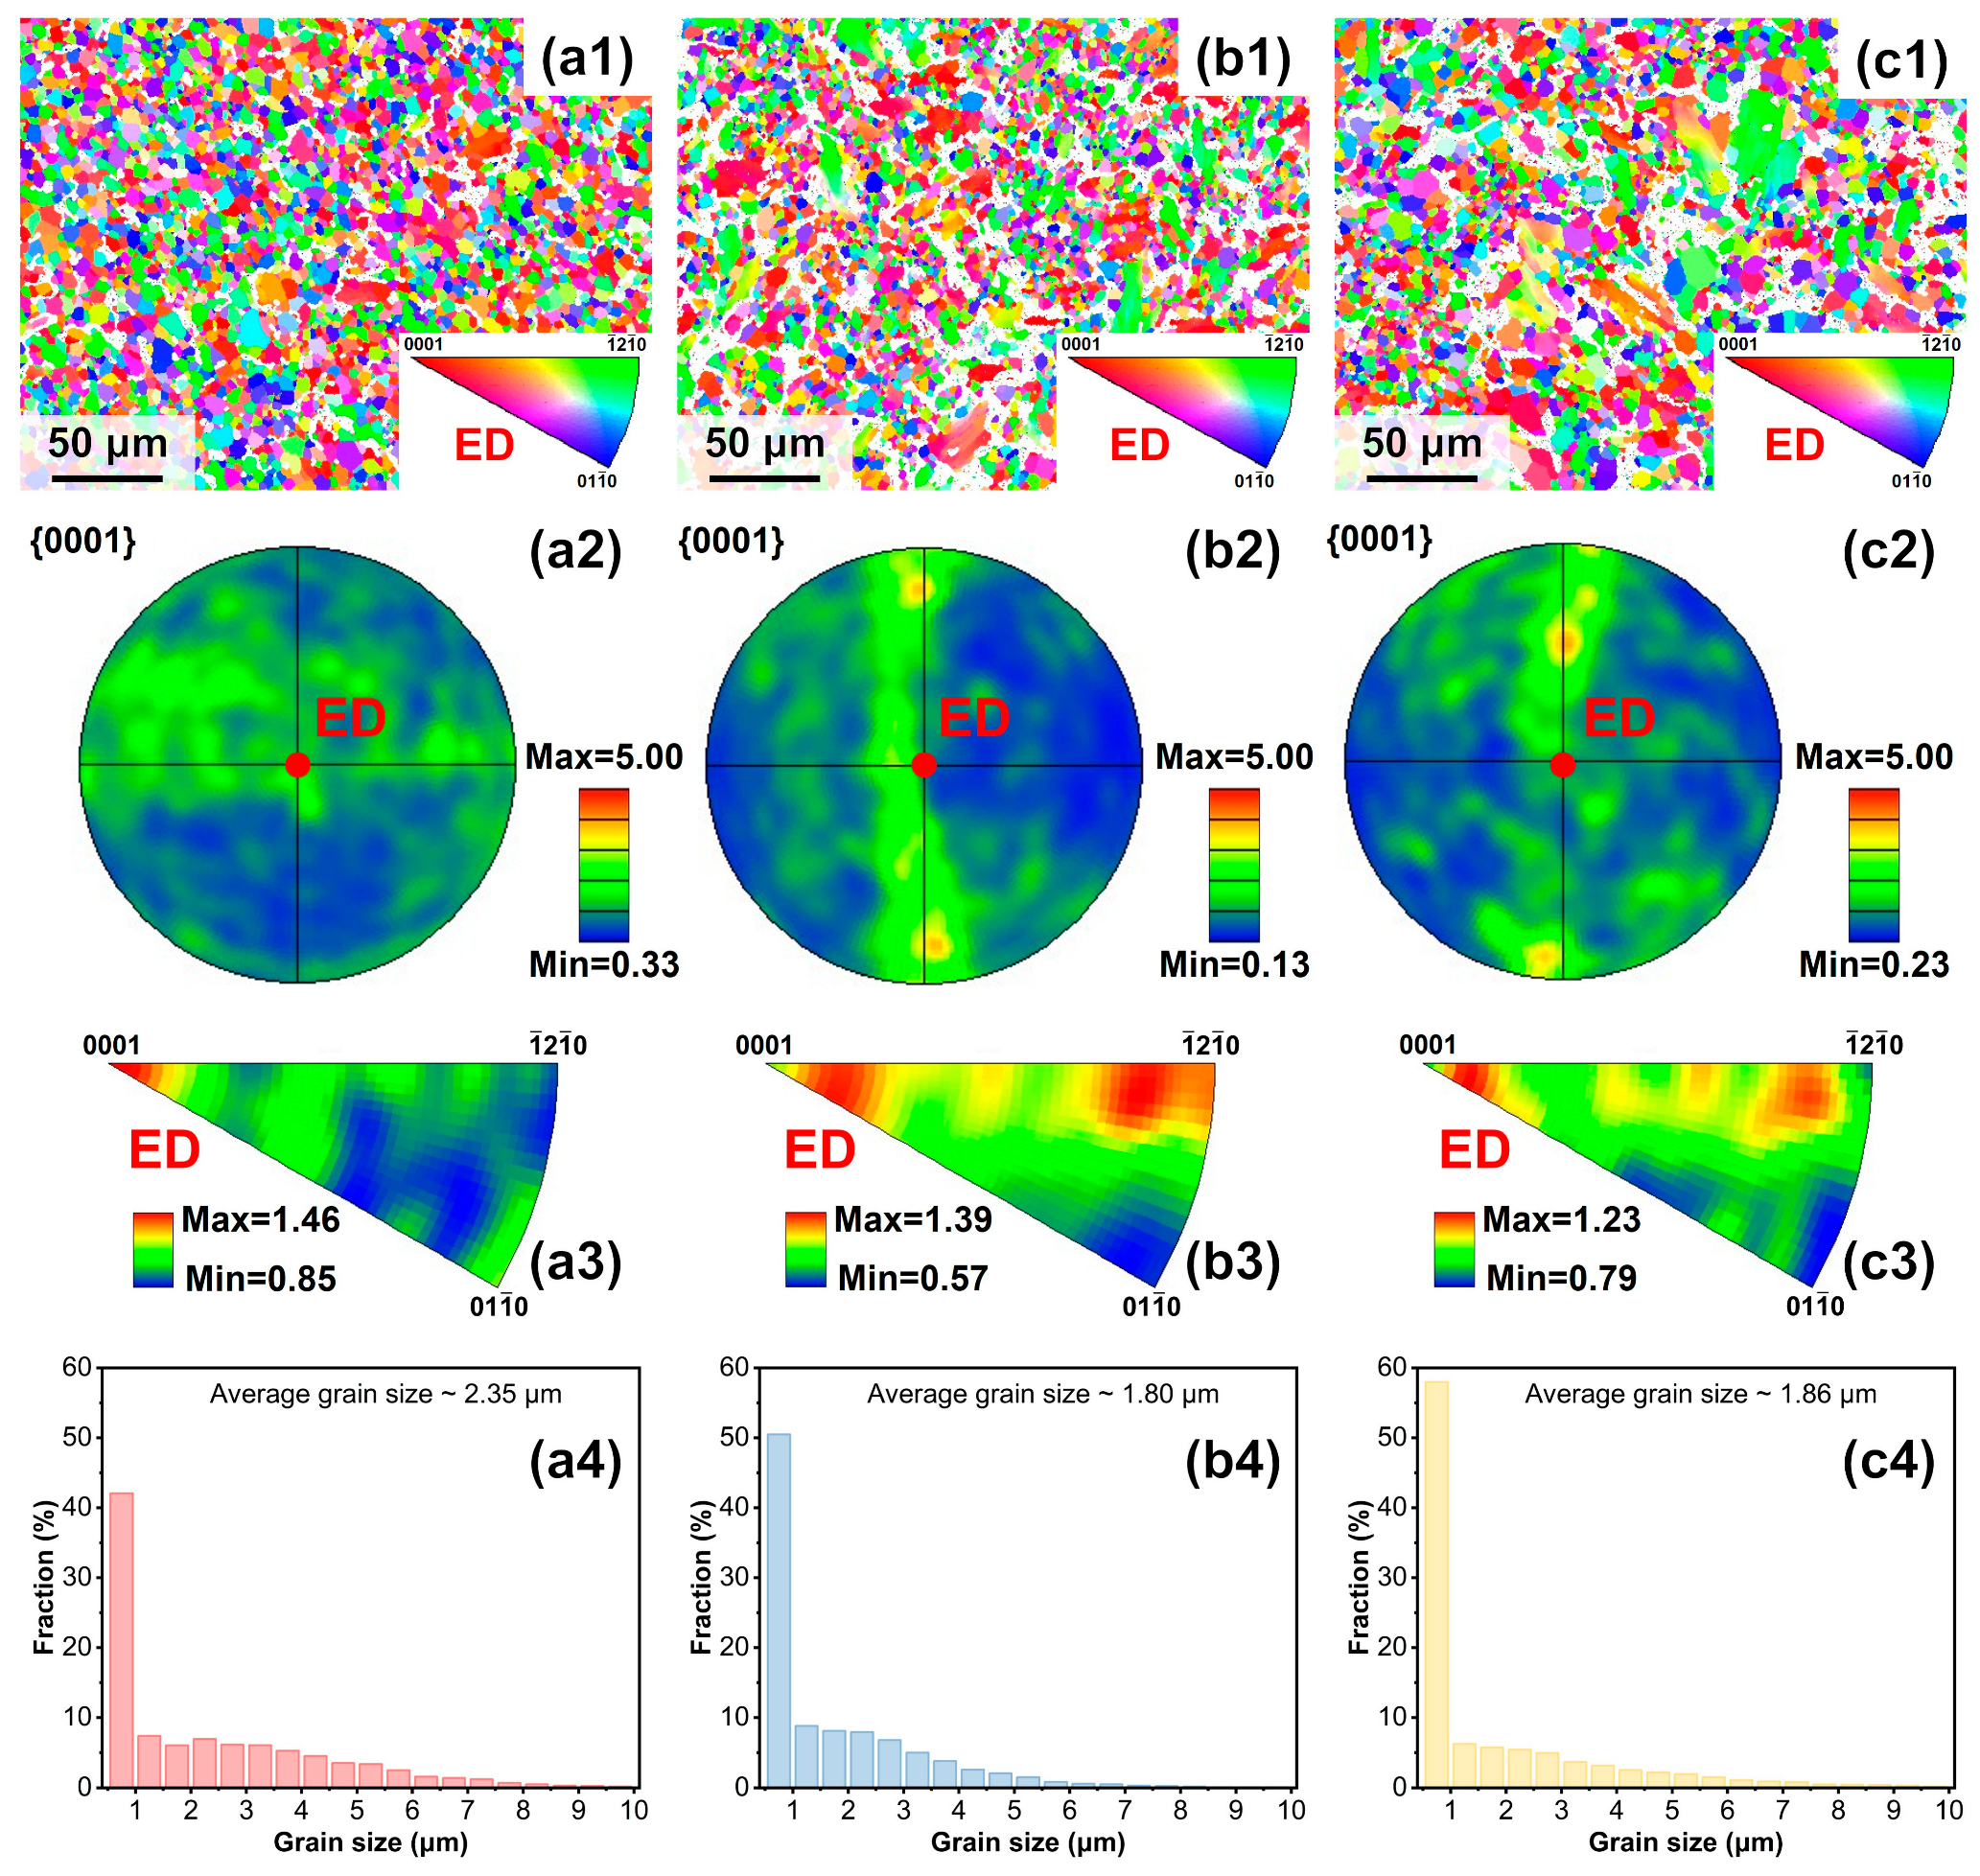
Figure 4 displays crystallographic orientation maps, pole figures (PFs), and inverse pole figures (IPFs) projected normal to the extrusion direction (ED). Alloy 1 presents an utterly dynamic recrystallized (DRXed) microstructure while there are some unDRXed grains in Alloy 2 and Alloy 3, which is consistent with the SEM images shown in Figure 1. From the PFs and the IPFs in Figure 4(a2,a3), the basal texture can be found in Alloy 1, but the texture strength is weak. For Alloy 2, unDRXed grains appear and obvious texture can be observed in Figure 4(b2,b3). IPFs reveal a duplex texture characterized by two dominant components: < 1 ¯ 2 1 ¯ 0 > // ED and near-<0001> orientations. When 1 wt.% Nd was added into the as-extruded alloy, the texture components of < 1 ¯ 2 1 ¯ 0 > parallel to ED move towards to <0001> slightly, and a weak texture component between <0001> and < 1 ¯ 2 1 ¯ 0 > parallel to the extrusion axis can be noticed. According to statistics based on the EBSD results, Alloy 1 exhibits a coarser average grain size (~2.35 μm) compared to Alloy 2 (~1.80 μm) and Alloy 3 (~1.86 μm).
In magnesium alloys, plastic deformation processes (rolling, extrusion, severe SPD) induce specialized textures governed by dominant slip systems and deformation modes [38]. Beyond processing parameters, compositional modification through alloying elements, including Ca, Al, Zn, Mn, Sr, and rare earth (RE) additions, also significantly alters extrusion textures [39]. The alloying elements could weaken or strengthen some specific orientations in Mg alloys [39]. Non-basic texture often exists in extruded Mg alloys containing RE elements [40]. In the present work, the basal texture can be noticed in Alloy 1, and the obvious texture (< 1 ¯ 2 1 ¯ 0 > parallel to ED and the direction close to <0001>) exists in Alloy 2 and Alloy 3.

3.2. Mechanical Properties

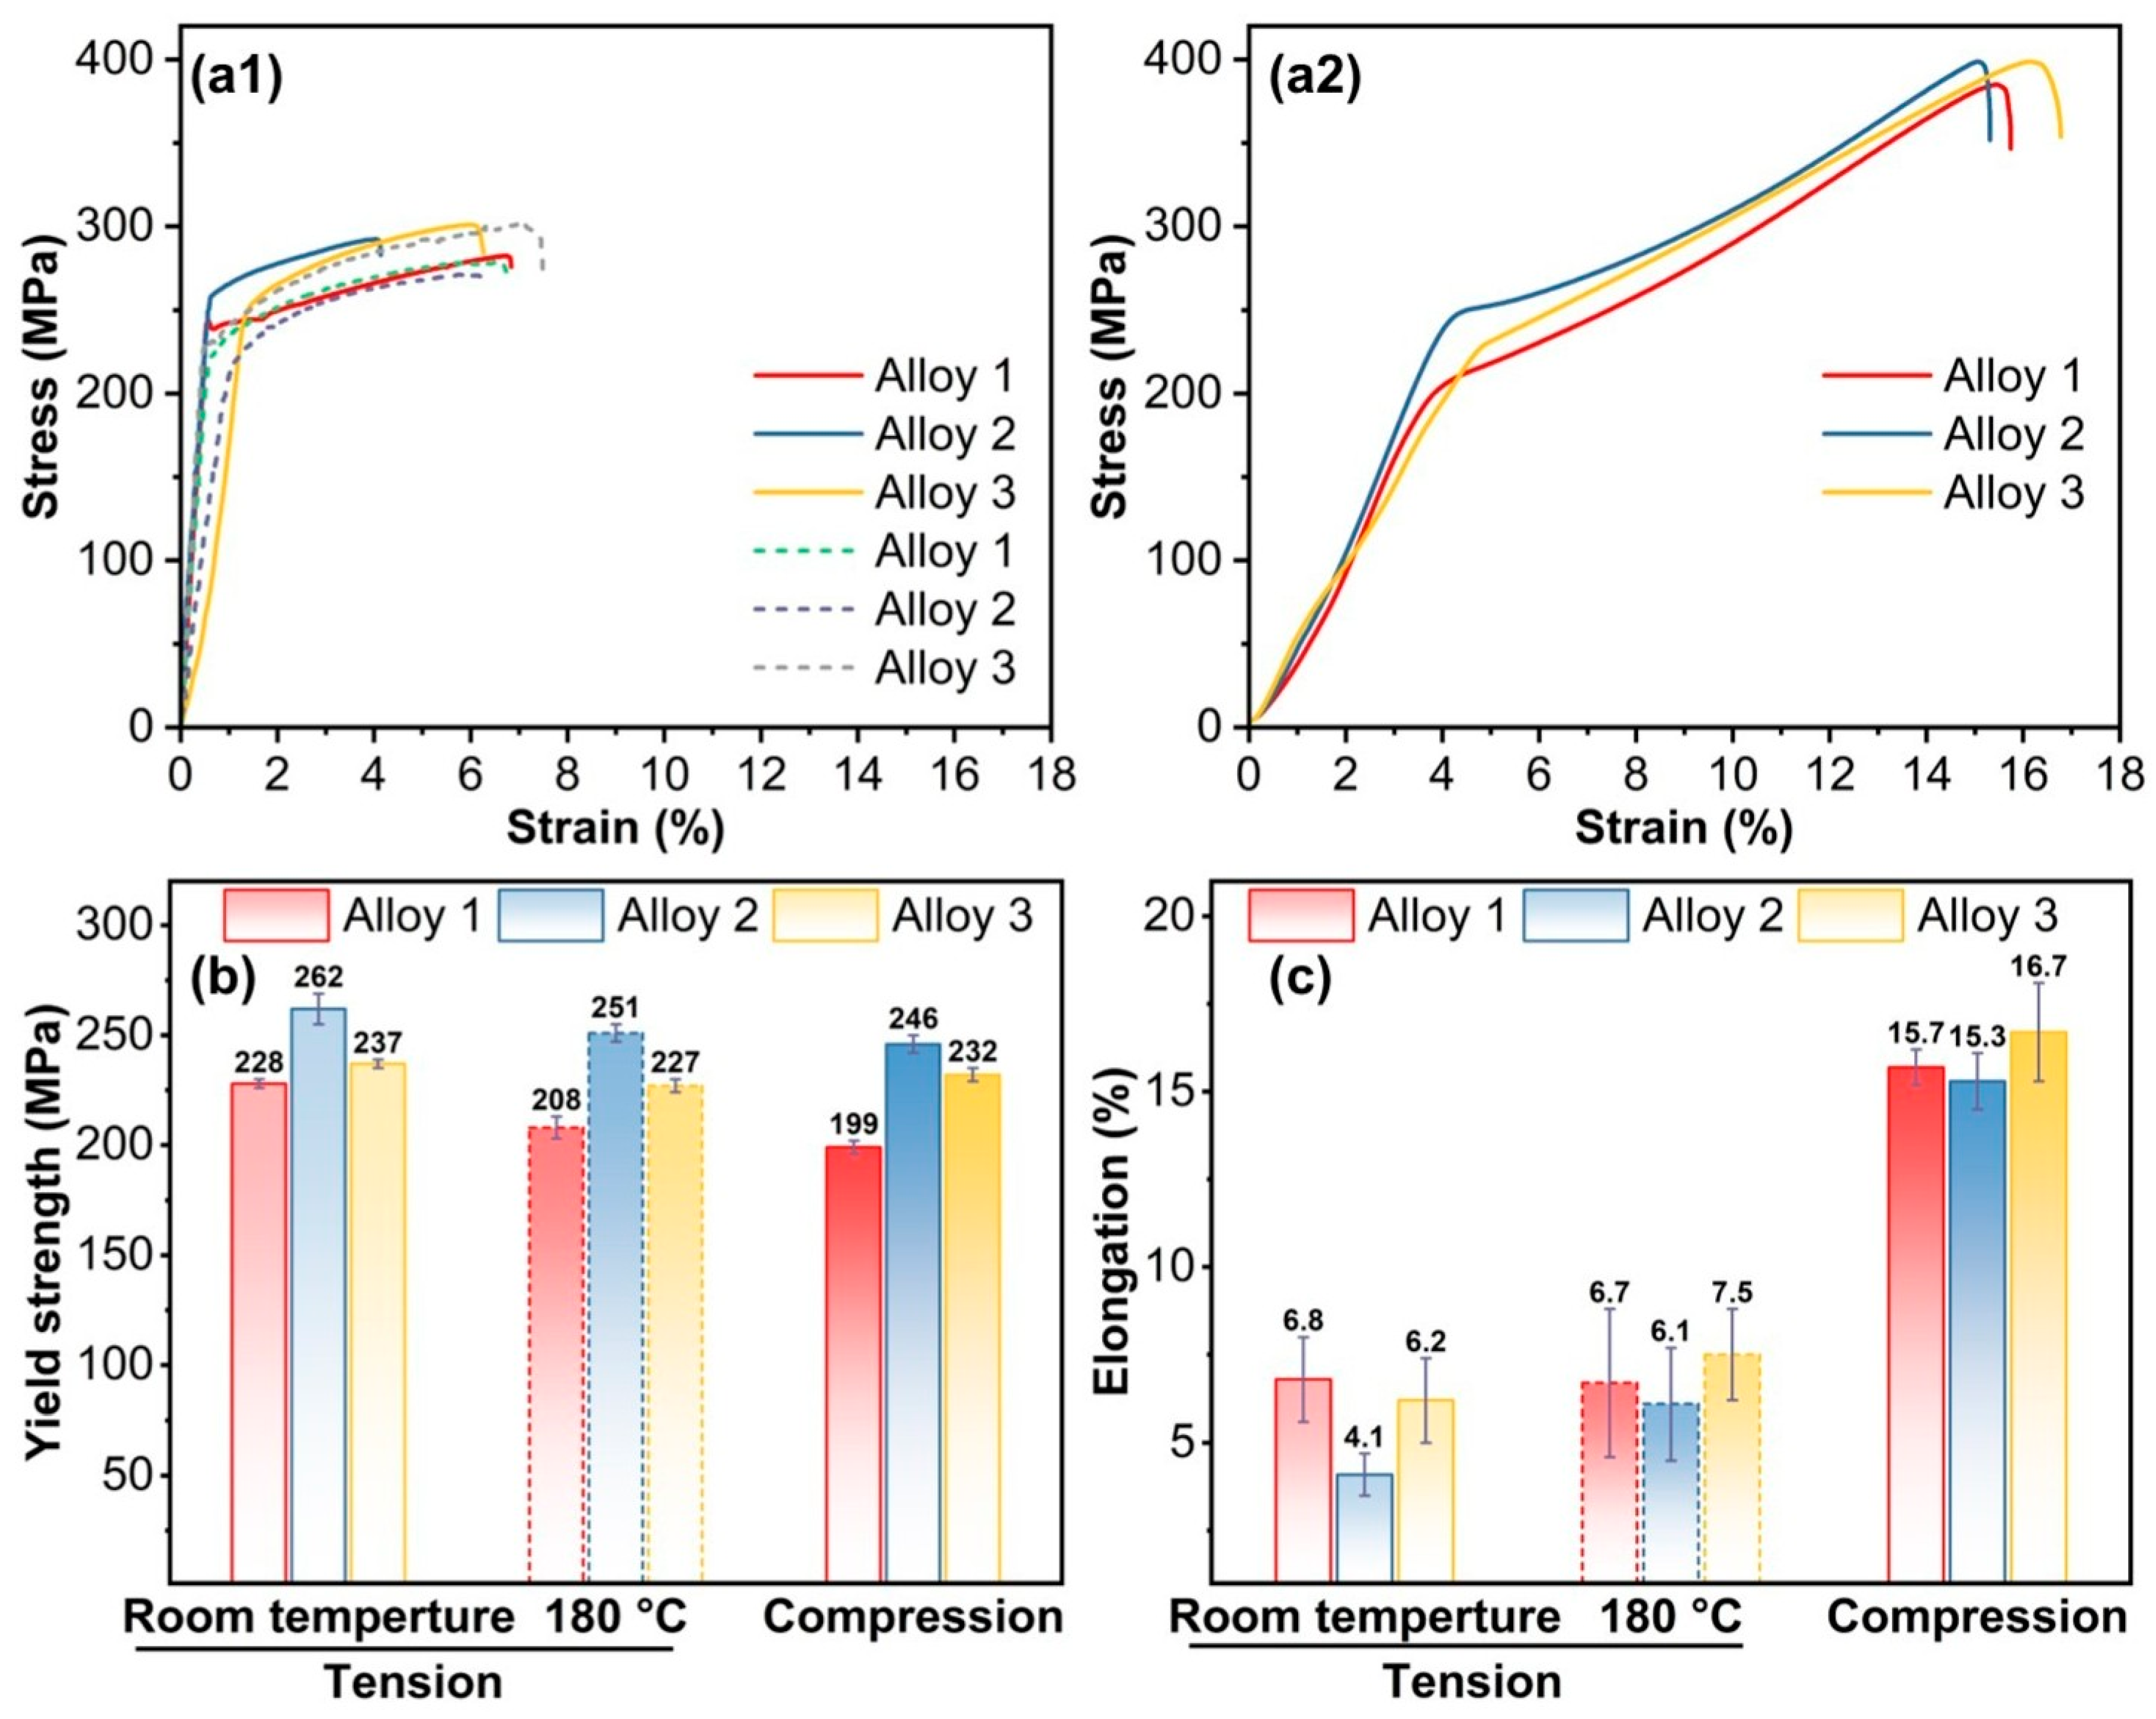
Figure 5(a1,a2) show the typical tensile (room temperature, 180 °C) curves and compressive curves of the as-extruded alloys, confirming significant tension–compression asymmetry, while Figure 5b presents corresponding tensile yield strength (TYS) and elongation. Alloy 2 exhibits peak TYS (262 ± 7 MPa), a 34 MPa increase over Alloy 1 (228 ± 2 MPa), though Alloy 3 shows reduced TYS (237 ± 2 MPa) with additional Nd. All alloys retain high TYS at 180 °C; the TYS of Alloy 1 (208 ± 5 MPa) decreases by 20 MPa, while the TYS of Alloy 2 (251 ± 4 MPa) and Alloy 3 (227 ± 3 MPa) decreases by 11 MPa and 10 MPa, respectively. This high retention of the TYS indicates that Nd plays a crucial role in regulating the tensile properties of the alloys at high temperature. Under the compressive testing conditions, the compression yield strength (CYS) of the alloys present the values of 199 ± 3 MPa, 246 ± 4 MPa, and 232 ± 3 MPa. The CYS of Alloy 1 decreases compared with the TYS at room temperature. Furthermore, the CYS/TYS ratio of Alloy 1 is 0.87, confirming the asymmetry between the tensile and compressive yield strengths. With the addition of Nd, the CYS/TYS ratio of Alloy 2 and Alloy 3 is 0.94 and 0.98, respectively, indicating that the Nd element is conducive to modifying the tension–compression YS asymmetry of the as-extruded Mg-12Gd-2Zn-0.4Zr alloy.
In the room-temperature tensile tests, the elongation of Alloy 1 is the highest (6.8 ± 1.2%). With increasing the Nd additions, the elongations of Alloy 2 and Alloy 3 decrease to 4.1 ± 0.6% and 6.2 ± 1.2%, respectively. At 180 °C, the corresponding tensile elongations of Alloy 2 and Alloy 3 increase obviously (6.1 ± 1.6% and 7.5 ± 1.3%, respectively), and the elongation of Alloy 1 shows a similar result (6.7 ± 2.1%). During the room-temperature compression test, the elongations of Alloy 1, Alloy 2, and Alloy 3 are 15.7 ± 0.5%, 15.3 ± 0.8%, and 16.7 ± 1.4%, respectively, which are much higher than those in the tensile test at room temperature.
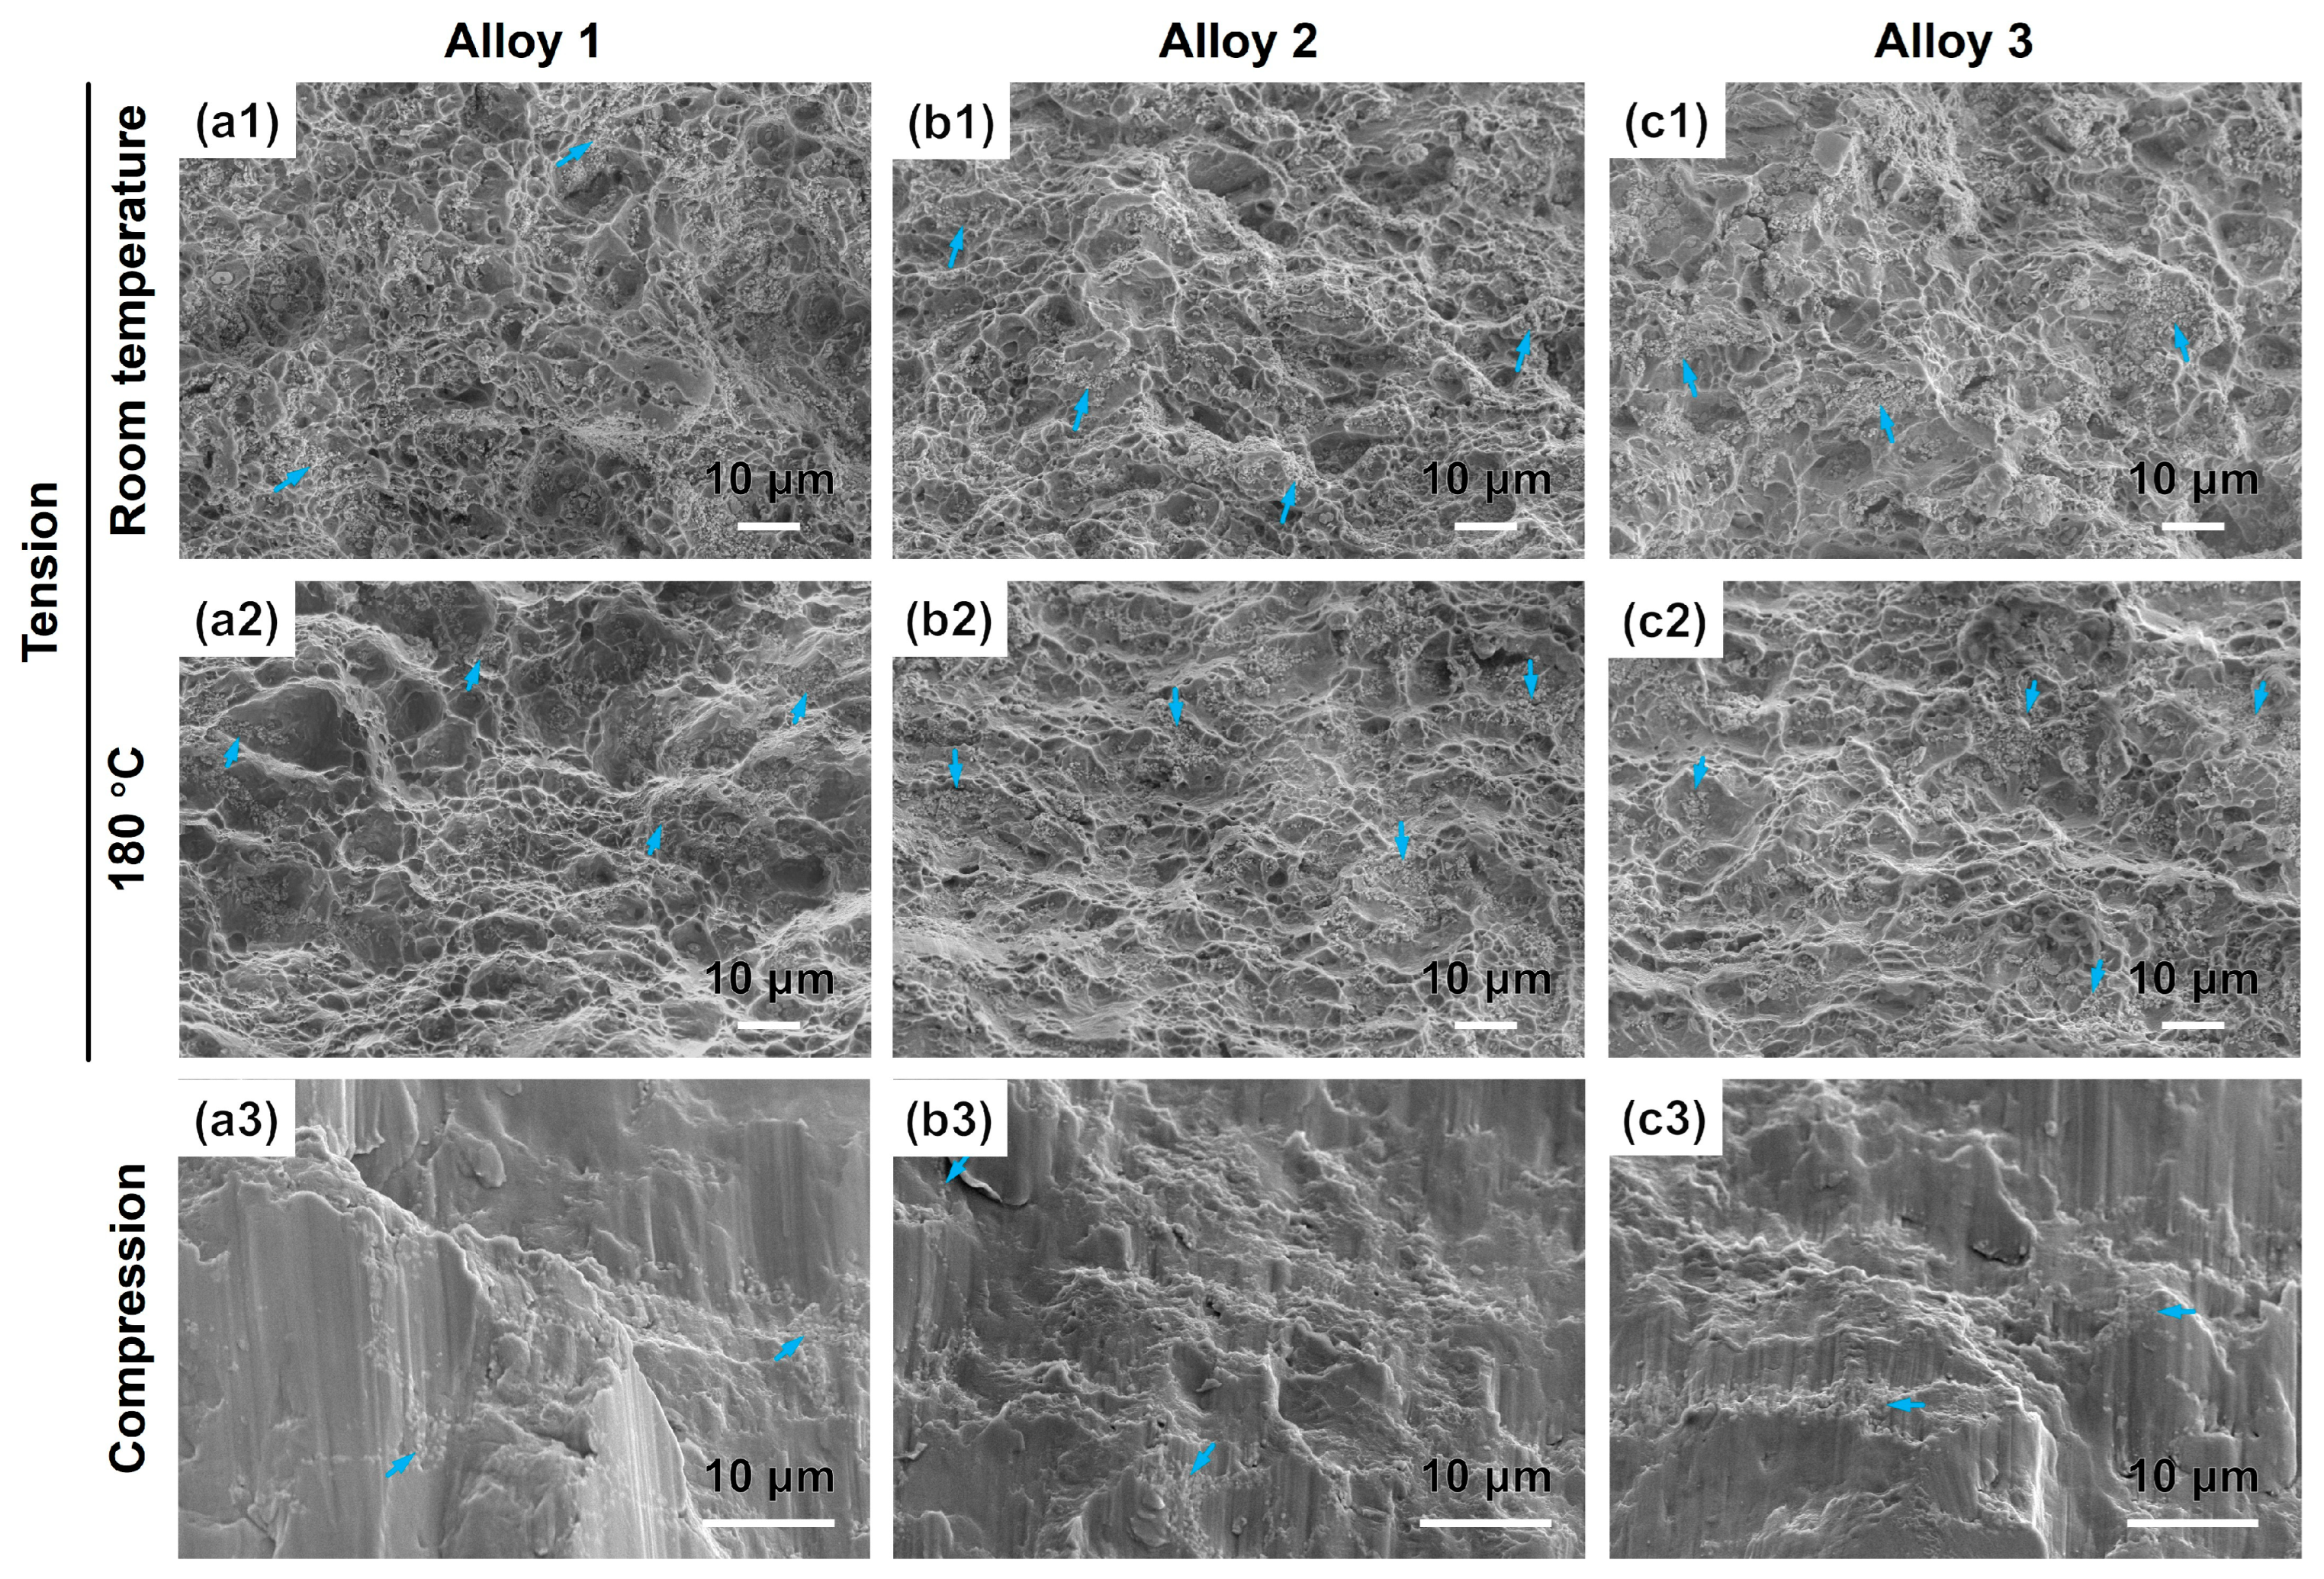
The tensile fracture surfaces of the alloys at room temperature and 180 °C are presented in Figure 6(a1–c2). The fracture surfaces of all three alloys exhibit both dimples and cleavage planes, indicating mixed ductile–brittle failure modes. Increasing Nd content correlates with heightened cleavage features (Figure 6(b1,c1)), which detrimentally impact ductility. Cleavage fractures are predominantly associated with unDRXed and elongated grains, while dimpled regions correspond to fine recrystallized grains. At 180 °C, Alloy 2 and 3 show reduced cleavage compared to at room temperature, suggesting static recrystallization in elongated grains, which enhances ductility. Compression fractures universally orient at 45° to the loading axis, characteristic of shear-induced failure, with morphologies dominated by large cleavage planes (Figure 6(a3–c3)). Microcracks (marked by the red arrows) near the eutectic phases can be observed in Alloy 2 and Alloy 3, which may be attributed to the fact that the Nd additions strengthen the eutectic phase and cause the cracks to encounter obstacles near the eutectic phases during the crack propagation process. It is also found that dispersed eutectic phases appear on the fracture surfaces, as shown by the cyan arrows.
According to the results displayed in Figure 5, the TYS of Alloy 2 increases remarkably and the TYS of Alloy 3 exhibits a slight increase at room temperature, compared to that of Alloy 1. On the one hand, SFs’ volume fraction increases in Alloy 2, which has previously been reported to be beneficial to the TYS [41,42]. On the other hand, the texture prevents dislocation slip during tension, contributing to the enhanced TYS of Alloy 2 and Alloy 3. Moreover, Nd partitions into stacking faults (SFs) and β-phases. After adding 1 wt.% Nd, the TYS of the Alloy 3 decreases compared with that of the Alloy 2, which may be caused by the coarser grains and fewer SFs in the Alloy 3.
At high temperature (180 °C), the TYS of Alloy 1, Alloy 2, and Alloy 3 decreases by 8.7%, 4.2%, and 4.2%, respectively, as compared to the corresponding TYS at room temperature. Therefore, Nd additions play positive roles in maintaining high-temperature tensile strength. Figure 7 plots the room- and high-temperature tensile properties of Mg alloys in this work and those of the other typical as-extruded RE-containing Mg alloys [8,43,44,45,46]. Herein, the slope of the straight line is 1. The closer the point to the straight line, the more stable the high-temperature mechanical properties. In general, the yield strength of Mg-Zn-Y and Mg-Zn-Y-Ca alloys tends to decrease sharply at high temperatures, as shown in Figure 7. The recent studies have reported that I-Mg3Zn6Y1 and Mg6Zn3Ca2 phases would soften at high temperatures, which then led to the deteriorated mechanical properties [43]. Nevertheless, the Mg alloys containing Gd exhibited relatively stable high-temperature performance [8,45,46]. The main reason for the above is that the added Gd would form a second phase with high-temperature stability, thus improving high-temperature strength of Mg alloys. Herein, the existence of Gd improves the high-temperature tensile properties of the as-extruded Mg-12Gd-2Zn-xNd-0.4Zr alloys, and the additions of Nd further enhance high-temperature mechanical properties. Furthermore, the obvious texture strengthens Mg alloys [15,47,48], which may also account for the good mechanical properties at high temperatures.
In the compression test, the CYS values of Alloy 2 and Alloy 3 are higher than that of Alloy 1. This is probably attributed to the combined effects of grain refinement and solid solution strengthening caused by the Nd additions, as well as the emergence of textures. Nevertheless, the elongation obtained by the compression test is much higher compared to that by tensile test. This divergence stems from distinct deformation mechanisms in tensile versus compressive loading. During tension, basal slip dominates but faces significant impediments from dislocations and grain boundaries. Under compression, however, the Mohr–Coulomb criterion [49] governs; compressive stresses generate internal friction that inhibits interfacial sliding, effectively restricting crack propagation. This frictional resistance proves more effective than tensile hindrance mechanisms, ultimately yielding substantially higher compressive elongation.
From the perspective of tension–compression YS asymmetry, CYS/TYS ratio increases with increasing Nd additions. It has been reported that finer grain is beneficial to decreasing tension–compression YS asymmetry [10]. Based on the EBSD results, the grain size of Alloy 1 is larger, which is one of the reasons for the small CYS/TYS ratio of Alloy 1. The tension–compression YS asymmetry has been improved for the alloys with Nd additions of 0.5 and 1.0 wt.%, since these alloys present finer grains parallel to extrusion direction. Furthermore, the emergence of texture may also reduce tension–compression YS asymmetry by its positive effects on the comprehensive mechanical properties. In previous work [36], the TYS values of the as-cast Mg-12Gd-2Zn-xNd-0.4Zr (x = 0, 0.5, and 1.0 wt.%) alloys were 142, 158, and 165 MPa; the corresponding elongations were 2.4%, 2.7%, and 3.4%; and the corresponding CYS/TYS ratios were 1.3, 1.12, and 1.05, respectively. In this work, the TYS is obviously improved by 60.5%, 65.8%, and 43.6% and elongation increases by 183%, 52%, and 82%, respectively, mainly due to grain refinement. Furthermore, with the addition of Nd, the tension–compression yield asymmetry in reverse of the as-cast alloy is reduced due to the finer and more homogeneous microstructure, but the finer grains parallel to the extrusion direction and the emergence of texture weaken the tension–compression yield asymmetry.

3.3. Corrosion Resistance

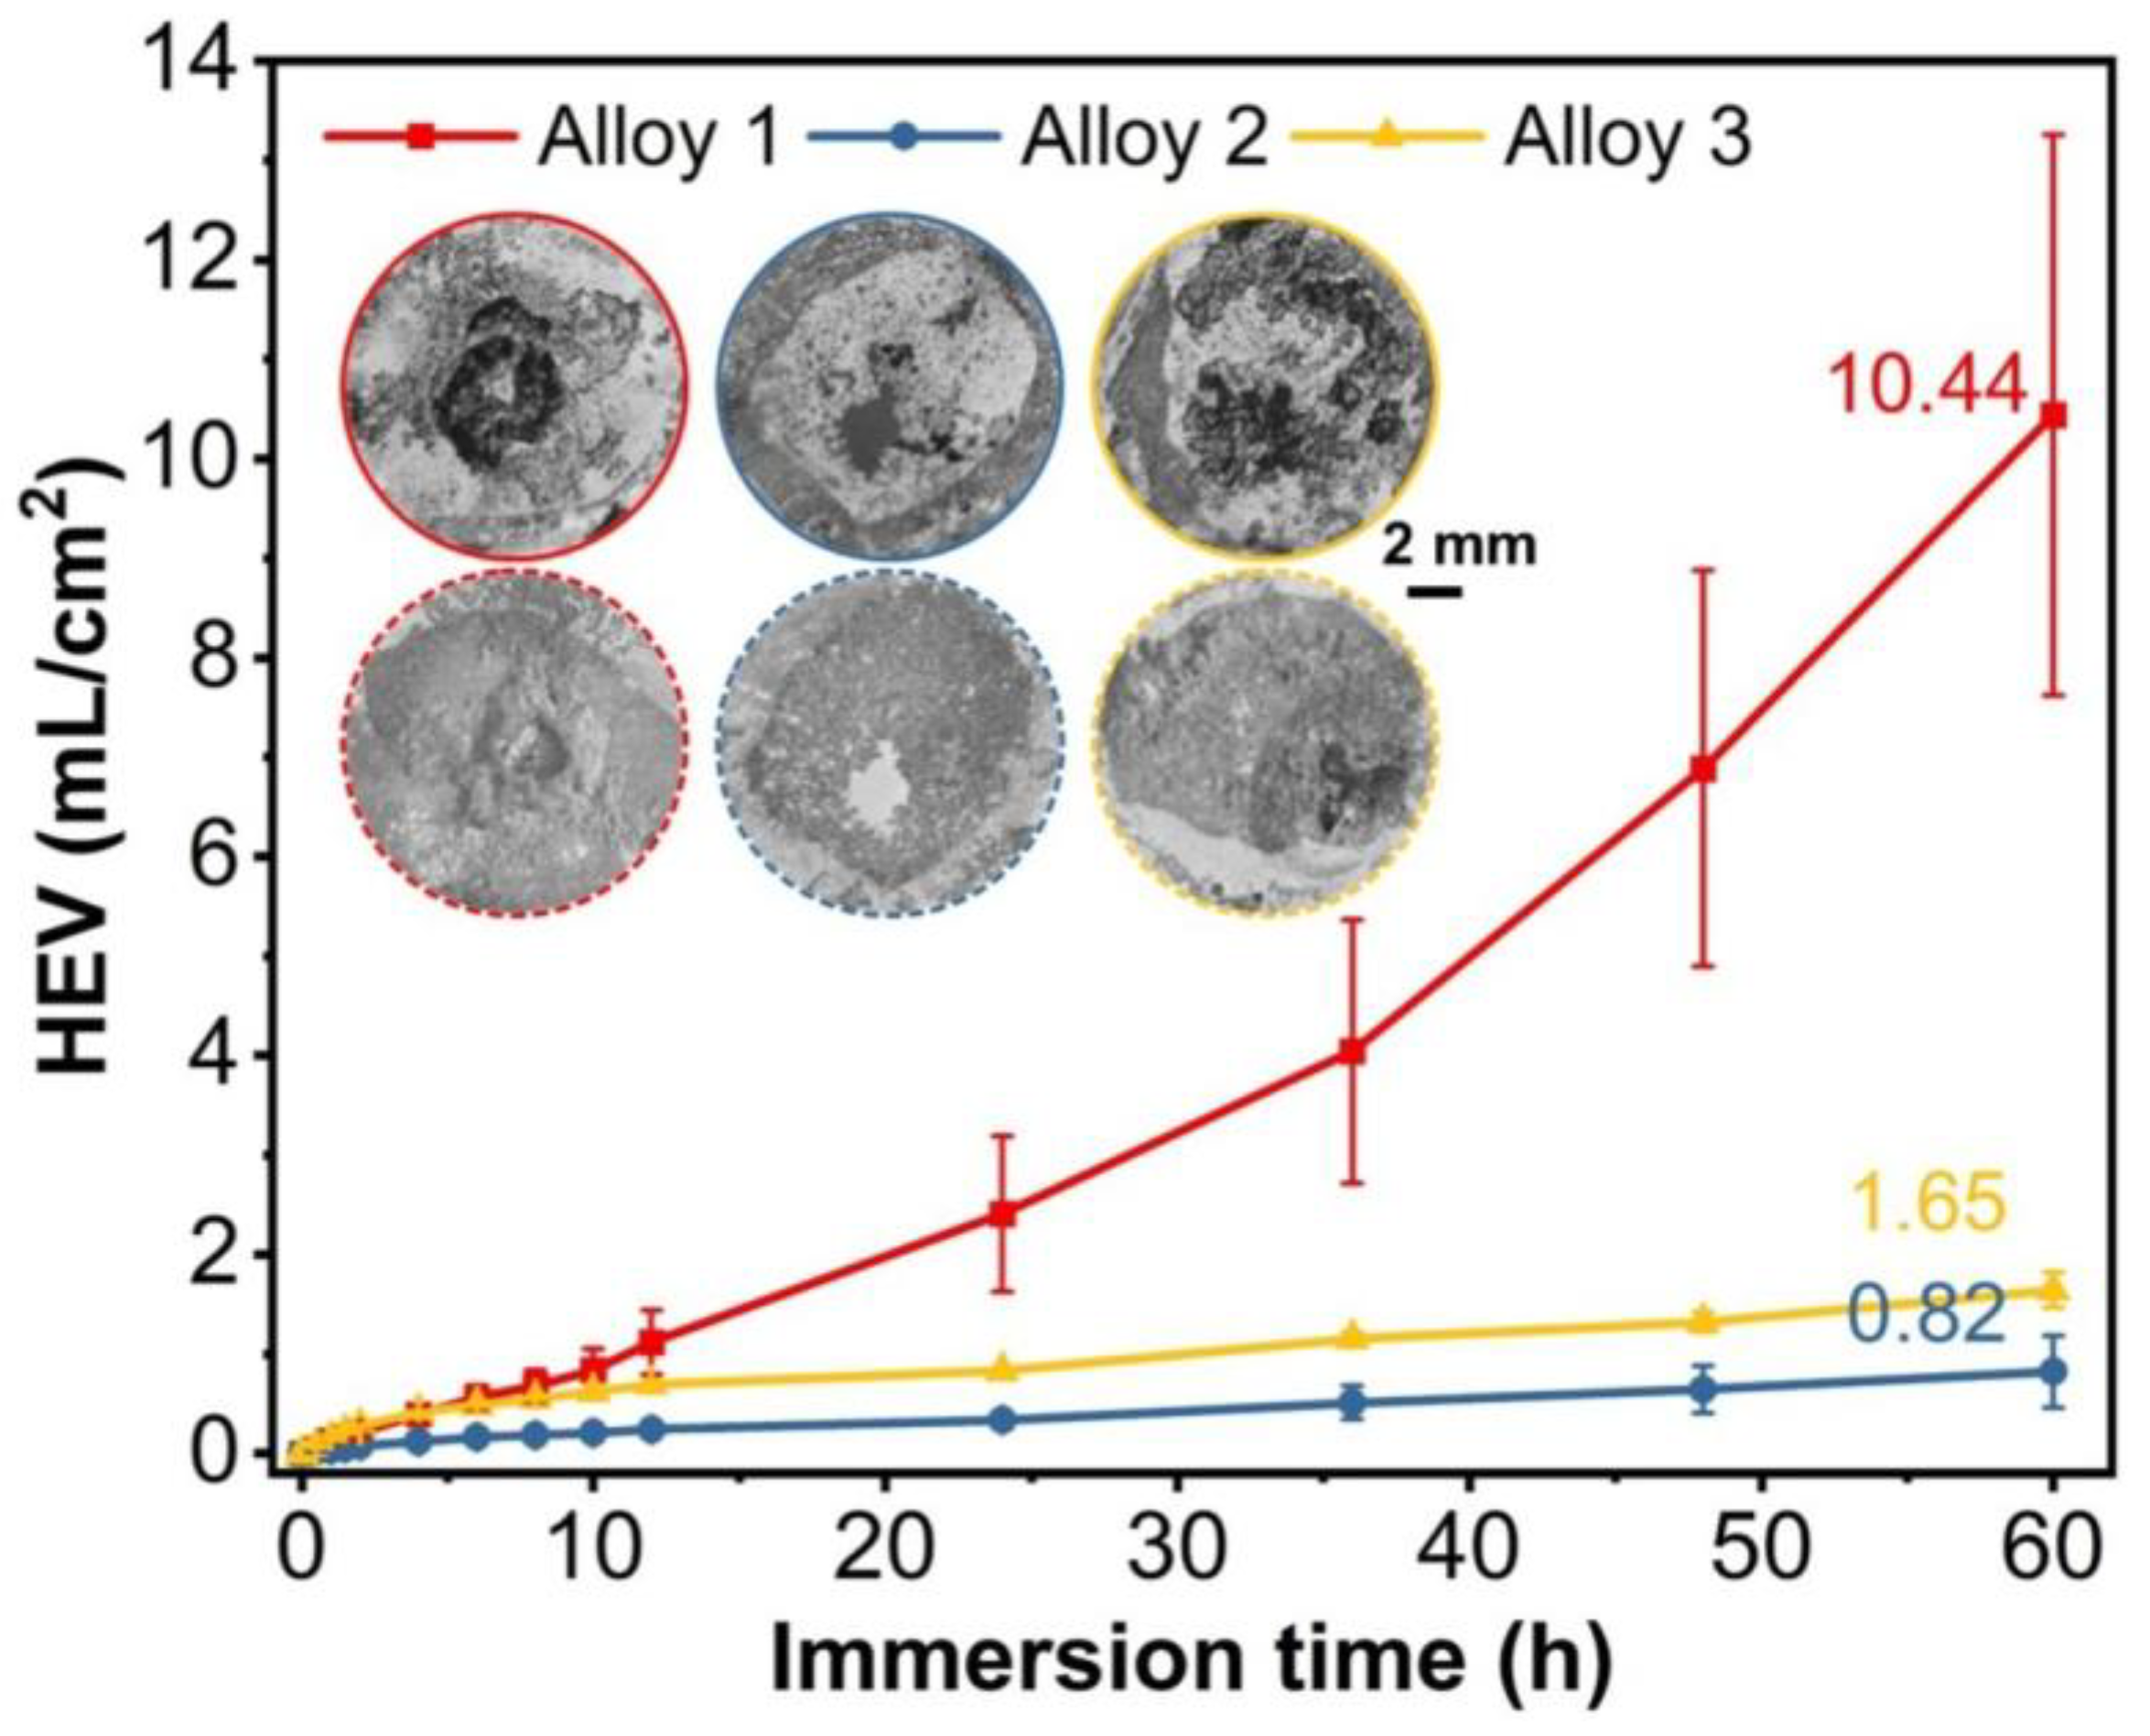
Figure 8 shows hydrogen evolution volume (HEV) curves immersed in 3.5 wt.% NaCl solution. The hydrogen evolution volume of Alloy 1 increases significantly after 24 h immersion, and those of Alloy 2 and Alloy 3 are relatively stable. The total hydrogen evolution volumes of the alloys for 60 h immersion obeys the following sequence: Alloy 1 > Alloy 3 > Alloy 2. In addition, the corrosion rates of Alloy 1, Alloy 2, and Alloy 3 are 8.44 ± 2.28, 0.66 ± 0.28, and 1.32 ± 0.13 mm/y, respectively, according to the HEV.
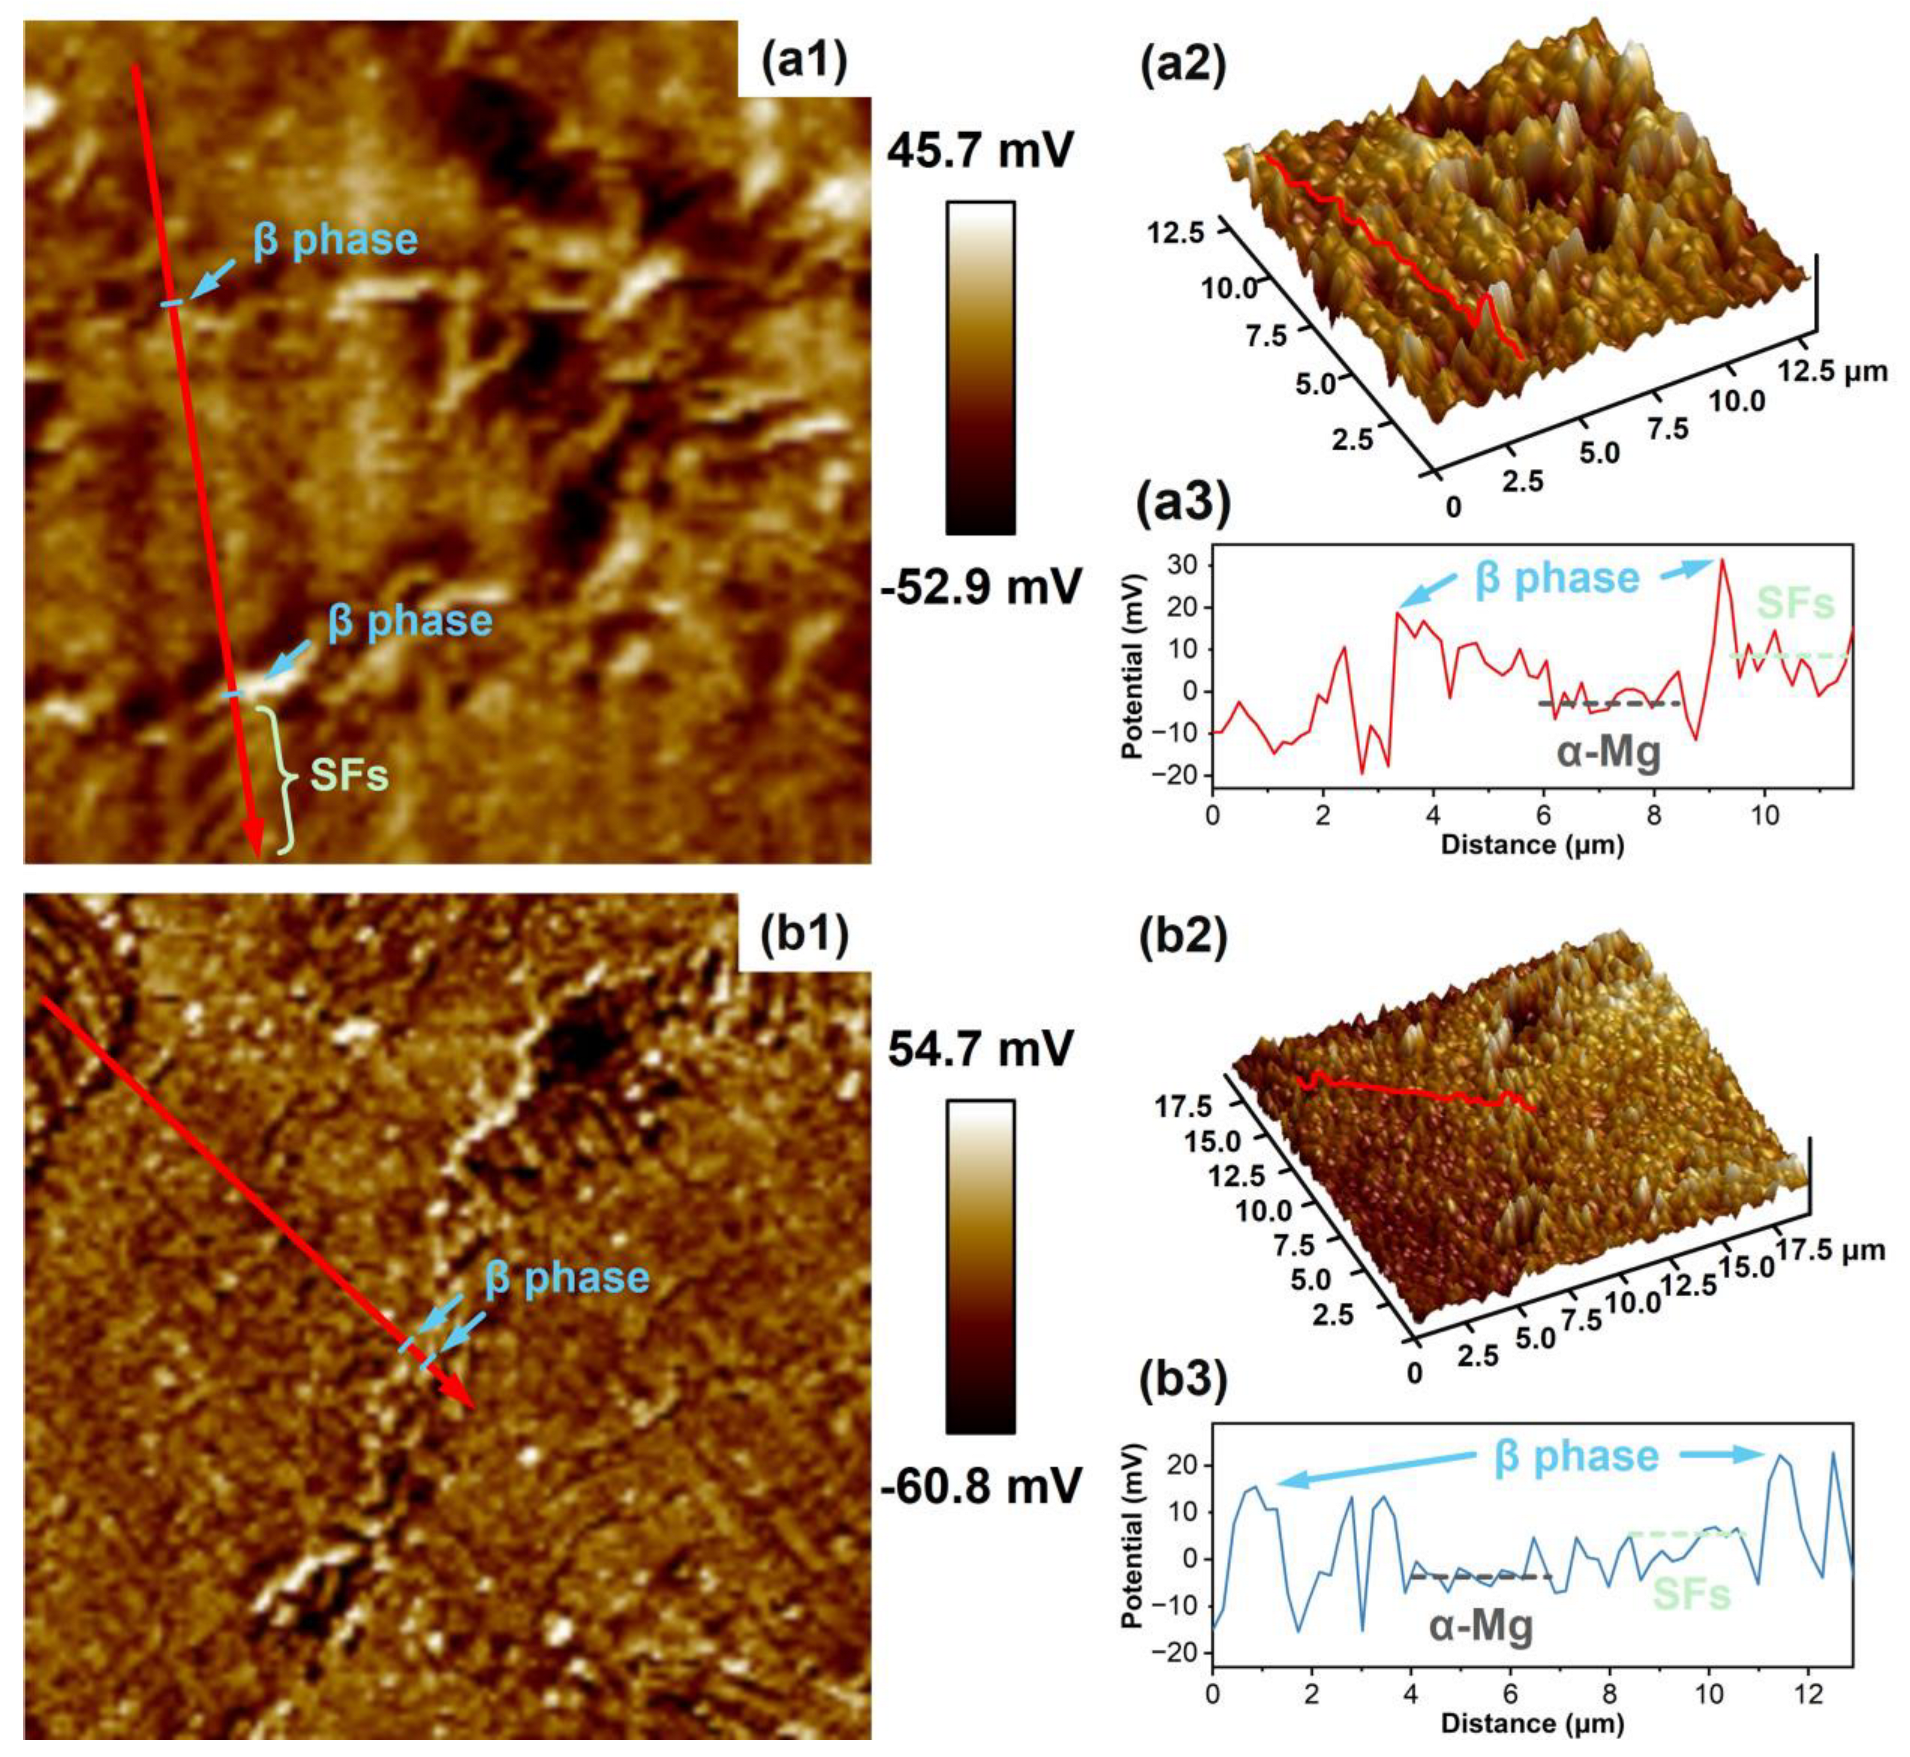
To reveal the corrosion potential of different phases, typical Volta potential maps of Alloy 1 and Alloy 2 are shown in Figure 9. The lines marked in Figure 9(a1,b1) cross different phases, and corresponding Volta potential curves are shown in Figure 9(a3,b3), respectively. The Volta potential values of SFs and β phase in Alloy 1 and Alloy 2 are higher than the Volta potential of the α-Mg matrix, and β phase presents the highest Volta potential among the phases.
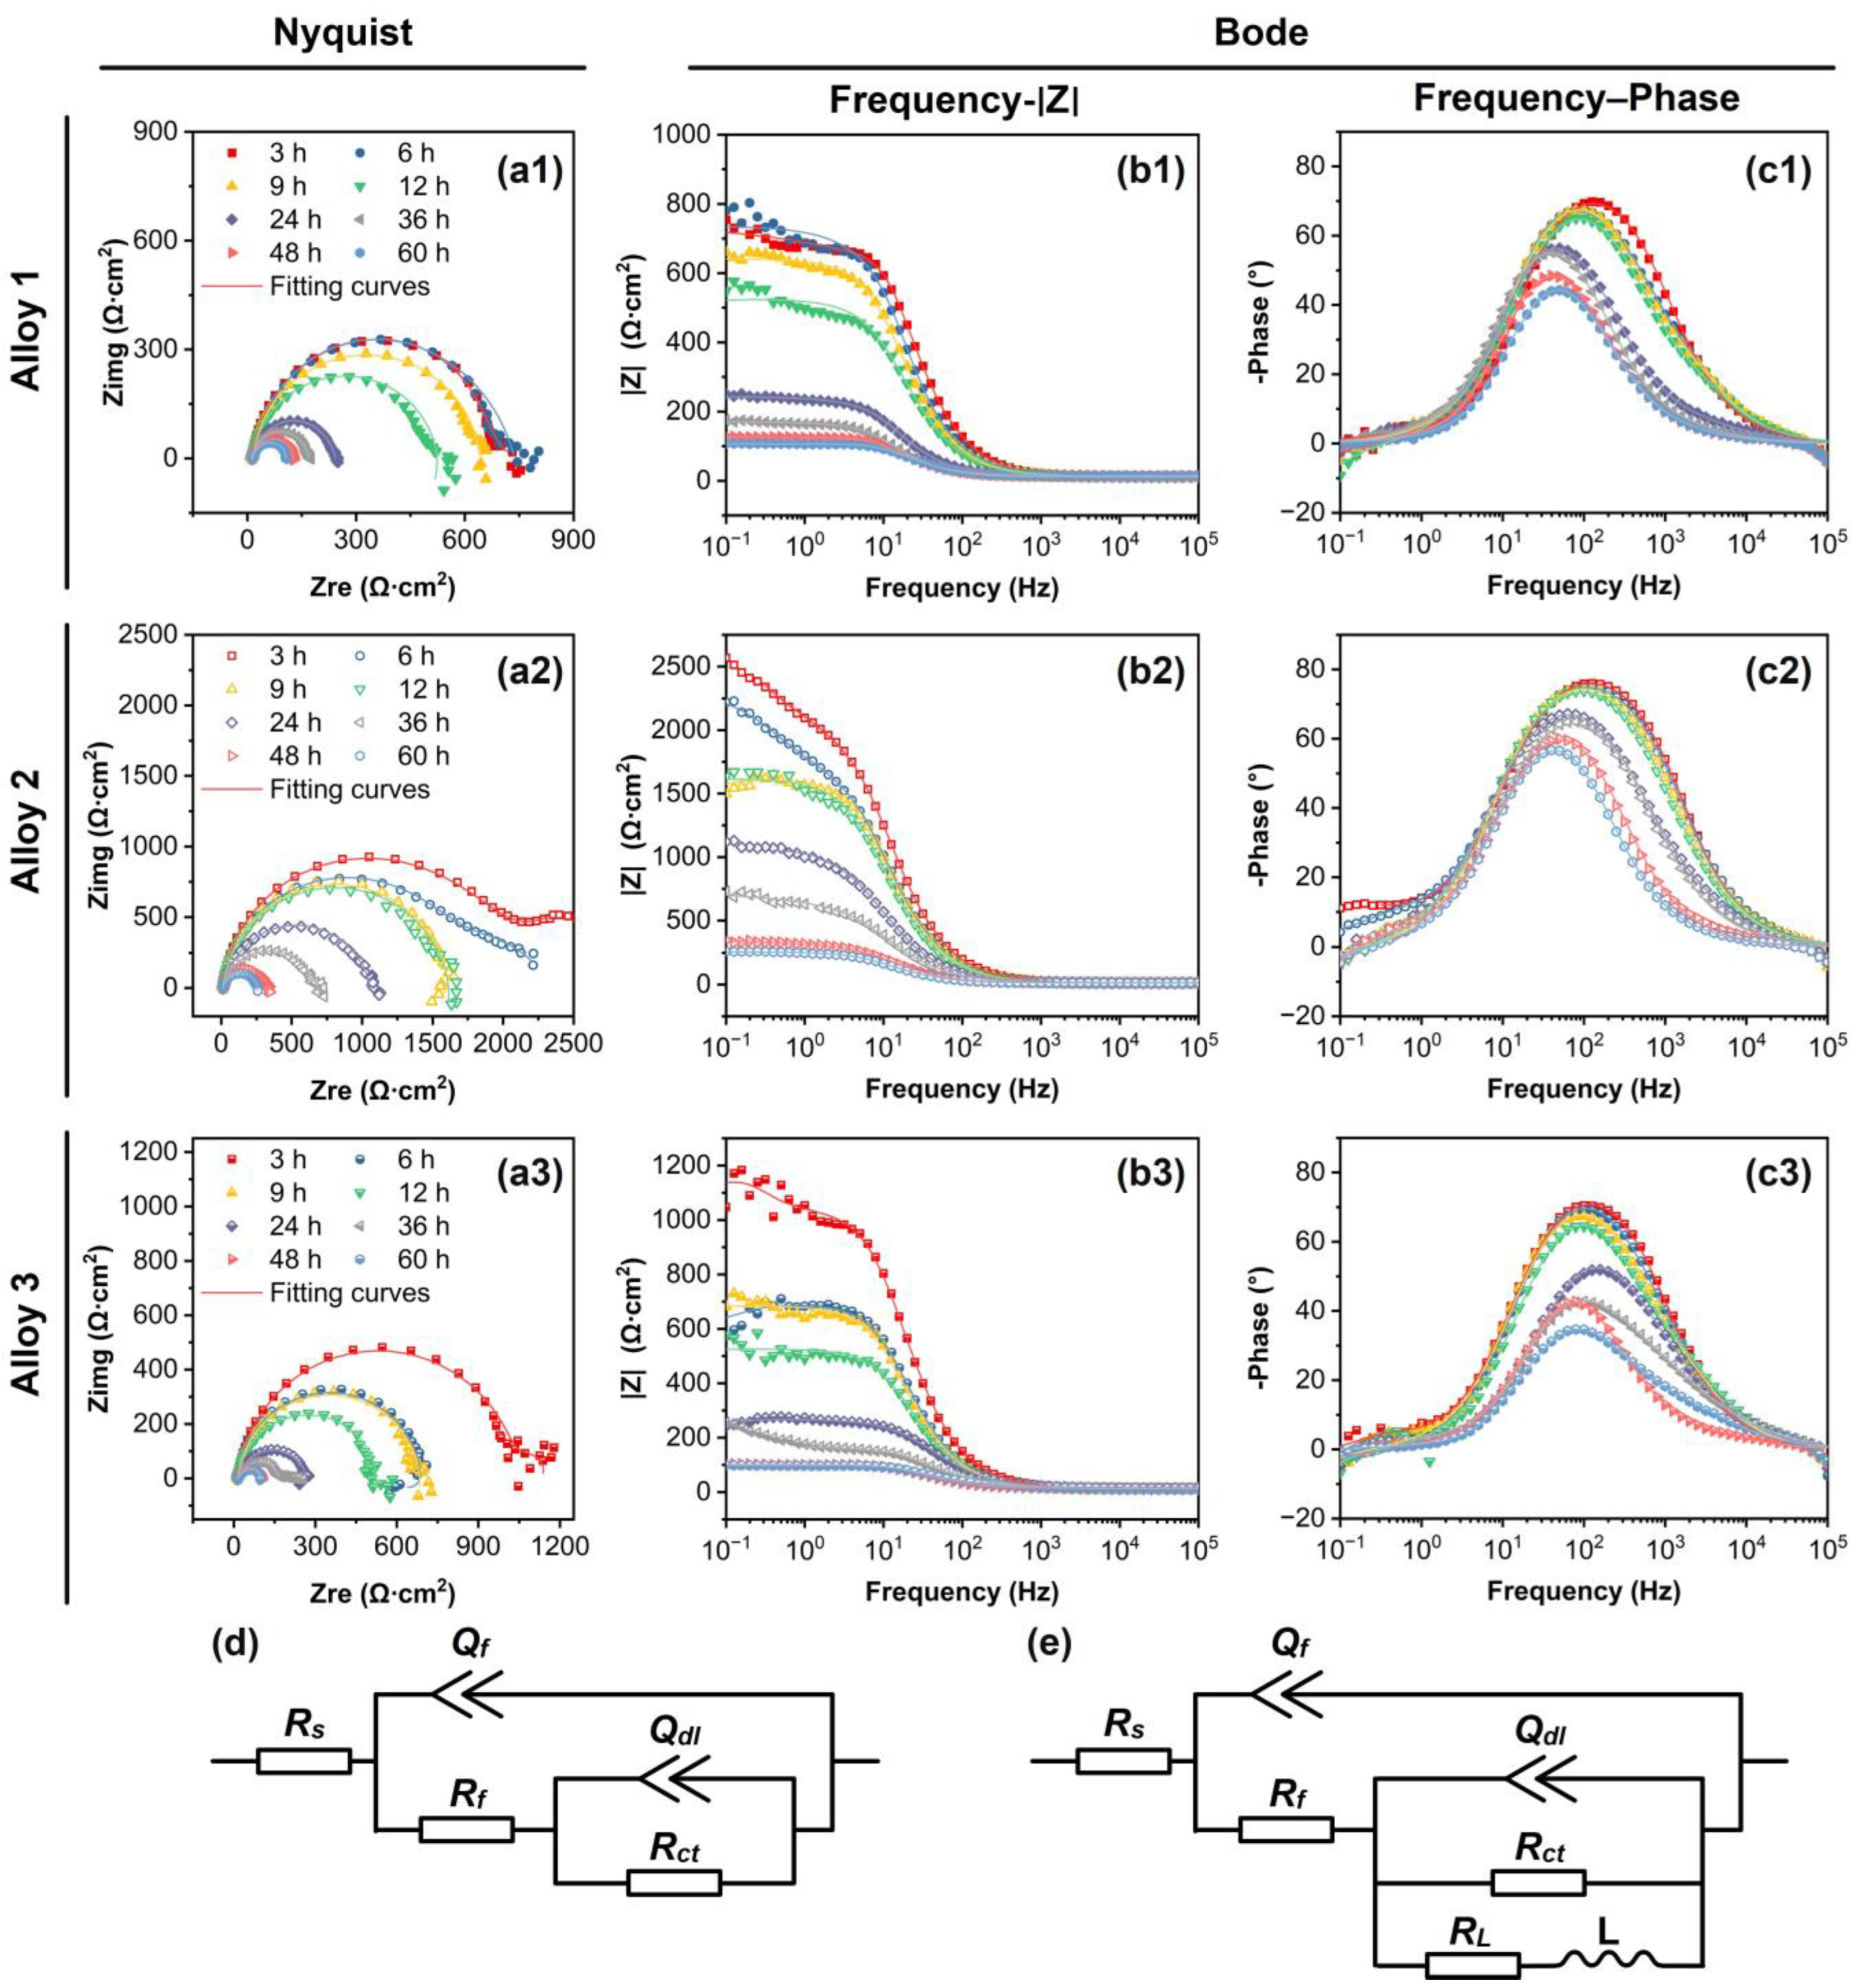
Figure 10 presents the typical EIS results of the as-extruded Mg-12Gd-2Zn-xNd-0.4Zr alloys during the immersion for 60 h. In general, the Nyquist plots demonstrate that the diameter of the capacitive reactance arc decreases with prolonging immersion time. To better understand the corrosion behavior evolutions, the EIS results are fitted by the equivalent circuit models (Rs(Qf(Rf(QdlRct)))) and (Rs(Qf(Rf(QdlRct(RLL))))), as illustrated in Figure 10 (d) and (e), respectively. Specifically, the equivalent circuit model (Rs(Qf(Rf(QdlRct)))) is only utilized to fit the EIS results of Alloy 2 after 3 h and 6 h immersion. Herein, Rs is solution resistance, Rf and Qf represent film resistance and constant phase element, respectively; Rct and Qdl are charge transfer resistance at the film/substrate interface and electric double layer capacity, respectively; and the resistance RL and inductance L are associated with the pitting corrosion. Table S1 lists the fitting equivalent circuit parameters and the effective capacitance value (Ceff, dl) represented by Qdl (evaluated by Brug’s formula [50]) and the effective capacitance value (Ceff, f) associated with the Qf are also calculated and displayed in Table S1. With increasing immersion time, the localized corrosion behaviors represented by RL and L are detected for all the alloys. The polarization resistance values of all the alloys decrease while Ceff, f increases, revealing the gradually attenuating corrosion resistance. The frequency-|Z| Bode plots reveal that the impedance modulus at a low frequency of 0.1 Hz (|Z|0.1 Hz) values at 60 h is in accordance with the following order: Alloy 1 < Alloy 3 < Alloy 2. The larger impedance modulus reflects the greater resistance to corrosion; thus, Alloy 2 shows the best corrosion property. This result is consistent with the corrosion behavior evaluated by the immersion test as presented in Figure 8.
The SEM corrosion morphologies of the as-extruded Mg-12Gd-2Zn-xNd-0.4Zr alloys after 60 h immersion are shown in Figure 11. White and loose corrosion products are observed on the upper surfaces of all the alloys. Furthermore, scaly corrosion morphologies accompanied by microcracks are detected. The corrosion morphologies with the corrosion products removed are shown in Figure 11(a2–c2). The corrosion pits are detected across the entire surface, proving the existence of localized pitting corrosion. Figure 11(a3–c3) present the high-resolution SEM images of the corroded alloys. EDS mapping reveals prominent Gd/Zr-rich eutectic phases on corroded surfaces of Alloy 1 and Alloy 3 (red circles), confirming their nobler electrochemical behavior compared to the α-Mg matrix. In Alloy 2, corrosion-resistant lamellar structures enriched with Gd/Zn persist near corrosion pits, indicating that SFs serve as transitional barriers during corrosion propagation.
According to the immersion and electrochemical tests, the corrosion resistance of Alloy 2 and Alloy 3 has been enhanced significantly by the addition of Nd, and Alloy 2 exhibits the best corrosion resistance among the three alloys.
Herein, the corrosion mechanisms are discussed from the perspectives of texture, grain size, SFs, and corrosion potential differences among different phases. Firstly, the texture affects corrosion resistance. The basal <0001> planes in Mg exhibit inherently higher corrosion resistance across various solutions. Alloy 2 and Alloy 3 contain coexisting grains with differing orientations, promoting galvanic corrosion between basal and prismatic planes that deteriorates overall corrosion resistance [39,51]. However, the corrosion resistance of the Alloy 2 may be explained by the positive impacts of the grain size, SFs, and the decreased Volta potential difference between β phase and α-Mg matrix.
After adding Nd into the alloy, the grain refinement can be observed obviously, as shown in Figure 1 and Figure 4(a4–c4). This is mainly because Nd gathers at the solid–liquid interface and inhibits grain growth of the Mg alloys, thereby contributing to the fine and uniform microstructures [52,53]. Therefore, the grain size evolution is one of the reasons accounting for the better corrosion resistance and the reduced pitting trend of the alloys in the present work. As can be seen from Figure 9, the β phase shows the highest Volta potential, thus forming galvanic corrosion with the α-Mg matrix during the corrosion process. SFs mainly act as the corrosion transition between the β phase and the α-Mg matrix. In general, the α-Mg matrix is corroded first as the anode, followed by SFs, and finally by β phase [4,54]. On the one hand, the volume fraction of SFs in the alloys may plays a crucial role in the corrosion resistance; specifically, more SFs in Alloy 2 enhance its corrosion resistance significantly. On the other hand, the Volta potential of the β phase in Alloy 1 is about 40 mV higher than that of the α-Mg matrix, while the Volta potential of the β phase in Alloy 2 is about 30 mV higher than that of the α-Mg matrix. The abovementioned differences indicate that galvanic corrosion tends to occur weakly in Alloy 2 due to the solute atoms of Nd. Consequently, Alloy 2 exhibits much better corrosion resistance as compared to Alloy 3 and Alloy 1 since it shows the finest grains, the maximum volume fraction of SFs, and the fewest number of unDRXed grains.

4. Conclusions

(1) As-extruded Mg-12Gd-2Zn-xNd-0.4Zr alloys (x = 0, 0.5, and 1.0 wt.%) comprise α-Mg matrix, β phase, and lamellar stacking faults (SFs). Alloy 2 with 0.5 wt.% Nd exhibits the finest grains and highest SFs density. The basal <0001> texture is detected in the alloy without Nd addition, and obvious texture (< 1 ¯ 2 1 ¯ 0 > parallel to ED and the direction close to <0001>) is observed in the alloys with various Nd additions.
(2) Nd additions significantly enhance ambient yield strength through synergistic solid solution strengthening, increased SF density, texture evolution, and grain refinement. Alloy 2 achieves peak tensile/compressive yield strengths. Notably, its 180 °C yield strength retains 95.8% of room-temperature performance.
(3) Combined with the compression and tensile tests at room temperature, the CYS/TYS ratios of the Alloy 2 and Alloy 3 are 0.94 and 0.98, which are higher than that of the Alloy 1 (0.87). The formation of texture, solid solution strengthening, and grain refinement of the alloys with Nd addition are responsible for the reduction in tension–compression YS asymmetry.
(4) Volta potential values of different phases in the as-extruded alloys obey the following order: β phase > SFs > α-Mg matrix. Alloy 2 (0.5 wt.% Nd) demonstrates superior corrosion resistance, attributable to its high SFs density, refined grains, and minimized β/α-Mg electrochemical potential difference.

Supplementary Materials

The following supporting information can be downloaded at: https://www.mdpi.com/article/10.3390/met15101077/s1, Figure S1: OM micrographs (a1–c1) perpendicular and (a2–c2) parallel respectively to the extrusion direction of (a1), (a2) Alloy 1, (b1), (b2) Alloy 2, (c1), (c2) Alloy 3; Table S1: Fitting equivalent circuit parameters obtained from EIS results.

Author Contributions

Conceptualization, J.H. and X.Z.; methodology, J.H., L.H. and J.D.; software, L.H. and J.D.; validation, J.H. and J.D.; formal analysis, L.H. and J.D.; investigation, J.H., L.H. and J.D.; resources, X.Z.; data curation, J.D. and X.Z.; writing—original draft preparation, J.H. and L.H.; writing—review and editing, J.D. and X.Z.; visualization, J.H. and J.D.; supervision, X.Z.; project administration, X.Z.; funding acquisition, X.Z. All authors have read and agreed to the published version of the manuscript.

Funding

This project was supported by the National Natural Science Foundation of China (52071175) and the Key Research and Development Plan (Social Development) of Jiangsu Province (BE2020702).

Data Availability Statement

The data presented in this study are available on request from the corresponding author. The data are not publicly available due to privacy.

Conflicts of Interest

The authors declare no conflict of interest.

References

  1. Yang, Y.; Xiong, X.M.; Chen, J.; Peng, X.D.; Chen, D.L.; Pan, F.S. Research advances of magnesium and magnesium alloys worldwide in 2022. J. Magnes. Alloys 2023, 11, 2611–2654. [Google Scholar] [CrossRef]
  2. Zhan, L.; Kong, C.H.; Zhao, C.Y.; Cui, X.H.; Zhang, L.H.; Song, Y.; Lu, Y.; Xia, L.; Ma, K.; Yang, H.Y.; et al. Recent advances on magnesium alloys for automotive cabin components: Materials, applications, and challenges. J. Mater. Res. Technol. 2025, 36, 9924–9961. [Google Scholar] [CrossRef]
  3. Jing, C.H.; Sheng, L.Y.; Xu, J.H.; Xu, Z.F.; Wu, D.; Jiao, J.K. Improved CFRTP/AZ31B alloy hybrid joint by surface micro-texture and laser rotational welding technique. Mater. Des. 2025, 255, 114155. [Google Scholar] [CrossRef]
  4. Dai, J.W.; Dong, Q.S.; Nie, Y.J.; Jia, Y.Q.; Chu, C.L.; Zhang, X.B. Insight into the role of Y addition in the microstructures, mechanical and corrosion properties of as-cast Mg-Gd-Y-Zn-Ca-Zr alloys. Mater. Des. 2022, 221, 110980. [Google Scholar] [CrossRef]
  5. Behera, M.; Shabadi, R.; Gruescu, C. Engineering Corrosion Resistance in Magnesium Alloys for Biomedical Applications: A Synergy of Zn/Ca Atomic Ratio and Texture-Based Approach. Metals 2024, 14, 1002. [Google Scholar] [CrossRef]
  6. Zhang, Y.X. Regulating the microstructures and creep behaviors of an LPSO-containing Mg alloy via heat treatment. Mater. Sci. Eng. A 2024, 914, 147153. [Google Scholar] [CrossRef]
  7. Kan, Z.Y.; Yang, G.Y.; Xiao, L.; Wang, C.H.; Qin, H.; Wang, B.S.; Jie, W.Q. Asymmetric tension-compression mechanical behaviors of extruded Mg-4.58Zn-2.6Gd-0.18Zr alloy with double-peak fiber texture. J. Alloys Compd. 2024, 989, 174291. [Google Scholar] [CrossRef]
  8. Anyanwu, I.A.; Kamado, S.; Kojima, Y. Aging characteristics and high temperature tensile properties of Mg–Gd–Y–Zr alloys. Mater. Trans. 2001, 42, 1206–1211. [Google Scholar]
  9. Ouyang, S.X.; Yang, G.Y.; Qin, H.; Wang, C.H.; Luo, S.F.; Jie, W.Q. Effect of the precipitation state on high temperature tensile and creep behaviors of Mg-15Gd alloy. J. Magnes. Alloys 2022, 10, 3459–3469. [Google Scholar] [CrossRef]
  10. Liu, X.Q.; Qiao, X.G.; Zhang, X.K.; Zhang, D.D.; Xiao, L.; Zhong, W.J.; Zhu, X.R.; Lian, J.C.; Zheng, M.Y. Achieving low tension-compression yield asymmetry and ultrahigh strength in Mg–1Al–1Ca–0.2Mn (wt%) alloy via sub-micron grain refinement. J. Mater. Res. Technol. 2024, 28, 2235–2246. [Google Scholar] [CrossRef]
  11. Li, J.L.; Chen, H.C.; Wu, D.; Chen, R.S.; Song, J.; Yi, X. Strain rate-dependent tension-compression asymmetry in cast Mg-Gd-Y alloy: Insights into slip and twinning mechanisms. J. Mater. Sci. Technol. 2025, 219, 134–146. [Google Scholar] [CrossRef]
  12. Xie, D.S.; Pan, H.C.; Pan, Z.; Zhang, D.D.; Tang, W.N.; Yang, C.B.; Xie, H.B.; Ren, Y.P.; Qin, G.W. Achieving high heat-resistant property in dilute Mg-0.2Ce wrought alloy by retarding recrystallization process. J. Alloy. Compd. 2023, 958, 170410. [Google Scholar] [CrossRef]
  13. Zhang, Y.Q.; Hong, Y.; Li, H.Y.; Zhang, D.P. Creep behavior and dynamic precipitation of highly heat-resistant Mg alloy with low rare-earth content. J. Alloy. Compd. 2024, 997, 174960. [Google Scholar] [CrossRef]
  14. Qi, M.F.; Wei, L.Y.; Xu, Y.Z.; Wang, J.; Liu, A.S.; Hao, B.; Wang, J.C. Effect of trace yttrium on the microstructure, mechanical property and corrosion behavior of homogenized Mg-2Zn-0.1Mn-0.3Ca-xY biological magnesium alloy. Int. J. Min. Met. Mater. 2022, 29, 1746–1754. [Google Scholar] [CrossRef]
  15. Chang, L.L.; Guo, J.; Su, X.J. Effect of Y on microstructure evolution and mechanical properties of Mg−4Li−3Al alloys. Trans. Nonferr. Met. Soc. China 2021, 31, 3691–3702. [Google Scholar] [CrossRef]
  16. Su, N.; Wu, Q.Y.; Ding, C.Y.; Wu, Y.J.; Peng, L.M. Effect of Y and Gd solutes on grain refinement of the as-extruded Mg-Gd(-Y)-Zn-Mn alloys. J. Alloy. Compd. 2023, 968, 171804. [Google Scholar] [CrossRef]
  17. Dong, N.N.; Wang, J.H.; Ma, H.B.; Jin, P.P. Effects of Nd content on thermal expansion behavior of Mg-Nd alloys. Mater. Today Commun. 2021, 29, 102894. [Google Scholar] [CrossRef]
  18. Wang, C.; Li, H.R.; Guo, E.Y.; Wang, X.J.; Kang, H.J.; Chen, Z.N.; Wang, T.M. The effect of Gd on the microstructure evolution and mechanical properties of Mg-4Zn-0.6Ca alloy. Mater. Sci. Eng. A 2023, 868, 144756. [Google Scholar] [CrossRef]
  19. Nie, Y.J.; Dai, J.W.; Li, X.; Zhang, X.B. Recent developments on corrosion behaviors of Mg alloys with stacking fault or long period stacking ordered structures. J. Magnes. Alloys 2021, 9, 1123–1146. [Google Scholar] [CrossRef]
  20. Dong, Q.S.; Jiang, J.H.; Zhang, J.H.; Hu, Z.; Zhang, X.B. Clarifying stress corrosion cracking behavior of biomedical Mg-Gd-Zn-Zr alloy. J. Magnes. Alloys 2025, 13, 3450–3465. [Google Scholar] [CrossRef]
  21. Dai, C.N.; Pei, S.L.; Ma, K.; Wang, Y.; Wang, D.Q.; Wang, J.X.; Ma, J.F. Rapid corrosion rates and high mechanical properties of as-extruded Mg–Er–Ni alloys by introducing LPSO and γʹ phases. J. Mater. Res. Technol. 2023, 24, 6246–6263. [Google Scholar] [CrossRef]
  22. Tang, Y.; Gao, X.; Chen, A.Q.; Liu, B.S.; Zhang, H.; Li, S.S.; Qin, G.W. Deformation behavior and strengthening mechanism of a gradient nanostructured WE43 Mg alloy. J. Magnes. Alloys, 2025; online. [Google Scholar] [CrossRef]
  23. Wang, X.; Zhao, Y.X.; Li, M.; Tang, S.X.; Huang, Y.C.; Liu, Y.; Huang, C.Q. Achieving enhanced mechanical properties of extruded Mg-Gd-Y-Zn-Zr alloy by regulating the initial LPSO phases. Mater. Sci. Eng. A 2024, 917, 147411. [Google Scholar] [CrossRef]
  24. Chen, Y.; Liu, F.L.; Wu, Y.J.; Peng, L.M.; Li, L.; He, C.; Chen, Q.; Liu, Y.J.; Wang, Q.Y. Outstanding fatigue performance of Mg-Gd-Zn-Zr alloy enriched with SFs rather than LPSO Structure. J. Magnes. Alloys 2025, 13, 90–100. [Google Scholar] [CrossRef]
  25. Koji, H.; Xuan, L.Z.; Michiaki, Y.; Yoshihito, K.; Takayoshi, N. Strengthening mechanisms acting in extruded Mg–based long–period stacking ordered (LPSO)–phase alloys. Acta Mater. 2019, 163, 226–239. [Google Scholar]
  26. Nie, Z.; Wang, F.L.; Li, J.Y.; Liu, C.L.; Zhao, C.Y.; Sanandiya, S.C.; Calvat, M.; Dhruv Anjaria, D.; Zeng, J.; Dong, S.; et al. Strain localization induced by closely spaced lamellae structure in a Mg alloy containing long period stacking ordered structure. Int. J. Plast. 2025, 193, 104423. [Google Scholar] [CrossRef]
  27. Xie, J.S.; Zhang, J.H.; Zhang, Z.; Yang, Q.; Guan, K.; He, Y.Y.; Wang, R.; Zhang, H.; Qiu, X.; Wu, R.Z. New insights on the different corrosion mechanisms of Mg alloys with solute-enriched stacking faults or long period stacking ordered phase. Corros. Sci. 2022, 198, 110163. [Google Scholar] [CrossRef]
  28. Zhang, Q.; Wang, F.L.; Zeng, J.; Zhou, H.T.; Wang, F.H.; Dong, S.; Jin, L.; Dong, J. Nd microalloying significantly enhances precipitation strengthening of Mg-Gd-Y-Zn-Zr alloy. J. Alloys Compd. 2025, 1025, 180324. [Google Scholar] [CrossRef]
  29. Bao, R.R.; Zhang, J.H.; He, Y.Y.; Li, Z.H.; Liu, S.J.; Dong, H.; Yang, Q.; Zhang, X.B.; Qiu, X. Exploring low-alloyed as-extruded Mg alloy with high strength and high corrosion resistance. J. Magnes. Alloys, 2025; online. [Google Scholar] [CrossRef]
  30. Gao, S.P.; Lyu, S.Y.; Zhao, Q.; Chen, M.F. Effect of Extrusion Temperature on the Microstructure and Properties of Biomedical Mg-1Zn-0.4Ca-1MgO Composite. Metals 2025, 15, 337. [Google Scholar] [CrossRef]
  31. Zhang, R.Z.; Huang, W.Y.; Liu, Y.; Zhao, J.G.; Ma, Q.; Ren, Z.Z.; Yang, X.Y.; Wu, Y.Z.; Wang, L.J.; Zhou, S.; et al. Influence of different extrusion temperatures on microstructure and mechanical properties of Mg-Bi-Zn-Ca alloy. Vacuum 2025, 238, 114297. [Google Scholar] [CrossRef]
  32. Nie, Q.D.; Liu, J.Z.; Ge, Z.B.; Wang, Y.Q.; Zou, Y.; Wang, S.Z. High-strength Mg-Gd-Y-Zn-Zr alloy with large size produced by differential temperature and small extrusion ratio process. J. Alloy. Compd. 2025, 1036, 181790. [Google Scholar] [CrossRef]
  33. Kang, X.K.; Nie, K.B.; Deng, K.K.; Guo, Y.C. Effect of extrusion parameters on microstructure, texture and mechanical properties of Mg-1.38Zn-0.17Y-0.12Ca (at. %) alloy. Mater. Charact. 2019, 151, 137–145. [Google Scholar] [CrossRef]
  34. Lu, X.Z.; Chen, Z.J.; Zou, X.J.; Zhang, J.; Tu, Y.; Zhou, X.J.; Chen, X.M.; Lai, C.P.; Chan, L.; Zeng, G. Synergistic Improvement of Mechanical and Corrosion Properties of Mg-9.1Y-1.8Zn Alloys by Hot Extrusion. Met. Mater. Int. 2024, 30, 3141–3154. [Google Scholar] [CrossRef]
  35. Liu, Y.H.; Liu, B.Y.; Li, B.; Wang, J.H.; Li, H.X.; Ding, N.; Zhang, J.S. The microstructure and corrosion properties of as-extruded Mg-Gd-Y-Zn-Cu-Ni alloy by altering the preheat treatment. J. Mater. Res. Technol. 2025, 37, 4925–4935. [Google Scholar] [CrossRef]
  36. Hong, L.X.; Wang, R.X.; Zhang, X.B. Effects of Nd on microstructure and mechanical properties of as-cast Mg-12Gd-2Zn-xNd-0.4Zr alloys with stacking faults. Int. J. Min. Met. Mater. 2022, 29, 1570–1577. [Google Scholar] [CrossRef]
  37. Hong, L.X.; Wang, R.X.; Zhang, X.B. The Role of Nd in Corrosion Properties of Mg-12Gd-2Zn-0.4Zr Alloys. J. Mater. Eng. Perform. 2021, 30, 6000–6008. [Google Scholar] [CrossRef]
  38. Panchal, M.; Ravi, K.R.; Kaushik, L.; Khatirkar, R.; Choi, S.; Singh, J. Texture Control Techniques for Improving Room Temperature Formability of Mg Alloys including Pre-twinning: A Review. J. Magnes. Alloys 2023, 29, 3471–3489. [Google Scholar] [CrossRef]
  39. Xu, Z.H.; Zhang, J.H.; He, Y.Y.; Yang, Q.; Liu, S.J.; Zhao, T.F.; Dong, H.; Wu, R.Z.; Zhang, X.B.; Qiu, X. Revealing anti-corrosion mechanism of low-alloyed Mg-Gd-Zn-Zr alloy with ultra-low corrosion rate. Corros. Sci. 2025, 251, 112931. [Google Scholar] [CrossRef]
  40. Liu, K.; Liu, J.X.; Li, S.B.; Wang, Z.H.; Du, W.B.; Wang, Q.F. Effects of secondary phases on texture and mechanical properties of as-extruded Mg–Zn–Er alloys. Trans. Nonferr. Met. Soc. China 2018, 28, 890–895. [Google Scholar] [CrossRef]
  41. Yang, Q.; Lv, S.H.; Guan, K.; Xie, Z.F.; Qiu, X. Extra-conventional strengthening mechanisms in non-recrystallized grains of an extruded Mg-Gd-Zr alloy. J. Magnes. Alloys 2025, 12, 4561–4573. [Google Scholar] [CrossRef]
  42. Li, S.C.; Wang, Z.; Zhao, X.; Wang, X.D.; Yu, J.M. Study on the plasticity improvement mechanism and grain refinement of AZ80 Mg alloy under cryogenic multi-directional forging. J. Mater. Res. Technol. 2024, 33, 384–397. [Google Scholar] [CrossRef]
  43. Medina, J.; Garces, G.; Pérez, P.; Stark, A.; Schell, N.; Adeva, P. High temperature mechanical behaviour of Mg–6Zn–1Y alloy with 1 wt.% calcium addition: Reinforcing effect due to I-(Mg3Zn6Y1) and Mg6Zn3Ca2 phases. J. Magnes. Alloys 2020, 8, 1047–1060. [Google Scholar] [CrossRef]
  44. Leng, Z.; Zhang, J.H.; Zhang, M.L.; Liu, X.H.; Zhan, H.B.; Wu, R.Z. Microstructure and high mechanical properties of Mg–9RY–4Zn (RY: Y-rich misch metal) alloy with long period stacking ordered phase. Mater. Sci. Eng. A 2012, 540, 38–45. [Google Scholar] [CrossRef]
  45. Su, N.; Wu, Y.J.; Deng, Q.C.; Chang, Z.Y.; Wu, Q.Y.; Xue, Y.T.; Yang, K.; Chen, Q.; Peng, L.M. Synergic effects of Gd and Y contents on the age-hardening response and elevated-temperature mechanical properties of extruded Mg–Gd(-Y)-Zn-Mn alloys. Mater. Sci. Eng. A 2021, 810, 141019. [Google Scholar] [CrossRef]
  46. Chen, B.; Zheng, J.X.; Yang, C.M.; Chen, Y.X.; Cao, S.C.; Zhao, Z.X.; Li, X.L.; Lu, C. Mechanical Properties and Deformation Mechanisms of Mg-Gd-Y-Zr Alloy at Cryogenic and Elevated Temperatures. J. Mater. Eng. Perform. 2016, 26, 590–600. [Google Scholar] [CrossRef]
  47. Li, X.Y.; Xia, W.J.; Chen, J.H.; Yan, H.G.; Li, Z.Z.; Su, B.; Song, M. Dynamic recrystallization, texture and mechanical properties of high Mg content Al–Mg alloy deformed by high strain rate rolling. Trans. Nonferrous Met. Soc. China 2021, 31, 2885–2898. [Google Scholar] [CrossRef]
  48. Li, B.; Wu, J.; Teng, B.G. Influences of the Texture Characteristic and Interdendritic LPSO Phase Distribution on the Tensile Properties of Mg–Gd–Y–Zn–Zr Sheets Through Hot Rolling. Acta Metall. Sin. (Engl. Lett.) 2021, 34, 1051–1064. [Google Scholar] [CrossRef]
  49. Papanastasiou, P.; Durban, D. Singular crack-tip plastic fields in Tresca and Mohr-Coulomb solids. Int. J. Solids Struct. 2018, 136–137, 250–258. [Google Scholar] [CrossRef]
  50. Dong, Q.S.; Dai, J.W.; Qian, K.; Liu, H.; Zhou, X.X.; Yao, Q.Q.; Lu, M.M.; Chu, C.L.; Xue, F.; Bai, J. Dual self-healing inorganic-organic hybrid coating on biomedical Mg. Corros. Sci. 2022, 200, 110230. [Google Scholar] [CrossRef]
  51. Zhang, S.; Liu, B.C.; Li, M.X.; Wang, H.Y.; Ma, Y.L. Effect of Microstructures and Textures on Different Surfaces on Corrosion Behavior of an as-Extruded ATZ411 Magnesium Alloy Sheet. Acta Metall. Sin. (Engl. Lett.) 2021, 34, 1029–1041. [Google Scholar] [CrossRef]
  52. Djebari, K.; Türen, Y.; Elen, L.; Ahlatçı, H. A Comparative Study of As-Cast Alloys of ZW21 with Varied Element Additions, Investigating Dry and Corrosive Wear in Body Fluid. JOM 2025, 77, 4344–4362. [Google Scholar] [CrossRef]
  53. Yi, S.Y.; Zhao, S.C.; Feng, Y.C.; Wang, L.; Guo, E.J.; Sun, Q.Y. Effect of heat treatment on microstructure, mechanical properties and corrosion behavior of Mg–Sm–Zn–Zr–xNd alloys. J. Mater. Res. Technol. 2025, 36, 5341–5354. [Google Scholar] [CrossRef]
  54. Zhang, X.B.; Dai, J.W.; Zhang, R.F.; Ba, Z.X.; Birbilis, N. Corrosion behavior of Mg–3Gd–1Zn–0.4Zr alloy with and without stacking faults. J. Magnes. Alloys 2019, 7, 240–248. [Google Scholar] [CrossRef]
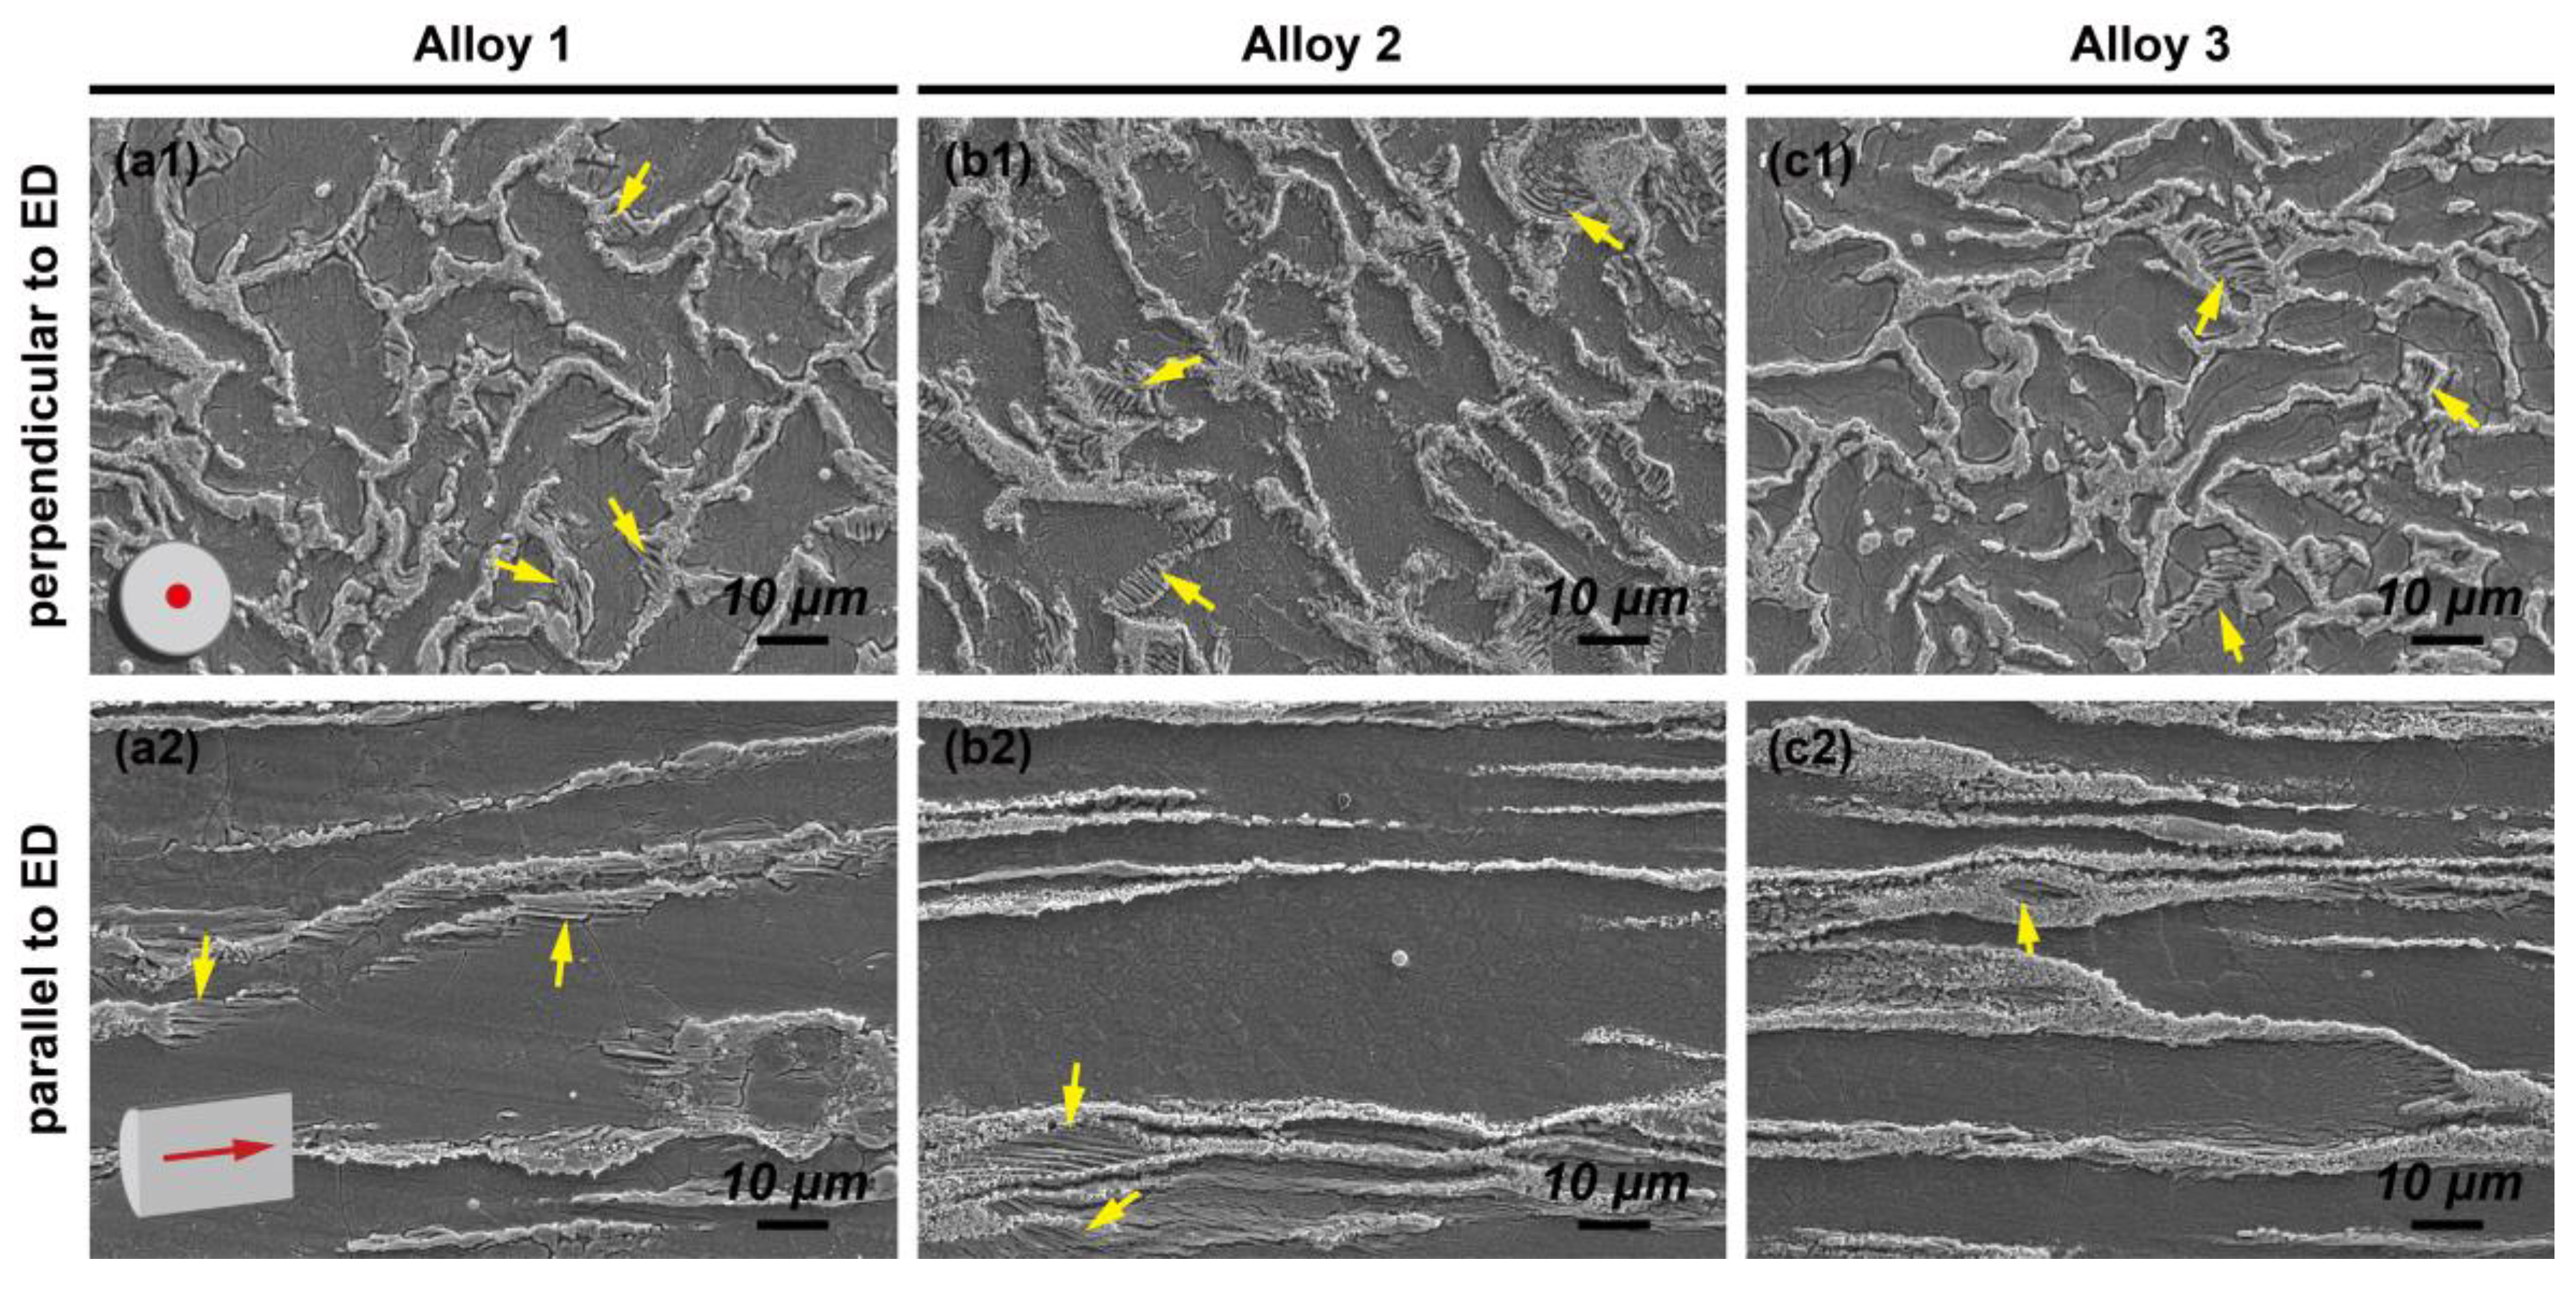
Figure 1. SEM micrographs (a1c1) perpendicular and (a2c2) parallel, respectively, to the extrusion direction of (a1,a2) Alloy 1, (b1,b2) Alloy 2, and (c1,c2) Alloy 3.
Metals 15 01077 g001
Figure 2. (a1c1) SEM images with high magnification, (a2c2) bright-field TEM images, and (a3c3) corresponding SAED patterns of (a1a3) Alloy 1, (b1b3) Alloy 2, and (c1c3) Alloy 3.
Metals 15 01077 g002
Figure 3. XRD patterns of the as-extruded Mg-12Gd-2Zn-xNd-0.4Zr alloys.
Metals 15 01077 g003
Figure 4. EBSD orientation maps with the extrusion direction and corresponding {0001} pole figures (PFs), inverse pole figures (IPFs), and grain size distribution of (a1a4) Alloy 1, (b1b4) Alloy 2, and (c1c4) Alloy 3.
Metals 15 01077 g004
Figure 5. Typical (a1) tensile curves at room temperature and 180 °C as well as (a2) the compressive curves, (b) the yield strength, and (c) the elongation of the as-extruded alloys under the different testing conditions.
Metals 15 01077 g005
Figure 6. Tensile fracture morphologies of the (a1,a2) Alloy 1, (b1,b2) Alloy 2, and (c1,c2) Alloy 3 at (a1c1) room temperature and (a2c2) 180 °C and the compression fracture morphologies of (a3) Alloy 1, (b3) Alloy 2, and (c3) Alloy 3.
Metals 15 01077 g006
Figure 7. Mechanical properties of Mg alloys at room and high temperature [8,43,44,45,46].
Metals 15 01077 g007
Figure 8. Hydrogen evolution of the alloys immersed in 3.5% NaCl solution for 60 h.
Metals 15 01077 g008
Figure 9. Volta potential maps of (a1a3) Alloy 1 and (b1b3) Alloy 2, including 2D maps of volta potential of (a1) Alloy 1 and (b1) Alloy 2, 3D volta potential maps of (a2) Alloy 1 and (b2) Alloy 2, and the marked line profiles of volta potential of (a3) Alloy 1 and (b3) Alloy 2.
Metals 15 01077 g009
Figure 10. Typical EIS results of as-extruded Mg-12Gd-2Zn-xNd-0.4Zr alloys: (a1a3) Alloy 1, (b1b3) Alloy 2, (c1c3) Alloy 3 and fitted equivalent circuit models (d) (Rs(Qf(Rf(QdlRct)))) and (e) (Rs(Qf(Rf(QdlRct(RLL))))), respectively.
Metals 15 01077 g010
Figure 11. SEM corrosion morphologies of the alloys after the 60 h immersion, specifically (a1c1) before and (a2c2) after removing the corrosion products, respectively, as well as the corresponding EDS maps of (a3c3).
Metals 15 01077 g011
Table 1. Alloying element contents (wt.%) of the marked regions in Figure 2.
AlloysAreasGdZnZrNdMg
Alloy 1A14.960.520.26-Bal.
B15.891.670.24-Bal.
C140.6410.200.20-Bal.
Alloy 2A26.720.740.680.91Bal.
B211.362.000.470.97Bal.
C255.8014.650.212.87Bal.
Alloy 3A37.721.270.870.99Bal.
B312.753.000.271.61Bal.
C350.0215.530.355.79Bal.
Disclaimer/Publisher’s Note: The statements, opinions and data contained in all publications are solely those of the individual author(s) and contributor(s) and not of MDPI and/or the editor(s). MDPI and/or the editor(s) disclaim responsibility for any injury to people or property resulting from any ideas, methods, instructions or products referred to in the content.