Article

Analysis of Strain Hardening Stages of AISI 316 LN Stainless Steel Under Cold Rolling Conditions

1
Bodva Industry and Innovation Cluster, Budulov 174, 04501 Moldava and Bodvou, Slovakia
2
Department of Metallic Materials, Institute of Materials, Faculty of Materials, Metallurgy and Recycling, Technical University of Kosice, Park Komenského 11, 04200 Košice, Slovakia
3
Department of Technology, Materials and Computer-Aided Production, Faculty of Mechanical Engineering, Technical University of Košice, Letná 9, 04002 Košice, Slovakia
4
Department of Material Analysis, Research Centre Řež, Hlavní 130, 25068 Husinec, Czech Republic
*
Authors to whom correspondence should be addressed.
Metals 2025, 15(10), 1060; https://doi.org/10.3390/met15101060
Submission received: 12 August 2025 / Revised: 16 September 2025 / Accepted: 17 September 2025 / Published: 23 September 2025
(This article belongs to the Special Issue Numerical Simulation and Experimental Research of Metal Rolling)

Abstract

In the present investigation, stress–strain curves and strain hardening rates on samples rolled at ambient temperature with thickness reductions of 0%, 10%, 30%, and 50% were studied. On the processed samples, static tensile tests at ambient temperature were performed. Transformation of the engineering stress–strain curves to true stress–strain curves and their numerical processing by first derivation (θ = dσ/dε) was carried out. Dependencies θ = f(εT) characterizing the strain hardening rates were derived. From the curves and the true stress–strain and strain hardening rates, the three stages describing different rates of strain hardening were identified. A rapid increase in true stress and a rapid decrease in the strain hardening rate in Stage I were observed. Quasi-linear dependencies with an increase in true stress but with a slow, gradual decline in the strain hardening rate in Stage II were obtained. Slowly increasing true strains, accompanied by a decrease in strain hardening rates and their transition to softening, led to the formation of plastic instability and necking in Stage III. The endpoints of the strain hardening rate depending on the cold rolling deformations lie in the following intervals: θStage I ∈ <1904;3032> MPa, θStage II ∈ <906;−873> MPa, θStage III ∈ <−144;−11,979> MPa. While in Stage I and Stage II, the plastic deformation mechanism is predominantly dislocation slip, in Stage III, the plastic deformation mechanism is twinning accompanied by dislocation slip.

1. Introduction

The mechanical properties of austenitic stainless steel (SS) are primarily a function of the face-centred cubic (FCC) crystallographic system of austenite [1,2,3,4] and, secondarily, a function of the plastic deformation conditions, primarily cold deformations. Because the crystallographic system of austenite strongly depends on the chemical conception, the level of mechanical properties is mainly determined by solid solution strengthening from interstitial and substitutional elements and other contributions that fall under the term passive strengthening [5,6,7,8].
An effective method of influencing the rise in mechanical properties is active strengthening contributions, which depend primarily on the conditions of plastic deformations [9,10,11]. Using plastic deformations, it is possible to influence mechanical properties over a wide range. In addition to the level of mechanical properties, it is also important to consider the plastic properties of the material, such as data on the strain hardening rate and the strain hardening coefficient (exponent) for the material secondarily used for the cold forming of sheets, e.g., by stamping. To determine these characteristics, it is necessary to know the stress and strain curves and the appropriate points where plastic deformation begins and ends without damaging the material. The interval between suitable points is called uniform deformation, where the stress increases directly proportionally to the strain.
Many authors have analyzed stress–strain curves to define the coordinates of these suitable points depending on the physical–metallurgical characteristics of the material [12,13,14,15,16,17,18]. After reaching the yield point, uniform deformation occurs. According to the authors of [5], the onset of uniform deformation does not lie near the yield point. The final point of uniform deformation is characterized by the beginning of the necking formation. Many authors have characterized individual parts of the stress–strain curve with different numbers of stages describing the strengthening of materials.
FCC materials usually exhibit three different stages [16,17,18,19,20,21,22] of hardening, which are referred to as Stage I, Stage II, and Stage III.
Other authors have described the existence of four stages [12,14,23,24] of hardening, which are referred to as Stage I, Stage II, Stage III, and Stage IV, respectively. The authors of [25,26] defined the changing strain hardening rate curves vs. logarithmic true strain ((θ = dσT/dεT) = f(ln (εT))) as the following stages of strain hardening:
(i)
The initial portion of the transient stage, in which θ decreases rapidly (Stage I);
(ii)
A stage where θ increases gradually with εT to a maximum (Stage II);
(iii)
A stage where θ decreases due to the onset of dynamic recovery (Stage III);
(iv)
A stage where θ decreases rapidly (Stage IV).
The authors of [27,28,29] showed that strengthening stages are dependent on the strain rates and deformation temperature. While Stages I, II, and III were observed at low strain rates, Stage IV was observed only after reaching a high strain rate. Other authors have analyzed the influence of the changing course of the strain hardening rate based on dislocation theory [24,30]. The authors of [24] characterized the individual stages as follows: Stage I exhibits almost no hardening and is associated with single slip. Stage II exhibits a nearly constant hardening rate and is associated with early stages of multiple slips. Stage III exhibits a steadily decreasing strain hardening rate, which is related to dynamic recovery processes. Stage IV exhibits an almost constant strain hardening rate, the magnitude of which is very low, but finite. Other authors [31] have supplemented the previously reported characteristics of the strain hardening rate. The mechanisms of the individual stages of the strain hardening rate have been studied using 316L steel, 14Cr1Mo steel, and other FCC materials such as Cu, Al, Ni. The authors of [17] reported that the strain hardening rate drops sharply in Stage I due to the elastic–plastic transition. The mechanism of this stage is attributed to easy dislocation glide. According to the authors of [21], the strain hardening rate slowly decreases in Stage II. This region is dominated by dislocation slip, during which dislocations propagate rapidly, leading to interactions and more efficient annihilation at grain boundaries. Stage III is described as the start of necking [23] and is characterized by dynamic recovery in the form of enhancing the annihilation of dislocations during gliding. It is shown that at a certain decrease in flow stress dependent on changes in thermo-deformation regimes, dynamic recovery controlled by cross-slip begins. Only Stage III is described as dependent on temperature and strain rate. The existence of Stage IV has been defined as significant only at low homologous temperatures (less than half the melting temperature) [32]. In State IV, the effect on permanent strain hardening is considered small and present only at very large deformations. More authors [23,33,34,35,36] have shown that nearly all stored dislocations are found in the cell walls with a density close to or equal to that of saturation. In contrast, the cell interiors are nearly fully devoid of dislocation. It can be assumed that the described mechanism is active in materials with nanoscale structures.
The presented contribution focuses on investigating stress–strain curves resulting from rolling deformations carried out at ambient temperature, to describe and analyze them numerically. The strain hardening of the steel grade AISI 316 LN as an FCC polycrystalline metal with different stages of strain hardening is discussed. As a new approach, conditions for processing designs of optimal cold rolling regimes depending on the determination of the strain hardening stages and mechanisms of plastic deformation will be presented.

2. Material and Experimental Procedures

For the experimental studies, ultra-low-carbon (ULC) austenitic stainless steel of grade AISI 316 LN was used, which contained Nitrogen, Niobium, and Boron, with the chemical composition given in Table 1.
Rectangular samples for cold rolling with dimensions (thickness × width × length) h0 × b0 × l0 = 15 × 40 × 75 mm were cut from the central part of the hot-forged ingot. These samples were then treated with solid solution annealing at 777 K for 60 min, followed by rapid cooling under pressurised air at ambient temperature. The rolling process was carried out at ambient temperature (295 K) on a duo rolling with roll diameters of 210 mm and a rolling speed of 1 m/min. Samples were rolled with 10% reduction per pass, resulting in total thickness reductions of 10%, 30%, and 50%. Static tensile tests were performed at ambient temperature (295 K) on round samples with a diameter and length of the measured part d = 4 mm, l = 22 mm (ASTM E8M standard [37]), with a displacement rate of 0.5 mm/min, which were machined from rolled materials. Each series of static tensile tests consisted of at least three samples, with the axis of the static tensile test samples parallel to the rolling direction. The grain size diameter was measured by the linear intersection method using a light optical microscope (manufacturer, city, and country). Also, technical aspects of determining strain hardening rate were studied.

3. Results and Analysis

The engineering stress–strain curves resulting from the processing of material with various thickness deformations by cold rolling are shown in Figure 1.
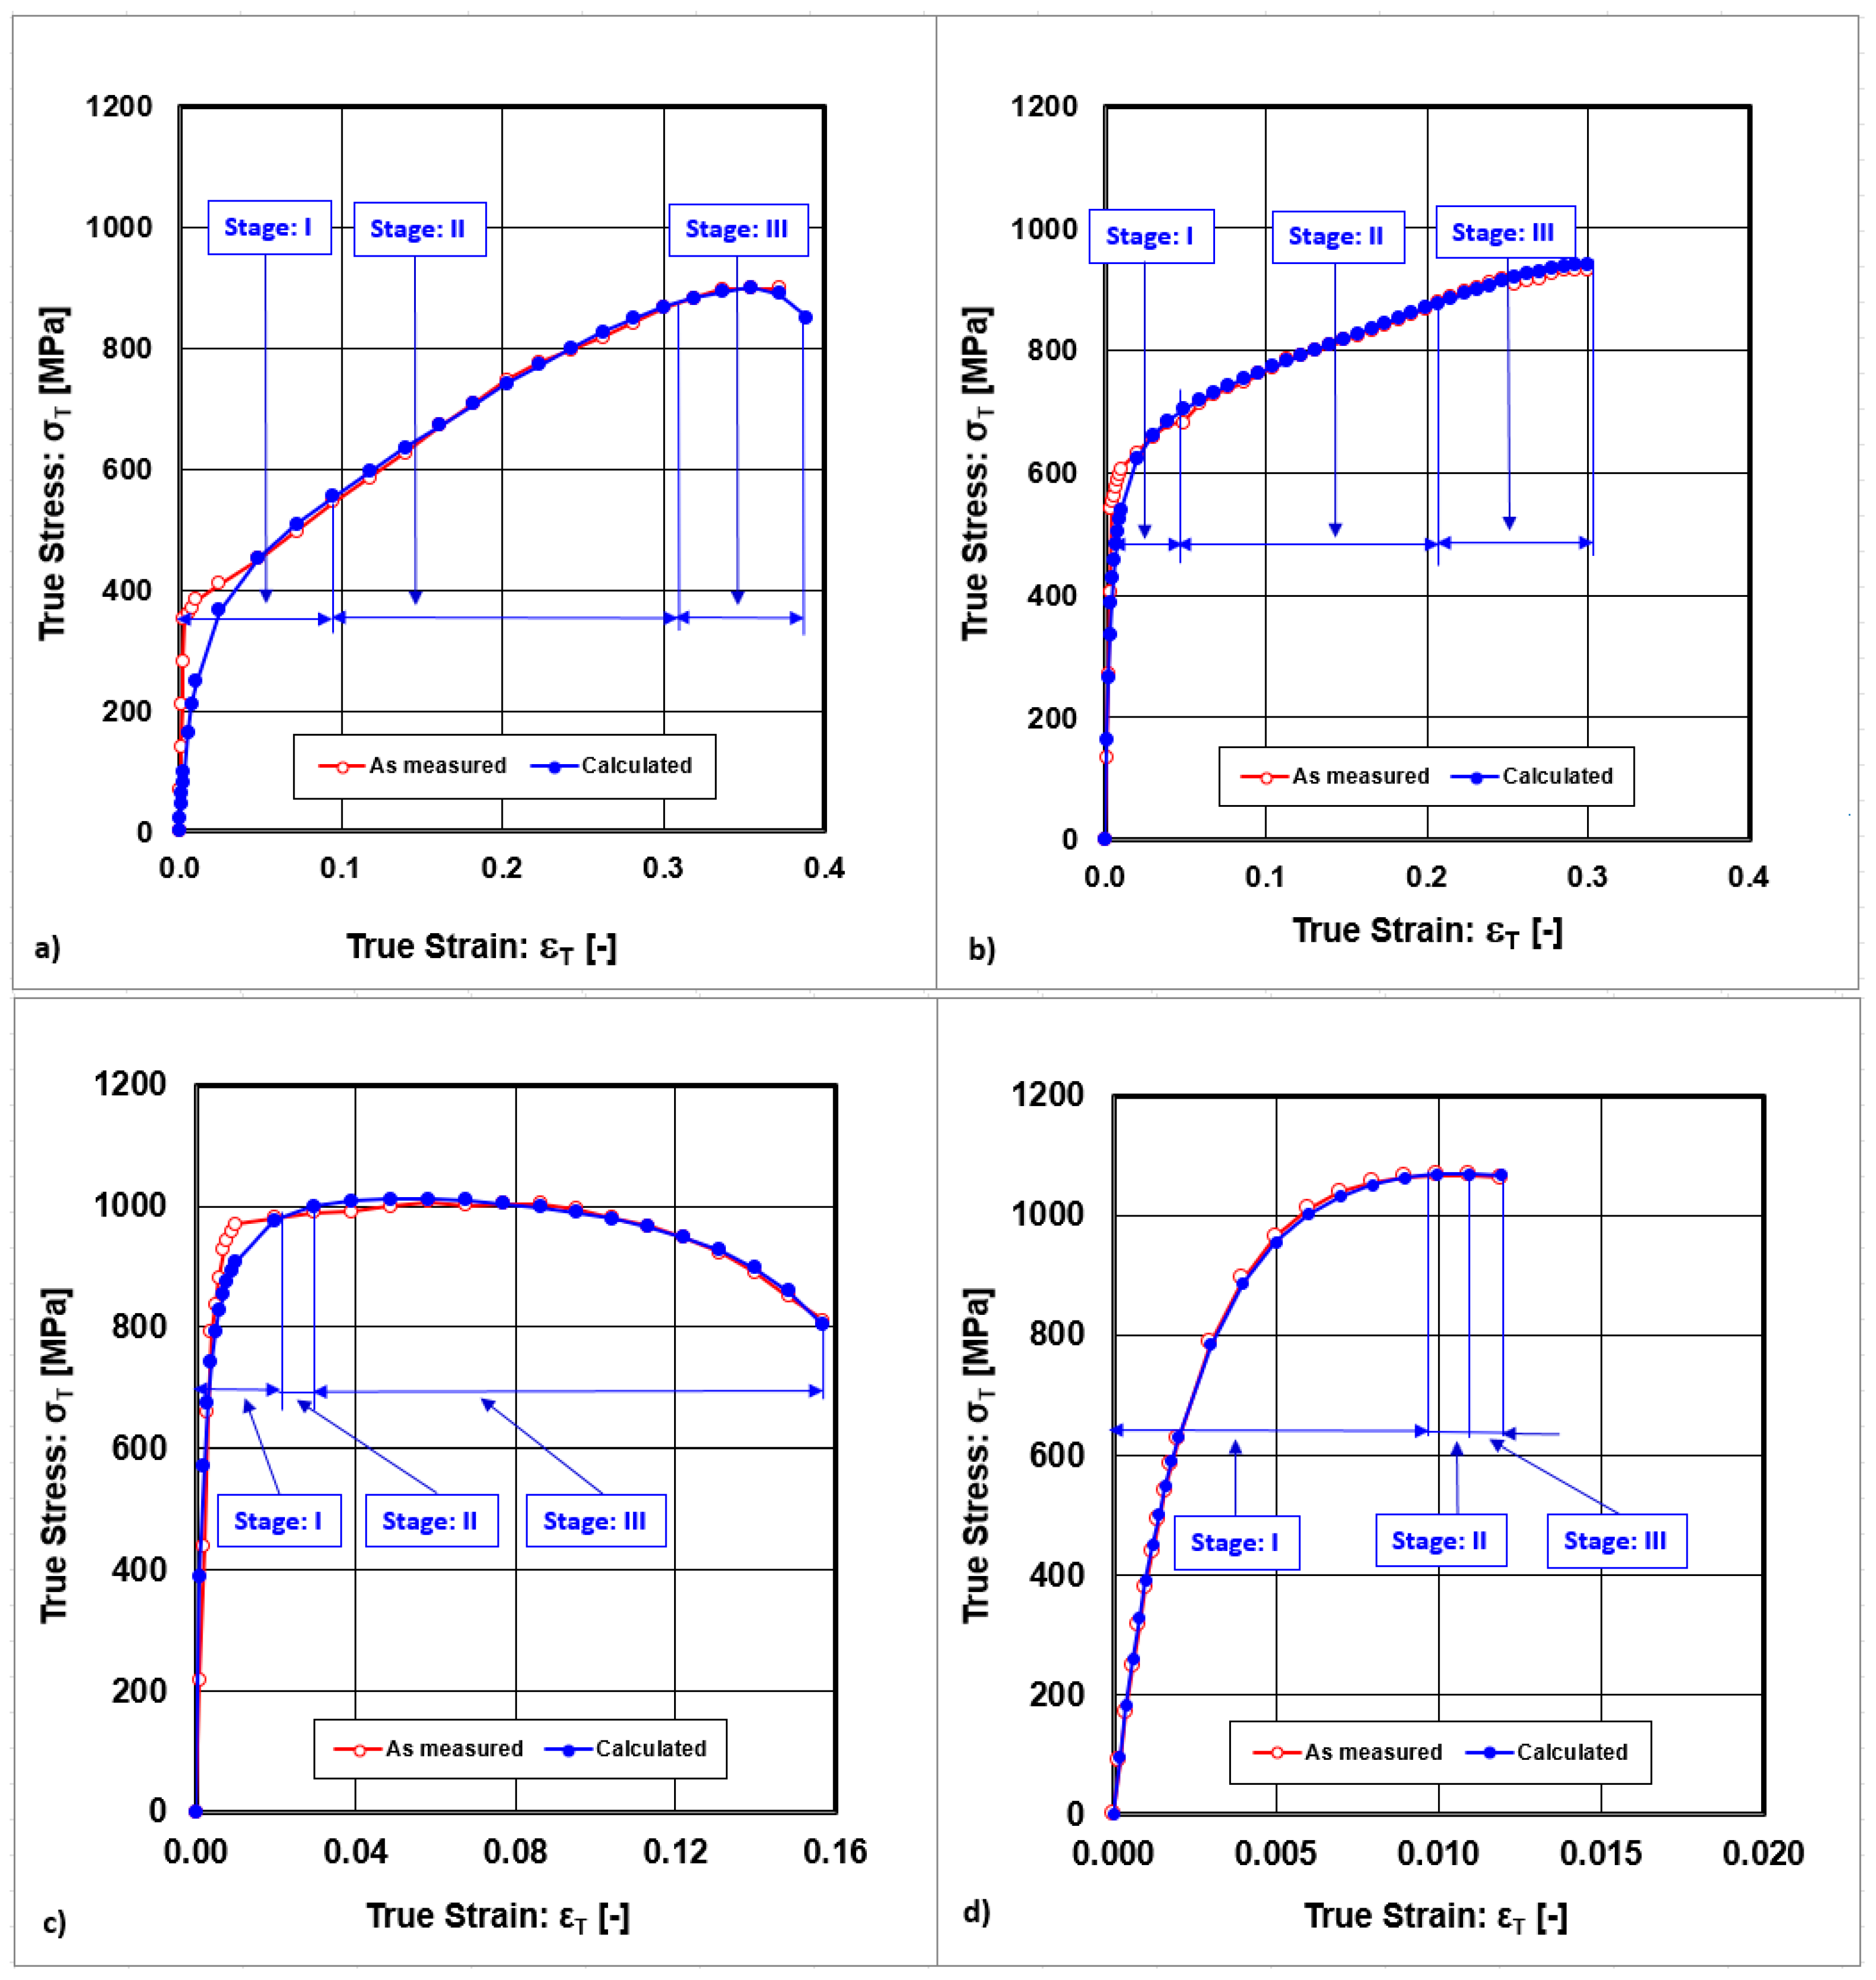
The conversion of the engineering stress–strain curves to the true stress–strain curves is graphically given in Figure 2. The strain hardening rates vs. true strains are shown in Figure 3.
The individual stages, based on cold rolling deformation, are graphically given in Figure 2 and Figure 3.
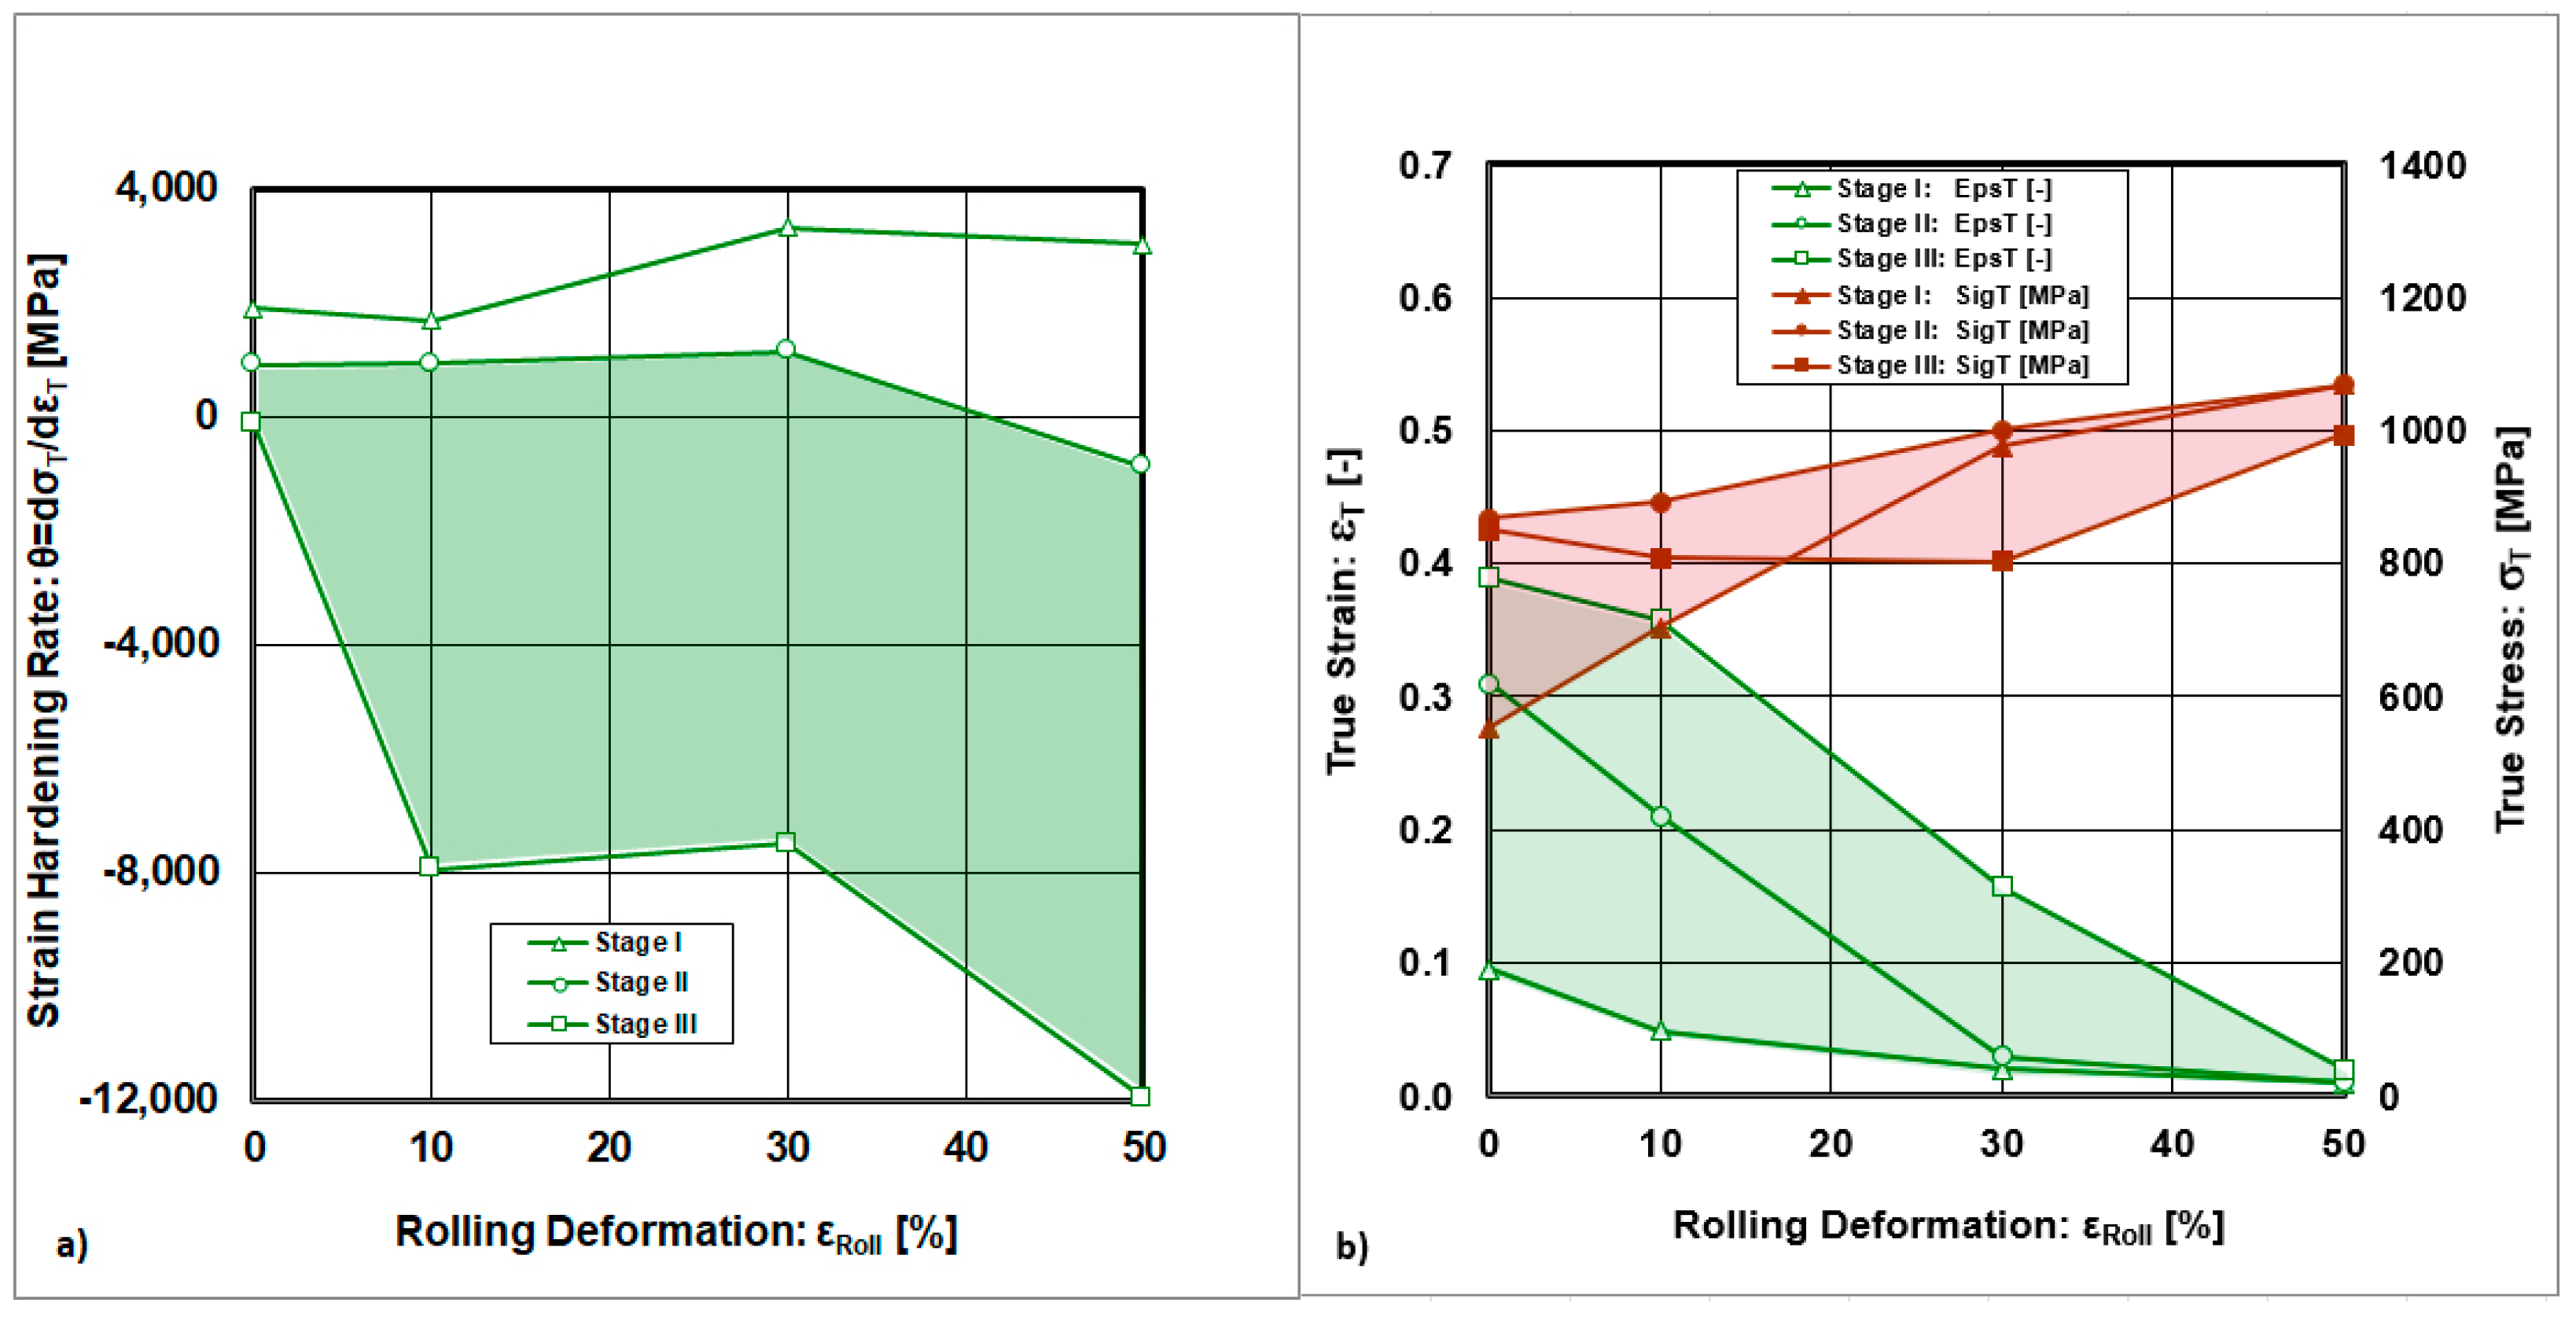
Stage I is characterized, for all cases, by a rapid increase in true stress, but on the other hand, by a rapid decrease in the strain hardening rate until the elastic–plastic transition. This stage is defined as elastic deformation. It can be observed that true strain changes depending on cold rolling deformations. If cold rolling deformation rises, the values of the true strain have a declining trend and exist in the following intervals: εT,StageI,εRoll = 0% ∈ <0;0.095>, εT,Stage_I,εRoll = 10% ∈ <0.095;0.049>, εT,Stage I,εRoll = 30% ∈ <0.049;0.02>, εT,Stage I,εRoll = 50% ∈ <0.02;0.01>. During these stages, deformation is accompanied by easy dislocation gliding along primary slip planes. Deformation takes place on a single slip system depending on the grain size and stacking fault energy of the materials [16]. The author [14] revealed that, except for simple slips, planar slips such as pile-ups and stacking faults can be observed too. The proportion of grains exhibiting planar slip increases with strain and decreases after reaching the boundary between Stages I and II. This author defined the value of the border strain as (εT,Stage I = 0.01). From our observations, it follows that this value was achieved with cold rolling deformation (εRoll = 50%). The end points of Stage I are described by the coordinates (εT,Stage I; σT,Stage I), which are given for each cold rolling deformation value in Table 2. From Table 2, it is evident that Stage I started at the values (εT,Stage I = 0.095; σT,Stage I = 554 MPa). The author of [14] reported for the solution annealing condition a value of the uniform true stress σT,Stage I = 580 MPa with a grain diameter of d = 53 μm, which is in alignment with our result (σT,Stage I = 554 MPa and d = 214 μm).
Quasi-linear dependencies characterize Stage II as exhibiting an increase in true stress, but a slow and gradual decline in the strain hardening rates up to the transition point of Stage III. These stages are defined as stages of ongoing plastic deformations. If cold rolling deformations are rising, the values of true strains have a declining trend and laying in the following intervals: εT,Stage II,εRoll = 0% ∈ <0.095;0.31>, εT,Stage II,εRoll = 10% ∈ <0.049;0.21>, εT,Stage II,εRoll = 30% ∈ <0.02;0.03>, εT,Stage II,εRoll = 50% ∈ <0.01;0.0109>. True stresses increase, but the strain hardening rates decrease compared to Stage I. Stage II is characterized by a decrease in the influence of planar slip but an increase in the role of multiple slip accompanied by cross-slip [14]. Toward the end of Stage II, a cellular structure forms with a high dislocation density at the walls of the cells and a low density within the cells, which increases the true stress [17]. The end points of Stage II are described by the coordinates (εT, Stage II; σT,Stage II), which are given for each cold rolling deformation value in Table 3.
Stage III is characterized by a decrease in the strain hardening rates with slowly increasing true stresses and their transition to strain softening, leading to the formation of plastic instability and necking. These stages are defined as stages of plastic deformation instability. If cold rolling deformation rises, the values of true strains have a declining trend and occur in the following intervals: εT,Stage III,εRoll = 0% ∈ <0.31;0.389>, εT,Stage III,εRoll = 10% ∈ <0.21;0.358>, εT,Stage III,εRoll = 30% ∈ <0.03;0.157>, εT,Stage III,εRoll = 50% ∈ <0.0109;0.0198>. The true stresses decrease, but the strain hardening rates decrease too. The excessive density of dislocations in Stage II indicates that dislocation annihilation will occur in Stage III. Stage III is characterized by dislocation interactions, which lead to their annihilation and ultimately to the recovery of the microstructure [17,38]. While dislocation slip dominates as the plastic deformation mechanism in Stage II, twinning becomes more prominent in Stage III [5]. The end points of Stage III are described by the coordinates (εT,Stage III; σT,Stage III), which are given for each cold rolling deformation value in Table 4.
From the graphical dependences, it results that the values of true strains and strain hardening rates corresponding to Stage III decline with the rise in cold rolling deformation.
The development stages of the strain hardening rate showed that with increasing cold rolling deformations, the range of true strains decreases and narrows. On the other hand, the range of true stresses rises and narrows, as shown in Figure 4a. The changes in the strain hardening rate point to two ranges, as given in Figure 4b. The area between Stage I and Stage II defines the first narrow band of the strain hardening rate. The wider region, situated between phase II and phase III, indicates that the strain hardening rate decreases sharply with increasing cold rolling strain for εRoll ≤ 10% and in the interval εRoll ∈ <30;50> %. In the interval εRoll ∈ <10;30> %, the strain hardening rate is stabilized.
A comprehensive analysis of the strain hardening stages, based on the assessment of true stresses and true strains in relation to cold rolling deformations, is presented in Figure 5. From the curves describing the true stresses for uniform plastic deformations, it results that these lie over the curve of the proof yield strength (σT,Necking > σT,Start > RP0.2) for all cold deformations. This diapason narrows significantly with the rising cold rolling deformations. The curve describing the true saturation stress (σT,Saturated) required to achieve dynamic recovery of the microstructure lies considerably higher than the stress required for necking formation (σT,Saturated > σT,Necking). Also, the true strain required to reach the saturation state lies above the curve of the true strain inducing necking (εT,Saturated > εT,Necking). The graphical dependencies show that under the given studied conditions, it is not possible to reach a state for starting dynamic recrystallization of the microstructure. The diapason of the true strains, where uniform plastic deformations lie in the area described by the following inequality (εT,Necking > εT,Start), narrows significantly with the rising cold rolling deformations.
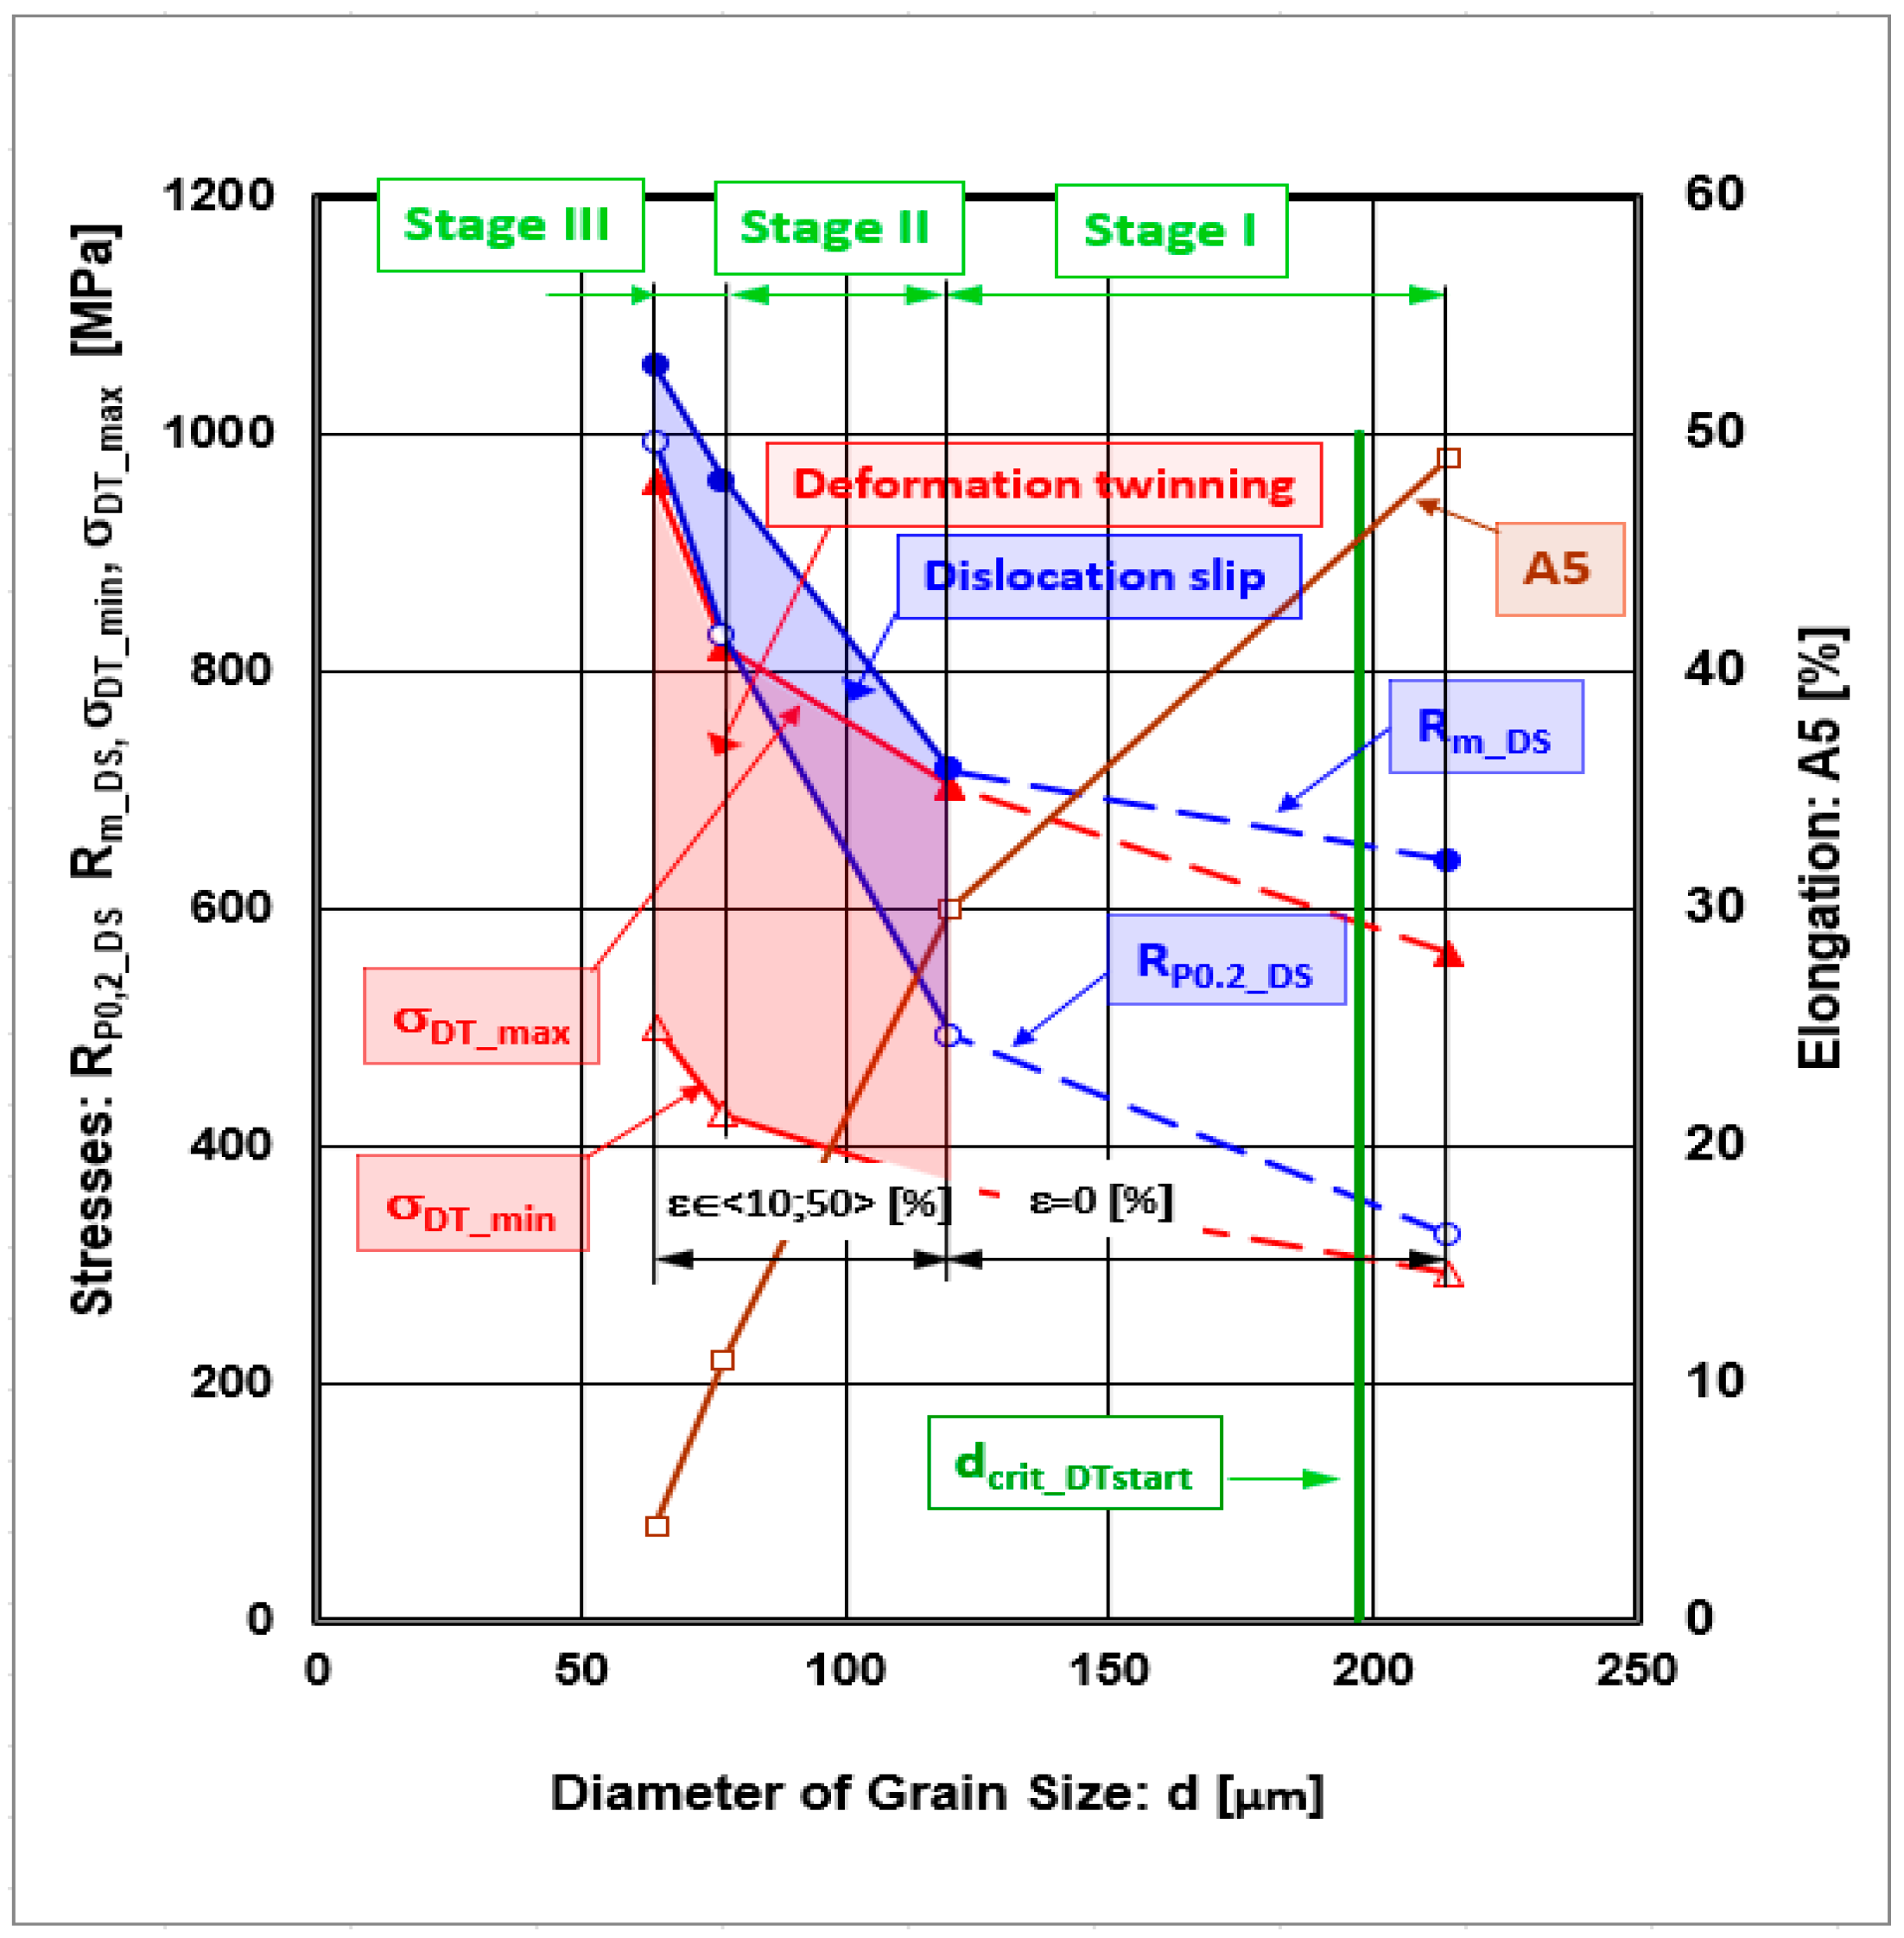
In our previous study, we described the relationship between cold rolling deformations, grain size, and plastic deformation mechanisms [5]. The analysis of cold rolling deformations aims to explain the development of regions of uniform true stresses and strains with d, together with the stages of strain hardening and the analysis of plastic deformation mechanisms, as presented in Figure 6 [5]. From the graphical dependencies, it results that Stage I is characterized predominantly by a plastic deformation mechanism based on dislocation slip.
From the graphical dependencies, it results that Stage I is characterized predominantly by a plastic deformation mechanism based on dislocation slip. In Stage I, dislocation slip can be defined in detail as simple slip or planar slips, which rise with true strain [14]. Therefore, for Stage I, the dominant plastic deformation mechanism is dislocation slip. With the rise in cold rolling deformation, the border Stage I–Stage II dislocation slip increases, but planar slip has a tendency to decline. Stage II is characterized by multiple increasing slips accompanied by cross-slips [14]. Toward the end of Stage II, a cellular structure forms with a high dislocation density at the walls of the cells and a low density within the cells, which increases the true stress [17]. According to the authors of [5], the maximal dislocation density was observed for εRoll = 30% which is in good agreement with the previous analysis. From the graphical dependence given in Figure 6 [5], it results that Stage II is characterized by a plastic deformation mechanism: dislocation slip, accompanied by deformation twinning. After entering Stage II, according to the authors of [17,38], dislocation interactions occur, which lead to their annihilation and ultimately to the recovery of the microstructure.
Stage III is characterized by dislocation interactions, which lead to their annihilation and ultimately to the recovery of the microstructure and a decrease in the strain hardening rate [17,38]. The authors of [38] demonstrated that the significant reduction in the strain hardening rate is caused by deformation twinning, which is most pronounced in Stage III. While in Stage I and Stage II, dislocation slip dominates as the plastic deformation mechanism, in Stage III, the most prominent mechanism is deformation twinning accompanied by dislocation slip (Figure 6). Nevertheless, the total normal stress increases until the material’s failure.

4. Conclusions

Based on the literature and our own experiments performed using cold rolling on AISI 316 LN stainless steel to analyse stress–strain curves with a focus on the strain hardening rate, strain hardening stages, and plastic deformation mechanisms, the following conclusions can be drawn:
  • Three stages of strain hardening rates were observed. Stage I lies in the interval εRoll ∈ <0;10> %, Stage II in the interval εRoll ∈ <10;30> %, and Stage III in the interval εRoll ∈ <30;50> %.
  • Stage I is characterized by a rapid decline in the strain hardening rate and is accompanied by easy dislocation gliding along primary slip planes.
  • Stage II is characterized by a stabilized strain hardening rate that is accompanied by multiple slips and cross-slip.
  • A decrease in the strain hardening rate characterizes Stage III. This stage is defined as a region of plastic deformation instability in which dislocation interactions take place, leading to their annihilation and ultimately to the recovery of the microstructure. The mechanisms of plastic deformation are characterized as follows: Stage I—dislocation slip; Stage II—dislocation slip accompanied by deformation twinning; Stage III—deformation twinning accompanied by dislocation slip.
  • The scientific results resulting from the determination of the plastic stability regions of the investigated material can be transferred to the design of optimized deformation plans for cold rolling in industrial conditions. By determining optimal deformation plans, the possibility of material defects during cold rolling processes is eliminated.

Author Contributions

Conceptualization, T.K. and A.F.; methodology, T.K. and J.B.; validation, T.K., J.B. and Ľ.K.; formal analysis, R.B.; investigation, A.F. and T.K.; resources, R.B.; data curation, T.K. and J.B.; writing—original draft preparation, T.K.; writing—review and editing, T.K. and J.B.; visualization, T.K.; supervision, J.B.; project administration, R.B.; funding acquisition, R.B. All authors have read and agreed to the published version of the manuscript.

Funding

Funded by the Next Generation EU through the Recovery and Resilience Plan for Slovakia under the project No. 09I03-03-V04-00694.

Data Availability Statement

The original contributions presented in this study are included in the article. Further inquiries can be directed to the corresponding authors.

Conflicts of Interest

Authors Tibor Kvačkaj and Róbert Bidulský were employed by the company Bodva Industry and Innovation Cluster. Author Alica Fedoríková was employed by the company Research Centre Řež. The remaining authors declare that the research was conducted in the absence of any commercial or financial relationships that could be construed as a potential conflict of interest.

References

  1. Properties and Selection: Irons, Steels, and High-Performance Alloys—ASM International. In ASM Handbook; 1990; Volume 1, ISBN 978-0-87170-377-4. Available online: https://www.asminternational.org/asm-handbook-volume-1-properties-and-selection-irons-steels-and-high-performance-alloys/results/-/journal_content/56/06181G/PUBLICATION (accessed on 27 November 2024).
  2. Brytan, Z.; Dagnaw, M.; Bidulska, J.; Bidulsky, R. Corrosion evaluation of LPBF-manufactured duplex stainless steel. Acta Metall. Slovaca 2024, 30, 34–40. [Google Scholar] [CrossRef]
  3. Hu, J.; Liu, Y.; Wang, G.; Li, Q.; Wen, J.; Yan, L.; Chen, S.; Gu, Y. Effect of Tempering Treatment on Microstructural Evolution and Mechanical Behavior of Heavy-Wall Heat Induction Seamless Bend Pipe. Materials 2021, 15, 259. [Google Scholar] [CrossRef]
  4. Vargas, B.R.R.; Albini, L.; Tiracorrendo, G.; Massi, R.; Stornelli, G.; Di Schino, A. Effect of Ultrafast Heating on AISI 304 Austenitic Stainless Steel. Acta Metall. Slovaca 2023, 29, 104–107. [Google Scholar] [CrossRef]
  5. Kvackaj, T.; Bidulska, J.; Fedorikova, A.; Bidulsky, R. Mechanical Properties and Strengthening Contributions of AISI 316 LN Austenitic Stainless Steel Grade. Materials 2025, 18, 499. [Google Scholar] [CrossRef]
  6. Janda, T.; Jeníček, Š.; Kučerová, L.; Leták, R.; Jandová, D. Influence of Higher Stabilization Temperatures on the Microstructure and Mechanical Properties of Austenitic Stainless Steel 08Ch18N10T. Metals 2023, 13, 975. [Google Scholar] [CrossRef]
  7. Kučerová, L.; Benediktová, A.; Burdová, K.; Jandová, D. Low-temperature precipitation strengthening of maraging steel 1.2709 produced by powder bed fusion. Mater. Des. 2024, 241, 112938. [Google Scholar] [CrossRef]
  8. Stornelli, G.; Albini, L.; Di Nunzio, P.E.; Tiracorrendo, G.; Rodriguez Vargas, B.R.; di Schino, A. Effect of ultrafast heating on AISI 441 ferritic stainless steel. Acta Metall. Slovaca 2023, 29, 22–25. [Google Scholar] [CrossRef]
  9. El-Danaf, E.; Kalidindi, S.R.; Doherty, R.D. Influence of deformation path on the strain hardening behavior and microstructure evolution in low SFE FCC metals. Int. J. Plast. 2001, 17, 1245–1265. [Google Scholar] [CrossRef]
  10. Cui, Z.; He, S.; Tang, J.; Fu, D.; Teng, J.; Jiang, F. Effect of Grain Size on the Plastic Deformation Behaviors of a Fe-18Mn-1.3Al-0.6C Austenitic Steel. Materials 2022, 15, 8717. [Google Scholar] [CrossRef]
  11. Soares, G.C.; Gonzalez, B.M.; de Arruda Santos, L. Strain hardening behavior and microstructural evolution during plastic deformation of dual phase, non-grain oriented electrical and AISI 304 steels. Mater. Sci. Eng. A 2017, 684, 577–585. [Google Scholar] [CrossRef]
  12. Ding, H.; Ding, H.; Song, D.; Tang, Z.; Yang, P. Strain hardening behavior of a TRIP/TWIP steel with 18.8% Mn. Mater. Sci. Eng. A 2011, 528, 868–873. [Google Scholar] [CrossRef]
  13. Kaščák, L.; Mucha, J.; Varga, J.; Slota, J.; Kaščáková, E. Analysis of hybrid joining of microalloyed steel sheets HX300LAD. Acta Metall. Slovaca 2024, 30, 188–191. [Google Scholar] [CrossRef]
  14. Feaugas, X. On the origin of the tensile flow stress in the stainless steel AISI 316L at 300 K: Back stress and effective stress. Acta Mater. 1999, 47, 3617–3632. [Google Scholar] [CrossRef]
  15. Wu, T.Y.; Bassani, J.L.; Laird, C. Latent Hardening in Single Crystals I. Theory and Experiments. Proc. R. Soc. A Math. Phys. Eng. Sci. 1991, 435, 1–19. [Google Scholar] [CrossRef]
  16. Kundu, A.; Field, D.P.; Chakraborti, P.C. Effect of strain and strain rate on the development of deformation heterogeneity during tensile deformation of a solution annealed 304 LN austenitic stainless steel: An EBSD study. Mater. Sci. Eng. A 2020, 773, 138854–138864. [Google Scholar] [CrossRef]
  17. Ivanov, S.; Mendagaliev, R.; Samoilov, S.; Akhmedianov, A.; Lebedeva, N.; Udin, I.; Turichin, G. Temperature dependence of tensile mechanical properties and work hardening behavior in direct laser deposited austenitic stainless steel 316L. Mater. Today Commun. 2024, 39, 108613. [Google Scholar] [CrossRef]
  18. Ruban, R.; Vijayanand, V.D.; Sivapirakasam, S.P.; Prasad Reddy, G.V. Influence of thermo-mechanical treatment on the flow behavior of 14Cr-15Ni stainless steel. Can. Metall. Q. 2025, 64, 873–878. [Google Scholar] [CrossRef]
  19. Arrayago, I.; Real, E.; Gardner, L. Description of stress–strain curves for stainless steel alloys. Mater. Des. 2015, 87, 540–552. [Google Scholar] [CrossRef]
  20. Wang, Y.; Hou, Q.; Li, X.; Li, Z.; Wu, F.; Chen, S.; Lv, C.; He, Q.; Ye, X.; Yu, Y.; et al. Strain rate-dependent tensile response and deformation mechanism of laser powder bed fusion 316L stainless steel. Mater. Sci. Eng. A 2024, 893, 146124. [Google Scholar] [CrossRef]
  21. Yu, B.; Zhang, B.; Shi, R.; Mao, F.; Wei, S.; Yang, D. Dynamic Recrystallization Model of High-Temperature Deformation and Finite Element Analysis of Microstructure Evolution of 14Cr1Mo Pressure Vessel Steel. Materials 2025, 18, 3531. [Google Scholar] [CrossRef]
  22. Christopher, J.; Choudhary, B.K. On the assessment of tensile work hardening behaviour of type 316L(N) austenitic stainless steel in the framework of θσd vs. σd using flow stress contribution from dislocations. Int. J. Press. Vessels Pip. 2016, 146, 151–160. [Google Scholar] [CrossRef]
  23. Argon, A.S. Mechanical properties of single-phase crystalline media: Deformation at low temperatures. In Physical Metallurgy; Cahn, R.W., Haasen, P., Eds.; North-Holland: Amsterdam, The Netherlands, 1996; ISBN 9780080538945. [Google Scholar]
  24. Asgari, S.; El-Danaf, E.; Kalidindi, S.R.; Doherty, R.D. Strain hardening regimes and microstructural evolution during large strain compression of low stacking fault energy fcc alloys that form deformation twins. Metall. Mater. Trans. A 1997, 28, 1781–1795. [Google Scholar] [CrossRef]
  25. Praveen, K.V.U.; Sastry, G.V.S.; Singh, V. Work-Hardening Behavior of the Ni-Fe Based Superalloy IN718. Metall. Mater. Trans. A 2008, 39, 65–78. [Google Scholar] [CrossRef]
  26. Kalidindi, S.A. Modeling the strain hardening response of low SFE FCC alloys. Int. J. Plast. 1998, 14, 1265–1277. [Google Scholar] [CrossRef]
  27. Finfrock, C.B.; Thrun, M.M.; Bhattacharya, D.; Ballard, T.J.; Clarke, A.J.; Clarke, K.D. Strain Rate Dependent Ductility and Strain Hardening in Q&P Steels. Metall. Mater. Trans. A 2021, 52, 928–942. [Google Scholar] [CrossRef]
  28. Angella, G. Strain hardening analysis of an austenitic stainless steel at high temperatures based on the one-parameter model. Mater. Sci. Eng. A 2012, 532, 381–391. [Google Scholar] [CrossRef]
  29. Isaac Samuel, E.; Choudhary, B.K.; Bhanu Sankara Rao, K. Influence of temperature and strain rate on tensile work hardening behaviour of type 316 LN austenitic stainless steel. Scr. Mater. 2002, 46, 507–512. [Google Scholar] [CrossRef]
  30. Ho, H.S.; Sun, L.L.; Liu, K.K.; Niu, P.H.; Zhang, E.L. Microstructural evolution and strain hardening behavior of AISI 316L type austenitic stainless steel. Int. J. Mater. Res. 2019, 110, 287–296. [Google Scholar] [CrossRef]
  31. Zhang, Y.Z.; Wang, J.J.; Tao, N.R. Tensile ductility and deformation mechanisms of a nanotwinned 316L austenitic stainless steel. J. Mater. Sci. Technol. 2020, 36, 65–69. [Google Scholar] [CrossRef]
  32. Kocks, U.F.; Mecking, H. Physics and phenomenology of strain hardening: The FCC case. Prog. Mater. Sci. 2003, 48, 171–273. [Google Scholar] [CrossRef]
  33. Prinz, F.B.; Argon, A.S. The evolution of plastic resistance in large strain plastic flow of single phase subgrain forming metals. Acta Metall. 1984, 32, 1021–1028. [Google Scholar] [CrossRef]
  34. Zehetbauer, M. Cold work hardening in stages IV and V of F.C.C. metals-II. Model fits and physical results. Acta Metall. Mater. 1993, 41, 589–599. [Google Scholar] [CrossRef]
  35. Park, N. Precise Flow Stress Analysis for the Occurrence of Dynamic Ferritic Transformation and Dynamic Recrystallization of Austenite in Low Carbon Steel. Korean J. Met. Mater. 2018, 56, 779–786. [Google Scholar] [CrossRef]
  36. Nes, E. Modelling of work hardening and stress saturation in FCC metals. Prog. Mater. Sci. 1997, 41, 129–193. [Google Scholar] [CrossRef]
  37. ASTM E8/E8M-03; Standard Test Methods for Tension Testing of Metallic Materials. ASTM International: West Conshohocken, PA, USA, 2003.
  38. Srinivas, B.; Dhal, A.; Panigrahi, S.K. A mathematical prediction model to establish the role of stacking fault energy on the cryo-deformation behavior of FCC materials at different strain levels. Int. J. Plast. 2017, 97, 159–177. [Google Scholar] [CrossRef]
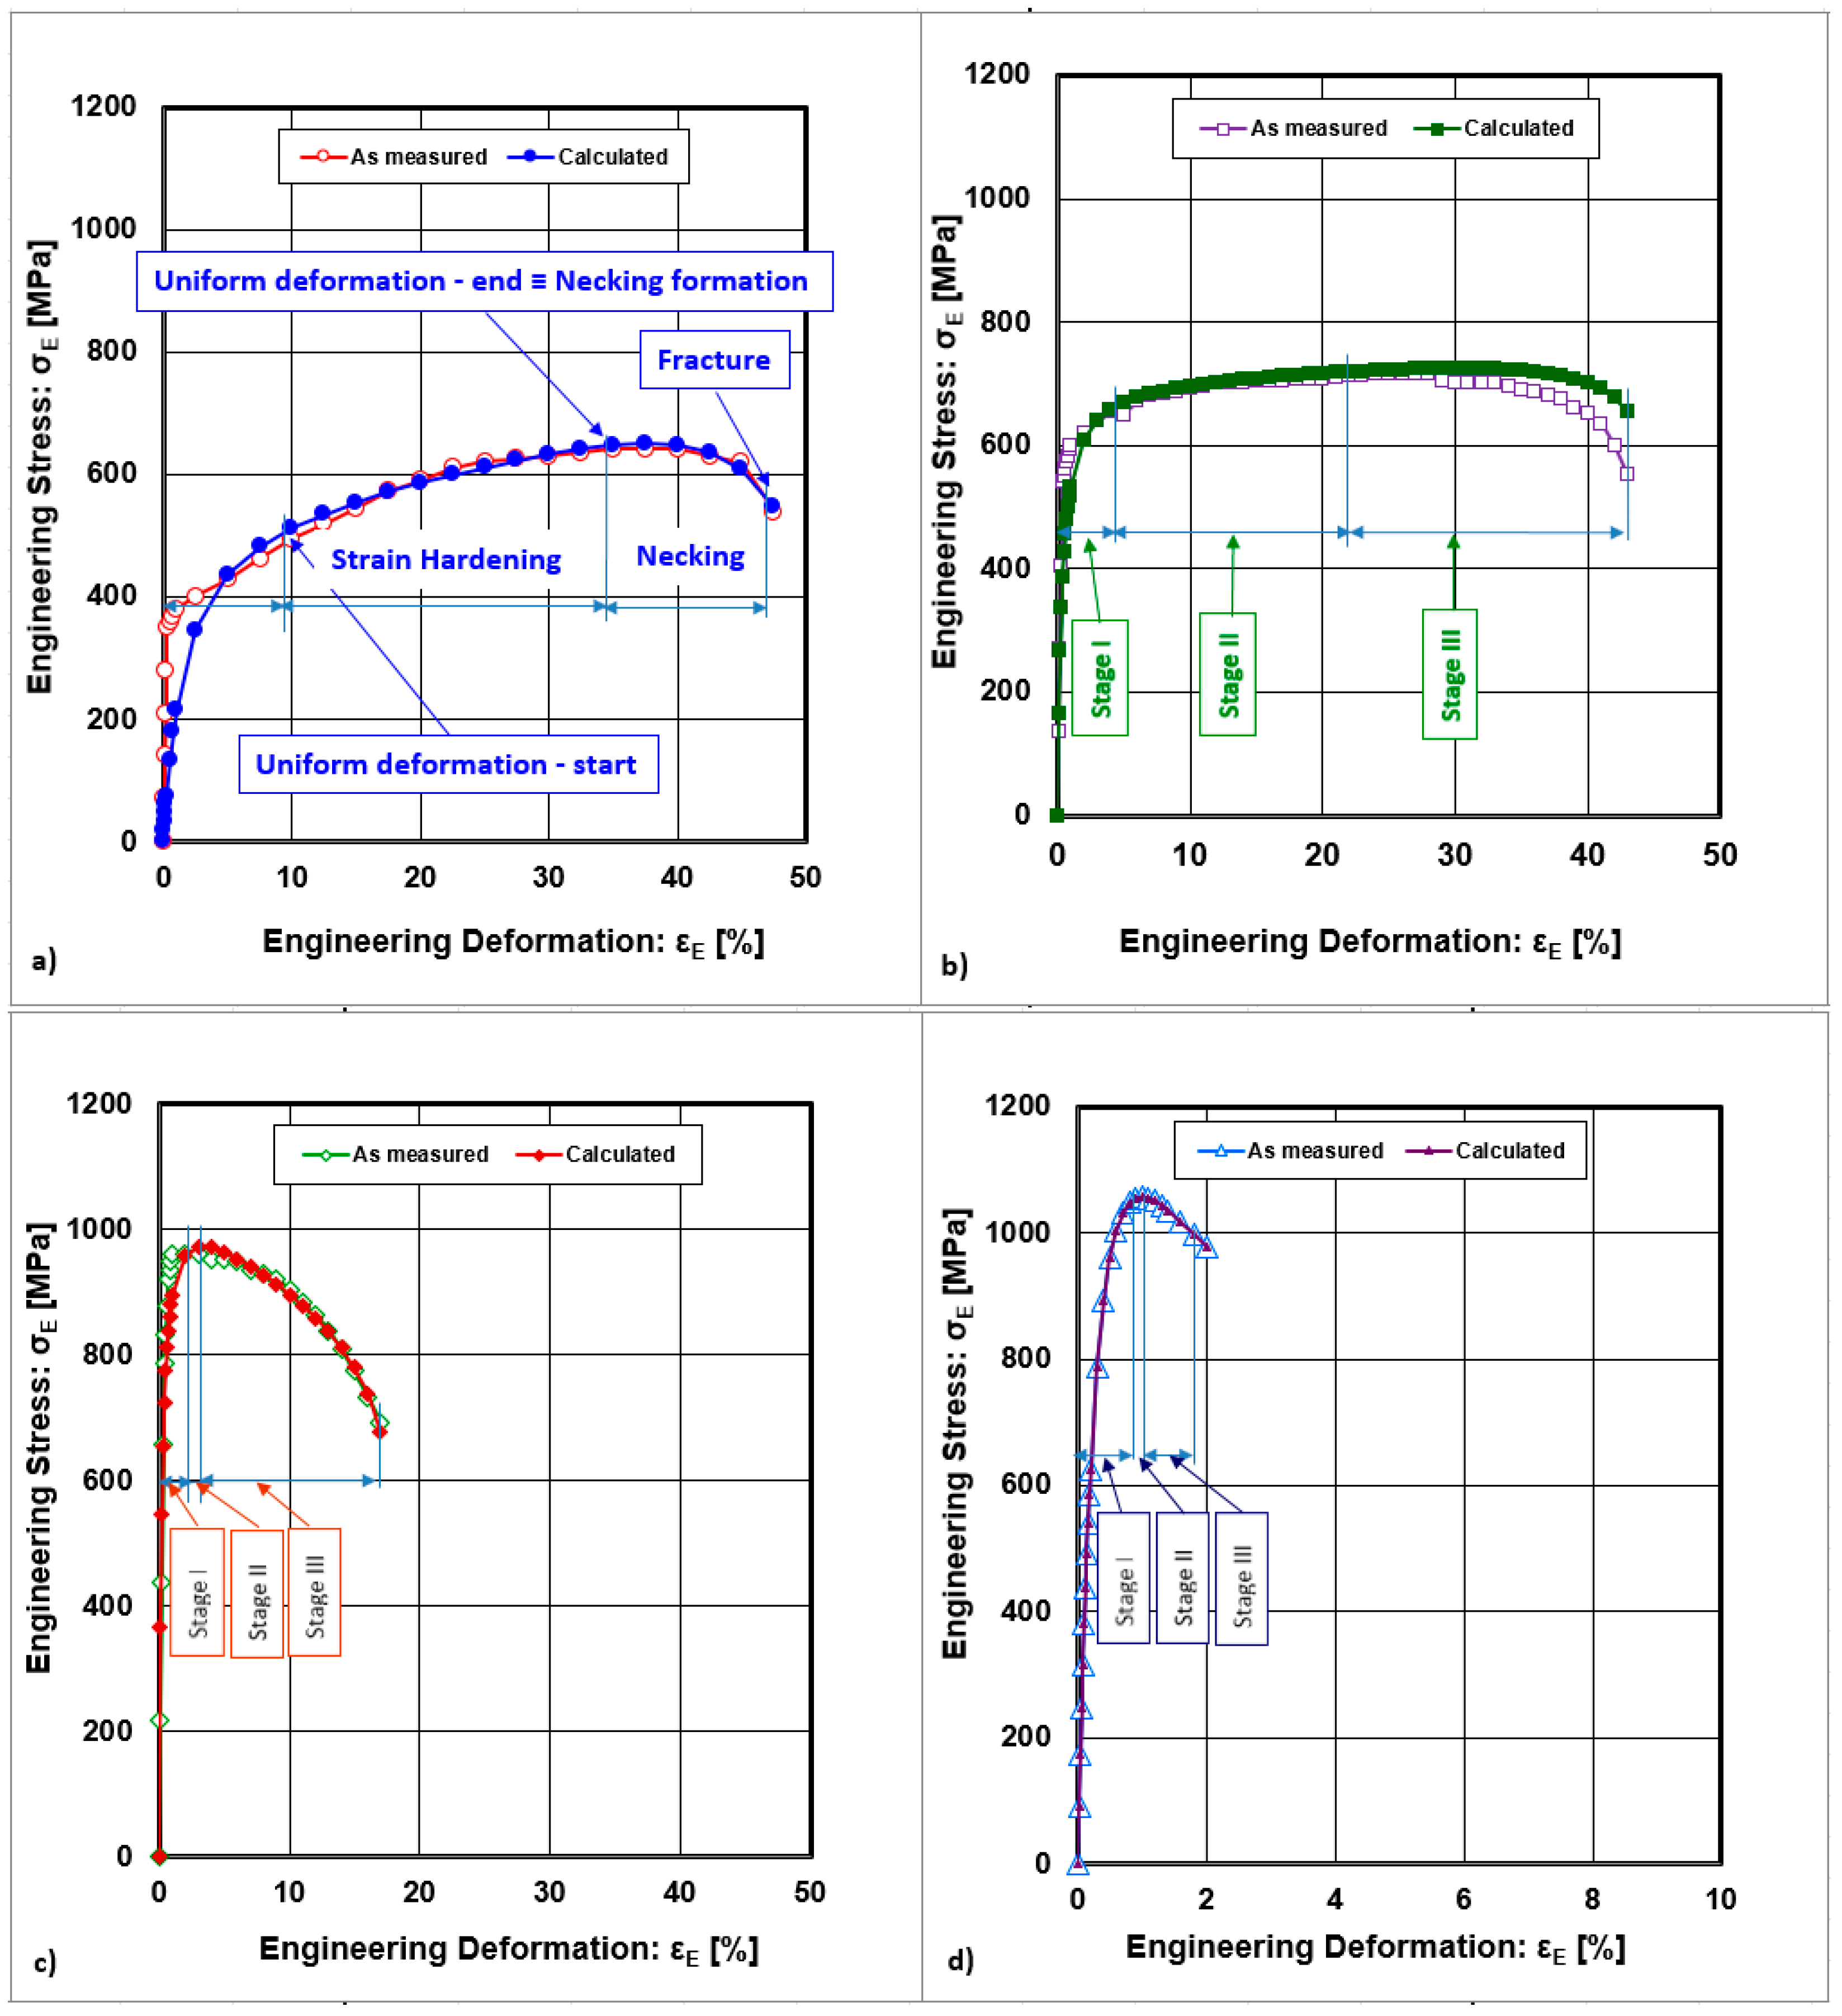
Figure 1. Engineering stress–strain curves with description of strain hardening stages ((a) solution annealed, (b) rolling deformation εRoll = 10%, (c) rolling deformation εRoll = 30%, (d) rolling deformation εRoll = 50%).
Metals 15 01060 g001
Figure 2. True stress–strain curves ((a) solution annealed, (b) rolling deformation εRoll = 10%, (c) rolling deformation εRoll = 30%, (d) rolling deformation εRoll = 50%).
Metals 15 01060 g002
Figure 3. Strain hardening stages ((a) solution annealed, (b) rolling deformation εRoll = 10%, (c) rolling deformation εRoll = 30%, (d) rolling deformation εRoll = 50%).
Metals 15 01060 g003
Figure 4. Strain hardening stages depending on processing conditions: (a) strain hardening rate depending on cold rolling deformation, (b) true strain and true stress depending on cold rolling deformation.
Metals 15 01060 g004
Figure 5. Comprehensive graphical dependence describing strain hardening stages depending on cold rolling deformation.
Metals 15 01060 g005
Figure 6. Comprehensive graphical dependence describing the relationship between plastic deformation mechanisms and strain hardening rate stages depending on cold rolling deformations (reprint from [5]).
Metals 15 01060 g006
Table 1. Local chemical composition of 316 LN used in this paper [mass %].
CMnSiPSCrNiMoVTiNbNB
0.061.50.50.0070.00318.7613.731.870.020.0040.020.130.001
Table 2. Coordinates of end points of Stage I.
Cold Rolling Deformation
εRoll [%]
Uniform True Strain
T,Stage I) [-]
Uniform True Stress
T,Stage I) [MPa]
00.095554
100.049704
300.02976
500.011068
Table 3. Coordinates of end points of Stage II.
Cold Rolling Deformation
εRoll [%]
Uniform True Strain
T,Stage II) [-]
Uniform True Stress
T,Stage II) [MPa]
00.31868
100.21892
300.031000
500.01091069
Table 4. Coordinates of end points of Stage III.
Cold Rolling Deformation
εRoll [%]
Uniform True Strain
T,Stage III) [-]
Uniform True Stress
T,Stage III) [MPa]
00.389850
100.358808
300.157803
500.0198993
Disclaimer/Publisher’s Note: The statements, opinions and data contained in all publications are solely those of the individual author(s) and contributor(s) and not of MDPI and/or the editor(s). MDPI and/or the editor(s) disclaim responsibility for any injury to people or property resulting from any ideas, methods, instructions or products referred to in the content.