Article

Microstructural Evolution and Oxidation Resistance of Fe-30Ni-15Cr Alloy for Internal Combustion Engine Valves Under Long-Term High-Temperature Exposure and Heat Treatment

1
School of Materials Science and Engineering, Shanghai University, Shanghai 200444, China
2
Jiangsu Shanyuan Group Co., Ltd., Taizhou 225722, China
3
Institute of Materials Henan Academy of Sciences, Zhengzhou 450046, China
4
School of Mechanical Engineering, Yancheng Institute of Technology, Yancheng 224501, China
*
Authors to whom correspondence should be addressed.
Metals 2025, 15(1), 61; https://doi.org/10.3390/met15010061
Submission received: 2 December 2024 / Revised: 30 December 2024 / Accepted: 3 January 2025 / Published: 12 January 2025

Abstract

:
Iron–nickel-based superalloy is an ideal substitute for the expensive Inconel 625 and Inconel 751 alloys. To elucidate the evolution of the microstructure and properties of Ni30 alloy under different thermal treatment conditions, a systematic study was conducted on the microstructural transformation of the alloy’s strengthening γ′ phase following solution treatment and aging, as well prolonged exposure at 750 °C, and the oxidation behavior of the Ni30 alloy was examined. During prolonged thermal exposure, grain growth occurs mainly in the initial stage, and after 200 h, the prolonged exposure time leads to a significant coarsening of γ′ precipitates, whose area fraction increases by more than 10 times compared to their unaged state. After 100 h of aging, the alloy reaches a peak tensile strength of 1270 MPa and a yield strength of 820 MPa; after 2000 h, the alloy maintains a relatively high strength with a slight decrease in ductility. The oxidation kinetic curve of Ni30 alloy follows the quasi-parabolic oxidation law at 750 °C, and its oxidation rate is consistently lower than 0.1 g·m−2·h−1 throughout the whole oxidation process, which indicates that it has excellent oxidation resistance. The external oxide layer of Ni30 alloy shows a bilayered structure, and no obvious surface porosity or flaking of oxidation products were observed throughout the high-temperature oxidation test. This study not only contributes to the improvement of material properties, but also promotes innovation and development in the field of high-temperature engineering applications that will help to meet the increasingly stringent requirements of high-temperature working environments.

1. Introduction

High-temperature alloys are a class of materials that demonstrate exceptional performance in extreme high-temperature environments and are extensively utilized in aerospace, energy, petrochemical, and other high-temperature engineering applications [1]. These alloys possess superior mechanical properties, oxidation resistance, and creep resistance at elevated temperatures, serving as critical solutions to the challenges associated with material performance in high-temperature environments. To further improve the properties and extend the service life of high-temperature alloys, heat-treatment processes have become essential. The properties of high-temperature alloys are heavily dependent on their microstructure and grain structure, which are directly influenced by the heat-treatment process [2]. Heat treatment typically involves controlling the temperature, treatment duration, and cooling rate of a material to adjust its grain size, phase transition behavior, and dislocation density. Proper heat treatment can significantly enhance the properties of high-temperature alloys, including their creep resistance, oxidation resistance, fatigue resistance, and mechanical strength [3,4,5]. Therefore, studying and optimizing heat-treatment processes is critical for improving the properties of these materials, reducing their cost, and prolonging their service life.
Mondelez Nickel successfully developed the Nimonic 75 alloy series. However, despite their outstanding high-temperature properties, Nimonic 75 alloys had a relatively low creep strength and were more suited to sheet metal fabrication. In order to gradually enhance the creep strength of the Nimonic family of alloys, researchers gradually increased the titanium content of these materials and introduced other alloying elements. A notable characteristic of the Nimonic alloy family is that their high-temperature strength can be enhanced through the continuous addition of the γ′ phase. In high-temperature valve alloys, nickel enhances their corrosion resistance and strength at high temperatures; the addition of from 25% to 50% nickel transforms the ferrite matrix into a stable austenitic matrix. Chromium can form a layer of dense oxide film, especially at high temperatures, and can be formed on the surface of an alloy’s dense Cr2O3-type oxide layer, which significantly enhances its oxidation and corrosion resistance [6]. Tungsten improves the high-temperature strength and heat resistance of alloys through solid solution strengthening and precipitation strengthening mechanisms, and helps prevent grain growth. When tungsten atoms are incorporated into the alloy matrix, the lattice expands significantly, creating a larger long-range stress field [7] which prevents dislocation movement and thus significantly increases the yield strength of the alloy [8]. Titanium can be combined with nitrogen to form titanium nitride, which enhances the corrosion resistance of the alloy [9]. Niobium is an effective stabilizing element that can inhibit lattice changes and improve the high-temperature stability of the alloy. The addition of niobium helps to reduce the rate of grain boundary creep and improve the durability of the material [10]. Molybdenum can increase the high-temperature strength and creep resistance of the alloy. It can also form hard compounds with other elements to improve the wear resistance and corrosion resistance of the alloy [11].
The main precipitation phase in iron–nickel-based superalloy (Ni30) is the γ′ phase, which serves as a critical reinforcement component whose rate and size are influenced by temperature and the aluminum and titanium content. When the ratio of titanium to aluminum is excessively high, the growth rate of the γ′ phase is affected, potentially leading to the formation of detrimental η-phase (Ni3Ti) [12]. The strengthening mechanisms of Ni30 alloys during solution treatment and aging include solid solution strengthening, precipitation strengthening, and grain boundary strengthening. S. Sinharoy et al. [13] compared the oxidation rate between Nimonic 90 and Inconel 751 alloys at 870 °C. At 830 °C, both high-temperature alloys exhibit similar oxidation resistance, consistent with the kinetics of Cr2O3 formation and determined by oxidation rate constants. The severity of oxidation increased significantly in both alloys at 970 °C, with Nimonic 90 showing a deeper oxide layer, while the Co element promoted oxidation at this temperature. Labun et al. [14] carried out microstructural and microchemical investigations of the high-temperature oxidation of Fe-Cr alloys with Cr contents ranging from 3 to 18 wt.%. Their results show that the first phase to nucleate at all pressures is M3O4 spinel (M = Fe, Cr). The formation of (α)-M2O3 was also observed for short periods. At low pressures, the oxide cores are Cr-rich, while the formation of transient Fe-rich oxides accelerates with increasing pressure. For low-chromium alloys, the oxide nuclei grow outward from the metal surface, whereas, for high-chromium alloys, the oxide nuclei form entirely within the metal. The diffusion of metal cations and oxygen anions can explain this difference in oxide core formation. As the oxidation proceeded, lamellar scales formed in all alloys. The low-chromium alloys formed scales consisting of two outer layers of hematite and an inner layer of spinel containing chromium and M3O4. The high-chromium alloys formed a thin outer layer of Cr2O3 over a thicker layer of iron-rich oxides.
Ni30 alloy is a key component in internal combustion engines and is considered for use for intake and exhaust valves. This study systematically investigates the microstructural and property changes of Ni30 alloy under various heat-treatment conditions, and the effects of different heat-treatment regimes on the amount of γ′ precipitation, the size distribution, and the orientation relationship with the matrix γ phase were investigated. The effects of prolonged exposure to high temperatures of 750 °C and 650 °C on the internal microstructural changes and mechanical properties of Ni30 alloys were investigated. The oxidation resistance of Ni30 alloys at 750 °C was assessed through weight gain measurements, and the oxidation products formed on the surface were characterized by XRD. The morphologies of the oxidized surfaces and cross-sections were observed by scanning electron microscopy and combined with EDS analysis to elucidate the oxidation mechanisms at different temperatures. This work provides valuable insights into the heat-treatment behavior of Ni30 superalloys, advancing the understanding of their performance and offering guidance to materials engineers seeking to develop superior high-temperature materials.

2. Experimental Procedures

2.1. Material Processing

The Ni30 superalloy used in this study was prepared using a vacuum induction melting furnace manufactured by Seco/Warwick S.A. (Świebodzin, Poland). Pre-prepared nickel blocks, chromium blocks, pure iron, titanium rods, aluminum blocks, and molybdenum blocks were placed in the vacuum induction melting furnace for melting. The melting technique employed effectively removes large non-metallic inclusions and refines the grain structure. The top-down solidification conditions ensure a dense and homogeneous crystal structure of the resulting ingots. The adopted electroslag remelting technology further improves the processing ductility of the ingots over a wide temperature rang. After forging and preliminary processing, the ingots were fabricated into φ16 mm diameter bars. The specific composition is shown in Table 1.

2.2. Microstructural Characterization

After grinding and polishing, the metallographic samples were electrolytically etched using a 10% oxalic acid solution in deionized water. The etched samples were then observed under a Zeiss Axio Observer A2M high-temperature metallographic microscope (ZEISS, Oberkochen, Germany). Hardness tests were performed using a KB 30S fully automated hardness tester (KB Prüftechnik GmbH, Hochdorf-Assenheim, Germany). The test load was set at 1 kg with a dwell time of 25 s. Five points were tested for each sample and the highest and lowest values were removed to obtain an average value, ensuring that each indentation had a clear and distinct edge and contour.
For room temperature tensile testing, Ni30 samples were machined into standardized tensile specimens with an original gauge length of 50 mm and a diameter of 10 mm. Figure 1 shows a standard schematic of the tensile specimen. According to the national standard GB/228.1-2021 [15], rod-shaped tensile specimens were prepared. Tests were carried out using a SANS universal testing machine (SUNS UTM4204X, Shanghai, China) at a strain rate of 3 mm/min. The ultimate tensile strength and elongation at break were recorded. The average value of the three parallel samples was taken as the test result. The fracture surfaces of the Ni30 samples were examined using field emission scanning electron microscopy (FE-SEM, Gemini 300, ZEISS, Jena, Germany). Microstructural observations were made using FE-SEM and the elemental compositions of the phases were analyzed using a companion EDS spectrometer (Ultim Max, Oxford Instruments, Santa Barbara, CA, USA). X-ray diffraction (XRD) analyses were performed using a Bruker D8 Advance X-ray diffractometer (Bruker, Billerica, MA, USA). XRD test was performed using a Cu target with an X-ray wavelength of 1.5406 Å, a scanning range from 10° to 90°, and a scanning speed of 4°/min.

2.3. Heat-Treatment Methods and Long-Term Heat Exposure Tests

In this study, the forged material was cut into cylindrical samples with dimensions of ø16 mm × 10 mm to serve as the base samples for heat treatment. The solution treatment temperatures selected were 950 °C, 1000 °C, 1050 °C, 1100 °C, and 1150 °C, with a fixed solution treatment time of 1 h and oil quenching as the cooling method. In order to more realistically simulate the working service environment of internal combustion engine valves, we designed the following test temperatures and long-term service test times. After solution treatment, the Ni30 alloy samples were subjected to aging treatment at temperatures of 700 °C, 750 °C, 800 °C, and 850 °C, with aging times of 1 h, 2 h, 4 h, 6 h, 12 h, and 24 h and air cooling as the cooling method. To verify the microstructural stability of the Ni30 alloy under long-term exposure, samples that underwent solution treatment at 1050 °C for 0.5 h followed by water quenching were selected. These samples were then placed in a muffle furnace at 750 °C for long-term holding tests, with holding times of 0 h, 10 h, 60 h, 100 h, 200 h, 500 h, 1000 h, 1500 h, 2000 h, 3000 h, and 4000 h. For the long-term high-temperature oxidation tests at 750 °C, the original forged bars with a diameter of 16 mm were processed into rectangular samples measuring 30 × 10 × 4 mm using an electrical discharge wire cutting technique. Oxidation treatment was performed at 750 °C for durations of 10 h, 60 h, 100 h, 200 h, 500 h, 1000 h, 1500 h, 2000 h, 3000 h, and 4000 h. Figure 2 shows the oxidized samples placed in the crucibles.

3. Results and Discussion

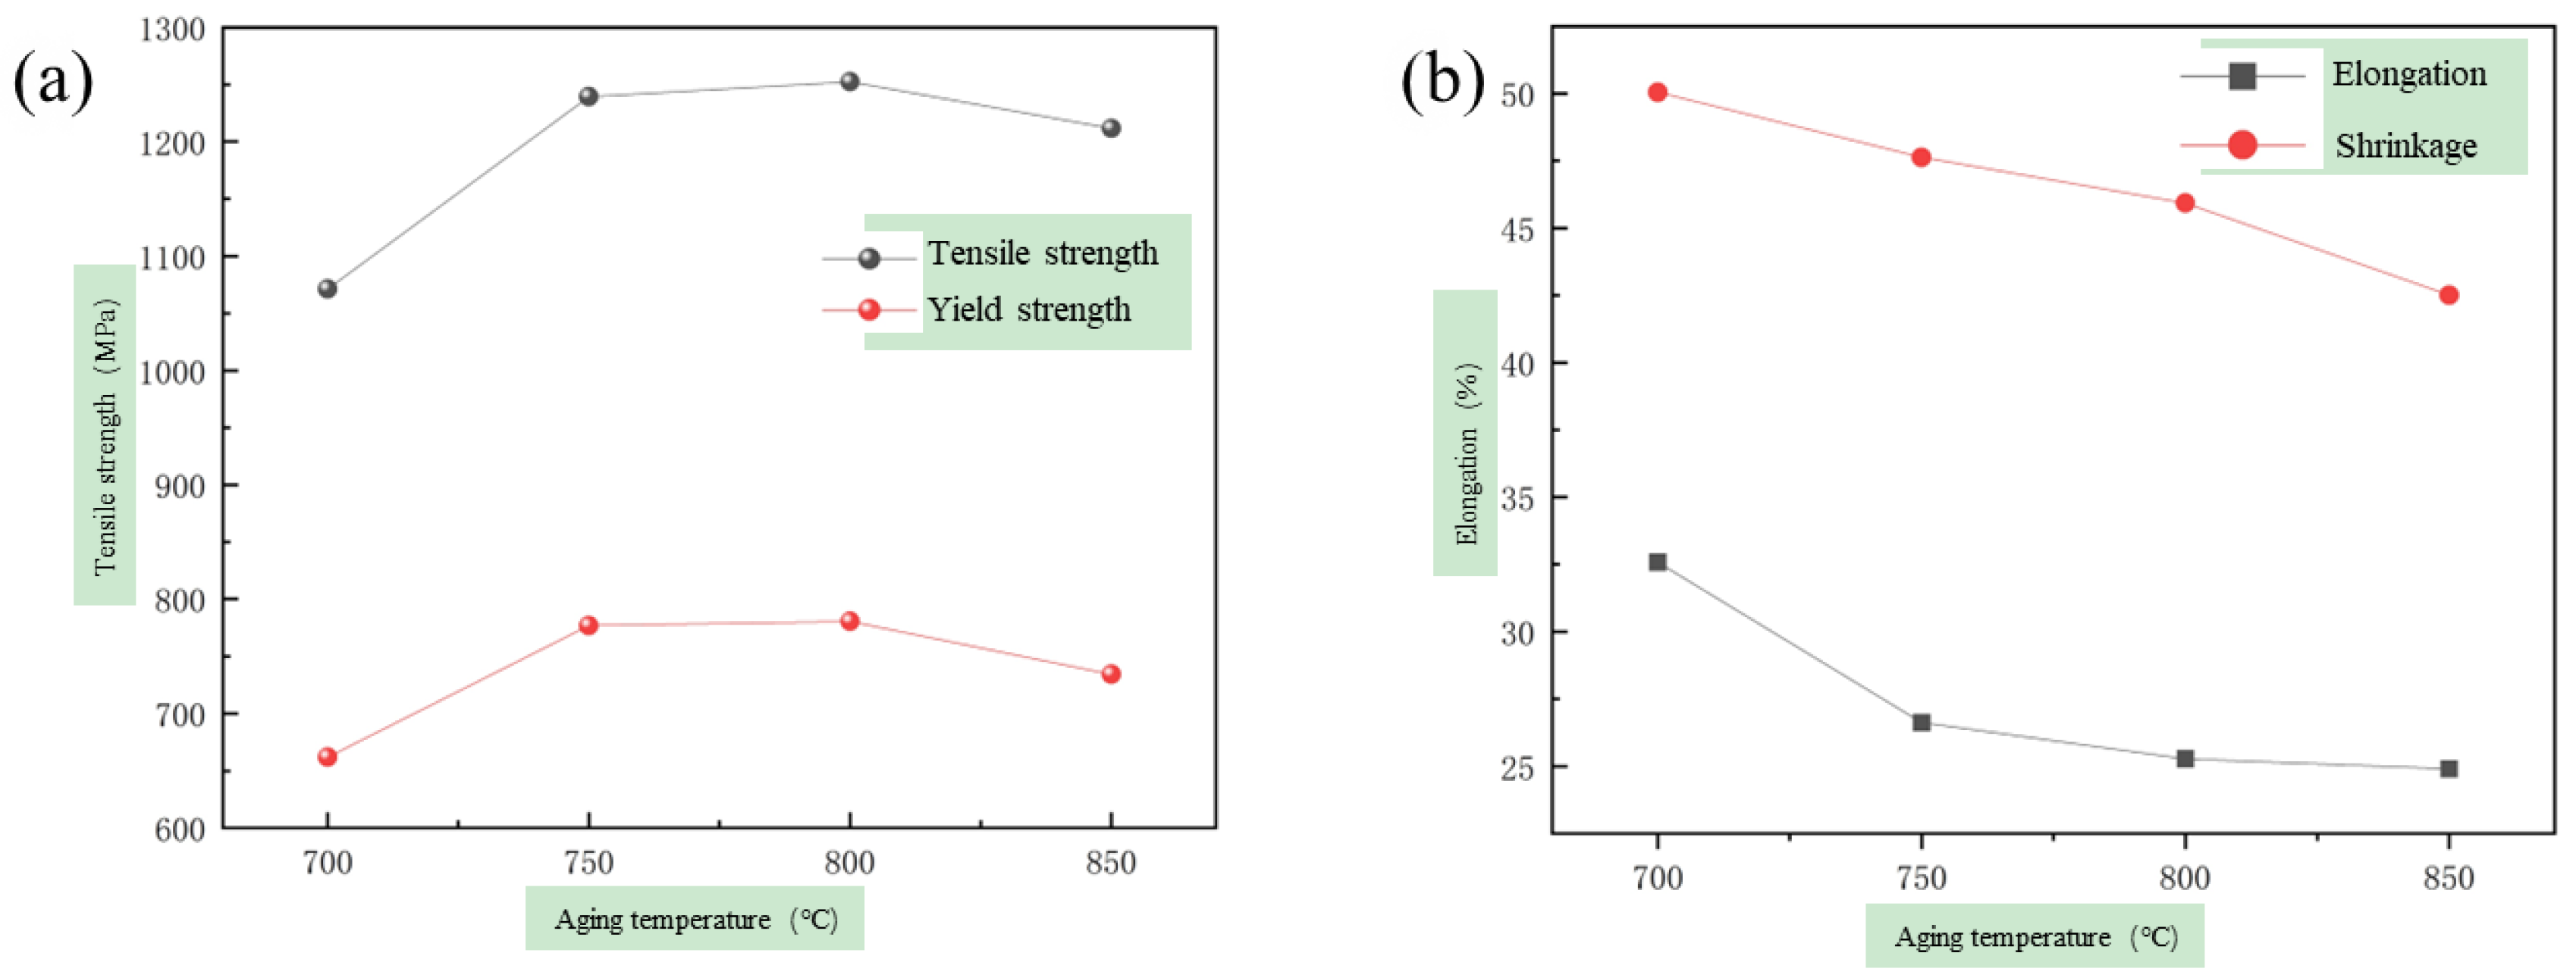
3.1. The Evolution of Microstructure and Mechanical Properties in Forged and Solution Heat Treated States

Figure 3a shows the microstructure of the as-forged Ni30 alloy, where the matrix consists of a single austenitic phase. Numerous irregular black block-like undissolved phases can be observed within the grains and near the grain boundaries. In high-temperature deposited austenitic alloys, these black undissolved phases are typically undissolved carbides. Figure 3b–f show the microstructures of the Ni30 alloy after solution treatment at different temperatures. At 950 °C, significant amounts of undissolved phases remain, and the grain size is similar to that before solution treatment. As the solution temperature increases, the granular undissolved phases within the alloy gradually disappear. By 1000 °C, the granular undissolved phases within the grains and along the grain boundaries are almost entirely dissolved into the matrix. The amount of fine grains is significantly reduced and the grain size begins to increase, effectively eliminating the mixed-grain structure.
As the solution temperature continues to rise, the grain size increases further. Even at 1150 °C, irregular block-like undissolved phases still persist and do not completely dissolve into the matrix. Previous studies have indicated that the dissolution temperature of these undissolved phases is above 1300 °C; thus, they cannot be entirely eliminated. At 950 °C, the microstructure contains a large number of fine grains, making 950 °C unsuitable as the solution treatment temperature for Ni30 alloy. The microstructure of Ni30 alloy after solution treatment is an oversaturated solid solution which is thermodynamically unstable. There is a tendency for second-phase particles to precipitate spontaneously from the oversaturated solid solution, forming the γ′ phase. The γ′ phase serves as the strengthening phase in Ni30 alloy, and numerous studies [16,17,18,19,20] have shown that the size, shape, and distribution of the strengthening phase are crucial to the performance of the alloy.
Figure 4 shows the microstructures and grain size distributions of the Ni30 alloy aged for 6 h at different solution treatment temperatures. It can be observed that, within the solution treatment temperature range from 700 °C to 850 °C, the grain size does not significantly increase with the increase in the solution temperature. The process of grain growth fundamentally involves the transfer of atoms from one grain to an adjacent grain, which is associated with the migration of large-angle grain boundaries. The migration rate of grain boundaries containing second-phase particles can be expressed by Equation (1) [21]:
V = M ( P g P z )
where V represents the grain boundary migration rate, M is the grain boundary mobility, Pg is the driving force for grain boundary migration, and Pz is the pinning force of the second-phase particles. M and Pz can be expressed by Equations (2) and (3), respectively [22,23]:
M = M 0 exp ( Q R T )
P z = 3 F z γ 2 r
where M0 is the kinetic constant, Q is the activation energy for grain growth, R is the gas constant (R = 8.314 J·mol−1·K−1:T), and T is the temperature. Fv is the volume fraction of precipitated phase particles, γ is the interfacial energy per unit area of the grain boundary, and r is the radius of the precipitated phase. From Equations (1)–(3), it can be deduced that the grain growth rate is influenced by both the driving force for grain boundary migration and the grain boundary mobility. The driving force for grain boundary migration primarily originates from the grain boundary interfacial energy. The solution treatment alone already caused significant grain growth, reducing the driving force for grain boundary migration. The aging temperature is much lower than the solution treatment temperature, which reduces the grain boundary mobility. During the aging process, as the aging temperature increases, the atomic diffusion coefficient increases, leading to more precipitation of the γ′ phase and an increase in the volume fraction of the precipitated phase. However, a 6 h aging time is insufficient to support long-distance atomic diffusion, so the radius of the precipitated phase does not significantly increase with the temperature. Consequently, the pinning effect of the second-phase particles is enhanced, which prevents a significant increase in the grain boundary migration rate, thereby inhibiting grain growth.
According to Figure 5, when the aging temperature is 700 °C, the aging temperature is relatively low. As the aging time extends, a large number of fine γ′ phase particles precipitate, continuously enhancing the pinning effect of the strengthening phase. Mechanically, this manifests as a rapid increase in hardness. However, as the aging time continues to increase, the nucleation of strengthening phase particles ceases and coarsening begins, along with grain growth. Due to the pinning effect of the strengthening phase particles and the relatively low aging temperature, this process occurs slowly. This results in a peak hardness followed by a gradual decrease, indicating overaging. When the aging temperature is 750 °C, the higher aging temperature leads to a faster precipitation rate of the strengthening phase and a shorter complete precipitation time. Since the aging temperature is still not high, the strengthening phase particles do not significantly grow. At 700 °C, due to the longer precipitation time, the initially precipitated strengthening phase particles have already begun to coarsen. The hardness of the samples aged at 750 °C is generally higher than those aged at 700 °C, and the peak hardness appears earlier. When the aging temperature is 800 °C, with a further increase in the aging temperature, the atomic diffusion coefficient also increases, leading to an increase in the size of the precipitated γ′ phase particles and a decrease in their number, weakening the pinning effect [18,19].
When the aging time is the same, the hardness first increases and then decreases with the increase in the aging temperature. This is because, at lower solution treatment temperatures, atomic diffusion is slow, making it difficult to form clusters of precipitate phase atoms, resulting in insufficient concentration fluctuations and difficulty in meeting the nucleation conditions for the precipitate phase. Although the undercooling is significant, the amount of precipitate phase is low. The deformation of the alloy primarily occurs through dislocation movement, and the γ′ phase hinders dislocation movement mainly through shear mechanisms and Orowan bypass mechanisms. When the amount of γ′ phase is small, the shear mechanism dominates; conversely, the Orowan bypass mechanism dominates. There is a critical size, and generally the strengthening effect of the γ′ phase is optimal when its size is close to this critical size [24]. As the aging temperature increases, the atomic diffusion coefficient increases, leading to more γ′ phase precipitation and enhancing the strengthening effect of the γ′ phase. However, when the aging temperature is further increased, the grain size of the γ′ phase grows, which reduces the strengthening effect of the γ′ phase. This results in a peak hardness value as the aging temperature changes. Therefore, it can be concluded that an aging temperature of 750 °C is the optimal aging temperature.
Figure 6 shows the microstructures of the Ni30 alloy samples aged at 750 °C for different aging times. The grain size does not change significantly with the extension of the aging time. After solution treatment, the grains have already grown, reducing the number of grain boundaries and the driving force for grain boundary migration. The aging temperature at this stage is relatively low, resulting in a low atomic diffusion coefficient. Atoms cannot diffuse over long distances and can only aggregate locally to form fine γ′ phase particles. As the time is extended, a large number of these fine γ′ phase particles precipitate, enhancing the pinning effect on the grain boundaries. Therefore, the grains do not grow significantly with the extension of the aging time. The statistical distribution of grain sizes in Figure 6 shows that, with the extension of the holding time, the grain size exhibits a slight increase and the overall distribution remains relatively uniform, with only a few large grains. Since the aging temperature is much lower than the solution treatment temperature, the grain boundary migration rate is low, and the grains do not exhibit the significant growth observed in the samples after solution treatment.
Figure 7 presents the variations in strength and ductility-toughness of the Ni30 alloy after the solution treatment and aging. At 700 °C, the strength of the Ni30 alloy is 1071.3 MPa. As the aging temperature increases, the tensile strength of the Ni30 alloy rises to a certain extent and then tends to decrease gradually. The peak tensile strength of 1252.5 MPa is achieved at 750 °C. As the temperature continues to rise, the strength begins to decline. However, the ductility and toughness show a continuous downward trend. The elongation and reduction of the area decrease from 32.6% and 50.0% to 24.9% and 42.5%, respectively. This phenomenon primarily stems from the fact that, under the corresponding temperature conditions, aging treatment leads to the presence of a significant amount of MX phases in the matrix which contribute to precipitation strengthening. The primary strengthening phase, γ′, precipitates within the grains and increases in quantity, providing effective reinforcement to the matrix. However, under higher aging temperatures, the γ′ phase may undergo coarsening, forming larger aggregates within the austenitic matrix. This results in an increase in the size of γ′ phase particles, which weakens the stress fields around the γ′ phase, leading to a reduction in the strengthening effect of the γ′ phase.
Table 2 presents the mechanical properties of the alloy after solution and aging treatment at 1050 °C for 0.5 h followed by 750 °C for 6 h. Compared to the as-forged Ni30 alloy, the hardness increased by 21% to 353.2 HV, while the tensile strength and elongation decreased. Figure 8 shows the fracture morphologies of the as-forged and optimally heat-treated states. Compared to the as-forged state, the low-magnification morphology of the heat-treated state reveals a reduction in the number of deep pits and shallower depths, with lower tear ridges. At high magnification, there is a noticeable increase in shallow dimples, which is attributed to the precipitation of a large number of fine γ′ phase particles after the solution and aging treatment.

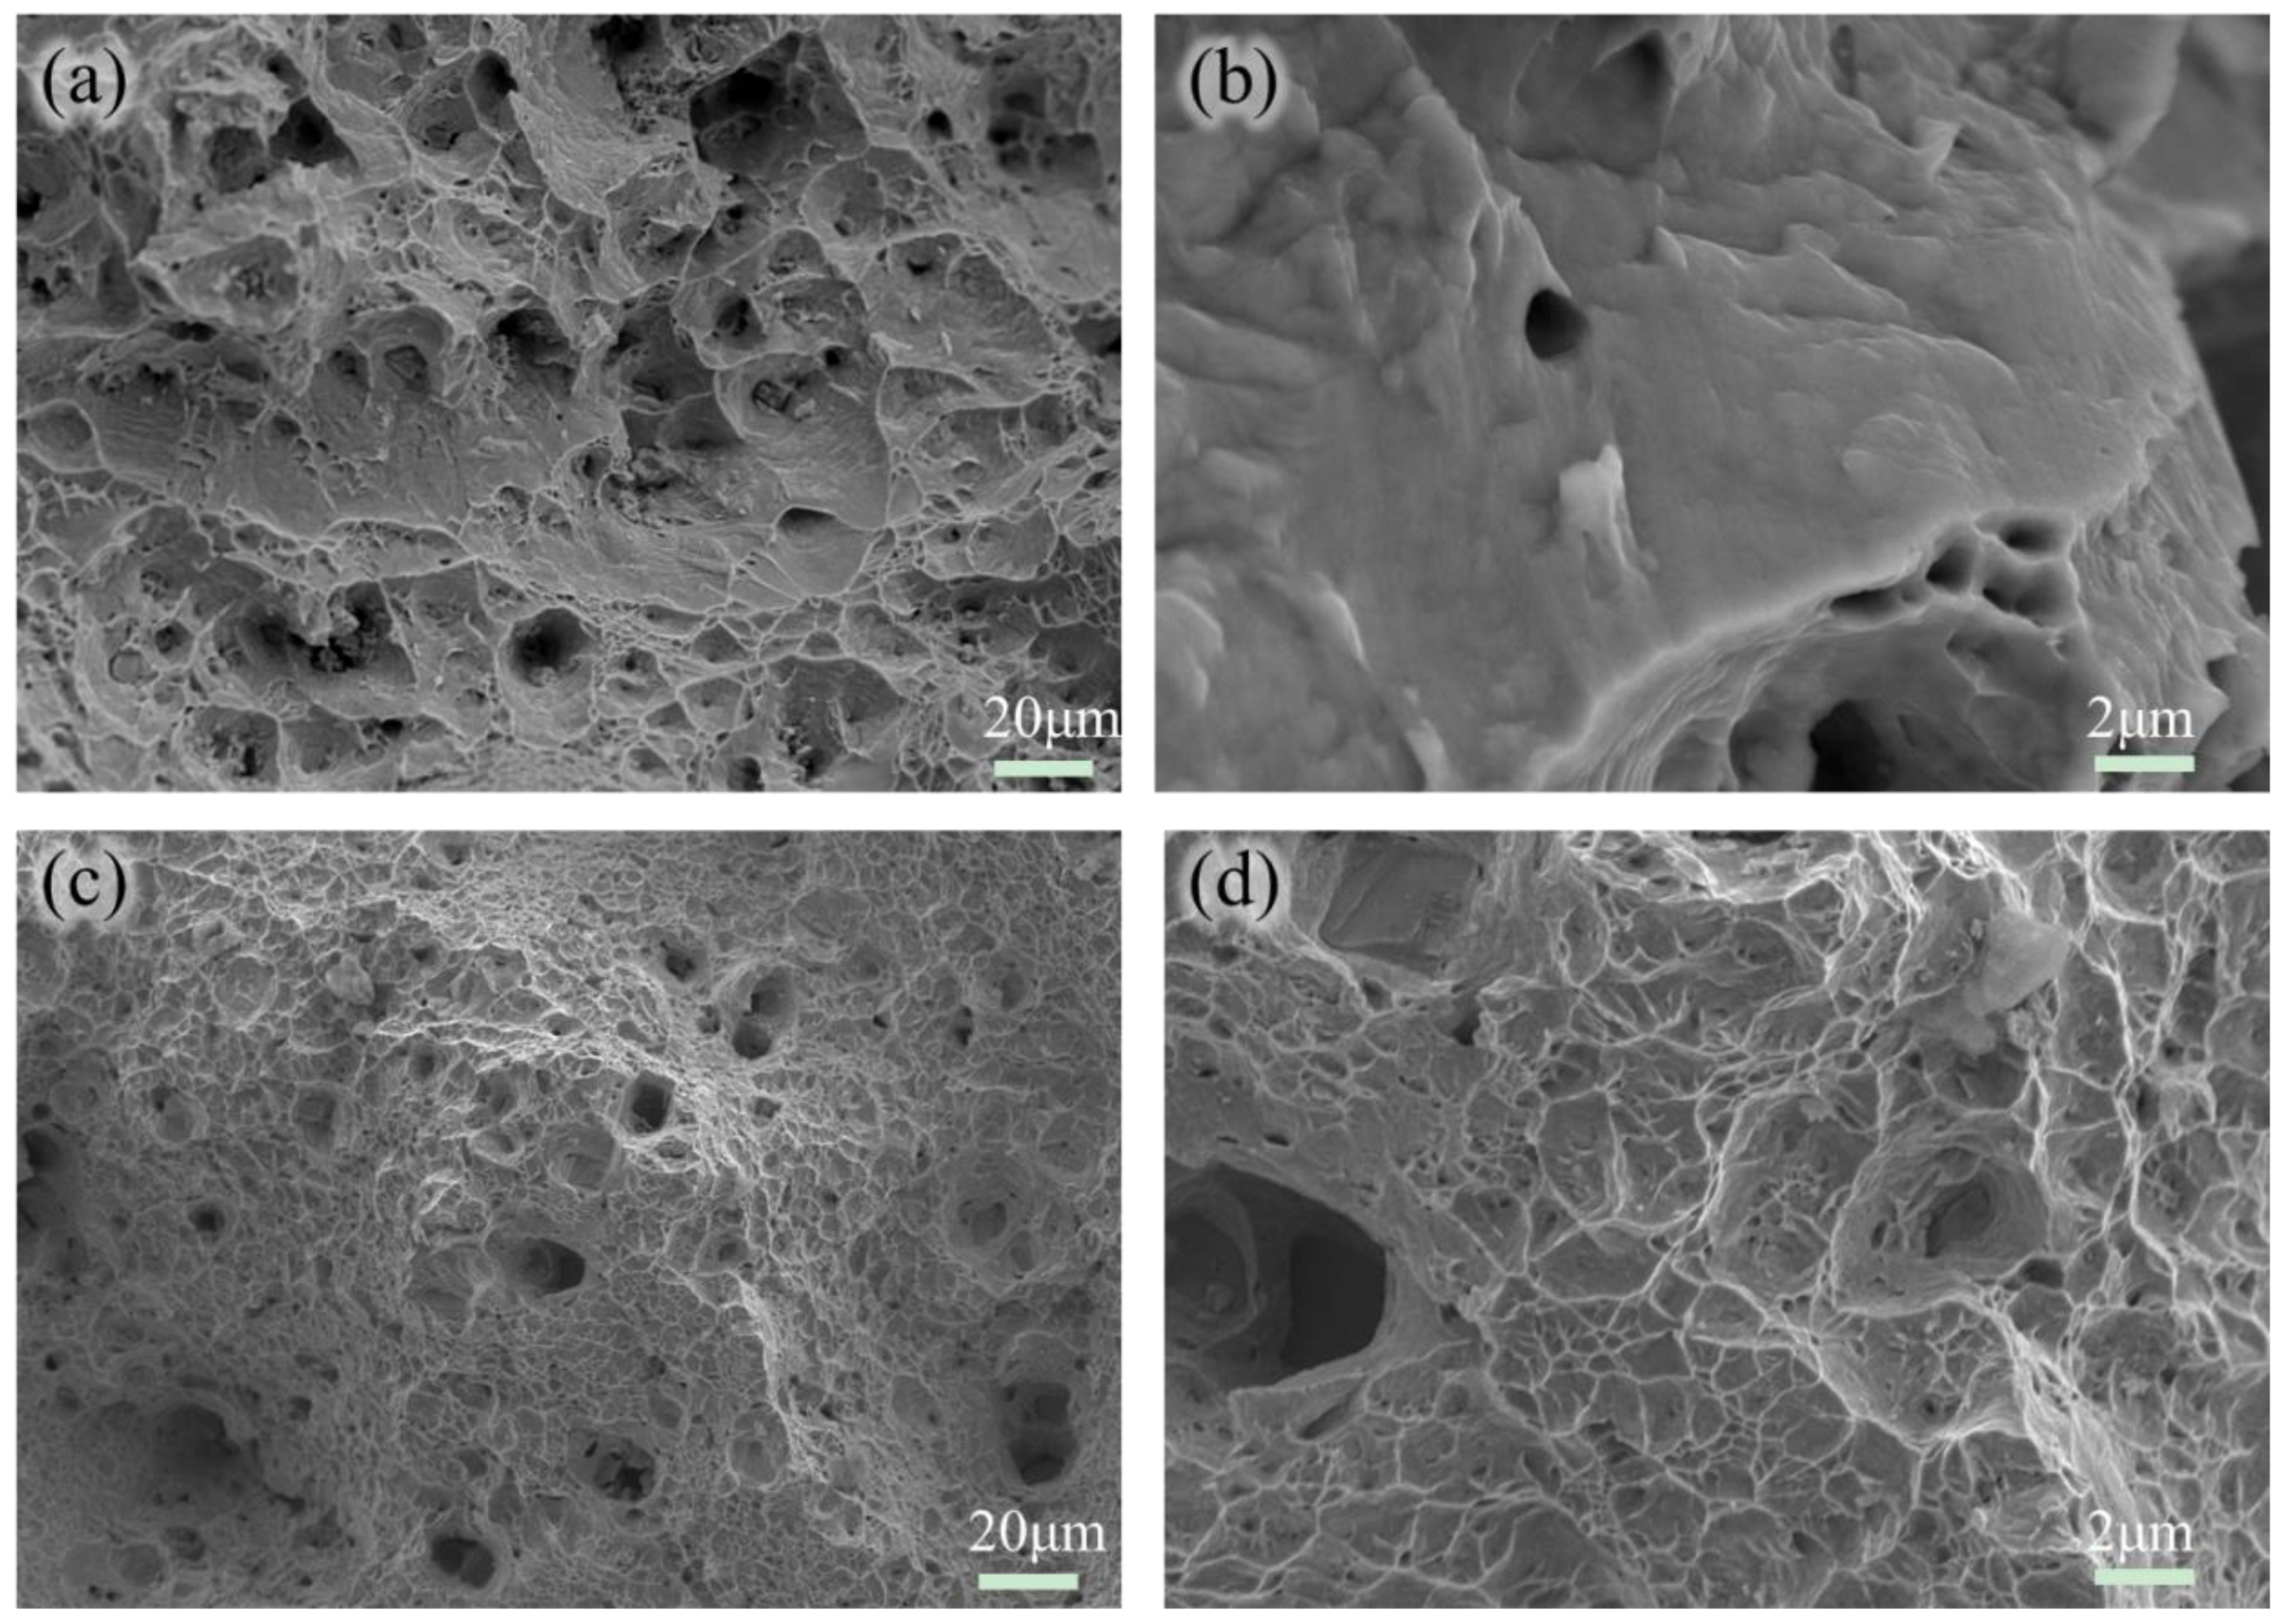
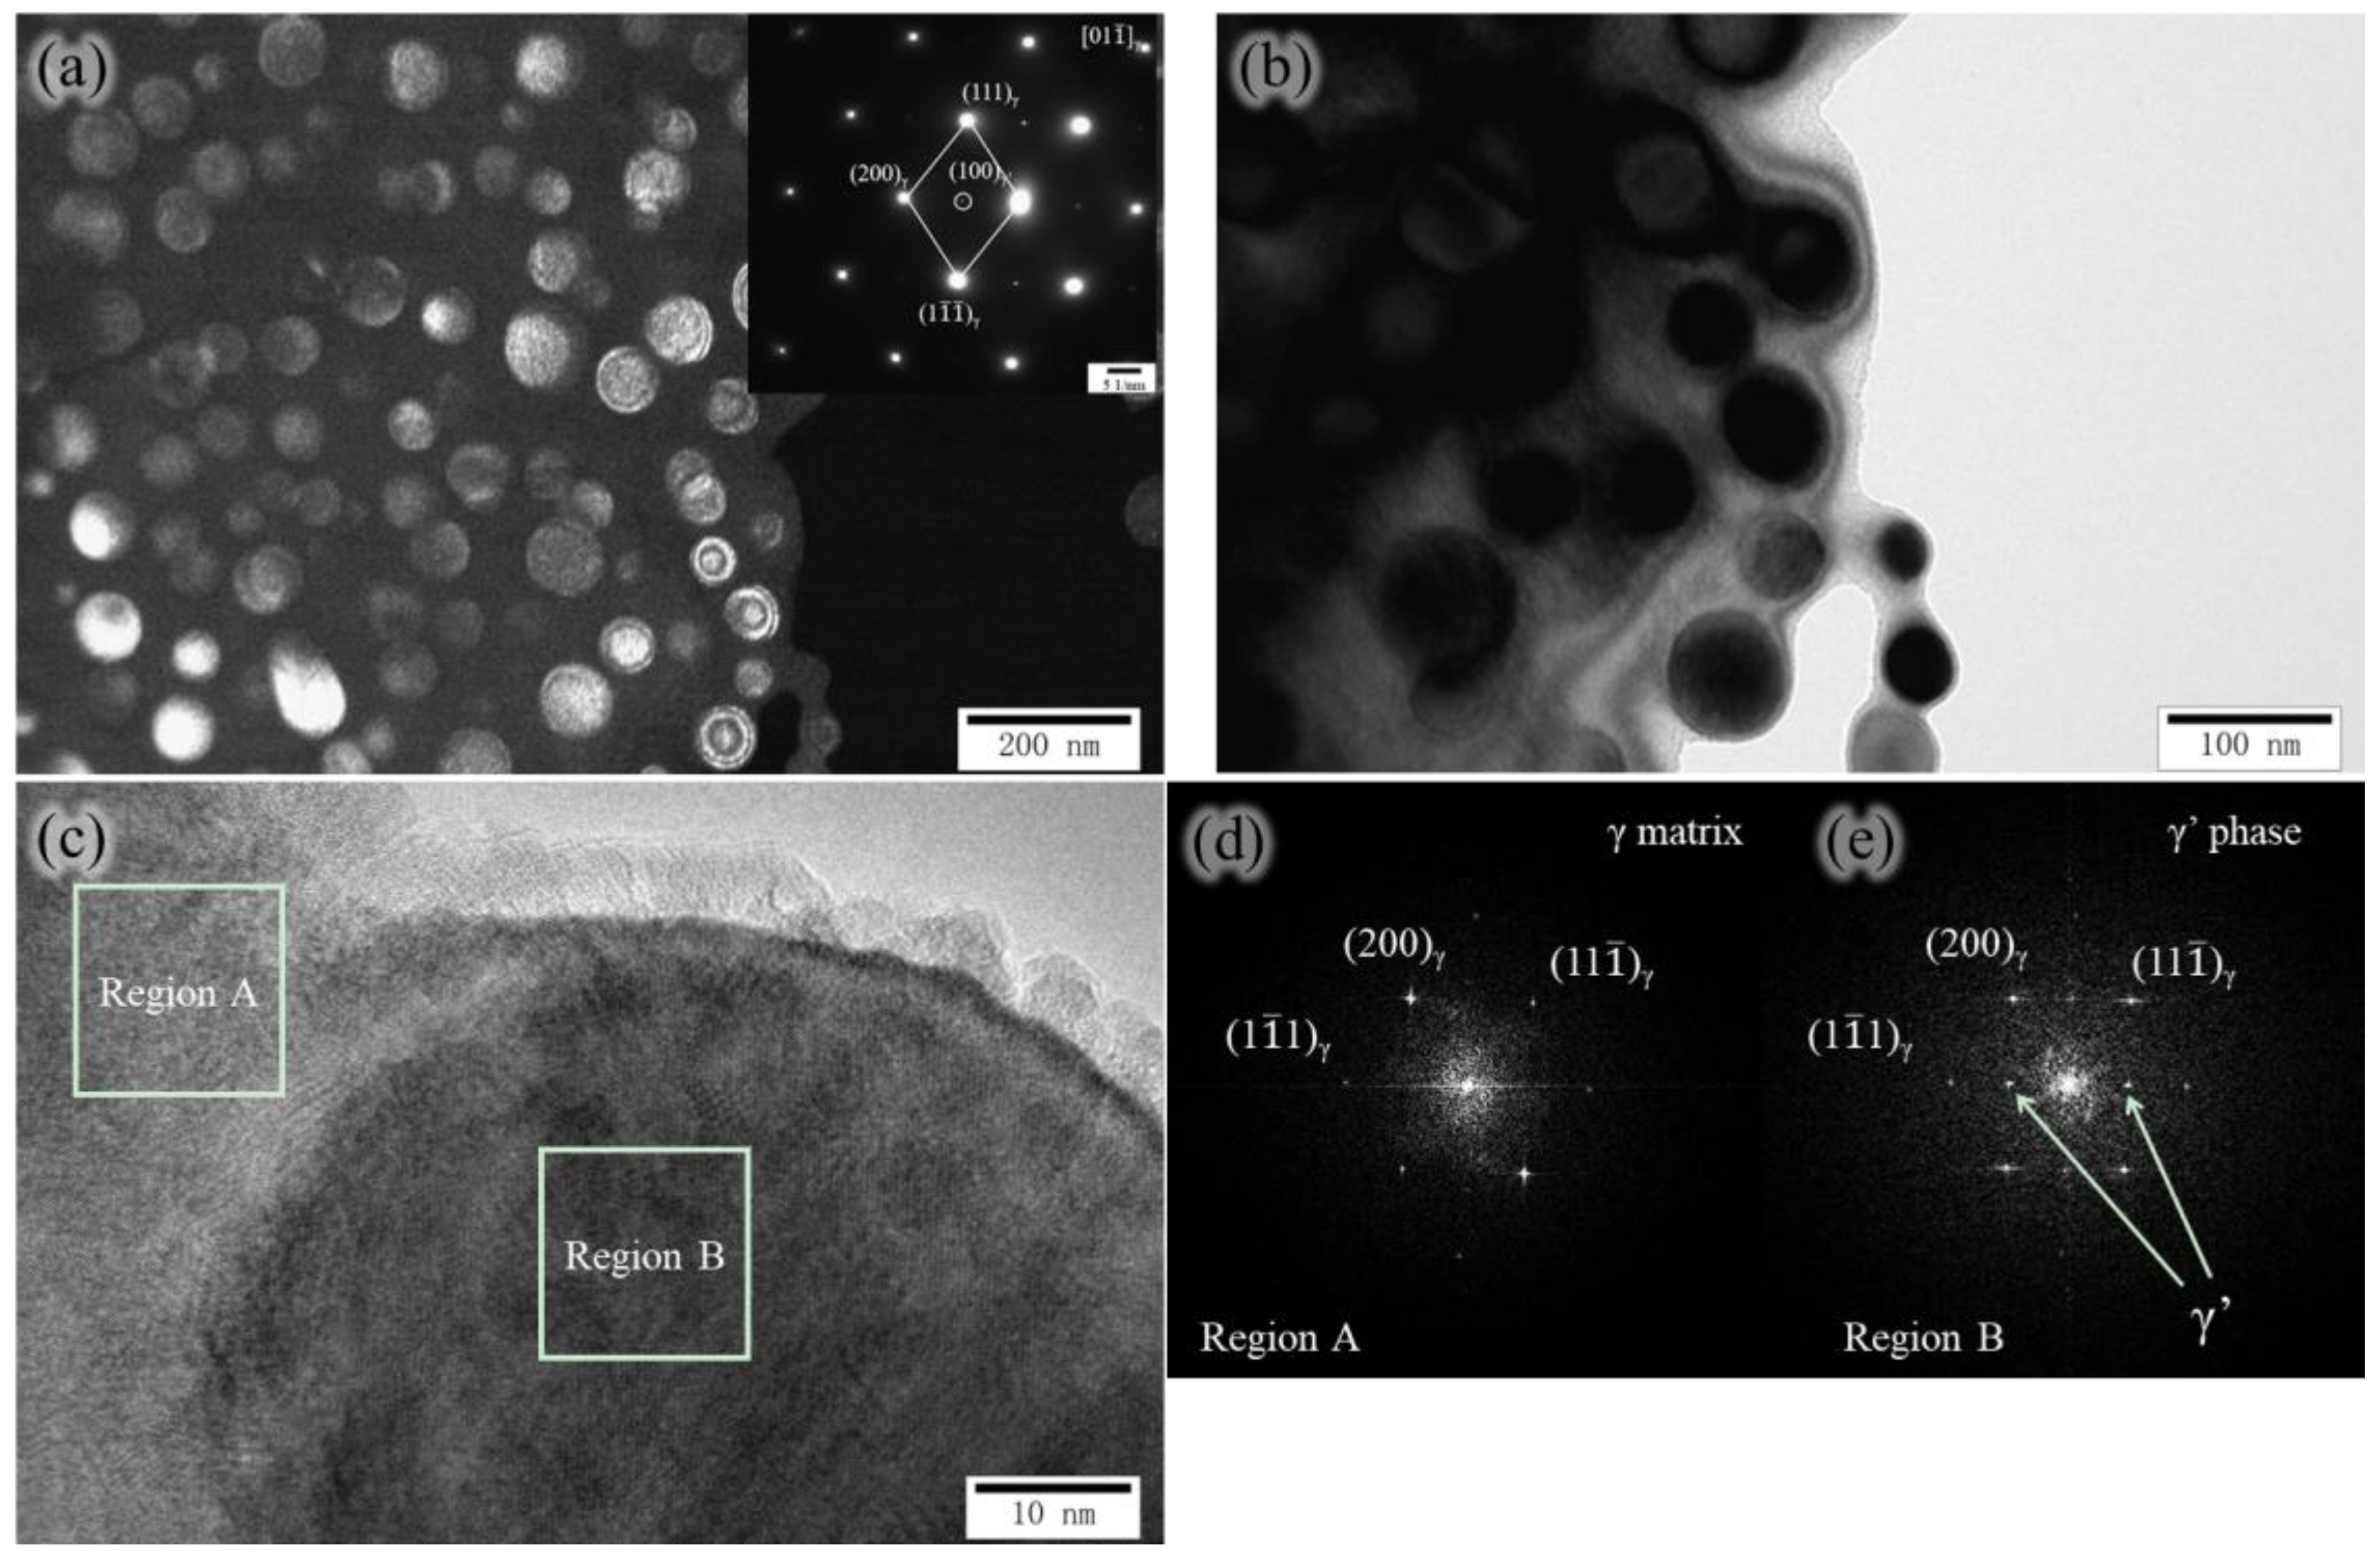
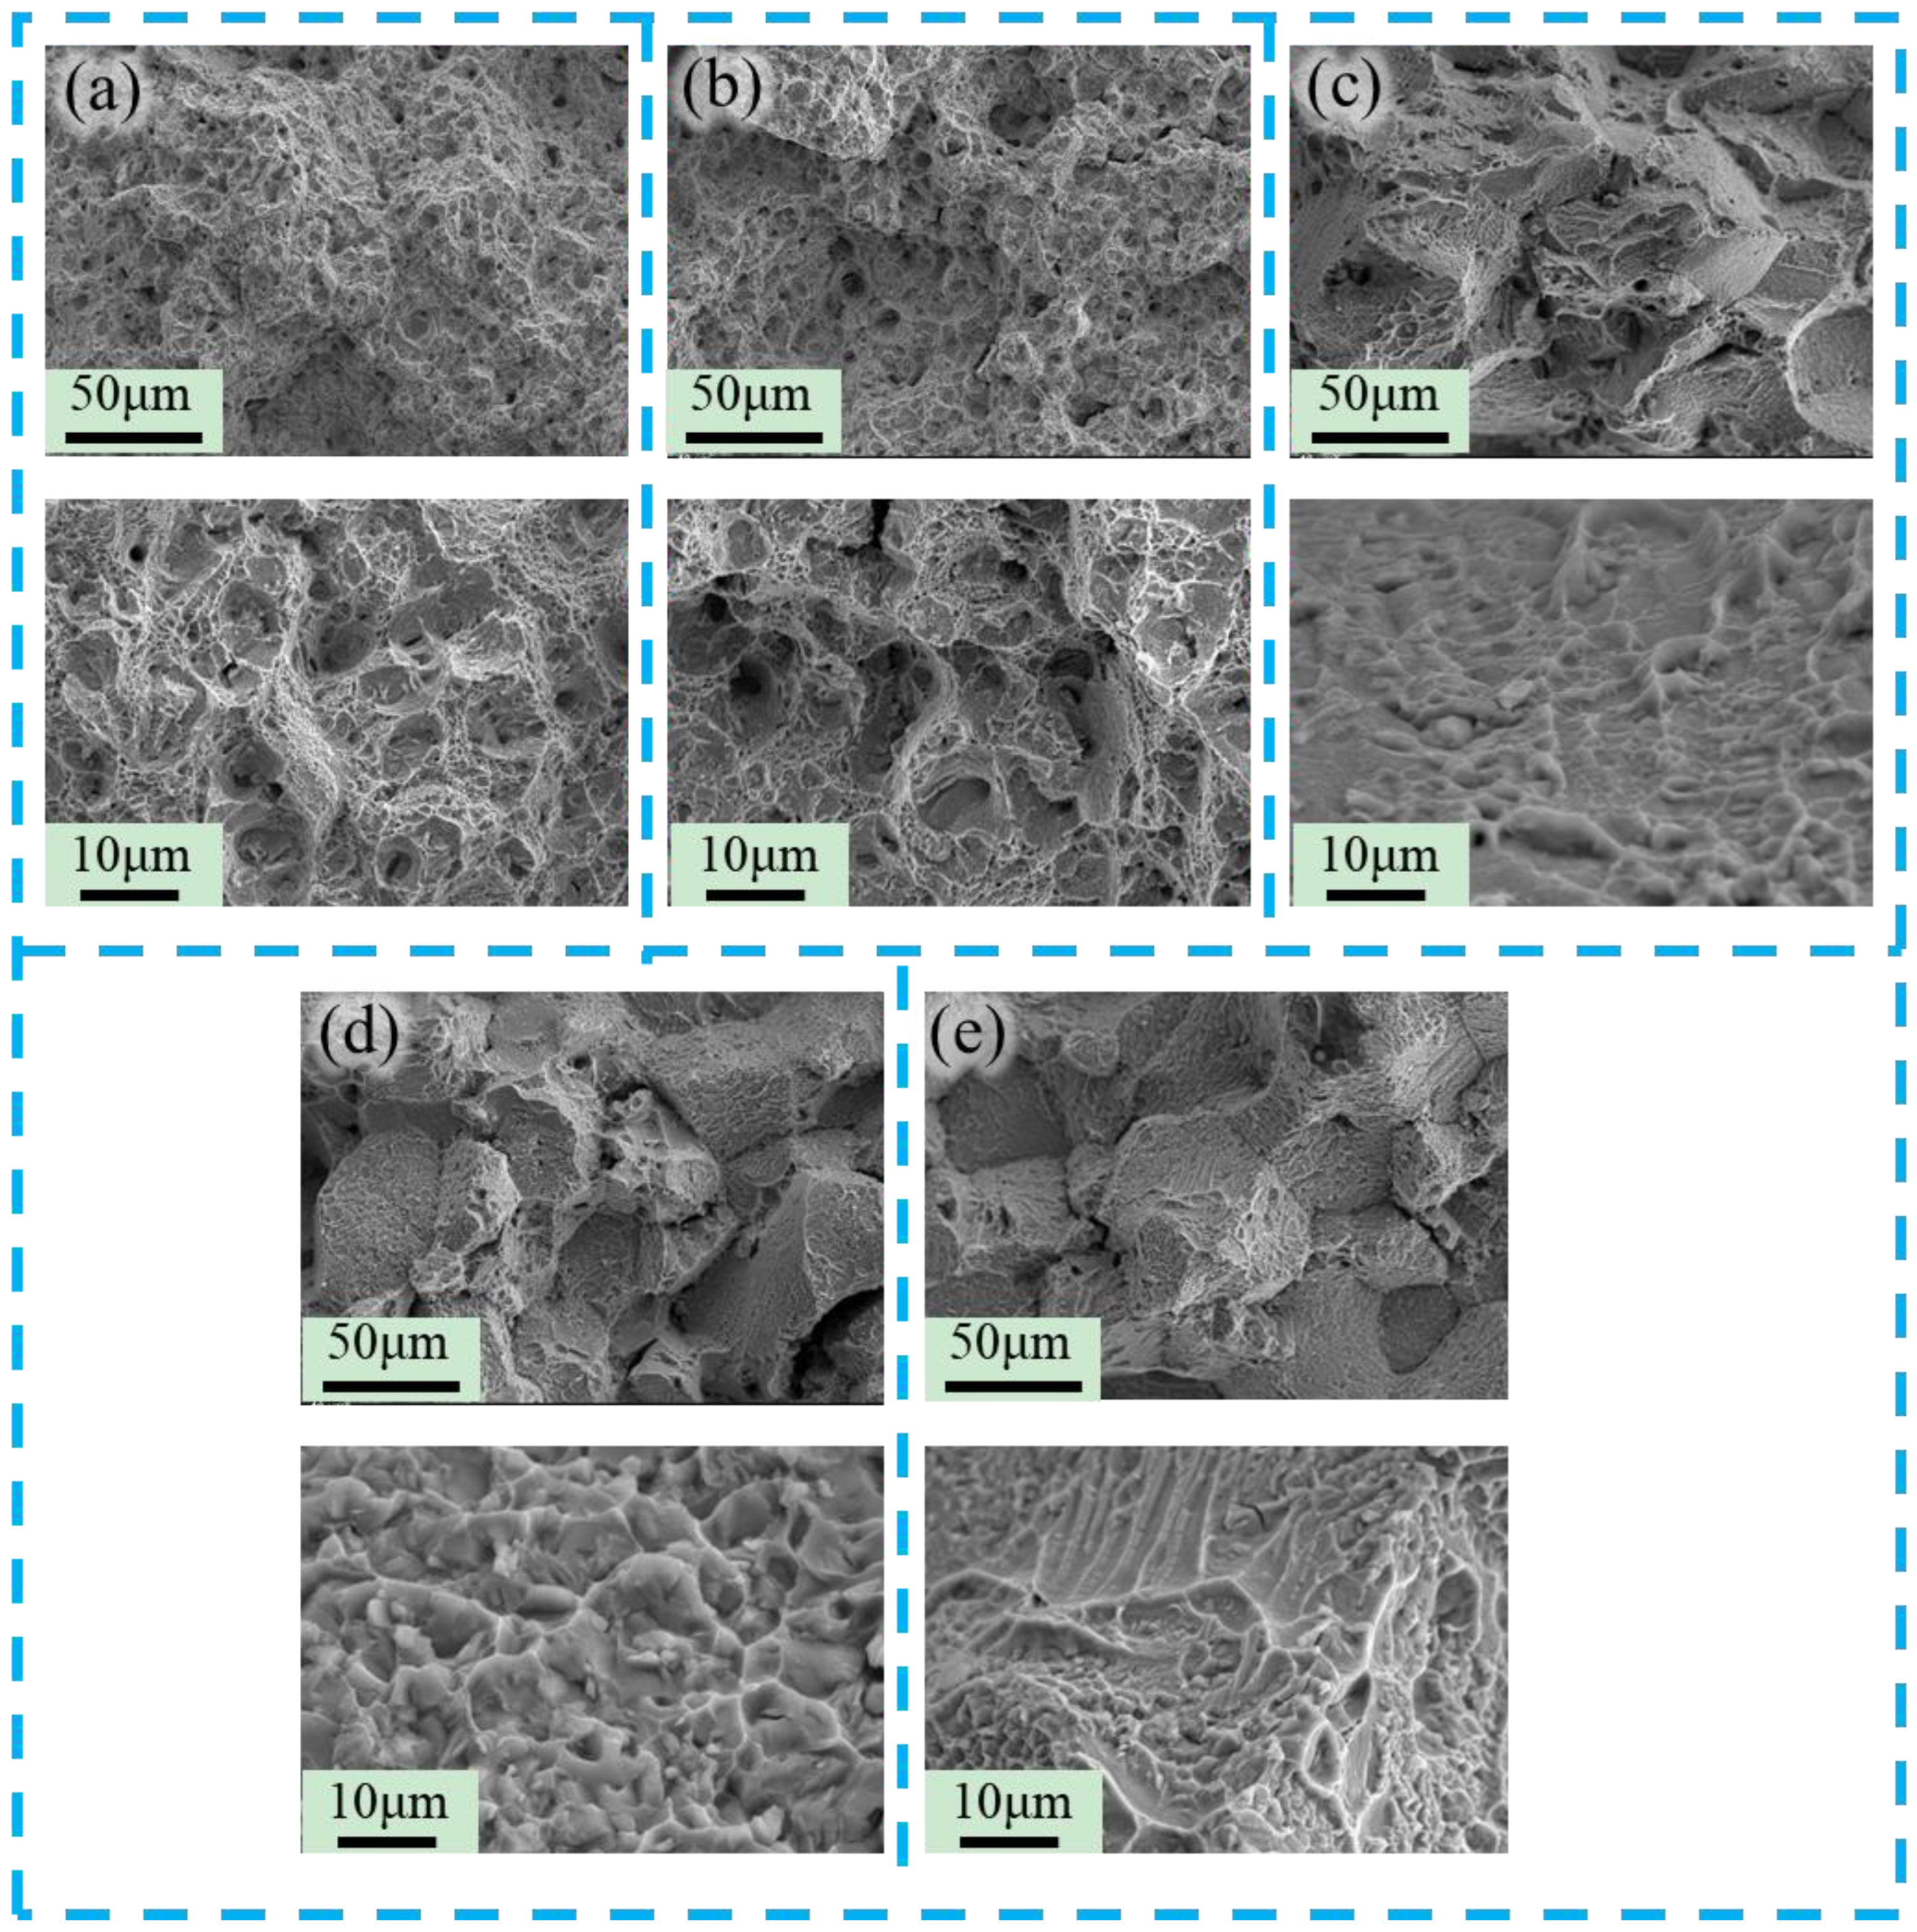
3.2. The Evolution of Microstructure and Mechanical Properties in Ultra-Long Term Aged Heat Treated

Figure 9 shows the microstructure of the Ni30 alloy after long-term holding at 750 °C following heat treatment (1050 °C for 0.5 h and 750 °C for 6 h). It can be observed that the grain size does not change significantly during the long-term holding process. This is because the second-phase particles precipitated during the aging treatment pin the grain boundaries, preventing grain boundary migration and suppressing grain growth. Additionally, the grains after solution treatment are already relatively coarse, and the temperature is relatively low, which reduces the driving force for grain boundary migration. As the holding time extends, the grain boundaries begin to coarsen, leading to a decrease in their corrosion resistance. This is due to the increased number of defects at the grain boundaries, which facilitates the nucleation and gradual precipitation of secondary carbides at these boundaries [25].
Figure 10 shows the SEM images of the Ni30 alloy after long-term holding at 750 °C. The white irregular block-like objects are believed to be Ti-rich carbides. After 50 h of aging, plate-like secondary carbides begin to precipitate at the grain boundaries. After long-term holding, the alloy contains a dense distribution of γ′ phase [17,18]. As the holding time extends, the size of the γ′ phase begins to increase, indicating coarsening of the γ′ phase. As shown in Figure 10, the morphology of the γ′ phase remains spherical or ellipsoidal throughout the aging process, indicating good structural stability of the γ′ phase during long-term aging. The precipitation of the γ′ phase in the matrix increases the interfacial energy, transforming the system from a stable to a metastable state. The size differences among the γ′ phase particles create concentration gradients, forcing solute atoms to migrate towards larger particles and leading to the gradual growth of larger γ′ particles and the disappearance of smaller ones. This competitive growth of precipitated particles in a near-equilibrium matrix is generally referred to as Ostwald ripening. The coarsening behavior of the γ′ phase is a typical diffusion-controlled growth process [20]. The rate-limiting process in Ostwald ripening, a diffusion-controlled coarsening mechanism, is the inter-particle diffusion of solute atoms.
The chemical potential gradient that drives this diffusion arises due to capillarity effects, which result in a lower chemical potential of solute atoms in larger particles. The precipitation of new phases from an oversaturated solid solution involves three steps: (a) stage 1, nucleation of the new phase; (b) stage 2, growth of the nuclei using matrix elements until the matrix reaches its equilibrium solute concentration; and (c) stage 3, coarsening of the precipitates through the Ostwald ripening process or competitive growth. Generally, the distribution of immobile particles in a solid matrix tends to reduce its interfacial free energy by transferring material from smaller to larger members of the distribution, thereby decreasing the total number of particles while increasing the average particle size. In other words, during stage 3, the surface energy of the precipitates is reduced through coarsening; smaller particles dissolve, and larger particles grow at the expense of the smaller ones.
From a thermodynamic perspective, the system spontaneously reduces its free energy to achieve a minimum, including interfacial energy and elastic energy, to stabilize the system. This is manifested in the nucleation and growth of new phases. As the γ′ phase grows, the overall interfacial energy decreases, leading to a more stable microstructure. With the extension of the aging time, the γ′ phase gradually coarsens. The growth of the γ′ phase can be explained by the LSW theory [26]. The changes in the morphologies of γ′ precipitates are attributed to the minimization of the total free energy of the system. To meet the requirements of the minimum energy configuration, γ′ precipitates consume smaller precipitates and coarsen during long-term holding to reduce the amount of interfacial free energy. Additionally, coarsened γ′ precipitates align along the direction of the lowest Young’s modulus to minimize the energy associated with lattice misfit strains [27]. This leads to anisotropy, increased lattice distortion, and a transition from coherent to semi-coherent and then to incoherent relationships between the γ′ phase and the matrix. The morphology changes from spherical to cubic, resulting in a decrease in the ductility and toughness of the alloy.
Figure 11 shows a transmission electron microscopy bright-field image, the selected-area electron diffraction (SAED), and an HRTEM of the γ′ phase after optimal heat treatment and 3000 h of holding at 750 °C. In the TEM bright-field image, a large number of spherical γ′ phases are observed to be uniformly dispersed in the γ matrix. Specifically, in the observation area shown in Figure 11a, spherical particles are overlapped in the thickness direction. The upper small sphere is fully visible, while the lower small sphere is partially visible. The SAED pattern is taken along the [011] incident axis, as shown in Figure 11b, clearly and accurately demonstrating the coherent orientation relationship between the γ′ phase and the γ matrix on the {100} and {110} atomic planes. The precipitation of the L12 ordered structure of the γ′ phase alters the extinction rules of the face-centered cubic (FCC) matrix, resulting in the appearance of superlattice diffraction spots at the FCC structure diffraction positions.
Figure 11c shows an HRTEM image of the interface between a single γ′ phase and the γ matrix. At low magnification, the precipitate phase region exhibits weaker diffraction contrast. The segregation of solute atoms in the γ′ phase region forms an ordered lattice structure, increasing the scattering of the transmitted electron beam. Therefore, the γ′ phase region appears with weaker diffraction contrast. FFT transformations of the regions on either side of the phase interface are shown in Figure 11d,e. In the FFT diffraction pattern of the γ′ phase region, a distinct pair of diffraction spots from the precipitate phase appears at the diffraction position, confirming that this region is the γ′ phase rather than the γ matrix.
Table 3 presents the yield strength and tensile strength of the Ni30 alloy as a function of the holding time. It is observed that the trends in the yield strength and tensile strength are similar and generally consistent with the changes in hardness. After 100 h of aging, the average tensile strength and yield strength of the aged samples increased from 1130 MPa and 763 MPa (for the unaged condition) to 1270 MPa and 820 MPa, respectively, resulting in a lower yield-to-tensile strength ratio. Conversely, the elongation and reduction of the area of the alloy gradually decrease with the extension of the holding time.
The reasons for these changes include the variation in the size of the γ′ phase and the precipitation of secondary carbides. The geometric shapes and arrangements of carbides at the grain boundaries change, appropriately restricting the movement of dislocations at the grain boundaries, thereby enhancing the strength of the alloy. As the γ′ phase particles coarsen, the interaction mechanism between moving dislocations and the γ′ phase in the microstructure transitions from the shearing mechanism to the Orowan bypass mechanism [24]. The decrease in hardness in the later stages did not lead to a significant reduction in the strength and ductility of the alloy, but the post-fracture elongation showed a noticeable decrease. This is preliminarily attributed to the formation of brittle phases during the long-term aging of the Ni30 alloy.
Figure 12 shows the fracture morphologies of the Ni30 alloy after long-term holding at 750 °C for different durations. The fracture surfaces are predominantly characterized by dimples, indicating a ductile fracture mode. Under low magnification, tear ridges and fracture facets are evident, along with numerous very fine pits. Upon closer inspection at higher magnification, these fine pits are identified as dimples of uniform size. The formation of dimples is primarily due to the nucleation, coalescence, and growth of microvoids, which eventually interconnect. Microvoids form at the interfaces between dislocations and second-phase particles in the matrix due to the separation of the interface. As these microvoids grow, they form voids, and dislocation pile-ups at the second-phase particles result in the formation of small particles at the bottom of the dimples [28]. The detachment of second-phase particles from the austenite matrix leads to the formation of microvoids. The number, size, and spacing of the second-phase particles have a direct influence on the formation of dimples [29].

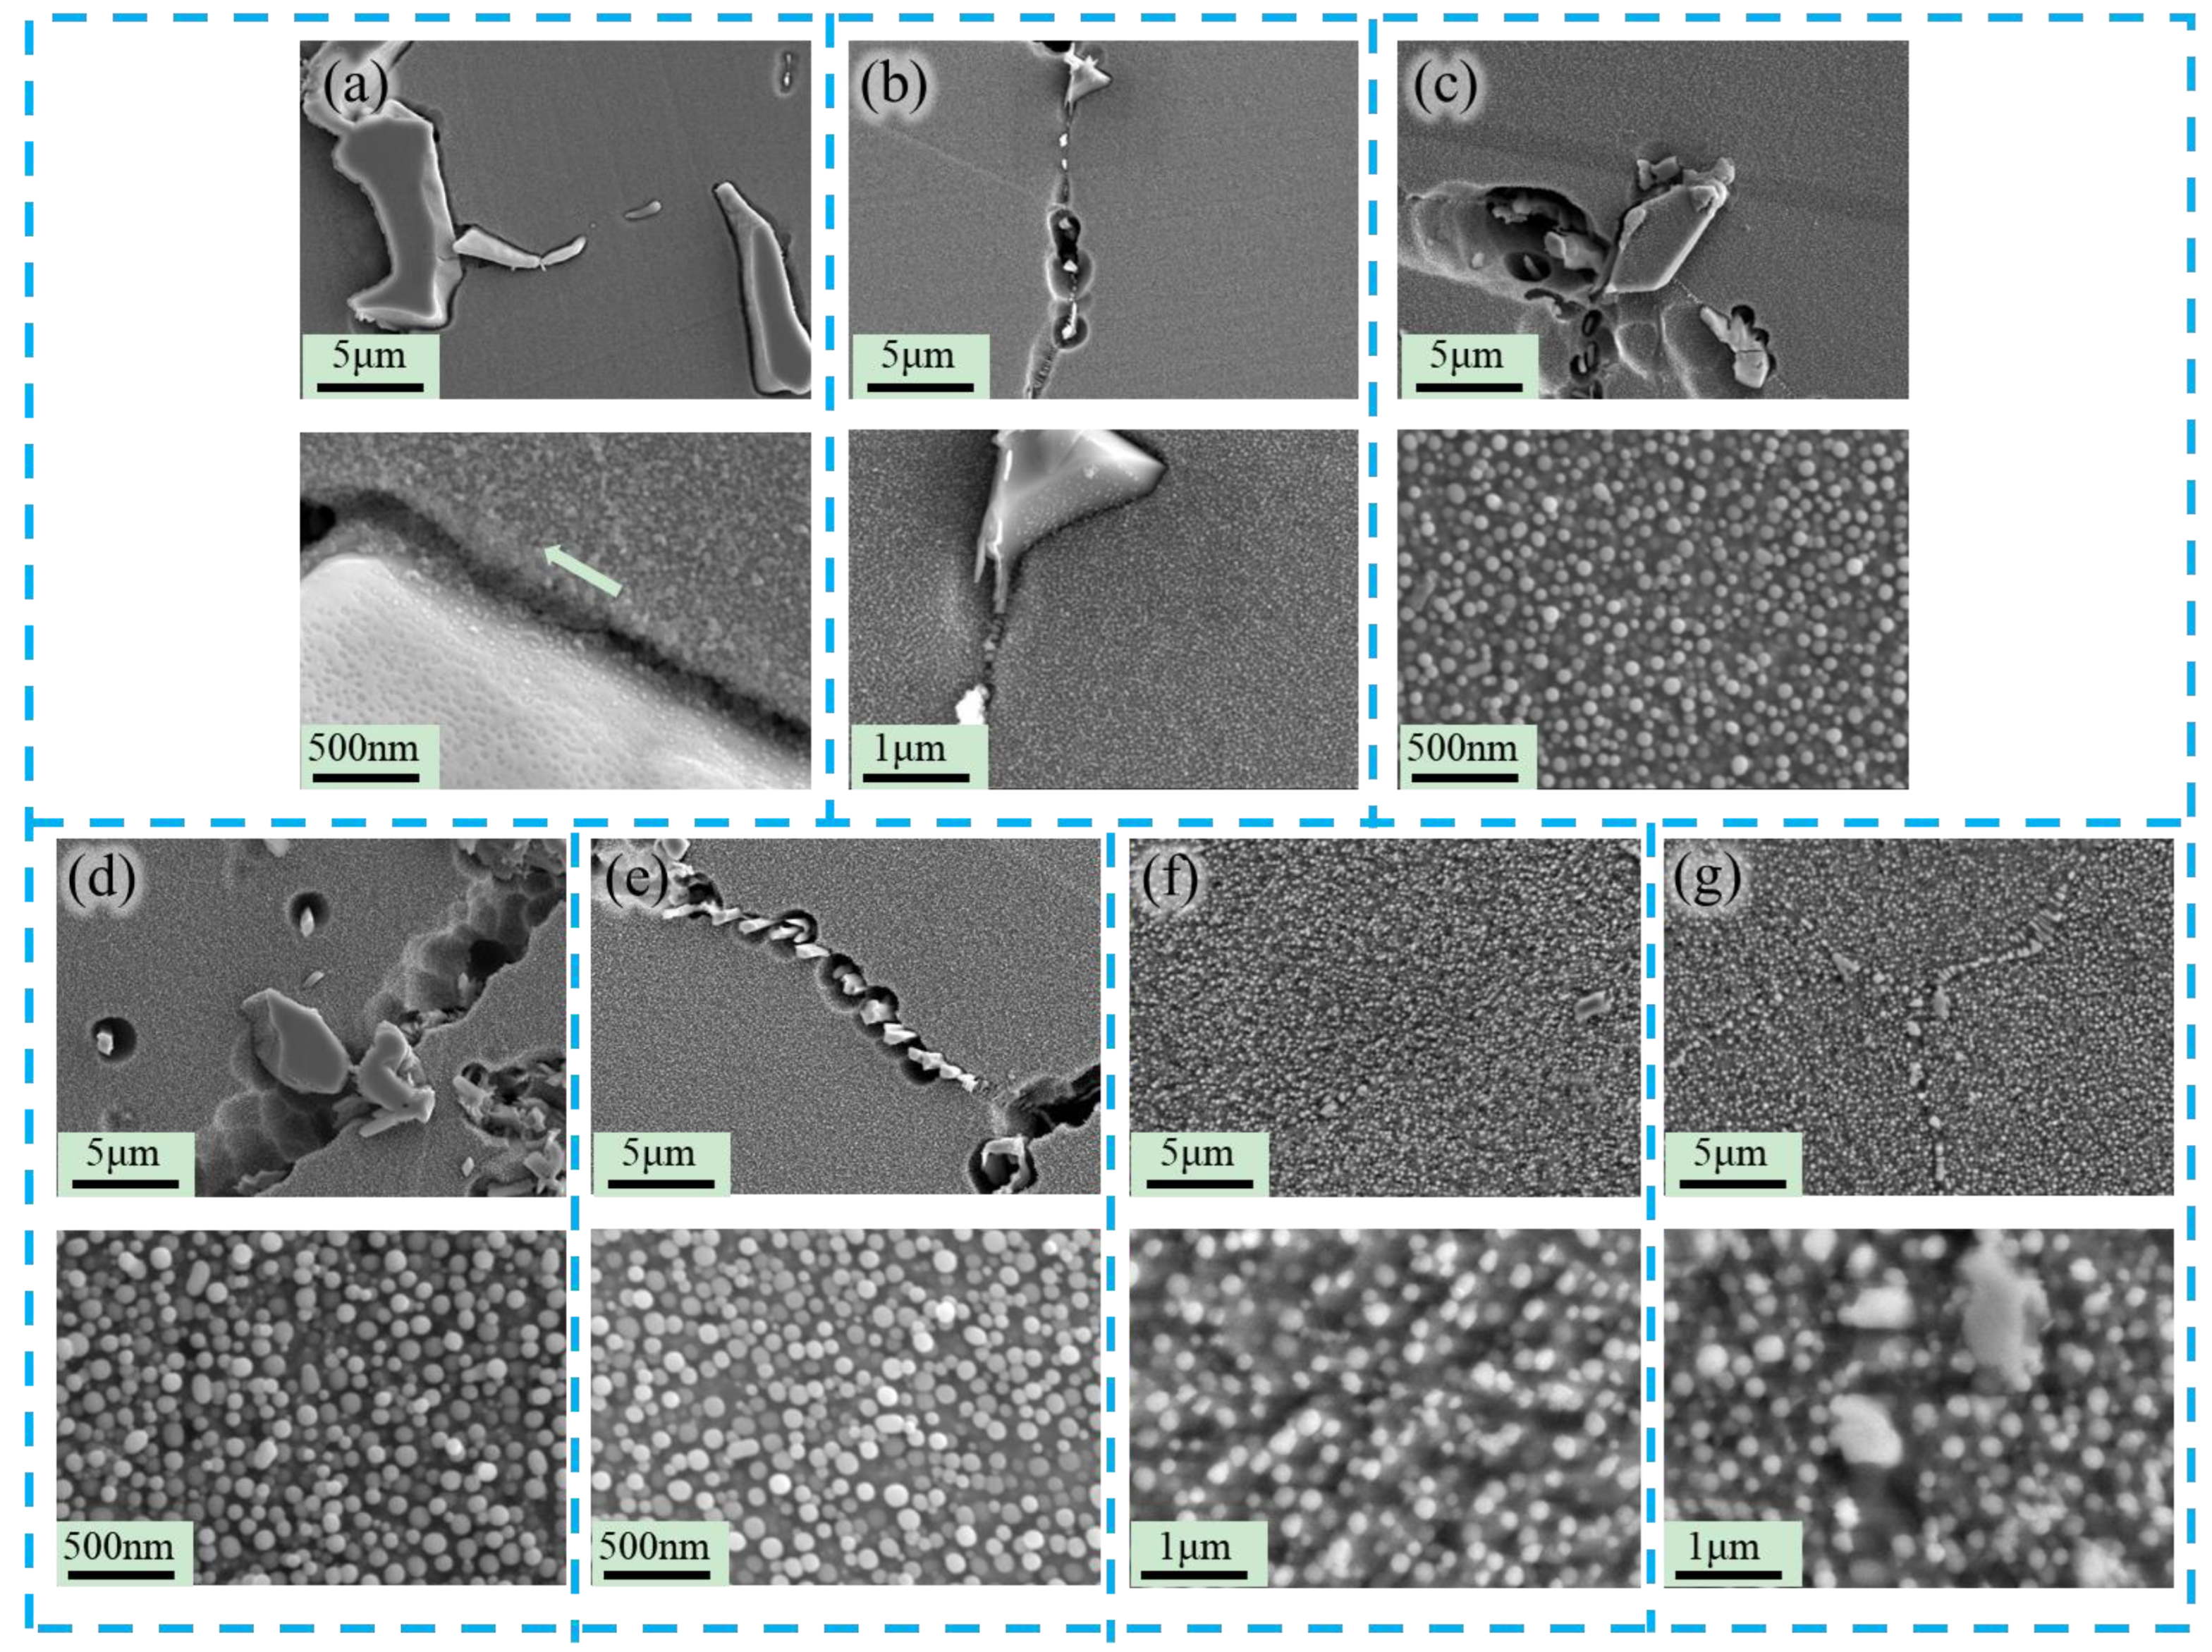
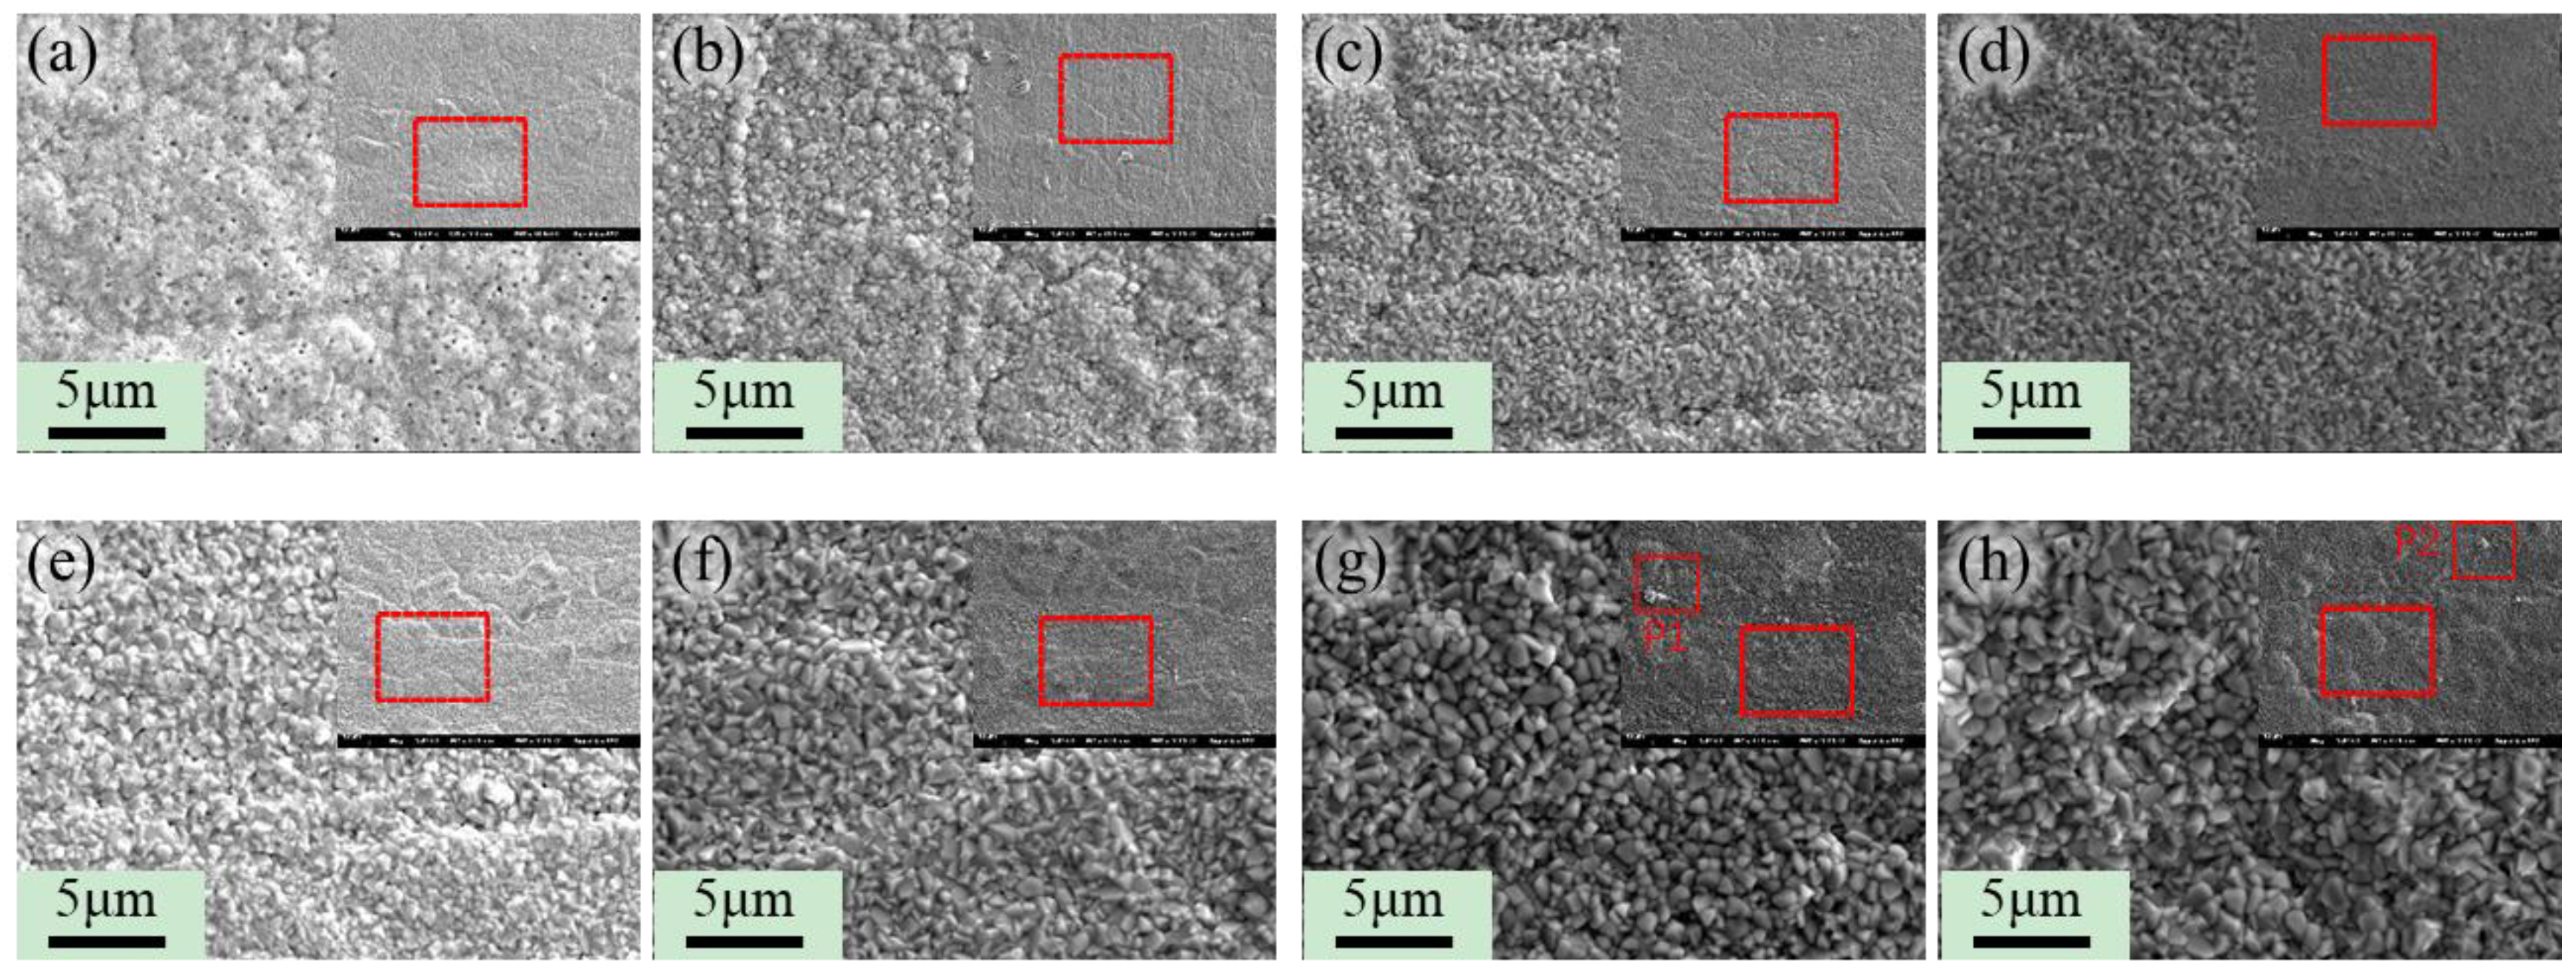
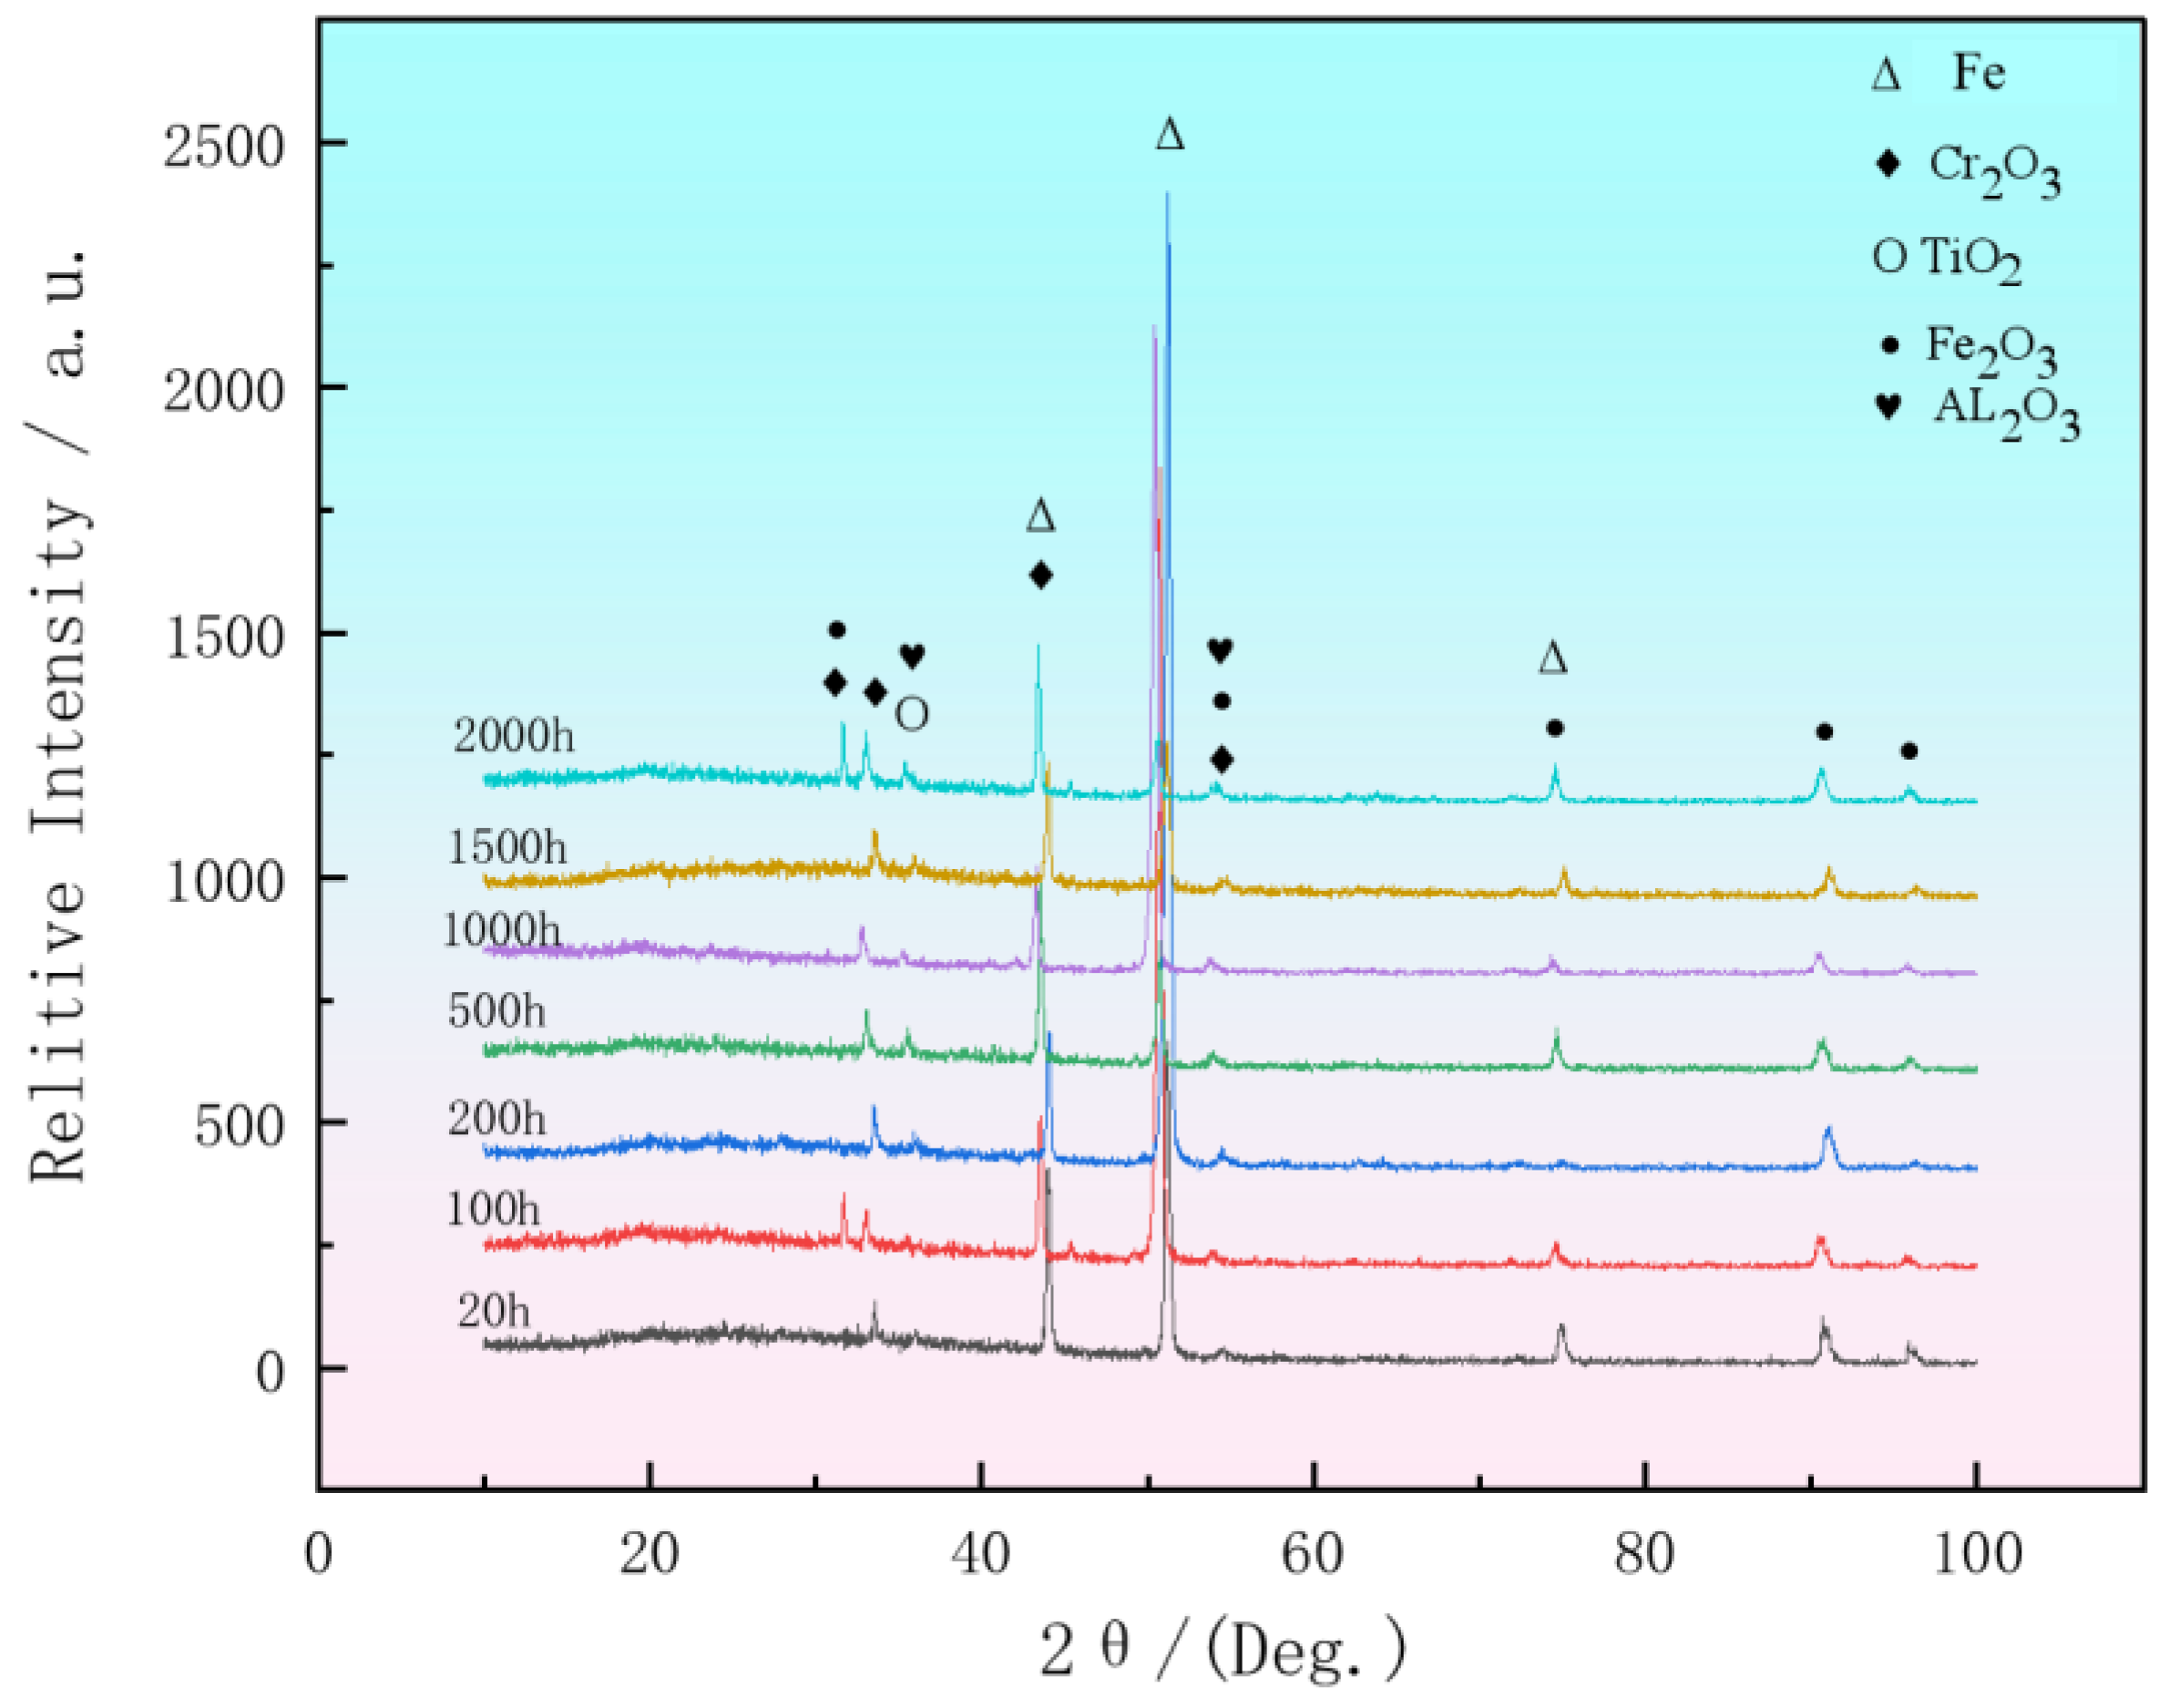
3.3. Research on Oxidation During Ultra-Long Term Aging Heat-Treatment Process

Figure 13a shows the oxidation weight gain and specific volume weight gain of the alloy during holding at 750 °C. For the Ni30 alloy, during the first 1000 h of holding at 750 °C, the oxidation weight gain increases continuously with the extension of the oxidation time. The initial oxidation period exhibits a significant increase in weight gain, while in the later stages, the rate of oxidation weight gain gradually levels off. Within the first 500 h of oxidation, before the oxygen concentration in the lattice reaches saturation, the rate of weight gain is relatively rapid. This period is considered the formation or incubation stage of the oxide film, where the alloy surface comes into contact with oxygen molecules and the controlling factor is the chemical reaction between them. Once the oxygen concentration in the lattice reaches saturation, the area covered by the oxide film on the alloy surface increases, forming a layered structure of oxygen/oxide film/substrate. This structure partially hinders the further reaction between oxygen molecules and the alloy interface, and the controlling factor becomes the oxidation rate at the two interfaces, leading to a reduction in the oxidation rate. The data on the oxidation weight gain of the alloy during the entire oxidation duration in high-temperature oxidation tests can be fitted using the following equation to describe the oxidation kinetics:
W = A × t n
In the equation, ΔW represents the oxidation weight gain per unit area of the alloy, A is the fitting constant, t is the oxidation time in seconds, and n is the oxidation exponent. Using the above fitting equation, the oxidation weight gain curve for the Ni30 alloy at 750 °C was obtained. The fitting results are shown in Figure 13b. The Ni30 high-temperature alloy exhibits rapid quasi-parabolic oxidation kinetics (n = 0.1996) at 750° C. The oxidation weight gain of the alloy increases non-linearly with the extension of the oxidation time under the test conditions, as shown in Figure 13b. Mathematically, the oxidation weight gain of the Ni30 high-temperature alloy at 750 °C can be described as varying with the oxidation time to the power of 0.1996. Therefore, relative stability of the oxidation weight gain with respect to the oxidation time is observed in this alloy.
Figure 14 illustrates the morphological changes on the surface of the oxide layer formed during the holding process at 750 °C. As the oxidation time extends, the oxide particles generated by the Ni30 alloy at 750 °C gradually grow. In the early stages of oxidation, the agglomerated oxides form discrete distributions, leading to non-uniform oxidation and the appearance of numerous loosely packed micro-pores on the surface. Consequently, the oxide layer fails to coalesce into a dense layer during the initial oxidation period, which does not effectively prevent ion diffusion, resulting in a higher oxidation rate. As the oxidation time progresses, the oxide film becomes more compact. Before 500 h of oxidation, the dispersed cavities gradually decrease in number and size. After 500 h of oxidation, the surface micro-pores largely disappear and, throughout the entire oxidation process, the oxide film progressively becomes more complete. The oxide particles also increase in size, with there being no signs of particle detachment from the sample’s surroundings, indicating strong adhesion between the oxide and the substrate. There are no obvious cracks or other defects, and the density of the oxide layer continues to improve, significantly reducing the oxidation rate.
Figure 14d,e show the surface morphology of the alloy after 1500 h and 2000 h of oxidation, respectively. It can be seen that surface oxides preferentially form at grain boundaries, where Cr carbides are present and the relative content of Cr is significantly higher than in the matrix. Under identical oxidation conditions, more Cr oxides form in the grain boundary regions. Even after extending the holding time to 2000 h, the outlines of the grain boundaries remain clearly discernible, suggesting that, throughout the oxidation holding process, the outer oxide layer remains stable without significant thickening, effectively hindering further reactions between alloy elements and oxygen, and thus protecting the alloy matrix.
Figure 15 presents the EDS analysis results for the surface oxidation products. The grown oxide particles are tightly bonded with each other, showing no apparent defects. The oxides are primarily composed of Fe, Ti, and Cr oxides. The XRD patterns shown in Figure 16, analyzed using Jade6 software for phase identification, indicate that the outermost oxide layer consists of TiO2 and Fe2O3, while the inner layer mainly comprises Cr2O3 and Al2O3 oxides. The relative content of these oxides increases slowly with the extension of the holding time. In the XRD pattern of the sample tested at 750 °C for 2000 h, diffraction peaks of the substrate can still be detected, suggesting that the thickness of the oxide layer is very thin. Figure 16 also displays the XRD patterns of the Ni30 alloy subjected to oxidation at 750 °C for different durations. The XRD spectra of the Ni30 alloy, after oxidation at 750 °C for various time periods, predominantly feature diffraction peaks corresponding to Cr2O3, Fe2O3, Al2O3, and TiO2, with no detection of NiO diffraction peaks. This indicates that a significant amount of Cr2O3 is produced during the oxidation process. Furthermore, the diffraction intensity of Cr2O3 increases relatively with the prolongation of the thermal exposure time, implying a higher content of Cr2O3.
To further investigate the elemental distribution in the cross-section of the oxidation products, EDS tests were conducted on samples oxidized at 750 °C for different durations. As shown in Figure 17, the cross-sections of the oxidation products at 750 °C consist of two main layers: the outer oxide layer and the inner oxide layer. The Ni30 alloy contains approximately 15% Cr. During the initial stages of oxidation, Cr can undergo selective oxidation to form a protective Cr2O3 oxide film [30,31]. The Ni30 alloy also contains significant amounts of Fe and Ni, which can diffuse outward to form NiO and Fe2O3. Therefore, the outer oxide layer is a complex oxide layer rich in Fe, Ni, and Cr, consisting of Fe2O3 and mixed oxides such as Cr2O3·Fe2O3. The inner layer is a dense Cr2O3 layer. As the oxidation time extends, some oxides react with each other at high temperatures to form spinel phases rich in Ni, Cr, and Fe.
The Ni30 alloy also contains small amounts of easily oxidizable elements such as Nb and Mo. Research has shown that Nb oxidizes quickly and readily, forming Nb2O5 in the outermost layer. Mo can also form volatile oxides such as MoO3 at high temperatures. These changes in the oxidation products can disrupt the density of the outermost and innermost oxide layers. As the oxidation time increases, the diffusion of elements controls the oxidation process, leading to a gradual weakening of the densities of the outer and innermost layers. This results in the formation of increasingly porous layers which promote the deeper penetration of external O elements and weaken the alloy’s oxidation resistance.
In the later stages of oxidation stability, a continuously dense outer oxide layer thickens over the alloy surface, effectively preventing direct contact between oxygen and the substrate. The oxidation process is then controlled by the diffusion of ions within the oxide layer, which slows down the oxidation rate of the alloy. However, as the oxide layer thickens, the internal stress also increases, leading to the formation of cracks in the oxide layer [31]. Oxygen can then rapidly penetrate along these micro-cracks, reacting with Cr and Al in the substrate to form internal oxides such as Cr2O3 and Al2O3, which interconnect through interfaces to form island-like oxides [32,33]. However, due to the relatively low content of Al in the Ni30 alloy, Cr elements mainly diffuse through the grain boundaries or phase boundaries to react with O, forming internal oxides. This leads to insufficient Cr content for outward diffusion to form the outer oxide layer, resulting in compositional inhomogeneity. Meanwhile, Nb elements in the substrate continuously diffuse outward to replenish, forming an enriched Nb layer beneath the Cr2O3 layer [34].
It is particularly noteworthy that a continuous enriched Nb layer forms beneath the Cr2O3 layer. This can be explained by the fact that the oxygen partial pressure beneath the continuous and dense Cr2O3 film is too low to react with Nb to form oxides. In contrast, the oxygen partial pressure required for Al oxidation is extremely low, and Al has a strong affinity for O, thus forming Al2O3 internal oxides. The continuous enriched Nb layer can reduce the diffusion of other alloy elements while tightly bonding with both the substrate and the outer Cr2O3 layer, enhancing the adhesion of the outer oxide layer and improving the alloy’s oxidation resistance.
The Ni30 alloy contains Nb elements, which preferentially react with O. Research has indicated that Nb reduces the diffusion rates of other elements within the oxide layer during oxidation, while promoting the formation of the Cr2O3 oxide film. The continuous accumulation of Nb elements beneath the Cr2O3 layer can enhance the adhesion between the oxide film and the substrate, thereby improving the alloy’s oxidation resistance. However, no distinct enriched Nb layer was observed in the oxide layer. As shown in Figure 17 and the EDS results in Table 4, the quantitatively measured mass percentage of Nb oxides is only 0.2%. This situation is preliminarily attributed to the limitations of the diffusion mechanism.

4. Conclusions

This study investigated the microstructure and properties of Ni30 alloy under different heat-treatment conditions and explored the effects of microstructure changes on its properties. The oxidation behavior of Ni30 alloy under actual working conditions was simulated through ultra-long-term annealing tests, and the mechanism by which the alloy maintains certain mechanical properties under long-term high-temperature insulation was studied. The anti-oxidation mechanism of the alloy was determined through oxidation tests. The specific conclusions are as follows:
The original forged state of the Ni30 alloy consists of a single austenitic phase, with a large number of irregularly shaped primary blocky undissolved phases present within its grains and near its grain boundaries. Energy-dispersive spectroscopy results indicate that these phases are Ti-rich carbides, primarily TiC. After aging, the strengthening phase γ′ gradually precipitates and coarsens, and granular secondary phases precipitate and distribute dispersively within the grains and at the grain boundaries, enhancing the second-phase strengthening effect. The strengthening effect initially increases and then decreases with increases in the aging temperature and time. The highest strength value observed after aging treatment is 1252.47 MPa, with a yield strength of 780.64 MPa. The ductility gradually decreases, and the hardness increases by 20.96%, reaching 353 HV.
As the aging time of the Ni30 alloy is extended, the grain size initially increases significantly. After 100 h, the grain size stabilizes, with a relatively uniform area-coarsening distribution, indicating good high-temperature stability of the alloy. After 200 h of holding, the coarsening of the γ′ strengthening phase particles becomes more pronounced. The area ratio of the strengthening phase reaches 35.18% at 1500 h, more than 10 times the initial 3.56%. After 1500 h, the area ratio of the γ′ phase to the matrix stabilizes. Compared to the unaged state, the tensile strength and yield strength of the alloy reach their maximum values of 1270 MPa and 820 MPa, respectively, at 100 h of aging. At 4000 h, the alloy still retains a relatively ideal strength, although its toughness decreases. Throughout the aging process, the primary mode of tensile fracture is ductile fracture.
At 750 °C, the oxidation rate of the Ni30 alloy remains at 0.1 g·m−2·h−1 over the entire oxidation time range, indicating complete oxidation resistance. The outer oxide film of the Ni30 alloy is a double-layer structure, with the outermost layer being a complex oxide layer rich in Fe, Ni, and Cr, comprising Cr2O3, TiO2, Fe2O3, and Cr2O3·Fe2O3. The sub-surface layer is a dense Cr2O3 layer, and the inner layer consists of dense Al2O3 and a small amount of dense Nb-containing oxides. As the oxidation time extends, the diffusion of Ti ions in the Cr2O3 layer leads to an increase in the amount of angular blocky TiO2 in the outer oxide layer, disrupting the continuity of the outermost oxide film. As a result, after long-term high-temperature treatment, only a few alloy oxidation samples exhibit surface porosity and oxide product spalling.

Author Contributions

Conceptualization, Y.T. and Z.Z.; methodology, Y.T.; software, Y.T. and Z.Z.; validation, Y.T., X.X., Z.Z. and L.Z.; formal analysis, Y.T.; investigation, Y.T. and L.Z.; resources, X.X. and Z.Z.; data curation, Y.T. and L.Z.; writing—original draft preparation, Y.T.; writing—review and editing, Y.T., X.X., Z.Z. and L.Z.; visualization, Y.T.; supervision, X.X. and Z.Z.; project administration, Z.Z. and L.Z.; funding acquisition, Z.Z. and L.Z. All authors have read and agreed to the published version of the manuscript.

Funding

The study was supported by Science and Technology Program of Jiangsu Province (nos. BE2015144), Jiangsu Shenyuan Group Co., Ltd.

Data Availability Statement

The original contributions presented in the study are included in the article, further inquiries can be directed to the corresponding authors.

Conflicts of Interest

Author Yuguo Tu was employed by Jiangsu Shanyuan Group Co., Ltd. The remaining authors declare that the research was conducted in the absence of any commercial or financial relationships that could be construed as a potential conflict of interest. Besides, the authors declare that this study received funding from Jiangsu Shenyuan Group Co., Ltd. The funder was not involved in the study design, collection, analysis, interpretation of data, the writing of this article or the decision to submit it for publication.

References

  1. Starr, F. Design and Development of Exhaust Valves for Internal Combustion engines from the Perspective of Modern Thinking: Part 2 1930–90. Int. J. Hist. Eng. Technol. 2014, 84, 1–29. [Google Scholar] [CrossRef]
  2. Ezugwu, E.O.; Wang, Z.M.; Machado, A.R. The machinability of nickel-based alloys: A review. J. Mater. Process. Technol. 1999, 86, 1–16. [Google Scholar] [CrossRef]
  3. Akca, E.; Gursel, A. A Review on Superalloys and IN718 Nickel-Based INCONEL Superalloy. Period. Eng. Nat. Sci. 2015, 3, 15–27. [Google Scholar] [CrossRef]
  4. Kumar, P.; Gupta, M.; Kumar, V. Parametric Optimization of WEDM Characteristics on Inconel 825 using Desirability Research. Int. J. Recent Technol. Eng. 2019, 8, 2277–3878. [Google Scholar] [CrossRef]
  5. Polzer, A.; Mouralova, K.; Benes, L.; Zahradnicek, R.; Fries, J. Comparison of machinability of nickel alloys using WEDM. Proc. Inst. Mech. Eng. Part B J. Eng. Manuf. 2022, 236, 1268–1281. [Google Scholar] [CrossRef]
  6. Ma, K.; Blackburn, T.; Magnussen, J.P.; Kerbstadt, M.; Ferreirós, P.A.; Pinomaa, T.; Hofer, C.; Hopkinson, D.G.; Day, S.J.; Bagot, P.A.; et al. Chromium-based bcc-superalloys strengthened by iron supplements. Acta Mater. 2023, 257, 119183. [Google Scholar] [CrossRef]
  7. Rathi, N.; Kumar, P.; Gupta, A. Non-conventional machining of nickel based superalloys: A review. Mater. Today Proc. 2023, in press. [Google Scholar] [CrossRef]
  8. Kamal, S.; Jayaganthan, R.; Prakash, S. Evaluation of cyclic hot corrosion behaviour of detonation gun sprayed Cr3C2–25%NiCr coatings on nickel- and iron-based superalloys. Surf. Coat. Technol. 2009, 203, 1004–1013. [Google Scholar] [CrossRef]
  9. Jiang, C.; Shen, X.; Song, W.; Shi, W.; Zhong, X.; Du, C.; Ma, H.; Li, X. High-temperature oxidation behavior of GH4169 and Inconel617 nickel-based superalloys in SOFC environment. Int. J. Hydrogen Energy 2024, 91, 414–422. [Google Scholar] [CrossRef]
  10. Xiao, W.; Xu, Y.; Xiao, H.; Li, S.; Song, L. Investigation of the Nb element segregation for laser additive manufacturing of nickel-based superalloys. Int. J. Heat Mass Transf. 2021, 180, 121800. [Google Scholar] [CrossRef]
  11. Li, J.G.; Wang, N.; Liu, J.D.; Xu, W. Influence of rare earth elements (Y, La and Ce) on the mechanical properties and oxidation resistance of nickel-based superalloys: A critical review. J. Mater. Sci. Technol. 2024, 195, 9–21. [Google Scholar] [CrossRef]
  12. Hou, K.; Ou, M.; Xing, W.; Ma, G.; Hao, X.; Wang, M.; Ma, Y. The formation of η-Ni3Ti phase microstructure in a cast nickel-based superalloy with high Ti/Al ratio. J. Mater. Res. Technol. 2024, 29, 764–778. [Google Scholar] [CrossRef]
  13. Sinharoy, S.; Narasimhan, S.L. Oxidation behavior of two nickel-base superalloys used as elevated temperature valves in spark ignited engines and diesel exhaust recirculation (EGR) applications. Superalloys 2004, 2004, 623–626. [Google Scholar] [CrossRef]
  14. Mikkelsen, L.P. High Temperature Oxidation of Iron-Chromium Alloys; Risø National Laboratory: Roskilde, Denmark, 2003; Available online: https://api.semanticscholar.org/CorpusID:135939374 (accessed on 2 January 2025).
  15. GB/228.1-2021; Metallic Materials—Tensile Testing—Part 1: Method of Test at Room Temperature. China Iron and Steel Association: Beijing, China, 2021.
  16. Jaromír, D.; Eva, C.; Črtomir, D. Laves phase evolution in 10Cr-3W-3Co steel during thermal exposure and creep. Mater. Lett. 2023, 348, 134656. [Google Scholar] [CrossRef]
  17. Feng, Q.; Wu, Y.; Li, J.; Cai, Y.; Zhang, Y.; Liu, J.; Liu, T. Effects of intermediate temperature on the grain boundary and γ’ precipitates of nickel-based powder superalloy under interrupted cooling. J. Alloys Compd. 2022, 922, 166310. [Google Scholar] [CrossRef]
  18. Tian, Q.; Zhang, W.; Du, J.; Lu, T.; Liu, Y.; Liu, X.; Li, H.; Wang, K. Growth and dissolution behavior and morphology evolution of γ′ precipitates in GH4742 nickel-based superalloy. J. Mater. Res. Technol. 2024, 32, 4198–4211. [Google Scholar] [CrossRef]
  19. Zhang, W.; Liu, X.; Zhu, M.; Guo, Y.; Qin, H.; Tian, Q. Precipitation characteristics of γ’ precipitates of the GH4742 nickel-based superalloy at a slow cooling rate. J. Alloys Compd. 2023, 941, 169013. [Google Scholar] [CrossRef]
  20. Wang, J.; Huang, H.; Xin, D.; Qu, J.; Zhang, H.; Ruan, J.; Zhou, X.; Zhang, S.; Jiang, L. The evolution behavior and mechanism of γ’ particles during hot deformation in a new P/M nickel-based superalloy. Mater. Charact. 2024, 217, 114359. [Google Scholar] [CrossRef]
  21. Humphreys, F.J.; Hatherly, M. Recrystallization and Related Annealing Phenomena; Elsevier Ltd.: Amsterdam, The Netherlands, 2004. [Google Scholar] [CrossRef]
  22. Collins, D.M.; Conduit, B.D.; Stone, H.J.; Hardy, M.C.; Conduit, G.J.; Mitchell, R.J. Grain growth behaviour during near y’ solvus thermal exposures in a polycrystalline nickel-base superalloy. Acta Mater. 2013, 61, 3378–3391. [Google Scholar] [CrossRef]
  23. Yuriy, S.; Frantisek, K. Microstructural aspects of grain growth kinetics in non-oriented electrical steels. Mater. Charact. 2005, 55, 1–11. [Google Scholar] [CrossRef]
  24. Wu, Y.; Zhao, H.; Li, J.; Zhang, Y.; Liu, J.; Liu, T. An innovative approach towards forming the serrated grain boundaries and refining the γ′ precipitates in nickel-based superalloys. J. Alloys Compd. 2022, 908, 164570. [Google Scholar] [CrossRef]
  25. Li, D.; Li, G.; Wei, X.; Ma, B.; Huang, C.; Chen, W.; Zhao, P.; Wang, L.; Zeng, Q. Long-term aging behavior and mechanism of CMSX-4 nickel-based single crystal superalloy at 950 °C and 1050 °C. J. Alloys Compd. 1004, 2024, 175763. [Google Scholar] [CrossRef]
  26. Hou, K.; Wang, M.; Ou, M.; Li, H.; Hao, X.; Ma, Y.; Liu, K. Effects of microstructure evolution on the deformation mechanisms and tensile properties of a new Ni-base superalloy during aging at 800 °C. J. Mater. Sci. Technol. 2021, 68, 40–52. [Google Scholar] [CrossRef]
  27. Li, T.; Wang, L. Precipitation behavior of γ′ precipitates in 21Cr-32Fe-41Ni heat-resistant alloy at different aging temperatures. J. Alloys Compd. 2023, 958, 170405. [Google Scholar] [CrossRef]
  28. Bayata, F.; Alpas, A.T. The high temperature wear mechanisms of iron-nickel steel (NCF 3015) and nickel based superalloy (inconel 751) engine valves. Wear 2021, 480, 203943. [Google Scholar] [CrossRef]
  29. Meng, W.; Lei, Y.; Wang, X.; Ma, Q.; Hu, L.; Xie, H.; Yin, X. Interface characteristics and mechanical properties of wire-arc depositing Inconel 625 superalloy on ductile cast iron. Surf. Coat. Technol. 2022, 440, 128493. [Google Scholar] [CrossRef]
  30. Sims, C.T.; Stoloff, N.S.; Hagel, W.C. Superalloys II: High-Temperature Materials for Aerospace and Industrial Power; Wiley: Hoboken, NJ, USA, 1987; ISBN 0471011479/9780471011477. [Google Scholar]
  31. Greene, G.A.; Finfrock, C.C. Oxidation of Inconel 718 in Air at High Temperatures. Oxid. Met. 2001, 55, 505–521. [Google Scholar] [CrossRef]
  32. Chen, J.H.; Rogers, P.M.; Little, J.A. Oxidation behavior of several chromia-forming commercial nickel-base superalloys. Oxid. Met. 1997, 47, 381–410. [Google Scholar] [CrossRef]
  33. Kumar, L.; Venkataramani, R.; Sundararaman, M.; Mukhopadhyay, P.; Garg, S.P. Studies on the oxidation behavior of Inconel 625 between 873 and 1523 K. Oxid. Met. 1996, 45, 221–244. [Google Scholar] [CrossRef]
  34. Han, Y.J.; Ye, F.X.; Lu, G.X.; Liu, C.; Hao, L.J. Residual stress evolution of thermally grown oxide in thermal barrier coatings deposited onto nickel-base superalloy and iron-base alloy with thermal exposure ageing. J. Alloys Compd. 2014, 584, 19–27. [Google Scholar] [CrossRef]
Figure 1. Drawing of tensile specimen dimensions.
Metals 15 00061 g001
Figure 2. Oxidation sample.
Metals 15 00061 g002
Figure 3. Metallographic structures of the Ni30 alloy in the forged state (a) and after solution treatment at different temperatures: (b) 950 °C, (c) 1000 °C, (d) 1050 °C, (e) 1100 °C, (f) 1150 °C.
Metals 15 00061 g003
Figure 4. Microstructures and grain size distributions of the Ni30 alloy after aging at different temperatures for 6 h: (a) 700 °C, (b) 750 °C, (c) 800 °C, (d) 850 °C.
Metals 15 00061 g004
Figure 5. Effect of aging time on the hardness of the Ni30 alloy at different aging temperatures.
Metals 15 00061 g005
Figure 6. Microstructures and grain size distributions of the Ni30 alloy at 750 °C after different holding times. (a) 1 h, (b) 2 h, (c) 4 h, (d) 6 h, (e) 12 h, (f) 24 h.
Metals 15 00061 g006
Figure 7. Effect of aging temperature on the mechanical properties of the Ni30 alloy: (a) strength variations, (b) ductility variations.
Metals 15 00061 g007
Figure 8. Fracture morphologies of the Ni30 alloy in the (a,b) forged state and in the (c,d) optimal heat-treated state.
Metals 15 00061 g008
Figure 9. Microstructures of the Ni30 alloy after long-term holding at 750 °C: (a) 0 h, (b) 100 h, (c) 200 h, (d) 500 h, (e) 1000 h, (f) 1500 h, (g) 2000 h, (h) 3000 h, (i) 4000 h.
Metals 15 00061 g009
Figure 10. Microstructures of the Ni30 alloy after ultra-long-term holding at 750 °C: (a) 40 h, (b) 200 h, (c) 1000 h, (d) 1500 h, (e) 2000 h, (f) 3000 h, (g) 4000 h.
Metals 15 00061 g010
Figure 11. TEM analysis of the Ni30 alloy after holding at 750 °C for 3000 h: (a) bright-field image and SAED, (b,c) high-resolution transmission electron microscopy images showing the interface bonding state of the γ′/γ phases, (d,e) the fast Fourier transform (FFT) images of the γ and γ′ phase regions, respectively, as indicated in (c).
Metals 15 00061 g011
Figure 12. Fracture morphologies of the Ni30 alloy after holding at 750 °C for different durations: (a) 100 h, (b) 500 h, (c) 2000 h, (d) 3000 h, (e) 4000 h.
Metals 15 00061 g012
Figure 13. (a) Weight gain per unit volume and (b) average oxidation rate curves of the Ni30 alloy during holding at 750 °C for different durations.
Metals 15 00061 g013
Figure 14. Morphological changes of the surface oxide layer of the Ni30 alloy during holding at 750 °C for different durations: (a) 20 h, (b) 40 h, (c) 100 h, (d) 200 h, (e) 500 h, (f) 1000 h, (g) 1500 h, (h) 2000 h.
Metals 15 00061 g014
Figure 15. EDS analysis of the surface structure of the Ni30 alloy after holding at 750 °C for (a) 1500 h and (b) 2000 h.
Metals 15 00061 g015
Figure 16. XRD results of the Ni30 alloy after different holding times.
Metals 15 00061 g016
Figure 17. Cross-sectional morphology of the oxide layer and line distribution of alloy elements for Ni30 alloy samples held at 750 °C for different durations: (a) 100 h, (b) 500 h, (c) 1000 h, (d) 1500 h, (e) 2000 h, (f) 3000 h, (g) 4000 h.
Metals 15 00061 g017
Table 1. Chemical composition of the NI30 superalloy (wt.%).
AlloyComposition
CSiMnPSCrNiAlCuTiMoNbBFe
Ni300.04–0.07≤0.20≤0.30≤0.014≤0.01014.20–15.0030.50–31.501.85–2.05≤0.12.55–2.750.65–0.800.65–0.800.002–0.004bal
Table 2. Mechanical properties of the Ni30 alloy before and after heat treatment.
Tensile Strength (MPa)Elongation (%)Yield Strength (MPa)Hardness (HV)
As-forged118332.9781292
Solution and aging treatment1252.4729.2780.64353.2
Table 3. Mechanical properties after long-term holding treatments.
Time/hTensile Strength (MPa)Elongation
(%)
Yield Strength (MPa)
0113029.2763
100127022.6820
200126019.2840
500124016.8823
1000123015.6821
1500121013.1819
2000120010.4790
30001135.312.9754.9
40001135.711.6723.8
Table 4. EDS analysis results of oxidation product cross-sections at different oxidation times at 750 °C.
Elements (wt%)
and Time (h)
10050010001500200030004000
C15.0914.4611.4213.2913.6317.1926.47
O4.679.47.0511.7514.196.4318.6
Al2.512.593.592.161.911.070.99
Ti2.211.932.022.21.92.131.51
Cr12.2812.6411.6211.2711.0811.7910.49
Fe37.8837.2238.7836.0435.5837.3627
Ni25.3621.425.0722.7521.3524.0414.93
Si~~0.31~0.37~~
Mn~0.360.140.53~~~
Disclaimer/Publisher’s Note: The statements, opinions and data contained in all publications are solely those of the individual author(s) and contributor(s) and not of MDPI and/or the editor(s). MDPI and/or the editor(s) disclaim responsibility for any injury to people or property resulting from any ideas, methods, instructions or products referred to in the content.

