
The Effect of Germanium Additions on the Mechanical Properties of Zn-Mg-Al Alloys

 , , , and
Abstract
1. Introduction
2. Materials and Methods
2.1. Materials
2.2. Methods
2.2.1. Microstructural Analysis
2.2.2. Vickers Hardness
2.2.3. Nano-Indentation
2.2.4. Small Punch Tensile Test
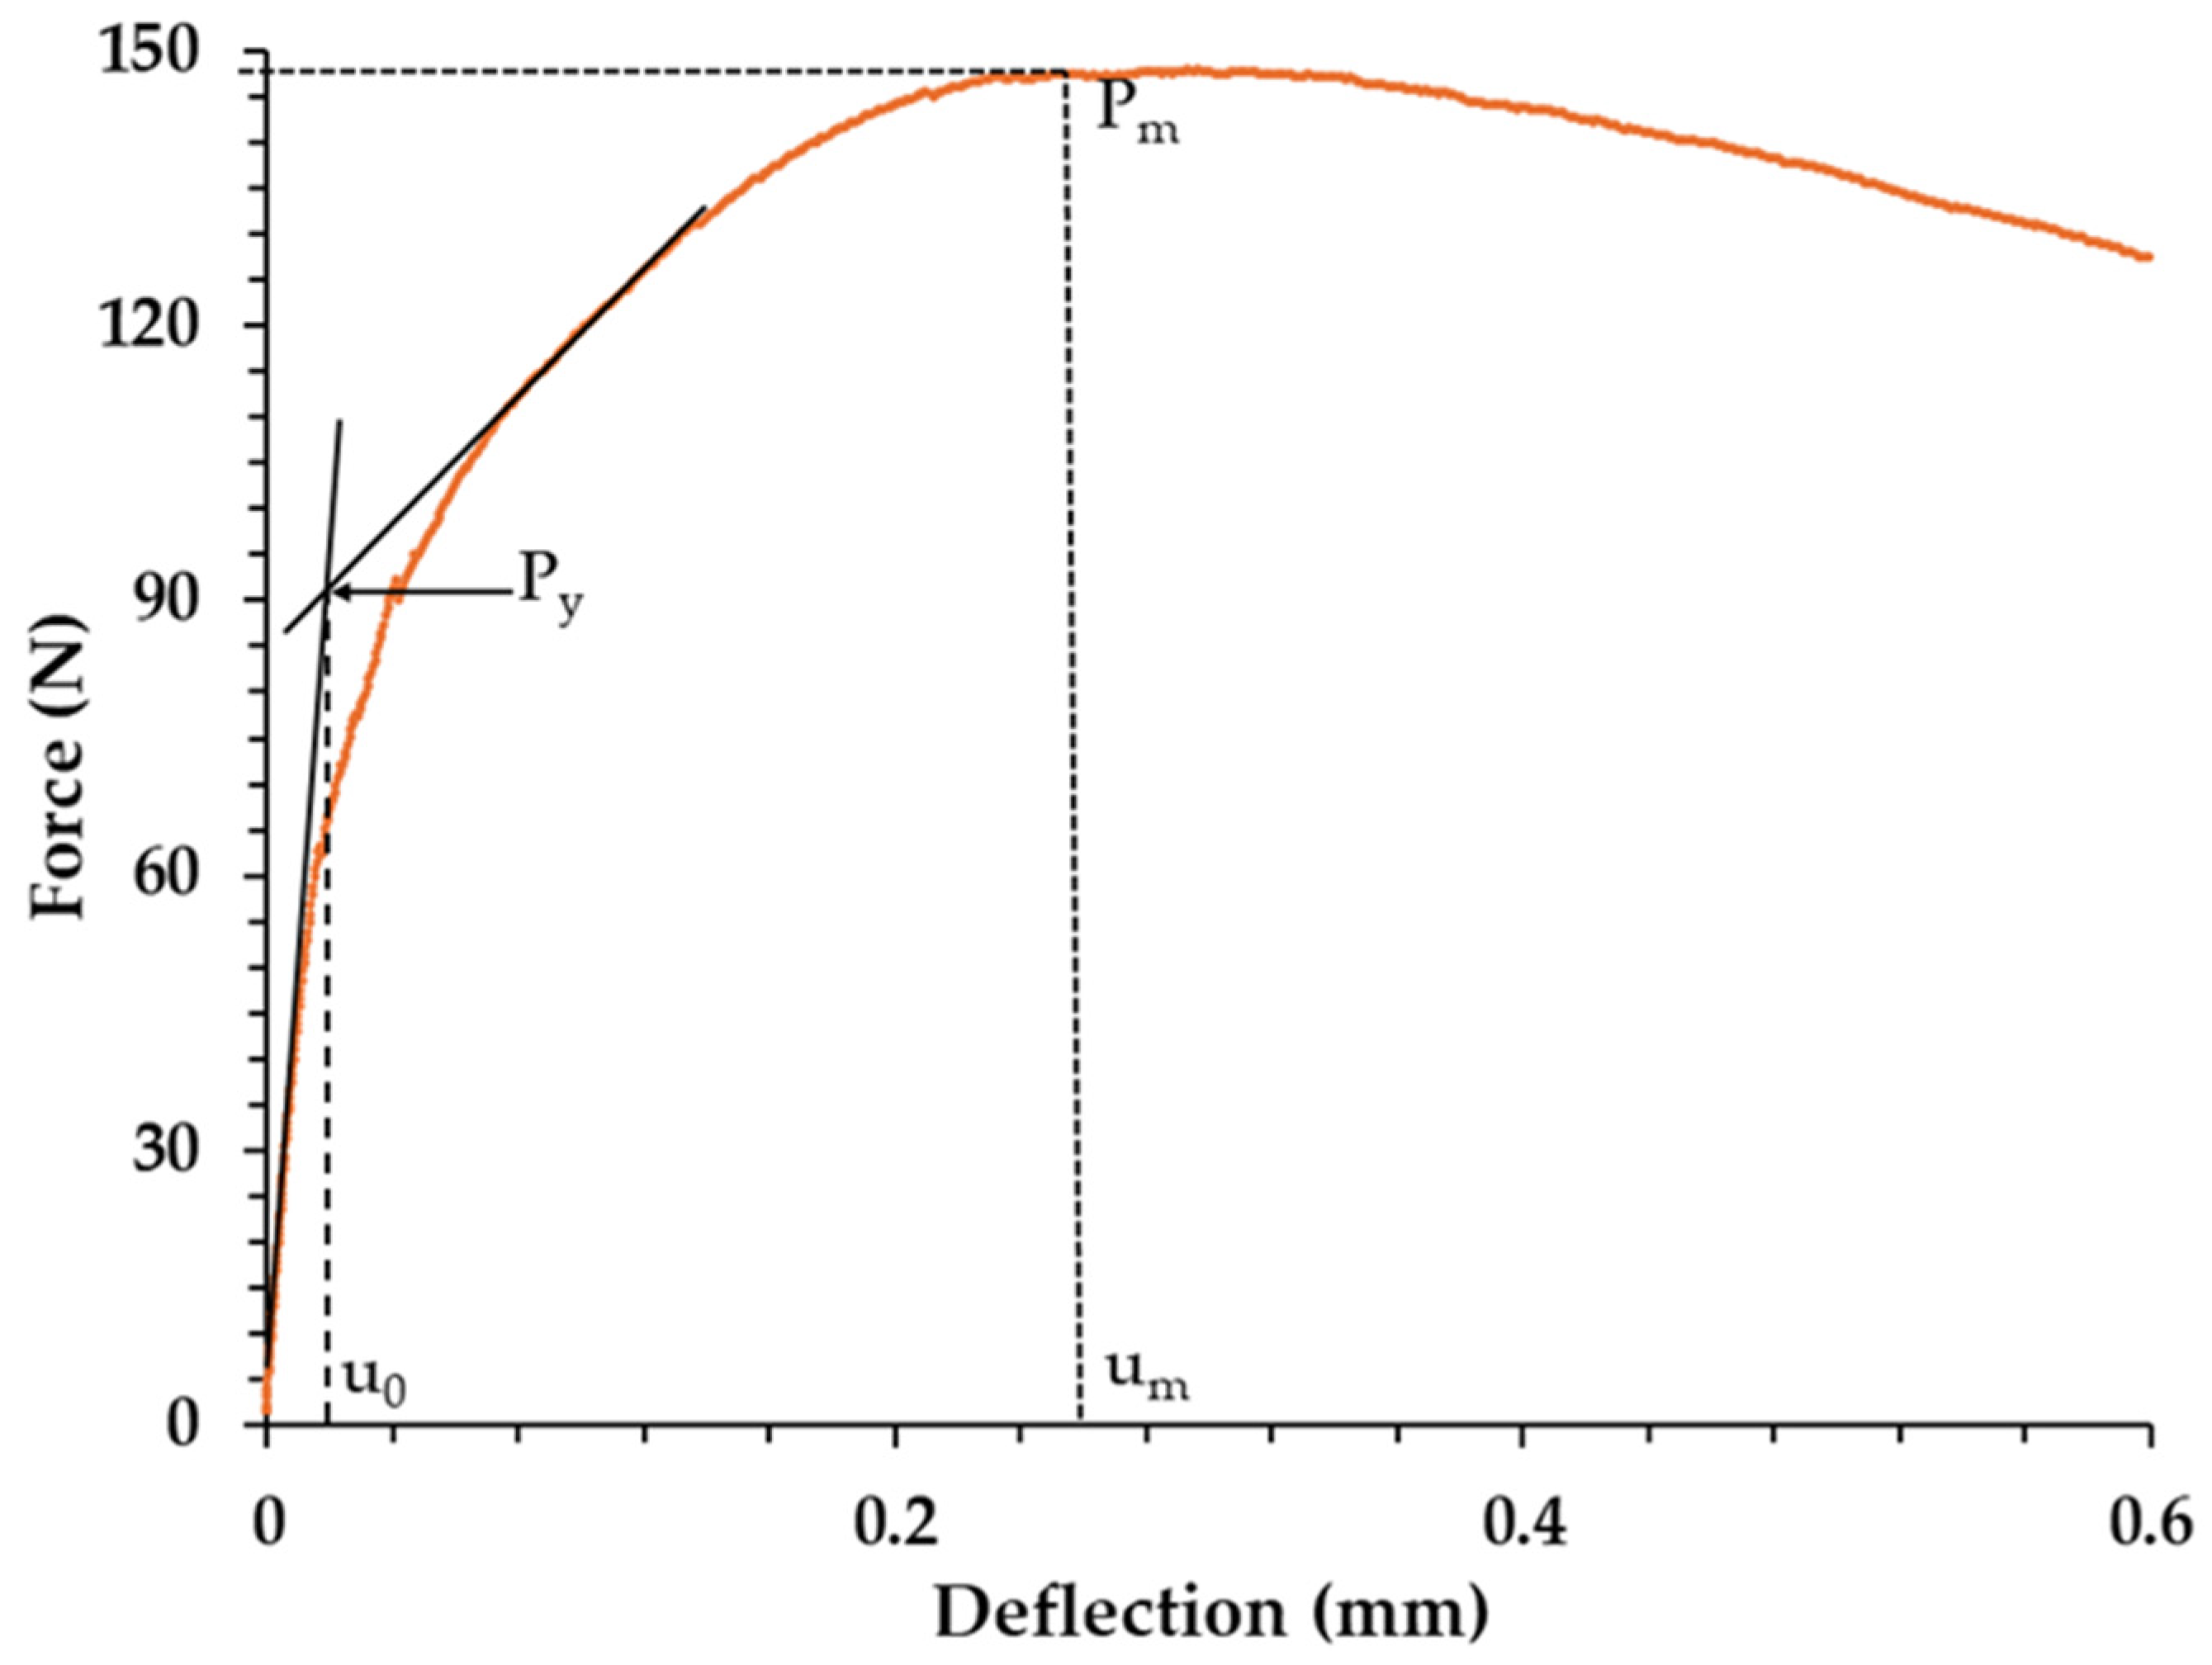
Determination of Elastic–Plastic Transition Point (Yield Point, Py)
3. Results
4. Discussion
5. Conclusions
Author Contributions
Funding
Institutional Review Board Statement
Informed Consent Statement
Data Availability Statement
Acknowledgments
Conflicts of Interest
References
- Pola, A.; Tocci, M.; Goodwin, F.E. Review of Microstructures and Properties of Zinc Alloys. Metals 2020, 10, 253. [Google Scholar] [CrossRef]
- Marder, A.R. The Metallurgy of Zinc-Coated Steel. Prog. Mater. Sci. 2000, 45, 191–271. [Google Scholar] [CrossRef]
- Su, Y.; Fu, J.; Du, S.; Georgas, E.; Qin, Y.-X.; Zheng, Y.; Wang, Y.; Zhu, D. Biodegradable Zn–Sr Alloys with Enhanced Mechanical and Biocompatibility for Biomedical Applications. Smart Mater. Med. 2022, 3, 117–127. [Google Scholar] [CrossRef]
- Shen, C.; Liu, X.; Fan, B.; Lan, P.; Zhou, F.; Li, X.; Wang, H.; Xiao, X.; Li, L.; Zhao, S.; et al. Mechanical Properties,: In Vitro Degradation Behavior, Hemocompatibility and Cytotoxicity Evaluation of Zn-1.2Mg Alloy for Biodegradable Implants. RSC Adv. 2016, 6, 86410–86419. [Google Scholar] [CrossRef]
- Gong, H.; Wang, K.; Strich, R.; Zhou, J.G. In Vitro Biodegradation Behavior, Mechanical Properties, and Cytotoxicity of Biodegradable Zn-Mg Alloy. J. Biomed. Mater. Res.—Part B Appl. Biomater. 2015, 103, 1632–1640. [Google Scholar] [CrossRef]
- Li, H.; Yang, H.; Zheng, Y.; Zhou, F.; Qiu, K.; Wang, X. Design and Characterizations of Novel Biodegradable Ternary Zn-Based Alloys with IIA Nutrient Alloying Elements Mg, Ca and Sr. Mater. Des. 2015, 83, 95–102. [Google Scholar] [CrossRef]
- Tong, X.; Zhang, D.; Zhang, X.; Su, Y.; Shi, Z.; Wang, K.; Lin, J.; Li, Y.; Lin, J.; Wen, C. Microstructure, Mechanical Properties, Biocompatibility, and in Vitro Corrosion and Degradation Behavior of a New Zn–5Ge Alloy for Biodegradable Implant Materials. Acta Biomater. 2018, 82, 197–204. [Google Scholar] [CrossRef]
- Zhao, S.; Seitz, J.M.; Eifler, R.; Maier, H.J.; Guillory, R.J.; Earley, E.J.; Drelich, A.; Goldman, J.; Drelich, J.W. Zn-Li Alloy after Extrusion and Drawing: Structural, Mechanical Characterization, and Biodegradation in Abdominal Aorta of Rat. Mater. Sci. Eng. C 2017, 76, 301–312. [Google Scholar] [CrossRef]
- Niu, J.; Tang, Z.; Huang, H.; Pei, J.; Zhang, H.; Yuan, G.; Ding, W. Research on a Zn-Cu Alloy as a Biodegradable Material for Potential Vascular Stents Application. Mater. Sci. Eng. C 2016, 69, 407–413. [Google Scholar] [CrossRef]
- Tong, X.; Shi, Z.; Xu, L.; Lin, J.; Zhang, D.; Wang, K.; Li, Y.; Wen, C. Degradation Behavior, Cytotoxicity, Hemolysis, and Antibacterial Properties of Electro-Deposited Zn–Cu Metal Foams as Potential Biodegradable Bone Implants. Acta Biomater. 2020, 102, 481–492. [Google Scholar] [CrossRef]
- Ahmadi, M.; Salgın, B.; Kooi, B.J.; Pei, Y. Cracking Behavior and Formability of Zn-Al-Mg Coatings: Understanding the Influence of Steel Substrates. Mater. Des. 2021, 212, 110215. [Google Scholar] [CrossRef]
- Najafabadi, E.P.; Heidarpour, A.; Raina, S. Hot-Dip Galvanizing of High and Ultra-High Strength Thin-Walled CHS Steel Tubes: Mechanical Performance and Coating Characteristics. Thin-Walled Struct. 2021, 164, 107744. [Google Scholar] [CrossRef]
- Ahmadi, M.; Salgın, B.; Kooi, B.J.; Pei, Y. The Effect of Grain Refinement on the Deformation and Cracking Resistance in Zn–Al–Mg Coatings. Mater. Sci. Eng. A 2022, 840, 142995. [Google Scholar] [CrossRef]
- Schuerz, S.; Fleischanderl, M.; Luckeneder, G.H.; Preis, K.; Haunschmied, T.; Mori, G.; Kneissl, A.C. Corrosion Behaviour of Zn–Al–Mg Coated Steel Sheet in Sodium Chloride-Containing Environment. Corros. Sci. 2009, 51, 2355–2363. [Google Scholar] [CrossRef]
- Prosek, T.; Larché, N.; Vlot, M.; Goodwin, F.; Thierry, D. Corrosion Performance of Zn–Al–Mg Coatings in Open and Confined Zones in Conditions Simulating Automotive Applications. Mater. Corros. 2010, 61, 412–420. [Google Scholar] [CrossRef]
- De Bruycker, E.; Zermout, Z.; De Cooman, B.C. Zn-Al-Mg Coatings: Thermodynamic Analysis and Microstructure Related Properties. In Materials Science Forum; Trans Tech Publications Ltd.: Wollerau, Switzerland, 2007. [Google Scholar]
- Persson, D.; Thierry, D.; LeBozec, N.; Prosek, T. In Situ Infrared Reflection Spectroscopy Studies of the Initial Atmospheric Corrosion of Zn-Al-Mg Coated Steel. Corros. Sci. 2013, 72, 54–63. [Google Scholar] [CrossRef]
- Xu, M.; Han, D.; Zheng, Z.; Ma, R.; Du, A.; Fan, Y.; Zhao, X.; Cao, X. Effects of Cooling Rate on the Microstructure and Properties of Hot-Dipped Zn–Al–Mg Coatings. Surf. Coat. Technol. 2022, 444, 128665. [Google Scholar] [CrossRef]
- Lee, J.-W.; Park, B.R.; Oh, S.-Y.; Yun, D.W.; Hwang, J.K.; Oh, M.-S.; Kim, S.J. Mechanistic Study on the Cut-Edge Corrosion Behaviors of Zn-Al-Mg Alloy Coated Steel Sheets in Chloride Containing Environments. Corros. Sci. 2019, 160, 108170. [Google Scholar] [CrossRef]
- Wint, N.; Eaves, D.; Williams, G.; McMurray, H.N. The Effect of Composition and Thickness on the Mechanism and Kinetics of Filiform Corrosion Occurring on Zinc-Aluminium-Magnesium Coated Steel. Corros. Sci. 2021, 179, 109168. [Google Scholar] [CrossRef]
- Prosek, T.; Hagström, J.; Persson, D.; Fuertes, N.; Lindberg, F.; Chocholatý, O.; Taxén, C.; Šerák, J.; Thierry, D. Effect of the Microstructure of Zn-Al and Zn-Al-Mg Model Alloys on Corrosion Stability. Corros. Sci. 2016, 110, 71–81. [Google Scholar] [CrossRef]
- Prosek, T.; Nazarov, A.; Bexell, U.; Thierry, D.; Serak, J. Corrosion Mechanism of Model Zinc-Magnesium Alloys in Atmospheric Conditions. Corros. Sci. 2008, 50, 2216–2231. [Google Scholar] [CrossRef]
- LeBozec, N.; Thierry, D.; Rohwerder, M.; Persson, D.; Luckeneder, G.; Luxem, L. Effect of Carbon Dioxide on the Atmospheric Corrosion of Zn-Mg-Al Coated Steel. Corros. Sci. 2013, 74, 379–386. [Google Scholar] [CrossRef]
- Hammam, R.E.; Abdel-Gawad, S.A.; Moussa, M.E.; Shoeib, M.; El-Hadad, S. Study of Microstructure and Corrosion Behavior of Cast Zn–Al–Mg Alloys. Int. J. Met. 2023, 17, 2794–2807. [Google Scholar] [CrossRef]
- Prosek, T.; Nazarov, A.; Goodwin, F.; Šerák, J.; Thierry, D. Improving Corrosion Stability of ZnAlMg by Alloying for Protection of Car Bodies. Surf. Coat. Technol. 2016, 306, 439–447. [Google Scholar] [CrossRef]
- Zhang, M.; Zhou, G.; Sun, H.; Teng, X.; Zhao, Z. Effects of Ti and Zr Elements Addition on the Microstructure and Corrosion Resistance of Zn-2.5Al-2Mg Alloy. Mater. Res. Express 2020, 7, 026525. [Google Scholar] [CrossRef]
- Gogola, P.; Gabalcová, Z.; Kusý, M.; Suchánek, H. The Effect of Sn Addition on Zn-Al-Mg Alloy; Part i: Microstructure and Phase Composition. Materials 2021, 14, 5404. [Google Scholar] [CrossRef] [PubMed]
- Liu, G.; Teng, H.; Xu, C.; Shang, T.; Jiang, G.; Liu, Z. Influence of Si Contents on the Microstructure and Corrosion Resistance of the Zn-Al-Mg-Si Alloys. Metall. Res. Technol. 2024, 121, 201. [Google Scholar] [CrossRef]
- Britton, D.A.; Penney, D.; Malla, A.D.; Mehraban, S.; Sullivan, J.; Goldsworthy, M.; McGettrick, J.; Johnston, R.; Mitchell, R.L.; Challinor, C. Effect of Antimony Additions on the Microstructure and Performance of Zn–Mg–Al Alloy Coatings. NPJ Mater. Degrad. 2024, 8, 62. [Google Scholar] [CrossRef]
- Wint, N.; Malla, A.D.; Cooze, N.; Savill, T.; Mehraban, S.; Dunlop, T.; Sullivan, J.H.; Penney, D.; Williams, G.; McMurray, H.N. The Ability of Mg2Ge Crystals to Behave as ‘Smart Release’ Inhibitors of the Aqueous Corrosion of Zn-Al-Mg Alloys. Corros. Sci. 2021, 179, 109091. [Google Scholar] [CrossRef]
- Malla, A.D.; Sullivan, J.H.; Penney, D.J.; Dunlop, T.; Barker, P. Mechanistic Study on the Corrosion Behaviour of Zinc and Zinc-Calcium Alloys Designed for Enhanced Metallic Coatings in the Presence of Chloride and Phosphate Ions. Corros. Sci. 2023, 213, 110956. [Google Scholar] [CrossRef]
- Oliver, W.C.; Pharr, G.M. An Improved Technique for Determining Hardness and Elastic Modulus Using Load and Displacement Sensing Indentation Experiments. J. Mater. Res. 1992, 7, 1564–1583. [Google Scholar] [CrossRef]
- Oliver, W.C.; Pharr, G.M. Measurement of Hardness and Elastic Modulus by Instrumented Indentation: Advances in Understanding and Refinements to Methodology. J. Mater. Res. 2004, 19, 3–20. [Google Scholar] [CrossRef]
- Pharr, G.M.; Oliver, W.C. Measurement of Thin Film Mechanical Properties Using Nanoindentation. MRS Bull. 1992, 17, 28–33. [Google Scholar] [CrossRef]
- Kumar, K.S.; Van Swygenhoven, H.; Suresh, S. Mechanical Behavior of Nanocrystalline Metals and Alloys. Acta Mater. 2003, 51, 5743–5774. [Google Scholar] [CrossRef]
- Cellini, F.; Gao, Y.; Riedo, E. Å-Indentation for Non-Destructive Elastic Moduli Measurements of Supported Ultra-Hard Ultra-Thin Films and Nanostructures. Sci. Rep. 2019, 9, 4075. [Google Scholar] [CrossRef] [PubMed]
- Saha, R.; Nix, W.D. Effects of the Substrate on the Determination of Thin Film Mechanical Properties by Nanoindentation. Acta Mater. 2002, 50, 23–38. [Google Scholar] [CrossRef]
- Rhee, H.; Lucas, J.P.; Subramanian, K.N. Micromechanical Characterization of Thermomechanically Fatigued Lead-Free Solder Joints. J. Mater. Sci. Mater. Electron. 2002, 13, 477–484. [Google Scholar] [CrossRef]
- Chromik, R.R.; Vinci, R.P.; Allen, S.L.; Notis, M.R. Nanoindentation Measurements on Cu–Sn and Ag–Sn Intermetallics Formed in Pb-Free Solder Joints. J. Mater. Res. 2003, 18, 2251–2261. [Google Scholar] [CrossRef]
- Frear, D.R.; Vianco, P.T. Intermetallic Growth and Mechanical Behavior of Low and High Melting Temperature Solder Alloys. Metall. Mater. Trans. A 1994, 25, 1509–1523. [Google Scholar] [CrossRef]
- Rho, J.-Y.; Tsui, T.Y.; Pharr, G.M. Elastic Properties of Human Cortical and Trabecular Lamellar Bone Measured by Nanoindentation. Biomaterials 1997, 18, 1325–1330. [Google Scholar] [CrossRef]
- Roos, W.H.; Wuite, G.J.L. Nanoindentation Studies Reveal Material Properties of Viruses. Adv. Mater. 2009, 21, 1187–1192. [Google Scholar] [CrossRef]
- Lancaster, R.J.; Illsley, H.W.; Davies, G.R.; Jeffs, S.P.; Baxter, G.J. Modelling the Small Punch Tensile Behaviour of an Aerospace Alloy. Mater. Sci. Technol. 2017, 33, 1065–1073. [Google Scholar] [CrossRef]
- Matocha, K. Small-Punch Testing for Tensile and Fracture Behavior: Experiences and Way Forward. In Small Specimen Test Techniques: 6th Volume; ASTM International: West Conshohocken, PA, USA, 2015; pp. 1–15. ISBN 9780803175976. [Google Scholar]
- Bruchhausen, M.; Holmström, S.; Simonovski, I.; Austin, T.; Lapetite, J.-M.; Ripplinger, S.; de Haan, F. Recent Developments in Small Punch Testing: Tensile Properties and DBTT. Theor. Appl. Fract. Mech. 2016, 86, 2–10. [Google Scholar] [CrossRef]
- Moreno, M.F.; Bertolino, G.; Yawny, A. The Significance of Specimen Displacement Definition on the Mechanical Properties Derived from Small Punch Test. Mater. Des. 2016, 95, 623–631. [Google Scholar] [CrossRef]
- Mao, X.; Takahashi, H. Development of a Further-Miniaturized Specimen of 3 Mm Diameter for Tem Disk (ø 3 Mm) Small Punch Tests. J. Nucl. Mater. 1987, 150, 42–52. [Google Scholar] [CrossRef]
- Cao, X.; Zhou, X.; Li, Z.; Luo, Z.; Duan, J. Interface Microstructure and Nanoindentation Characterization of Laser Offset Welded 5052 Aluminum to Press-Hardened Steel Using a Brass Interlayer. Metals 2019, 9, 1143. [Google Scholar] [CrossRef]
- Lancaster, R.J.; Jeffs, S.P.; Haigh, B.J.; Barnard, N.C. Derivation of Material Properties Using Small Punch and Shear Punch Test Methods. Mater. Des. 2022, 215, 110473. [Google Scholar] [CrossRef]
- Yao, C.; Lv, H.; Zhu, T.; Zheng, W.; Yuan, X.; Gao, W. Effect of Mg Content on Microstructure and Corrosion Behavior of Hot Dipped Zn–Al–Mg Coatings. J. Alloys Compd. 2016, 670, 239–248. [Google Scholar] [CrossRef]
- Jin, H.; Zhao, S.; Guillory, R.; Bowen, P.K.; Yin, Z.; Griebel, A.; Schaffer, J.; Earley, E.J.; Goldman, J.; Drelich, J.W. Novel High-Strength, Low-Alloys Zn-Mg (<0.1 Wt% Mg) and Their Arterial Biodegradation. Mater. Sci. Eng. C 2018, 84, 67–79. [Google Scholar] [CrossRef]
- Drápala, J.; Kostiuková, G.; Losertová, M. Contribution to the Aluminum–Tin–Zinc Ternary System. IOP Conf. Ser. Mater. Sci. Eng. 2017, 266, 012002. [Google Scholar] [CrossRef]


| Sample | Zn (wt.%) | Mg (wt.%) | Al (wt.%) | Ge (wt.%) |
|---|---|---|---|---|
| Galv Zn | 99.80 | - | 0.20 | - |
| ZMA–0 Ge | 96.80 | 1.60 | 1.60 | - |
| ZMA–0.19 Ge | 96.61 | 1.59 | 1.59 | 0.19 |
| ZMA–0.87 Ge | 95.96 | 1.58 | 1.58 | 0.87 |
| ZMA–1.80 Ge | 98.05 | 1.57 | 1.57 | 1.80 |
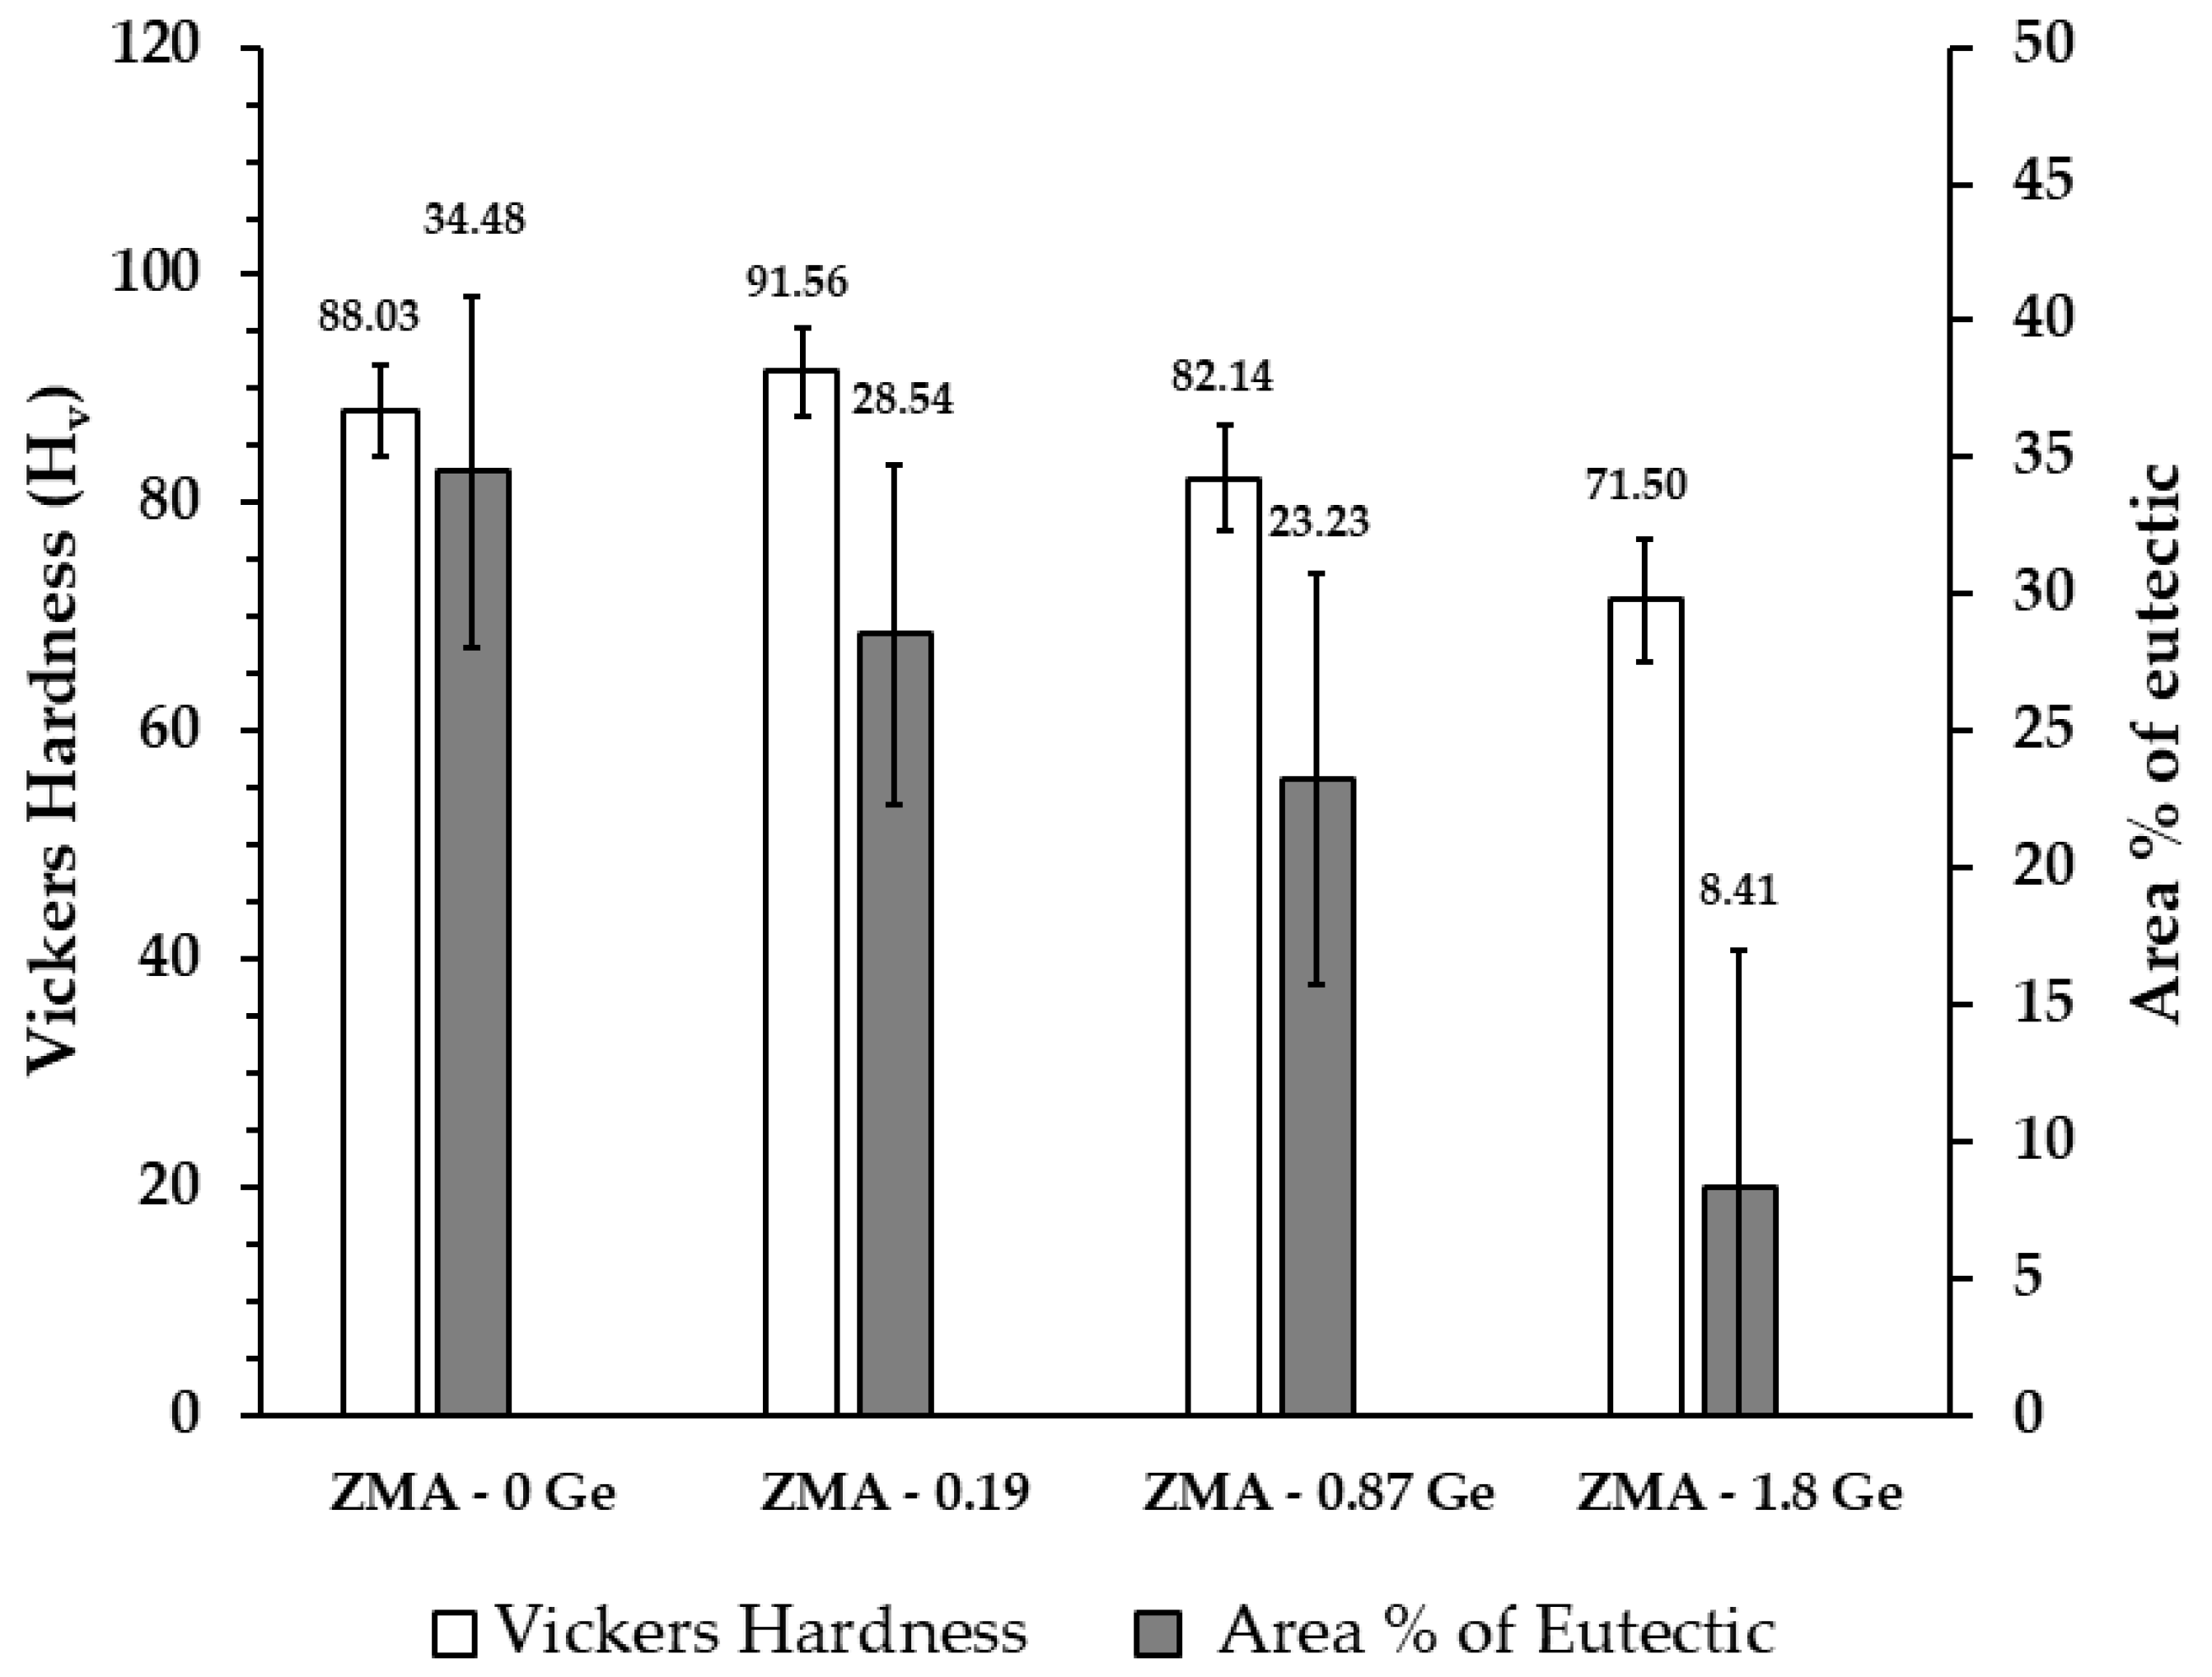
| Sample | Primary Zn (Surface Area %) | Eutectic (Surface Area %) | Mg2Ge (Surface Area %) |
|---|---|---|---|
| Galv Zn | 100 | - | - |
| ZMA–0 Ge | 65.52 ± 2.18 | 34.48 ± 1.92 | - |
| ZMA–0.19 Ge | 69.89 ± 6.21 | 28.54 ± 6.27 | 1.57 ± 0.07 |
| ZMA–0.87 Ge | 72.17 ± 0.45 | 23.23 ± 0.64 | 4.60 ± 0.22 |
| ZMA–1.80 Ge | 77.31 ± 5.67 | 8.41 ± 1.27 | 14.28 ± 6.84 |
| Sample | Vickers Hardness (Hv) |
|---|---|
| Galv Zn | 51.60 ± 1.94 |
| ZMA–0 Ge | 88.03 ± 4.00 |
| ZMA–0.19 Ge | 91.56 ± 3.87 |
| ZMA–0.87 Ge | 82.14 ± 4.65 |
| ZMA–1.80 Ge | 71.50 ± 5.33 |
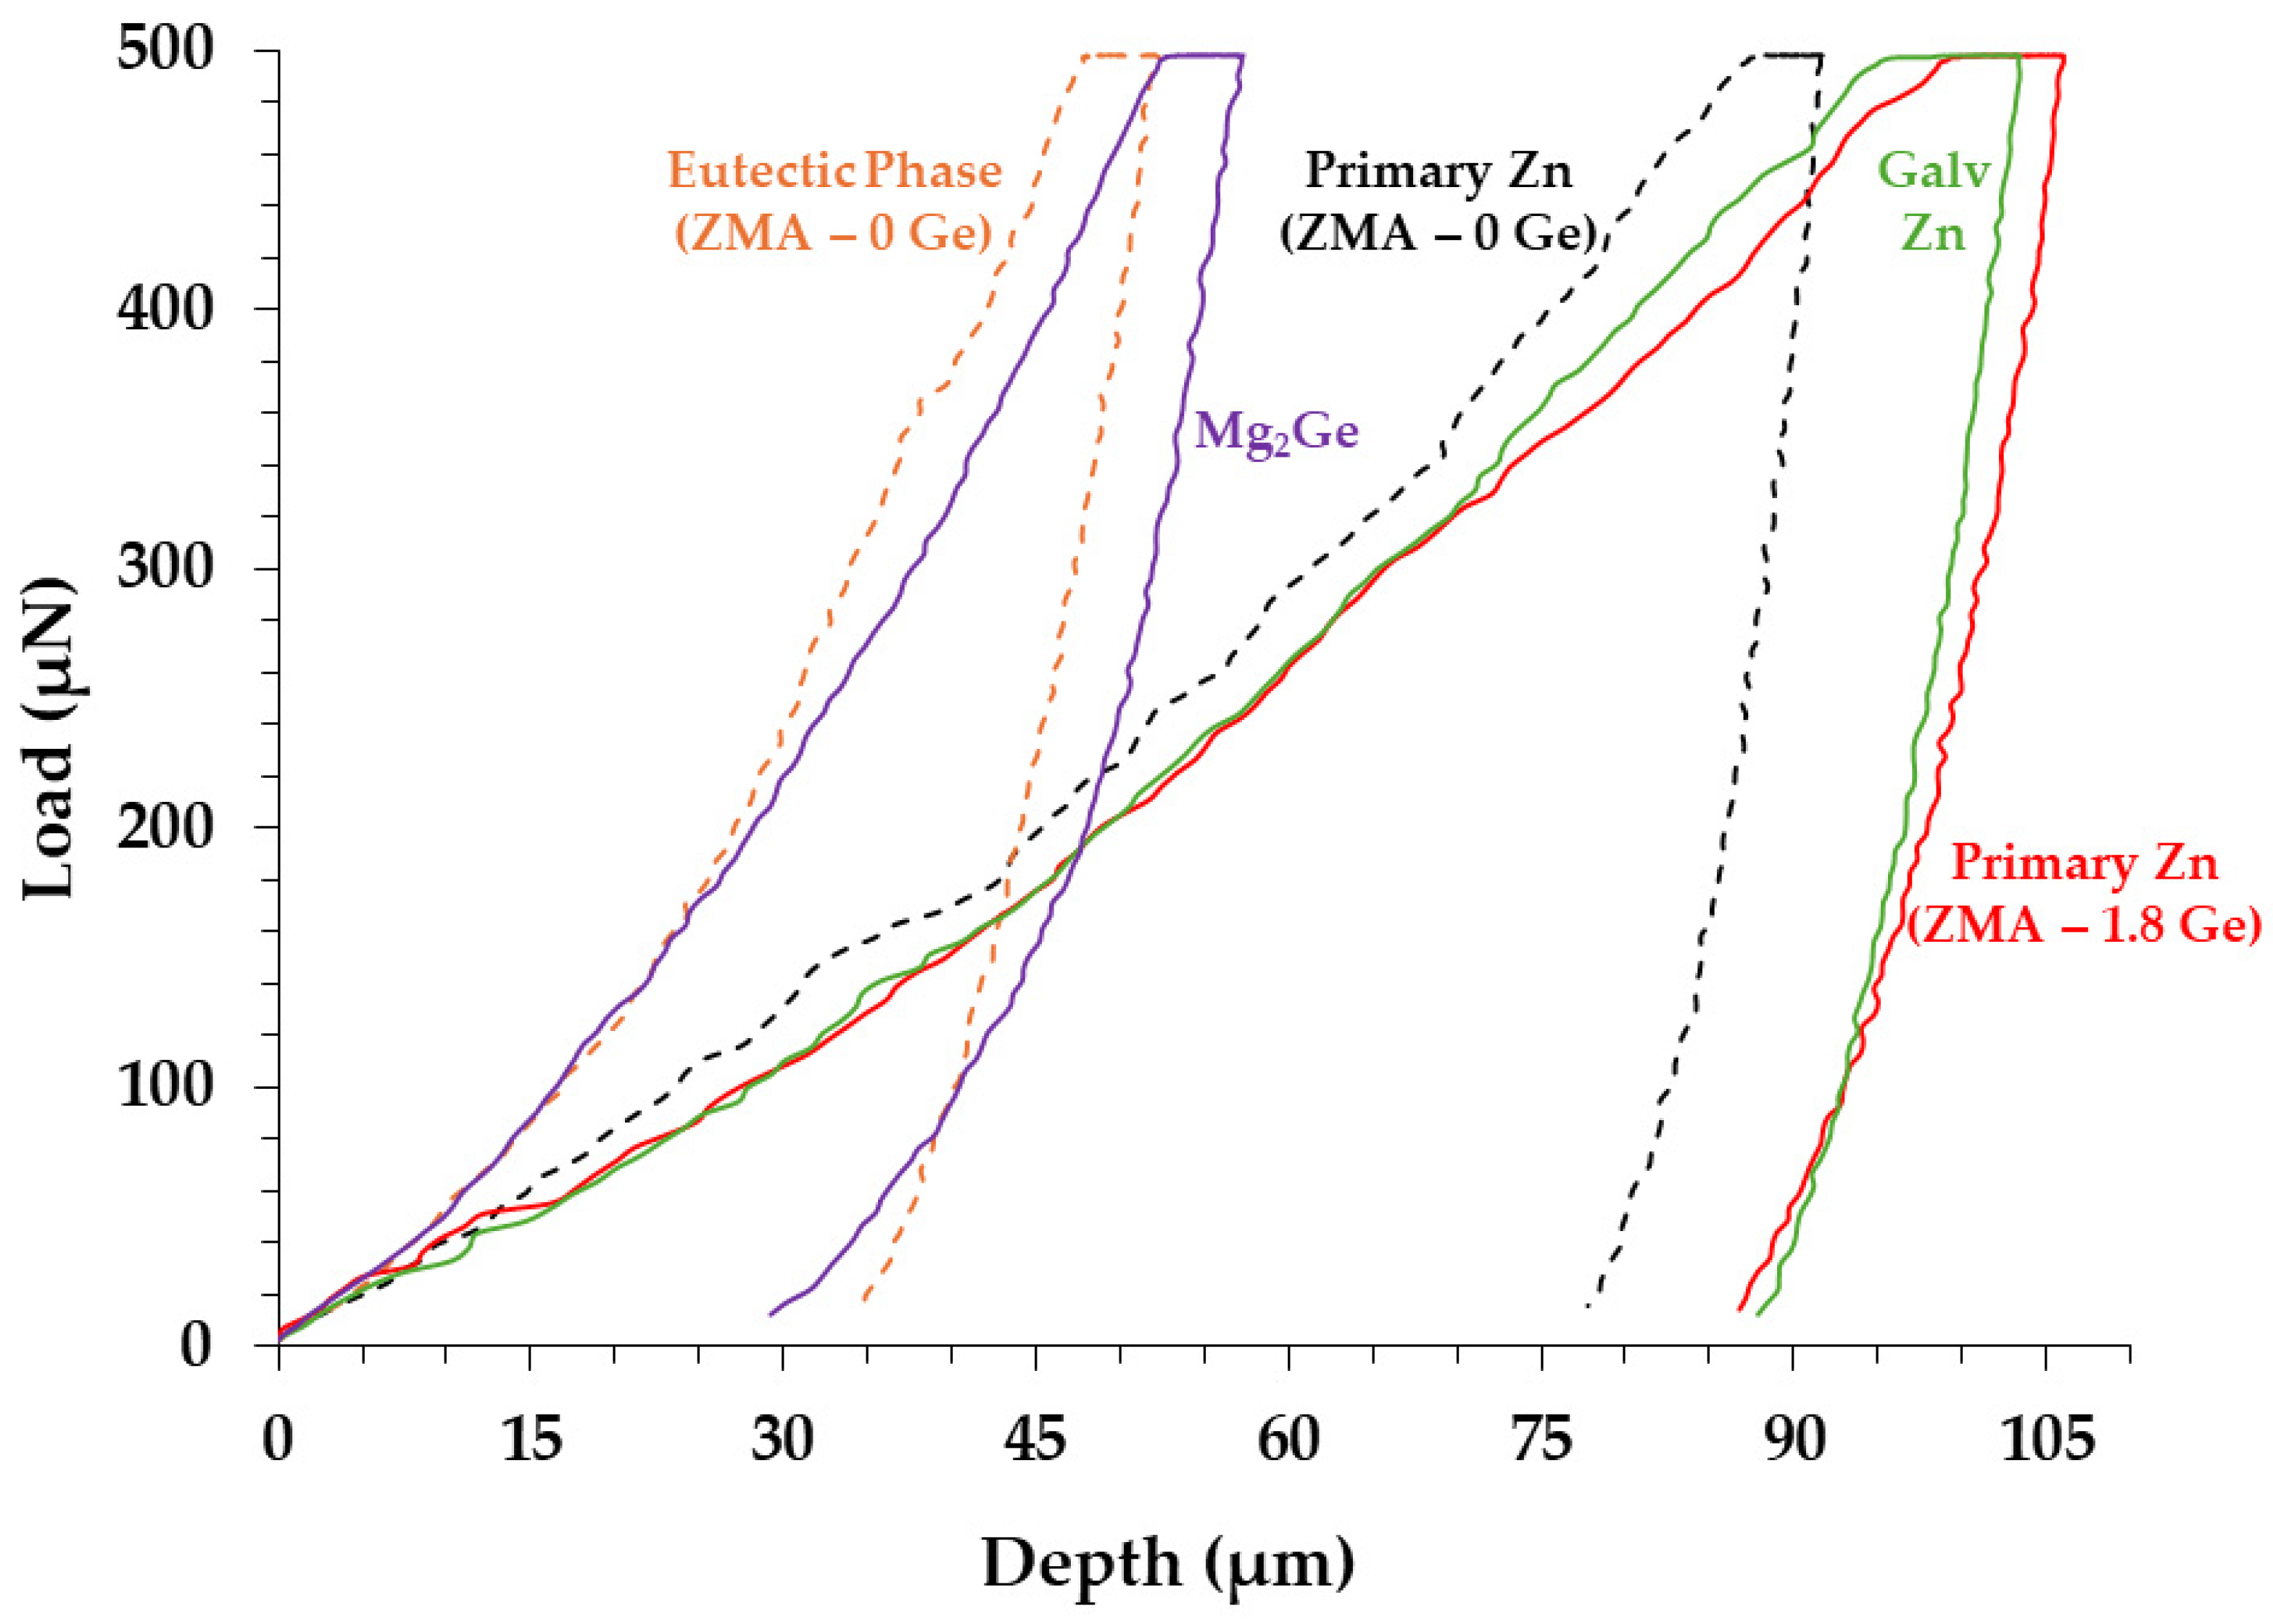
| Galv Zn | Primary Zn (ZMA–0 Ge) | Eutectic Phase (ZMA–0 Ge) | Primary Zn (ZMA–1.8 Ge) | Mg2Ge | |
|---|---|---|---|---|---|
| Reduced Elastic Modulus (Er) (GPA) | 89.92 ± 4.02 | 113.02 ± 2.46 | 125.91 ± 10.82 | 78.07 ± 6.37 | 136.39 ± 7.39 |
| Hardness (H) (GPA) | 1.34 ± 0.27 | 1.96 ± 2.46 | 4.55 ± 1.17 | 1.65 ± 0.15 | 6.79 ± 0.58 |
| Sample | Pm (N) | um (mm) | Py (N) | uo (mm) | um–uo (mm) | Predicted σUTS (MPa) | Predicted σys (MPa) |
|---|---|---|---|---|---|---|---|
| Galv Zn | 112.20 | 1.04 | 25 | 0.02 | 1.02 | 136.5 | 168.4 |
| ZMA–0 Ge | 147.82 | 0.30 | 70 | 0.02 | 0.28 | 303.5 | 231.2 |
| ZMA–0.19 Ge | 130.04 | 0.17 | 78 | 0.01 | 0.16 | 421.6 | 242.4 |
| ZMA–0.87 Ge | 125.67 | 0.18 | 74 | 0.01 | 0.17 | 392.6 | 236.8 |
| ZMA–1.8 Ge | 114.84 | 0.21 | 73 | 0.02 | 0.19 | 327.0 | 239.6 |
| Temperature | Mg (wt.%) | Al (wt.%) |
|---|---|---|
| RT | 0.008 | 0.07 |
Disclaimer/Publisher’s Note: The statements, opinions and data contained in all publications are solely those of the individual author(s) and contributor(s) and not of MDPI and/or the editor(s). MDPI and/or the editor(s) disclaim responsibility for any injury to people or property resulting from any ideas, methods, instructions or products referred to in the content. |
© 2024 by the authors. Licensee MDPI, Basel, Switzerland. This article is an open access article distributed under the terms and conditions of the Creative Commons Attribution (CC BY) license (https://creativecommons.org/licenses/by/4.0/).
Share and Cite
Malla, A.D.; Sullivan, J.H.; Penney, D.J.; Sackett, E.; Lancaster, R.J.; Barker, P. The Effect of Germanium Additions on the Mechanical Properties of Zn-Mg-Al Alloys. Metals 2024, 14, 820. https://doi.org/10.3390/met14070820
Malla AD, Sullivan JH, Penney DJ, Sackett E, Lancaster RJ, Barker P. The Effect of Germanium Additions on the Mechanical Properties of Zn-Mg-Al Alloys. Metals. 2024; 14(7):820. https://doi.org/10.3390/met14070820
Chicago/Turabian StyleMalla, Amar Dhoj, James Henley Sullivan, David Jonathan Penney, Elizabeth Sackett, Robert Joseph Lancaster, and Peter Barker. 2024. "The Effect of Germanium Additions on the Mechanical Properties of Zn-Mg-Al Alloys" Metals 14, no. 7: 820. https://doi.org/10.3390/met14070820
APA StyleMalla, A. D., Sullivan, J. H., Penney, D. J., Sackett, E., Lancaster, R. J., & Barker, P. (2024). The Effect of Germanium Additions on the Mechanical Properties of Zn-Mg-Al Alloys. Metals, 14(7), 820. https://doi.org/10.3390/met14070820