Abstract
Due to the phenomenon of deformation-induced phase transformation, the mechanical properties of TRIP steel, including the elastic modulus, undergo changes during the deformation process. This deviation from plastic theory in describing the deformation process is addressed in this study. Through tensile and cupping tests conducted at different rates, the relationship between inelastic deformation and forming time in TRIP steel is established. These tests demonstrate the presence of viscosity and the rheological behavior of solid metal materials during inelastic deformation. The experimental findings also highlight the significance of selecting an appropriate deformation rate for successful TRIP steel forming. Excessive deformation rates can result in the rapid transformation of residual austenite into martensite and increase the likelihood of material cracking. Building upon rheological theory, a constitutive equation is developed to describe the relationship between stress, strain, and strain rate for TRIP600 under creep test conditions. This constitutive model is then applied to simulate the cupping test, and by comparing the simulation results with actual test data, it is confirmed that the rheological constitutive model provides a more accurate representation of TRIP steel deformation. Furthermore, it can guide the improvement of the forming process to enhance the success rate of forming operations.
1. Introduction
Hooke’s law, which describes the relationship between stress and strain for most materials, is valid only within certain limits of stress and strain. When a specific yield condition is met, the material undergoes inelastic deformation, including yield and plastic flow. In the case of cyclic loading, inelastic deformation accumulates significantly, and its mechanism is more complex than elastic deformation. Consequently, Hooke’s law is no longer applicable in these situations [1]. It is important to note that plasticity, which is independent of forming time, should be distinguished from time-dependent deformations like creep [2,3]. Classical plastic theory divides inelastic deformation into two categories: time-independent plastic deformation and time-dependent creep. The plastic constitutive equation primarily focuses on the mechanical properties of materials under static forces and does not account for the effects of strain rate or the historical effects of strain rates [4,5,6]. This plastic static constitutive relationship can only provide accurate results when the material is insensitive to strain rate or when the working temperature is low and the loading rate is very slow [7]. However, when the strain rate effect cannot be neglected, the material exhibits different characteristics compared to those under static loads [8,9,10]. For instance, many metals experience a significant increase in yield strength under rapid loading conditions, but the onset of yield is delayed [11,12,13,14]. Additionally, instantaneous stress increases with higher strain rates. These phenomena collectively represent the strain rate effect, and materials that are highly affected by strain rate are referred to as strain rate-sensitive materials.
TRIP steel is an advanced high-strength steel developed to utilize the TRIP effect during the deformation process [15,16,17,18,19]. At room temperature, the microstructure of TRIP steel mainly consists of inter-critical ferrite, bainitic ferrite, and residual austenite (typically 5–15%). As a metastable phase, residual austenite tends to transform into the more stable martensite under certain inelastic deformations [20]. The hardening properties of martensite are superior to those of austenite, enhancing the material’s ability to undergo uniform deformation and improving its plasticity [21,22,23].
The mechanical behavior of TRIP steel under different strain rates has been studied extensively. J.L. Dai et al. [24] studied the dynamic and static response behavior of TRIP steel, and the results indicated that the strength and plasticity of Q&P steel had significant strain rate sensitivity. The yield strength and ultimate strength increased continuously, whereas the elongation first decreased and then increased with the increase in strain rate. Murr [25] found that in the dynamic tensile process, the greater the strain rate, the less the residual austenite transforms into martensite in stainless steel. Perlade et al. [26] established a physical model of the macroscopic mechanical properties of TRIP steel and well predicted the volume fraction of strain-induced martensite from austenitic stainless steels under uniaxial stress. Bleck [27] carried out tensile tests on TRIP steel in the strain rate range of 5 × 10⁻³–2 × 10² s−1, and the results showed that the elongation of TRIP steel would also increase with the increase in strain rate, and the results of dynamic tensile tests were higher than those of quasi-static tensile tests. Mao et al. [28] studied the influence of strain rate on the tensile strength and deformation mechanism of TWIP-TRIP steel. Saito [29] studied the effects of strain rate and temperature on the inelastic deformation characteristics of TRIP steel and concluded that temperature would increase with an increase in strain rate, which had an inhibitory effect on martensite transformation. Choi [30] analyzed the effects of strain rate and residual austenite transformation amount on the mechanical properties of TRIP steel and established the relationship between strain rate, residual austenite volume fraction, tensile strength, elongation, energy absorption, yield strength, etc. He carried out dynamic tensile tests on TRIP steel in the strain rate range of 1 × 10⁻³–2.5 × 10² s−1, and the results showed that the energy absorption values of all samples increased with the increase in strain rate. Oliver et al. [31,32] observed a change in the microstructure of TRIP steel under the condition of a high strain rate, and the results showed that the elongation of ferrite significantly increased and the transformation of residual austenite to martensite increased. Iwamoto et al. [33] established a constitutive equation that could be used in the uniaxial tensile simulation of SUS304 stainless steel by combining meso-mechanics and Green’s self-consistent equation, which consider the effects of strain rate and martensite shape. H.Y. Yu [34] derived the relationship between the change rate of residual austenite volume ratio and the deformation rate in TRIP steel based on the transformation dynamics model, and the results showed that an increase in deformation rate would lead to an increase in the change rate of residual austenite volume ratio. Pychmintsev et al. [35] and X.C. Wei et al. [36] found that with the increase in strain rate, the yield strength and tensile strength of Si-Mn TRIP steel increased, the uniform elongation decreased significantly, the total elongation also decreased, but the elongation of the instability zone increased. The decrease in total elongation of TRIP steel was not obvious because the transformation of residual austenite to martensite was induced in the deformation process, which relaxed the stress concentration, combining with the thermal softening effect of strain. Moreover, many examples indicate that the deformation behavior and energy absorption characteristics of TRIP steel at high deformation rates change significantly compared with those under quasi-static conditions [37]. Therefore, TRIP steel is a strain rate-sensitive material, and the influence of strain rate and time on its mechanical behavior cannot be ignored in the study of the constitutive relationship.
Despite this high strength, TRIP steel has poor formability and is prone to cracking during the forming processes. One of the key challenges in TRIP steel forming is the lack of a clear constitutive equation, resulting in a mismatch between the applied external force and the expected deformation. The springback behavior of TRIP steel after unloading is complex, involving not only elastic recovery but also a significant amount of plastic recovery. This complexity renders traditional stress–strain empirical formulas inadequate for springback analysis in TRIP steel. Numerous theoretical and numerical models have been developed to predict the formability of sheet metals [38,39,40,41]. Improving traditional constitutive models is a common approach to constructing a constitutive model for TRIP steel. For instance, Lee et al. combined the HAH model and QPE model to construct a constitutive model for TRIP steel, resulting in improved simulation accuracy for springback [42]. Yang et al. modified the QPE model and coupled it with the Lemaitre damage model for springback simulation [43]. H.Y. Yu et al. enhanced the traditional Chaboche model based on the martensitic transformation dynamics model, achieving higher accuracy in springback simulation [44].
Employing elastic [H], viscous [N], and plastic [V] elements in rheology, along with models such as Kelvin, Maxwell, and Bingham, enables a more accurate description of the stress–strain relationship during the forming process of TRIP steel. This approach also allows for a more reasonable explanation of the elastic and inelastic recovery behavior of TRIP steel after work-hardening, softening, and unloading. The rheological constitutive model, based on this theory, accurately and reasonably describes the properties of the soft and hard phases in dual-phase steel (as well as complex-phase steel). It can also characterize the behavior of the transition from residual austenite to martensite in TRIP steel by adjusting coefficients and combinations of different elements. The mechanics of work-hardening and springback during deformation can be analyzed using generalized creep and generalized stress relaxation theory with this type of constitutive model. Thus, the rheological constitutive model is ideal for describing and explaining the stress–strain relationship in the TRIP steel-forming process.
2. Experimental Material and Procedure
The test material used in this study is a self-made TRIP steel with a grade of 600 MPa, referred to as TRIP600. The chemical composition of TRIP600 is presented in Table 1.

Table 1.
Chemical composition of TRIP600.
The smelting process involved using a 50 kg vacuum induction furnace to melt the steel, followed by forging the resulting ingots into billets measuring 130 mm × 100 mm × 35 mm. These billets were then hot rolled to create a plate with a thickness of 4 mms, with the final rolling temperature exceeding 900 °C. After rapid cooling, the samples underwent a tempering process at 650 °C for 1 h. Subsequently, pickling and cold rolling were performed to obtain cold-rolled plates with a thickness of 1 mm. Finally, heat treatment was conducted using the ULVAC-CCT-AY-II simulation test machine made by Ulvac (Maozaki, Japan), with the annealing process depicted in Figure 1a. The sample is heated to 800 °C for 92 s, then cooled in stages to 410 °C for isothermal treatment, and finally cooled to room temperature to obtain the microstructure of ferrite, bainite, and residual austenite. The primary objective in designing these parameters is to align them with the temperature conditions experienced by commercial TRIP600 in real production environments. Holding at 800 °C is conducted to achieve a dual-phase structure of inter-critical ferrite–austenite. To obtain a minor portion of proeutectoid ferrite, a slow cooling rate of 6.4 °C/s is maintained above 680 °C. Furthermore, a rapid cooling rate exceeding 410 °C, specifically at 42.2 °C/s, is employed to avert pearlite phase formation. Subsequently, the material undergoes isothermal treatment to obtain bainitic ferrite and residual austenite. The metallographic photo is displayed in Figure 1b. Polygonal ferrite (F) primarily forms during the inter-critical austenitizing holding stage and cooling stages above 680 °C. The bainite (B) structure mainly forms during the isothermal period at 410 °C, consisting of lath-shaped bainitic ferrite and lath-shaped residual austenite or carbides on it. The slightly larger-sized island-like microstructures are residual austenite islands. During the cooling stage after the 410 °C isothermal treatment, there may be a very small amount of martensitic phase transformation, forming martensite–austenite islands (A/M). Given that martensitic structures are undesirable in commercial TRIP600 steel, this paper assumes the absence of martensitic phase transformations and initial martensite during the cooling process.
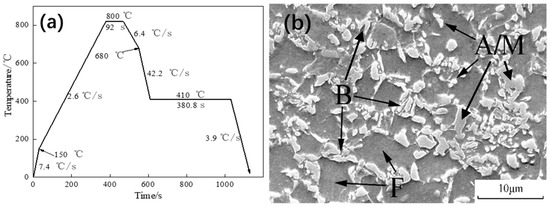
Figure 1.
(a) Continuous annealing process diagram of the TRIP600 steel; (b) metallographic photos of experimental materials; F represents ferrite, B represents bainite, A represents austenite, and M represents martensite.
In order to assess the influence of different rates on the martensitic transformation, a series of tensile tests were conducted on the GLEEBLE 3500 thermal simulator produced by DSI (St. Paul, MN, USA). The experiment involved three different tensile rates: 0.1 s−1, 1 s−1, and 10 s−1. The stress–strain curves of TRIP600 were measured at each of these rates.
For each tensile rate, five different strain levels were selected: 0.10, 0.15, 0.20, 0.25, and 0.30. Tensile tests were performed on the GLEEBLE 3500 thermal simulator using these strain levels. The martensite volume fraction at the fracture section after the tensile test was indirectly measured using an X-ray diffractometer. The sample size was about 15 mm × 10 mm, with a scanning angle range of 47–93° and a scanning speed of 2°/min. Based on Miller’s method for calculating the volume of austenite, the {200A}, {220A}, and {311A} austenite diffraction peaks, along with the {200F} and {211F} ferrite diffraction peaks, were selected for calculation. This yielded a diffraction spectrum. The results were then input into the Jade 6.5 software for automatic peak finding, and the peak values and intensity values of each diffraction peak were sequentially entered into an empirical formula, thus obtaining the residual austenite volume fraction under different amounts of deformation.
The schematic diagram of the tensile test sample is provided in Figure 2.
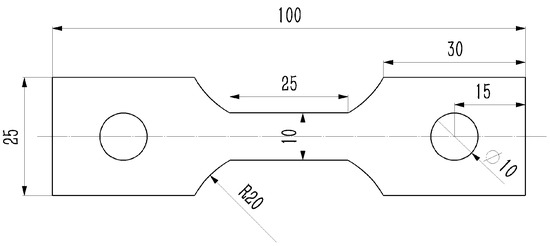
Figure 2.
Schematic diagram of tensile test samples (Unit, millimeters).
Creep tests were conducted on the GLEEBLE to observe the strain variation trend in the inelastic deformation zone of TRIP600 steel. Five stress levels were selected for the experiment: 500 MPa, 540 MPa, 575 MPa, 610 MPa, and 650 MPa. These stress levels were maintained for 9 h to capture the strain variation pattern.
The cupping test is a reliable method for evaluating the strength and deformation ability of sheet materials and is commonly used to assess the forming properties of sheet metal. The test process is illustrated in Figure 3. During the test, the blank holder presses the sheet metal while the ball head punches at a pre-determined speed until cracks appear on the protruding part of the sheet metal. In this study, the sheet sample had dimensions of 90 mm × 90 mm and a thickness of 1 mm. Prior to the test, graphite grease was evenly applied to both sides of the sheet sample and the punch. The sample was then clamped between the pressing die and the cushion die after zero setting. The clamping force was set to 10 kN, and the punch speed was varied at 0.1 mm/s, 0.5 mm/s, 1.0 mm/s, 5.0 mm/s, and 10.0 mm/s. The test utilized a spherical end punch with a stamping-sensitive value set at 1000 N. When this value was reached, the equipment automatically unloaded, and the depth of the sample at this point was recorded as the IE value. Specifically, for a speed of 1.0 mm/s, four key points (A–D) were selected for phase transition analysis using EBSD, as depicted in Figure 3. The EBSD experiment was conducted using the HKL Nordlys electron backscatter diffraction analysis system equipped with a ZEISS ULTRA 55 thermal field emission scanning electron microscope at a magnification of 3000 times and a scanning step size of 0.1 um/s.
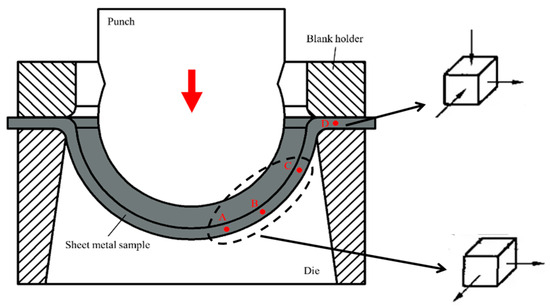
Figure 3.
Schematic diagram of the cupping test.
3. Results and Discussion
Figure 4 illustrates the tensile test curve, highlighting the impact of strain rate on the strength and elongation of TRIP600. It is evident that the yield strength and tensile strength of TRIP600 increase with higher strain rates. This observation clearly indicates that TRIP600 is a material sensitive to strain rate, and its mechanical behavior during the forming process is time-dependent, providing evidence for its viscosity.
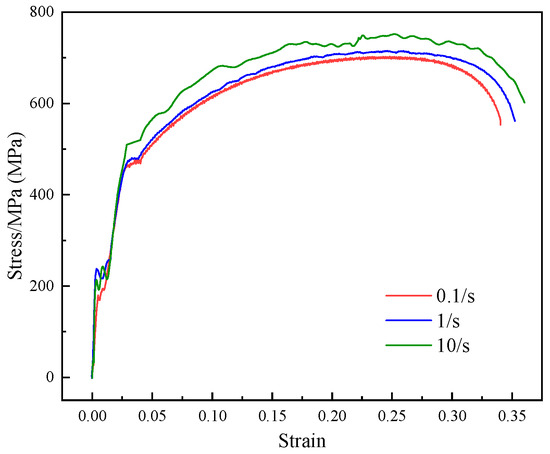
Figure 4.
Stress–strain curves at different strain rates.
Figure 5 reveals the influence of strain rate on the martensite transformation. The effective strain here refers to the effective plastic strain, and the effective plastic strain at the yield point is zero. In the stress–strain curve, it is equivalent to removing the elastic segment. It is evident that, at the same strain level, the volume fraction of martensite increases with higher strain rates. High strain rates result in a greater extent of martensite transformation. Martensite, being a hard phase, enhances the material’s resistance to deformation. During continuous deformation, if the material cannot effectively reduce deformation resistance through thinning, it eventually leads to fracture.
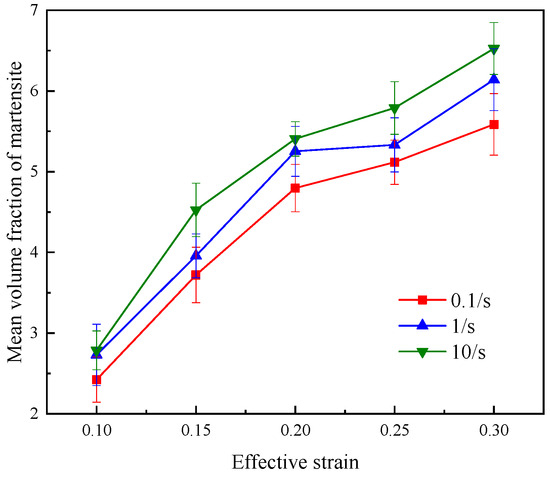
Figure 5.
Effects of tensile rate and effective strain on the volume fraction of martensite transformation.
In the cupping test, the top portion of the sheet material undergoes significant deformation, leading to an accelerated transformation of residual austenite with higher strain rates. As the level of deformation continues to rise, the material eventually cracks when the deformation resistance surpasses the sheet metal’s capacity to withstand thinning. Consequently, for TRIP steel, regulating the appropriate forming speed becomes crucial for enhancing the success rate of stamping part formation and preventing cracking.
EBSD analysis was conducted on the four designated key locations indicated in Figure 3, and the findings are presented in Figure 6. The yellow region in the analysis represents residual austenite. Subsequently, the volume fraction of martensite resulting from deformation was deduced from the initial volume fraction of residual austenite, as shown in Table 2. During the cupping test, different parts experience varying stress states, resulting in disparities in strain across each area. During the deformation process, points A, B, and C are in a bi-directional tensile stress state, and the degree of deformation near the bottom of the specimen becomes more severe, leading to more residual austenite transforming into martensite. The stress state at point D is in two directions under compressive stress and one direction under tensile stress, which limits the deformation capacity of this area. Combining Table 2 and the results of EBSD, it can be observed that the amount of residual austenite transformation gradually increases from region D to region A. Key point A, located near the top, is subjected to both compression and tension, resulting in the highest strain and the largest volume of converted martensite. Ideally, the presence of martensite, as a hard phase, enhances the strength of the deformation region and mitigates further deformation in that area, thereby improving the overall homogeneity of sheet metal deformation. However, in conjunction with previous research on the impact of deformation rate on martensite transformation, excessively high forming rates can lead to premature martensite transformation. This premature transformation does not enhance plasticity but instead predisposes the sheet metal to crack prematurely. This aligns with rheology theory, which suggests that higher forming rates result in larger viscosity correlation coefficients for the material and greater deformation resistance, making the material more prone to cracking.
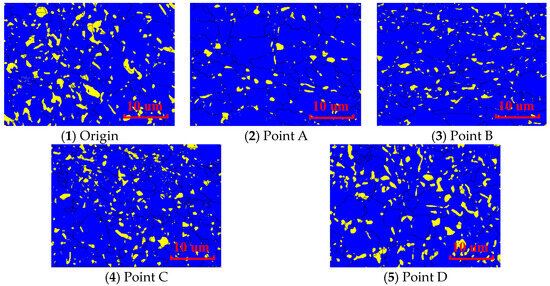
Figure 6.
EBSD results of the original material and the four points after the cupping test.
Table 2.
Content of martensite obtained from local deformation.
Currently, rheological models are generally classified into two categories: restricted models and generalized models. The restricted models include the Kelvin model for delayed elasticity ([K] = [H]|[N]), the Maxwell model for viscoelasticity ([M] = [H] − [N]), the Bingham model for viscoplasticity ([B] = [H] − ([N]|[V])), and the Burgers model for linear viscoelasticity ([M] − [K]). On the other hand, the generalized models consist of a parallel arrangement of Maxwell models or a series arrangement of Kelvin models. High-strength steels, such as TRIP steel, exhibit characteristics of both hard and soft phases. These characteristics can be effectively described by the rheological model, which incorporates the serial and parallel connections of elastic and plastic elements along with the variation in parameters for each element. Additionally, the phase transformation-induced plastic effects in TRIP steel during the deformation process also demonstrate a certain level of viscosity. Therefore, it is necessary to incorporate a viscous element into the model. The work-hardening behavior of TRIP steel resembles the series characteristics of the Maxwell or Bingham models. Springback, which occurs after unloading, is caused by residual stress from material deformation or uneven metal flow during processing. In the case of TRIP steel, the springback often exhibits anelastic behavior, consistent with the creep behavior observed in the rheological model. This behavior can be effectively described by the Kelvin or Bingham models. For this study, the Bingham model was chosen to investigate the rheological constitutive model of TRIP600, and its specific structure is depicted in Figure 7.
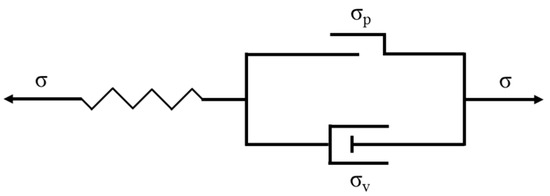
Figure 7.
Bingham model.
According to the rheological model theory, the strain of the Bingham model should meet the following requirements:
where is the total strain, is the elastic strain, is the viscoplastic strain, and and are the strains of the dashpot and the friction piece, respectively. The spring stress, i.e., the elastic stress , conforms to Hooke’s law and is equal to the total stress σ:
where E is the elastic modulus of the elastic element, which can also be called the elastic coefficient of the model, but it is not equal to the elastic modulus of the material.
The magnitude of the stress first depends on whether the yield stress of the material has been reached. When , the stress that causes the continuous viscoplastic flow of the material is related to the strengthening property of the material. To simplify the problem, linear strengthening is adopted in this paper, and the strengthening parameter is defined as . Thus, in the subsequent yield stage of viscoplastic flow, the stress is
where is the stress of the dashpot. When the viscosity coefficient of the material is set as η, then
According to Equations (4)–(6), we can obtain
Combining Equations (2) and (3), we can obtain
When the stress applied to the model is the constant , Equation (8) can be rewritten as
The following results can be obtained by solving this first-order ordinary differential equation:
This is the equation of strain variation with time described by the Bingham model at a certain stress level. After the instantaneous elastic deformation, the strain increases exponentially and reaches a stable value, as shown in Figure 8.
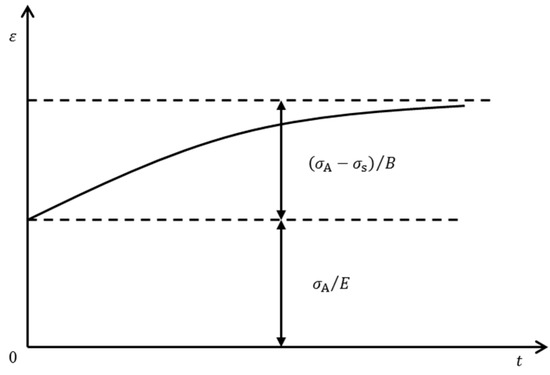
Figure 8.
Strain–time curve of the Bingham model.
The strain–time relationship described by the Bingham model, namely Formula (10), can be denoted as follows:
Equation (11) is used to fit the strain–time data obtained from the creep test, and the coefficient values in the formula are shown in Table 3, and then the parameter values of the Bingham model are shown in Table 4. Thus, the strain–time equation of TRIP600 under different stress states is obtained. The test data and fitting curve are shown in Figure 9.
Table 3.
Parameter values of Equation (11).
Table 4.
Parameter values of the Bingham model.
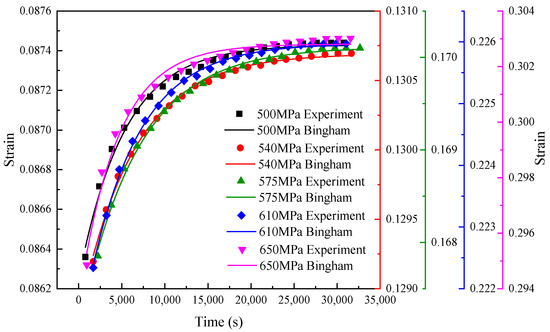
Figure 9.
Strain–time curve of the TRIP600 creep experiment.
The relationship between , , and is linear fitted, and the curve is shown in Figure 10. Then, the curve equation of and with stress is obtained:
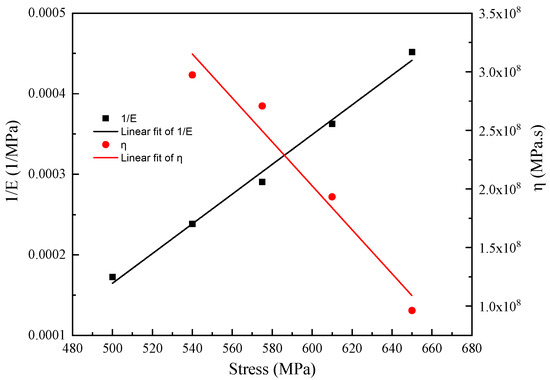
Figure 10.
Trend fitting of E and .
The fitting results of the strengthening coefficient B value of the five groups are averaged, and the result is 36,386.87.
According to Equation (11), we can obtain
then
namely
Substituting the B value and Equations (12) and (13) into Equation (16), the constitutive equation between stress, strain, and time of TRIP600 steel under the experimental condition of fixed stress is obtained as follows:
Equation (17) is a strain rate correlation function. Under the condition of a certain loading stress, the strain is proportional to the strain rate; that is, the strain increases with the increase in the strain rate. Assuming that the thickness of the sheet material used in the cupping test is h, the relationship between strain rate and punch speed is
In the test, the thickness of the sheet material is 1 mm, and when the punch speed is 0.1 mm/s, 0.5 mm/s, 1 mm/s, 5.0 mm/s, and 10.0 mm/s, the rheological constitutive equation required in the numerical simulation is naturally obtained.
To simulate the cupping process of TRIP600, the Dynaform software 5.9.3 is utilized, and the IE value is recorded upon crack detection in the sheet. Initially, the software’s constitutive model is employed for simulation, followed by the utilization of the previously obtained rheological constitutive model for simulation. The results from both numerical simulations are summarized and compared with the experimental data, as depicted in Figure 11. As the set punch speed increases, the IE value gradually decreases, indicating an increase in forming difficulty. The simulation results obtained using the rheological constitutive model demonstrate closer agreement with the actual test data. When the software’s constitutive equation is employed for simulation, the deviation between the solution result and the experimental data is acceptable at lower punch speeds. However, as the punch speed increases, the deviation becomes unacceptably large, rendering the simulation no longer meaningful for reference purposes.
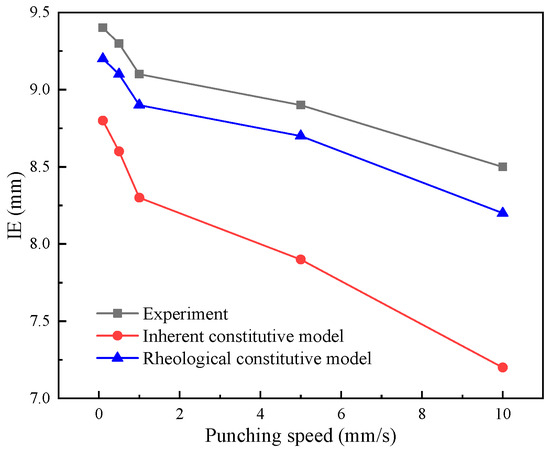
Figure 11.
The comparison of the cupping simulation and experiment results.
Figure 12 illustrates the comparison of forming limit diagrams (FLD) obtained from two different sets of simulations while controlling the punching depth at 8 mm. This visual comparison allows us to observe the distinctions between the two constitutive models. The software’s constitutive model does not incorporate the phase transformation or the viscous effects during the deformation process of TRIP steel. Consequently, when the punch speed reaches 5.0 mm/s, the FLD image shows the presence of a yellow area, indicating a region on the verge of rupture. This outcome contradicts the actual test observations. In contrast, the results obtained with the optimized constitutive model, which is based on the rheological theory discussed earlier, demonstrate good agreement with the experimental data. This highlights the superiority of the rheological constitutive model over the traditional model, which only considers elasticity and plasticity. By accounting for viscosity, the rheological model can more accurately describe and replicate the phase transformation, resulting mechanical properties, and forming outcomes during the deformation process of TRIP600.
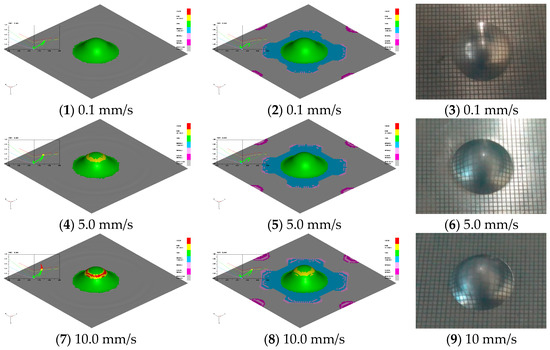
Figure 12.
Simulation results of the cupping test at different punching speeds with the inherent constitutive equation (1,4,7) and the rheological constitutive equation (2,5,8), compared with the real experimental results (3,6,9).
4. Conclusions
The analysis of TRIP600 sample microstructures reveals that the transformation rate of residual austenite to martensite increases with higher deformation rates. However, this premature martensite transformation does not enhance plasticity but hinders the material’s ability to adapt to deformation through thinning. As a result, the material experiences excessive deformation resistance, making it more susceptible to cracking. Therefore, controlling the forming speed within a reasonable range is crucial for improving the quality and success rate of forming TRIP steel.
Furthermore, the tensile speed has a significant impact on the strength and elongation of TRIP600. This indicates the presence of viscosity during the deformation process, implying that solid metal materials exhibit rheological properties during inelastic deformation. By utilizing the Bingham model and conducting creep tests under various loads, a rheological constitutive model for TRIP600 is developed through regression calculations. This model is suitable for approximate creep conditions and can be applied to numerical simulations of the cupping test process. It has been demonstrated that the rheological constitutive model accurately describes the deformation behavior of TRIP steel and provides guidance for improving the forming process.
Author Contributions
Software, H.Z.; Writing—original draft, Y.Y. and X.K.; Writing—review & editing, Y.Y. and X.K.; Project administration, X.K. All authors have read and agreed to the published version of the manuscript.
Funding
This research was funded by Jiangsu University (High-tech ship) Collaborative Innovation Center [1174872301-7] and Changzhou Science and Technology Bureau [CJ20235072]. And The APC was funded by Changzhou Science and Technology Bureau [CJ20235072].
Data Availability Statement
The original contributions presented in the study are included in the article, further inquiries can be directed to the corresponding author.
Conflicts of Interest
The authors declare no conflicts of interest.
References
- Hu, C.; Xu, L.; Zhao, L.; Han, Y.; Song, K.; Luo, X.; Li, C. Investigation of low cycle fatigue crack propagation behavior of 316H steel at 550 °C based on cyclic response and damage accumulation: Experiment and modelling. Int. J. Plast. 2023, 167, 103661. [Google Scholar] [CrossRef]
- Tao, W.; Cao, P.; Park, H.S. Superplastic Creep of Metal Nanowires from Rate-Dependent Plasticity Transition. ACS Nano 2018, 12, 4984–4992. [Google Scholar] [CrossRef] [PubMed]
- Wu, W.-P.; Şopu, D.; Yuan, X.; Adjaoud, O.; Song, K.; Eckert, J. Atomistic understanding of creep and relaxation mechanisms of Cu64Zr36 metallic glass at different temperatures and stress levels. J. Non-Cryst. Solids 2021, 559, 120676. [Google Scholar] [CrossRef]
- Guo, X.; Mao, N.; Kong, T.; Zhang, J.; Shen, J.; Wang, C.; Sun, C.; Li, P.; Xiong, Z. Strain rate-dependent plastic behavior of TWIP steel investigated by crystal plasticity model. Mater. Sci. Eng. A 2024, 891, 145986. [Google Scholar] [CrossRef]
- Krolo, P.; Grandić, D.; Smolčić, Ž. Experimental and Numerical Study of Mild Steel Behaviour under Cyclic Loading with Variable Strain Ranges. Adv. Mater. Sci. Eng. 2016, 2016, 7863010. [Google Scholar] [CrossRef]
- Soni, A.; Das, P.K.; Gupta, S.K. Experimental investigations on the influence of natural reinforcements on tribological performance of sustainable nanocomposites: A comparative study with polymer technology. Tribol. Int. 2024, 191, 109195. [Google Scholar] [CrossRef]
- El Ters, P.; Shehadeh, M.A. Modeling the temperature and high strain rate sensitivity in BCC iron: Atomistically informed multiscale dislocation dynamics simulations. Int. J. Plast. 2018, 112, 257–277. [Google Scholar] [CrossRef]
- Chapuis, A.; Liu, Q. Effect of strain rate sensitivity in visco-plastic modeling. Int. J. Solids Struct. 2018, 152, 217–227. [Google Scholar] [CrossRef]
- Jia, B.; Zhang, Y.; Rusinek, A.; Xiao, X.; Chai, R.; Gu, G. Thermo-viscoplastic behavior and constitutive relations for 304 austenitic stainless steel over a wide range of strain rates covering quasi-static, medium, high and very high regimes. Int. J. Impact Eng. 2022, 164, 104208. [Google Scholar] [CrossRef]
- Wang, H.; Wu, P.; Kurukuri, S.; Worswick, M.J.; Peng, Y.; Tang, D.; Li, D. Strain rate sensitivities of deformation mechanisms in magnesium alloys. Int. J. Plast. 2018, 107, 207–222. [Google Scholar] [CrossRef]
- Shen, Z.; Wu, R.; Yuan, C.; Jiao, W. Comparative study of metamodeling methods for modeling the constitutive relationships of the TC6 titanium alloy. J. Mater. Res. Technol. 2020, 10, 188–204. [Google Scholar] [CrossRef]
- Chandran, S.; Verleysen, P. Non-monotonic plasticity and fracture in DP1000: Stress-state, strain-rate and temperature influence. Int. J. Mech. Sci. 2024, 267, 109011. [Google Scholar] [CrossRef]
- Hao, S.; Cai, X.; Wang, Y.; Li, X.; Chen, L.; Jin, M. Cyclic plastic response of MnN bearing duplex stainless steel: The role of martensitic trans-formation. Mater. Charact. 2024, 209, 113766. [Google Scholar] [CrossRef]
- Huo, W.; Zhou, H.; Fang, F.; Hu, X.; Xie, Z.; Jiang, J. Strain-rate effect upon the tensile behavior of CoCrFeNi high-entropy alloys. Mater. Sci. Eng. A 2017, 689, 366–369. [Google Scholar] [CrossRef]
- Chen, S.; Rana, R.; Haldar, A.; Ray, R.K. Current state of Fe-Mn-Al-C low density steels. Prog. Mater. Sci. 2017, 89, 345–391. [Google Scholar] [CrossRef]
- Soleimani, M.; Kalhor, A.; Mirzadeh, H. Transformation-induced plasticity (TRIP) in advanced steels: A review. Mater. Sci. Eng. A 2020, 795, 140023. [Google Scholar] [CrossRef]
- Pelligra, C.; Samei, J.; Amirkhiz, B.S.; Hector, L.G.; Wilkinson, D.S. Microstrain partitioning, Transformation Induced Plasticity, and the evolution of damage during deformation of an austenitic-martensitic 1.5 GPa Quench and Partition steel. Mater. Sci. Eng. A 2024, 895, 146181. [Google Scholar] [CrossRef]
- Seleznev, M.; Kaden, N.; Renzing, C.; Schmidtchen, M.; Prahl, U.; Biermann, H.; Weidner, A. Microstructural evolution of the bonding zone in TRIP-TWIP laminate produced by accumulative roll bonding. Mater. Sci. Eng. A 2022, 840, 142866. [Google Scholar] [CrossRef]
- Xiong, Z.; Kostryzhev, A.; Saleh, A.; Chen, L.; Pereloma, E. Microstructures and mechanical properties of TRIP steel produced by strip casting simulated in the laboratory. Mater. Sci. Eng. A 2016, 664, 26–42. [Google Scholar] [CrossRef]
- Clarke, K.D.; Hovanski, Y.; Coughlin, D.R.; Carsley, J.E. Shaping and Forming of Advanced High Strength Steels. JOM 2018, 70, 892–893. [Google Scholar] [CrossRef]
- Merwin, M.J. Low-carbon manganese TRIP steels. Mater. Sci. Forum 2007, 539, 4327–4332. [Google Scholar] [CrossRef]
- Ennis, B.; Jimenez-Melero, E.; Atzema, E.; Krugla, M.; Azeem, M.; Rowley, D.; Daisenberger, D.; Hanlon, D.; Lee, P. Metastable austenite driven work-hardening behaviour in a TRIP-assisted dual phase steel. Int. J. Plast. 2016, 88, 126–139. [Google Scholar] [CrossRef]
- Matsuno, T.; Fujita, T.; Matsuda, T.; Shibayama, Y.; Hojo, T.; Watanabe, I. Unstable stress-triaxiality development and contrasting weakening in two types of high-strength transformation-induced plasticity (TRIP) steels: Insights from a new compact tensile testing method. J. Am. Acad. Dermatol. 2023, 322, 118174. [Google Scholar] [CrossRef]
- Dai, J.; Yuan, J.; Yang, Z.; Zhang, C.; Zhang, H.; Yu, S. Deformation and fracture behavior in TRIP steels under static and dynamic tensile conditions. J. Mater. Res. Technol. 2022, 18, 3798–3807. [Google Scholar] [CrossRef]
- Meyers, M.A.; Murr, L.E.; Lindholm, U.S. Shock Waves and High-Strain-Rate Phenomena in Metals; Meyers, M.A., Murr, L.E., Eds.; Plenum Press: New York, NY, USA; London, UK, 1982; p. 683. [Google Scholar]
- Perlade, A.; Bouaziz, O.; Furnémont, Q. A physically based model for TRIP-aided carbon steels behaviour. Mater. Sci. Eng. A 2003, 356, 145–152. [Google Scholar] [CrossRef]
- Schael, I.; Bleck, W. Determination of crash-relevant parameters by dynamic tensile tests. Steel Res. 2001, 71, 173–178. [Google Scholar]
- Mao, W.; Gao, S.; Gong, W.; Bai, Y.; Harjo, S.; Park, M.H.; Shibata, A.; Tsuji, N. Quantitatively evaluating respective contribution of austenite and deformation-induced mar-tensite to flow stress, plastic strain, and strain hardening rate in tensile deformed TRIP steel. Acta Mater. 2023, 256, 119–139. [Google Scholar] [CrossRef]
- Saito, K.; Ikeda, S.; Makii, K.; Akamizu, H.; Tomita, Y. Strain Rate and Temperature Dependent Plastic Deformation Behavior of Low-Carbon TRIP Steel. Trans. Jpn. Soc. Mech. Eng. Ser. A 2005, 71, 465–471. [Google Scholar] [CrossRef][Green Version]
- Choi, I.D.; Bruce, D.M.; Kim, S.J.; Lee, C.G.; Park, S.H.; Matlock, D.K.; Speer, J.G. Deformation behavior of low carbon TRIP sheet steels at high strain rates. ISIJ Int. 2002, 42, 1483–1489. [Google Scholar] [CrossRef]
- Oliver, S.; Jones, T.; Fourlaris, G. Dual phase versus TRIP strip steels: Microstructural changes as a consequence of quasi-static and dynamic tensile testing. Mater. Charact. 2007, 58, 390–400. [Google Scholar] [CrossRef]
- Huh, H.; Kim, S.-B.; Song, J.-H.; Lim, J.-H. Dynamic tensile characteristics of TRIP-type and DP-type steel sheets for an auto-body. Int. J. Mech. Sci. 2008, 50, 918–931. [Google Scholar] [CrossRef]
- Iwamoto, T.; Sawa, T.; Sasaki, M. Macroscopic Constitutive Modeling of TRIP Steel Using Green Function and Computational Simulation of Its Deformation Behavior. J. Soc. Mater. Sci. Jpn. 2004, 53, 1365–1370. [Google Scholar] [CrossRef]
- Yu, H.Y. Influence of deformation rate on formability of TRIP sheet steel. J. Plast. Eng. 2008, 15, 25–28. (In Chinese) [Google Scholar]
- Pychmintsev, I.; Savrai, R.; De Cooman, B.; Moriau, O. High strain rate behaviour of TRIP-aided automotive steels. In Proceedings of the International Conference on TRIP-Aided High Strength Ferrous Alloys, GRIPS; 2002; pp. 299–302. Available online: https://biblio.ugent.be/publication/161203 (accessed on 9 May 2024).
- Wei, X.; Fu, R.; Li, L. Tensile deformation behavior of cold-rolled TRIP-aided steels over large range of strain rates. Mater. Sci. Eng. A 2007, 465, 260–266. [Google Scholar] [CrossRef]
- Samek, L.; De Cooman, B.C.; Van Slycken, J.; Verleysen, P.; Degrieck, J. Physical Metallurgy of Multi-Phase Steel for Improved Passenger Car Crash-Worthiness. Steel Res. 2016, 75, 716–723. [Google Scholar] [CrossRef]
- Wankhede, P.; Suresh, K. A review on the evaluation of formability in sheet metal forming. Adv. Mater. Process. Technol. 2020, 6, 458–485. [Google Scholar] [CrossRef]
- Lumelskyj, D.; Rojek, J.; Lazarescu, L.; Banabic, D. Determination of forming limit curve by finite element method simulations. Procedia Manuf. 2019, 27, 78–82. [Google Scholar] [CrossRef]
- Caro, L.P.; Schill, M.; Haller, K.; Odenberger, E.-L.; Oldenburg, M. Damage and fracture during sheet-metal forming of alloy 718. Int. J. Mater. Form. 2019, 13, 15–28. [Google Scholar] [CrossRef]
- Hou, Y.; Myung, D.; Park, J.K.; Min, J.; Lee, H.-R.; El-Aty, A.A.; Lee, M.-G. A Review of Characterization and Modelling Approaches for Sheet Metal Forming of Lightweight Metallic Materials. Materials 2023, 16, 836. [Google Scholar] [CrossRef]
- Lee, J.; Lee, J.Y.; Barlat, F.; Wagoner, R.H.; Chung, K.; Lee, M.G. Extension of quasi-plastic-elastic approach to incorporate complex plastic flow behavior—Application to springback of advanced high-strength steels. Int. J. Plast. 2013, 45, 140–159. [Google Scholar] [CrossRef]
- Yang, M.; Liang, P.; Zhang, Y.; Fan, L.-F.; Wang, G. Improvement of springback prediction accuracy applying a new constitute model considering damage and nonlinear elastic unloading-reloading behaviors. Int. J. Press. Vessel. Pip. 2023, 204, 104961. [Google Scholar] [CrossRef]
- Yu, H.; Chen, S.J. A mixed hardening model combined with the transformation-induced plasticity effect. J. Manuf. Process. 2017, 28, 390–398. [Google Scholar] [CrossRef]
Disclaimer/Publisher’s Note: The statements, opinions and data contained in all publications are solely those of the individual author(s) and contributor(s) and not of MDPI and/or the editor(s). MDPI and/or the editor(s) disclaim responsibility for any injury to people or property resulting from any ideas, methods, instructions or products referred to in the content. |
© 2024 by the authors. Licensee MDPI, Basel, Switzerland. This article is an open access article distributed under the terms and conditions of the Creative Commons Attribution (CC BY) license (https://creativecommons.org/licenses/by/4.0/).