Article

Hot Deformation Characteristics and Microstructure Evolution of CoCrFeNiZr0.3 Hypoeutectic High-Entropy Alloy

by
Peng Lyu
1,
Haoming Yuan
1,
Hao Wang
1,
Feiyu Ge
1,
Qingfeng Guan
1,
Haixia Liu
1,* and
Xinlin Liu
2,*
1
School of Materials Science and Engineering, Jiangsu University, Zhenjiang 212013, China
2
School of Energy and Power Engineering, Jiangsu University, Zhenjiang 212013, China
*
Authors to whom correspondence should be addressed.
Metals 2024, 14(6), 632; https://doi.org/10.3390/met14060632
Submission received: 3 May 2024 / Revised: 21 May 2024 / Accepted: 24 May 2024 / Published: 26 May 2024

Abstract

:
CoCrFeNiZr0.3 is a two-phase coexisting (Laves + FCC) high-entropy alloy with high strength, excellent corrosion resistance, and thermal stability. However, the inhomogeneous distribution of the eutectic structure among the dendrites has a detrimental effect on the coordinated deformation of the material. The current study shows that the grain size, weave structure, and second phase distribution of high-entropy alloys can be significantly changed by thermal deformation, which affects the mechanical and physical properties, as well as the chemical stability of the alloys. In this study, the thermal deformation behavior of CoCrFeNiZr0.3 biphasic hypoeutectic high-entropy alloy was investigated using a Gleeble-3500 thermal simulation tester under the conditions of deformation temperature of 950–1100 °C and deformation rate of 0.001–1 s−1. The results show that CoCrFeNiZr0.3 high-entropy alloy has higher deformation activation energy, which means its deformation resistance is larger. In addition, the microstructure with finer grain size and uniform distribution of Laves phase can be obtained by EBSD analysis after compression at 1000 °C and 0.01 s−1.

1. Introduction

The concept of high-entropy alloys (HEAs), which generally consist of four or more metallic elements in equal or nearly equal proportions, was introduced in the early 21st century [1,2,3]. Compared with conventional alloys, HEAs are usually composed of multiple elements and the content of each element is relatively low, resulting in a more homogeneous atomic structure and higher entropy of mixing. Due to the synergistic effect between elements, HEAs have excellent mechanical properties and heat and corrosion resistance [4,5,6]. Since then, researchers have successfully fabricated numerous HEAs using rapid solidification techniques, confirming their ability to form simple solid solution structures during the cooling process [5,7,8,9,10]. Among these alloys, those containing FCC phases exhibit excellent ductility and fracture toughness [11,12,13,14,15,16], making them widely applicable in engineering practice. However, single-phase FCC HEAs suffer from insufficient strength and their properties can be further optimized. Numerous studies have shown that an effective way to improve the properties of HEAs is through alloying by additional elements [17,18,19,20].
Zr is a ductile and corrosion-resistant metal with excellent mechanical properties. A large number of studies have shown that the addition of trace Zr elements can significantly improve the strength and hardness of conventional steel [21,22,23,24]. CoCrFeNiZr0.3 is a typical two-phase HEA composed of FCC phase and intermetallic compound. It is a hypoeutectic alloy with both FCC and Laves phases and has excellent mechanical properties [19,25,26,27,28]. Among them, the FCC phase with good plasticity has two forms: dendrite (marked as DR) and lamellar. However, the lamellar Laves phase in the interdendrite (marked as ID) region reduces ductility, but Laves phase alloys generally have special mechanical properties such as high melting point, good high temperature stability, and high strength and heat resistance, making them potential high temperature structural materials, especially in aerospace, nuclear, and other applications. Therefore, this series of HEA has great research value.
Wang et al. [29] investigated the hot compression behavior and organization evolution of dual phase NiCoFeCrAl0.7 HEA, and the relationship between the flow stress and the thermal compression parameters is established by the constitutive equation. The activation energy of the dual phase HEA was significantly improved up to approximately 379.81 kJ/mol. Sonkusare et al. [30] investigated the compression properties of CoCuFeMnNi HEA under different thermal deformation conditions, and found the strain hardening and strain rate hardening behavior is better than that of pure metal. Tong et al. [31] established the optimum processing interval for Al0.3CoCrFeNi HEA through hot compression, and found that there was dislocation-precipitated phase interaction during high temperature deformation, and the precipitated phase was B2-type NiAl phase. Therefore, thermal deformation may be an effective way to modulate the microstructure of CoCrFeNiZr0.3 HEA.
In this study, the high temperature compression experiment of CoCrFeNiZr0.3 HEA was carried out using a Gleeble-3500 thermal simulation experimental machine, and the flow behavior at high temperature was studied in the range of deformation temperature 950–1100 °C and deformation rate 0.001–1 s−1, including the drawing of a true stress-strain curve, the calculation of constitutive equation, and the construction of thermal working diagram. The effects of different deformation parameters on the grain orientation and size of the alloy and the recrystallization grain distribution were analyzed by EBSD, and the relationship between the microstructure and flow behavior was discussed.

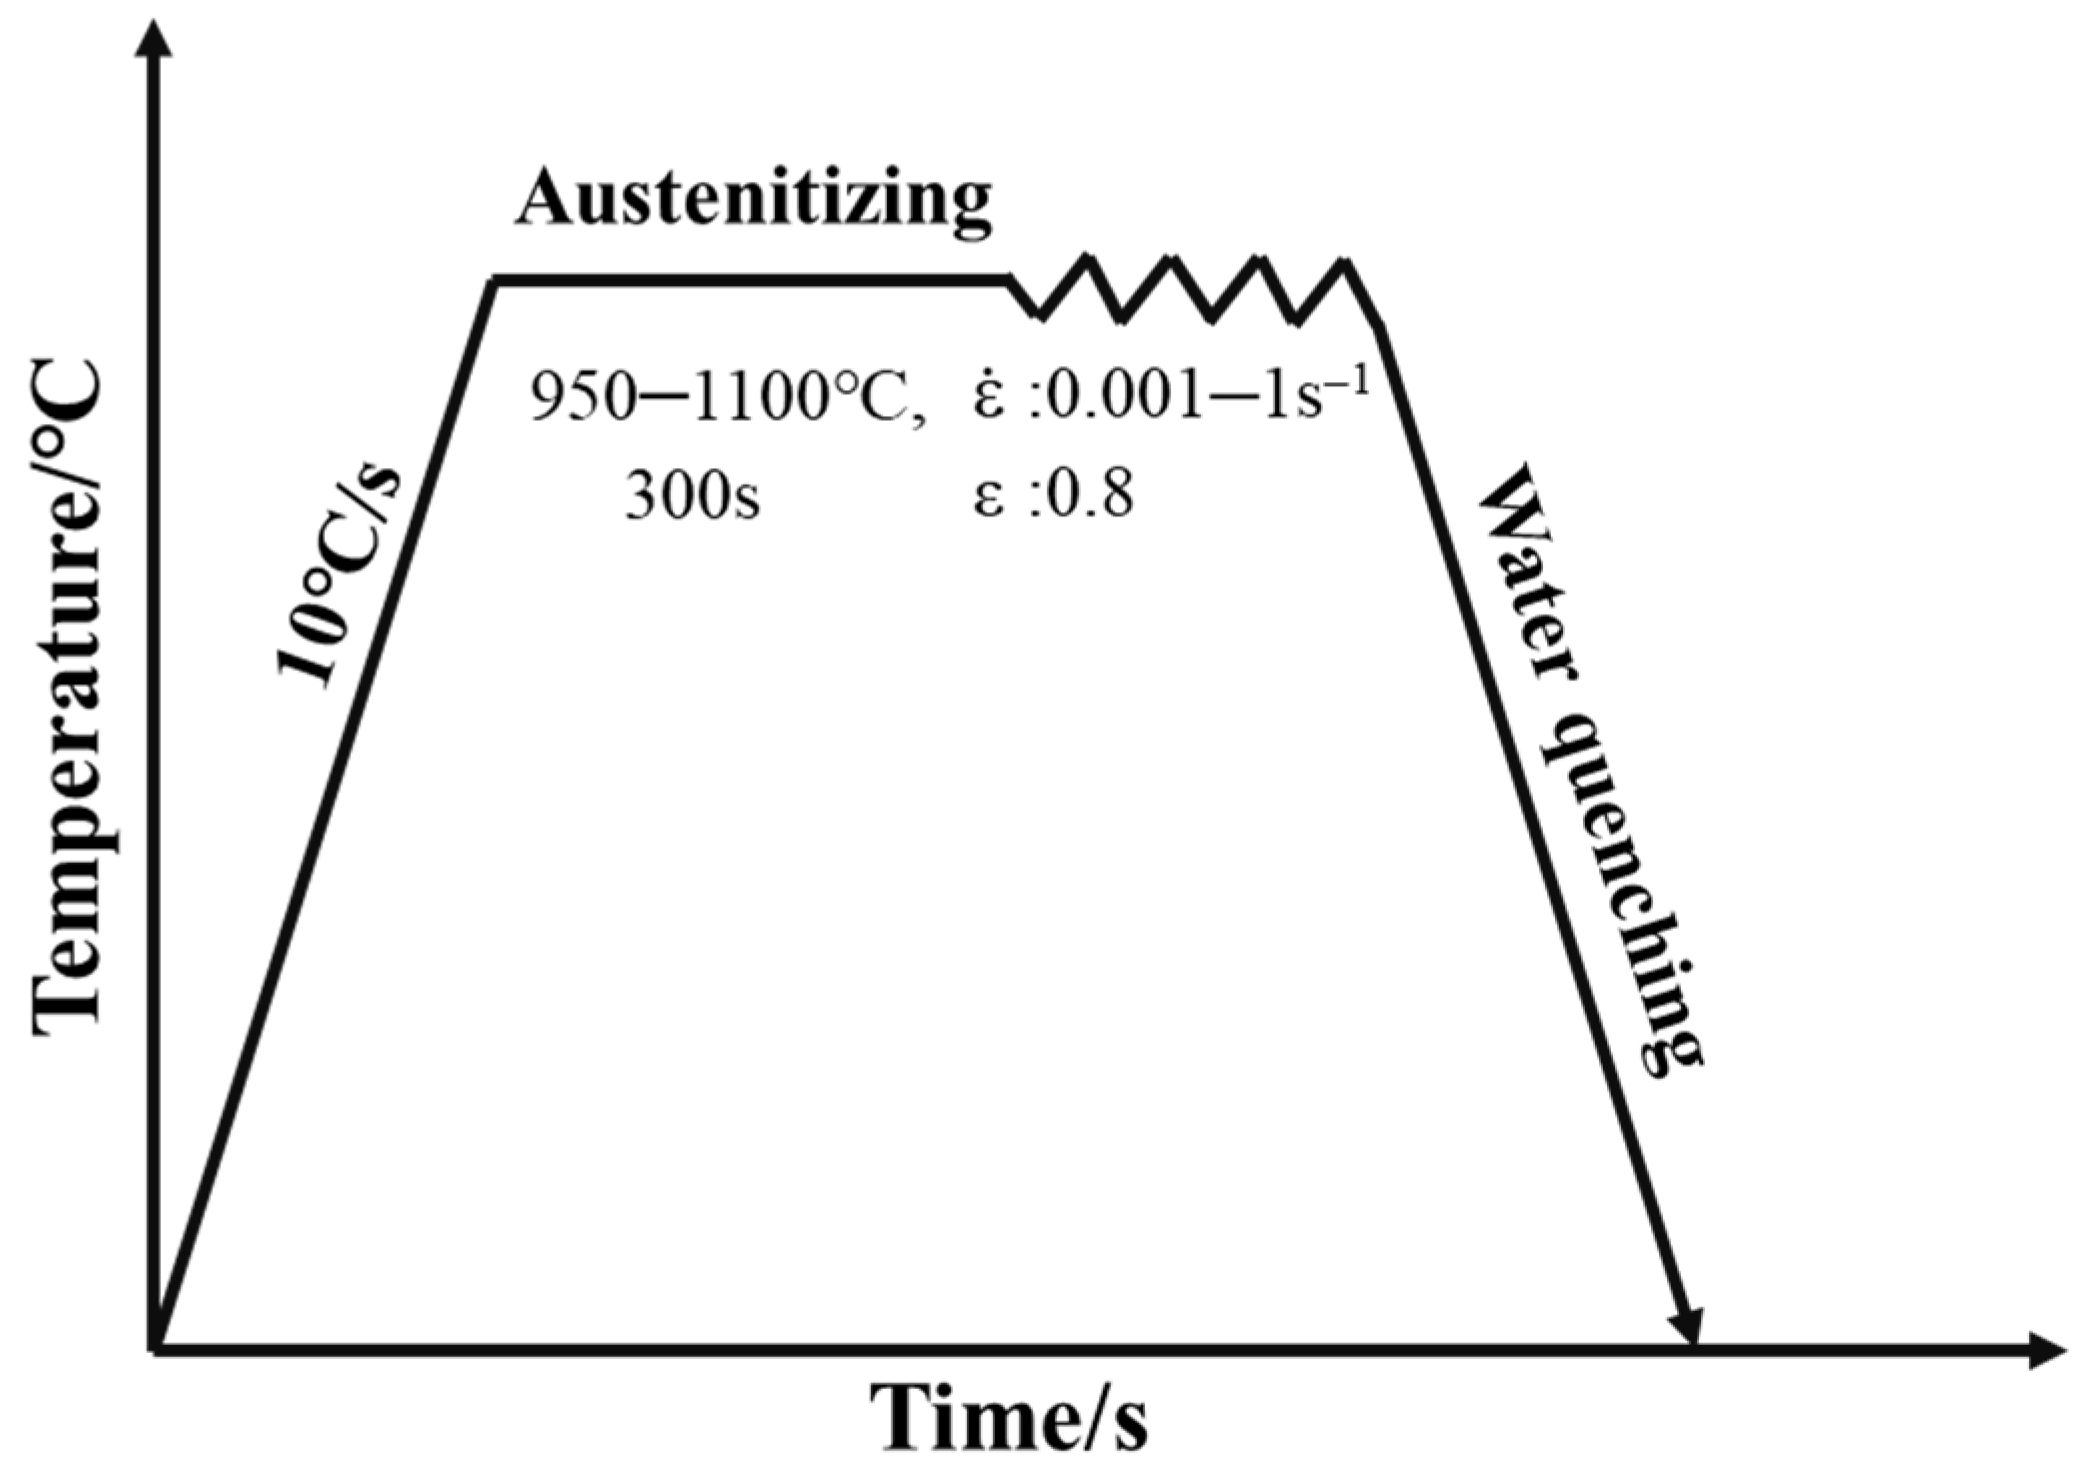
2. Experimental Procedures

In this study, high-purity metal particles of Co, Cr, Ni, Fe, and Zr, with a minimum purity of 99.9%, were utilized to prepare the CoCrFeNiZr0.3 HEA samples. An electronic balance with an accuracy of 0.0001 g (model FA2104N) was employed for weighing purposes, and the quality of each element is shown in Table 1. The experimental material was prepared using a non-consumable vacuum arc melting furnace (model DHL-300). Prior to the experiment, pure Ti particles were melted in a crucible under a high-purity argon atmosphere to ensure the complete removal of oxygen within the furnace and prevent oxidation of the alloy due to oxygen presence. During melting, efforts were made to ensure uniformity in the resulting alloy ingots by stirring and repeatedly turning over the alloy sample in the crucible. A fixed melting current of 400 A and a melting time of 2 min were maintained for each cycle. After 6 repetitions of this process, the required sample was obtained.
Gleeble-3500 (DSI Inc, Albany, NY, USA) is a widely used thermal simulation testing machine in the field of materials science and engineering. It can simulate the hot mechanical processing conditions such as hot rolling, hot extrusion, welding, and forging for various materials to study their mechanical behavior, phase transformation, deformation mechanisms, and microstructural evolution at high temperatures. The present study utilizes a Gleeble-3500 thermal-mechanical simulator to perform hot compression tests in order to investigate the flow behavior and microstructural development of the CoCrFeNiZr0.3 HEA under various deformation conditions.
Circular cylindrical specimens, measuring 6 mm in diameter and 10 mm in length, were extracted from the CoCrFeNiZr0.3 HEA obtained through the melting process. The hot compression tests were conducted at deformation temperatures of 950 °C, 1000 °C, 1050 °C, and 1100 °C with strain rates set at 0.001 s−1, 0.01 s−1, 0.1 s−1, and 1 s−1, respectively; a true strain value of 0.8 was applied to each sample, and the compressed sample was immediately quenched in water until reaching room temperature, the corresponding experimental flow chart is shown in Figure 1. To prevent surface oxidation during heating, the thermal simulation tests were carried out under vacuum conditions. Furthermore, a layer of Ta sheet with a thickness of 0.05 mm was interposed between the specimen and the indenter to minimize bulge effects resulting from end friction.
The surface microstructure of the original samples was analyzed using the Nova Nano 450 Scanning Electron Microscope (SEM, FEI Company, Hillsboro, OR, USA). Additionally, the crystal structure of samples subjected to different deformation parameters was examined utilizing the JEOL JSM-7900F Field Emission Electron Scanning Microscope with Electron Backscatter Diffraction (SEM-EBSD, Japan Electronics Co., LTD, Tokyo, Japan).
The microhardness of the alloy samples was assessed using a KB30S-FA automatic micro-hardness tester (KB Inc, Hochdorf-Assenheim, Germany), with a working load of 300 g and load protection set at 15 s. To ensure measurement accuracy, multiple measurements were averaged. Specifically, 10 points on the sample surface were randomly measured, the maximum and minimum values were excluded, and the average of the remaining 8 points was calculated as the final hardness value.

3. Results and Discussion

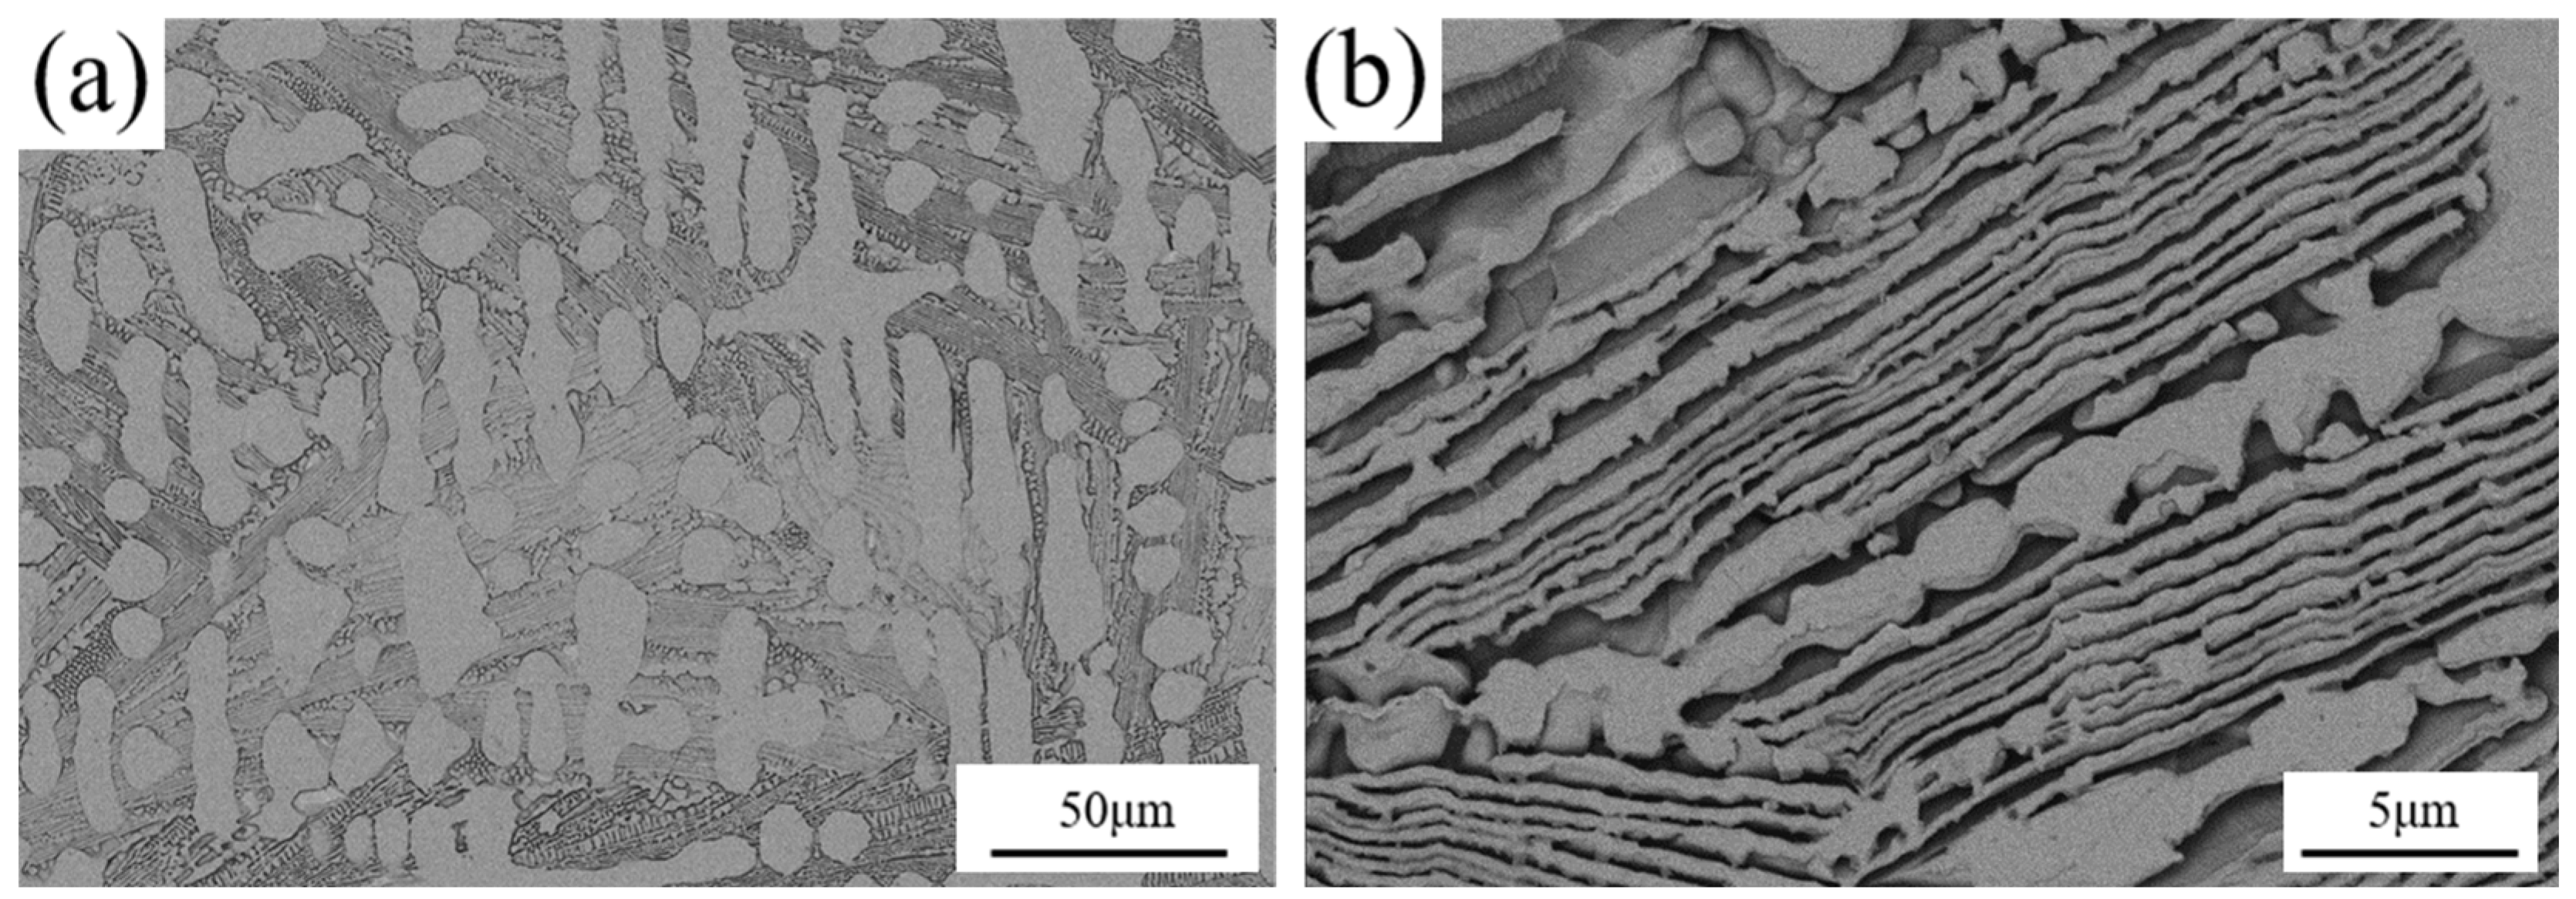
3.1. Microstructural Analysis

Figure 2 shows the low and high magnification SEM backscattered electron images of CoCrFeNiZr0.3 alloy. The as-cast CoCrFeNiZr0.3 HEA exhibits a typical two-phase organization, with the dendrites as FCC solid solution, whose average size is between 10–60 μm. In addition, a layered structure of FCC and Laves phases was observed in the inter-dendritic region (Figure 2b), with the lamellae spacing reaching the submicron level.

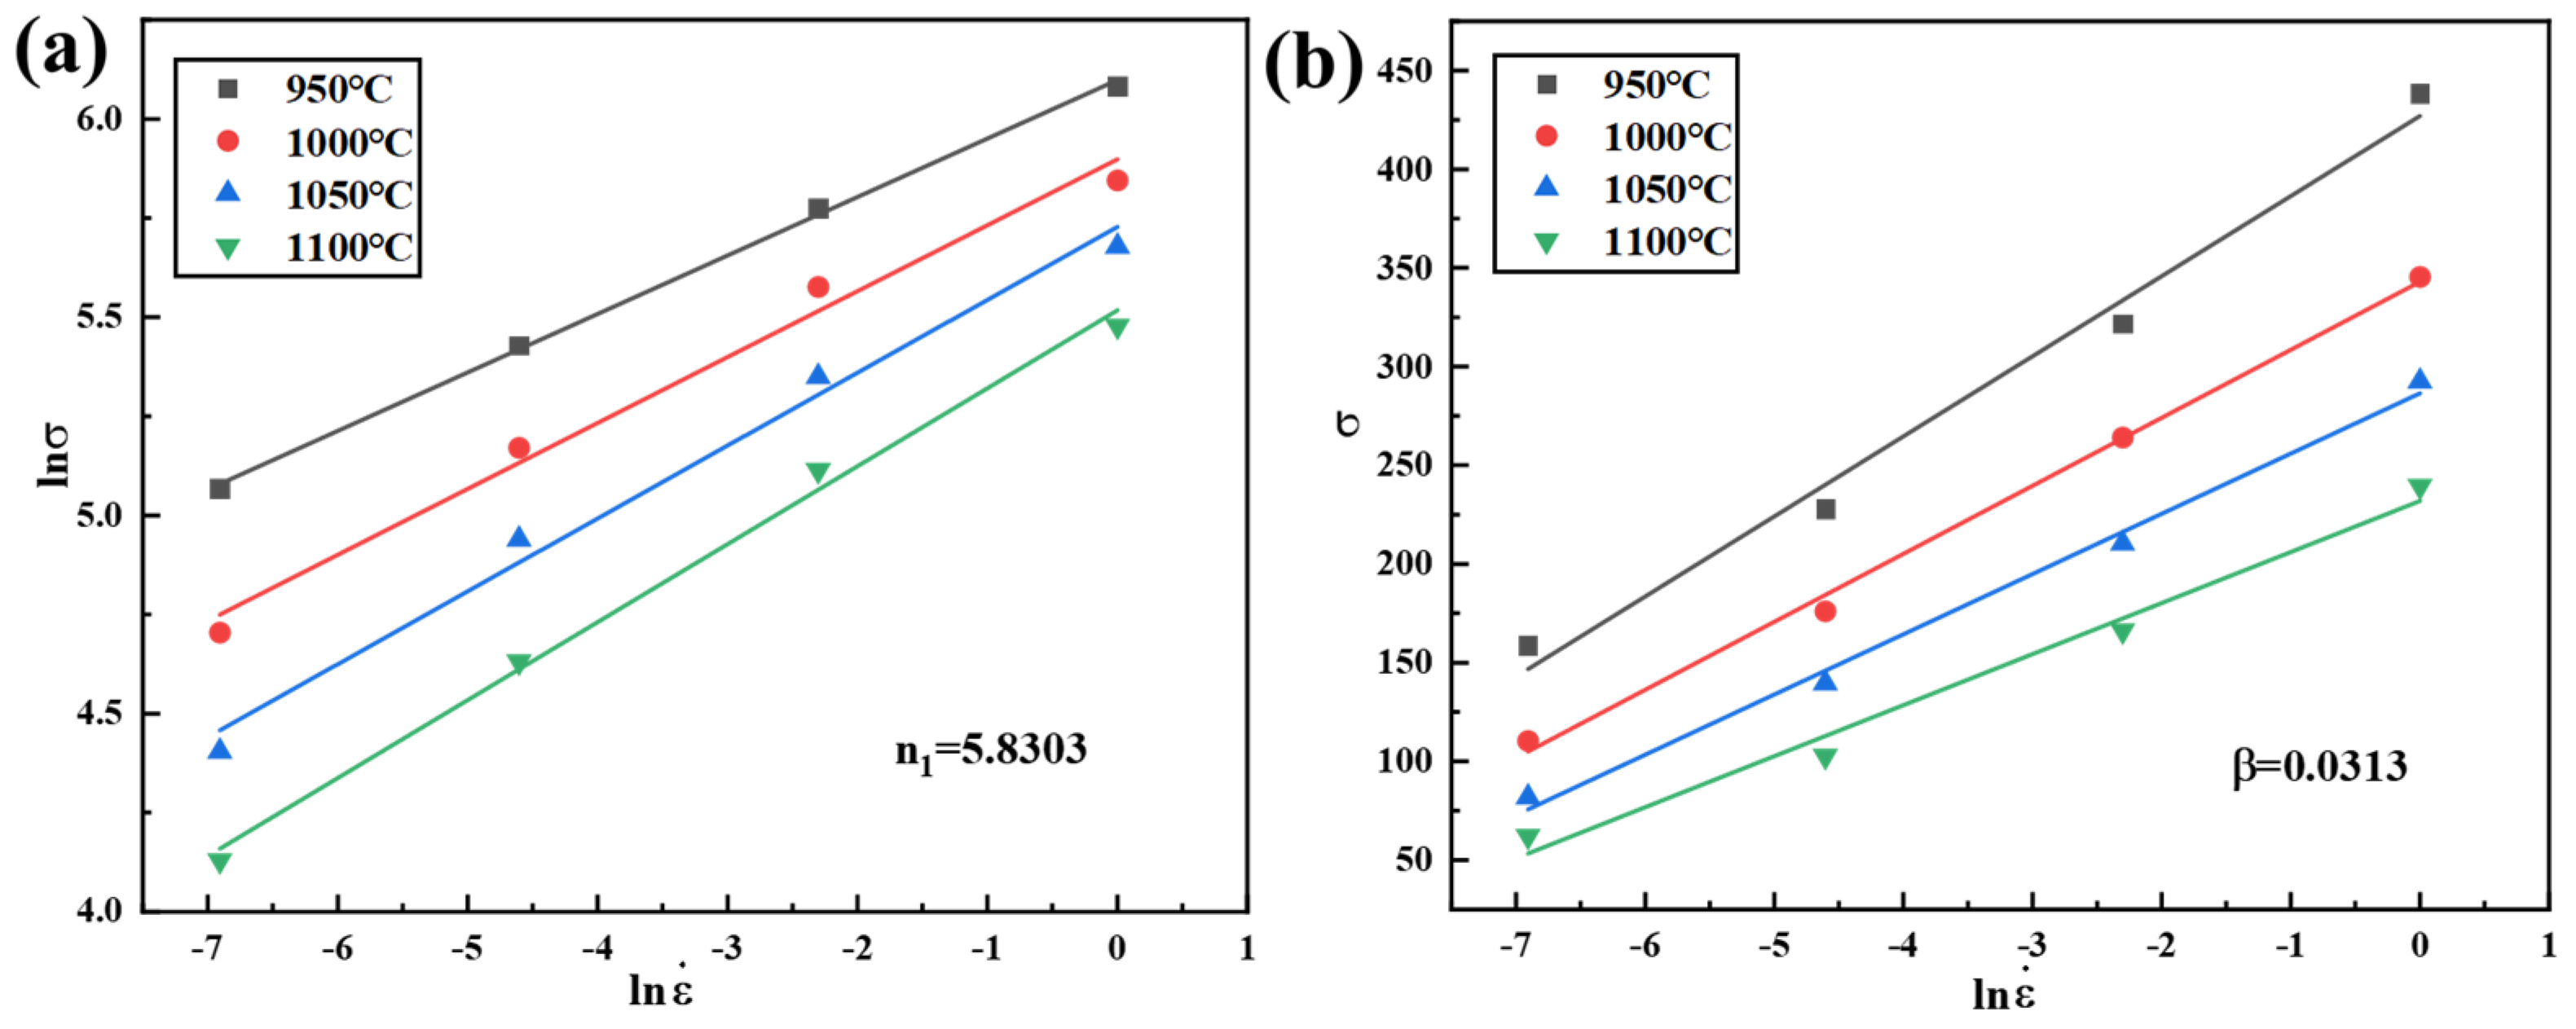
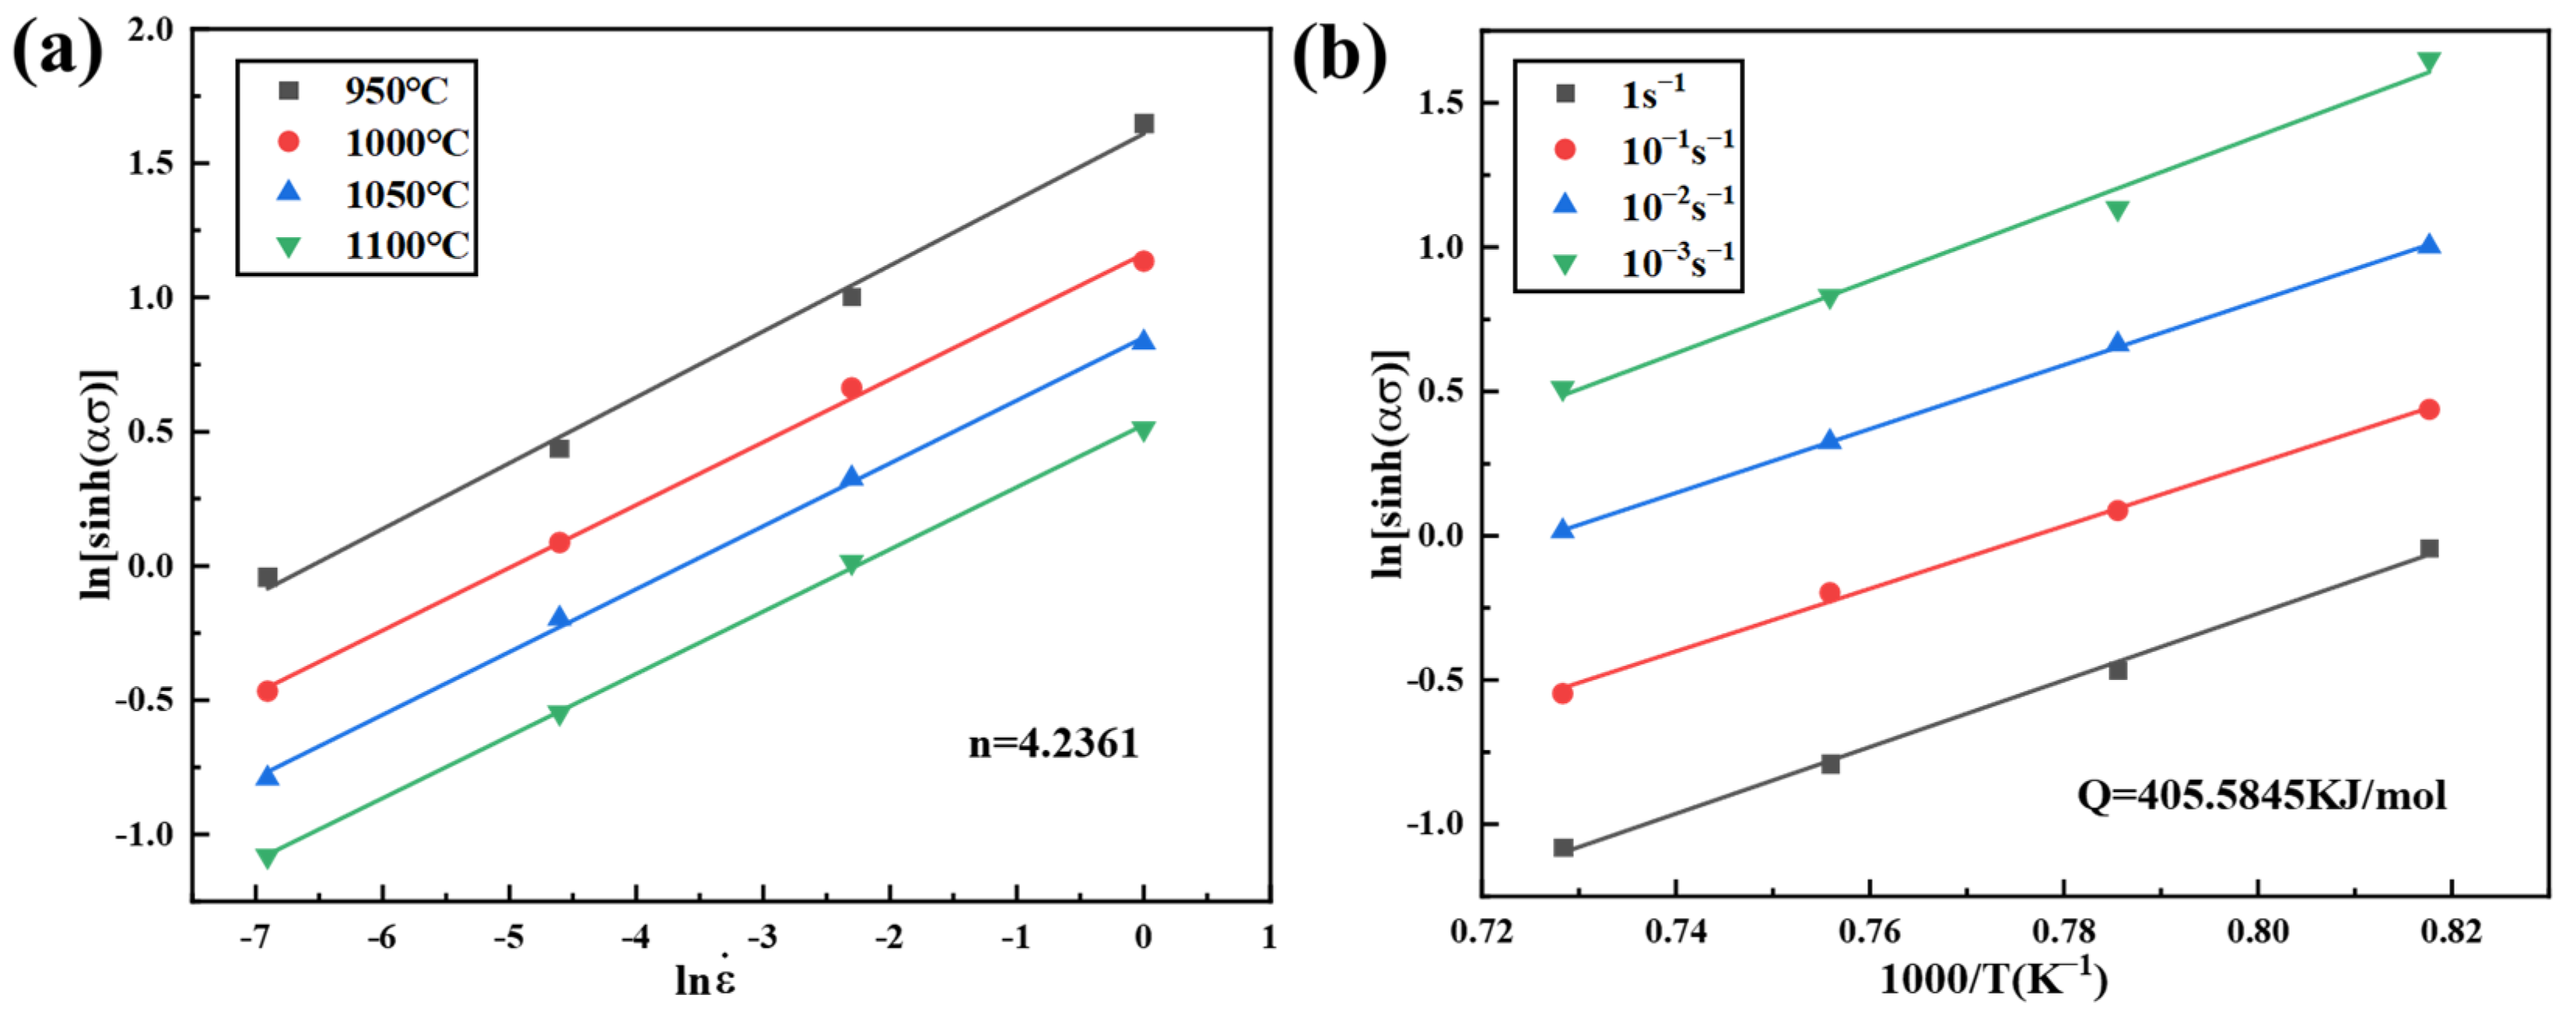
3.2. Hot Deformation Behaviors

Figure 3 presents the true stress-true strain curves of CoCrFeNiZr0.3 HEA at different deformation rates, with deformation temperatures of 950 °C, 1000 °C, 1050 °C, and 1100 °C, respectively, and a true strain ε = 0.8. It can be observed from Figure 3 that the shapes of the true stress-true strain curves for CoCrFeNiZr0.3 HEA are approximately similar. Initially, during the elastic deformation stage of the HEA, the true stress-true strain curve resembles a straight line. Due to the dominance of the work hardening effect during alloy deformation, the flow stress quickly rises to its peak.
Subsequently, as the flow stress reaches its peak value and with further increase in true strain, there is a gradual decrease in flow stress as dynamic recrystallization-based dynamic softening begins to occur within the alloy. This emergence of dynamic softening causes work hardening to lose its dominant position and leads to a transition in deformation resistance from an initially hardened state to a softened state. Ultimately, as processing hardening and dynamic softening compete against each other towards completion of the deformation process stages, their effects offset one another leading to stabilization in flow stress values.
Figure 4a illustrates that the flow stress value of CoCrFeNiZr0.3 HEA is positively correlated with the strain rate at a constant deformation temperature. This is attributed to the rapid proliferation of dislocations at high strain rates, which hinders dynamic softening. Conversely, lower strain rates allow sufficient time for dynamic recrystallization, smooth nucleation and growth of grains, resulting in lower flow stress values and easier macroscopic deformation of the alloy. And from Figure 4b, when the strain rate is certain, the flow stress value of CoCrFeNiZr0.3 HEA is negatively correlated with the deformation temperature, the alloy is at a higher deformation temperature, and the value of flow stress is lower. This is because the higher deformation temperature accelerates the motion rate of atoms and reduces the hindrance of dislocation motion and interfacial sliding, thus allowing the dynamic recrystallization process to proceed smoothly [32].
In order to further describe the thermal deformation behavior of CoCrFeNiZr0.3 HEA, the thermal deformation constitutive equations of CoCrFeNiZr0.3 alloy is constructed based on Equation (1) [33], where ε ˙ is the strain rate (s−1), σ is the flow stress (MPa), T is the absolute temperature (K), Q is the deformation activation energy (kJ/mol), R is the gas constant (=8.314 J/mol·k), A is the structural factor, n1 is the stress index, α is the stress level parameter (mm2/N), and β is the material constant.
ε ˙ = A sin h ( α σ ) n 1 exp Q RT
The parameter σ can be represented as the steady-state stress, peak stress, or flow stress corresponding to a specified strain variable. In this study, the peak stress in the true stress-strain curve is utilized for constructing a constitutive equation (see Table 2). The corresponding data are substituted into Equations (2) and (3), and the fitting curves of ln ε ˙ -lnσ and ln ε ˙ -σ are drawn by linear regression processing according to the least squares method, as shown in Figure 5. From Equations (2) and (3), it can be observed that the reciprocal average values of the slopes of lines (a) and (b) in Figure 5 are n1 = 5.8303 and β = 0.0313, respectively, with α = β/n1 = 0.0054 calculated from Equation (4)
ln ε ˙ = ln ( A ) + n 1 ln σ Q RT
ln ε ˙ = ln ( A ) + β σ Q RT
α = β n 1
When the peak flow stress is determined, the deformation temperature and strain rate of the CoCrFeNiZr0.3 HEA are analyzed using linear regression processing based on the least squares method. The coordinates of ln[sinh(ασ)]-ln ε ˙ and 1000/T-ln[sinh(ασ)] are then plotted by linear regression processing, as depicted in Figure 6. According to Equations (5)–(7), in Figure 6a, the reciprocal average of the slope of the line is n = 4.6321; in Figure 6b, the average value of the slope of the line is k = 11.5162 and Q = Rnk = 405.5845 kJ/mol.
Q = R δ ln ε ˙ δ ln [ sin h ( α σ ) ] T δ ln [ sin h ( α σ ) ] δ ( 1000 T ) ε ˙ = Rnk
thereinto:
n = δ ln ε ˙ δ ln [ sin h ( α σ ) ] T
k = δ ln [ sin h ( α σ ) ] δ ( 1000 T ) ε ˙
The Zener–Hollomon parameter (Z parameter) is a pivotal factor in high temperature creep mechanics for characterizing the deformation behavior of materials at elevated temperatures. It integrates the creep rate, temperature, activation energy, and other factors to reflect the material’s sensitivity to creep under specific temperature and stress conditions. The high temperature constitutive equation based on this parameter can be utilized to predict the plastic deformation behavior of materials at high temperatures, particularly their creep and fatigue life properties under long-term loading. Substituting the parameters of different deformation conditions and the deformation activation energy Q into Equation (8) yields the corresponding natural logarithm (ln) value for Z.
By substituting the calculated lnZ and its corresponding flow stress “σ” into Equation (9), a coordinate plot of ln[sinh(ασ)]-lnZ is generated through linear regression using the least squares method, as shown in Figure 7. From Equation (9), it can be observed that the intercept of the fitted line in Figure 7 is lnA = 33.2653, A = 2.7986 × 10¹⁴. Furthermore, it can be seen from Figure 7 that there is a correlation coefficient of 0.9976 between ln[sinh(ασ)] and lnZ, indicating a strong linear relationship between them; thus confirming that CoCrFeNiZr0.3 HEA’s flow stress equation under thermal deformation conforms to Zener–Hollomon parameter’s hyperbolic sinusoidal function form.
lnZ = ln ε ˙ + Q RT
lnZ = ln A + nln [ sin h ( α σ ) ]
Through the above analysis and calculation, all the parameters of the Arrhenius equation of the hyperbolic sinusoidal function of CoCrFeNiZr0.3 HEA are obtained. Therefore, the constitutive equation between flow stress, deformation temperature, and strain rate at a deformation temperature of 950–1100 °C and a strain rate of 0.001–1 s−1 is:
ε ˙ = 2.7986 × 10 14 sin h ( 0.0054 σ ) 5.8303 exp ( 405585 RT )
The thermal processing map of the material is based on the Dynamic Material Modeling (DMM) model and integrates the instability diagram with the power dissipation diagram [34,35]. The DMM model is utilized to characterize the internal microstructure evolution and energy conversion of materials during thermal deformation. The thermal working map based on the DMM model is extensively employed in investigating the thermal deformation behavior of alloys. Therefore, this paper employs the DMM model to construct a hot working diagram, which facilitates a detailed understanding of the relationship between deformation conditions, deformation mechanism, and deformation microstructure. Simultaneously, the figure’s dangerous zone and safe zone can be utilized for selecting appropriate deformation process parameters to enhance material processing performance.
Figure 8 illustrates the thermal processing map for CoCrFeNiZr0.3 HEA at strains ranging from 0.2 to 0.7. In this figure, contour lines represent the power dissipation factor η; higher values of η indicate greater energy expenditure driving microstructural changes within the material. The shaded areas in the diagram denote instability regions for this alloy, with darker shades indicating a higher likelihood of instability, suggesting phenomena such as cracking and particle fragmentation are more likely to occur within these specific parameter intervals. Therefore, these areas should be avoided during material processing. The trends of the power dissipation factor and the instability region are nearly identical across strains of 0.4 to 0.7, as shown in Figure 8. Furthermore, it is evident that the area of the instability region increases with higher strain levels, indicating an increased susceptibility to detrimental deformations as deformation level grows.
It can be observed from Figure 8 that the instability shadow region is mainly concentrated in the high speed and medium temperature range. The processing interval with a temperature of 960–1090 °C and a strain rate of 10−0.7–1 s−1 should be avoided, while the remaining areas are considered safe for processing. However, at low temperatures and low rates, the power dissipation factor is lower (8–36%), indicating that this area should also be avoided during thermal deformation due to reduced thermal movement between atoms and dislocation migration ability, leading to worsened workability of the material. Therefore, the optimal thermal deformation process parameters for CoCrFeNiZr0.3 HEA are determined as follows: deformation temperature is 1000–1100 °C, strain rate is 0.01–0.1 s−1.

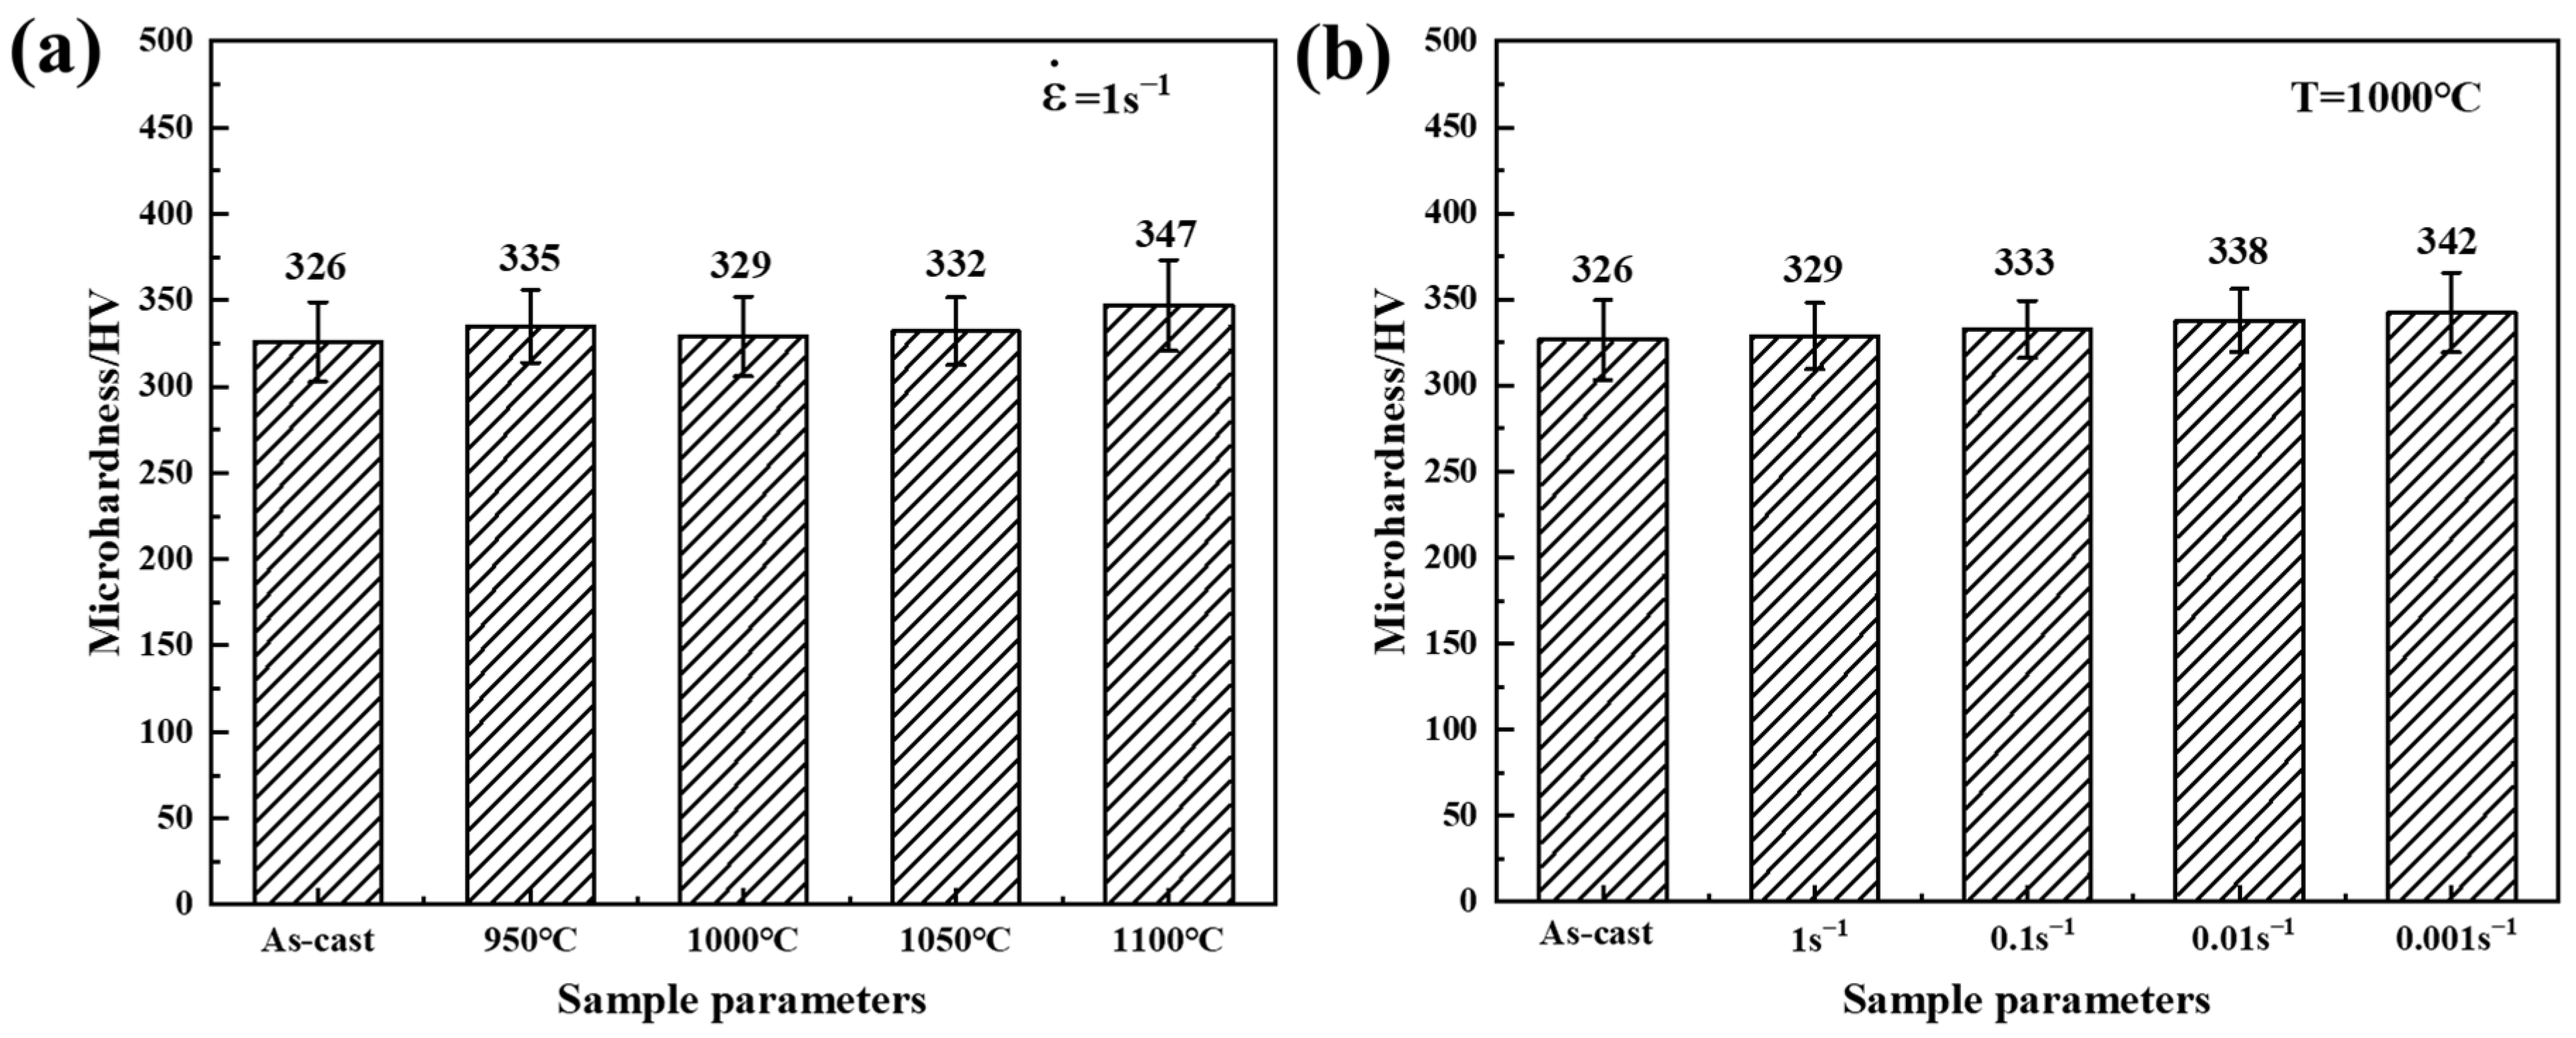
3.3. Hardness Analysis
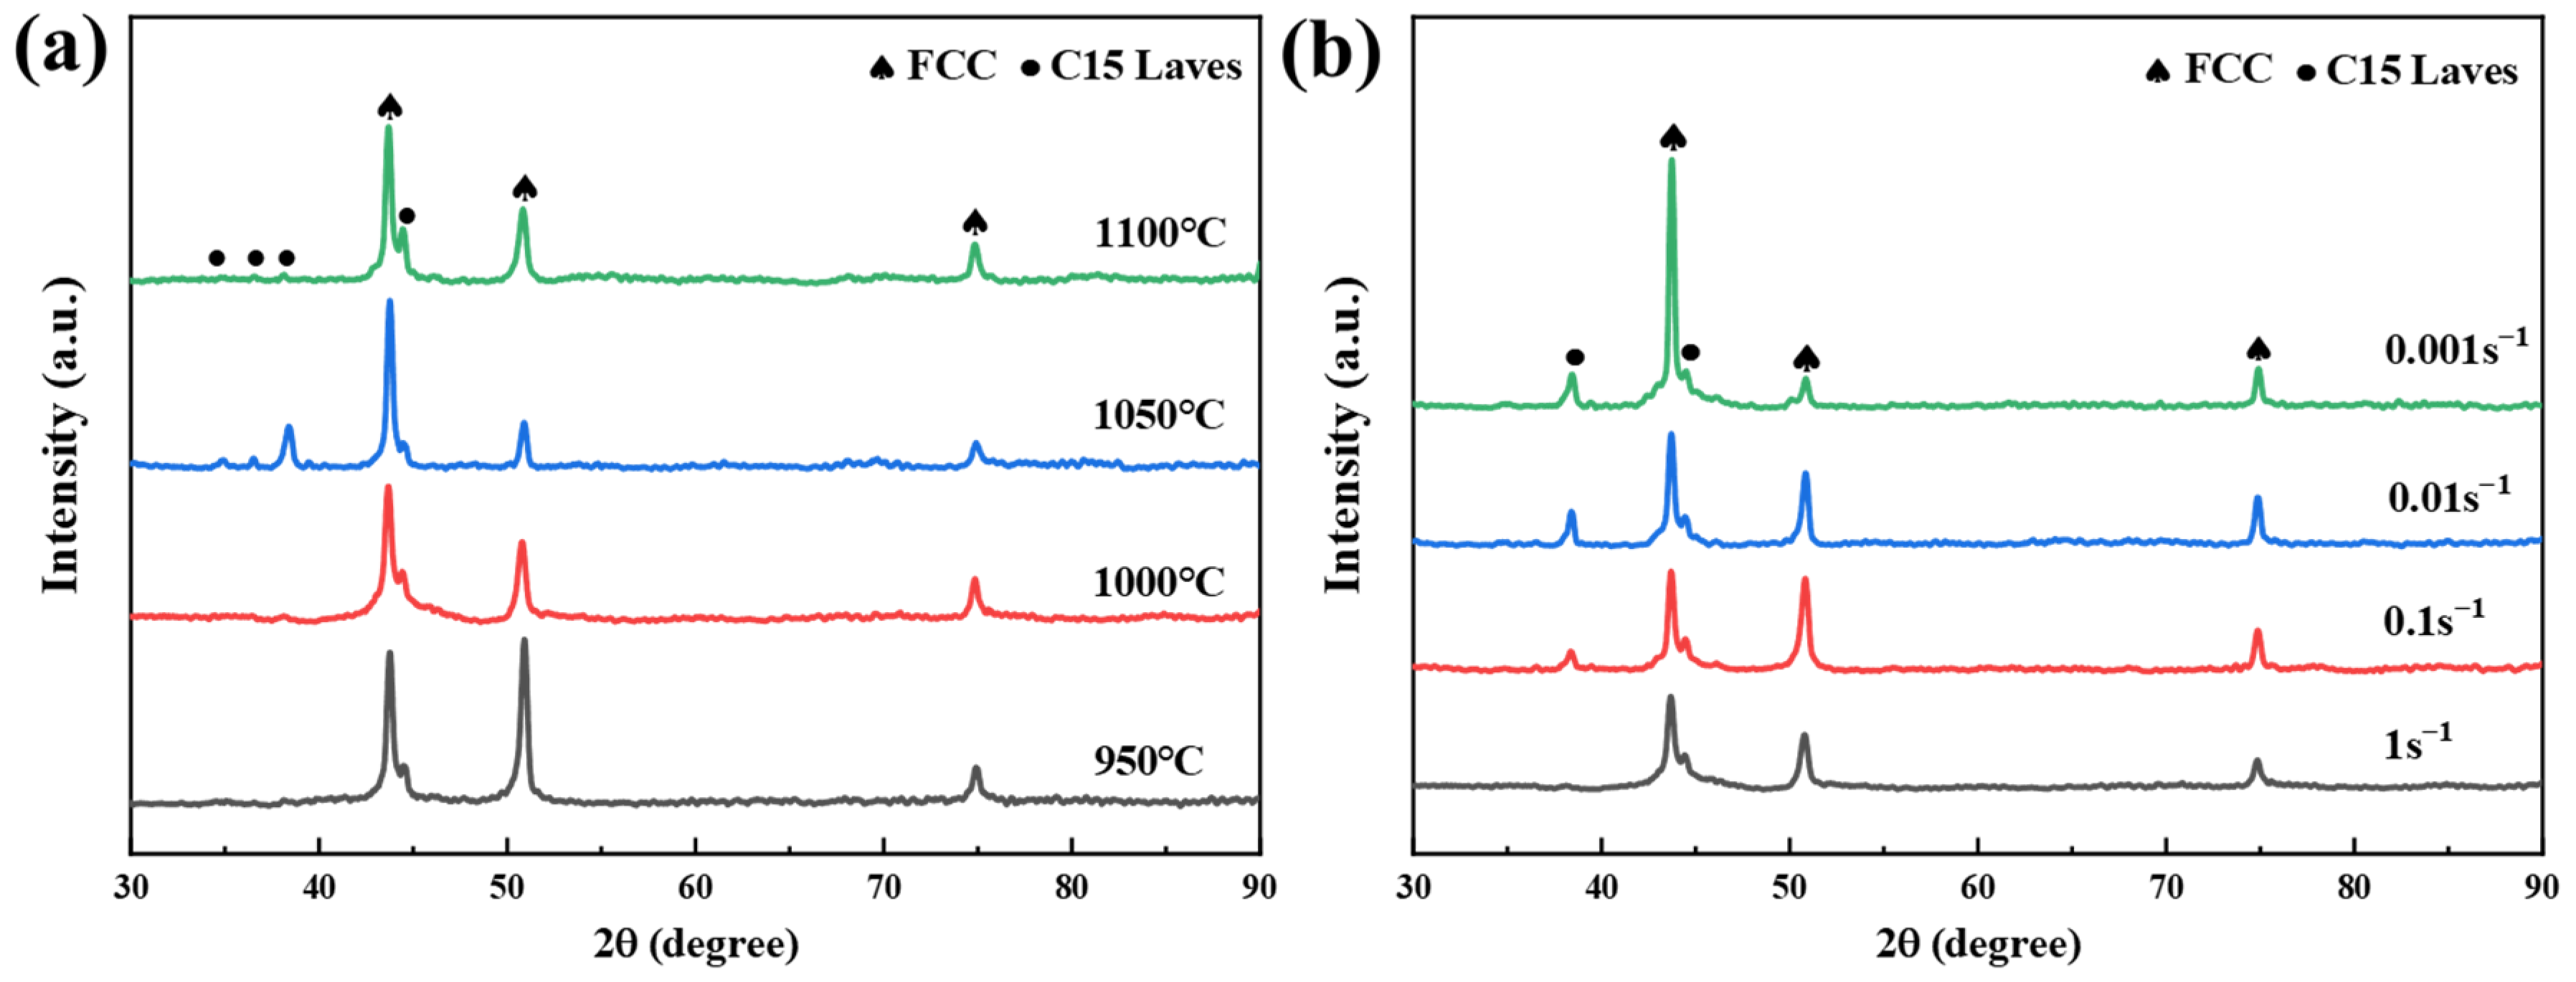
Figure 9 shows the relationship between hardness values and deformation parameters of CoCrFeNiZr0.3 HEA. It is obvious from Figure 9a that the hardness of CoCrFeNiZr0.3 HEA is greater than that of the as-cast alloy after deformation at 950–1100 °C. Among them, the hardness of the alloy reaches the highest value of 347 HV at 1100 °C, but the change of hardness does not show a certain regularity. However, at 1000 °C (Figure 9b), the hardness of the alloys increases as the strain rate decreases, and the hardness is greater than that of the as-cast alloys, which may be related to the growth of the Laves phase. In general, the strain rate and strain temperature have little effect on the hardness of the alloy, and maintain good hardness stability during the hot deformation process.

3.4. XRD Analysis

Figure 10 shows the XRD diffraction patterns of CoCrFeNiZr0.3 HEA under different hot deformation conditions. The results indicate that the peak positions do not shift with varying hot deformation conditions, and there is no significant shift in different temperature and strain rate deformation conditions, only changes in intensity. This suggests that the structure of the alloy does not change before and after hot deformation, and CoCrFeNiZr0.3 HEA still consists of (FCC + Laves) phases, indicating good thermal stability of the alloy.

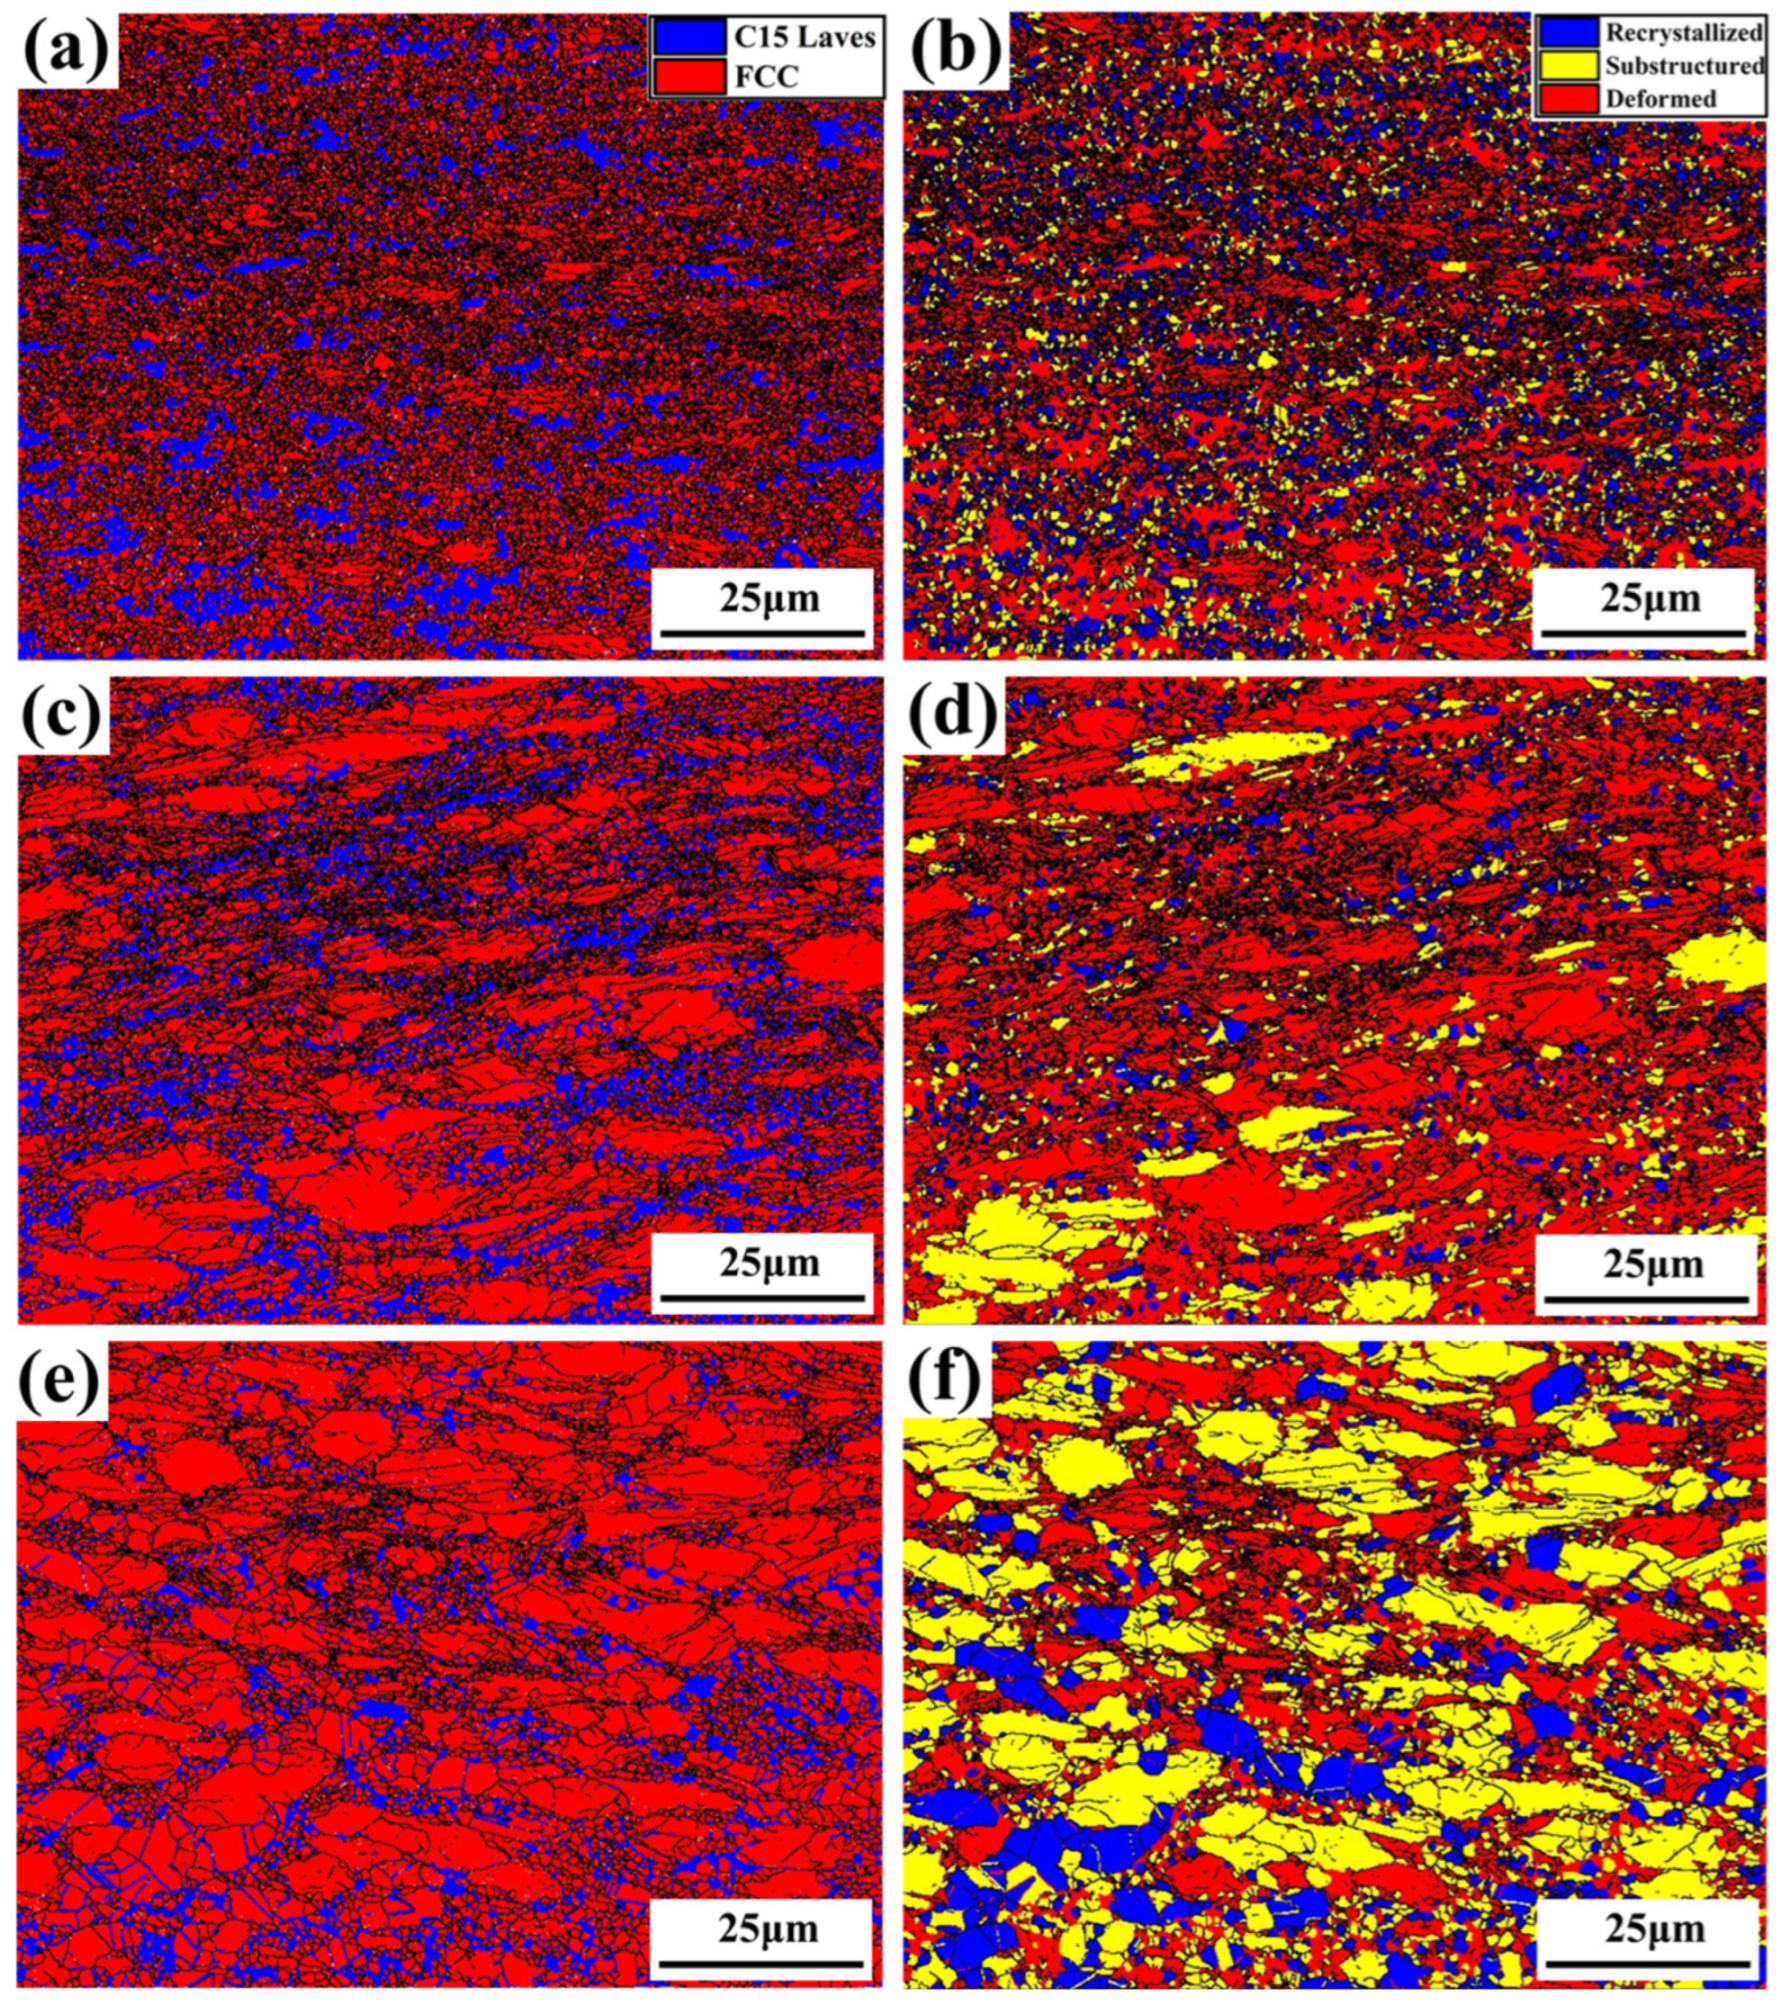
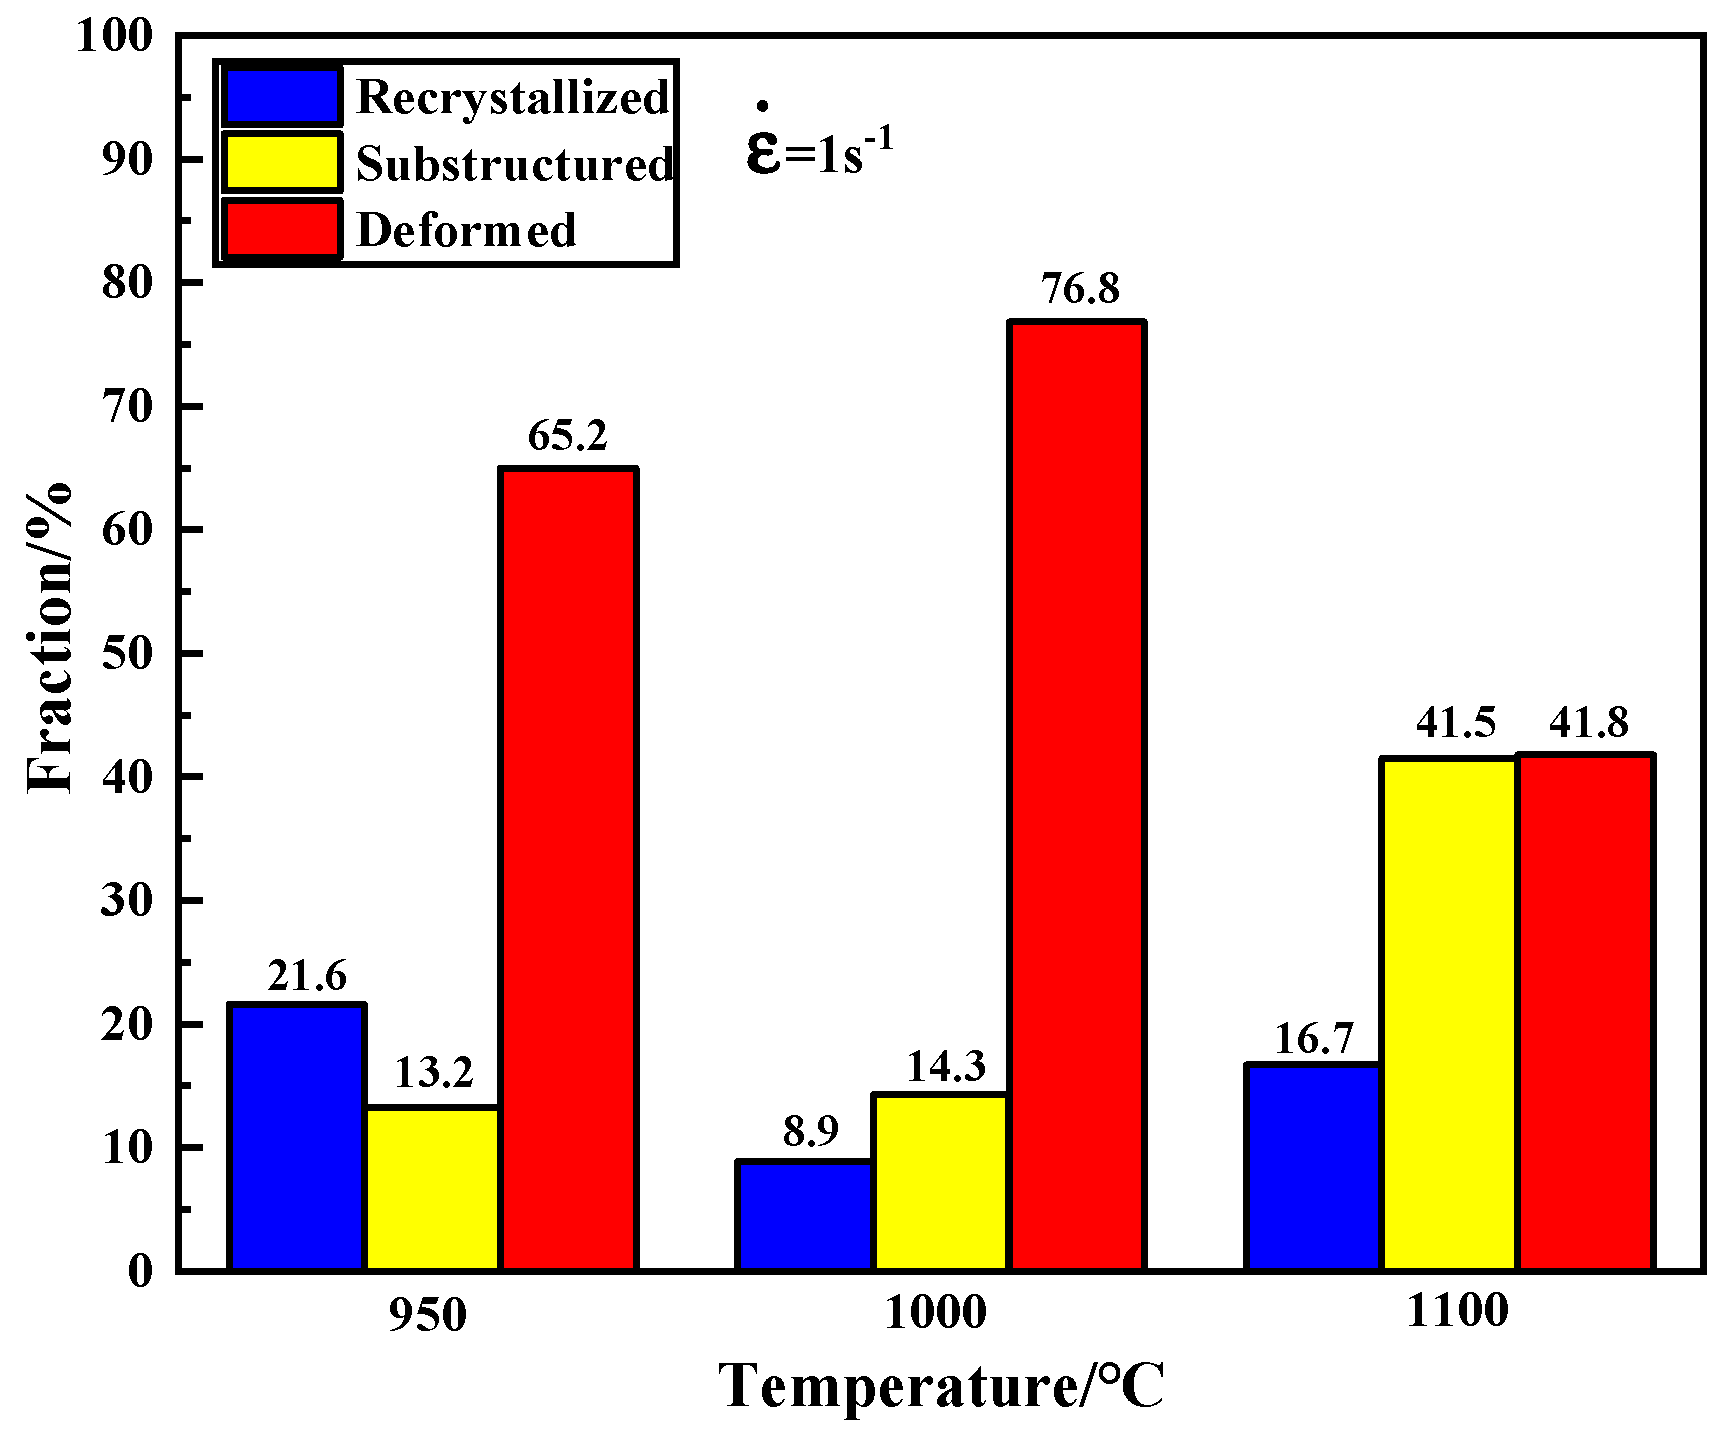
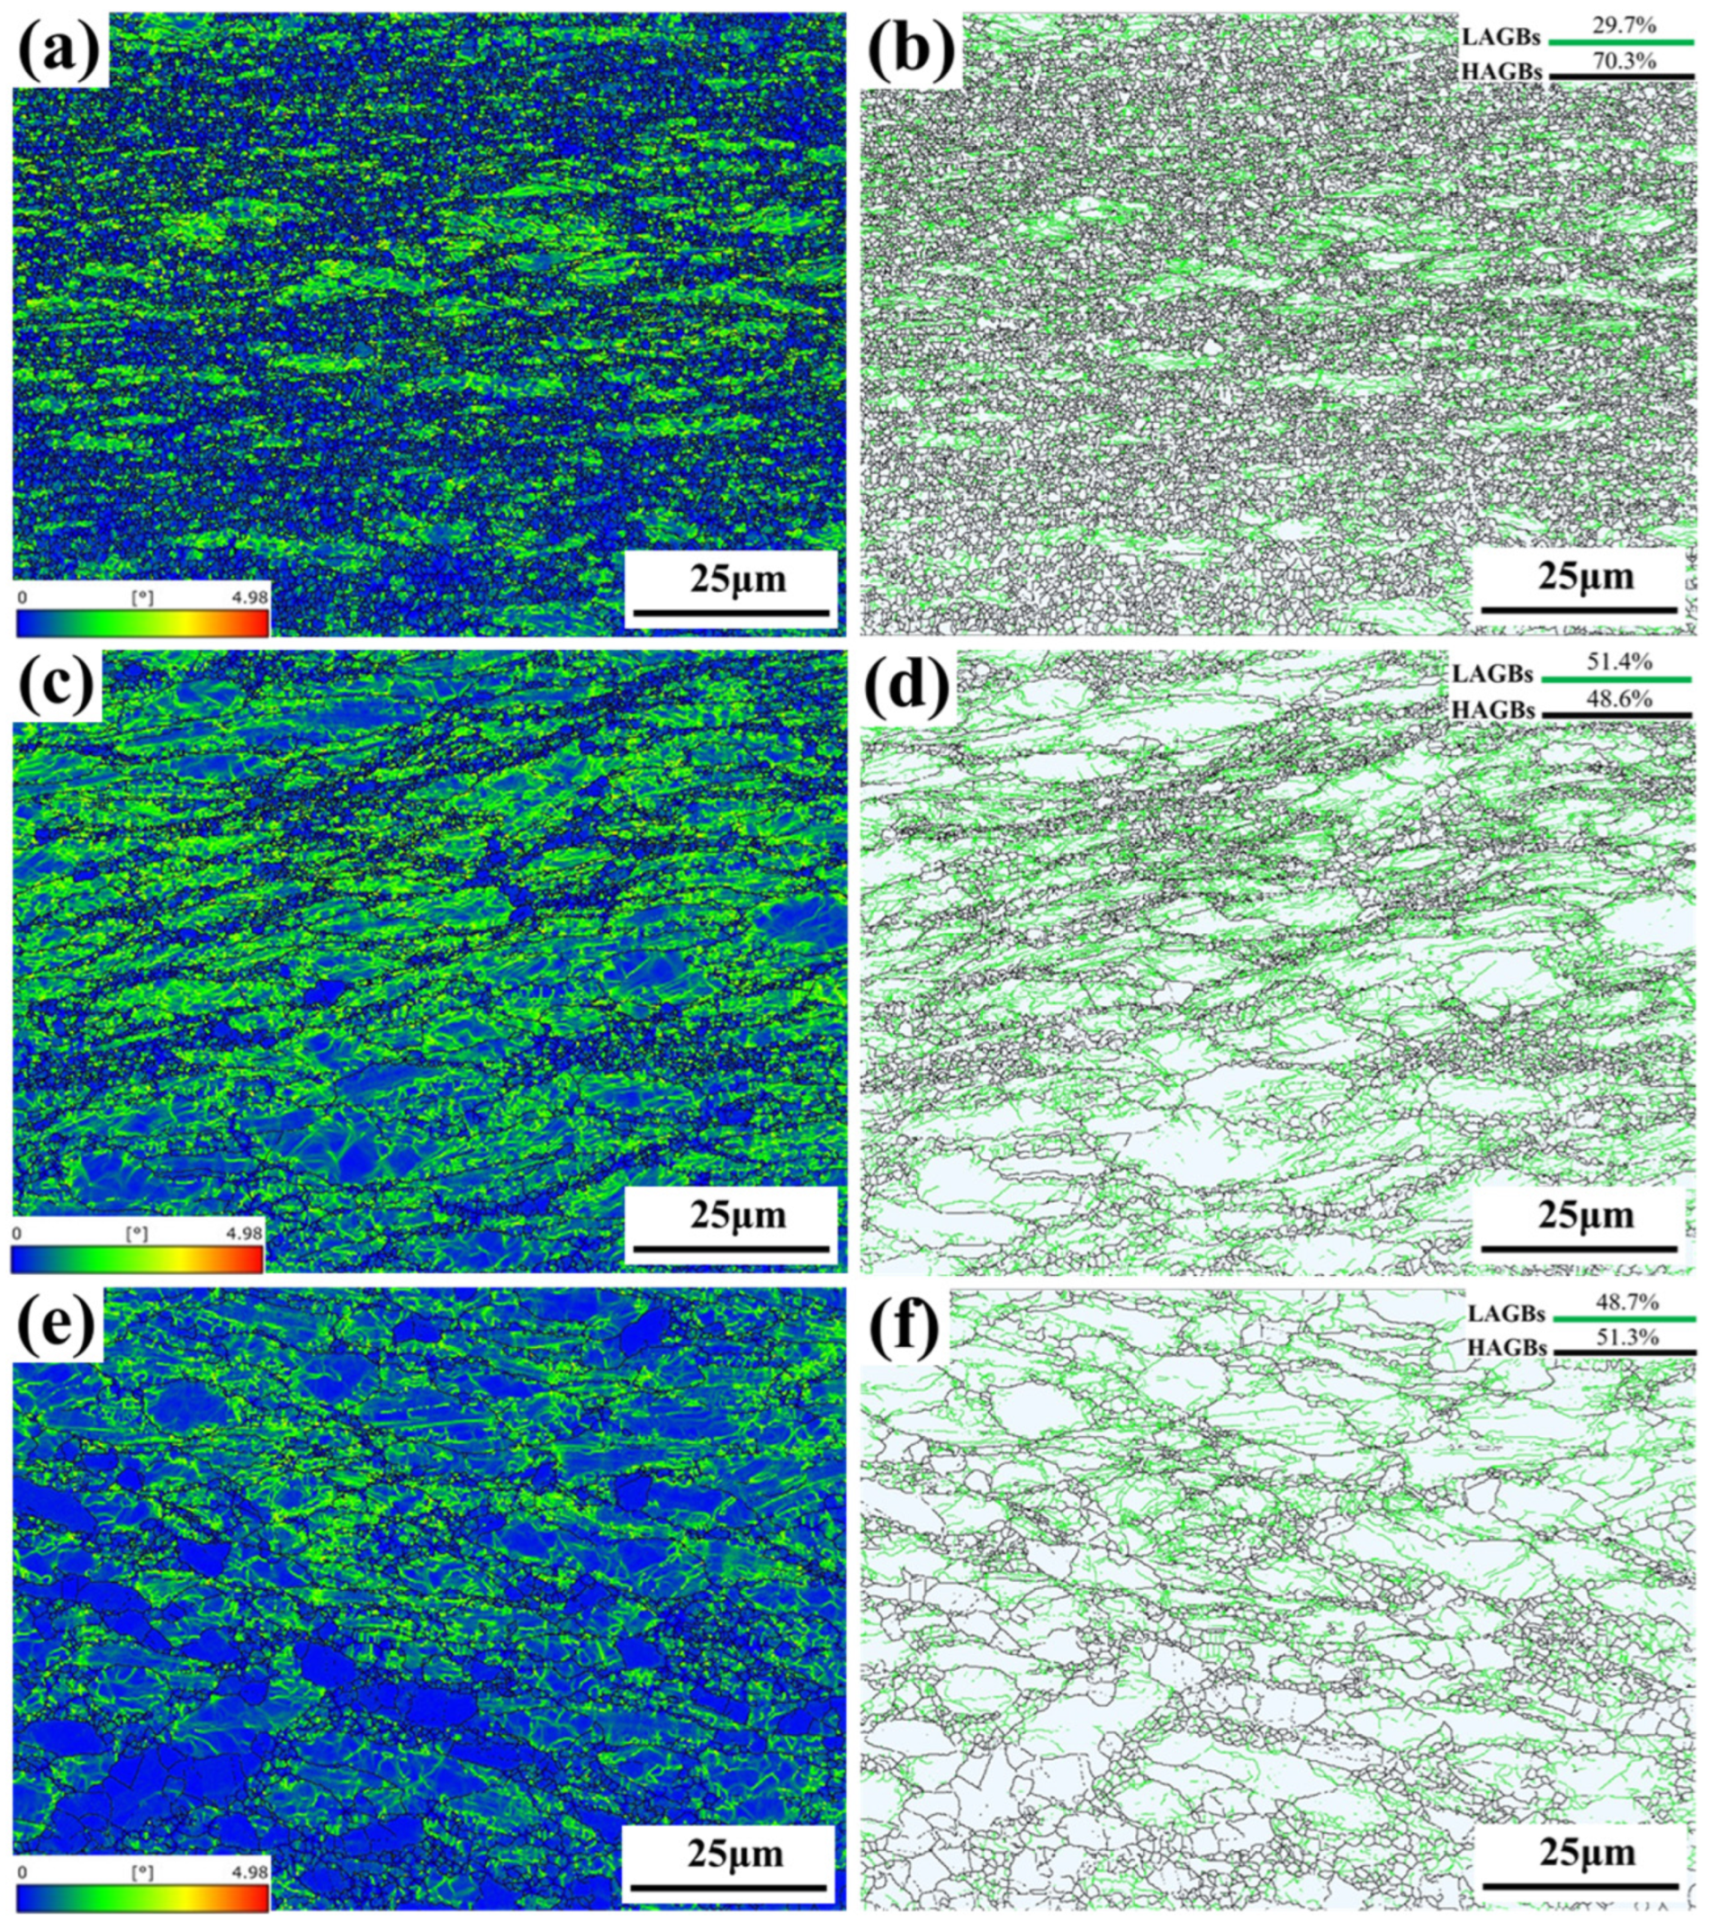
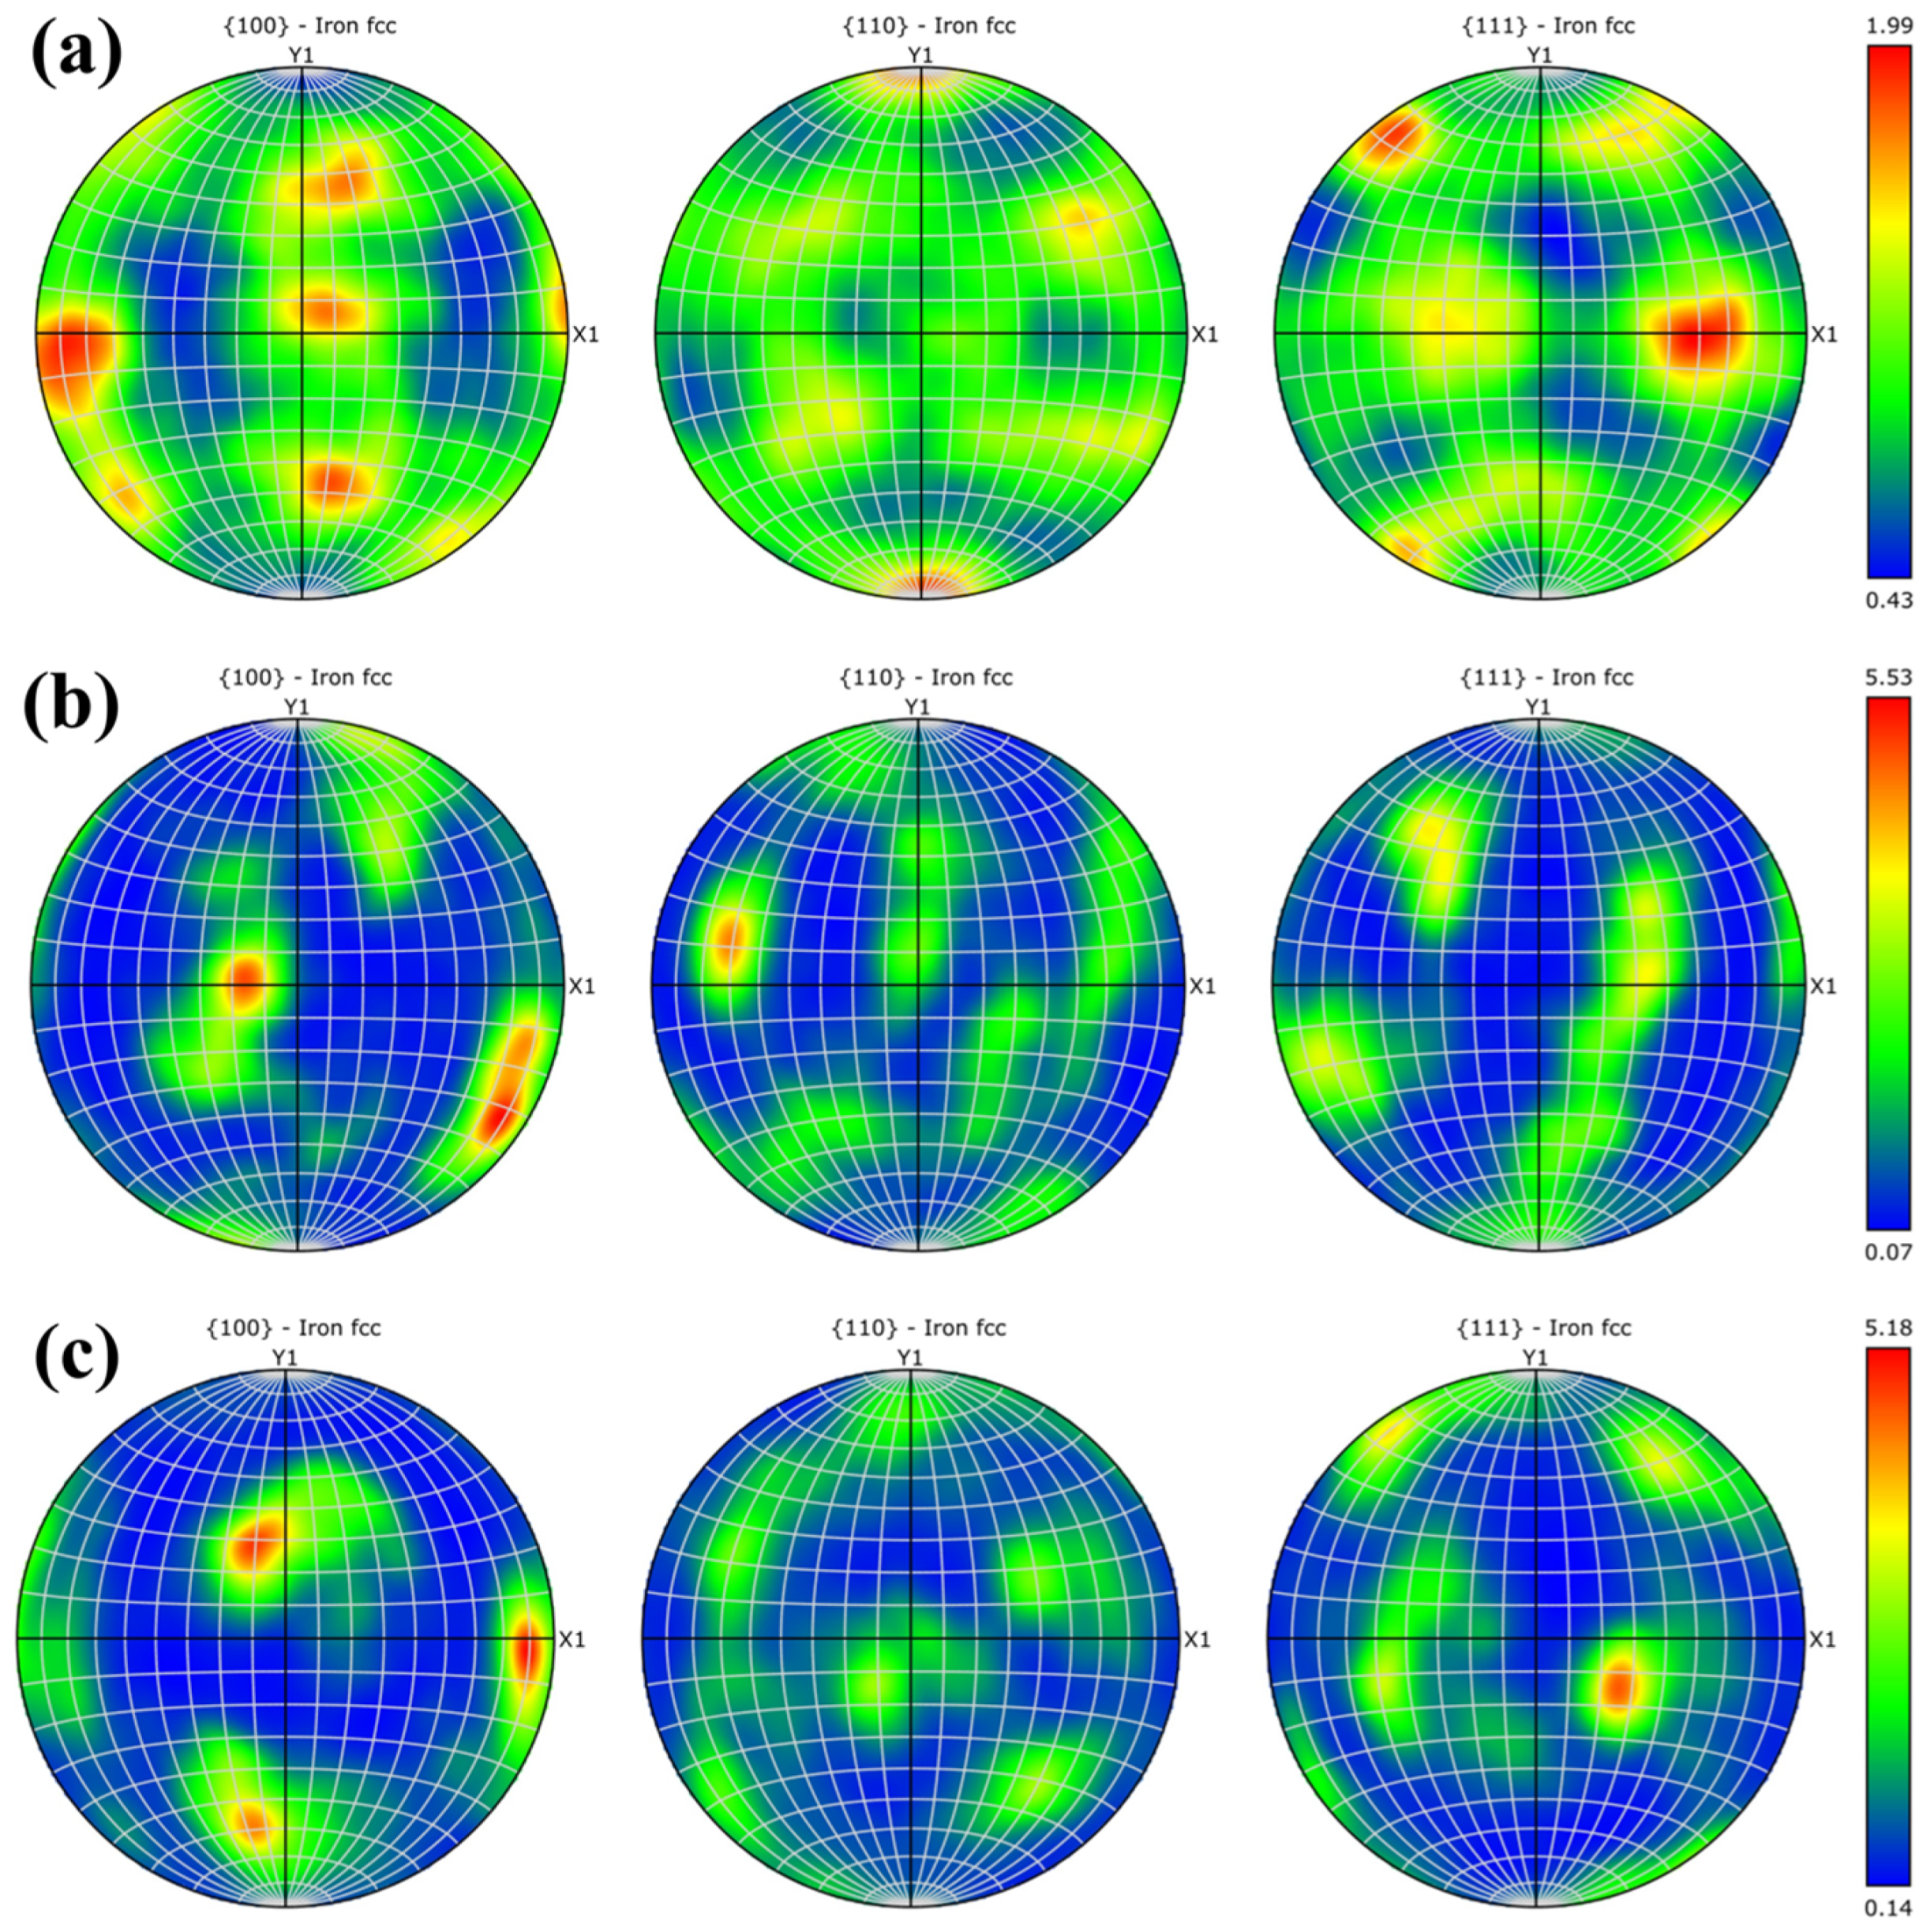
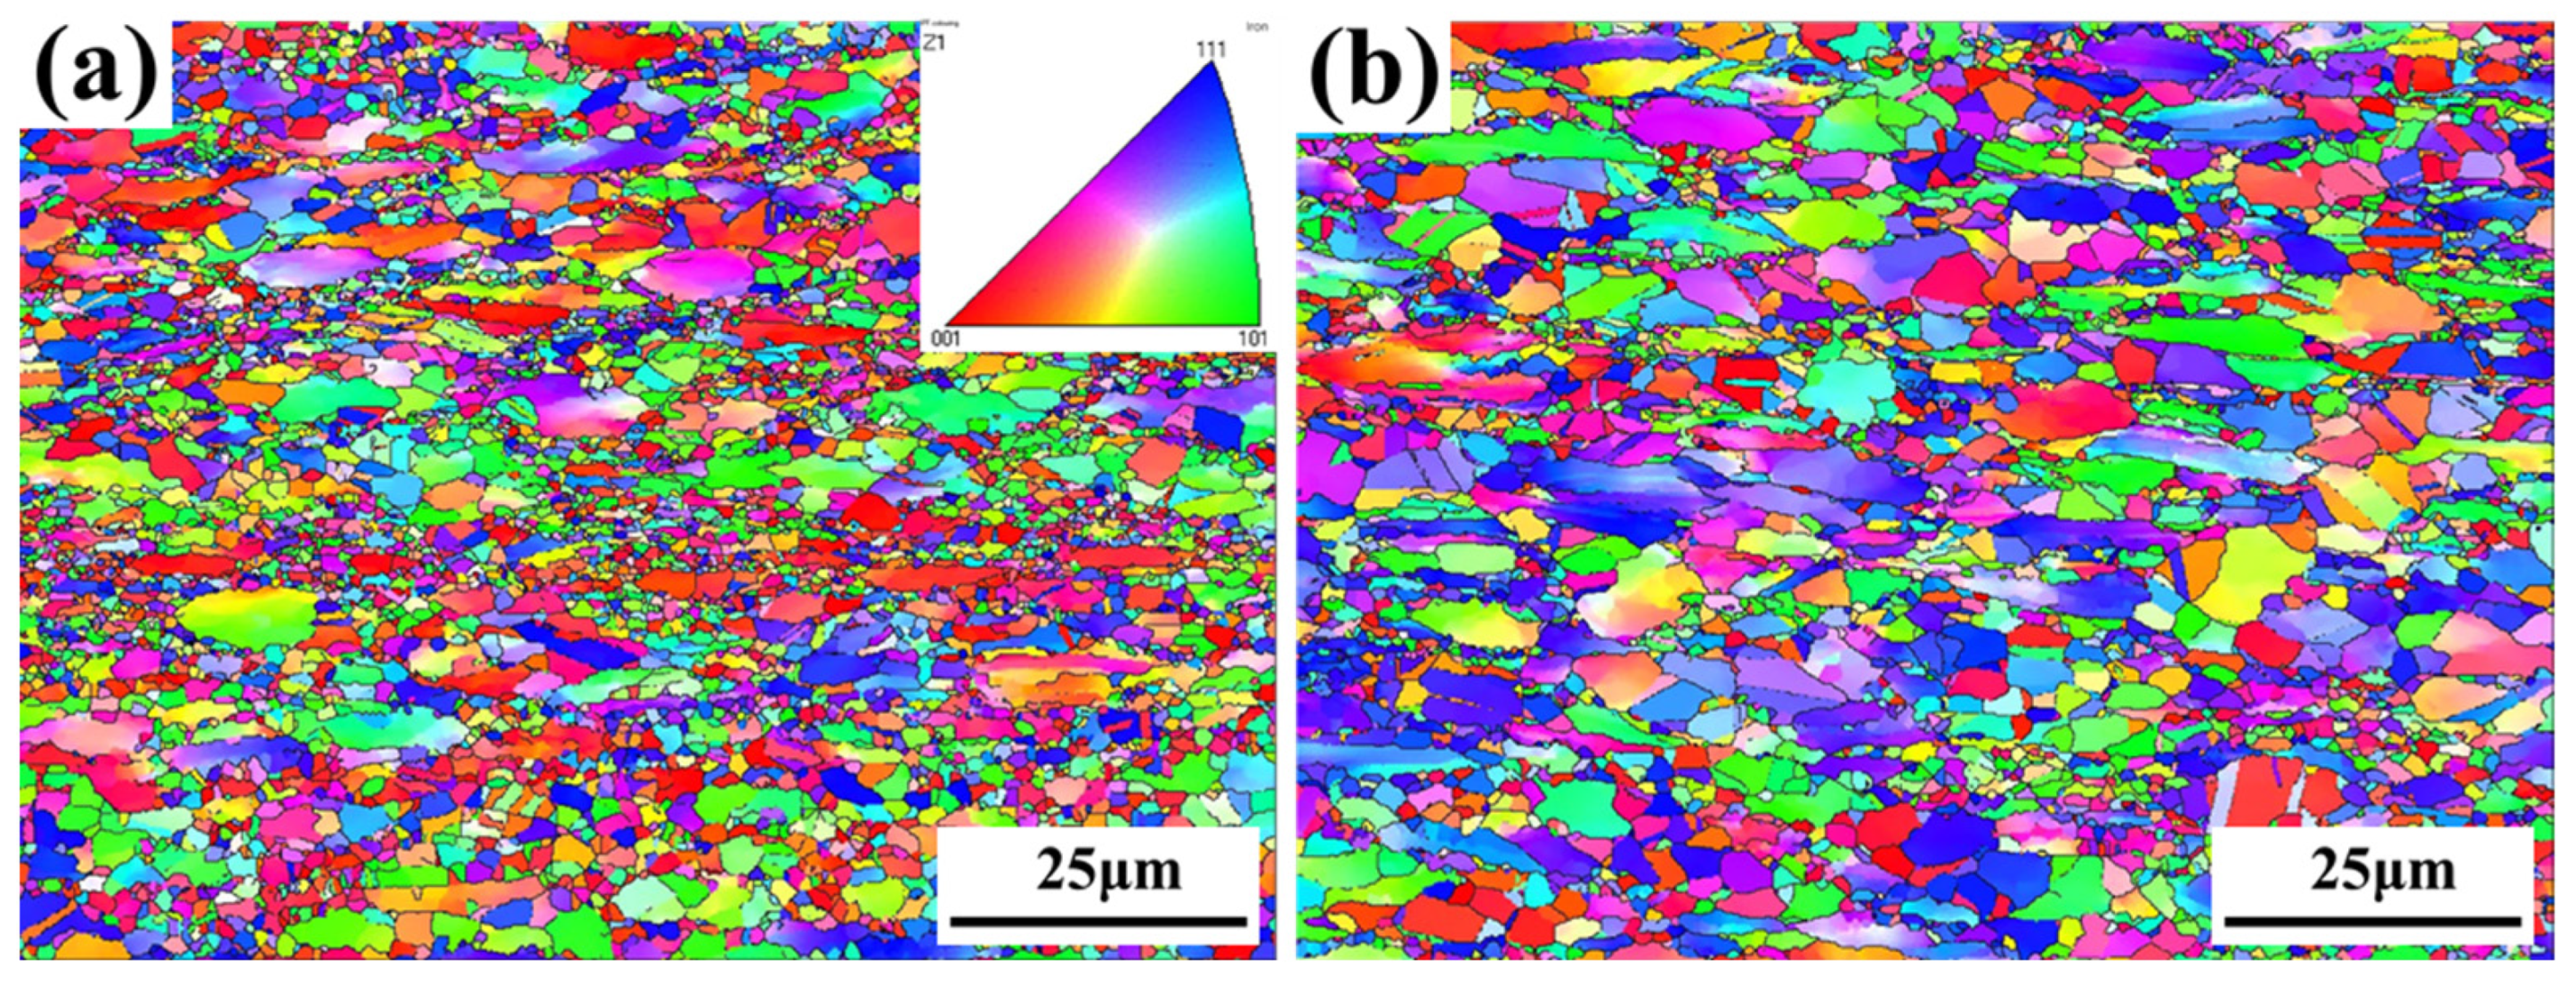
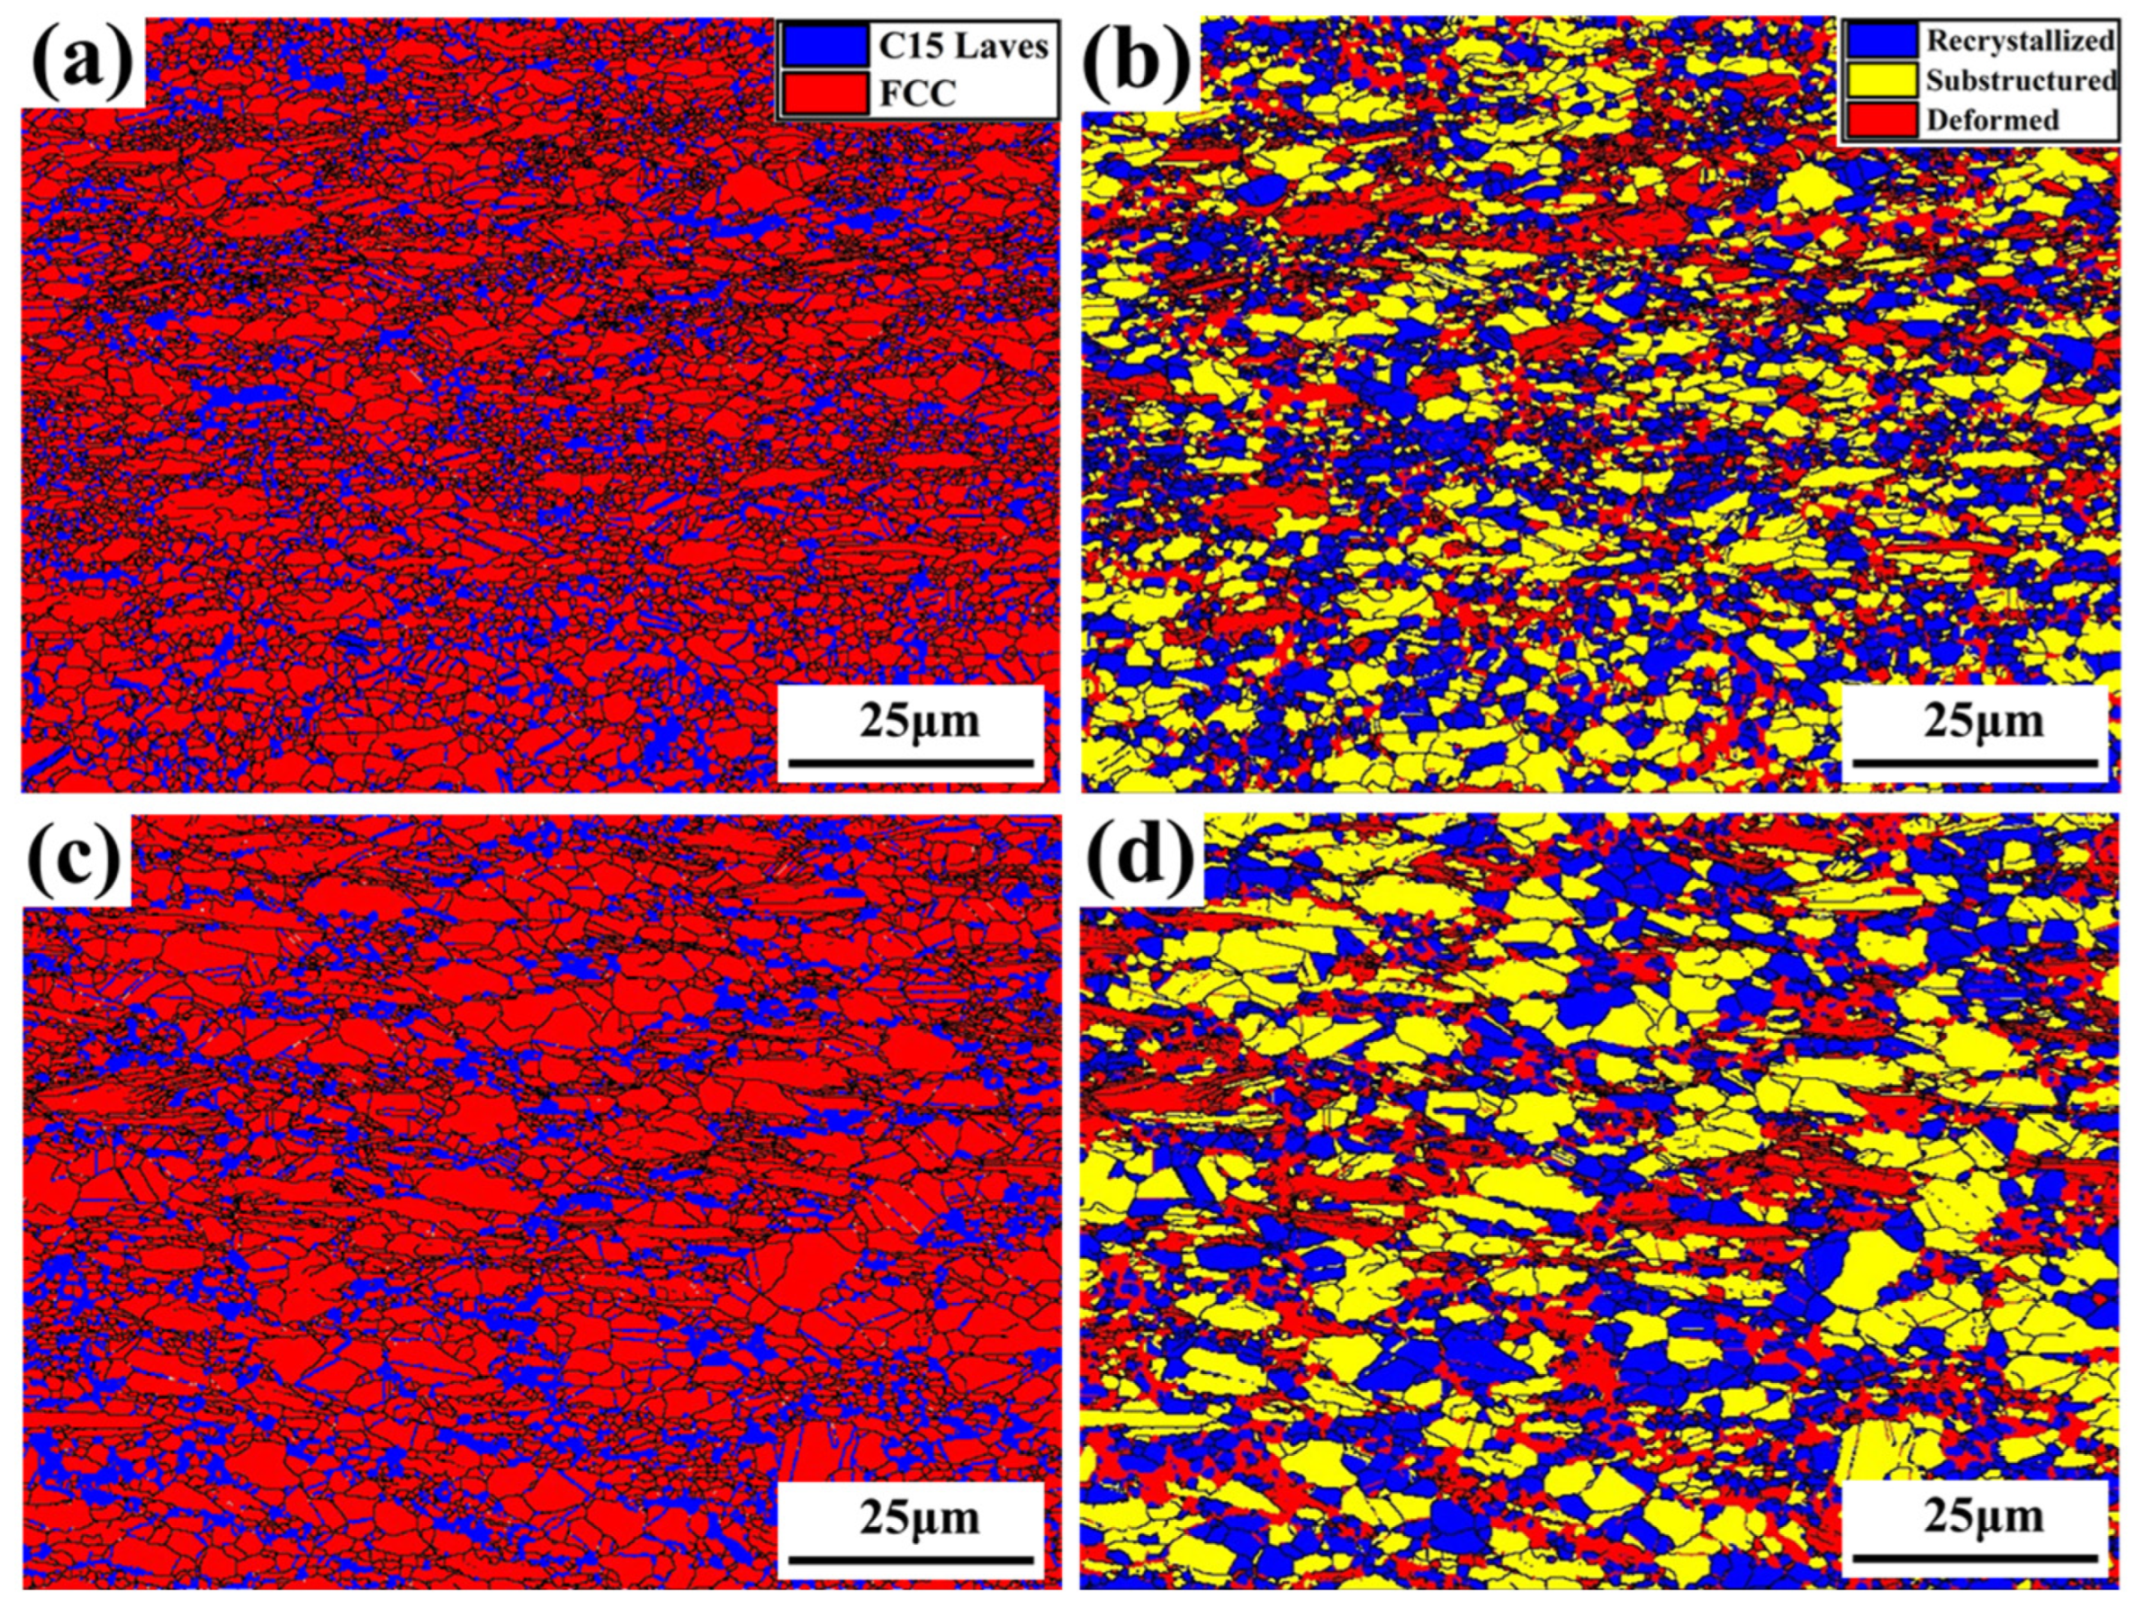
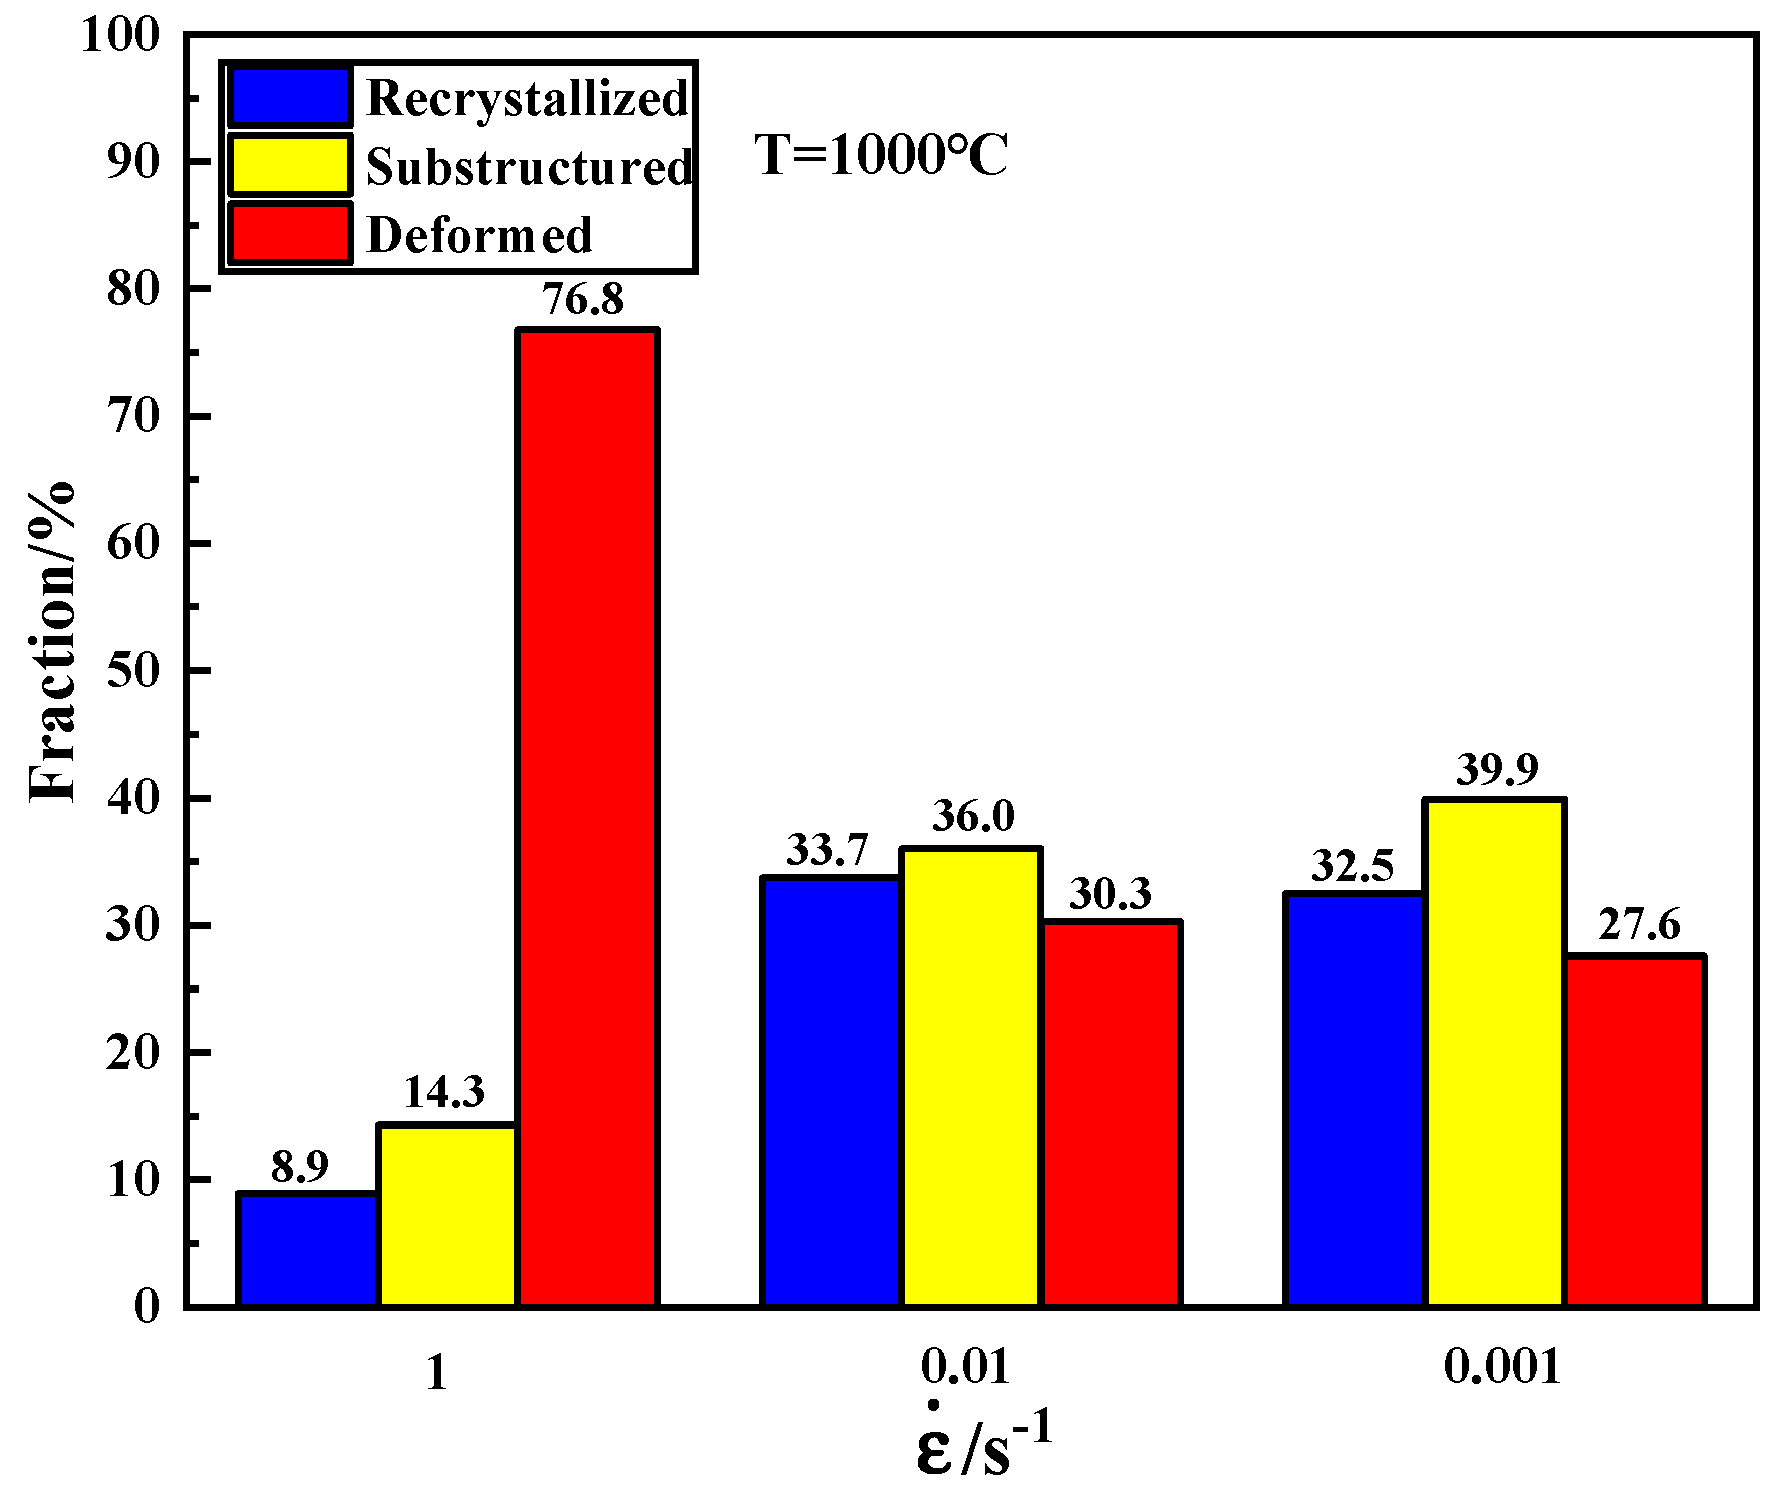
3.5. Microstructures after Hot Deformation at Different Conditions

The grain orientation maps of the CoCrFeNiZr0.3 HEA under varying deformation temperatures at a strain rate of 1 s−1 is shown in Figure 11, the direction of compression deformation of the specimen is z-axis and the results obtained are from the core of the sample. At a deformation temperature of 950 °C, incomplete dynamic recrystallization occurs. The original FCC grains undergo severe elongation, while numerous fine recrystallized grains are formed and distributed around the FCC grains. At this point, the average size of the recrystallized grains is small, generally consisting of submicron-scale fine grains. Upon increasing the temperature to 1000 °C, further growth of FCC grains occurs as depicted in Figure 11b. Shear deformation bands emerge within the thermally deformed microstructure at relatively lower temperatures, predominantly featuring {101} planes. When the temperature reaches 1100 °C, more prominent grain growth during recrystallization becomes apparent. From the grain orientation map, it can be inferred that newly formed recrystallized grains exhibit diverse shapes and sizes with their orientations randomly dispersed throughout the material.
In order to better analyze the thermal deformation behavior of CoCrFeNiZr0.3 HEA under different temperature conditions, and to clarify the relationship between phase distribution and dynamic recrystallization, the corresponding phase map and dynamic recrystallization distribution map are shown in Figure 12. In Figure 12a,c,e, blue and red represent Laves phase and FCC phase, respectively; in Figure 12b,d,f, blue, yellow, and red represent recrystallized organization, substructured organization, and deformed organization. The corresponding statistical results are shown in Figure 13. It can be observed from the figures that dynamic recrystallization occurred at all three deformation temperatures. When the temperature is 950 °C, the newly formed recrystallized grains are relatively small and distributed around the deformed grains. At this time, the majority of the alloy consists of deformed grains, accounting for 65.2%, while substructured grains and recrystallized grains account for only 13.2% and 21.6%, respectively, indicating a low degree of dynamic recrystallization. Similarly, when the temperature reaches 1000 °C, the proportion of recrystallized grains continues to decrease, with the weight percentage of deformed grains reaching 76.8%, and substructured and deformed grains becoming coarser. With a further increase in temperature (reaching 1100 °C), it becomes very evident that the recrystallized grains are growing larger. This is because as the temperature rises, atomic thermal motion intensifies and diffusion capability strengthens; high temperatures accelerate processes such as recovery, annihilation, and recombination of dislocations, which are favorable for the growth of the recrystallized grains [36]. Furthermore, it can be observed that most recrystallized grains are mainly distributed in FCC phase, while almost all deformed grains are found in Laves phase; this implies that dynamic recrystallization primarily occurs in FCC phase.
Figure 14 shows the Kernel Average Misorientation (KAM) and grain boundary map of CoCrFeNiZr0.3 HEA at different deformation temperatures. High-density dislocations are mainly distributed within the deformed structure, as indicated by larger KAM values in the regions corresponding to the deformed structure in Figure 14a,c, as well as within some substructure regions, such as in Figure 14e. At a temperature of 1000 °C, due to the high dislocation density, there is a large amount of deformed structure under this deformation condition, leading to a high degree of strain hardening in the alloy. Therefore, this parameter is not suitable for processing, which corresponds to the hot working diagram. However, at 1100 °C, it can be seen from the KAM map that there is a significant decrease in dislocation density within the structure due to dynamic recrystallization eliminating a large number of dislocations. Similarly, from the grain boundary map, it can be observed that low angle grain boundaries (LAGBs) are relatively more abundant in areas with higher dislocation density [37]. Dislocations with higher energy will induce new grain nucleation at low angle grain boundaries or pre-existing grain defects during recrystallization process; during this process low angle grain boundaries will transform into high angle grain boundaries (HAGBs).
After hot deformation, a noticeable texture with a certain high density index (texture strength) appeared in the alloy structure. Figure 15 shows the EBSD pole figures at different temperatures, displaying the distribution of textures on the (100), (110), and (111) planes. As shown in Figure 15a, when the alloy was subjected to hot deformation at 950 °C, strong textures mainly appeared on the (100) and (111) planes, but the highest value was relatively low at only 1.99. With increasing temperature, the texture strength gradually increased. At 1000 °C (Figure 15b), strong texture distribution mainly occurred on the (100) plane, with a maximum value of 5.32. When the temperature reached 1100 °C (Figure 15c), strong textures appeared on both the (100) and (111) planes, but there were more distributions on the (100) plane, with a maximum value of 5.18. It can be found that with the increase in recrystallization, the degree of preferred orientation decreases. The random texture is more conducive to the formation of fine equiaxed grains [38], which is also reflected in Figure 13.
Figure 16 illustrates the grain orientation map of CoCrFeNiZr0.3 HEA at a deformation temperature of 1000 °C and different deformation rates. It is evident that at low strain rates, the deformation shear bands disappear and the grain orientations tend to be randomly distributed without a clear preferred orientation. With further reduction in strain rate (0.001 s−1), noticeable recrystallized grains exhibit significant growth, presenting a distinct equiaxed grain morphology.
Similarly, at 1000 °C, the phase diagram and recrystallization distribution maps for different strain rates are shown in Figure 17. It can be observed that the distribution of deformed grains, recrystallized grains, and substructure grains is uniform, and with the decrease in strain rate, all three types of grains exhibit growth phenomena. Additionally, at this temperature, the FCC phase mainly consists of recrystallized grains and subgrains, while the recrystallization phenomenon in the Laves phase remains less pronounced. It is evident that within a wide range, dynamic recrystallization in CoCrFeNiZr0.3 HEA primarily occurs in the FCC phase.
From Figure 18, it can be observed that the strain rate is inversely proportional to the recrystallization degree, indicating that as the strain rate increases, the occurrence of recrystallization becomes more difficult. Under low strain rate conditions, substructures are easily formed and deformation energy storage is rapidly released through dynamic recrystallization nucleation and growth mechanisms. Increasing the strain rate shortens the deformation time, inhibiting the formation and development of substructures, making recrystallization nucleation more difficult [39]. At high strain rates, intense deformation may cause recrystallization nuclei to undergo deformation after their formation, leading to dislocation formation within them and reducing the strain gradient between recrystallized grains and deformed grains. As a result, significant grain growth during recrystallization is not observed. However, it is also noted that when the strain rate continues to decrease, the recrystallization degree of CoCrFeNiZr0.3 HEA does not continue to increase (33.7% at a strain rate of 0.01 s−1; 32.5% at a rate of 0.001 s−1). This is because an excessively low deformation rate leads to slow dislocation accumulation which cannot reach the critical value for rapid recrystallization nucleation; thus resulting in predominantly substructured microstructure in this case.

4. Conclusions

In this study, CoCrFeNiZr0.3 HEA was prepared by the vacuum arc melting method, and equiaxed thermal simulation experiments were carried out using the Gleeble-3500. The true stress-strain curve and thermal processing map were depicted. The microstructure of the deformed specimens was analyzed by EBSD. The following conclusions were drawn:
  • The flow stress curves of CoCrFeNiZr0.3 HEA exhibit typical dynamic recrystallization behavior. The flow stress of the alloy is sensitive to both the deformation temperature and the strain rate. As the deformation temperature decreases and the strain rate increases, the flow stress also increases, and vice versa.
  • The thermal activation energy of CoCrFeNiZr0.3 HEA is about 406 kJ/mol, and the constitutive equation for peak stress is obtained:
    ε ˙ = 2.7986 × 10 14 sin h ( 0.0054 σ ) 5.8303 exp ( 405585 RT )
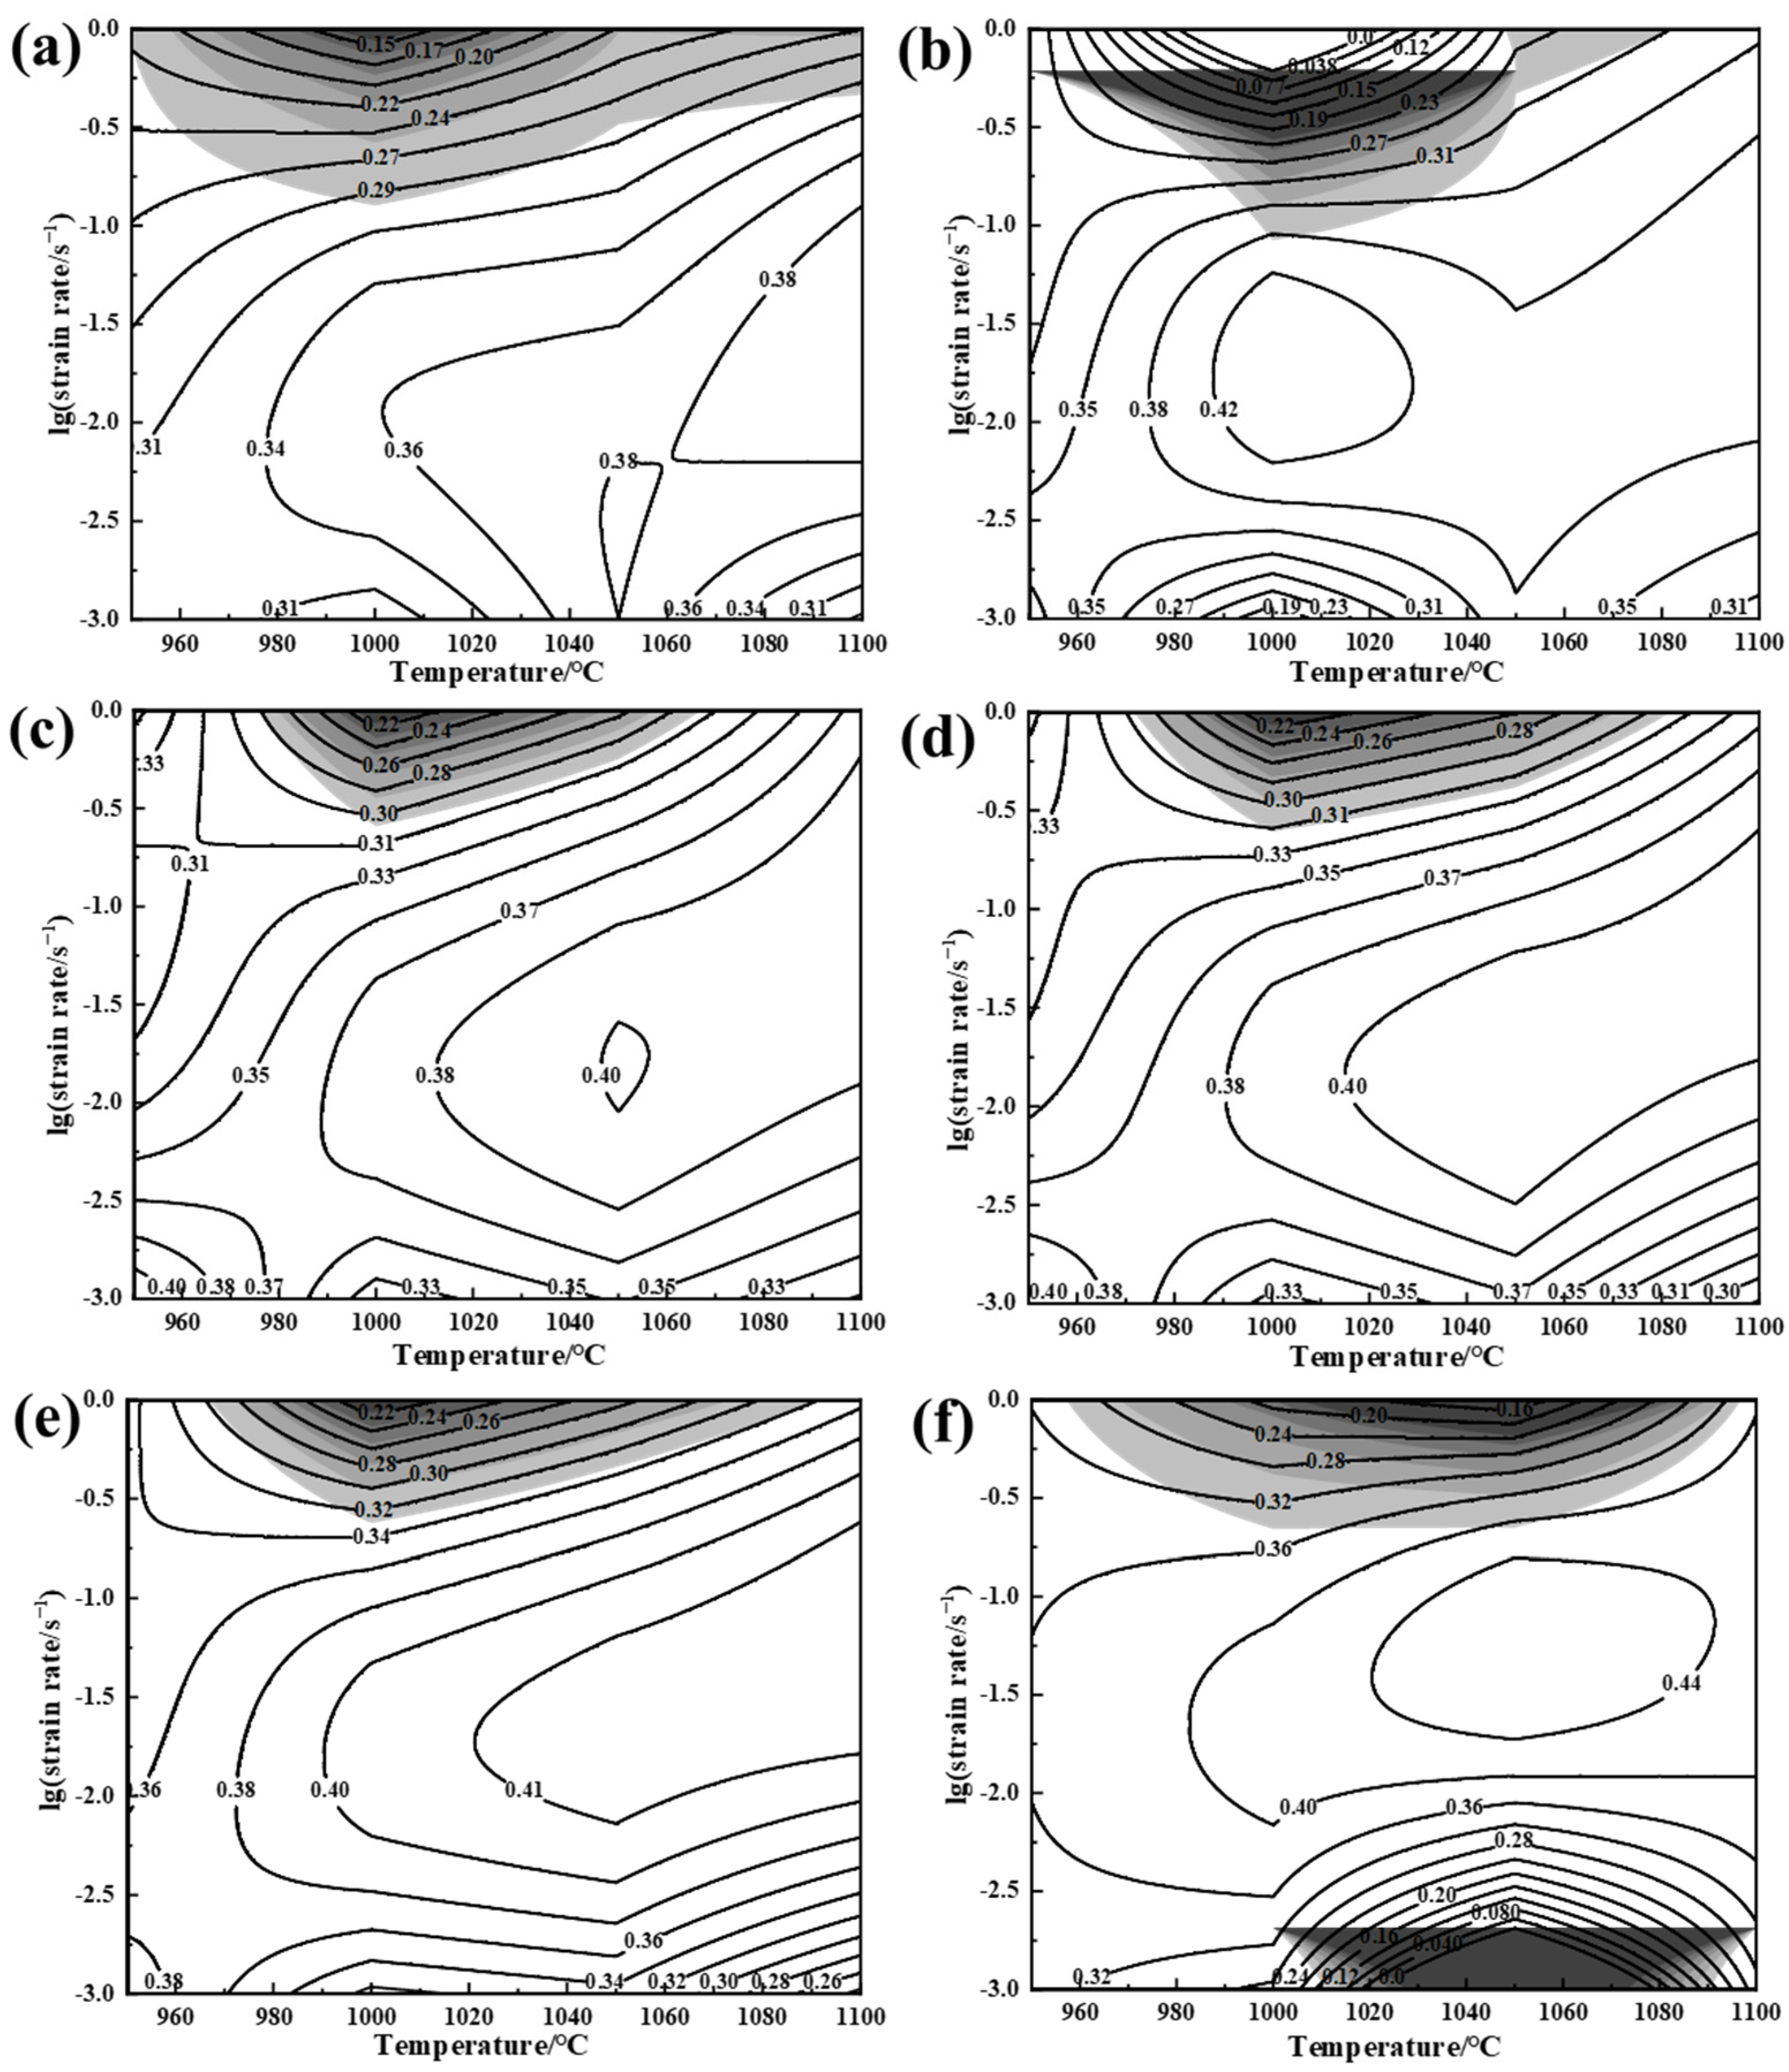
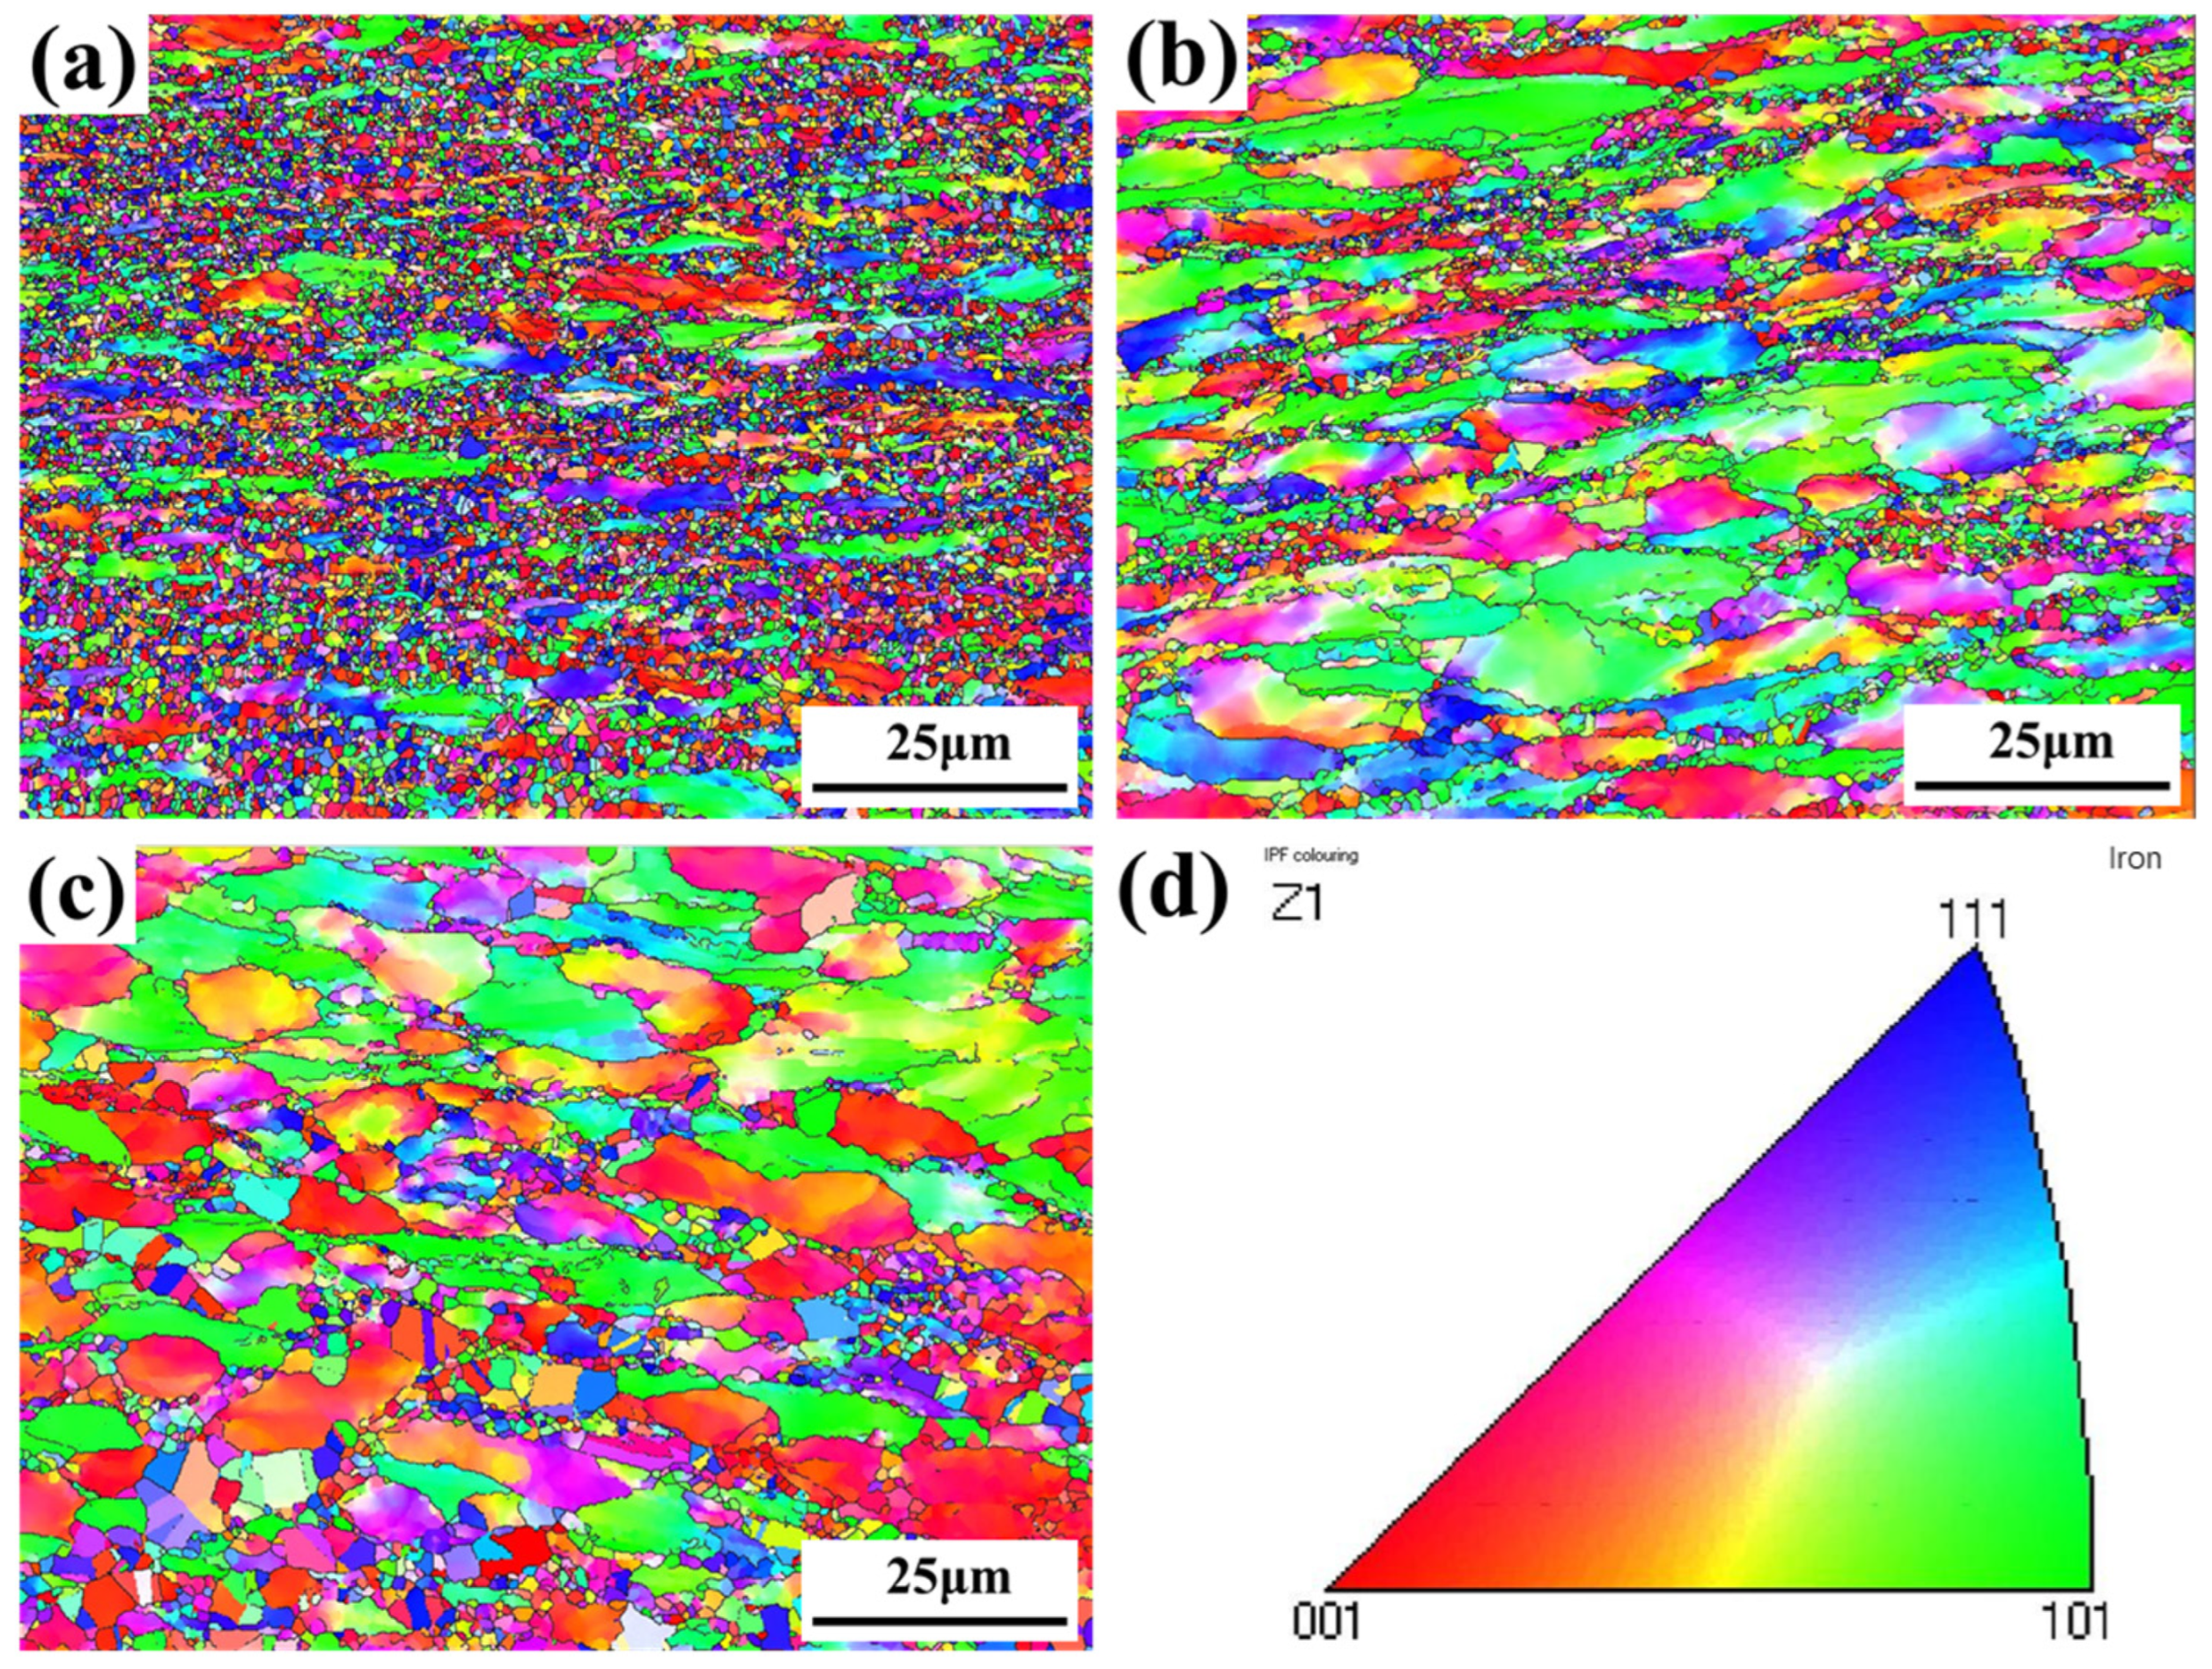
  • Through the analysis of the thermal processing diagram, we have determined the optimal process parameters for thermal deformation of CoCrFeNiZr0.3 HEA: a deformation temperature range of 1000–1100 °C and a strain rate range of 0.01–0.1 s−1. As the deformation temperature increases and the strain rate decreases, there is an observed increase in the size of dynamically recrystallized grains, and the content of the substructure increases relatively.
  • CoCrFeNiZr0.3HEA has high compressive strength at high temperature, and XRD shows that the phase structure stability of the alloy is good. This study provides a reference for the development of similar two-phase materials through hot working pictures. Due to its excellent high temperature resistance, low neutron absorption cross section and good corrosion resistance, Zr has a potential application prospect in the nuclear industry.

Author Contributions

P.L.: Conceptualization, Investigation, Writing—original draft, Visualization, Funding Acquisition. H.Y.: Conceptualization, Methodology, Investigation, Writing—review & editing. H.W.: Investigation, Writing—review & editing. F.G.: Methodology, Investigation, Methodology, Investigation. Q.G.: Conceptualization, Investigation, Resources. H.L.: Methodology, Writing—review & editing, Funding acquisition. X.L.: Supervision, Methodology, Writing—review & editing. All authors have read and agreed to the published version of the manuscript.

Funding

This work was supported by Postgraduate Research & Practice Innovation Program of Jiangsu Province (KYCX23_3718).

Data Availability Statement

The raw data supporting the conclusions of this article will be made available by the authors on request.

Acknowledgments

Thank the Beijing Dream Material Technology Co., Ltd. for providing smelting raw material support.

Conflicts of Interest

The authors declare no conflicts of interest.

References

  1. Wang, X.; Guo, W.; Fu, Y. High-entropy alloys: Emerging materials for advanced functional applications. J. Mater. Chem. A 2021, 9, 663–701. [Google Scholar] [CrossRef]
  2. Wang, X.; Zhai, W.; Li, H.; Wang, J.Y.; Wei, B. Ultrasounds induced eutectic structure transition and associated mechanical property enhancement of FeCoCrNi2. 1Al high entropy alloy. Acta Mater. 2023, 252, 118900. [Google Scholar] [CrossRef]
  3. Varvenne, C.; Luque, A.; Curtin, W.A. Theory of strengthening in fcc high entropy alloys. Acta Mater. 2016, 118, 164–176. [Google Scholar] [CrossRef]
  4. Tung, C.C.; Yeh, J.W.; Shun, T.T.; Chen, S.K.; Huang, Y.S.; Chen, H.C. On the elemental effect of AlCoCrCuFeNi high-entropy alloy system. Mater. Lett. 2007, 61, 1–5. [Google Scholar] [CrossRef]
  5. Tokarewicz, M.; Grądzka-Dahlke, M. Review of recent research on AlCoCrFeNi high-entropy alloy. Metals 2021, 11, 1302. [Google Scholar] [CrossRef]
  6. Niu, P.; Li, R.; Fan, Z.; Cao, P.; Zheng, D.; Wang, M.; Deng, C.; Yuan, T. Inhibiting cracking improving strength for additive manufactured AlxCoCrFeNi high entropy alloy via changing crystal structure from BCC-to-FCC. Addit. Manuf. 2023, 71, 103584. [Google Scholar]
  7. Chen, S.; Qiao, J.; Diao, H.; Yang, T.; Poplawsky, J.; Li, W.; Meng, F.; Tong, Y.; Jiang, L.; Liaw, P.K.; et al. Extraordinary creep resistance in a non-equiatomic high-entropy alloy from the optimum solid-solution strengthening and stress-assisted precipitation process. Acta Mater. 2023, 244, 118600. [Google Scholar] [CrossRef]
  8. Ranganathan, S. Alloyed pleasures: Multimetallic cock-tails. Curr. Sci. 2003, 85, 1404–1406. [Google Scholar]
  9. Dasari, S.; Sharma, A.; Jiang, C.; Gwalani, B.; Lin, W.C.; Lo, K.C.; Gorsse, S.; Yeh, A.-C.; Srinivasan, S.G.; Banerjee, R. Exceptional enhancement of mechanical properties in high-entropy alloys via thermodynamically guided local chemical ordering. Proc. Natl. Acad. Sci. USA 2023, 120, e2211787120. [Google Scholar] [CrossRef]
  10. Wu, B.; Yu, W.; Zhu, W.; Li, Y.; Hu, Z. A new strategy of Al0. 1CoCrFeNi high entropy alloys and Inconel 625 alloys joining technology. J. Mater. Process. Technol. 2024, 324, 118251. [Google Scholar] [CrossRef]
  11. Lee, D.H.; Seok, M.Y.; Zhao, Y.; Choi, I.C.; He, J.; Lu, Z.; Suh, J.Y.; Rama-murty, U.; Kawasaki, M.; Langdon, T.G.; et al. Spherical nanoin-dentation creep behavior of nanocrystalline and coarse-grained CoCrFeMnNi high-entropy alloys. Acta Mater. 2016, 109, 314. [Google Scholar] [CrossRef]
  12. Li, W.; Wang, W.; Niu, M.; Yang, K.; Luan, J.; Zhang, H.; Jiao, Z. Unraveling the two-stage precipitation mechanism in a hierarchical-structured fcc/L21 high-entropy alloy: Experiments and analytical modeling. Acta Mater. 2024, 262, 119426. [Google Scholar] [CrossRef]
  13. Schuh, B.; Mendez-Martin, F.; Vo¨lker, B.; George, E.P.; Clemens, H.; Pippan, R.; Hohenwarter, A. Mechanical properties, microstruc-ture and thermal stability of a nanocrystalline CoCrFeMnNi high-entropy alloy after severe plastic deformation. Acta Mater. 2015, 96, 258. [Google Scholar] [CrossRef]
  14. Guan, Y.; Cui, X.; Chen, D.; Su, W.; Zhao, Y.; Li, J.; Feng, L.; Li, X.; Jin, G. Realizing excellent tribological properties of BCC/FCC gradient high-entropy alloy coating via an in-situ interface reaction. Mater. Today Commun. 2023, 35, 106098. [Google Scholar] [CrossRef]
  15. Li, Z.; Zhang, Z.; Liu, X.; Li, H.; Zhang, E.; Bai, G.; Xu, H.; Liu, X.; Zhang, X. Strength, plasticity and coercivity tradeoff in soft magnetic high-entropy alloys by multiple coherent interfaces. Acta Mater. 2023, 254, 118970. [Google Scholar] [CrossRef]
  16. Niu, S.Z.; Kou, H.C.; Wang, J.; Li, J.S. Improved tensile properties of Al0.5CoCrFeNi high-entropy alloy by tailoring microstructures. Rare Met. 2021, 40, 2508. [Google Scholar] [CrossRef]
  17. Xing, Z.; Pang, J.; Zhang, H.; Ji, Y.; Zhu, Z.; Wang, A.; Zhang, L.; Li, H.; Fu, H.; Zhang, H. Optimizing the microstructure and mechanical performance of Fe-Ni-Cr-Al high entropy alloys via Ti addition. J. Alloys Compd. 2023, 943, 169149. [Google Scholar] [CrossRef]
  18. Lu, Y.; Zhang, K.; Zhao, B.; Dong, X.; Sun, F.; Zhou, B.; Zhen, Y.; Zhang, L. Balanced mechanical properties of Al0.3CoCrFeNiTix high-entropy alloys by tailoring Ti content and heat treatment. Mater. Sci. Eng. A 2023, 866, 144677. [Google Scholar] [CrossRef]
  19. Jain, R.; Jain, A.; Rahul, M.R.; Kumar, A.; Dubey, M.; Sabat, R.K.; Samal, S.; Phanikumar, G. Development of ultrahigh strength novel Co–Cr–Fe–Ni–Zr quasi-peritectic high entropy alloy by an integrated approach using experiment and simulation. Materialia 2020, 14, 100896. [Google Scholar] [CrossRef]
  20. Tsai, R.C.; Fan, A.C.; Huang, W.F.; Shi, Y.W.; Miracle, D.B.; Lai, W.Y.; Tsai, M.H. Composition of Intermetallic Phases in High-Entropy Alloys: Compositional Inheritance of High-Entropy Sigma Phases from Binary Counterparts. High Entropy Alloys Mater. 2024, 1–8. [Google Scholar] [CrossRef]
  21. Yilmazbayhan, A.; Motta, A.T.; Comstock, R.J.; Sabol, G.P.; Lai, B.; Cai, Z. Structure of zirconium alloy oxides formed in pure water studied with synchrotron radiation and optical microscopy: Relation to corrosion rate. J. Nucl. Mater. 2004, 324, 6–22. [Google Scholar] [CrossRef]
  22. Bojinov, M.; Karastoyanov, V.; Kinnunen, P.; Saario, T. Influence of water chemistry on the corrosion mechanism of a zirconium–niobium alloy in simulated light water reactor coolant conditions. Corros. Sci. 2010, 52, 54–67. [Google Scholar] [CrossRef]
  23. Yamanaka, S.; Higuchi, K.; Miyake, M. Hydrogen solubility in zirconium alloys. J. Alloys Compd. 1995, 231, 503–507. [Google Scholar] [CrossRef]
  24. Hatano, Y.; Hitaka, R.; Sugisaki, M.; Hayashi, M. Influence of size distribution of Zr (Fe, Cr) 2precipitation on hydrogen transport through oxide film of Zircaloy-4. J. Nucl. Mat. 1997, 248, 311–314. [Google Scholar] [CrossRef]
  25. Huo, W.; Zhou, H.; Fang, F.; Xie, Z.; Jiang, J. Microstructure and mechanical properties of CoCrFeNiZrx eutectic high-entropy alloys. Mater. Des. 2017, 134, 226–233. [Google Scholar] [CrossRef]
  26. Vrtnik, S.; Guo, S.; Sheikh, S.; Jelen, A.; Koželj, P.; Luzar, J.; Kocjan, A.; Jagličić, Z.; Meden, A.; Guim, H.; et al. Magnetism of CoCrFeNiZrx eutectic high-entropy alloys. Intermetallics 2018, 93, 122–133. [Google Scholar] [CrossRef]
  27. Feng, X.; Fan, S.; Meng, F.; Surjadi, J.U.; Cao, K.; Liao, W.; Lu, Y. Effect of Zr addition on microstructure and mechanical properties of CoCrFeNiZrx high-entropy alloy thin films. Appl. Nanosci. 2021, 11, 771–776. [Google Scholar] [CrossRef]
  28. Qi, W.; Wang, W.; Yang, X.; Xie, L.; Zhang, J.; Li, D.; Zhang, Y. Effect of Zr on phase separation, mechanical and corrosion behavior of heterogeneous CoCrFeNiZrx high-entropy alloy. J. Mater. Sci. Technol. 2022, 109, 76–85. [Google Scholar] [CrossRef]
  29. Wang, Q.; Gao, T.; Du, H.; Hu, Q.; Chen, Q.; Fan, Z.; Zeng, L.; Liu, X. Hot compression behaviors and microstructure evolutions of a cast dual phase NiCoFeCrAl0. 7 high-entropy alloy. Intermetallics 2021, 138, 107314. [Google Scholar] [CrossRef]
  30. Sonkusare, R.; Jain, R.; Biswas, K.; Parameswaran, V.; Gurao, N.P. High strain rate compression behaviour of single phase CoCuFeMnNi high entropy alloy. J. Alloys Compd. 2020, 823, 153763. [Google Scholar] [CrossRef]
  31. Tong, Y.; Qiao, J.C.; Yao, Y. The constitutive model and threshold stress for characterizing the deformation mechanism of Al0. 3CoCrFeNi high entropy alloy. Mater. Sci. Eng. A 2018, 730, 137–146. [Google Scholar] [CrossRef]
  32. Zhang, P.; Ye, L.-Y.; Zhang, X.-M.; Gu, G.; Jiang, H.-C.; Wu, Y.-L. Grain structure and microtexture evolution during superplastic deformation of 5A90Al-Li alloy. Trans. Nonferrous Met. Soc. China 2014, 24, 2088–2093. [Google Scholar] [CrossRef]
  33. Prasad, Y.V.R.K.; Gegel, H.L.; Doraivelu, S.M.; Malas, J.C.; Morgan, J.T.; Lark, K.A.; Barker, D.R. Modeling of dynamic material behavior in hot deformation: Forging of Ti-6242. Metall. Trans. A (Phys. Metall. Mater. Sci.) 1984, 15, 1883–1892. [Google Scholar] [CrossRef]
  34. Wu, Y.; Zhang, M.; Xie, X.; Dong, J.; Lin, F.; Zhao, S. Hot deformation characteristics and processing map analysis of a new designed nickel-based alloy for 700 °C A-USC power plant. J. Alloys Compd. 2016, 656, 119–131. [Google Scholar] [CrossRef]
  35. Cavaliere, P.; Cerri, E.; Leo, P. Hot deformation and processing maps of a particulate reinforced 2618/Al2O3/20p metal matrix composite. Compos. Sci. Technol. 2004, 64, 1287–1291. [Google Scholar] [CrossRef]
  36. LMDougherty, I.M.; Robertson, J.S. Vetrano. Direct observation of the behavior of grain boundaries during continuous dynamic recrystallization in an Al-4Mg-0.3Sc alloy. Acta Mater. 2003, 51, 4367–4378. [Google Scholar] [CrossRef]
  37. Ma, X.; Huang, C.; Moering, J.; Ruppert, M.; Höppel, H.W.; Göken, M.; Narayan, J.; Zhu, Y. Mechanical properties of copper/bronze laminates: Role of interfaces. Acta Mater. 2016, 116, 43–45. [Google Scholar] [CrossRef]
  38. Hasegawa, M.; Fukutomi, H. Microstructural study on dynamic recrystallization and texture formation in pure nickel. Mater. Trans. 2002, 43, 1183–1190. [Google Scholar] [CrossRef]
  39. Chanda, B.; Pani, S.K.; Das, J. Mechanism of microstructure evolution and spheroidization in ultrafine lamellar CoCrFeNi (Nb0· 5/Ta0. 4) eutectic high entropy alloys upon hot deformation. Mater. Sci. Eng. A 2022, 835, 142669. [Google Scholar] [CrossRef]
Figure 1. Schematic diagram illustrating sequence of hot compression tests.
Metals 14 00632 g001
Figure 2. SEM backscatter electron images of CoCrFeNiZr0.3 HEA. (a) low and (b) high magnification.
Metals 14 00632 g002
Figure 3. True stress–true strain curves of CoCrFeNiZr0.3HEA during hot compression deformation: (a) 950 °C, (b) 1000 °C, (c) 1050 °C, (d) 1100 °C.
Metals 14 00632 g003
Figure 4. (a) Peak flow stress of isothermally compressed CoCrFeNiZr0.3 HEA and (b) peak flow stress as a function of strain rate at different temperatures.
Metals 14 00632 g004
Figure 5. Linear fit between strain rate and flow stress of peak flow stress of CoCrFeNiZr0.3 HEA: (a) ln ε ˙ -lnσ, (b) ln ε ˙ -σ.
Metals 14 00632 g005
Figure 6. Linear fit between strain rate, flow stress and temperature of peak flow stress of CoCrFeNiZr0.3 HEA: (a) ln[sinh(ασ)]-ln ε ˙ , (b) 1000/T-ln[sinh(ασ)].
Metals 14 00632 g006
Figure 7. Linear fit between lnZ and ln[sinh(ασ)] of peak flow stress of CoCrFeNiZr0.3 HEA.
Metals 14 00632 g007
Figure 8. Processing map of CoCrFeNiZr0.3 HEA at different strains: (a) ε = 0.2, (b) ε = 0.3, (c) ε = 0.4, (d) ε = 0.5, (e) ε = 0.6, (f) ε = 0.7.
Metals 14 00632 g008
Figure 9. Relationship between microhardness and deformation parameters of CoCrFeNiZr0.3 HEA: (a) deformation temperature, (b) deformation rate.
Metals 14 00632 g009
Figure 10. XRD patterns of CoCrFeNiZr0.3 HEA under different deformation conditions: (a) 1 s−1, (b) 1000 °C.
Metals 14 00632 g010
Figure 11. EBSD grain orientation maps of CoCrFeNiZr0.3 HEA at rate of 1 s−1: (a) 950 °C, (b) 1000 °C, (c) 1100 °C, (d) the IPF color keys.
Metals 14 00632 g011
Figure 12. Phase and DRX maps of CoCrFeNiZr0.3 HEA at rate of 1 s−1: (a,b) 950 °C; (c,d) 1000 °C; (e,f) 1100 °C.
Metals 14 00632 g012
Figure 13. DRX volume percentage of CoCrFeNiZr0.3 HEA at rate of 1 s−1.
Metals 14 00632 g013
Figure 14. KAM and GB maps of CoCrFeNiZr0.3 HEA at rate of 1 s−1: (a,b) 950 °C; (c,d) 1000 °C; (e,f) 1100 °C.
Metals 14 00632 g014
Figure 15. Pole maps of CoCrFeNiZr0.3 HEA at rate of 1 s−1: (a) 950 °C; (b) 1000 °C; (c) 1100 °C.
Metals 14 00632 g015
Figure 16. EBSD grain orientation maps of CoCrFeNiZr0.3 HEA at temperature of 1000 °C: (a) 0.01 s−1, (b) 0.001 s−1.
Metals 14 00632 g016
Figure 17. Phase and DRX distribution diagram of CoCrFeNiZr0.3 HEA at temperature of 1000 °C: (a,b) 0.01 s−1; (c,d) 0.001 s−1.
Metals 14 00632 g017
Figure 18. DRX volume percentage of CoCrFeNiZr0.3 HEA at temperature of 1000 °C.
Metals 14 00632 g018
Table 1. Mass of elements in CoCrFeNiZr0.3 HEA.
AlloyElemental Quality/(g)
CoCrFeNiZr
CoCrFeNiZr0.323.307620.566722.089423.212710.8236
Table 2. Peak flow stress (MPa) of CoCrFeNiZr0.3 HEA under different deformation conditions.
Strain Rate (s−1)Peak Flow Stress (MPa)
950 °C1000 °C1050 °C1100 °C
1438.7238345.5079292.4590239.4383
0.1322.1562264.0917210.4556166.2917
0.01227.8438176.0611139.6435102.6387
0.001158.7436110.399081.805362.1746
Disclaimer/Publisher’s Note: The statements, opinions and data contained in all publications are solely those of the individual author(s) and contributor(s) and not of MDPI and/or the editor(s). MDPI and/or the editor(s) disclaim responsibility for any injury to people or property resulting from any ideas, methods, instructions or products referred to in the content.

