

Microstructure Evolution and Numerical Modeling of TC4 Titanium Alloy during Ultrasonic Shot Peening Process


Abstract
1. Introduction
2. Materials and Methods
2.1. Materials
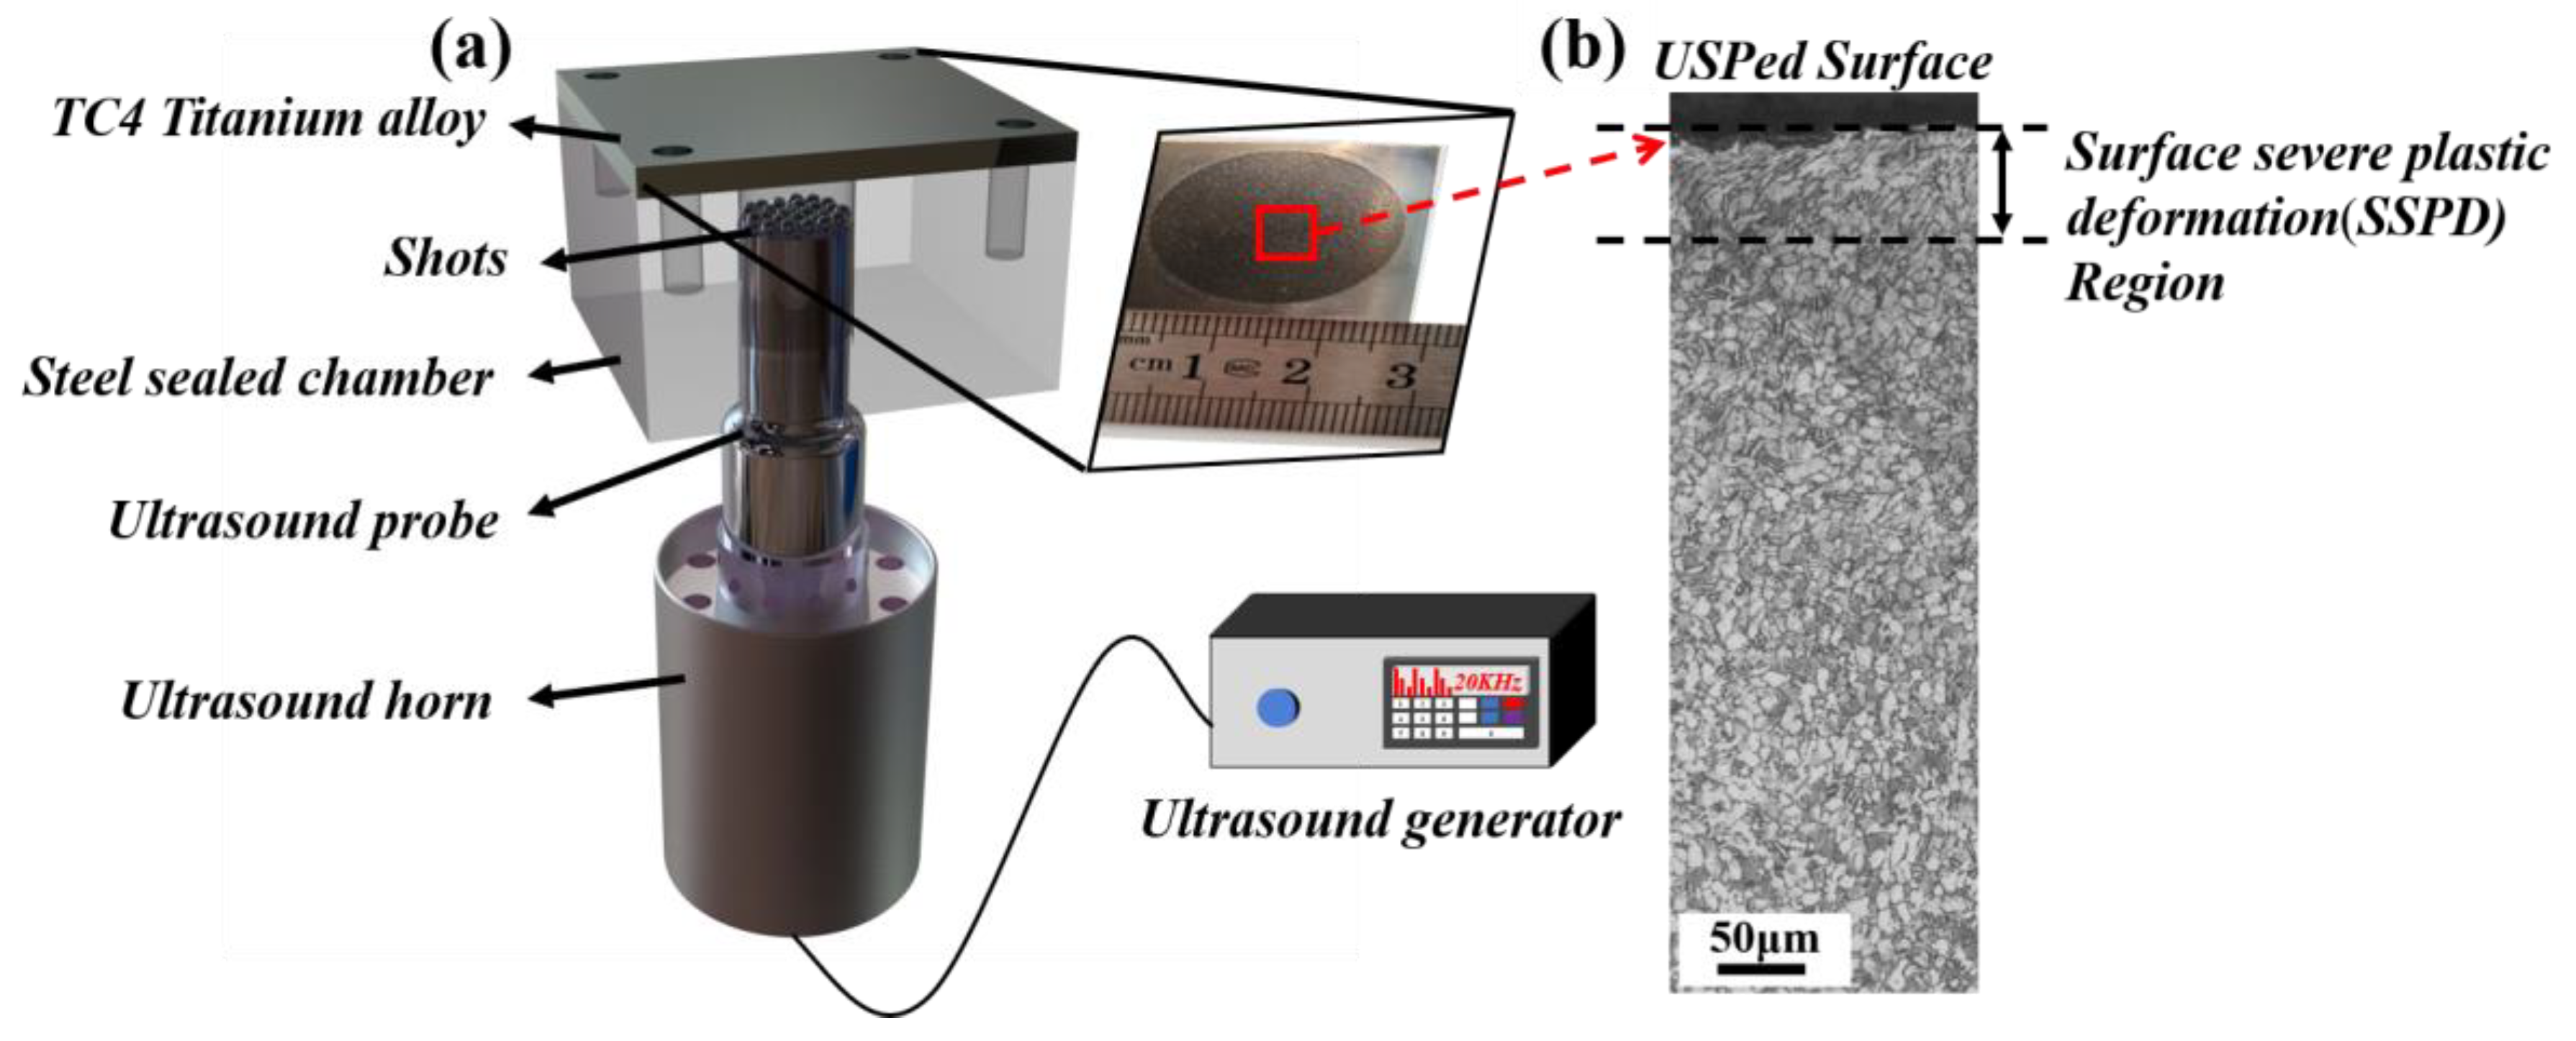
2.2. USP Treatment
2.3. Measurements and Characterization
2.4. Finite Element Method
3. Results
3.1. Gradient Nanograined Structure
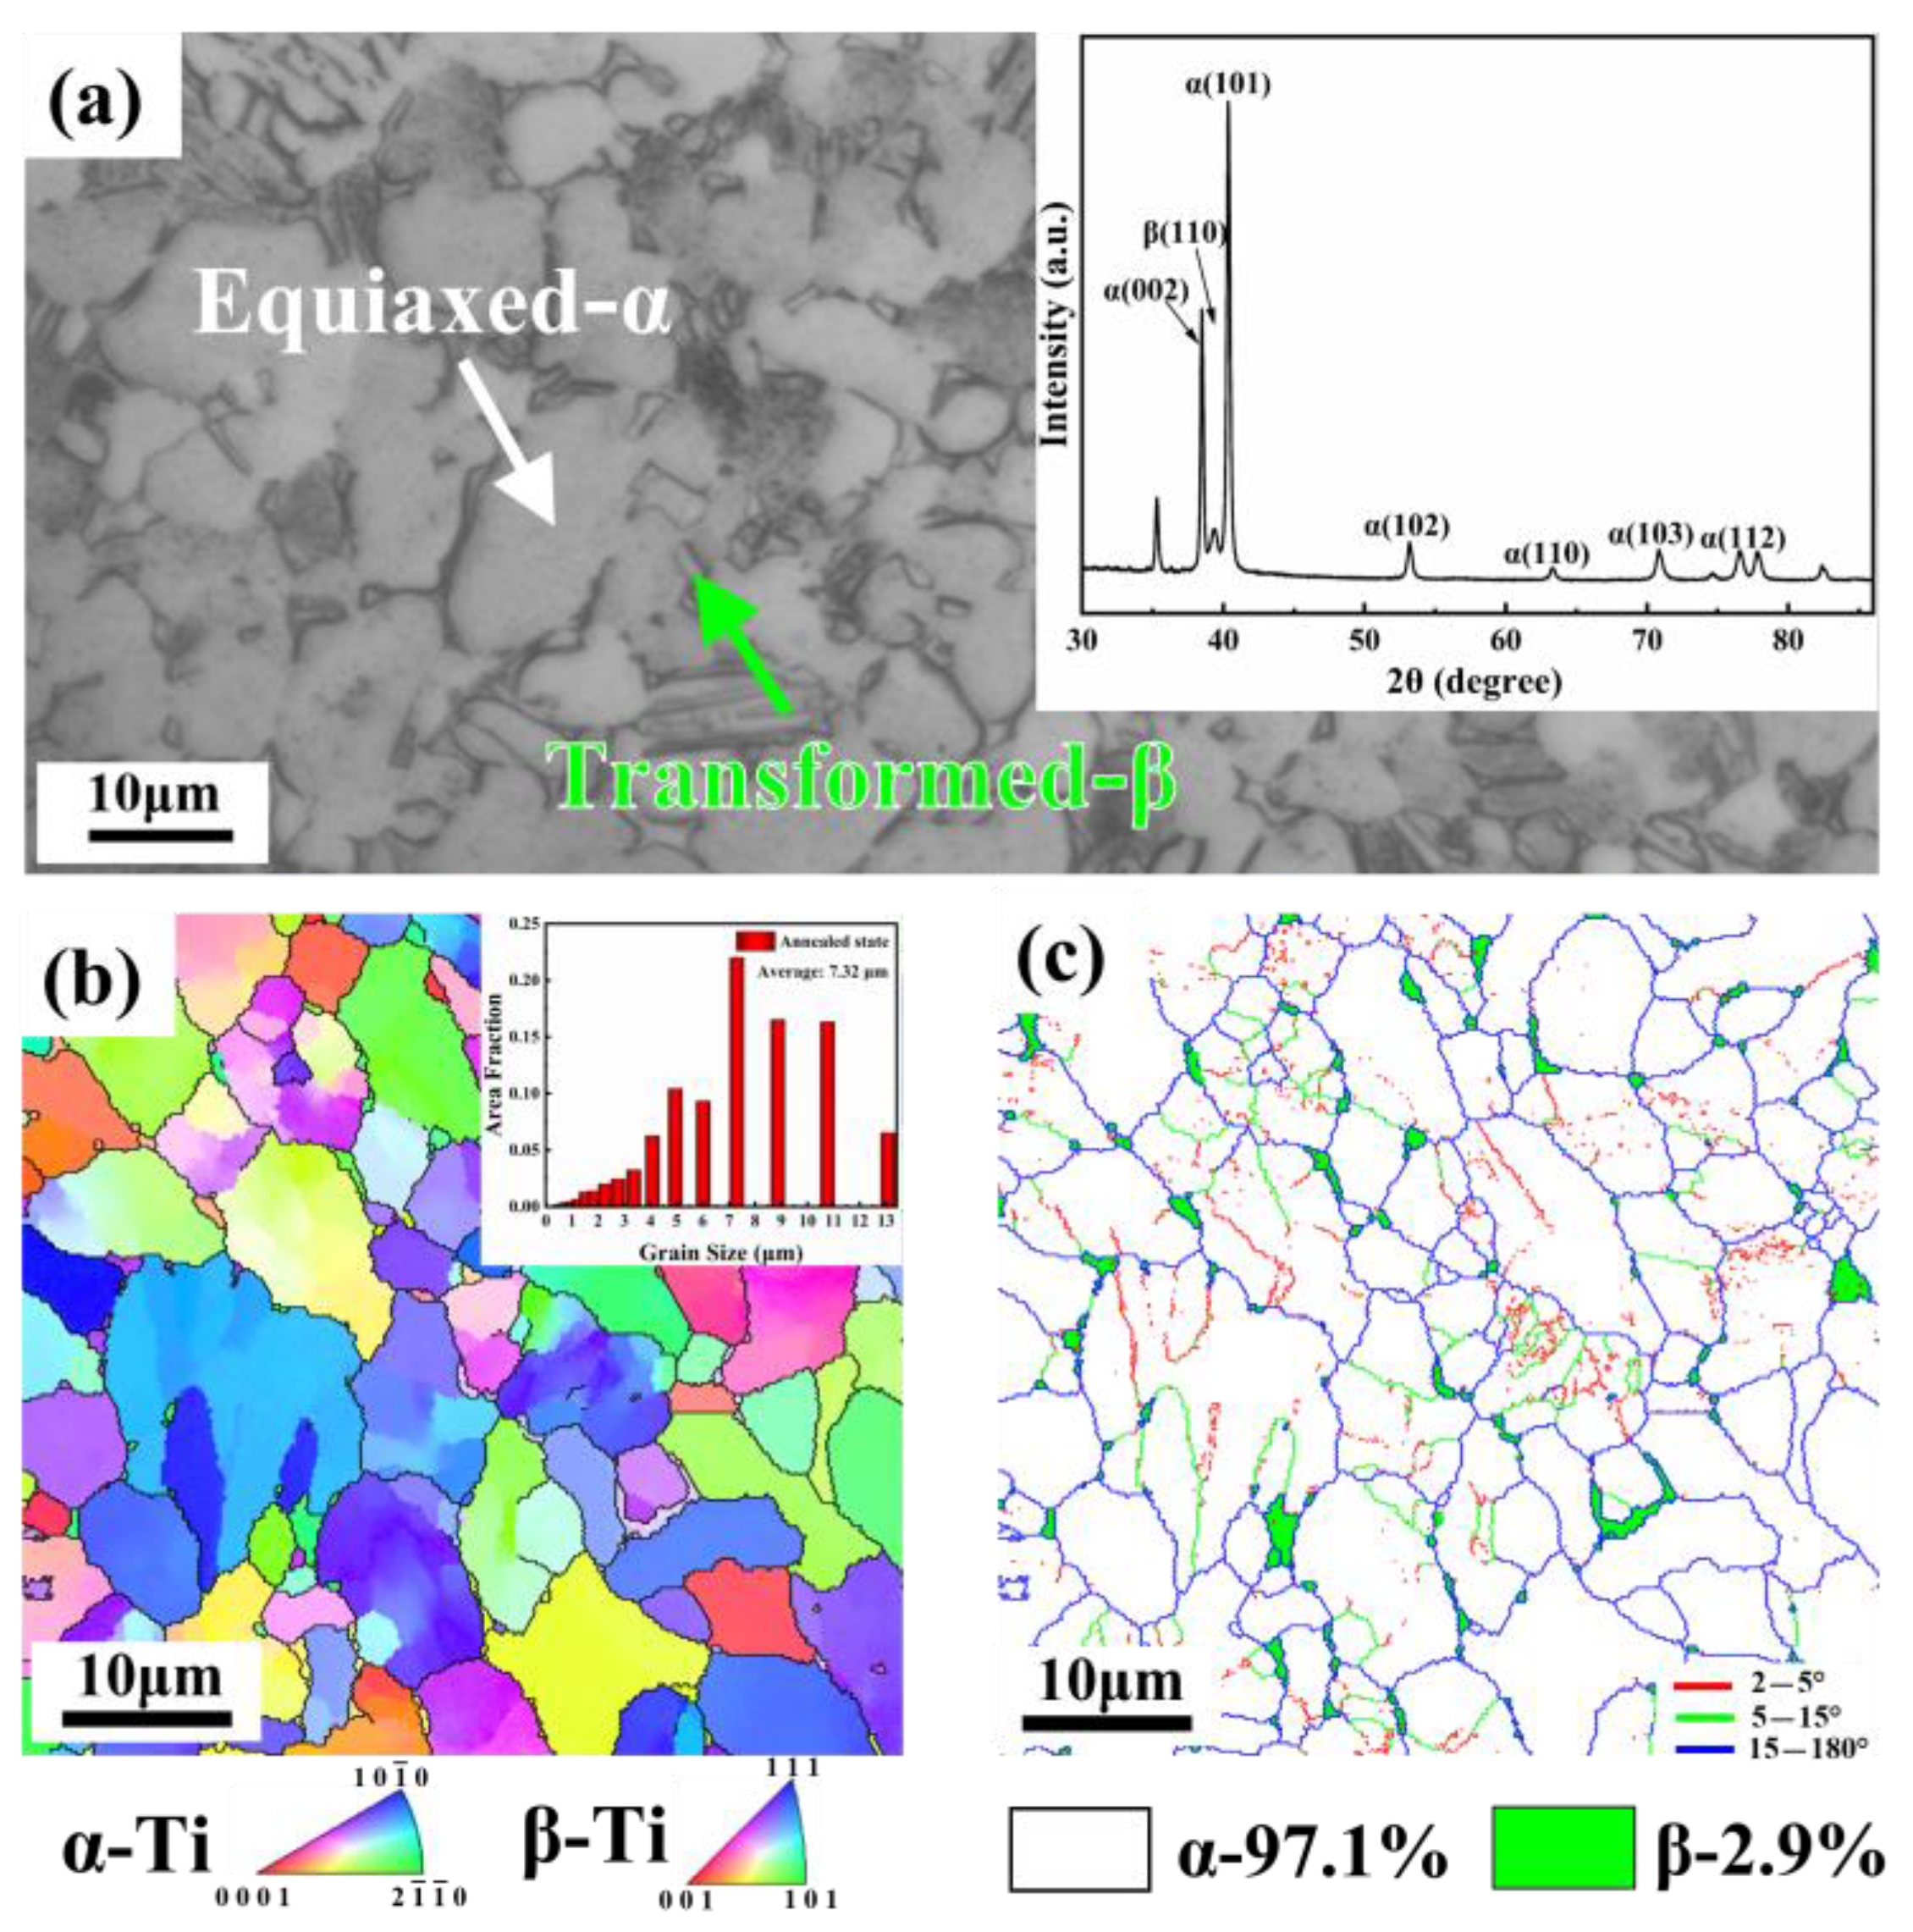
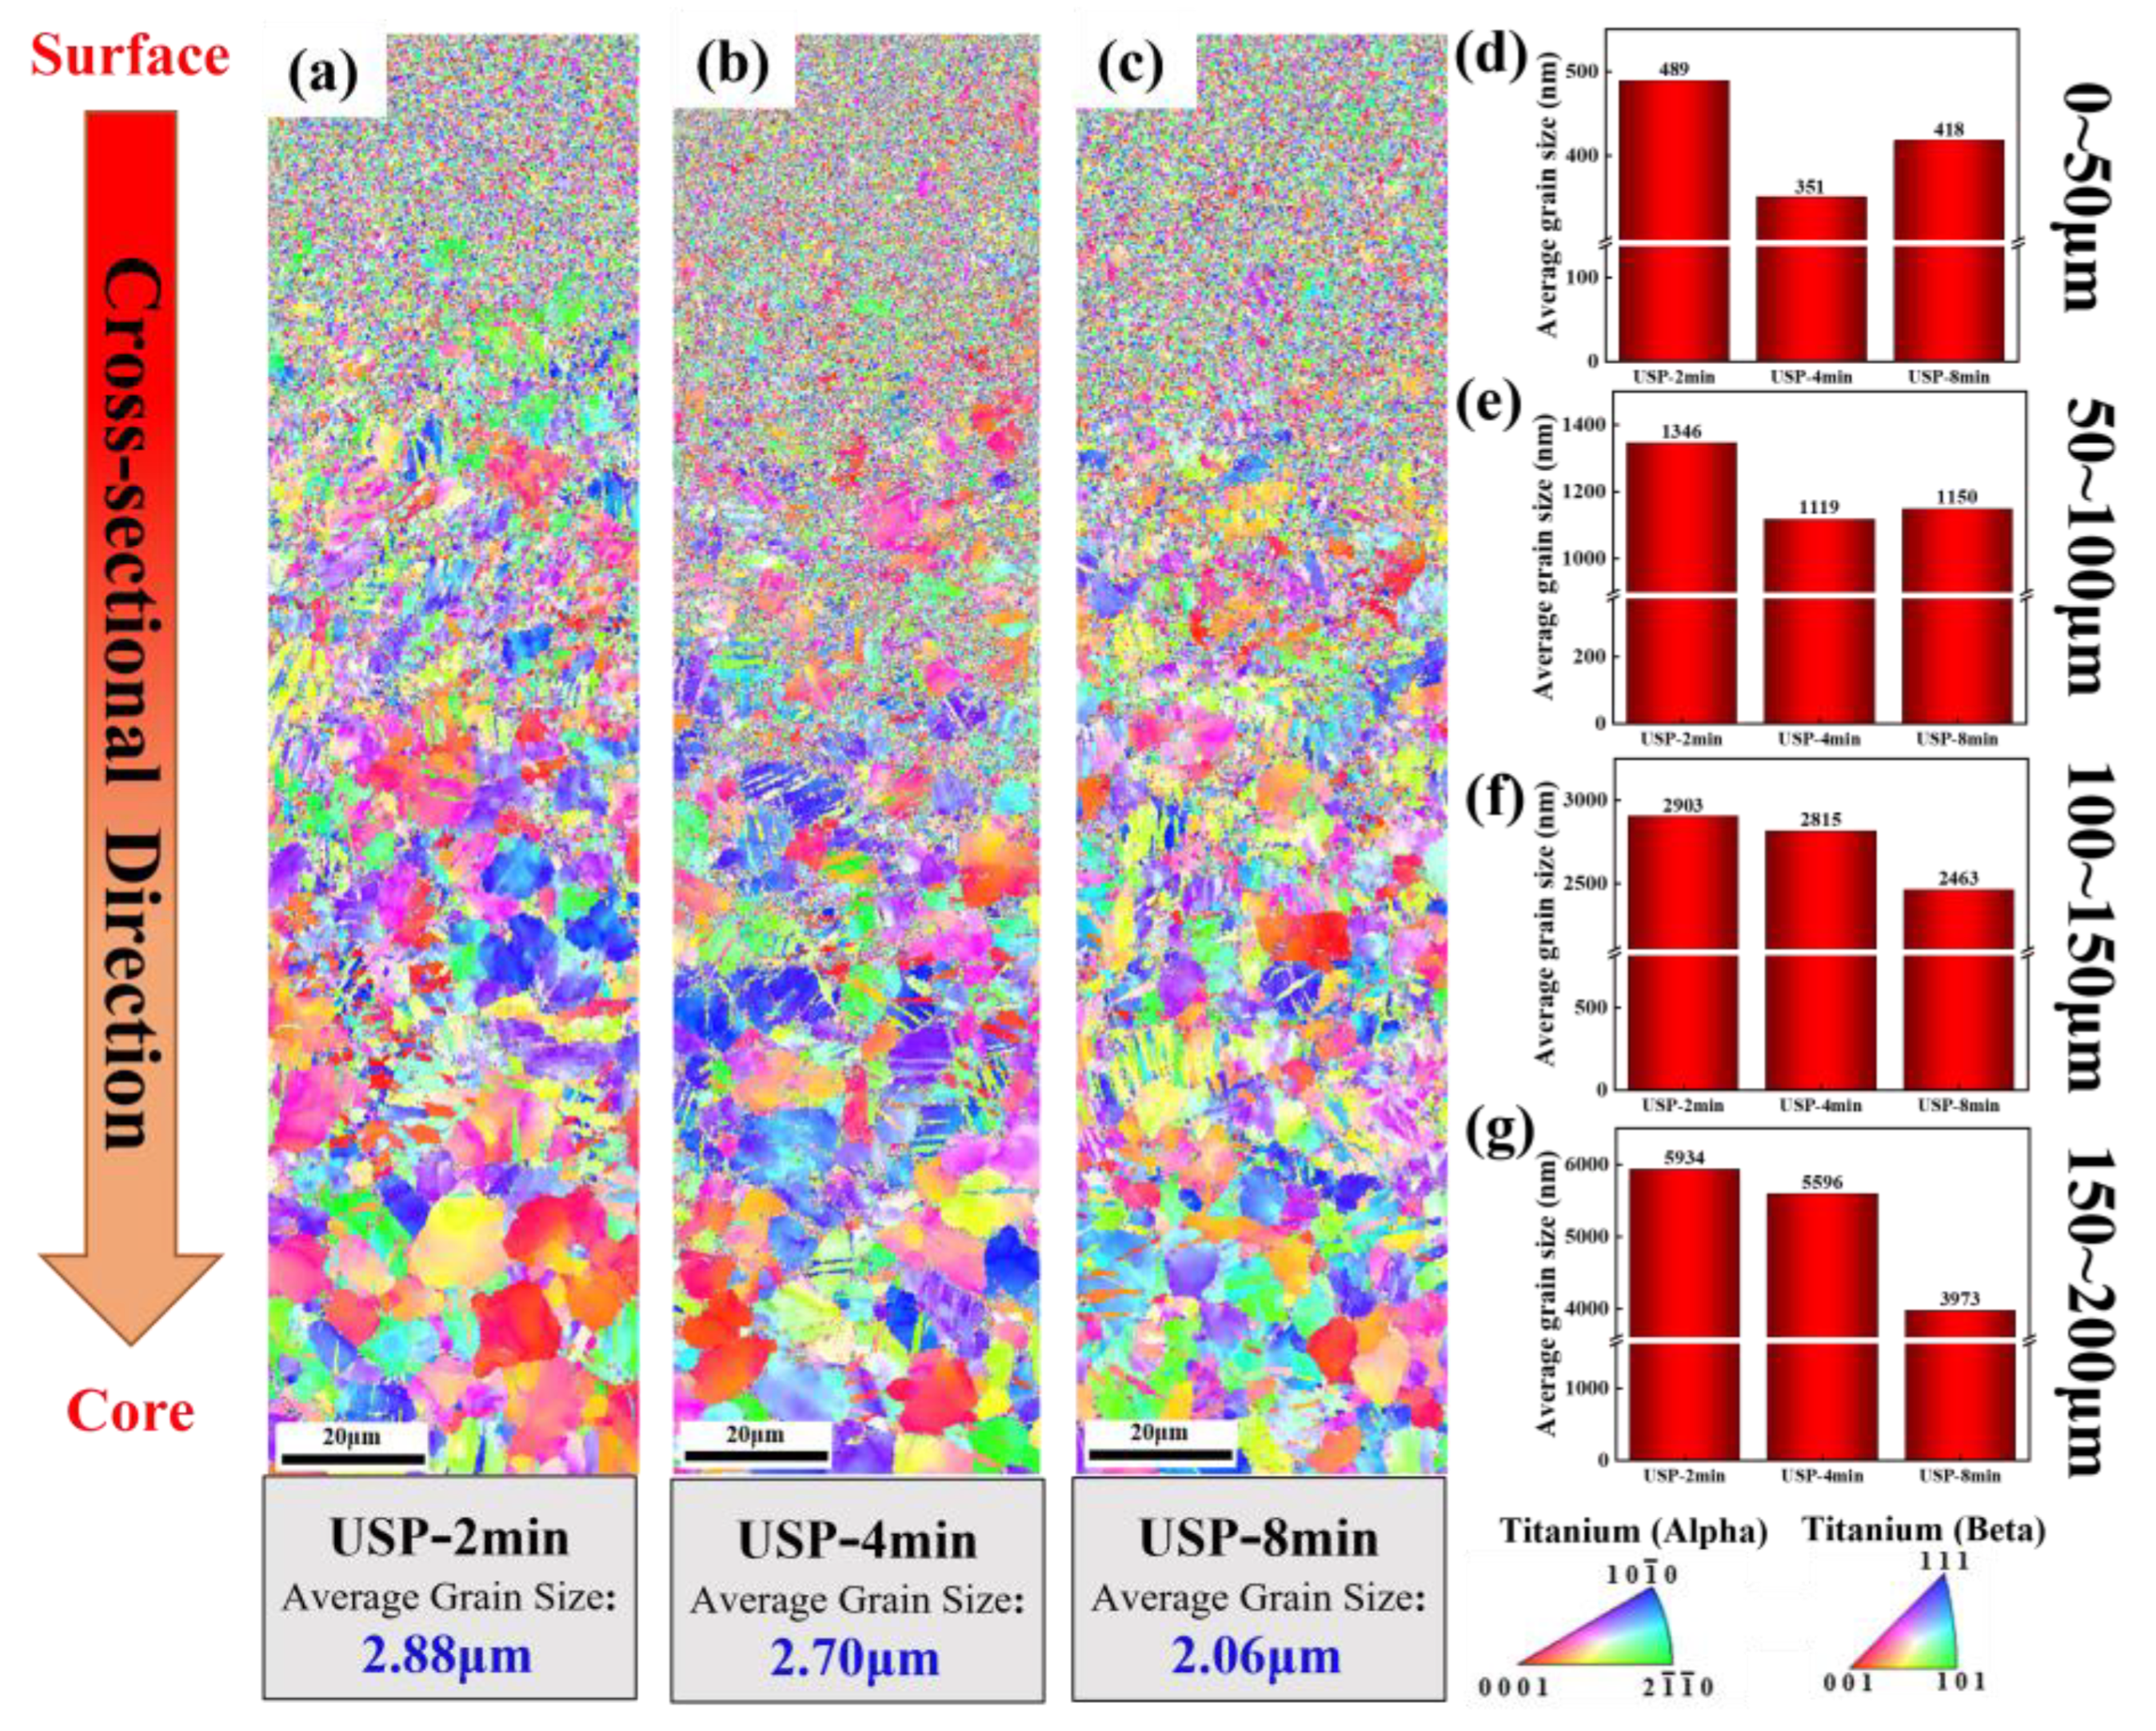
3.1.1. Microstructure Evolution
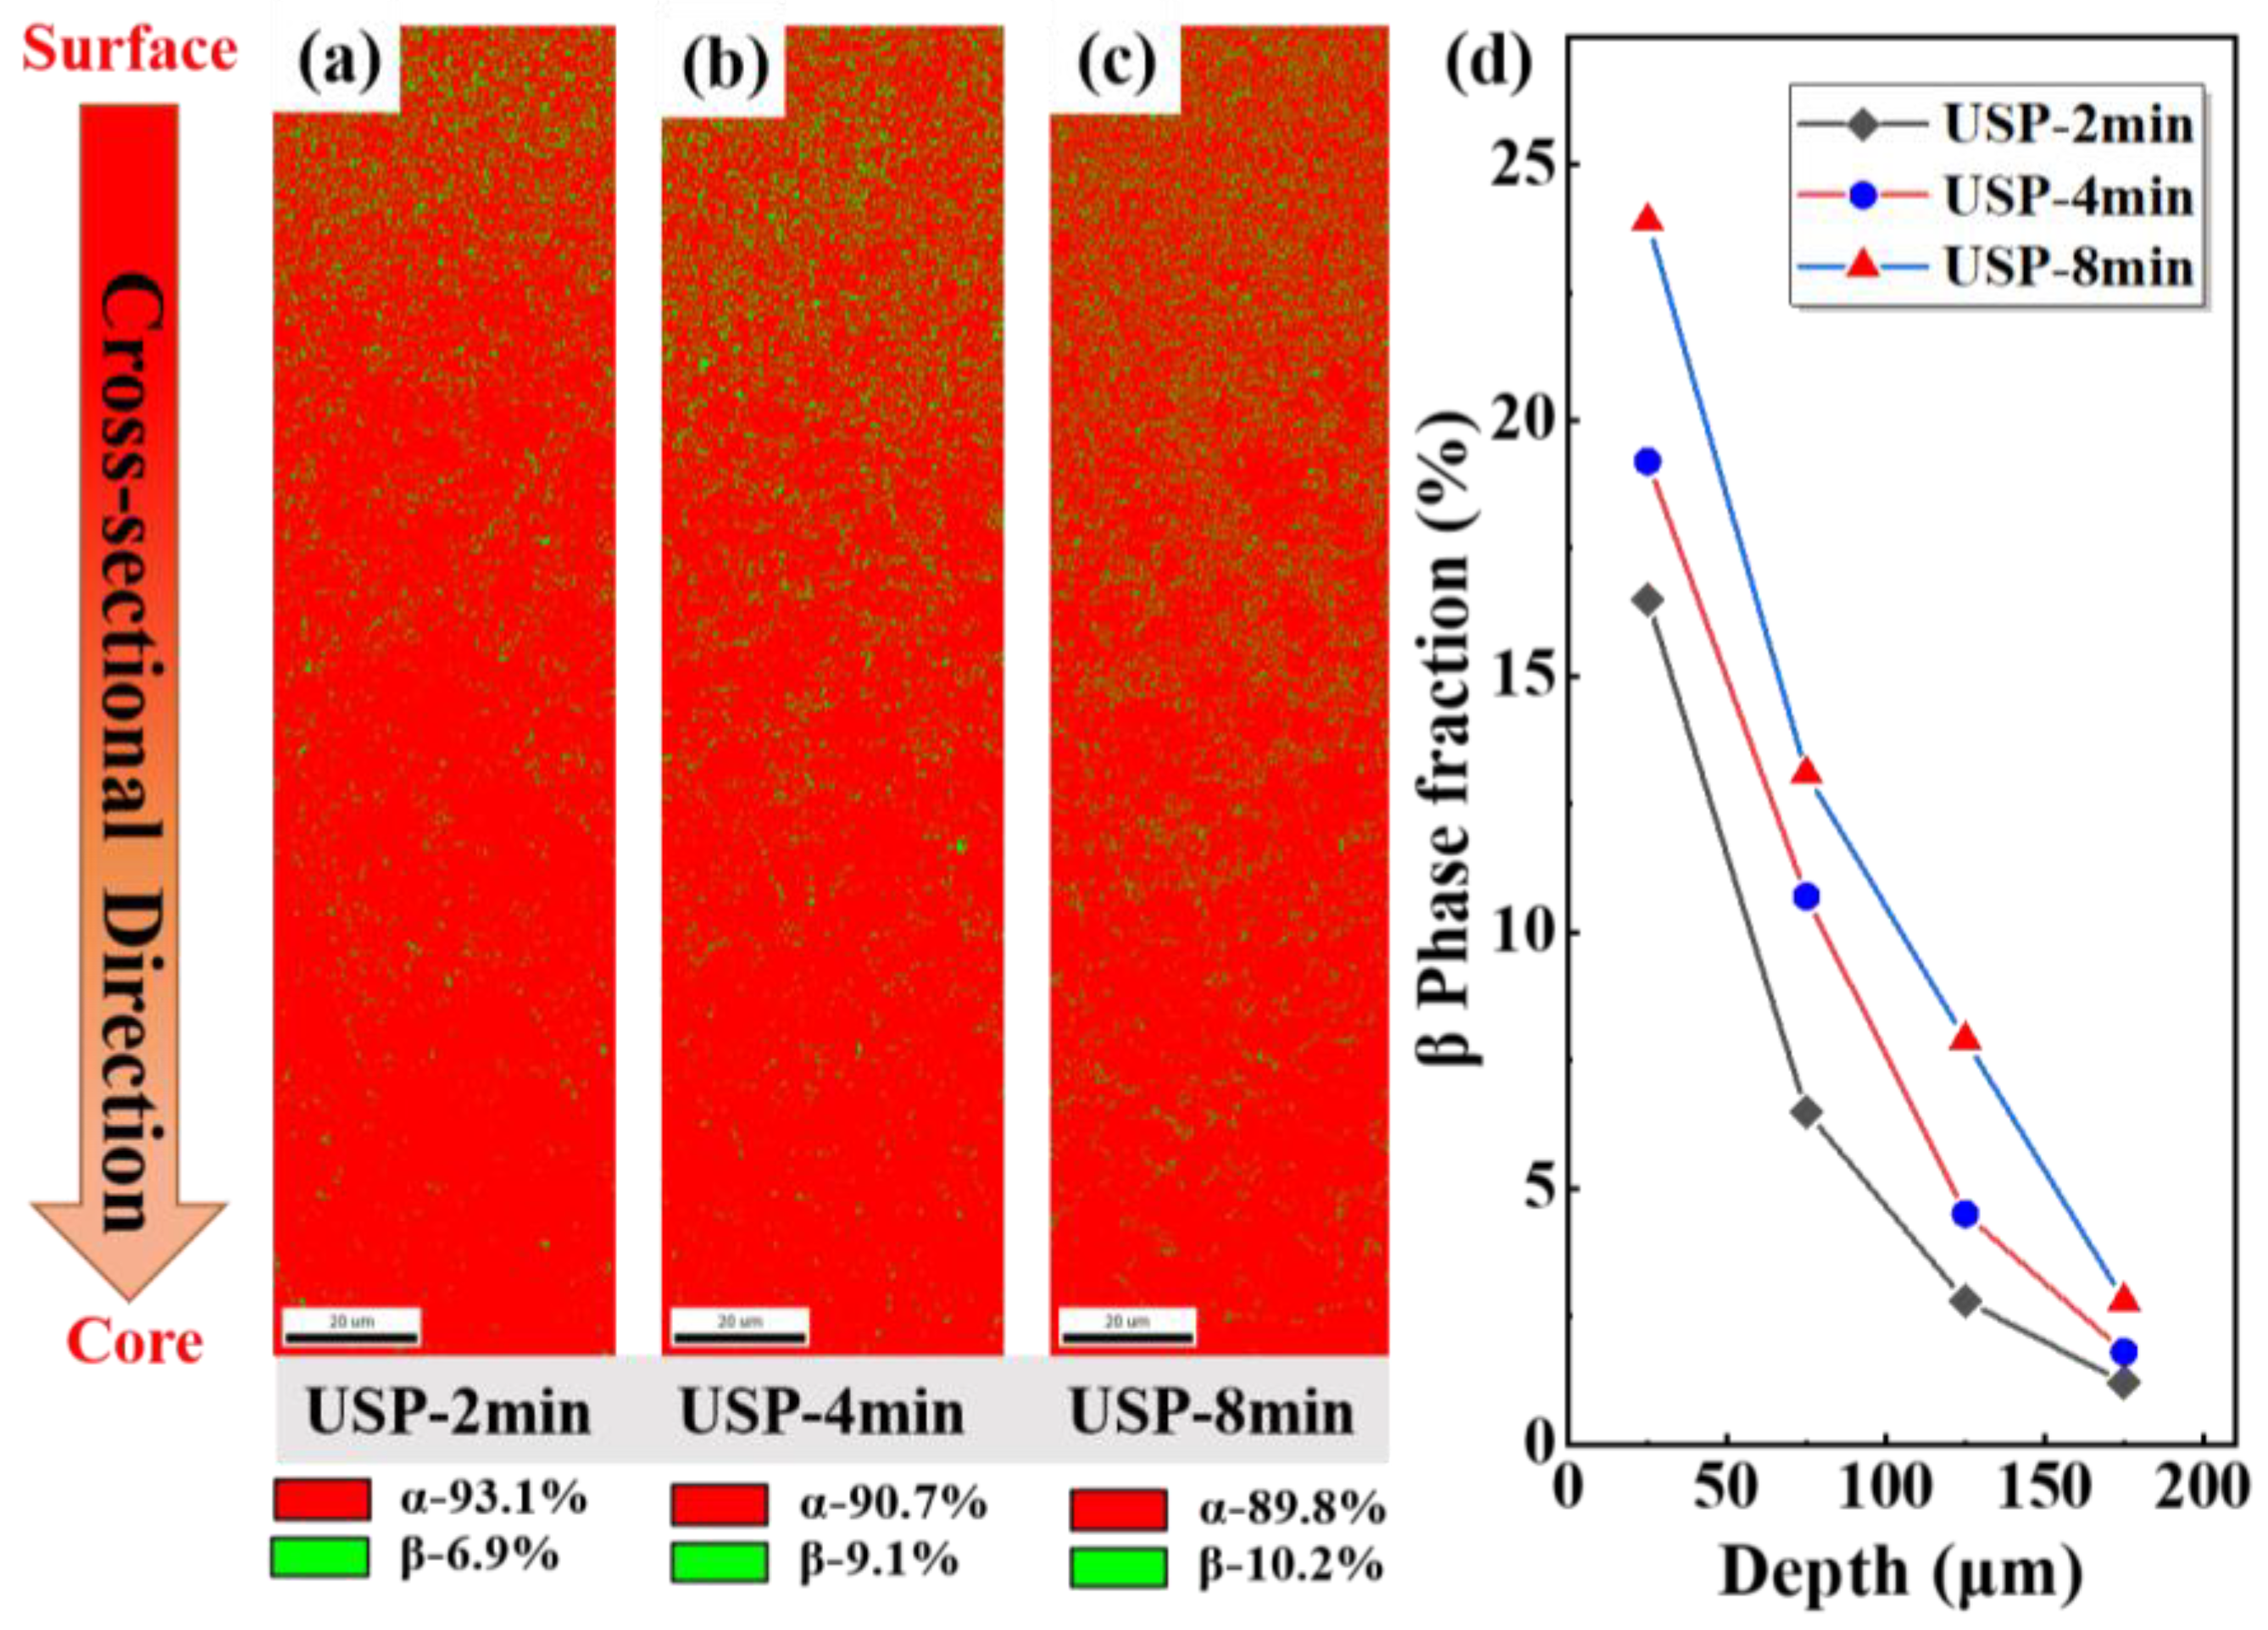
3.1.2. Phase Transformation
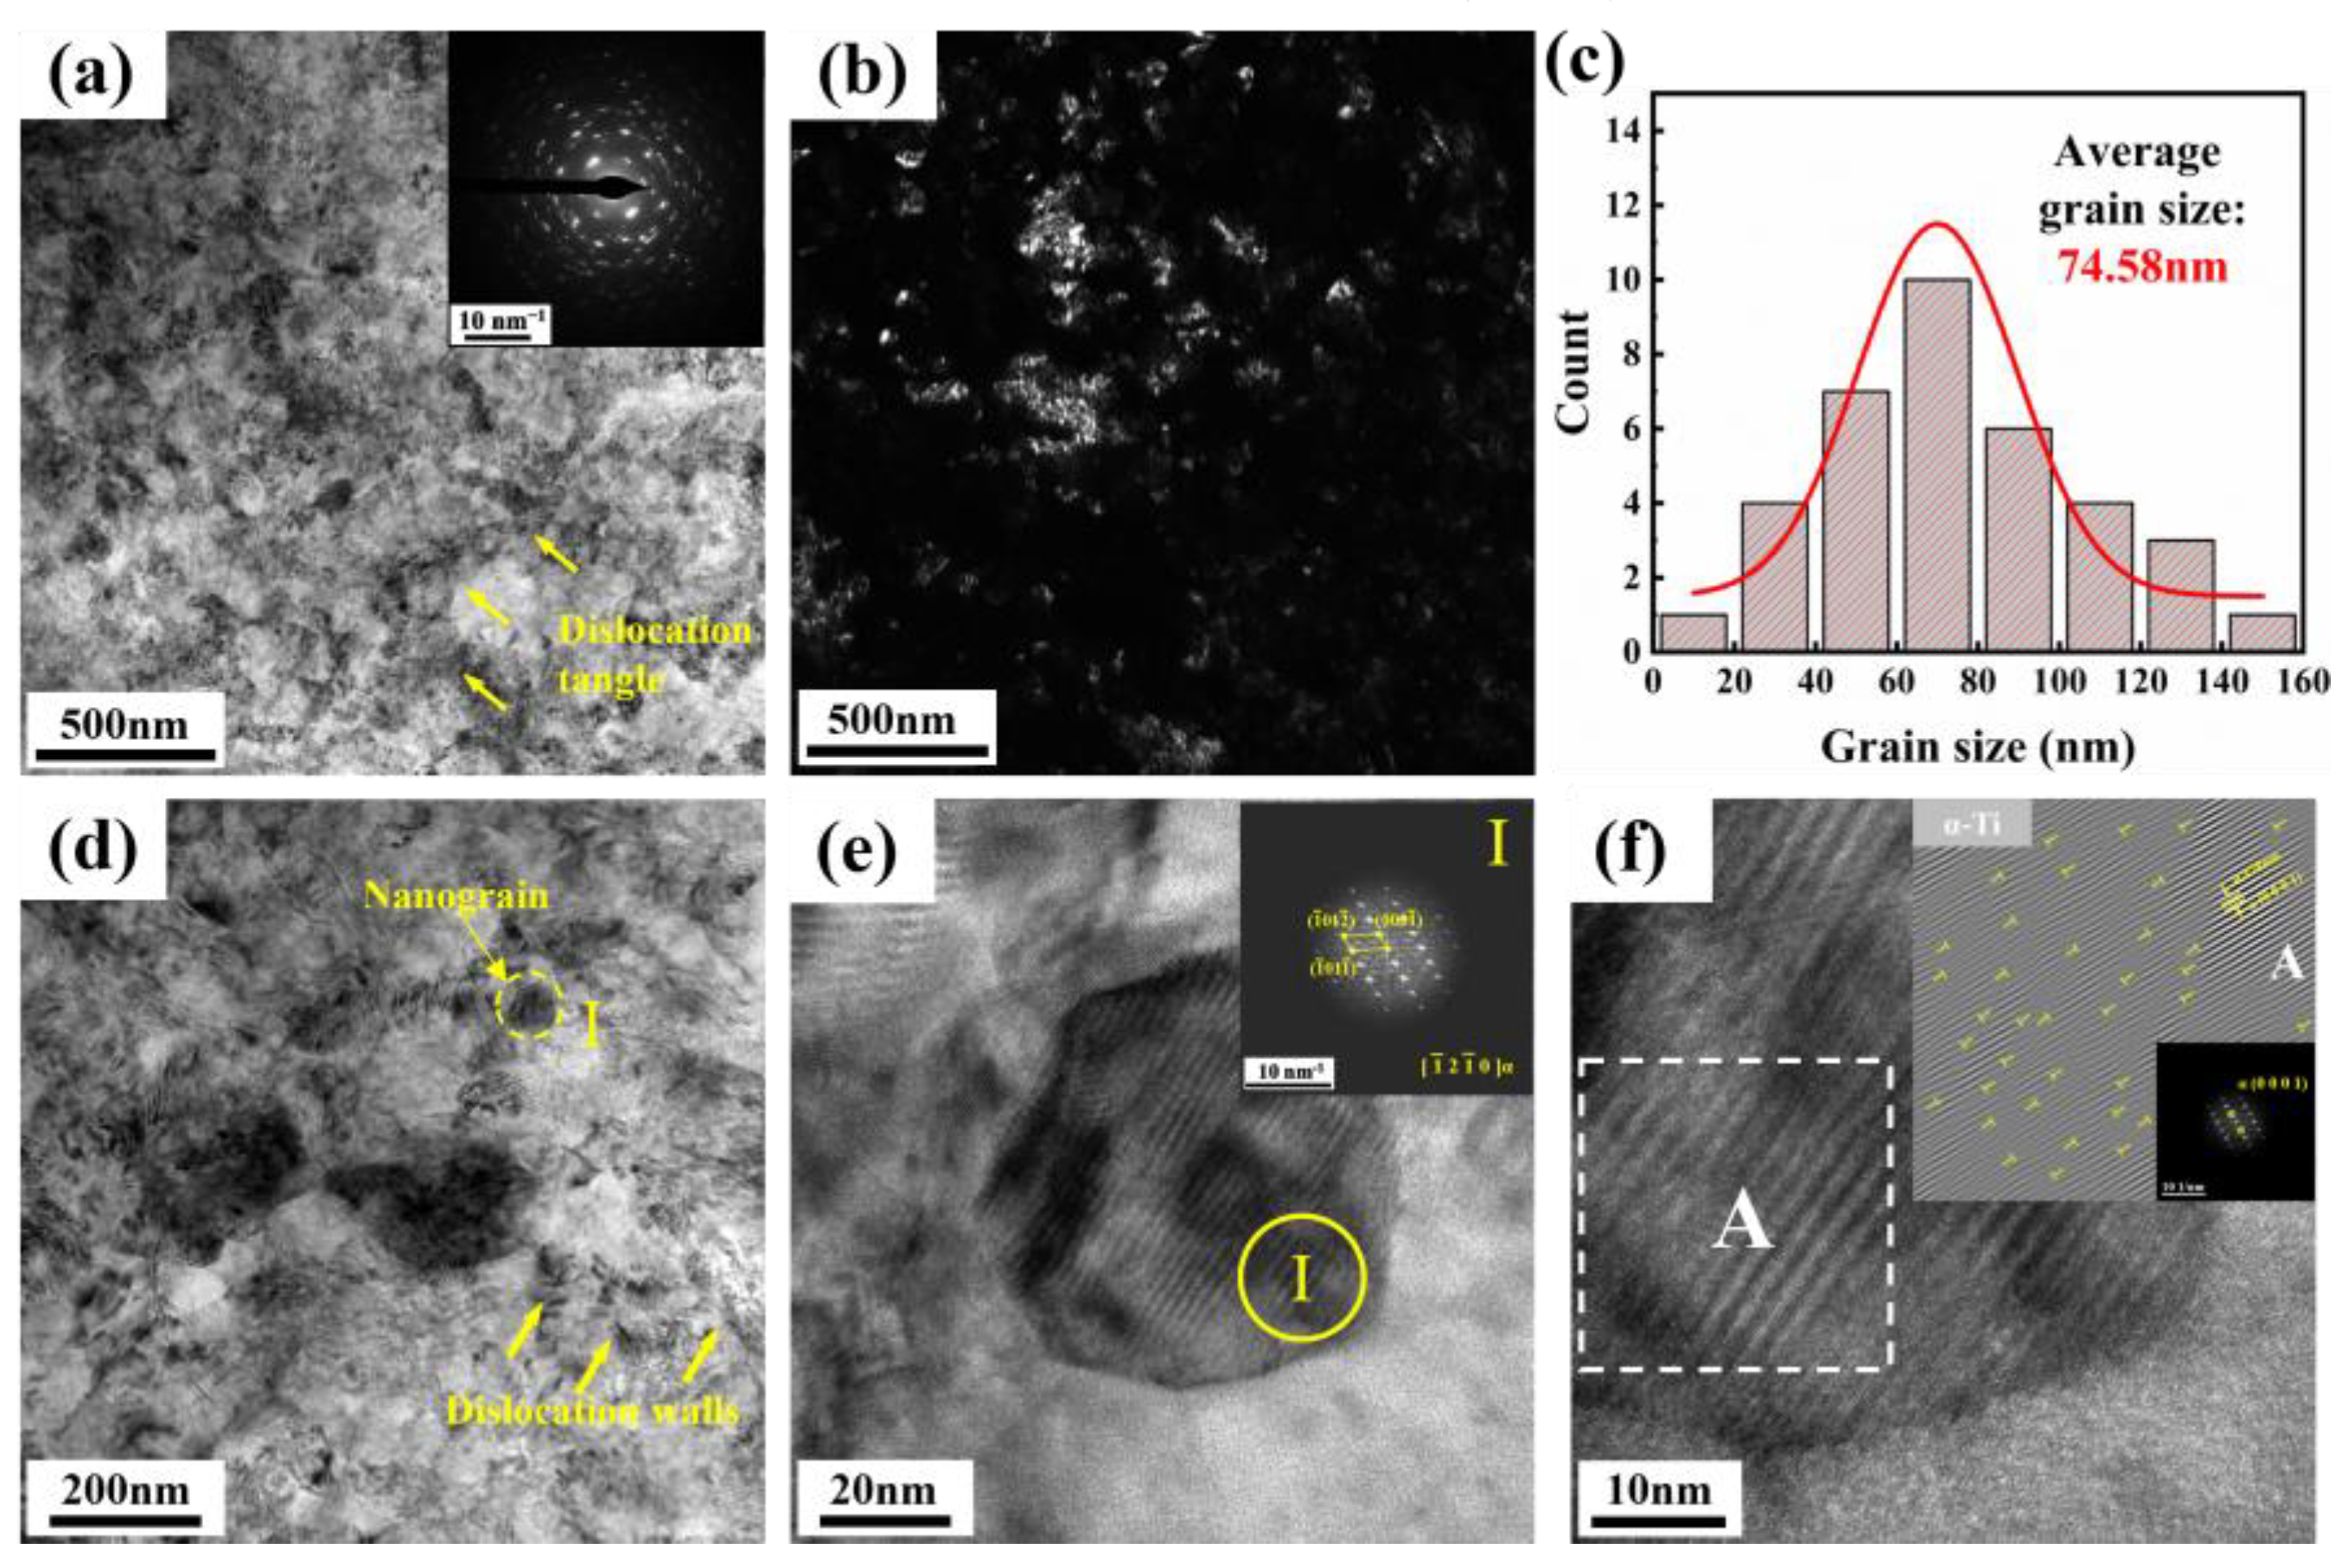
3.2. Surface Nanostructure
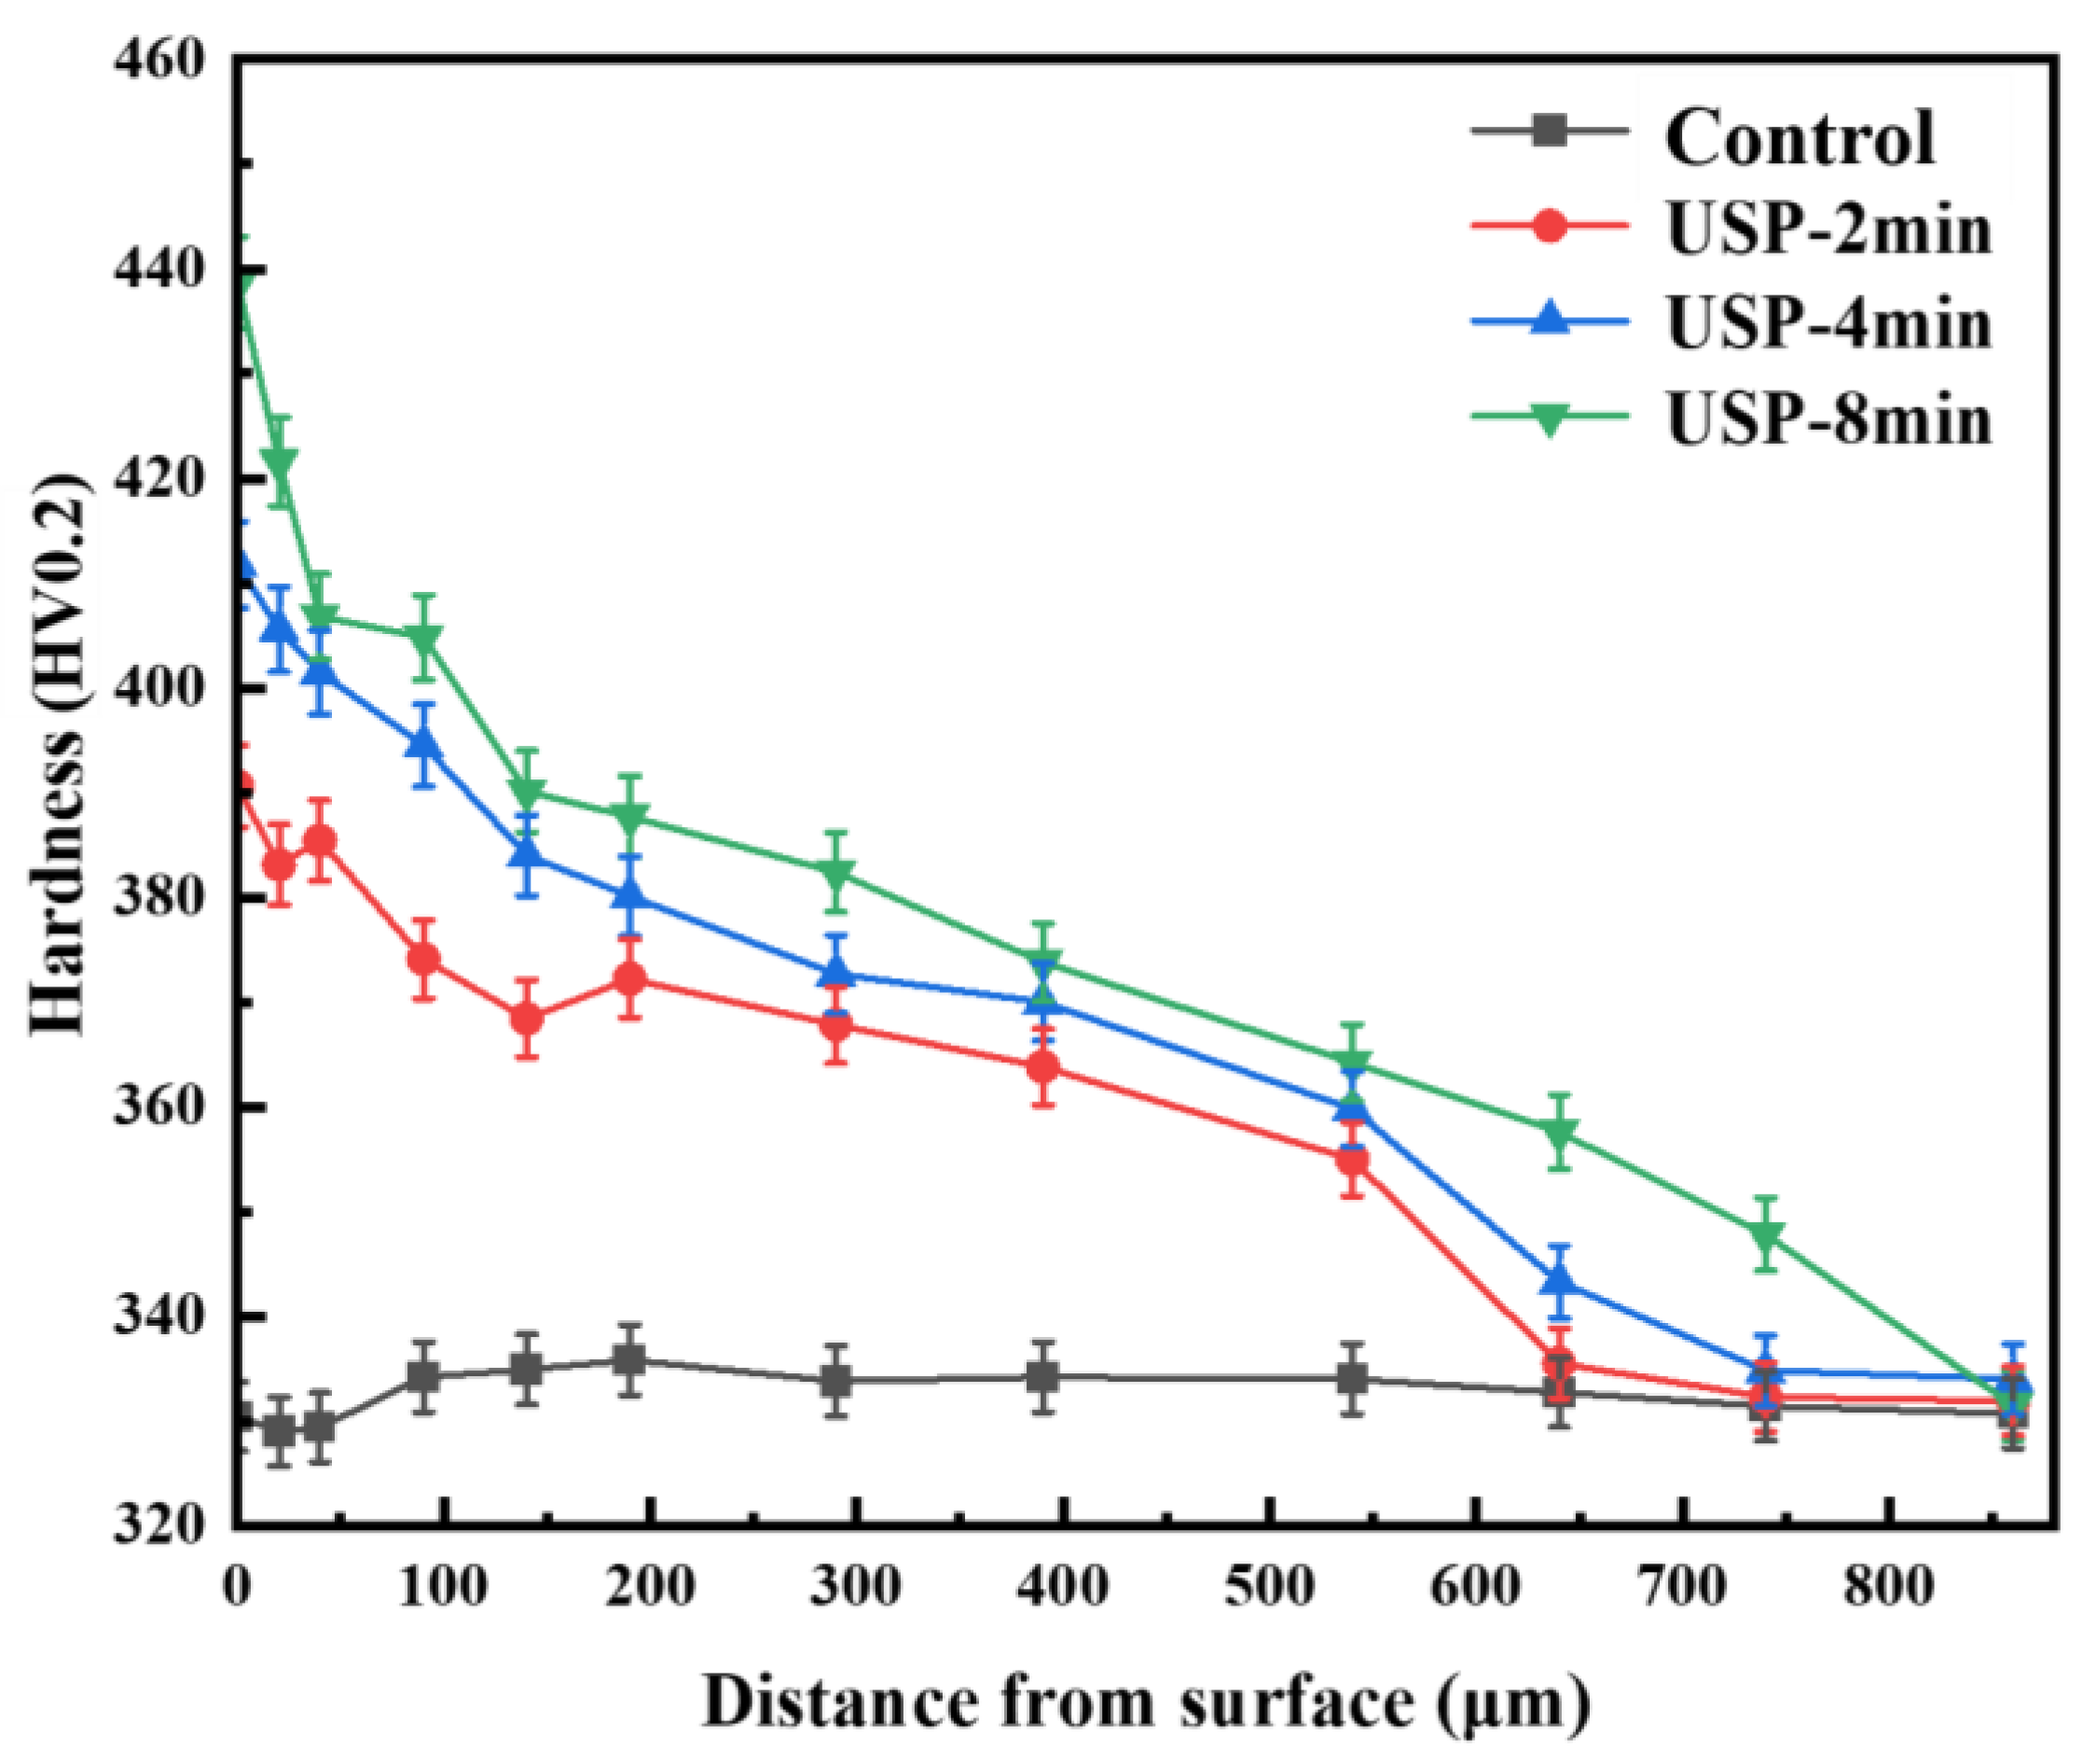
3.3. Microhardness
3.4. FEM Analysis and Motion Behavior Observation
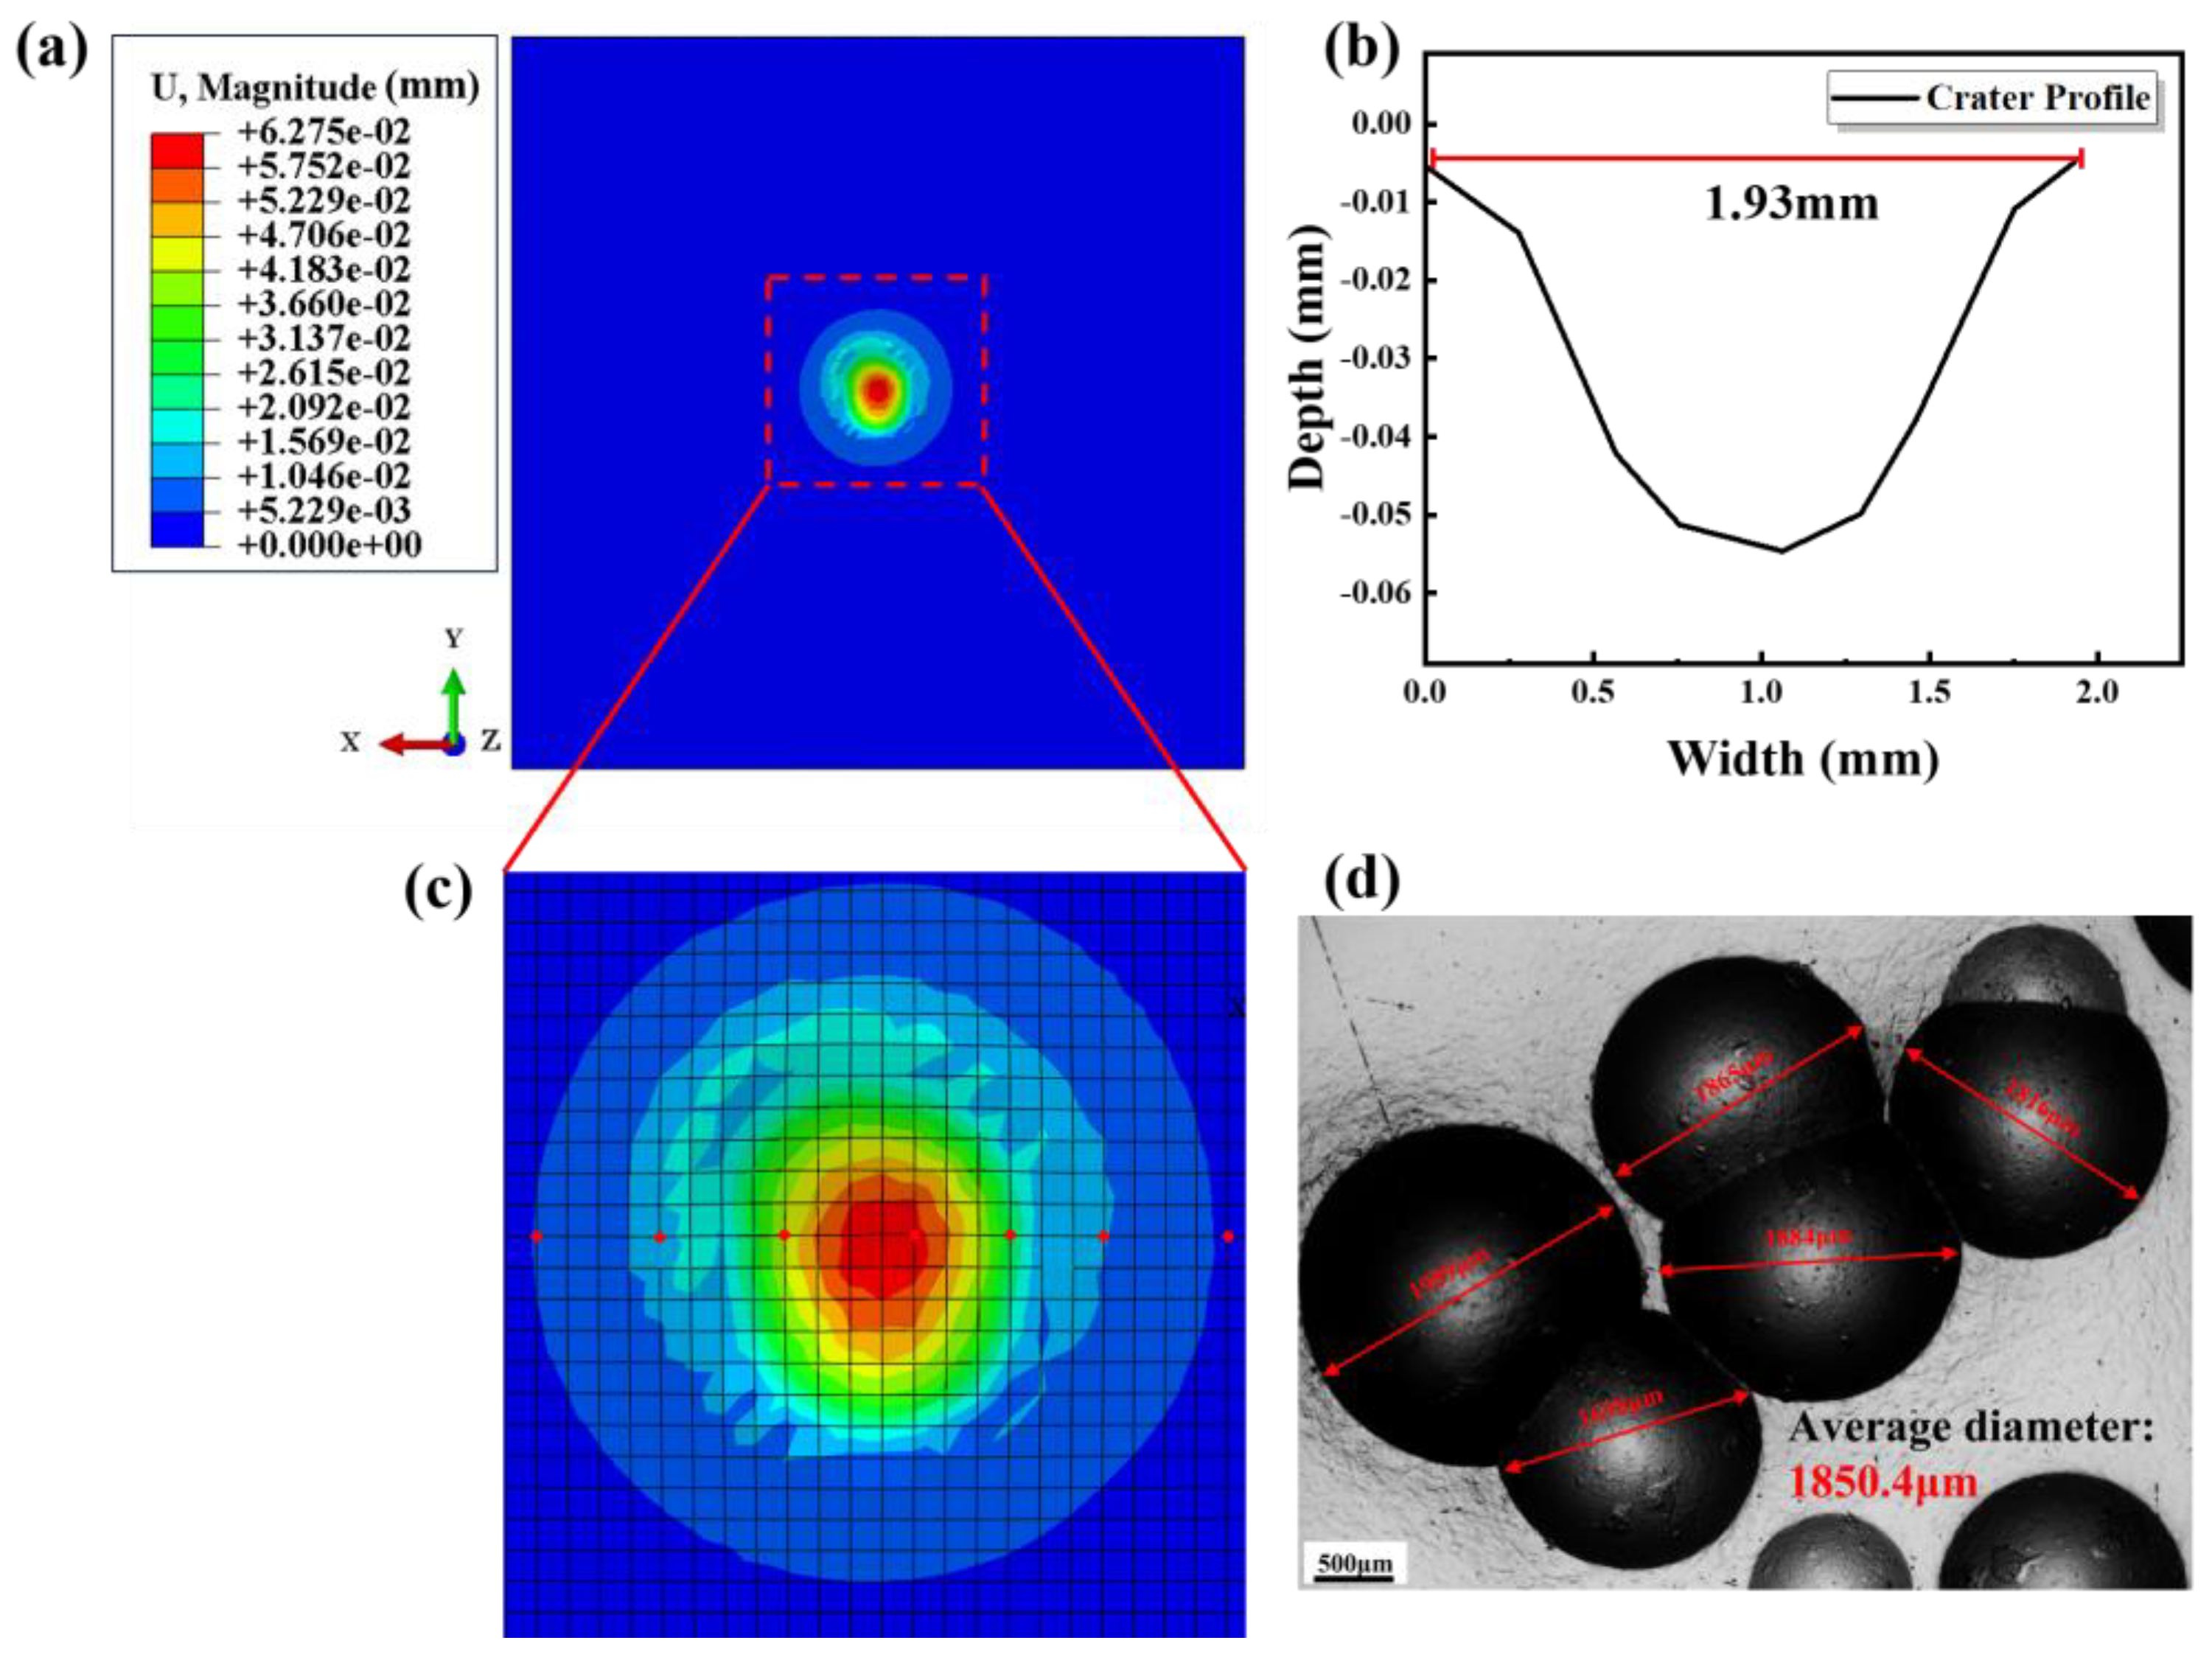
3.4.1. Single Impact Investigation
3.4.2. Experimental Validation of the FE Model
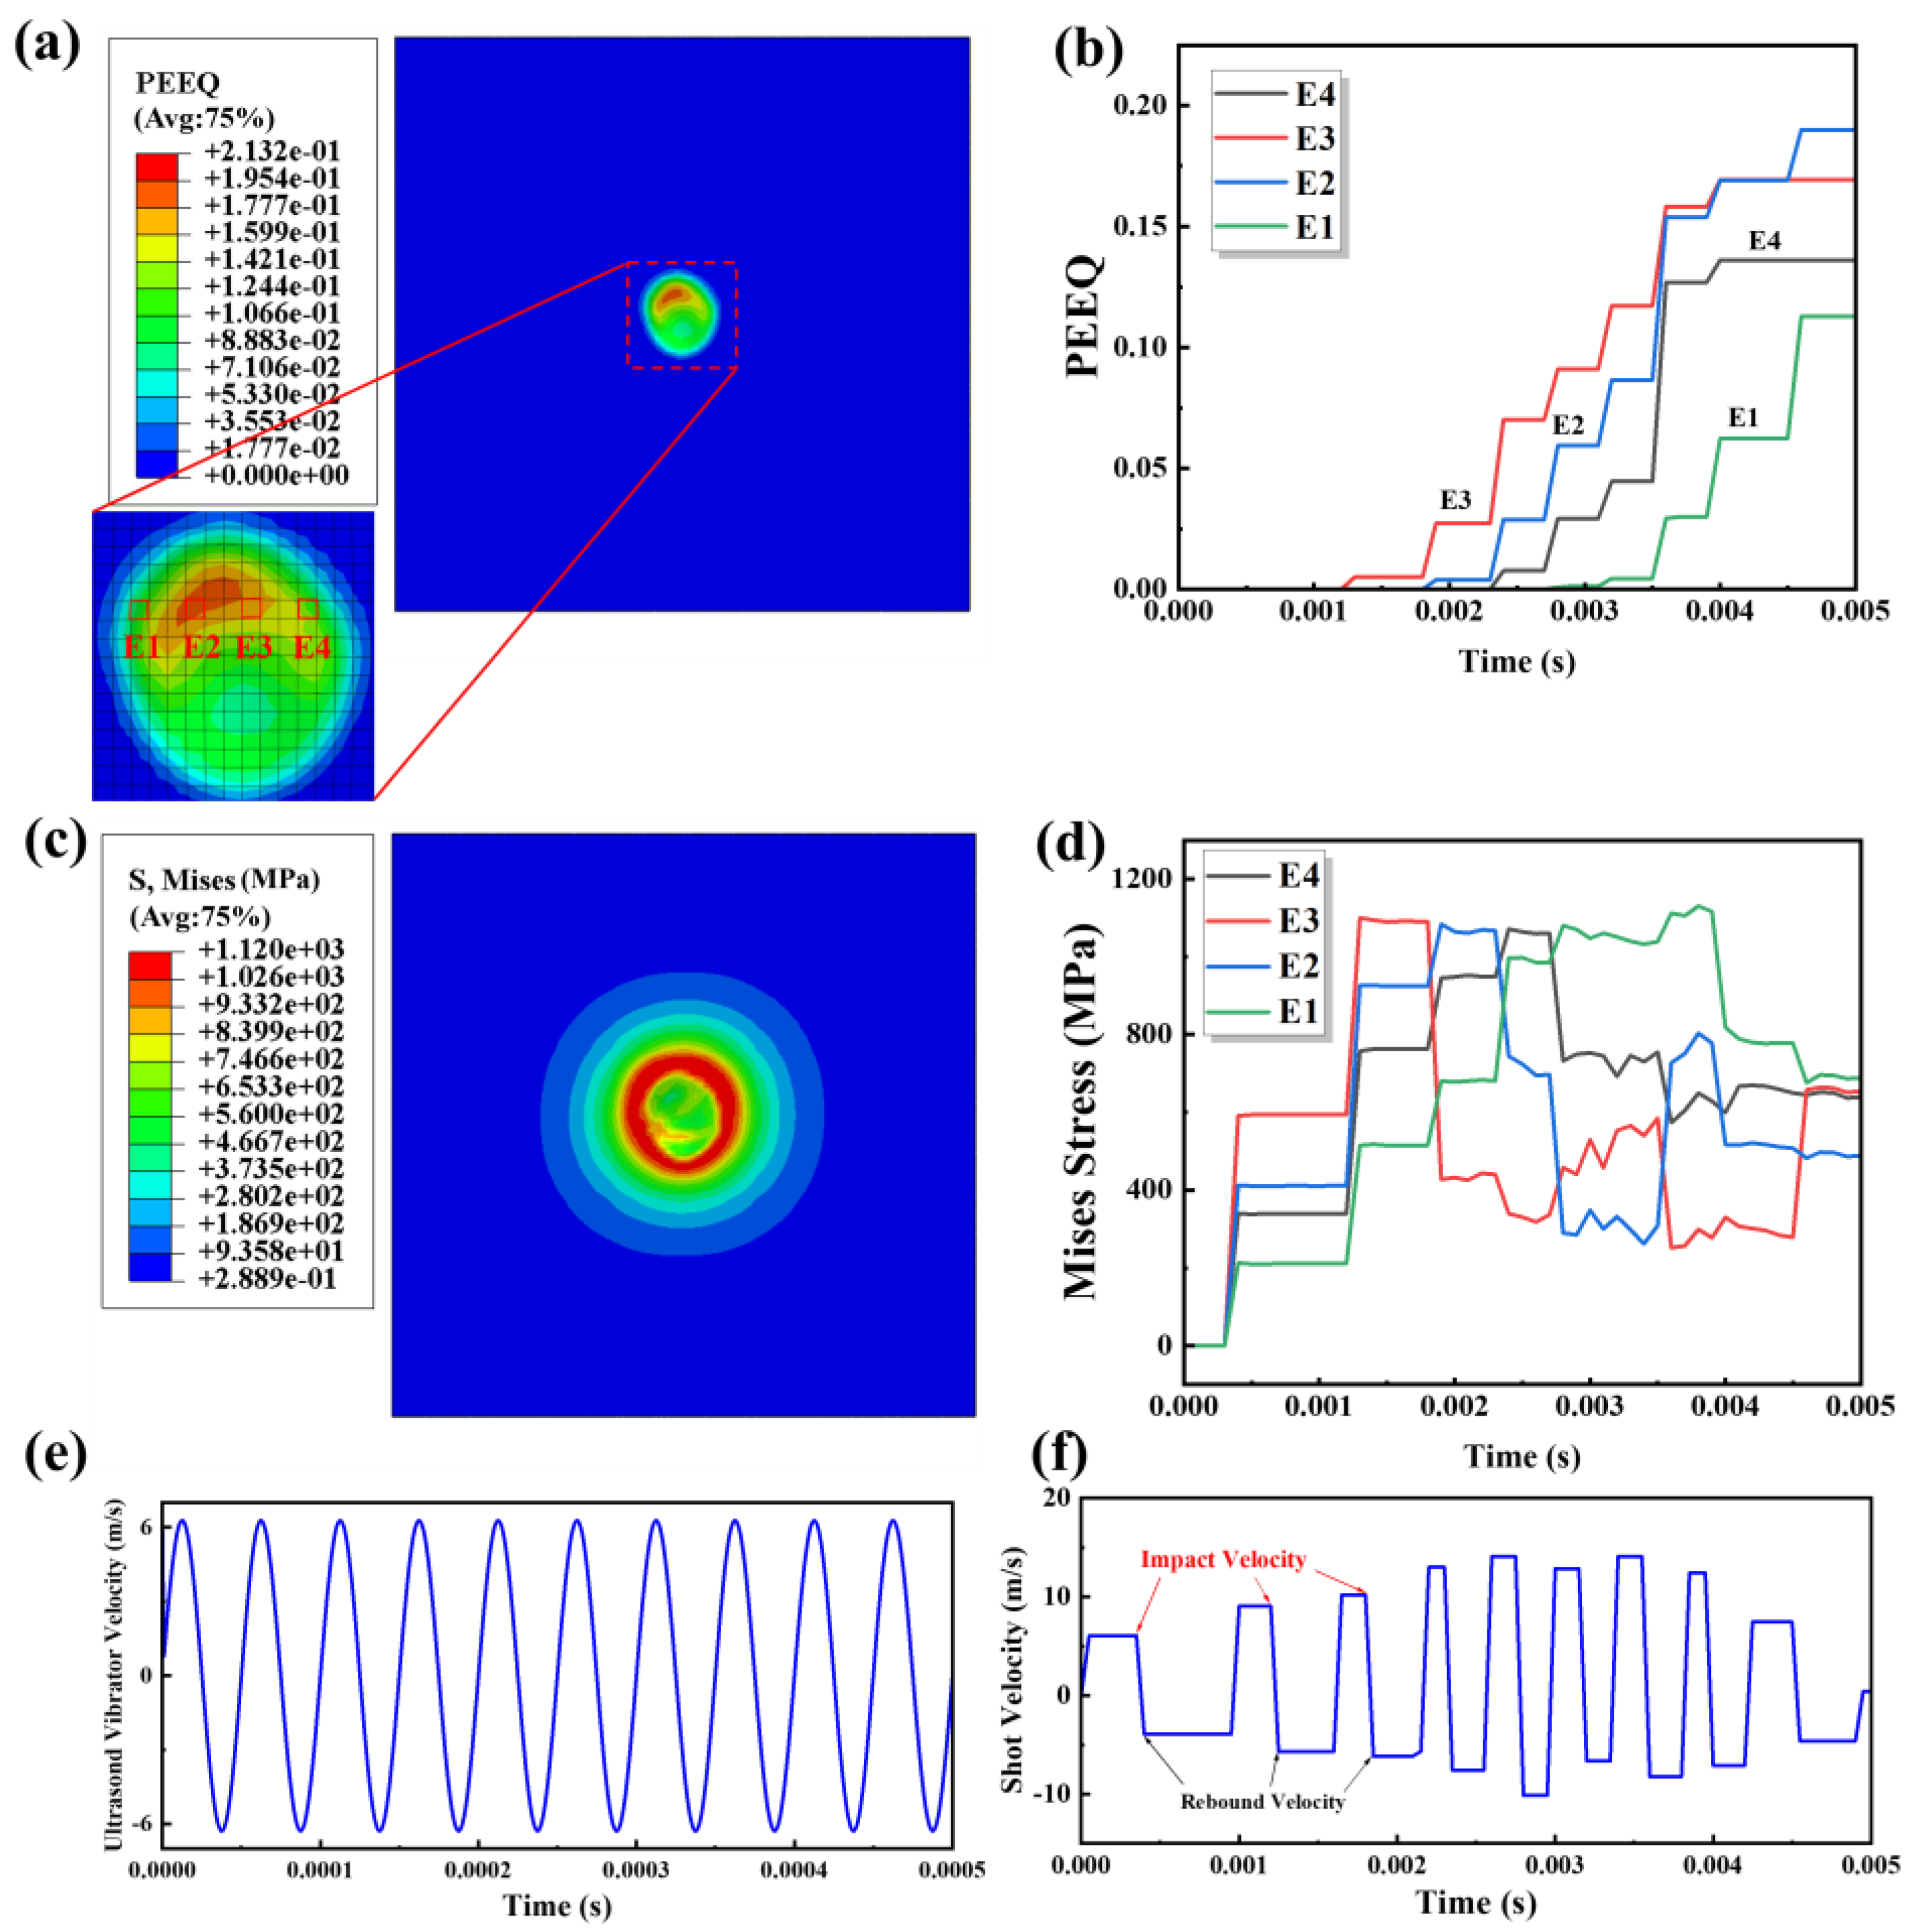
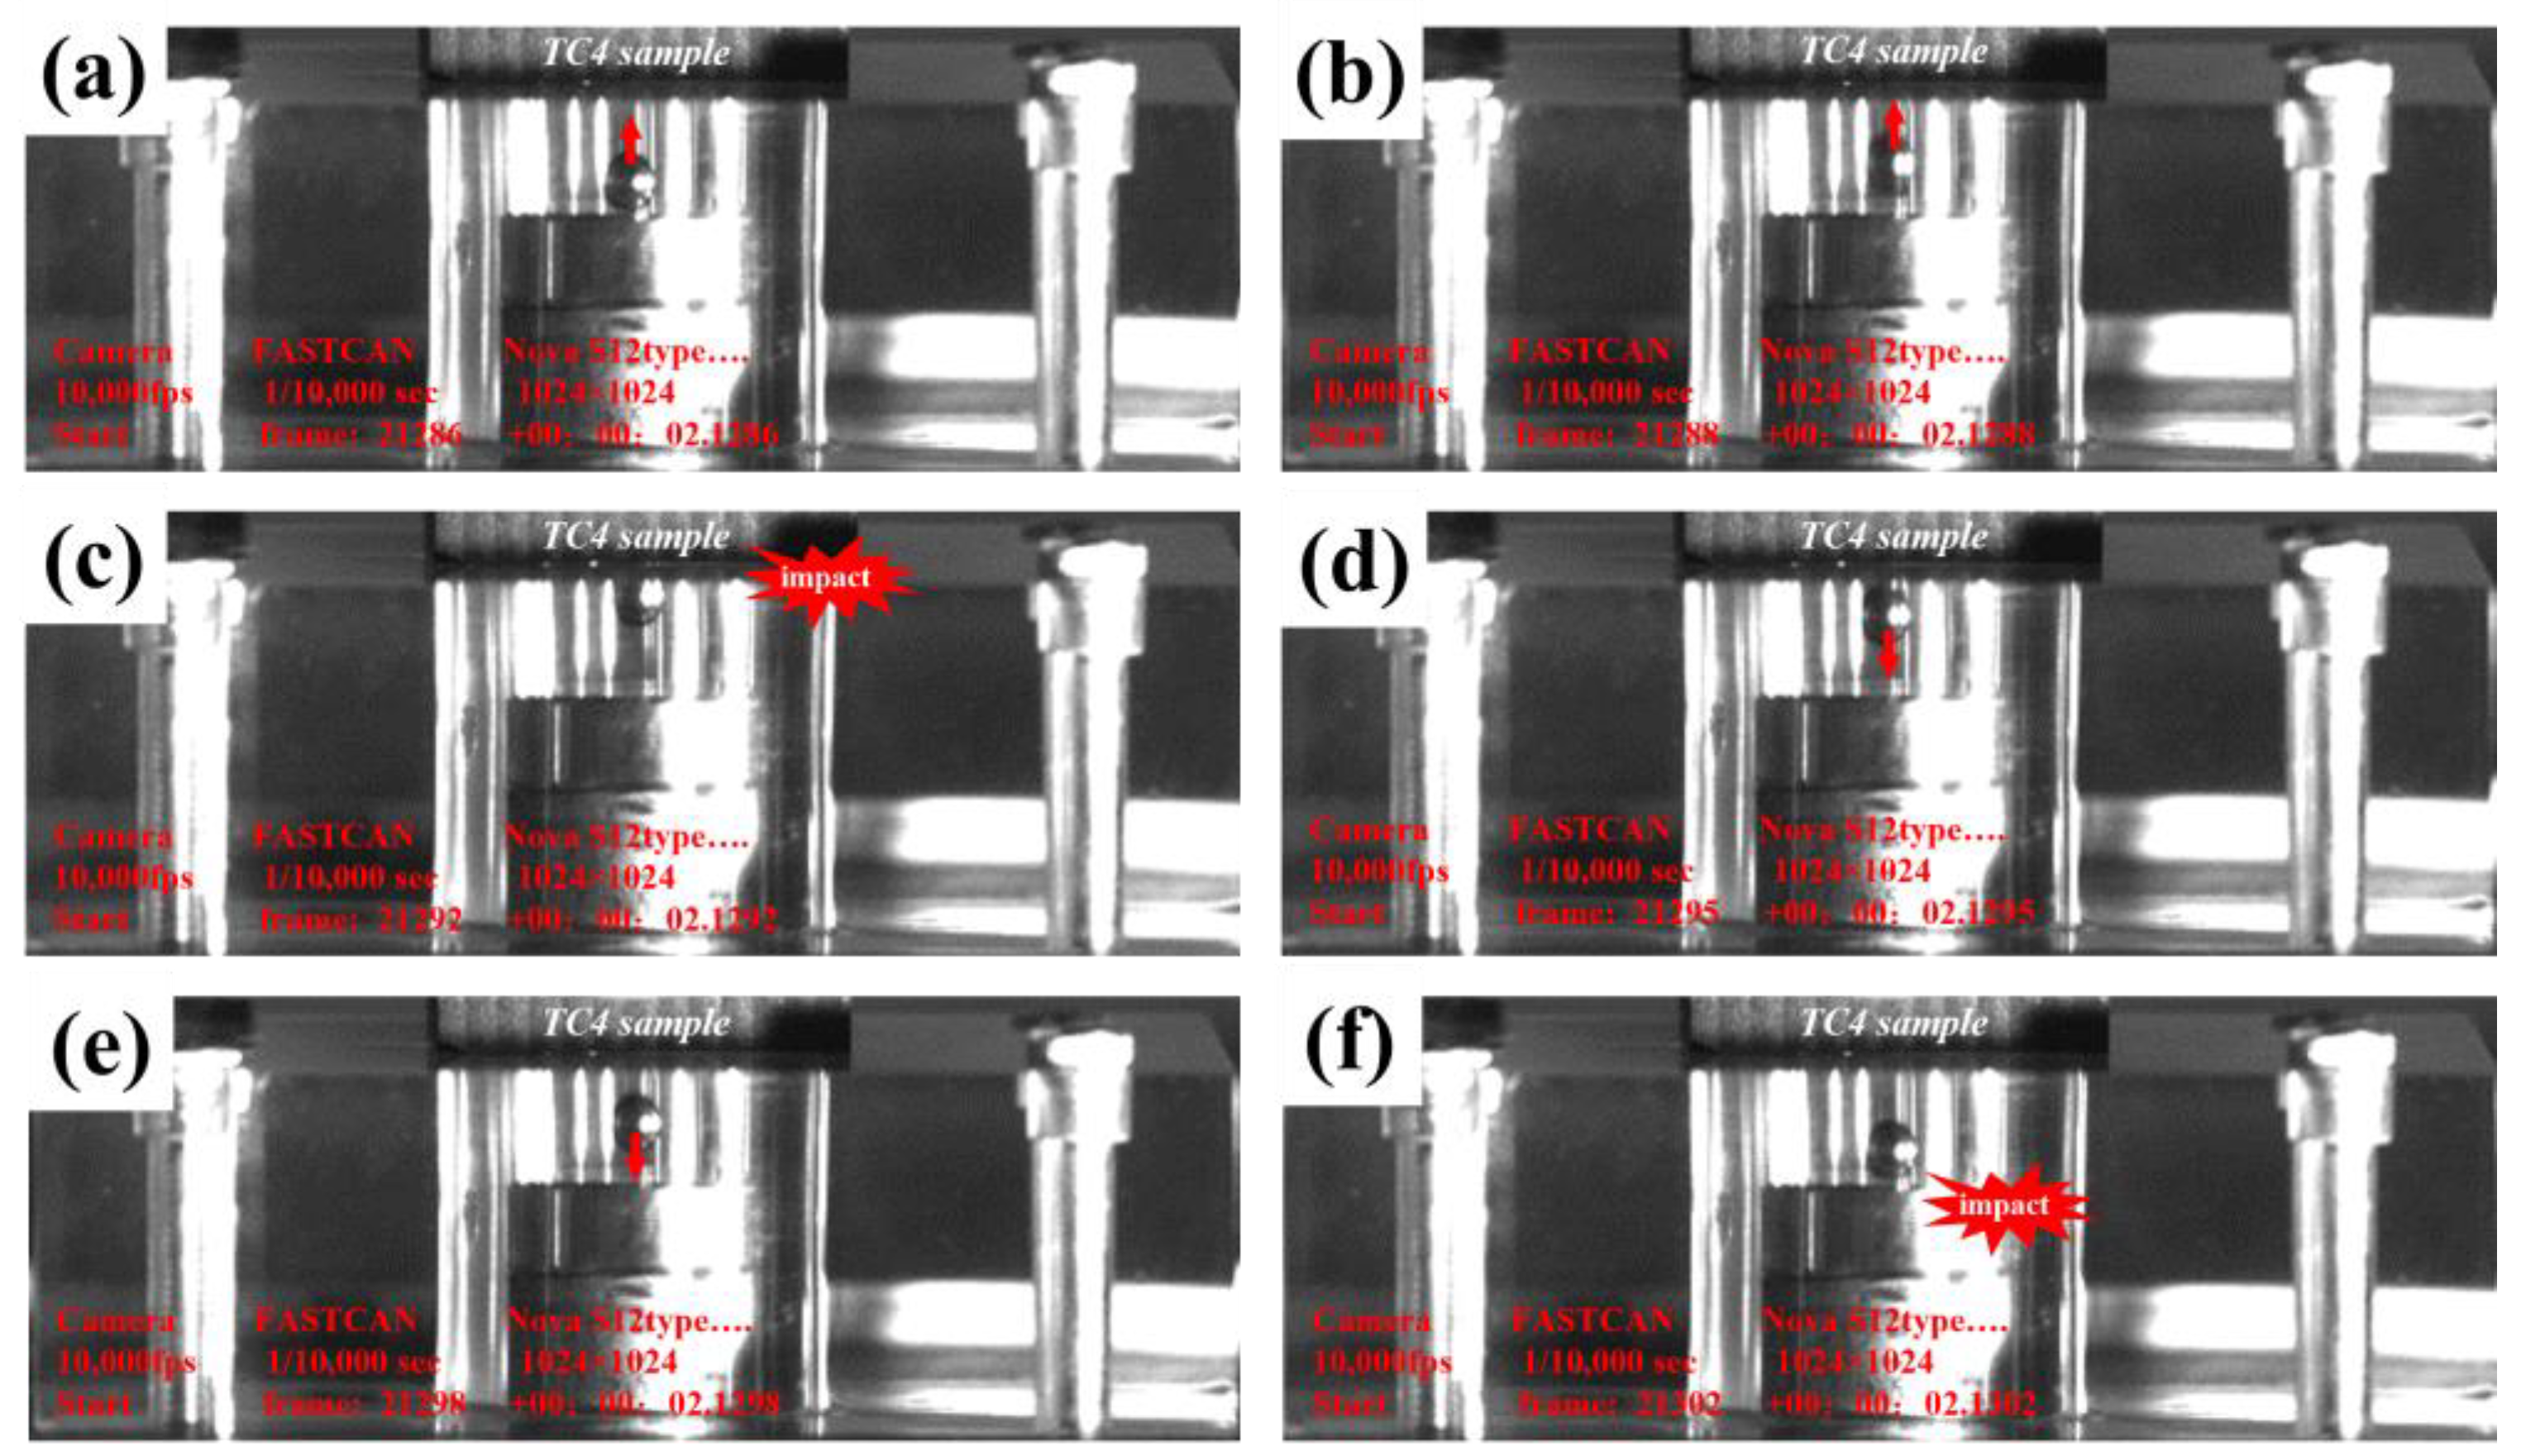
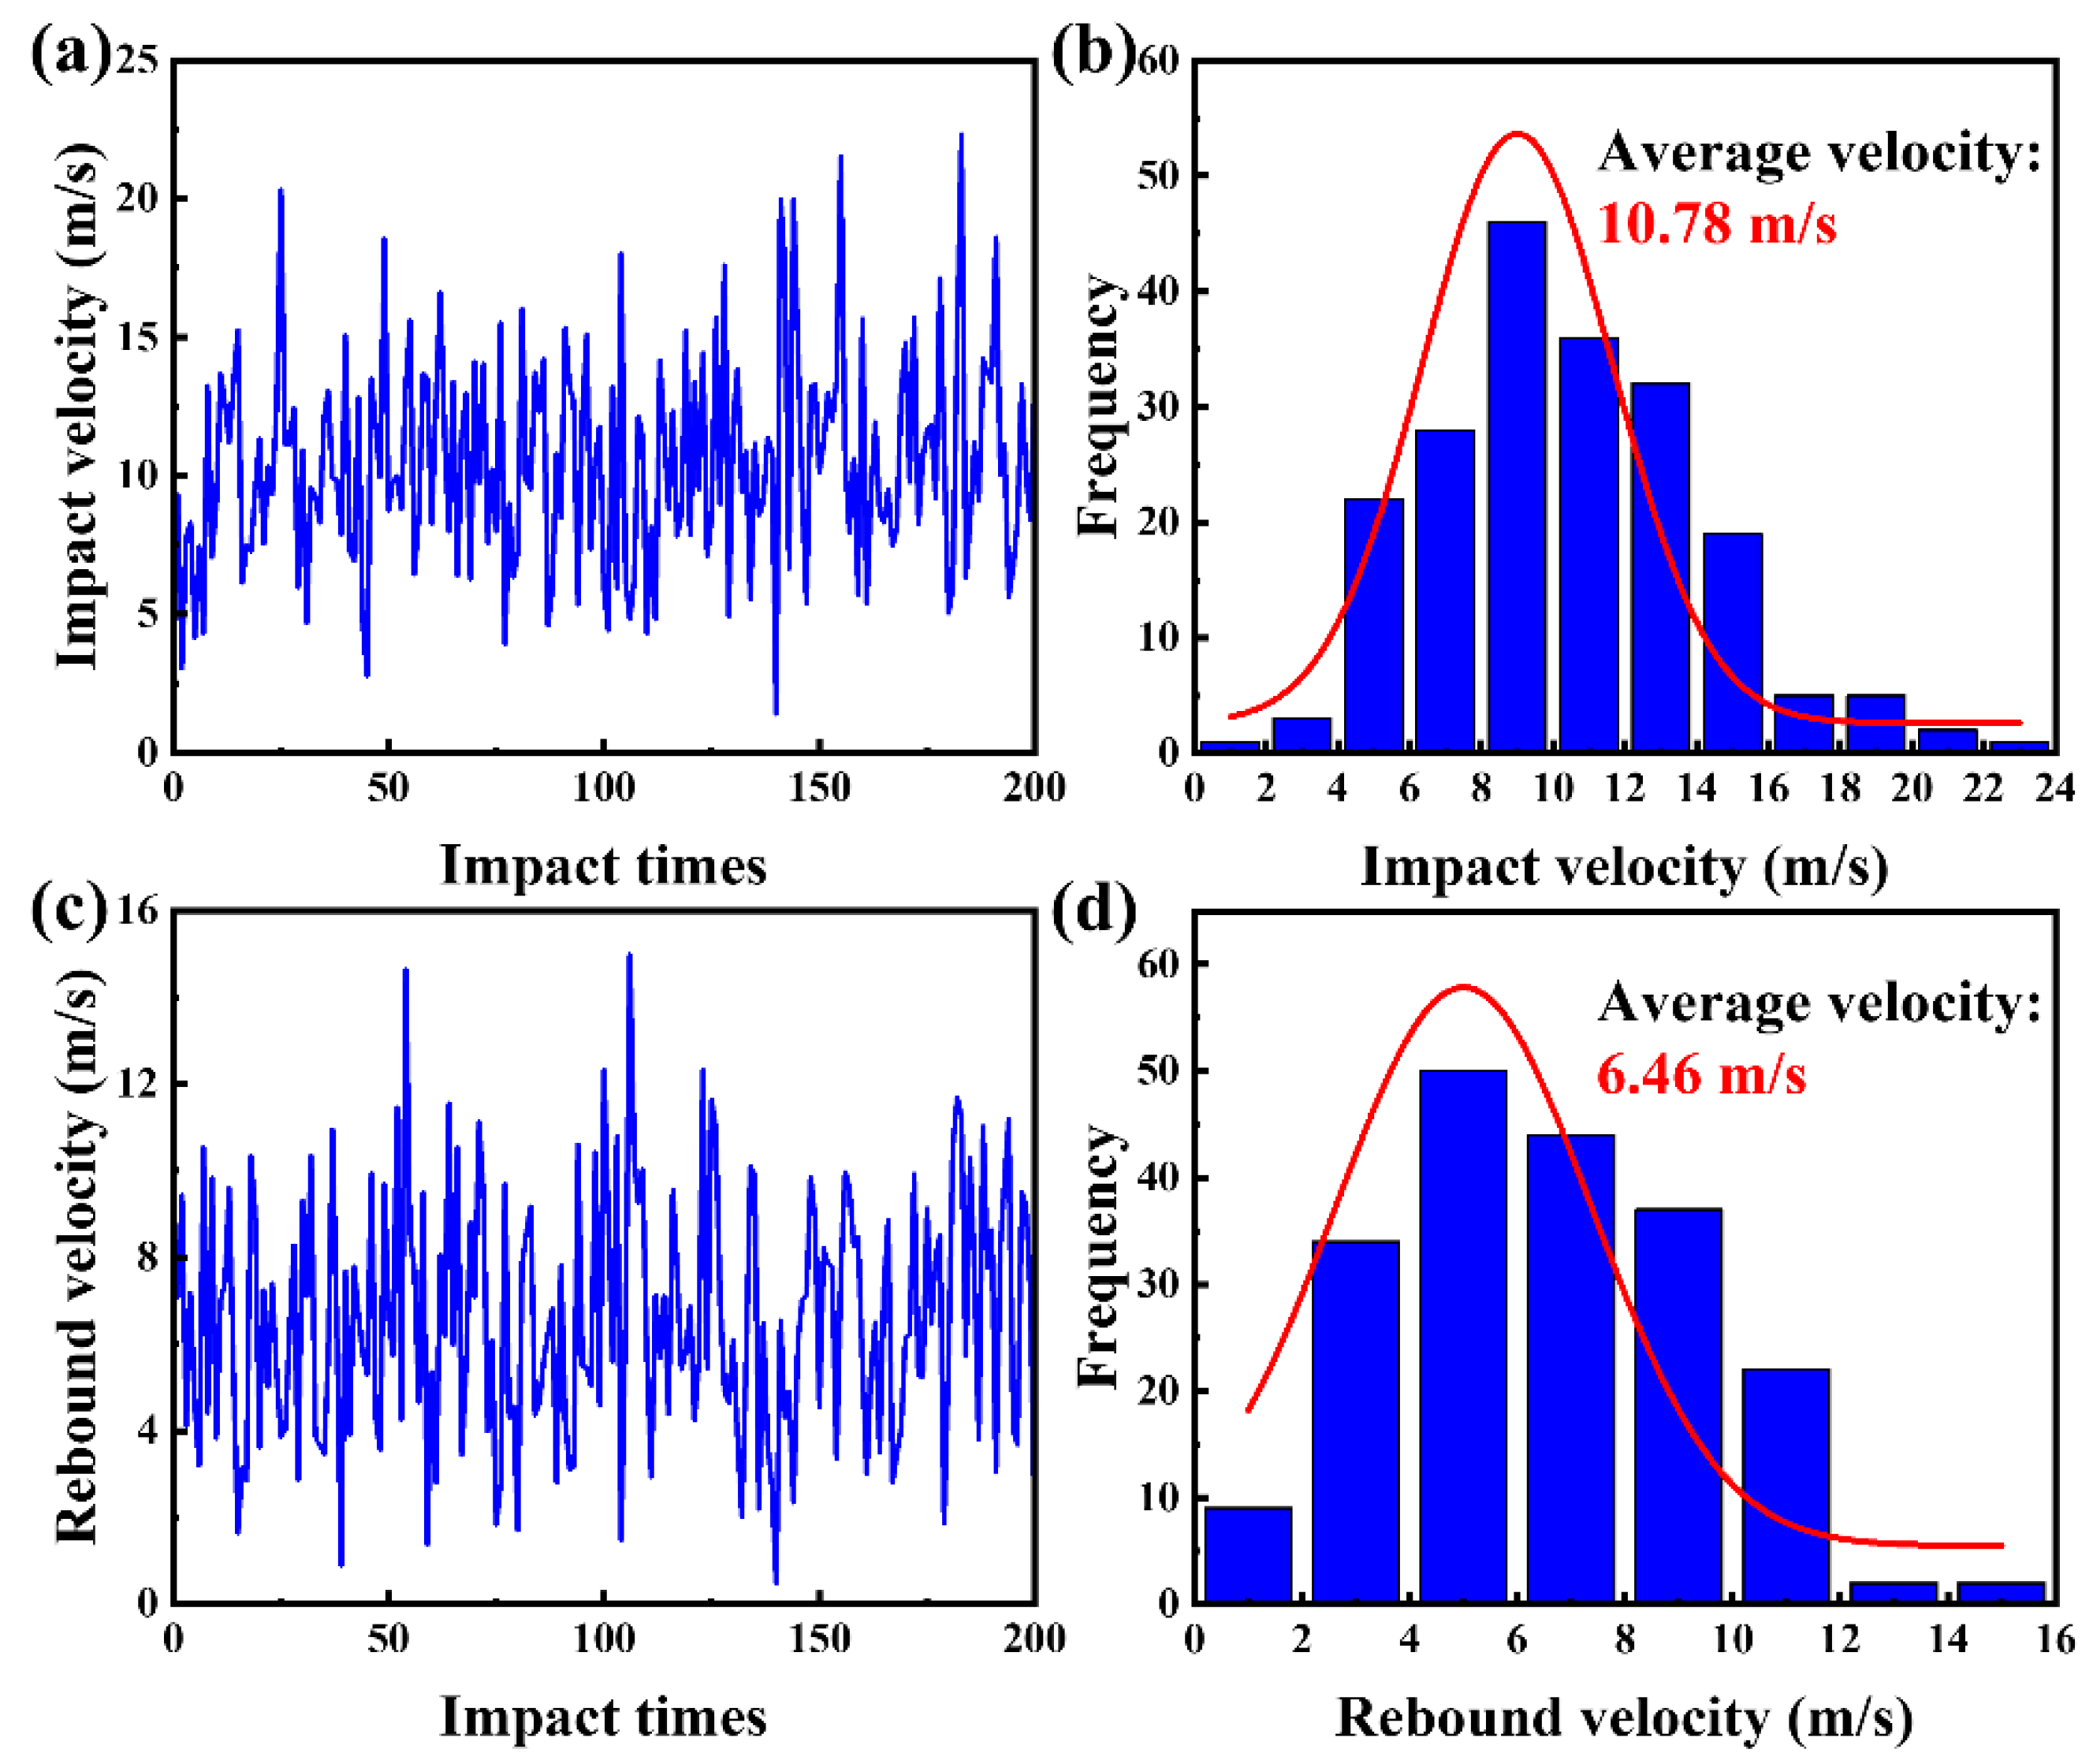
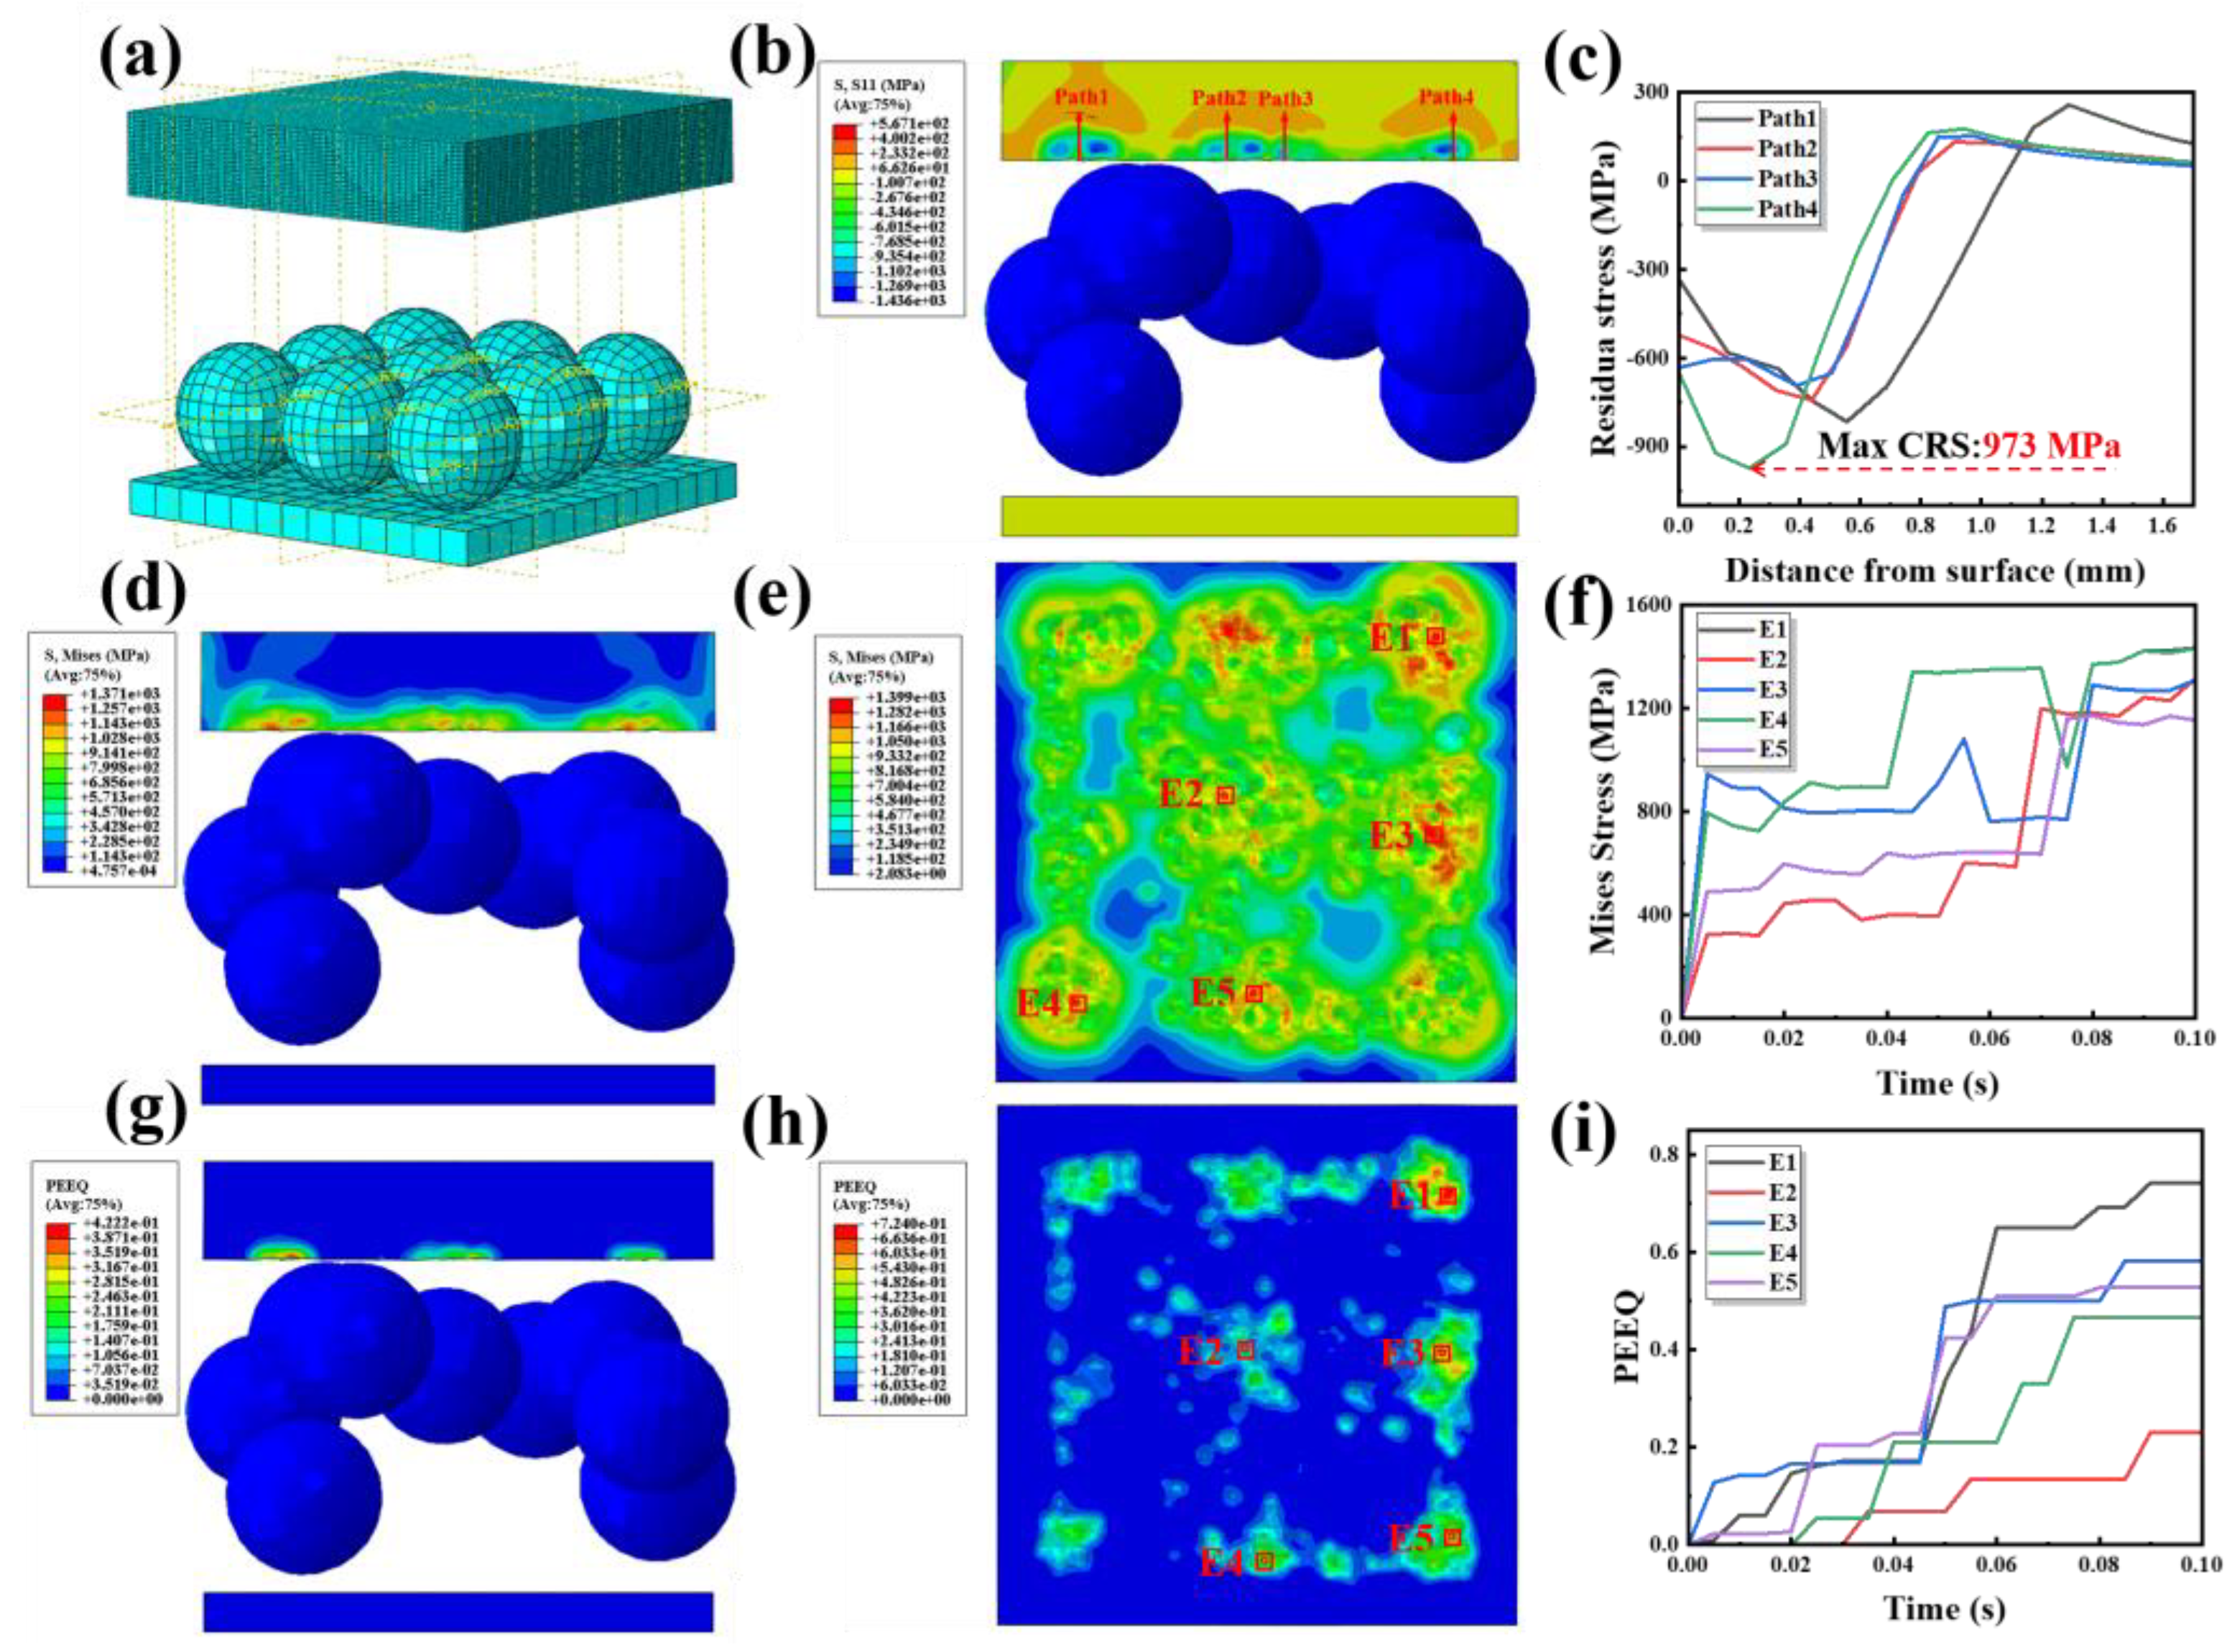
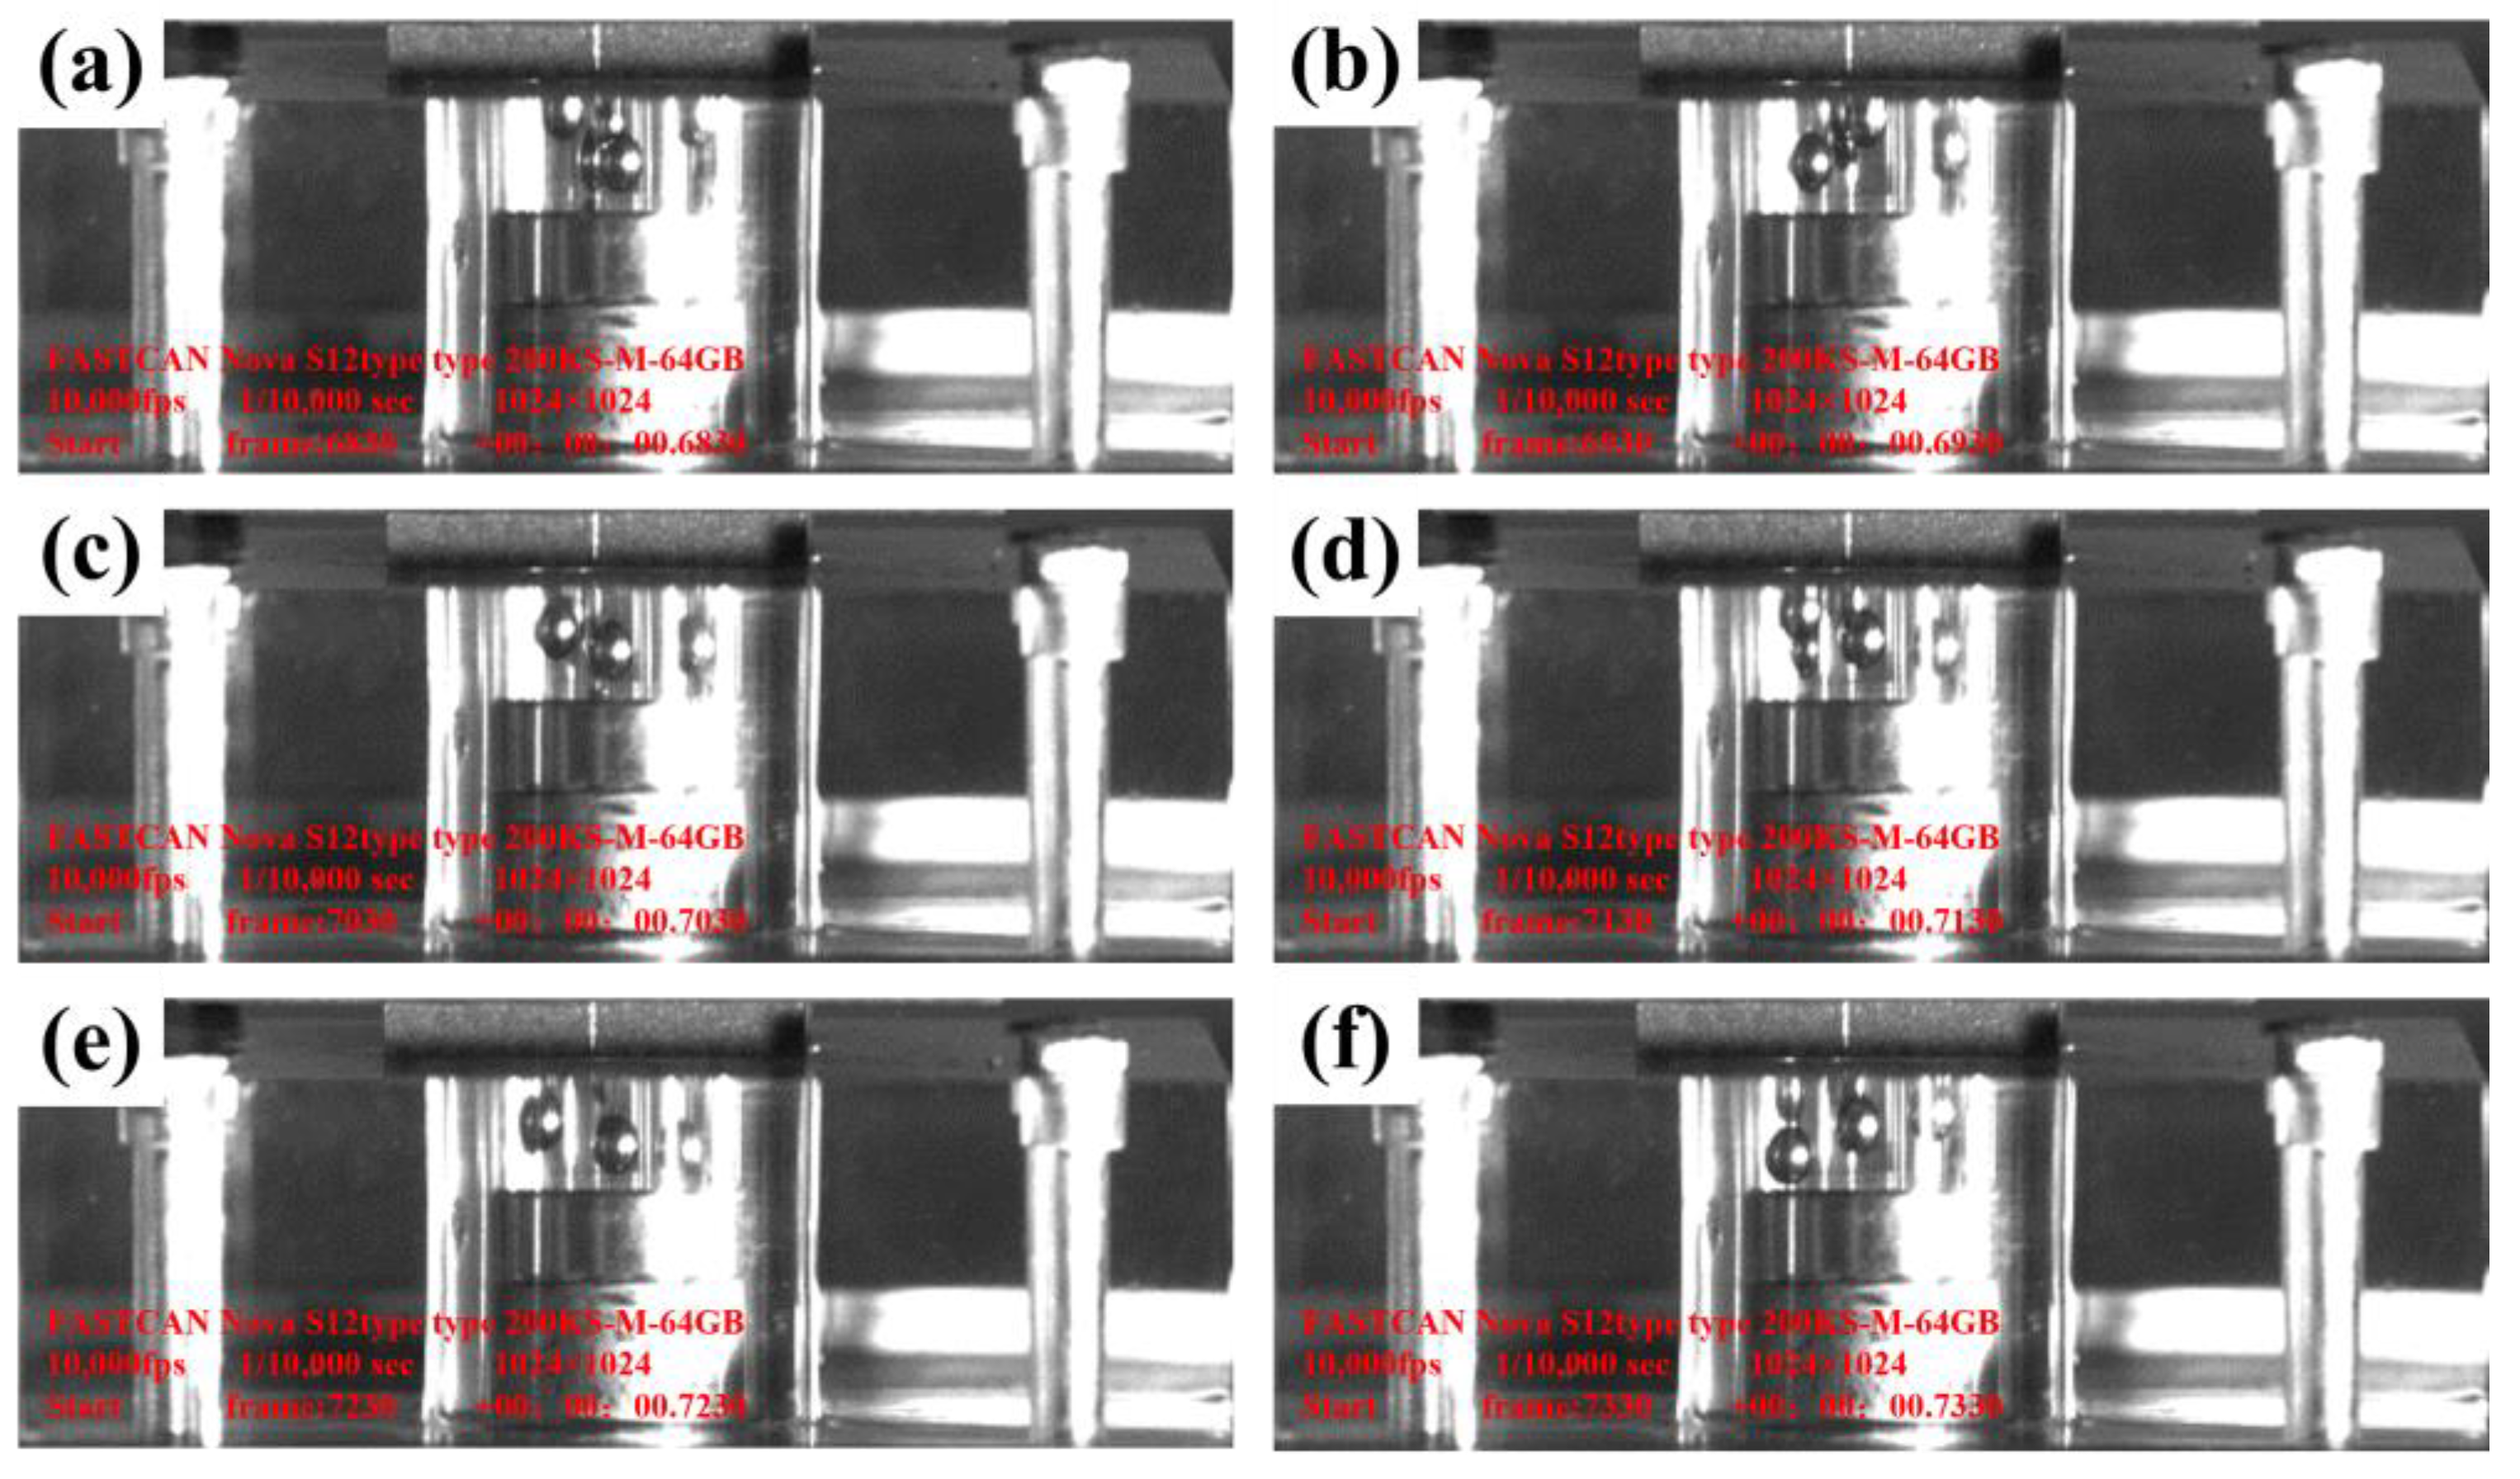
3.4.3. Multiple Impacts Investigation and Observation
4. Discussion
4.1. Microstructure Refinement Mechanism
4.2. Parameter Investigation
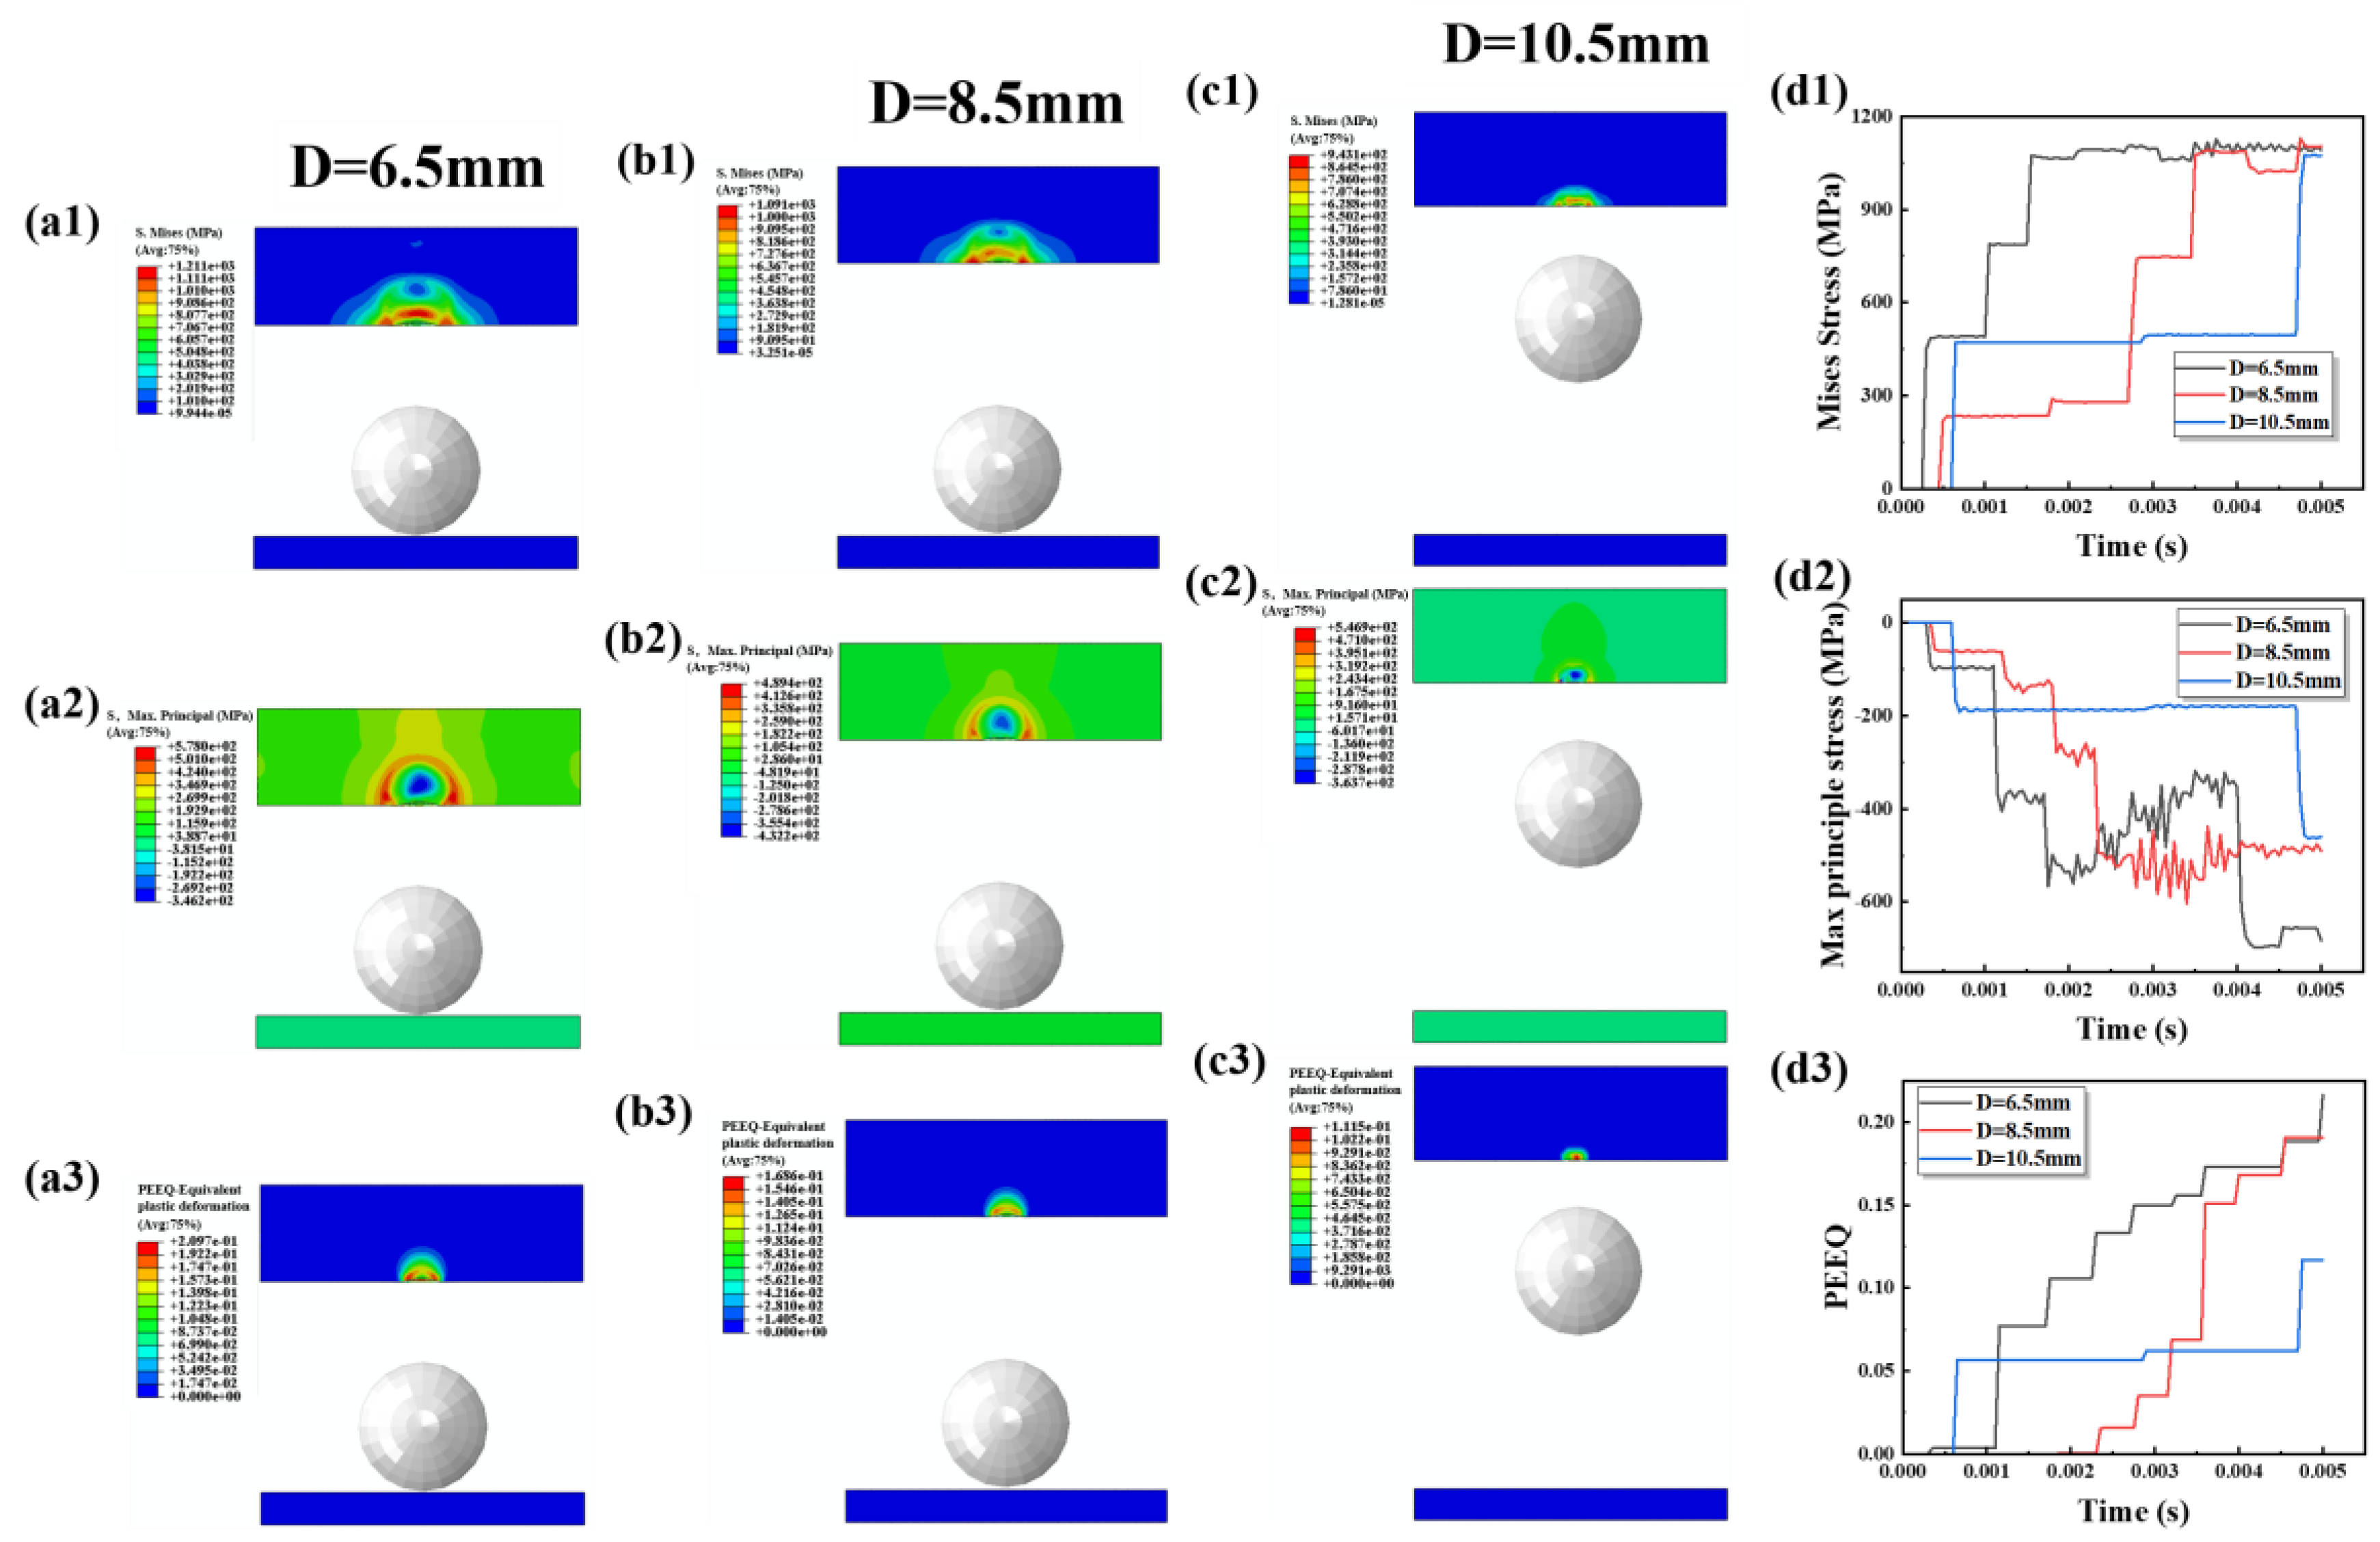
4.2.1. Working Distance
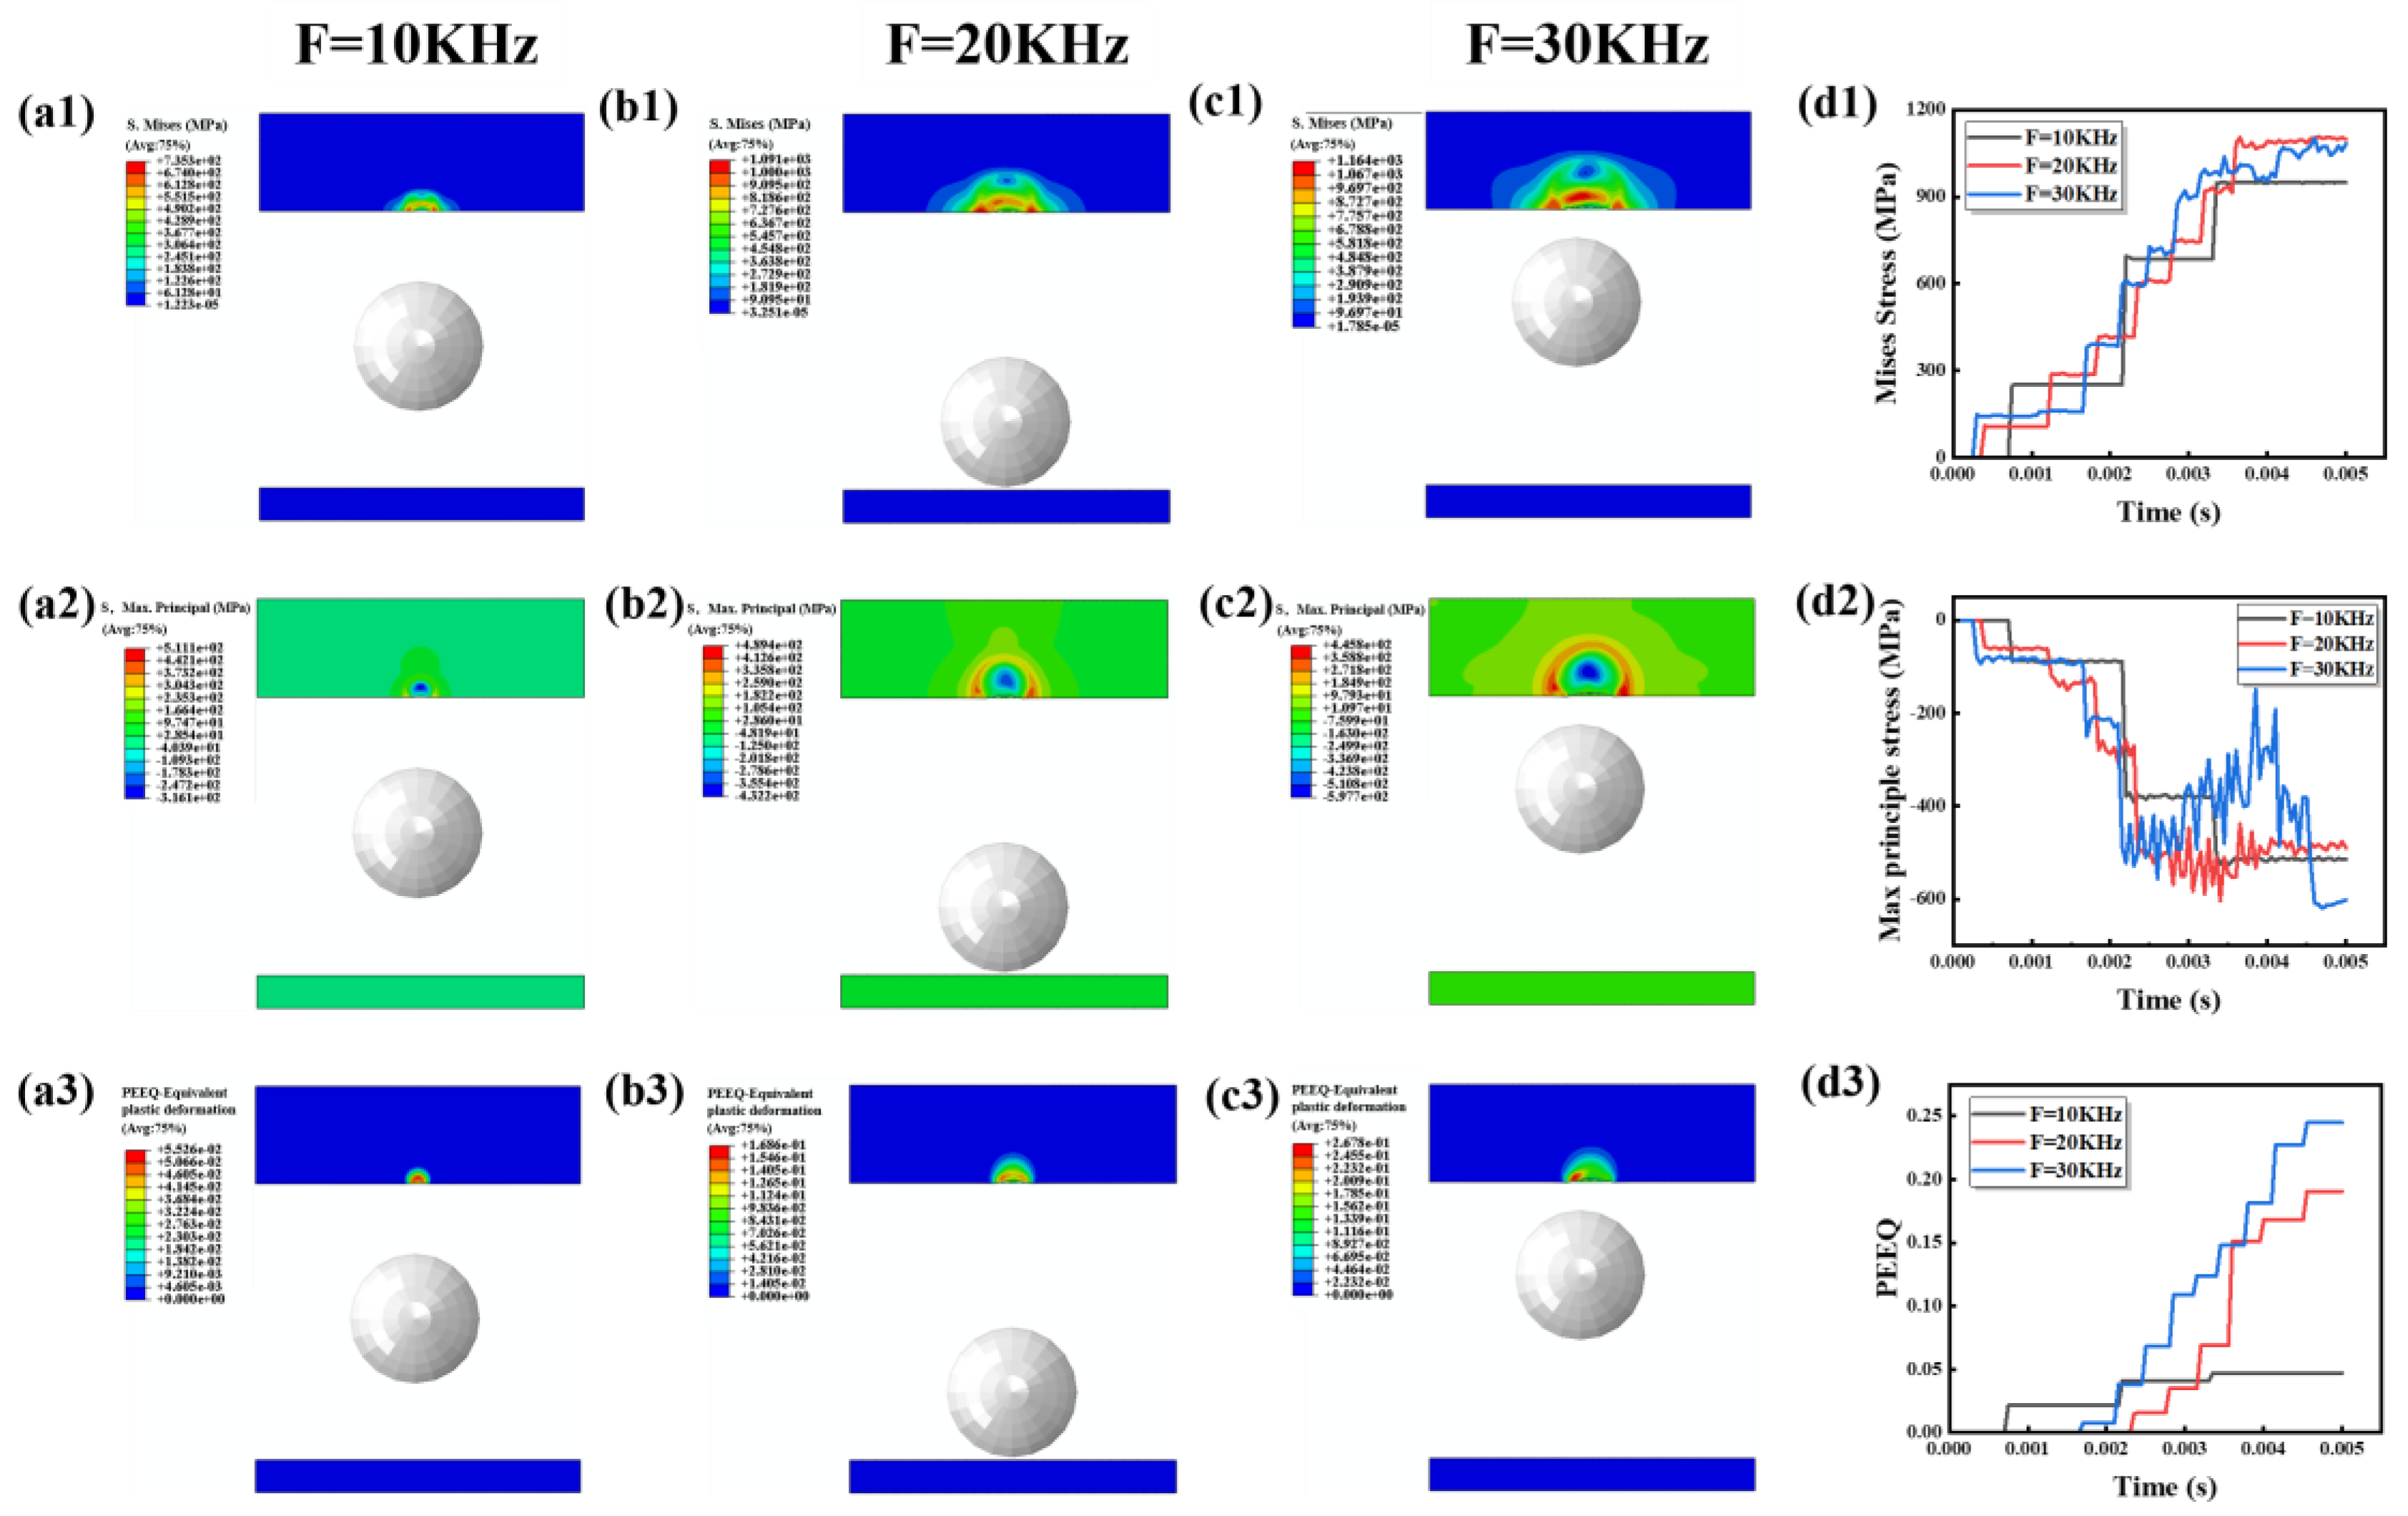
4.2.2. Ultrasound Frequency
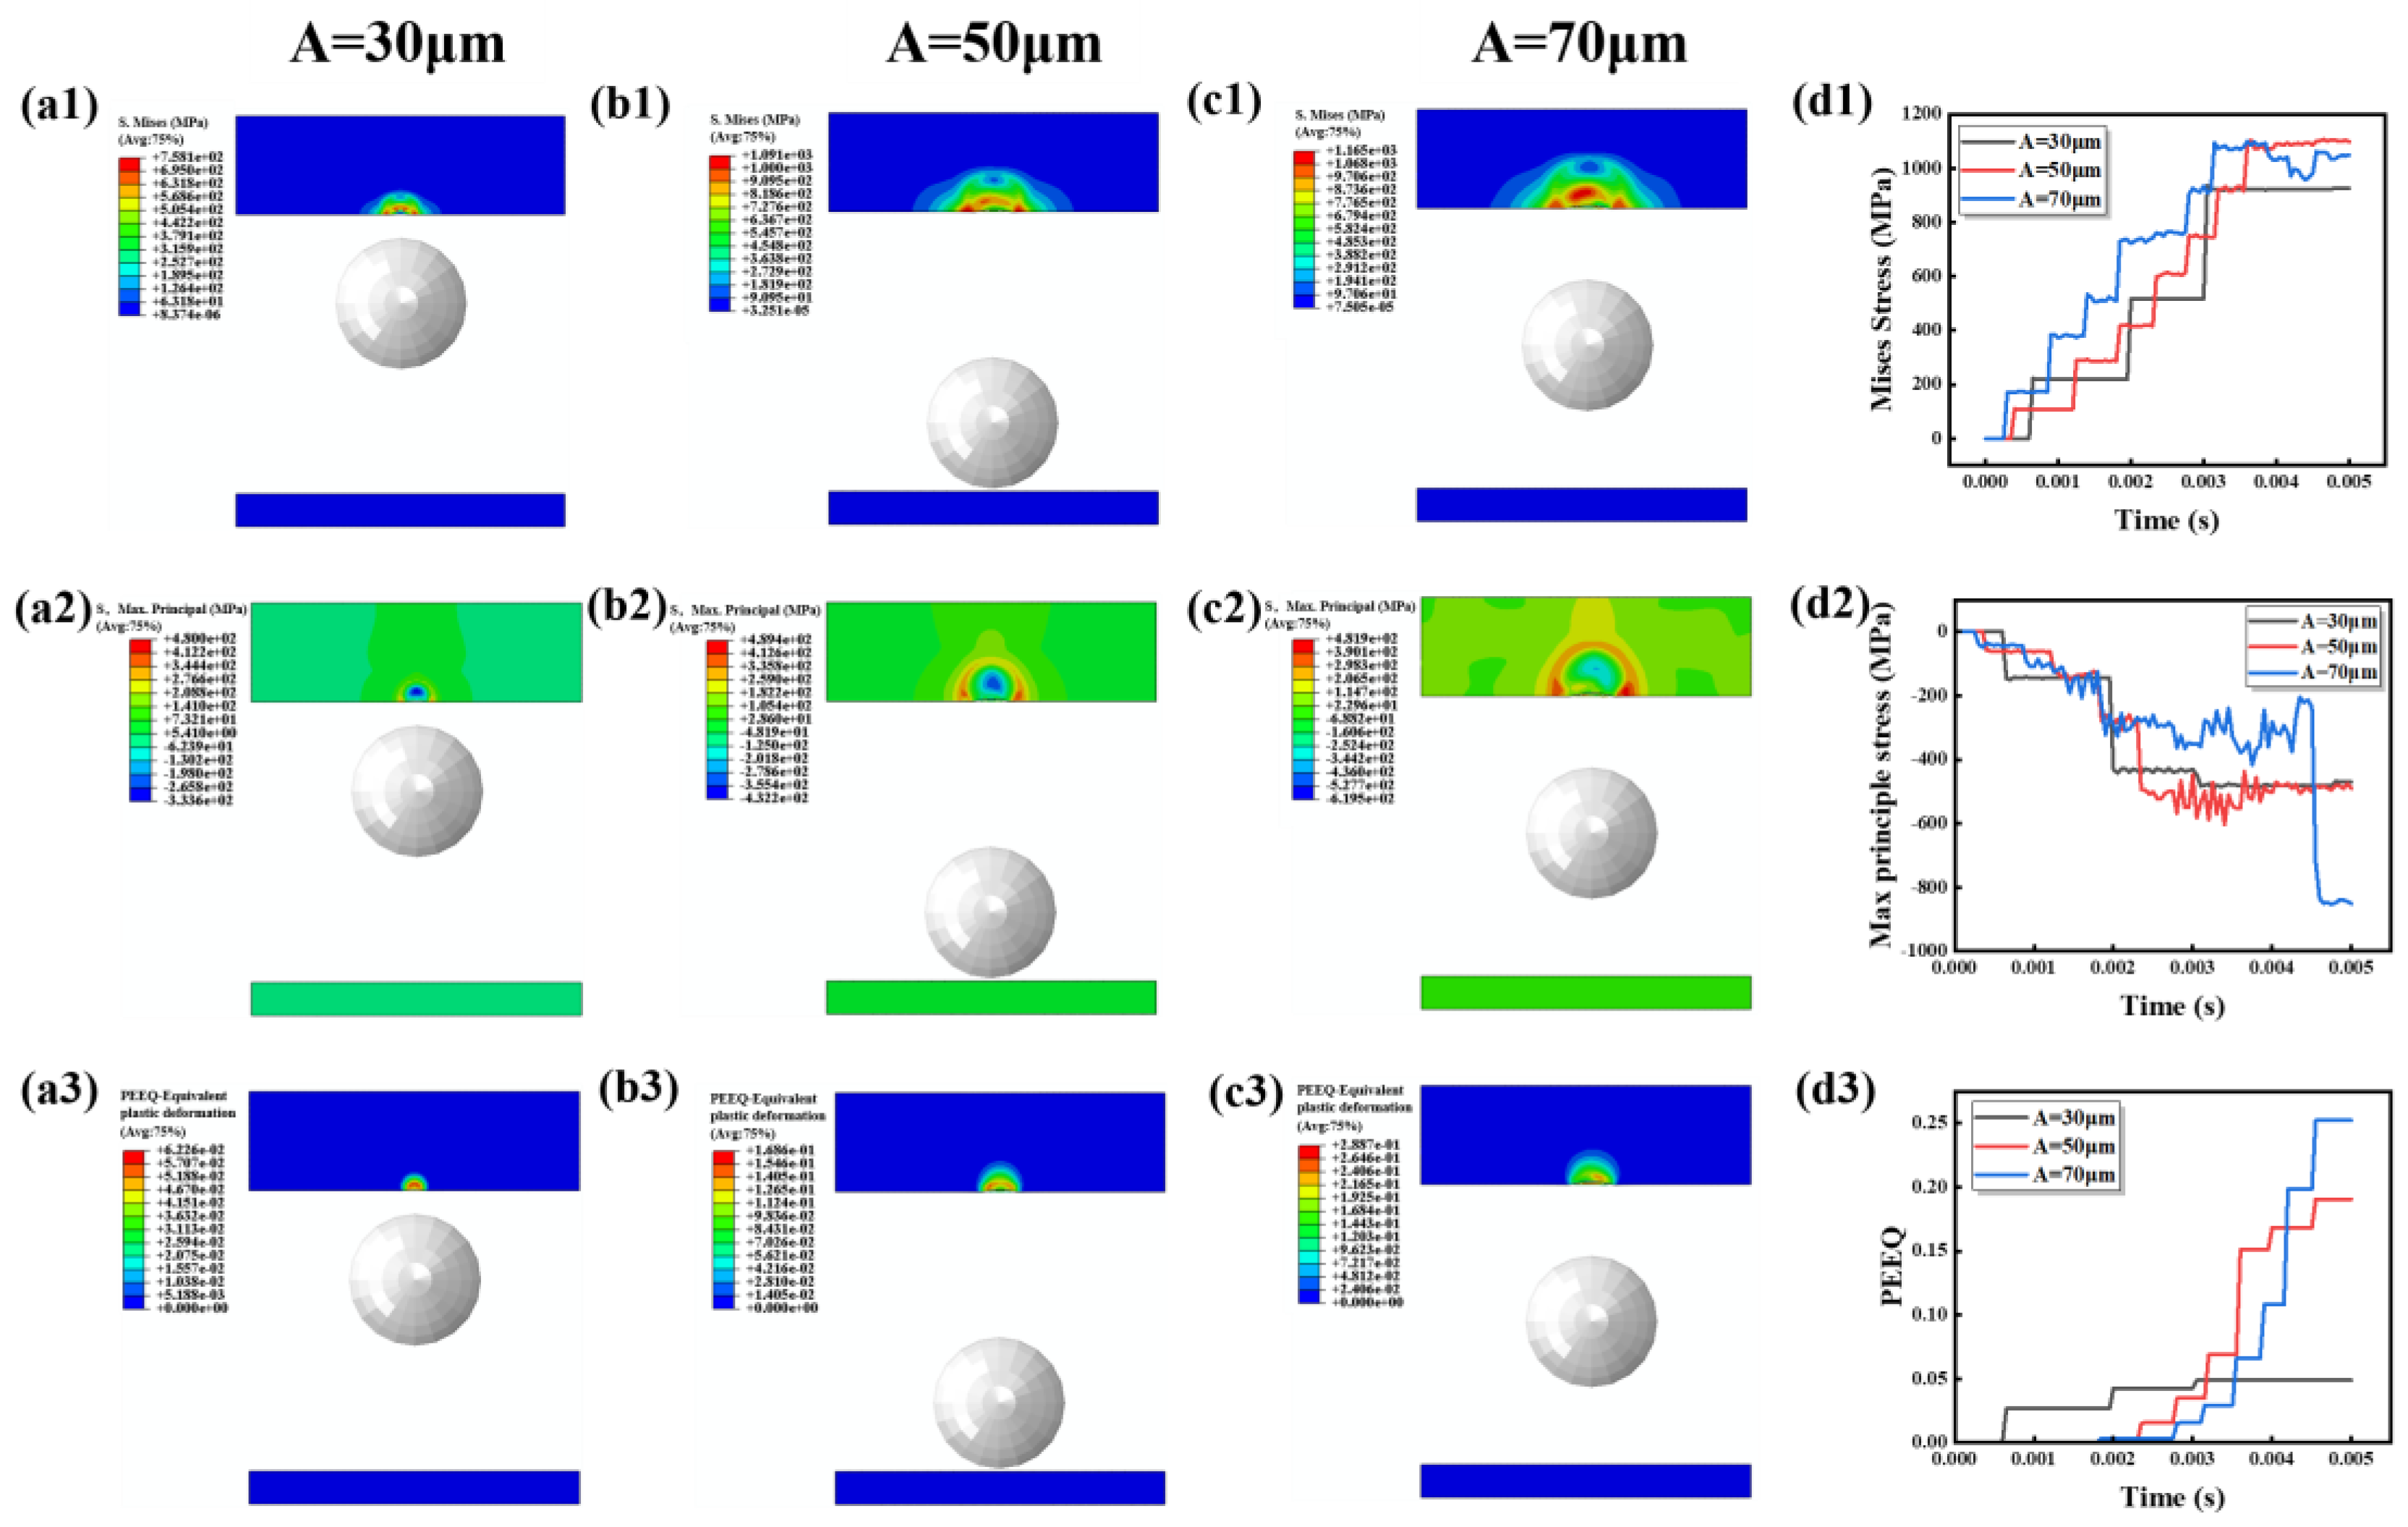
4.2.3. Ultrasound Amplitude
5. Conclusions
- (1)
- After 8 min of USP, significant microstructural refinement and the β phase transformation occurred in the material within the region of 0–200 μm. A significant quantity of nanograins formed on the treated surface, accompanied by abundant dislocation generation. The grain size on the peened surface decreased from 7.32 μm to 74.58 nm, and the surface microhardness increased from 330 HV to 438 HV.
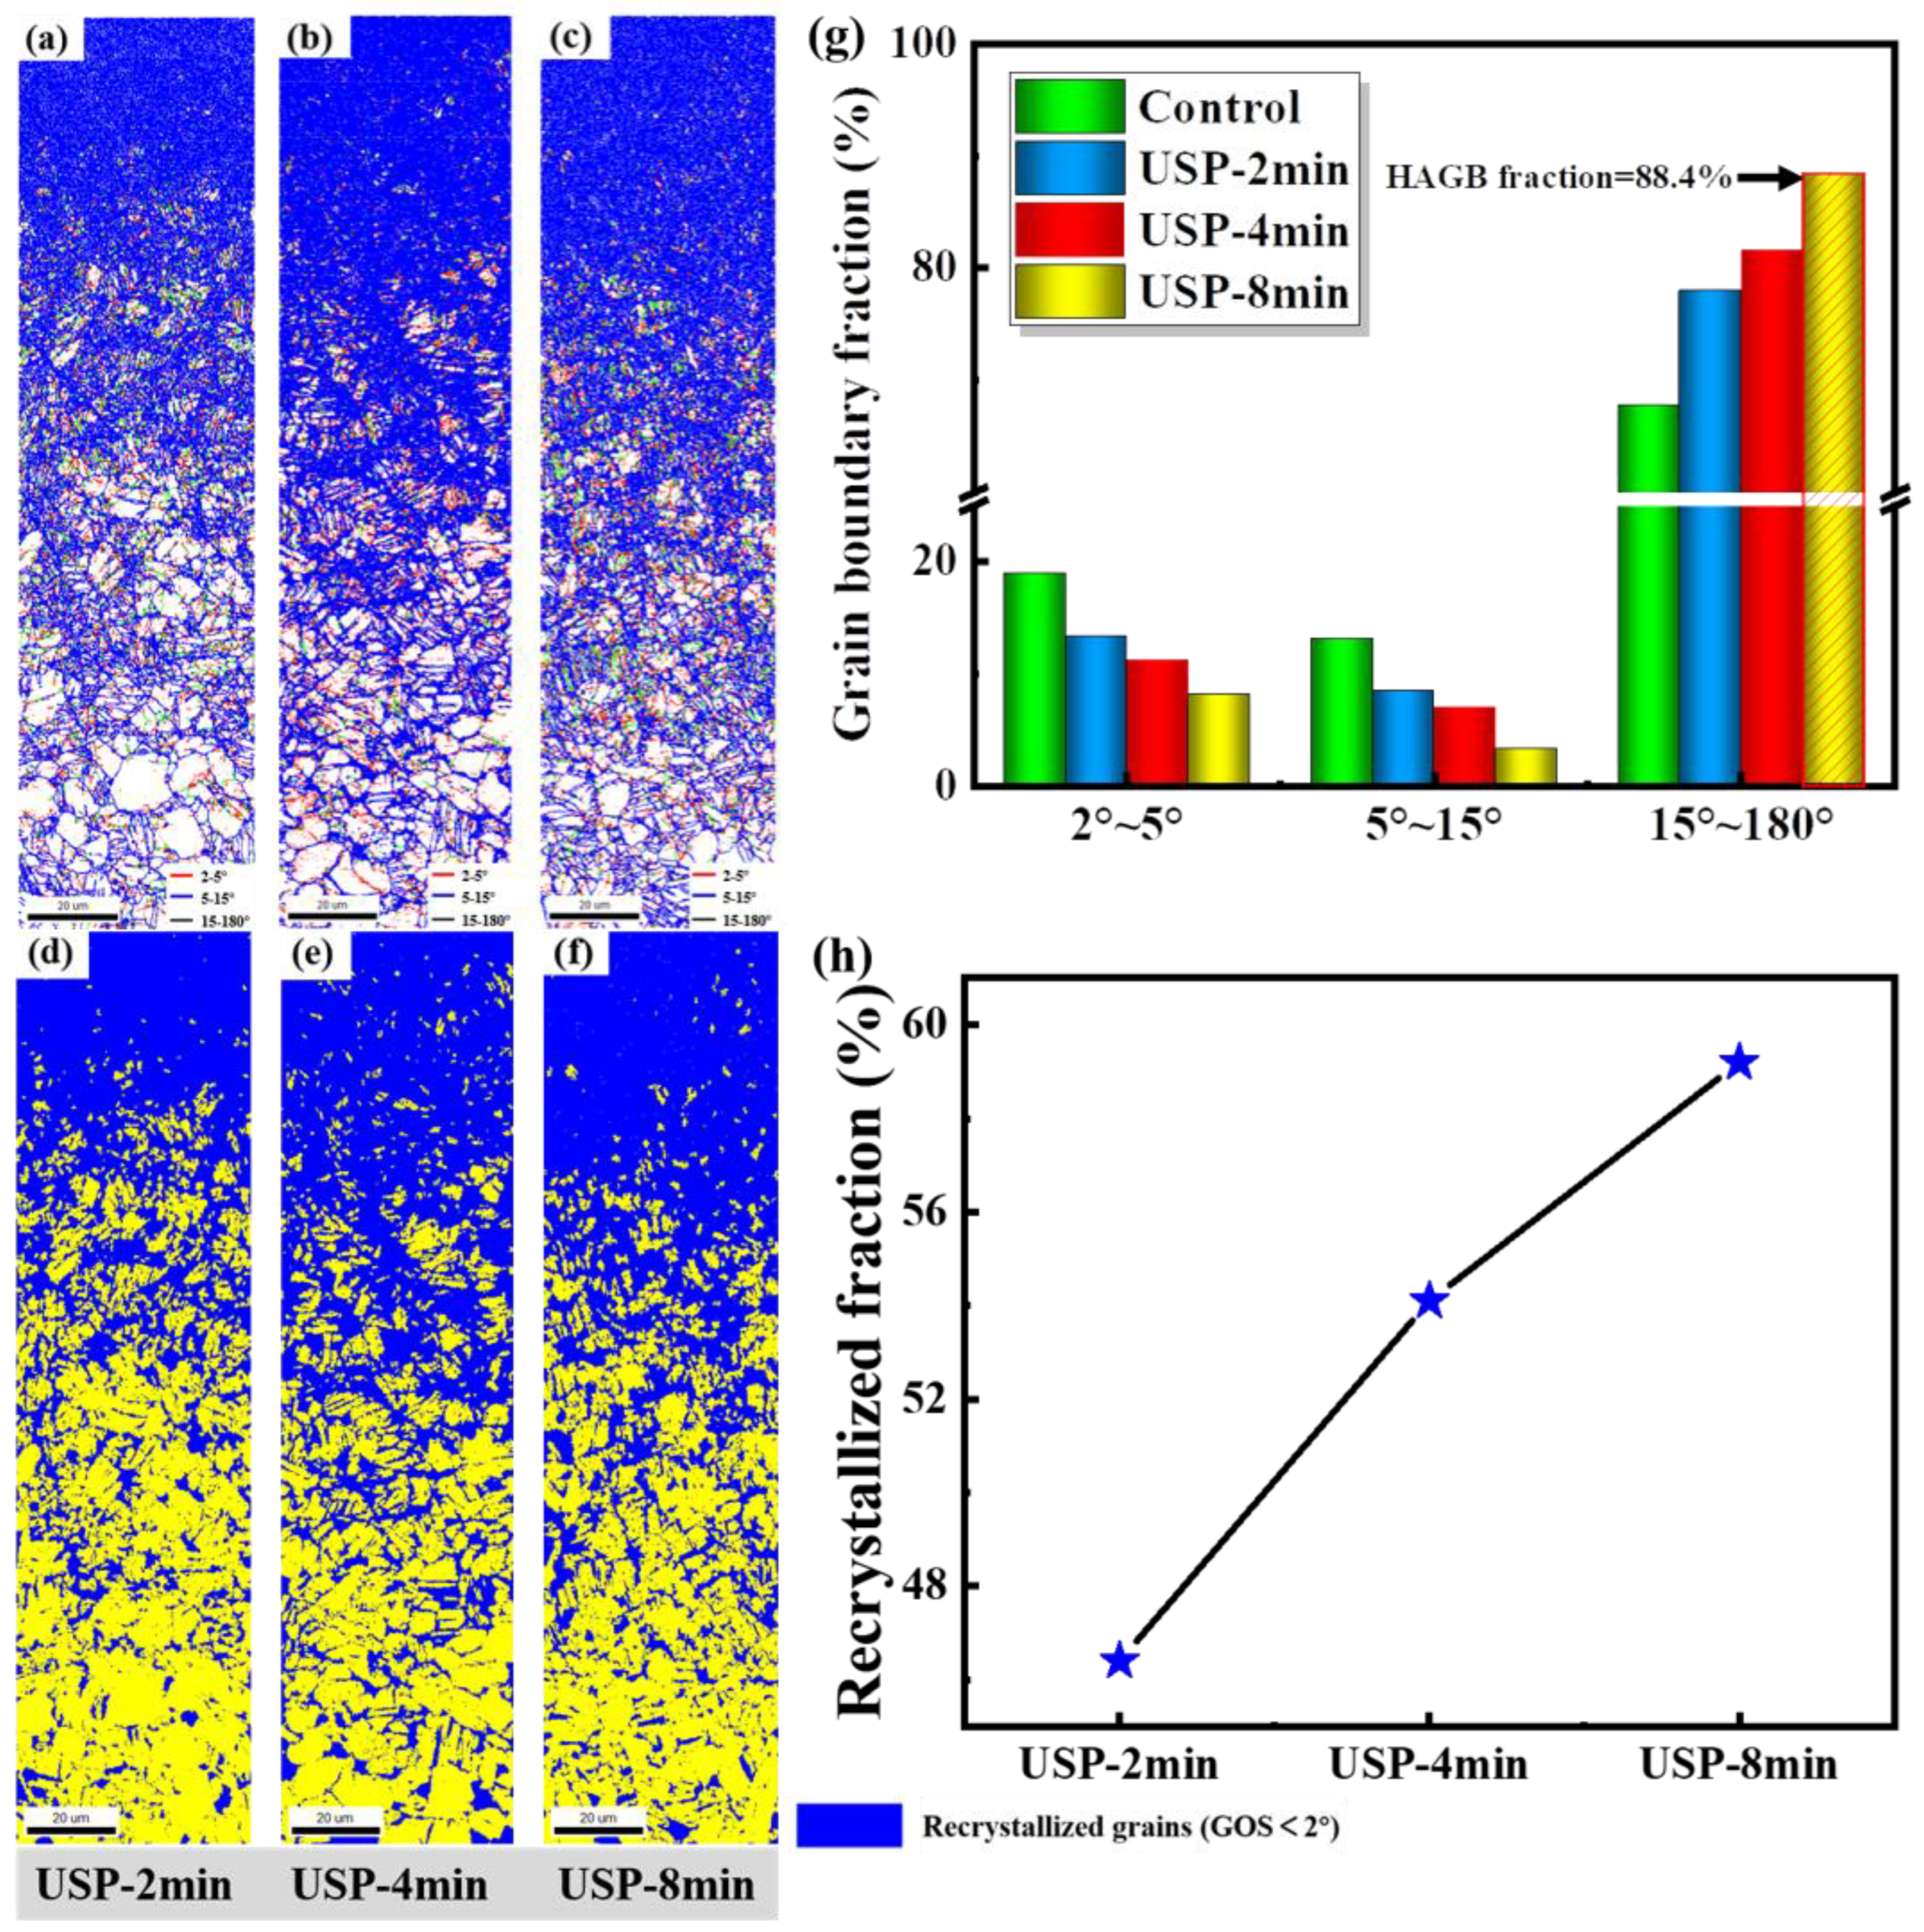
- (2)
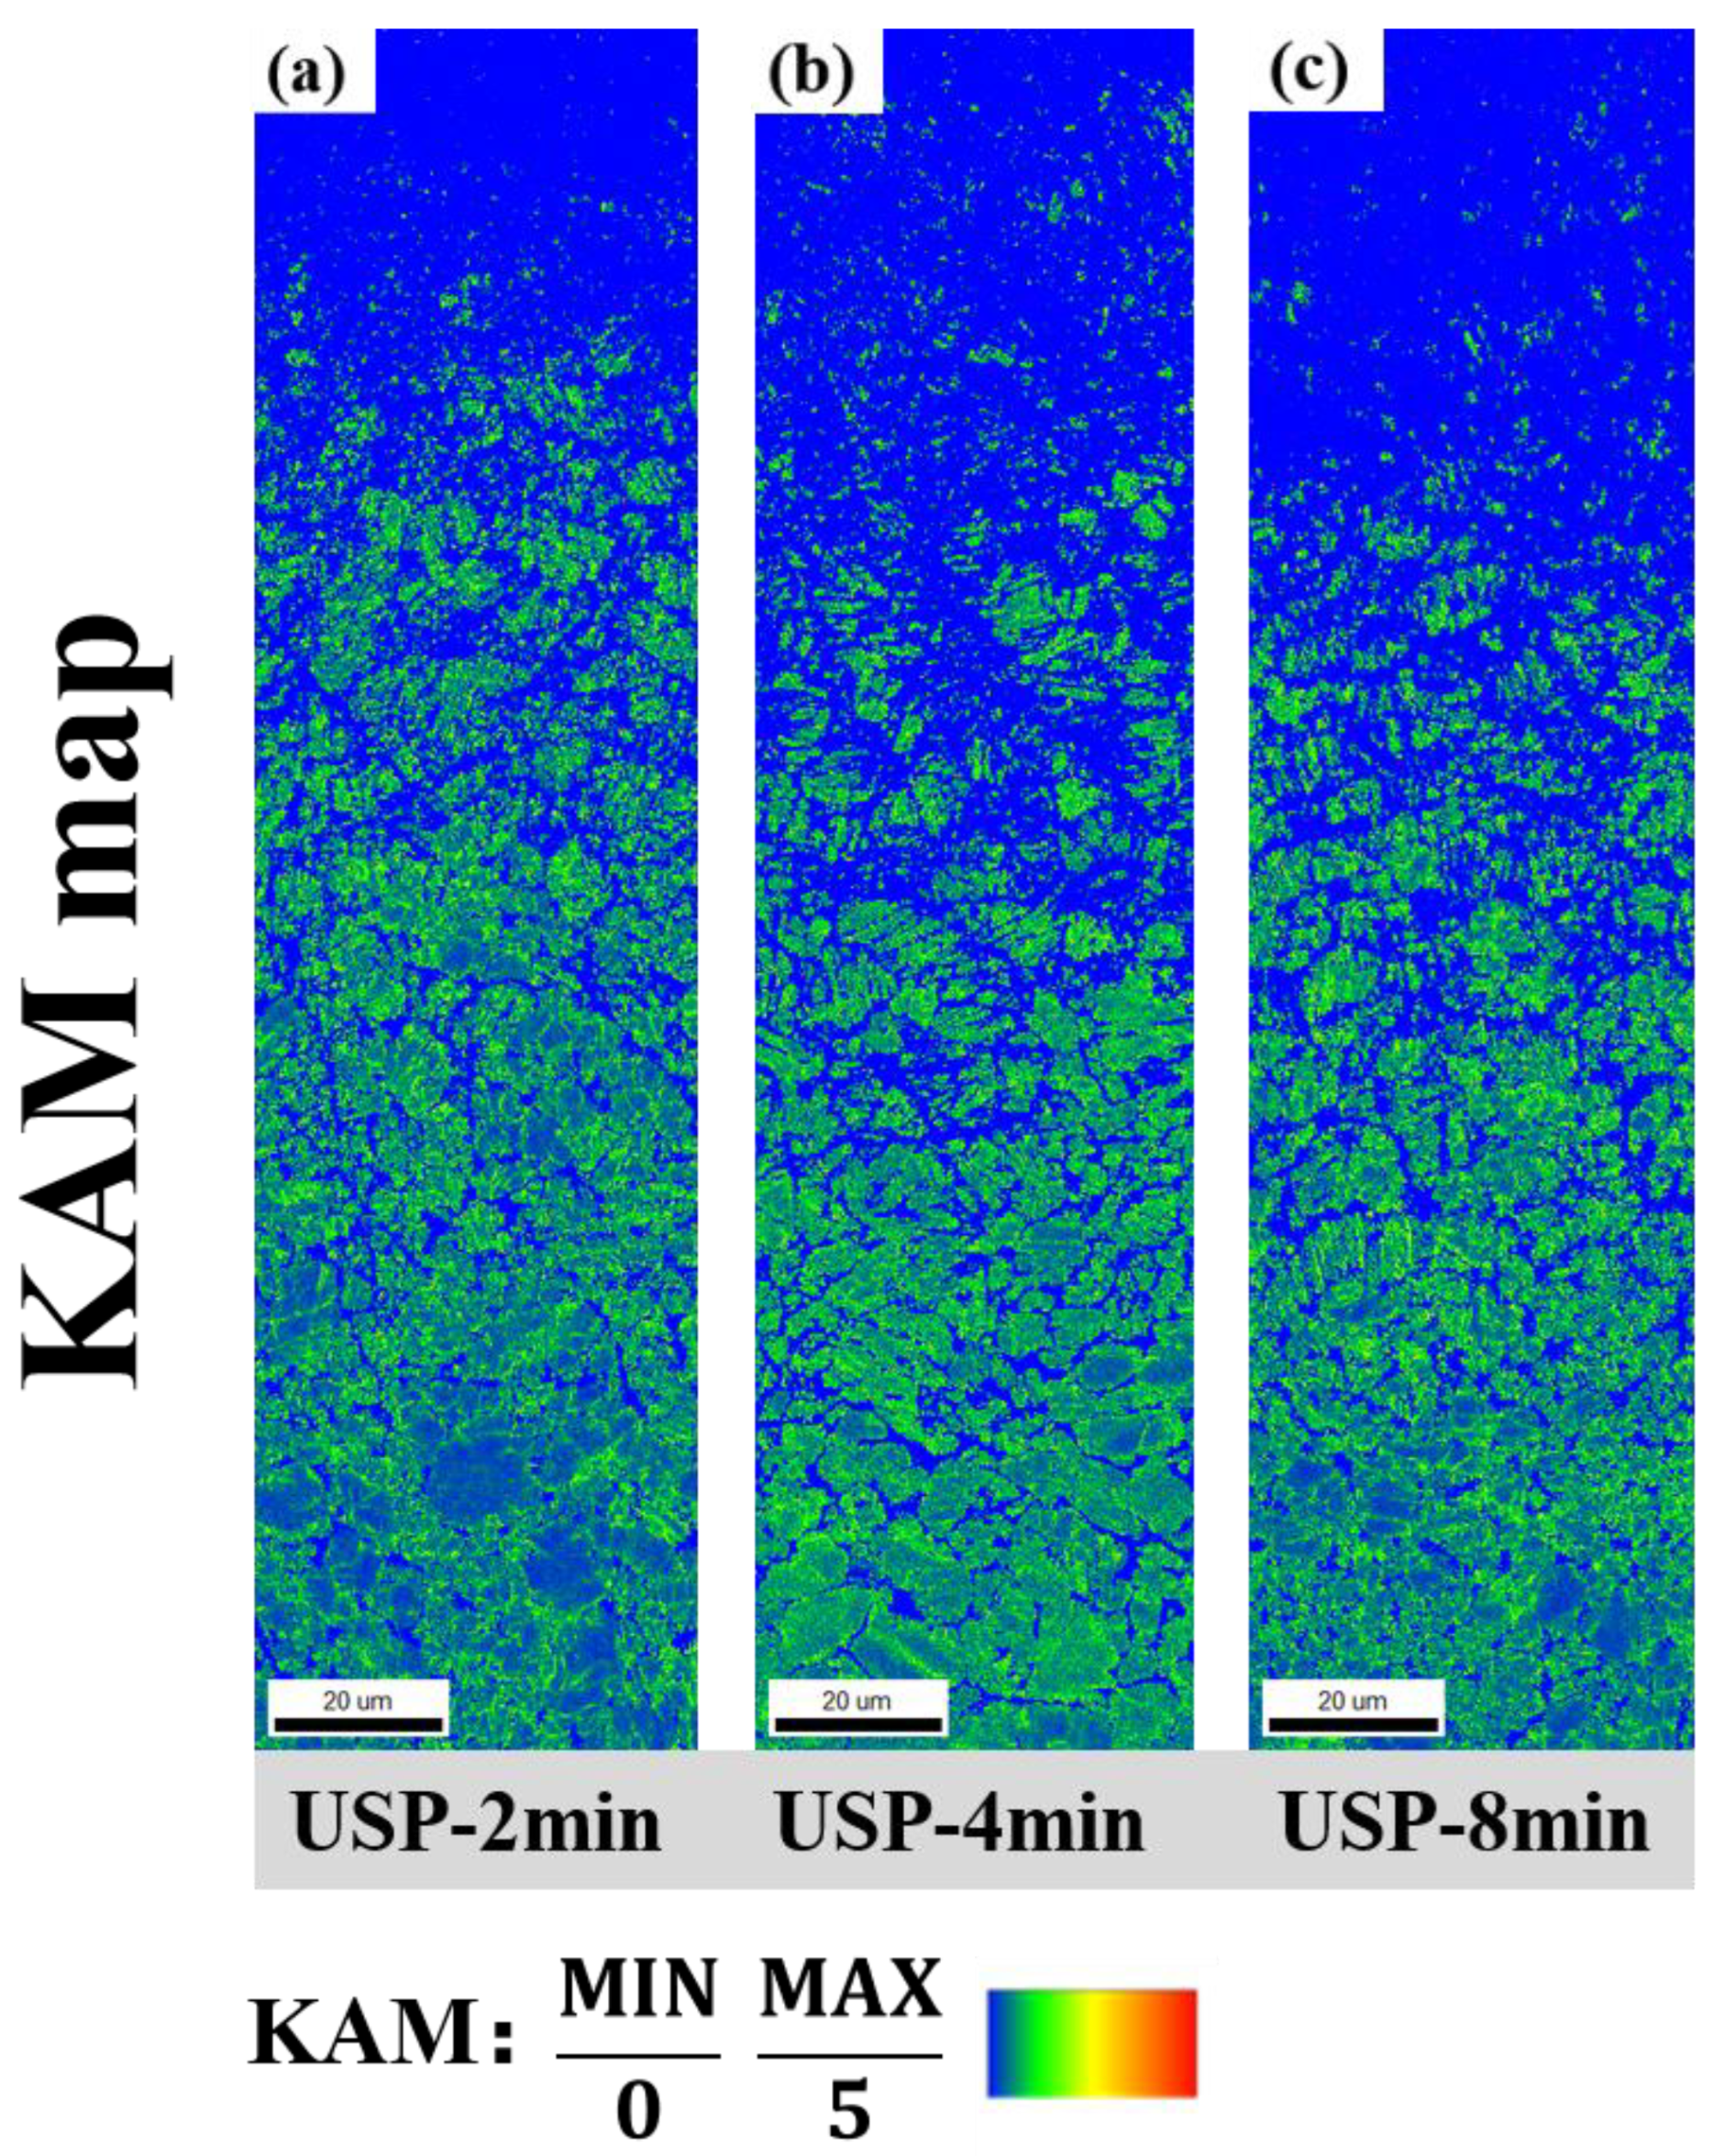
- The dynamic recrystallization process dominated the nanocrystallization process by inducing consecutive severe plastic deformation in the titanium alloy. The recrystallization degree increased after the USP process. The accumulation of high plastic strain rates on the treated surface by USP resulted in an increase of dislocation density and formation of grain boundaries within the region of 0–200 μm.
- (3)
- The plastic deformation distribution during single-ball and multi-ball impact processes was calculated via FEM. The FE simulation results agreed well with the experimental results. The simulated maximum CRS in the sub-surface reached 973 MPa after multi-ball impact.
- (4)
- The impact behavior of the shots during the USP process was analyzed. The experimental observations validated the accuracy of the model. The strengthening intensity of USP was improved with the USP parameters of working distance, ultrasonic frequency and amplitude based on the validated model.
Author Contributions
Funding
Data Availability Statement
Conflicts of Interest
References
- Boyer, R.R. An overview on the use of titanium in the aerospace industry. Mater. Sci. Eng. A 1996, 213, 103–114. [Google Scholar] [CrossRef]
- Sachdev, A.K.; Kulkarni, K.; Fang, Z.Z.; Yang, R.; Girshov, V. Titanium for Automotive Applications: Challenges and Opportunities in Materials and Processing. JOM 2012, 64, 553–565. [Google Scholar] [CrossRef]
- Sidambe, A. Biocompatibility of Advanced Manufactured Titanium Implants—A Review. Materials 2014, 7, 8168–8188. [Google Scholar] [CrossRef] [PubMed]
- Cheng, J.; Li, F.; Zhu, S.; Yu, Y.; Qiao, Z.; Yang, J. Electrochemical corrosion and tribological evaluation of TiAl alloy for marine application. Tribol. Int. 2017, 115, 483–492. [Google Scholar] [CrossRef]
- Liu, Y.G.; Li, M.Q.; Liu, H.J. Surface nanocrystallization and gradient structure developed in the bulk TC4 alloy processed by shot peening. J. Alloys Compd. 2016, 685, 186–193. [Google Scholar] [CrossRef]
- Yin, F.; Hu, S.; Xu, R.; Han, X.; Qian, D.; Wei, W.; Hua, L.; Zhao, K. Strain rate sensitivity of the ultrastrong gradient nanocrystalline 316L stainless steel and its rate-dependent modeling at nanoscale. Int. J. Plast. 2020, 129, 102696. [Google Scholar] [CrossRef]
- Fan, K.; Liu, D.; Wang, C.; Yang, J.; Liu, Y.; Zhang, X.; Xiang, J.; Abdel Wahab, M. Effect of contact stress and slip amplitude on fretting fatigue behaviour of ultrasonic surface nanocrystallized TC11 titanium alloy. J. Mater. Res. Technol. 2024, 28, 4052–4064. [Google Scholar] [CrossRef]
- Li, L.; Jia, W.; Ji, V. Phase transformations mechanism in commercially pure titanium subjected to multiple laser shock peening. Surf. Coat. Technol. 2022, 450, 129010. [Google Scholar] [CrossRef]
- He, D.; Li, L.; Zhang, Y.; Chi, J.; Zhang, H.; Rujian, S.; Che, Z.; Zhang, H.; Guo, W. Gradient Microstructure and Fatigue Properties of TC21 Titanium Alloy Processed by Laser Shock Peening. J. Alloys Compd. 2022, 935, 168139. [Google Scholar] [CrossRef]
- Nalla, R.K.; Altenberger, I.; Noster, U.; Liu, G.Y.; Scholtes, B.; Ritchie, R.O. On the influence of mechanical surface treatments—Deep rolling and laser shock peening—On the fatigue behavior of Ti–6Al–4V at ambient and elevated temperatures. Mater. Sci. Eng. A 2003, 355, 216–230. [Google Scholar] [CrossRef]
- Sami, J.; Richard, C.; Retraint, D.; Roland, T.; Chemkhi, M.; Demangel, C. Effect of surface nanocrystallization on the corrosion behavior of Ti–6Al–4V titanium alloy. Surf. Coat. Technol. 2013, 224, 82–87. [Google Scholar] [CrossRef]
- Bahl, S.; Suwas, S.; Ungàr, T.; Chatterjee, K. Elucidating microstructural evolution and strengthening mechanisms in nanocrystalline surface induced by surface mechanical attrition treatment of stainless steel. Acta Mater. 2017, 122, 138–151. [Google Scholar] [CrossRef]
- Wei, P.; Hua, P.; Xia, M.; Yan, K.; Lin, H.; Yi, S.; Lu, J.; Ren, F.; Sun, Q. Bending fatigue life enhancement of NiTi alloy by pre-strain warm surface mechanical attrition treatment. Acta Mater. 2022, 240, 118269. [Google Scholar] [CrossRef]
- Wang, C.; Liu, X.; Hu, X.; Fei, S.; Li, B.; Deng, H.; Shen, G.; Wang, X. Gradient-structured 1060 aluminum by air pressure-driven surface mechanical rolling treatment and its effects on the friction performance. J. Manuf. Process. 2023, 108, 804–819. [Google Scholar] [CrossRef]
- Carneiro, L.; Wang, X.; Jiang, Y. Cyclic deformation and fatigue behavior of 316L stainless steel processed by surface mechanical rolling treatment. Int. J. Fatigue 2020, 134, 105469. [Google Scholar] [CrossRef]
- Zhu, R.; Ma, S.; Wang, X.; Chen, J.; Pengfei, H.; Wang, Y. Effect of ultrasonic surface rolling process on hydrogen embrittlement behavior of TC4 laser welded joints. J. Mater. Sci. 2022, 57, 11997–12011. [Google Scholar] [CrossRef]
- Berezin, I.; Zalazinsky, A.; Kryuchkov, D. Analytical model of equal-channel angular pressing of titanium sponge. Met. Work. Mater. Sci. 2023, 25, 17–31. [Google Scholar] [CrossRef]
- Jia, D.-S.; He, T.; Song, M.; Huo, Y.-M.; Hu, H.-Y. Effects of equal channel angular pressing and further cold upsetting process to the kinetics of precipitation during aging of 7050 aluminum alloy. J. Mater. Res. Technol. 2023, 26, 5126–5140. [Google Scholar] [CrossRef]
- Zhang, B.; Chen, Y.; Yang, Y.; Gu, H.; You, H. Improving Mechanical Properties, Corrosion Resistance and Biocompatibility of Zn-1Mg-0.3Y Alloys Through Equal Channel Angular Pressing. Sci. Adv. Mater. 2023, 15, 1328–1335. [Google Scholar] [CrossRef]
- Li, Y.; Liu, X.; Wang, F.; Zhou, W.; Ren, X. Influence of ultrasonic shot peening on the surface acid etching behavior of pure titanium. Mater. Chem. Phys. 2024, 313, 128720. [Google Scholar] [CrossRef]
- Li, G.; Qu, S.; Xie, M.; Li, X. Effect of ultrasonic surface rolling at low temperatures on surface layer microstructure and properties of HIP Ti-6Al-4V alloy. Surf. Coat. Technol. 2017, 316, 75–84. [Google Scholar] [CrossRef]
- Liu, J.; Suslov, S.; Ren, Z.; Dong, Y.; Ye, C. Microstructure Evolution in Ti64 Subjected to Laser-assisted Ultrasonic Nanocrystal Surface Modification. Int. J. Mach. Tools Manuf. 2018, 136, 19–33. [Google Scholar] [CrossRef]
- Kumar, S.; Chattopadhyay, K.; Singh, V. Effect of surface nanostructuring on corrosion behavior of Ti-6Al-4V alloy. Mater. Charact. 2016, 121, 23–30. [Google Scholar] [CrossRef]
- Han, M.; Du, J.; Chen, Y.; Sun, Q.; Hu, K. Influence of ultrasonic shot peening on the microstructure and corrosion behavior of AZ80M magnesium alloy. J. Alloys Compd. 2024, 980, 173633. [Google Scholar] [CrossRef]
- Malaki, M.; Ding, H. A review of ultrasonic peening treatment. Mater. Des. 2015, 87, 1072–1086. [Google Scholar] [CrossRef]
- Sun, Q.; Han, Q.; Wang, S.; Xu, R. Microstructure, corrosion behaviour and thermal stability of AA 7150 after ultrasonic shot peening. Surf. Coat. Technol. 2020, 398, 126127. [Google Scholar] [CrossRef]
- Yin, F.; Hu, S.; Hua, L.; Wang, X.; Suslov, S.; Han, Q. Surface Nanocrystallization and Numerical Modeling of Low Carbon Steel by Means of Ultrasonic Shot Peening. Metall. Mater. Trans. A 2014, 46, 1253–1261. [Google Scholar] [CrossRef]
- Yin, F.; Cheng, G.; Xu, R.; Zhao, K.; Li, Q.; Jian, J.; Hu, S.; Sun, S.; An, L.; Han, Q. Ultrastrong nanocrystalline stainless steel and its Hall-Petch relationship in the nanoscale. Scr. Mater. 2018, 155, 26–31. [Google Scholar] [CrossRef]
- Yue, X.; Hu, S.; Wang, X.; Liu, Y.; Yin, F.; Hua, L. Understanding the nanostructure evolution and the mechanical strengthening of the M50 bearing steel during ultrasonic shot peening. Mater. Sci. Eng. A 2022, 836, 142721. [Google Scholar] [CrossRef]
- Bagherifard, S.; Ghelichi, R.; Guagliano, M. Numerical and experimental analysis of surface roughness generated by shot peening. Appl. Surf. Sci. 2012, 258, 6831–6840. [Google Scholar] [CrossRef]
- Jiuyue, Z.; Tang, J.; Zhou, W.; Jiang, T.; Liu, H.; Xing, B. Numerical modeling and experimental verification of residual stress distribution evolution of 12Cr2Ni4A steel generated by shot peening. Surf. Coat. Technol. 2021, 430, 127993. [Google Scholar] [CrossRef]
- Ghasemi, A.; Vanini, S.A.S. A comprehensive investigation on the effect of controlling parameters of ultrasonic peening treatment on residual stress and surface roughness: Experiments, numerical simulations and optimization. Surf. Coat. Technol. 2023, 464, 129515. [Google Scholar] [CrossRef]
- Zhang, B.; Liu, H.; Bai, H.; Zhu, C.; Wu, W. Ratchetting–multiaxial fatigue damage analysis in gear rolling contact considering tooth surface roughness. Wear 2019, 428–429, 137–146. [Google Scholar] [CrossRef]
- Lin, Q.; Liu, H.; Zhu, C.; Parker, R.G. Investigation on the effect of shot peening coverage on the surface integrity. Appl. Surf. Sci. 2019, 489, 66–72. [Google Scholar] [CrossRef]
- Li, K.; Wang, C.; Hu, X.; Zhou, Y.; Lai, Y.; Wang, C. DEM-FEM coupling simulation of residual stresses and surface roughness induced by shot peening of TC4 titanium alloy. Int. J. Adv. Manuf. Technol. 2022, 118, 1469–1483. [Google Scholar] [CrossRef]
- Xie, L.; Zhang, J.; Xiong, C.; Wu, L.; Jiang, C.; Lu, W. Investigation on experiments and numerical modelling of the residual stress distribution in deformed surface layer of Ti–6Al–4V after shot peening. Mater. Des. 2012, 41, 314–318. [Google Scholar] [CrossRef]
- Li, P.; Hu, S.; Liu, Y.; Hua, L.; Yin, F. Surface Nanocrystallization and Numerical Modeling of 316L Stainless Steel during Ultrasonic Shot Peening Process. Metals 2022, 12, 1673. [Google Scholar] [CrossRef]


| Al | V | Fe | C | N | O | Ti |
|---|---|---|---|---|---|---|
| 6.40 | 4.07 | 0.04 | 0.01 | 0.02 | 0.15 | Bal. |
| E (GPa) | v | A (MPa) | B (MPa) | C | n | m | Tr (K) | Tm (K) |
|---|---|---|---|---|---|---|---|---|
| 110 | 0.34 | 1098 | 1092 | 0.014 | 0.93 | 1.1 | 298 | 1878 |
Disclaimer/Publisher’s Note: The statements, opinions and data contained in all publications are solely those of the individual author(s) and contributor(s) and not of MDPI and/or the editor(s). MDPI and/or the editor(s) disclaim responsibility for any injury to people or property resulting from any ideas, methods, instructions or products referred to in the content. |
© 2024 by the authors. Licensee MDPI, Basel, Switzerland. This article is an open access article distributed under the terms and conditions of the Creative Commons Attribution (CC BY) license (https://creativecommons.org/licenses/by/4.0/).
Share and Cite
Yi, Y.; Yin, F.; Zhai, J.; Liu, Y. Microstructure Evolution and Numerical Modeling of TC4 Titanium Alloy during Ultrasonic Shot Peening Process. Metals 2024, 14, 275. https://doi.org/10.3390/met14030275
Yi Y, Yin F, Zhai J, Liu Y. Microstructure Evolution and Numerical Modeling of TC4 Titanium Alloy during Ultrasonic Shot Peening Process. Metals. 2024; 14(3):275. https://doi.org/10.3390/met14030275
Chicago/Turabian StyleYi, Yuxuan, Fei Yin, Jiajun Zhai, and Yanxiong Liu. 2024. "Microstructure Evolution and Numerical Modeling of TC4 Titanium Alloy during Ultrasonic Shot Peening Process" Metals 14, no. 3: 275. https://doi.org/10.3390/met14030275
APA StyleYi, Y., Yin, F., Zhai, J., & Liu, Y. (2024). Microstructure Evolution and Numerical Modeling of TC4 Titanium Alloy during Ultrasonic Shot Peening Process. Metals, 14(3), 275. https://doi.org/10.3390/met14030275