
Effect of MgO Contents on the Microstructure, Mechanical Properties and Corrosion Behavior of Low-Alloyed Mg-Zn-Ca Alloy


Abstract
1. Introduction
2. Experimental
2.1. Materials Preparation
2.2. Microstructural Characterization
2.3. XRD Phase Analysis
2.4. Mechanical Performance Test
2.4.1. Hardness Test
2.4.2. Tensile Test
2.5. Corrosion Test
3. Results
3.1. Microstructural Characterization
3.2. XRD Physical Phase Analysis of Extruded Composites
3.3. Mechanical Properties
3.4. Corrosion Performance
4. Discussion
4.1. Strengthening Mechanism of MgO on Mg-Zn-Ca Alloy
4.2. Corrosion Mechanism of ZXx Materials
5. Conclusions
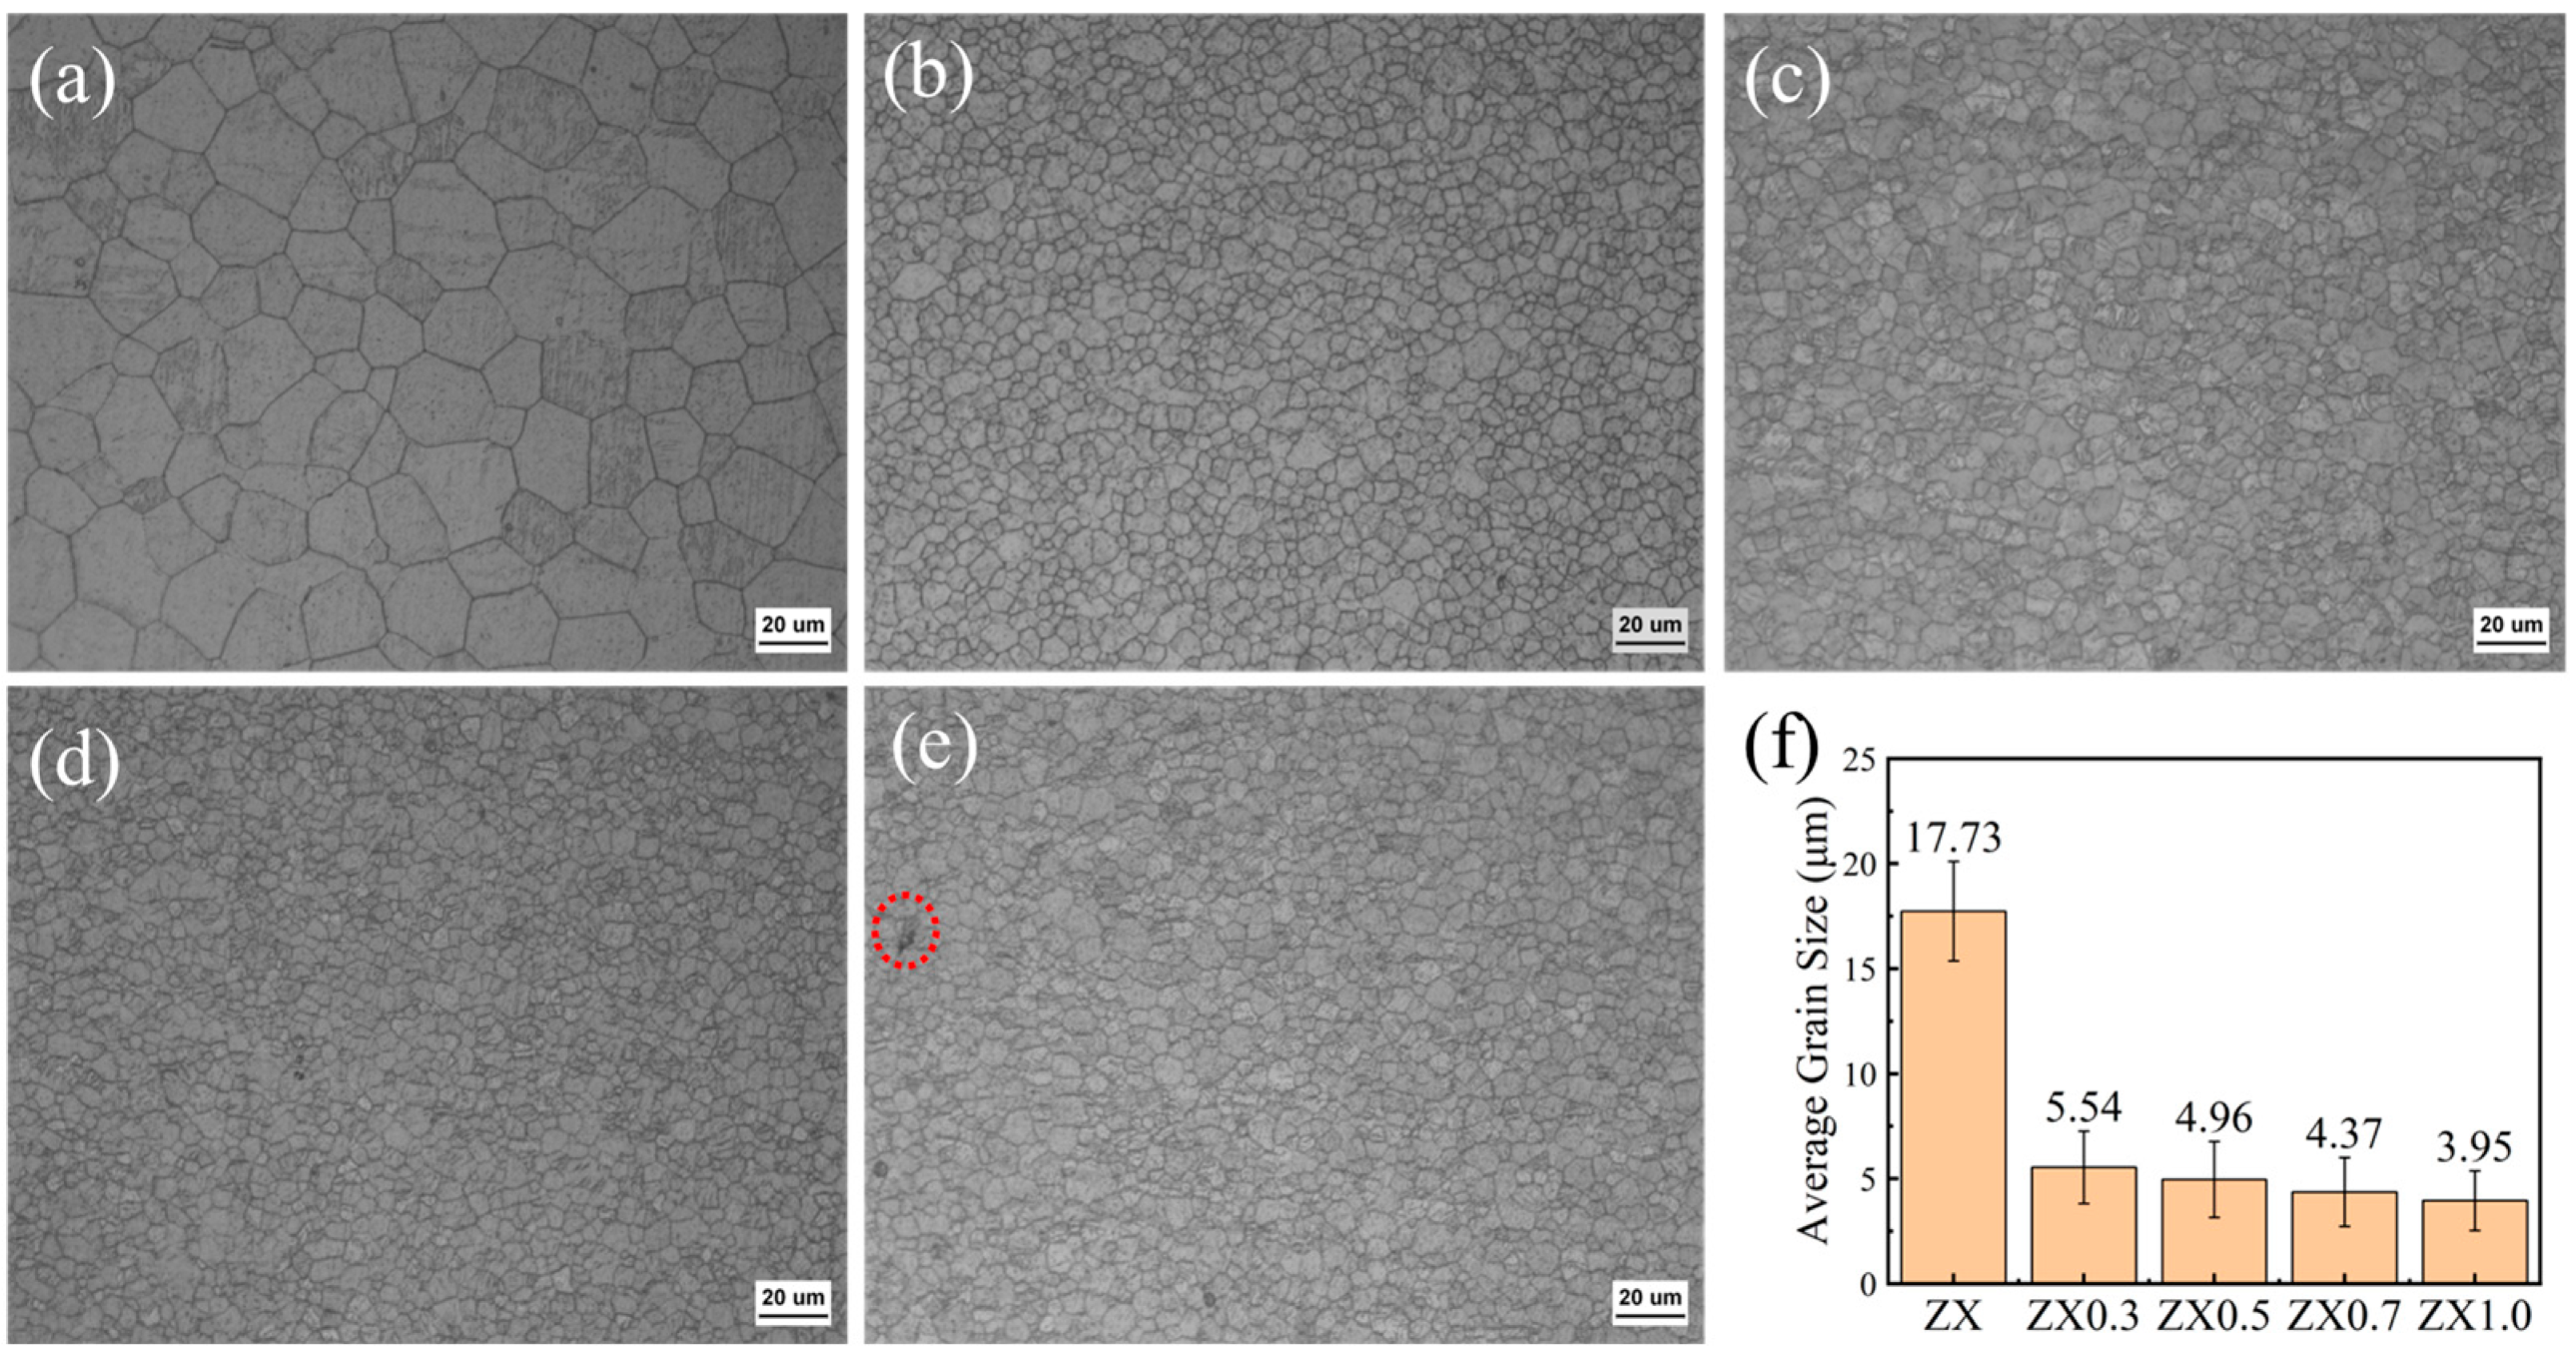
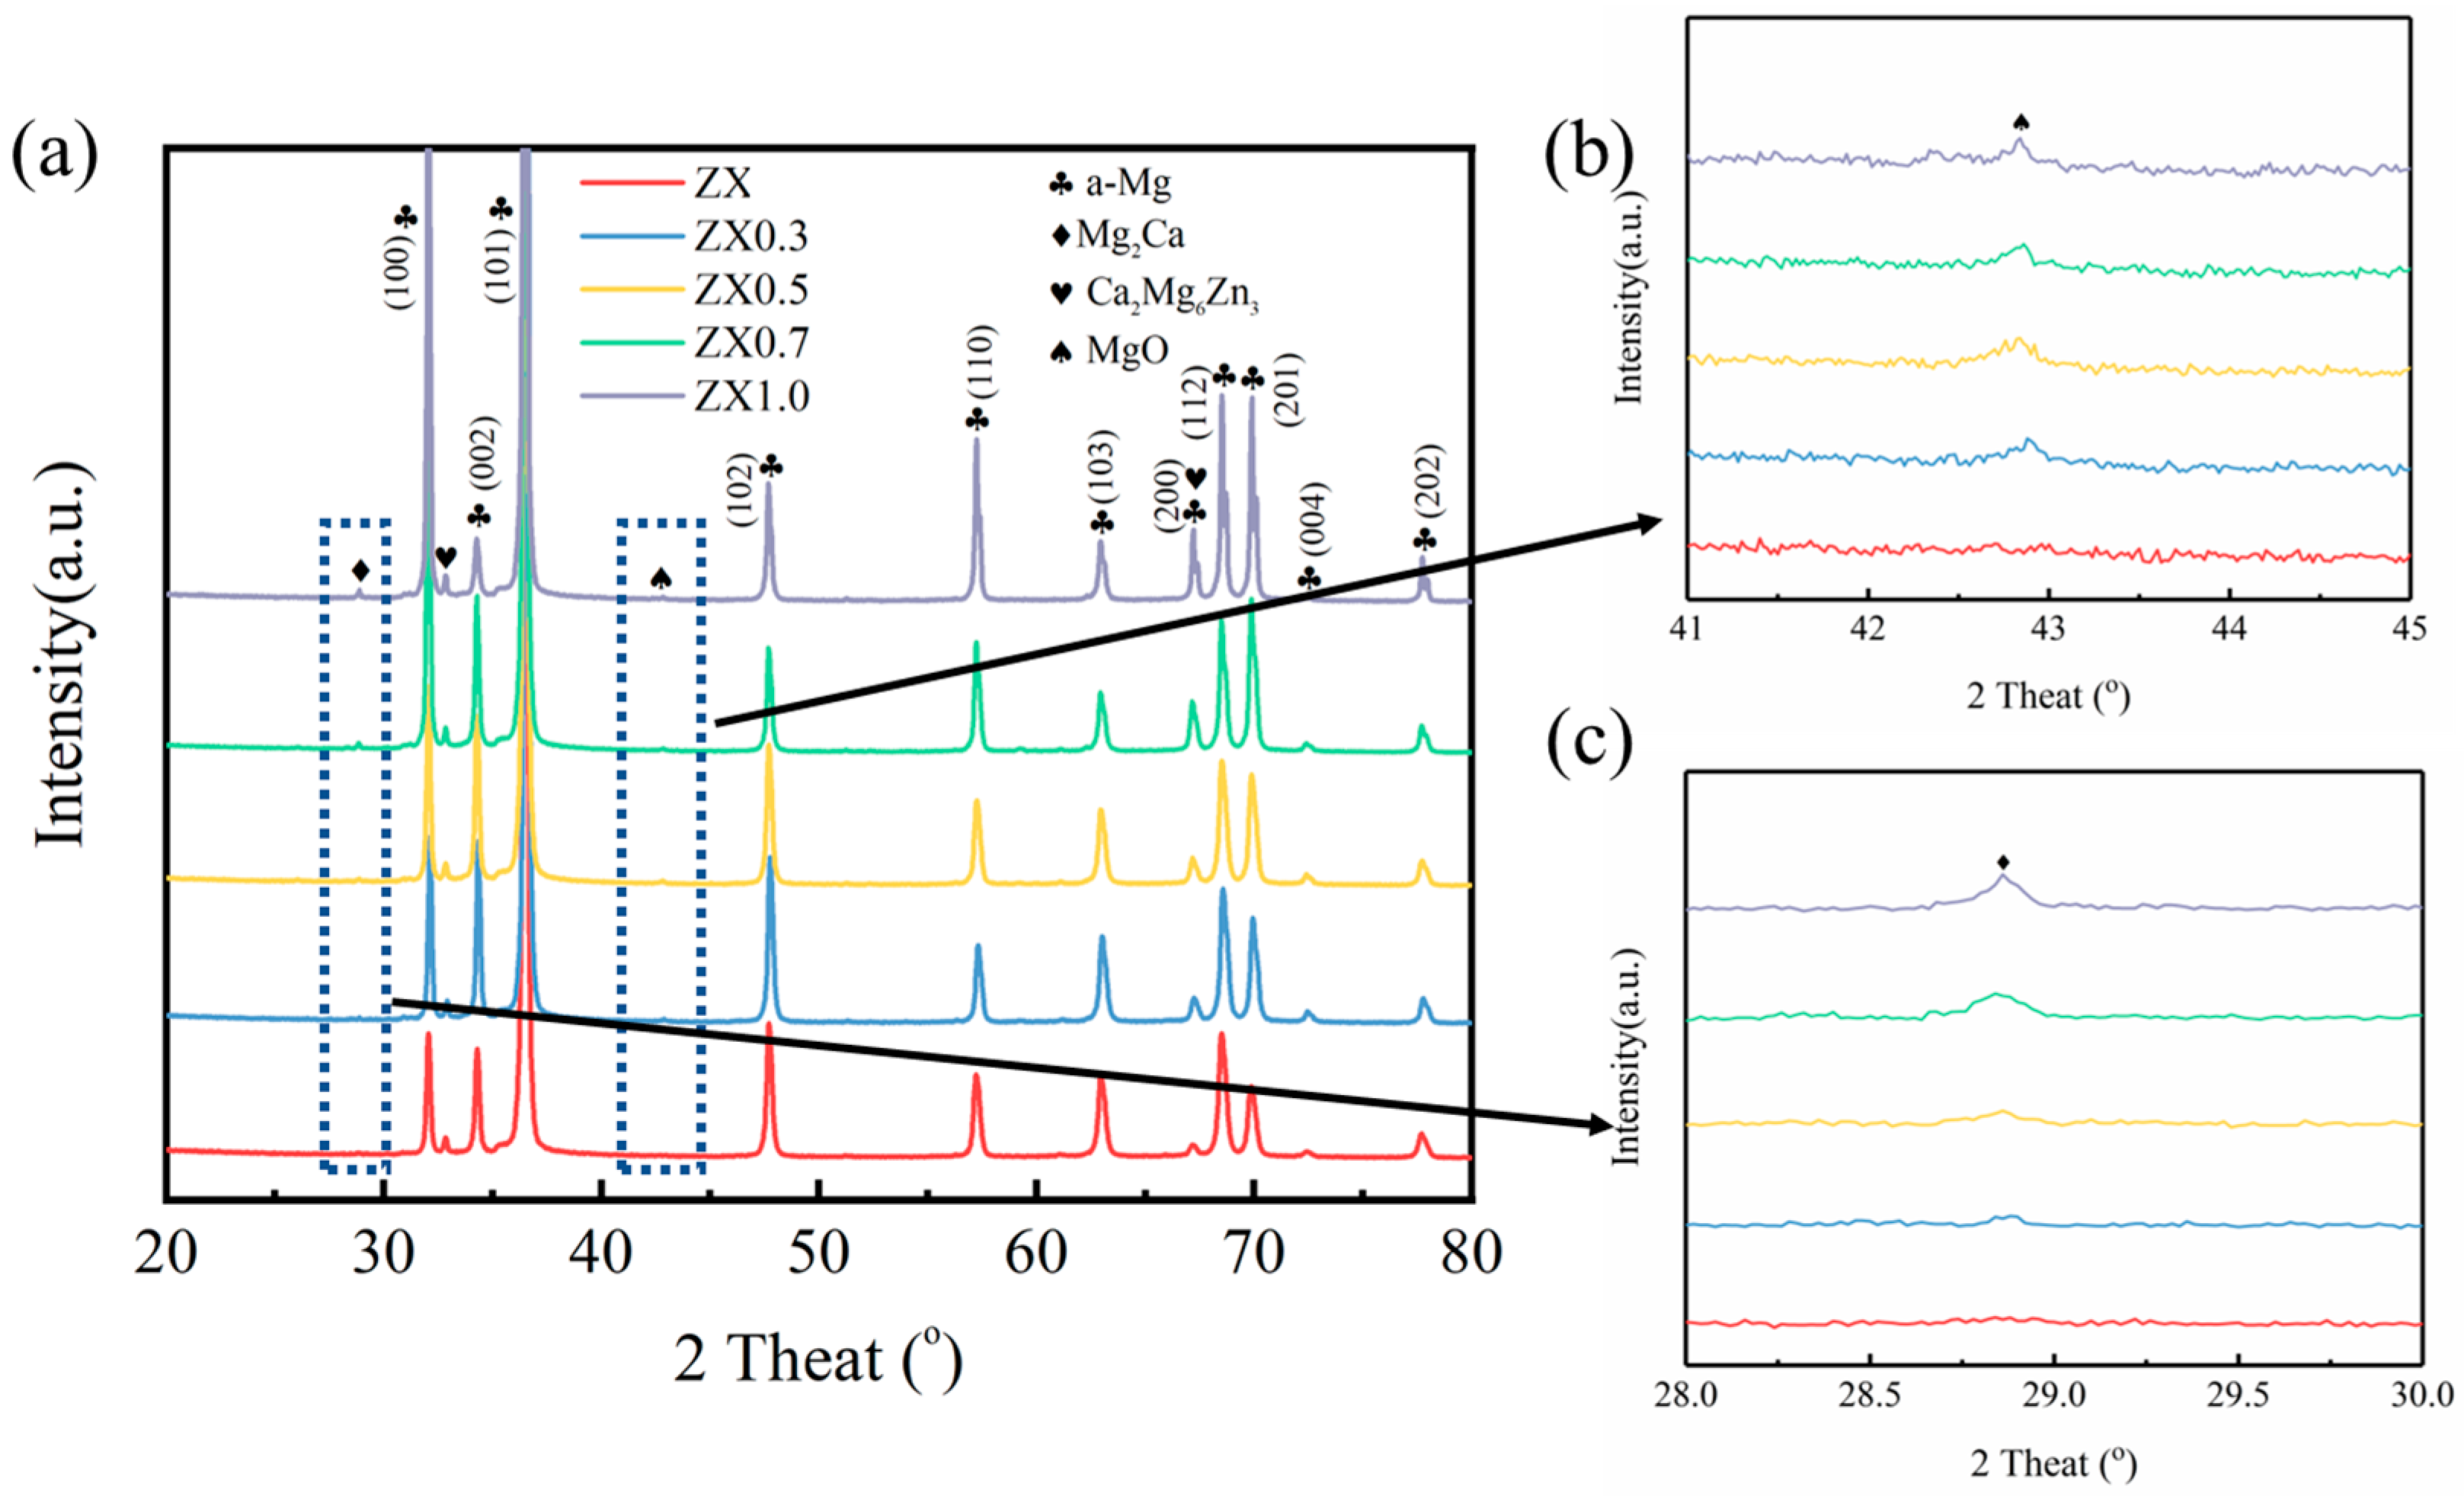
- The incorporation of MgO particles significantly inhibited the grain boundary migration through the Zener pinning force, and the average grain size of the ZX, ZX0.3, ZX0.5, ZX0.7, and ZX1.0 materials were 17.73 μm, 5.54 μm, 4.96 μm, 4.37 μm, and 3.95 μm was obtained in the ZX1.0 composite. However, it did not change the type of second phases (Ca2Mg6Zn3 and Mg2Ca) and only increased the volume fraction of them by increasing the MgO contents.
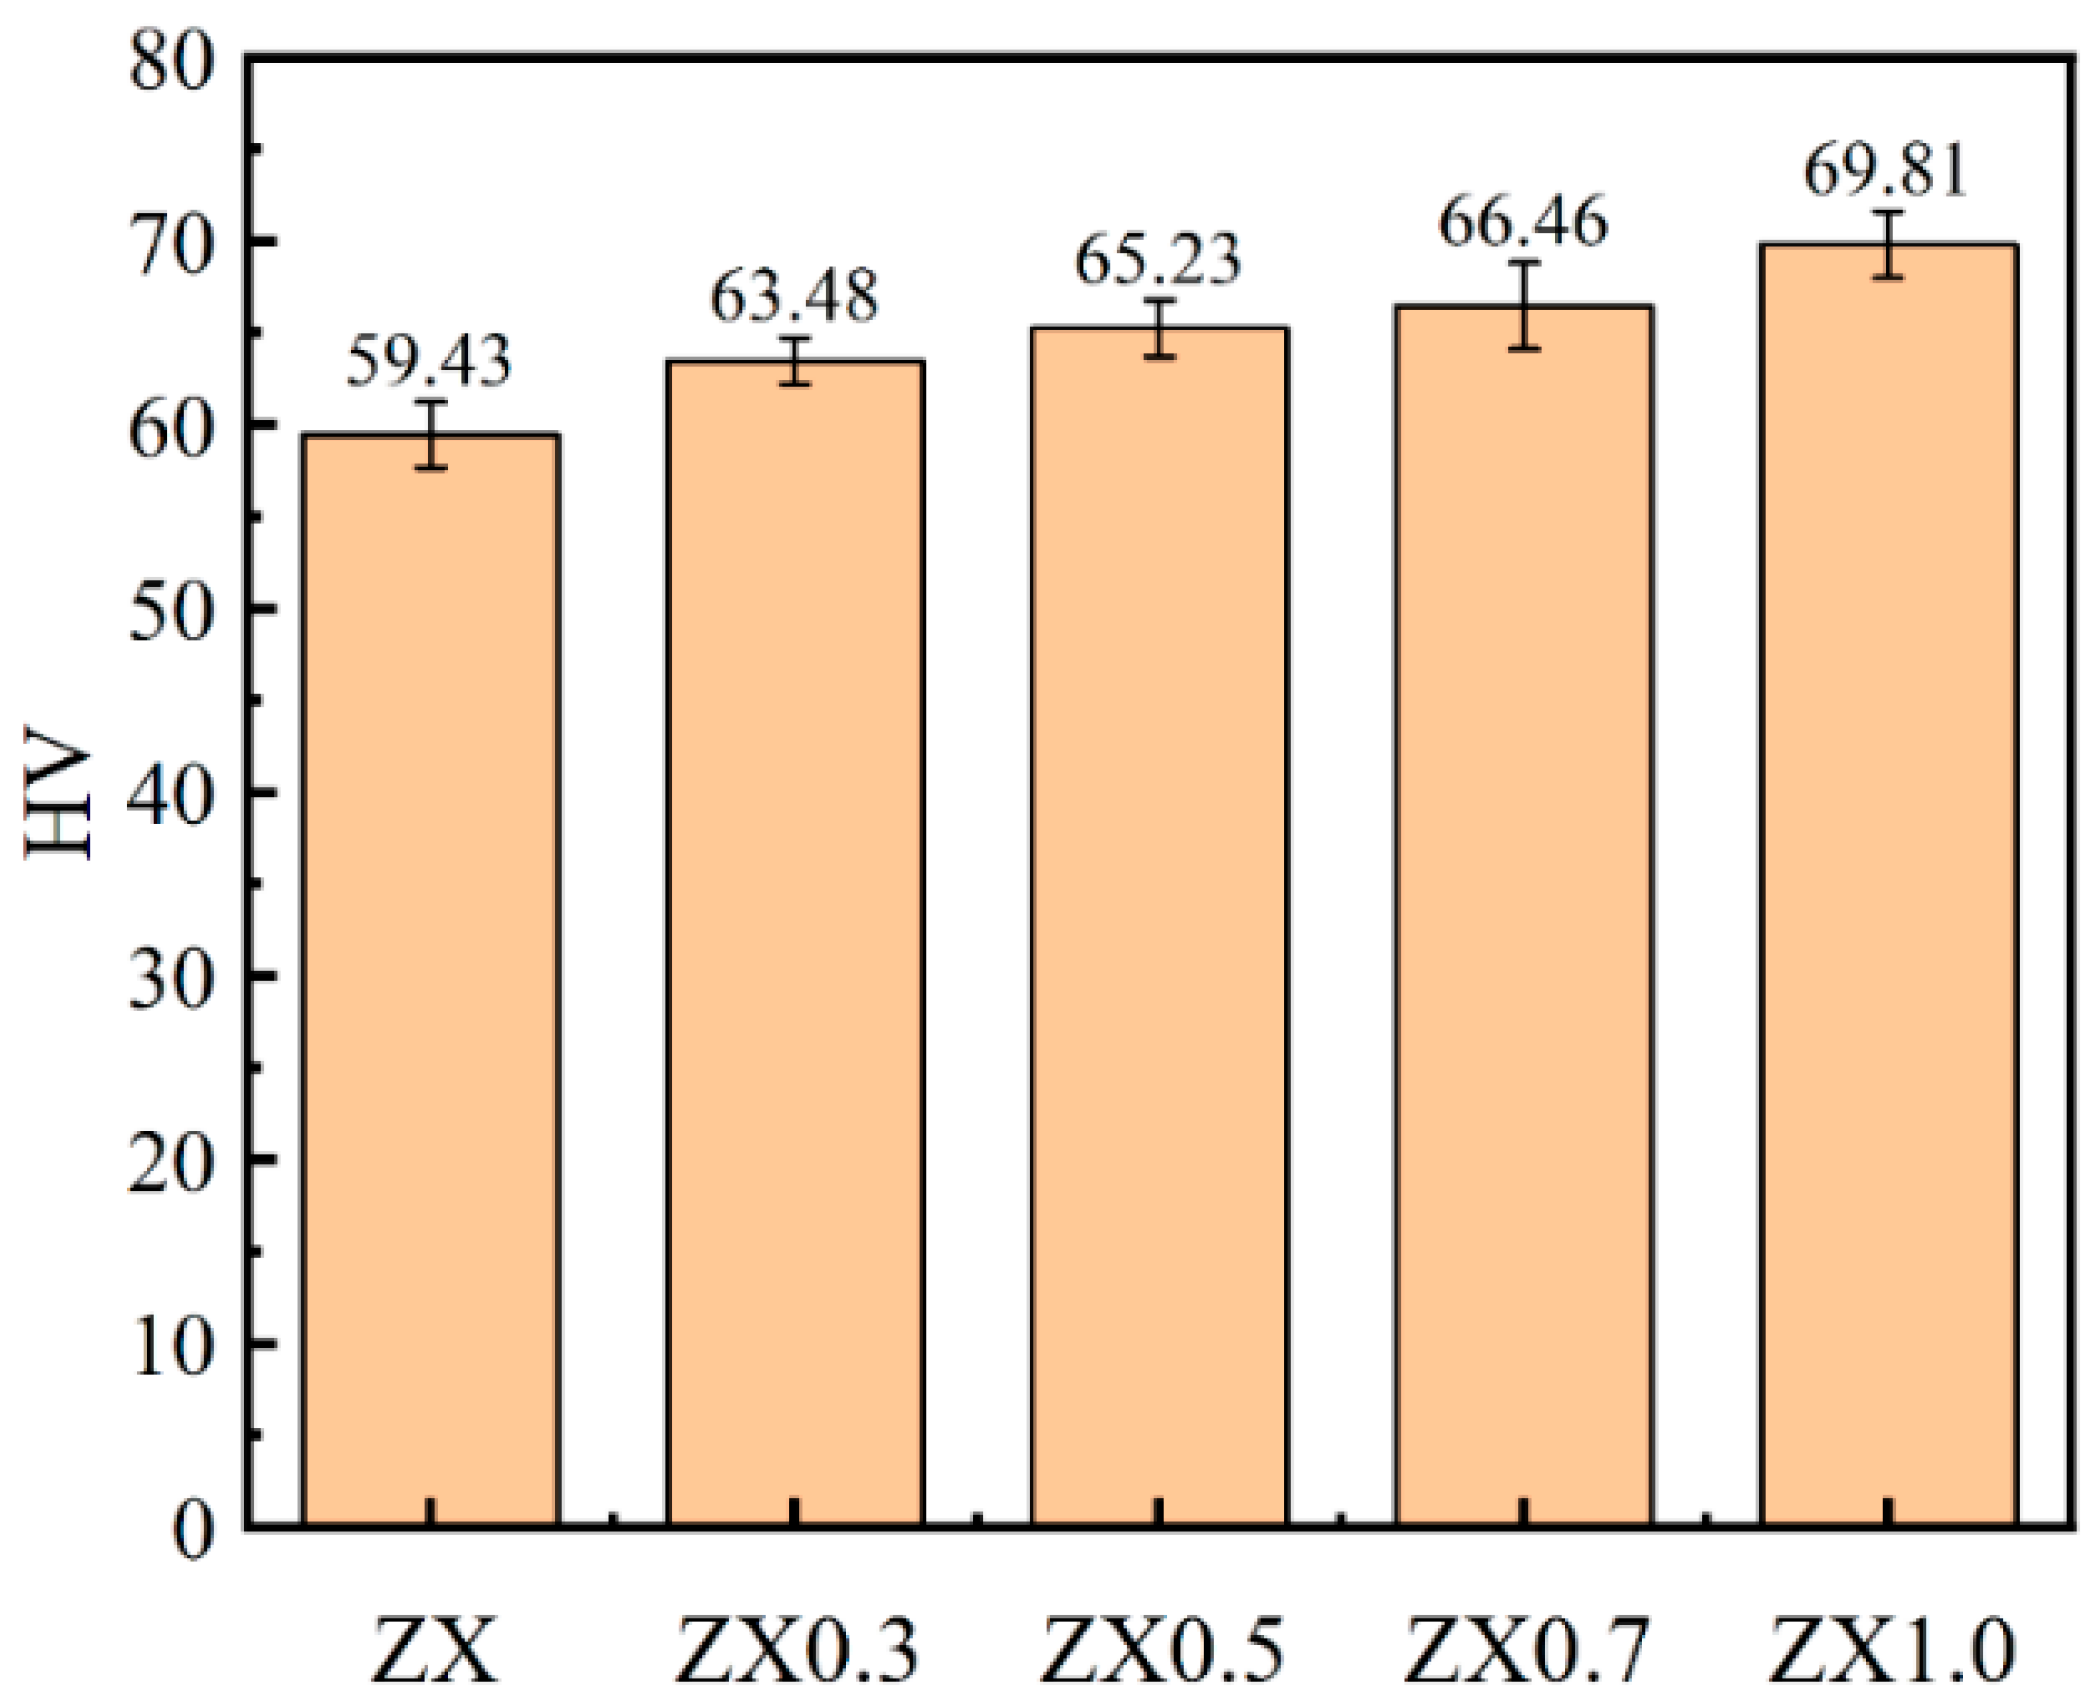
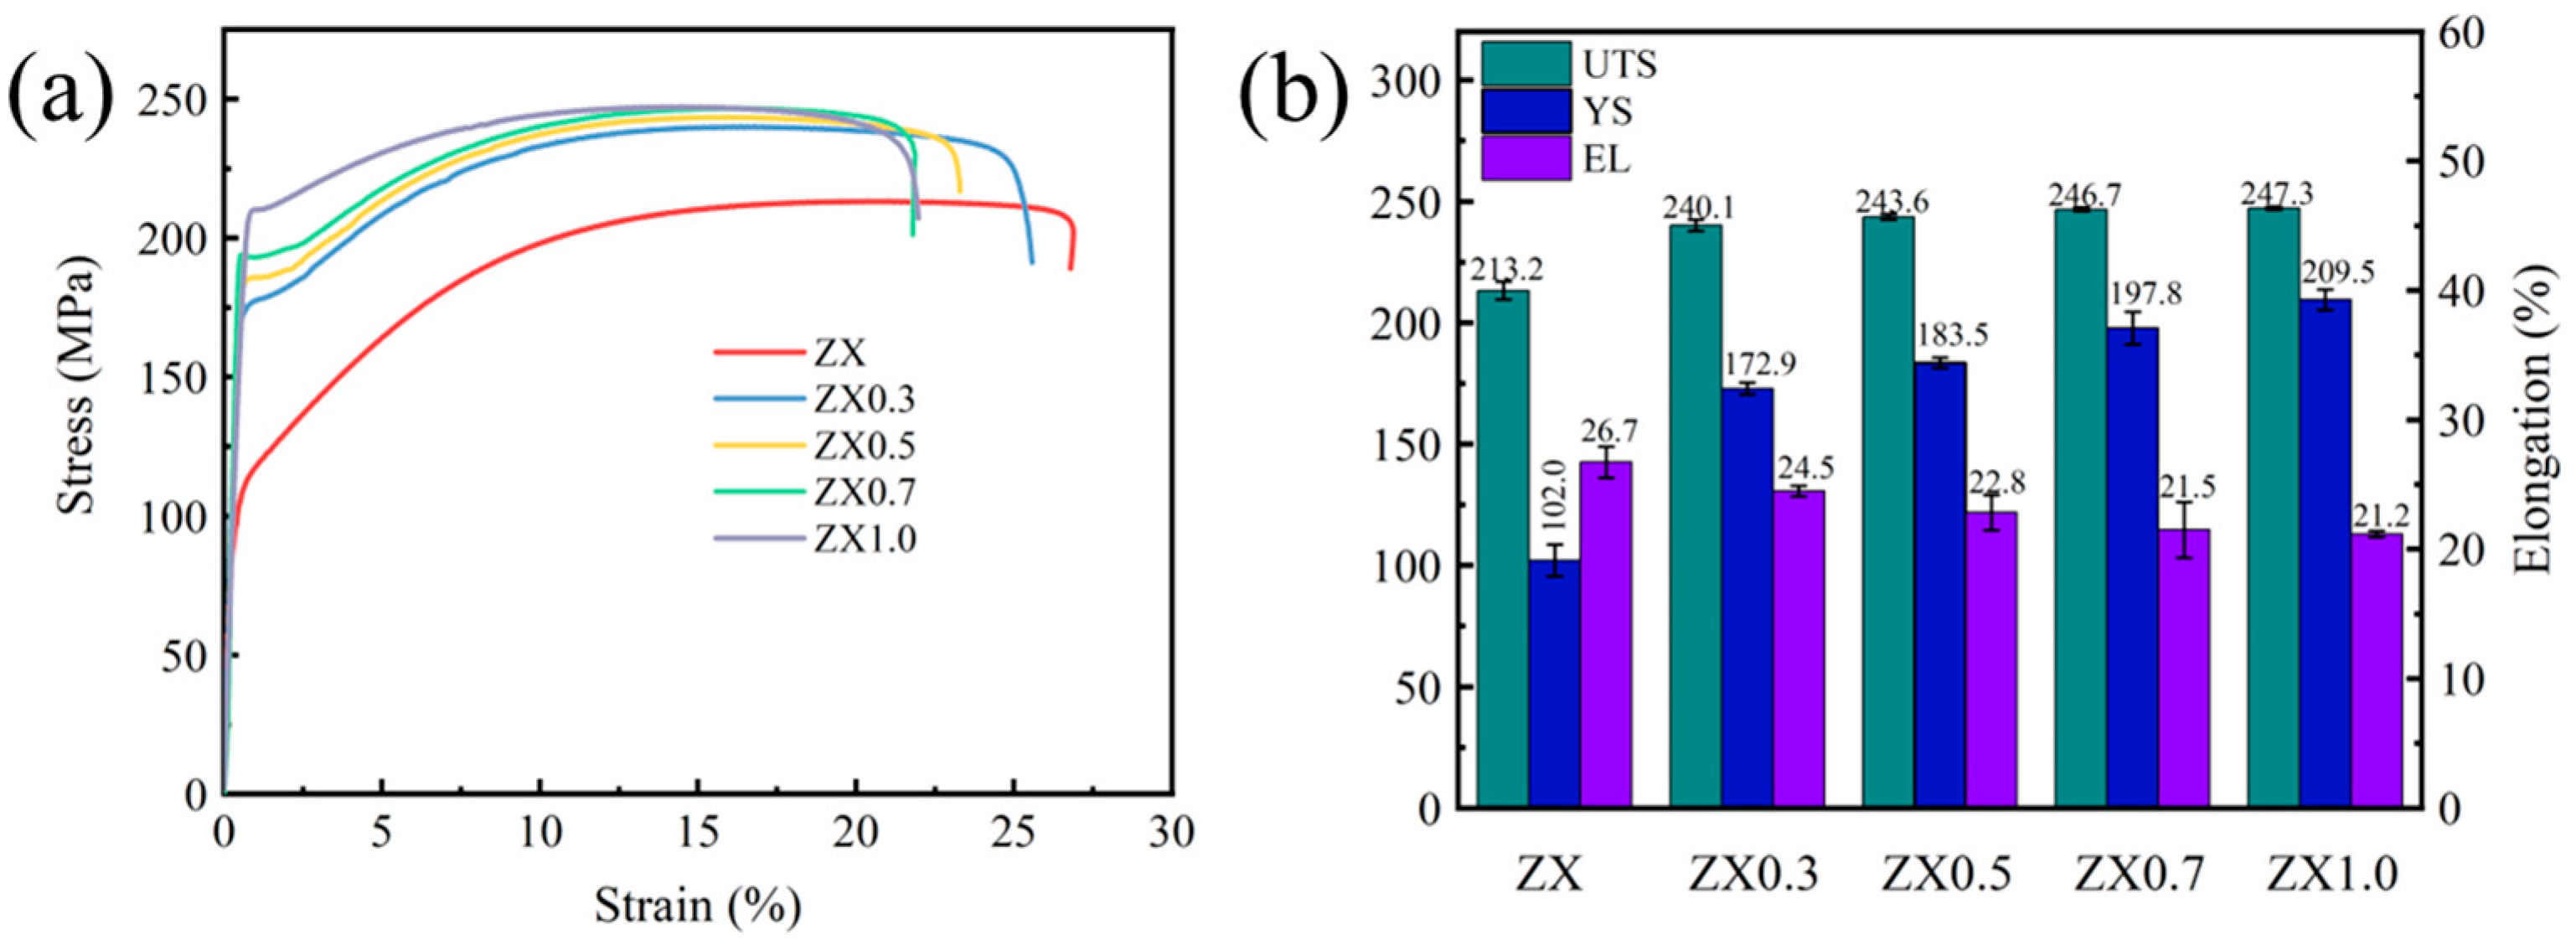
- The mechanical properties of the composites were enhanced due to the fine grain strengthening effect brought by the grain size refinement, as well as the Orowan strengthening caused by the incorporation of MgO particles and the thermal expansion mismatch strengthening. The yield strength and microhardness increased from 102.0 MPa and 59.43 HV in the ZX alloy to 209.5 MPa and 69.81 HV in the ZX1.0 composite. However, the corresponding fracture elongation decreased from 26.7% to 21.2%.
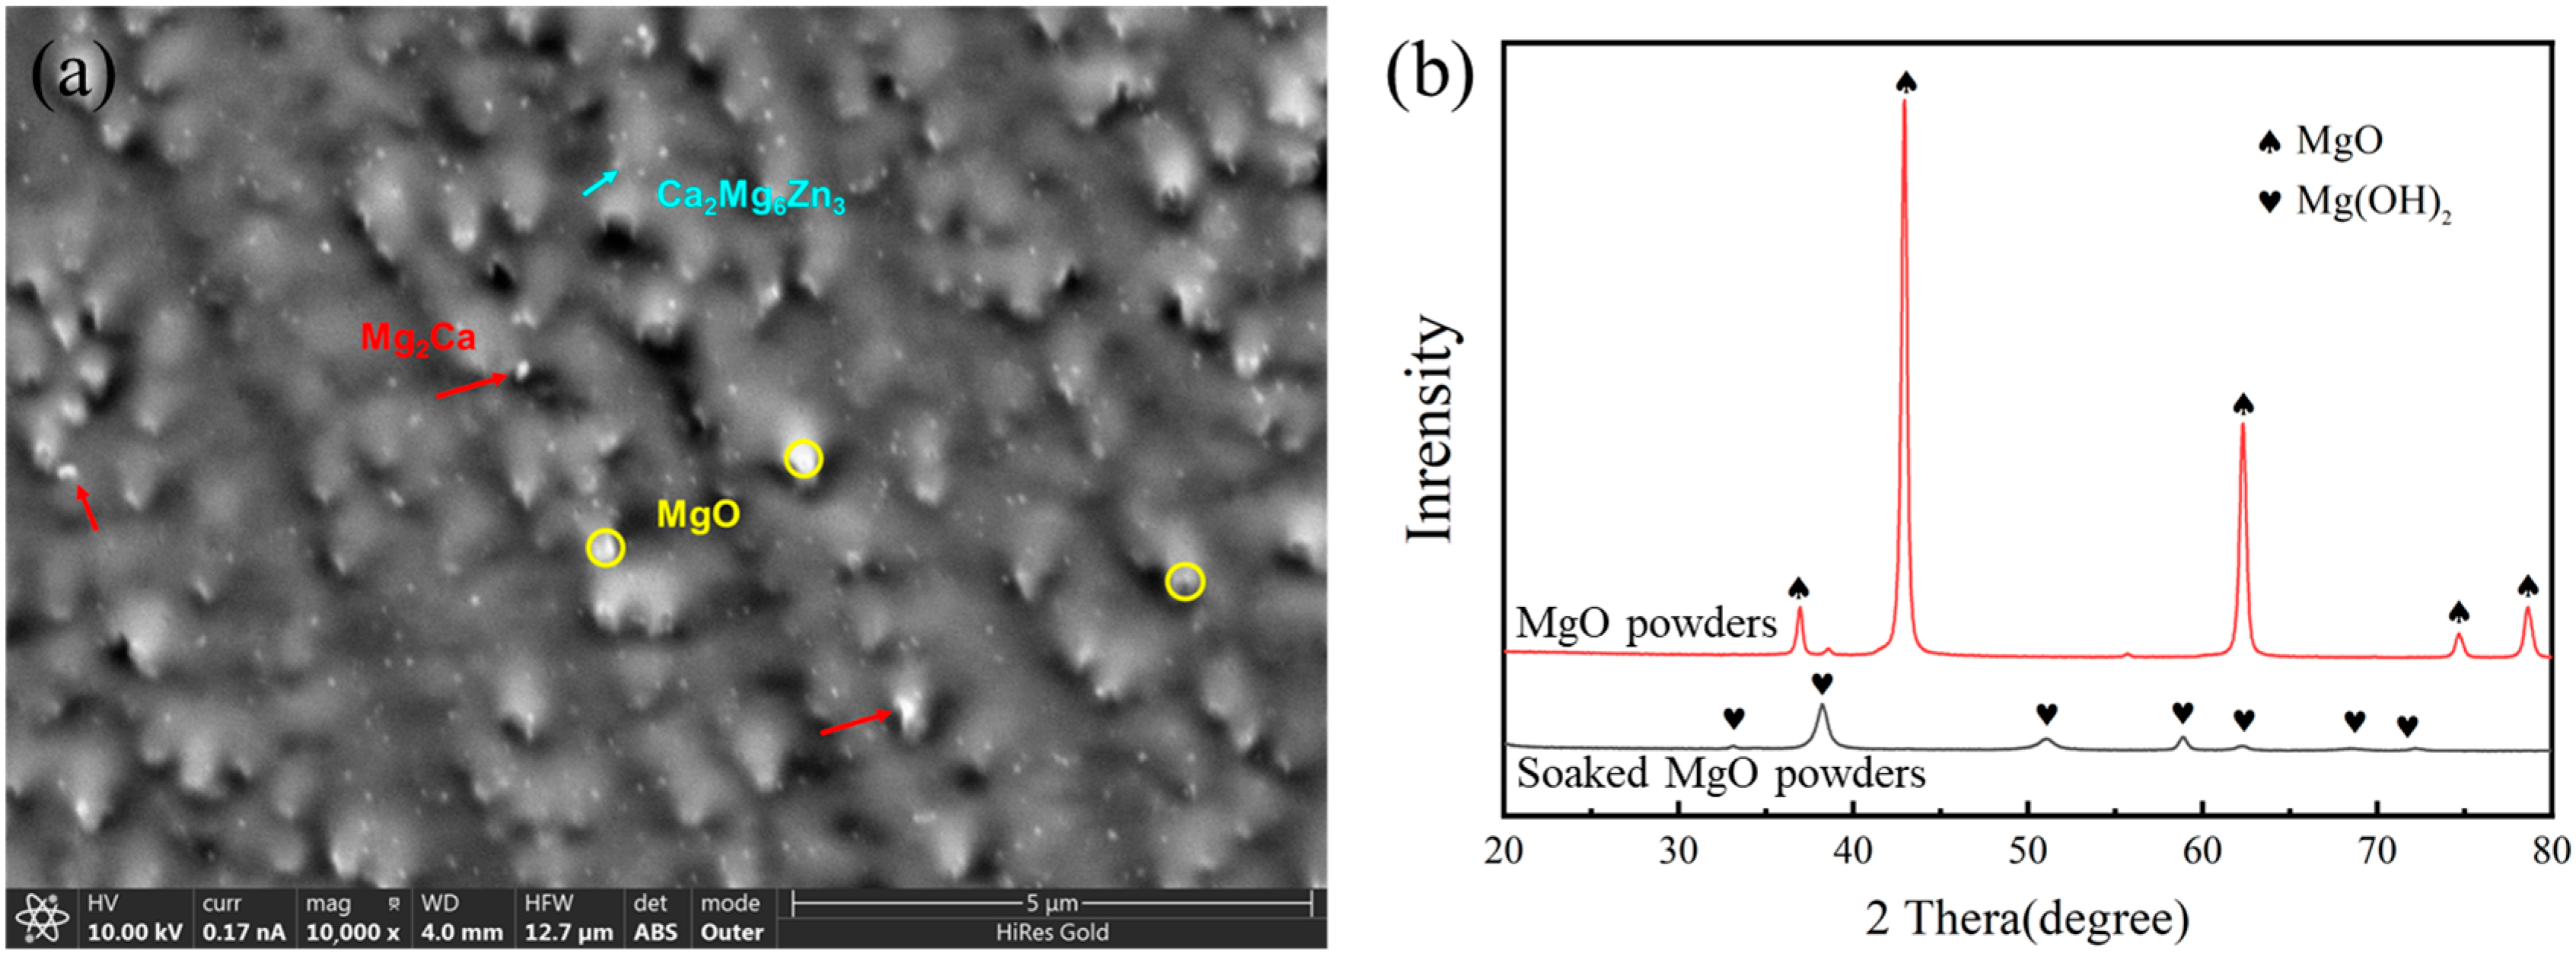
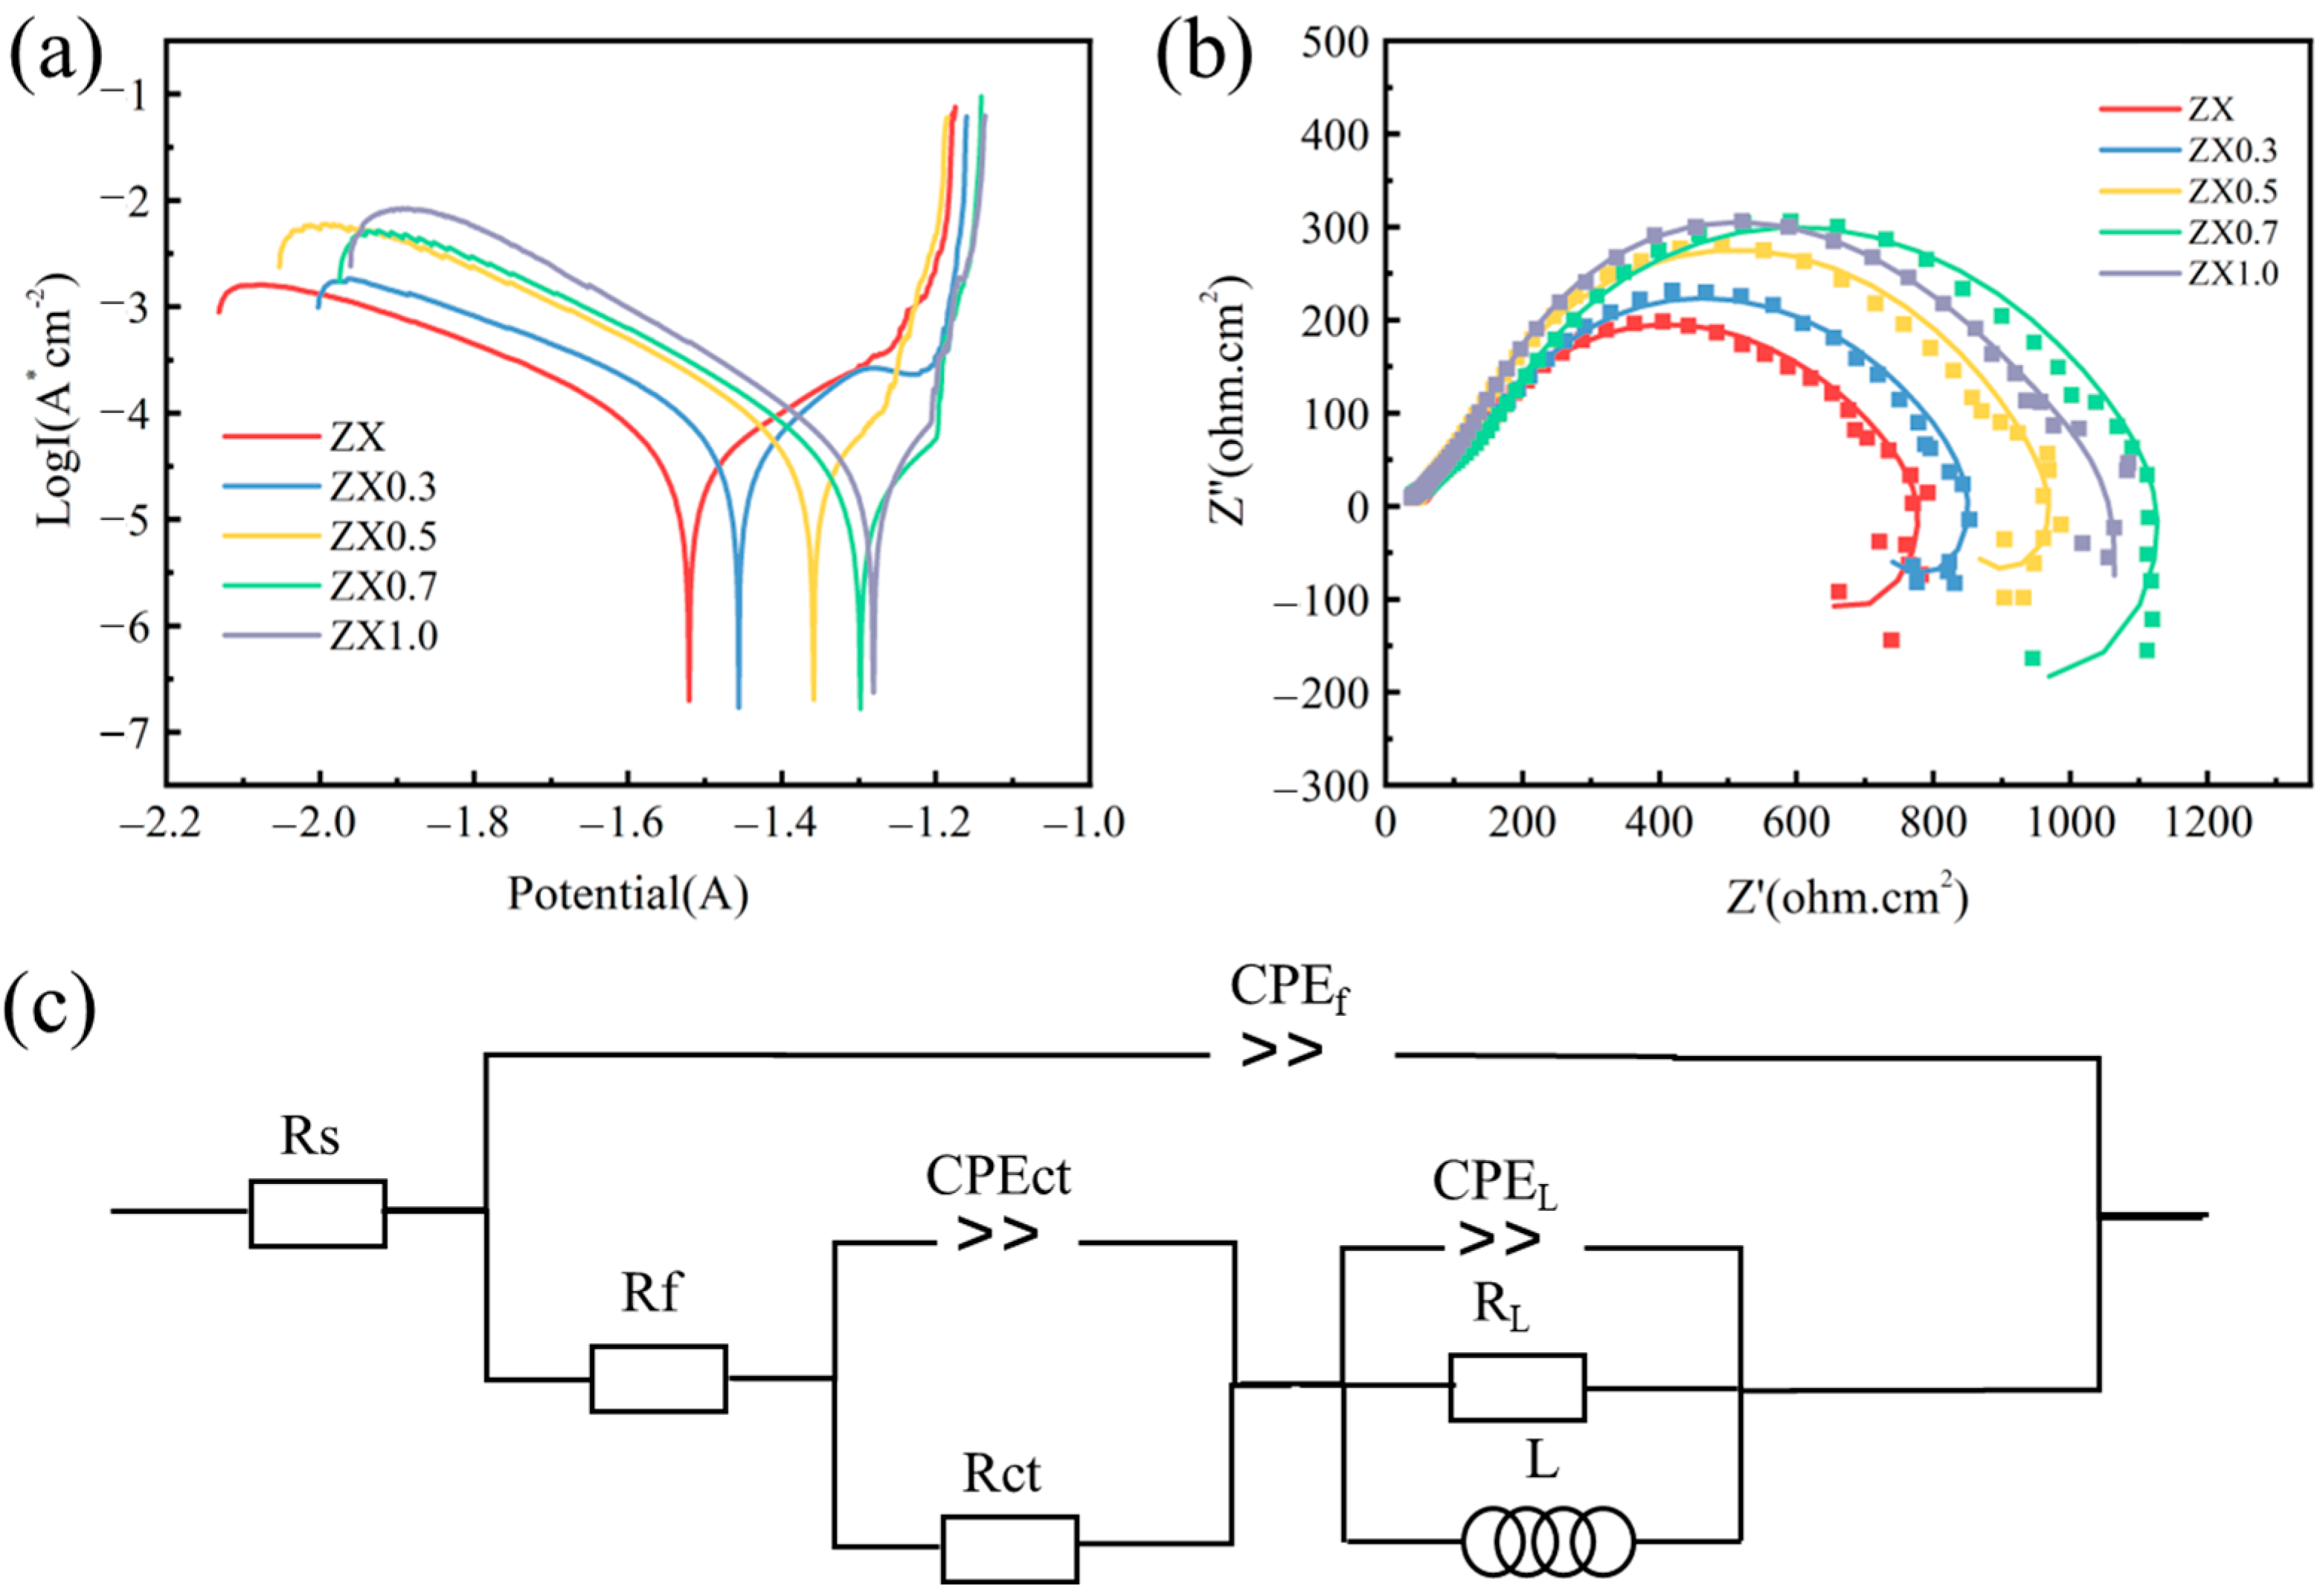
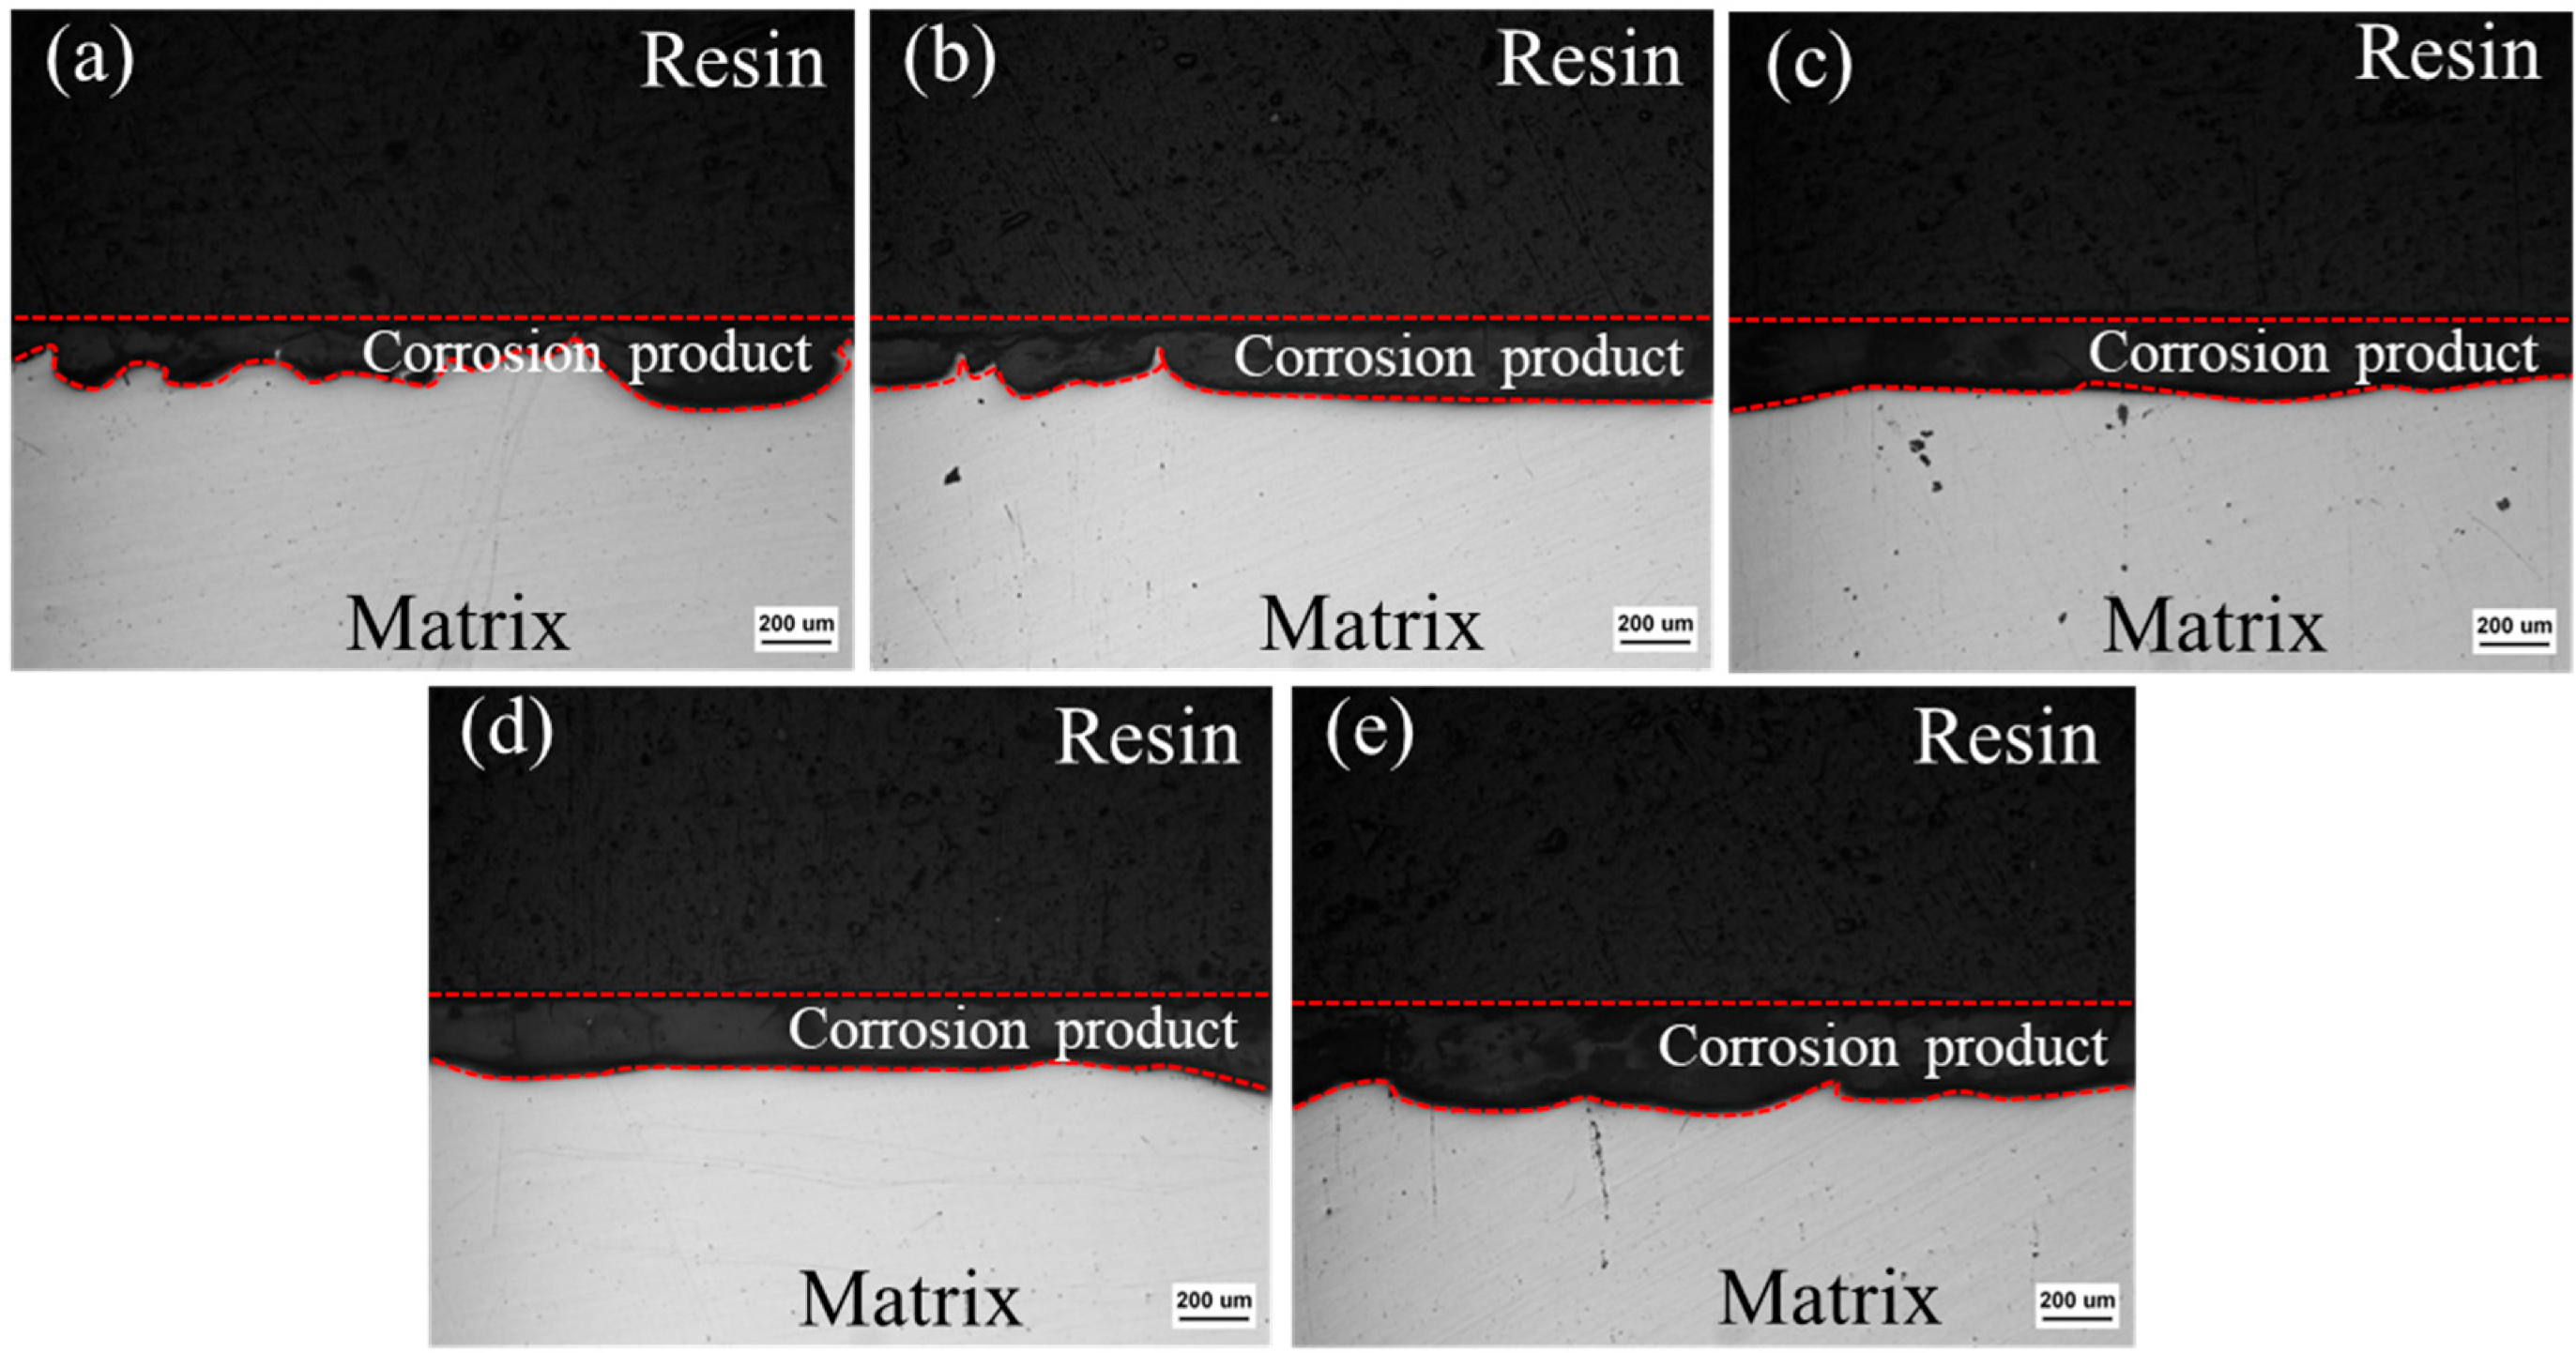
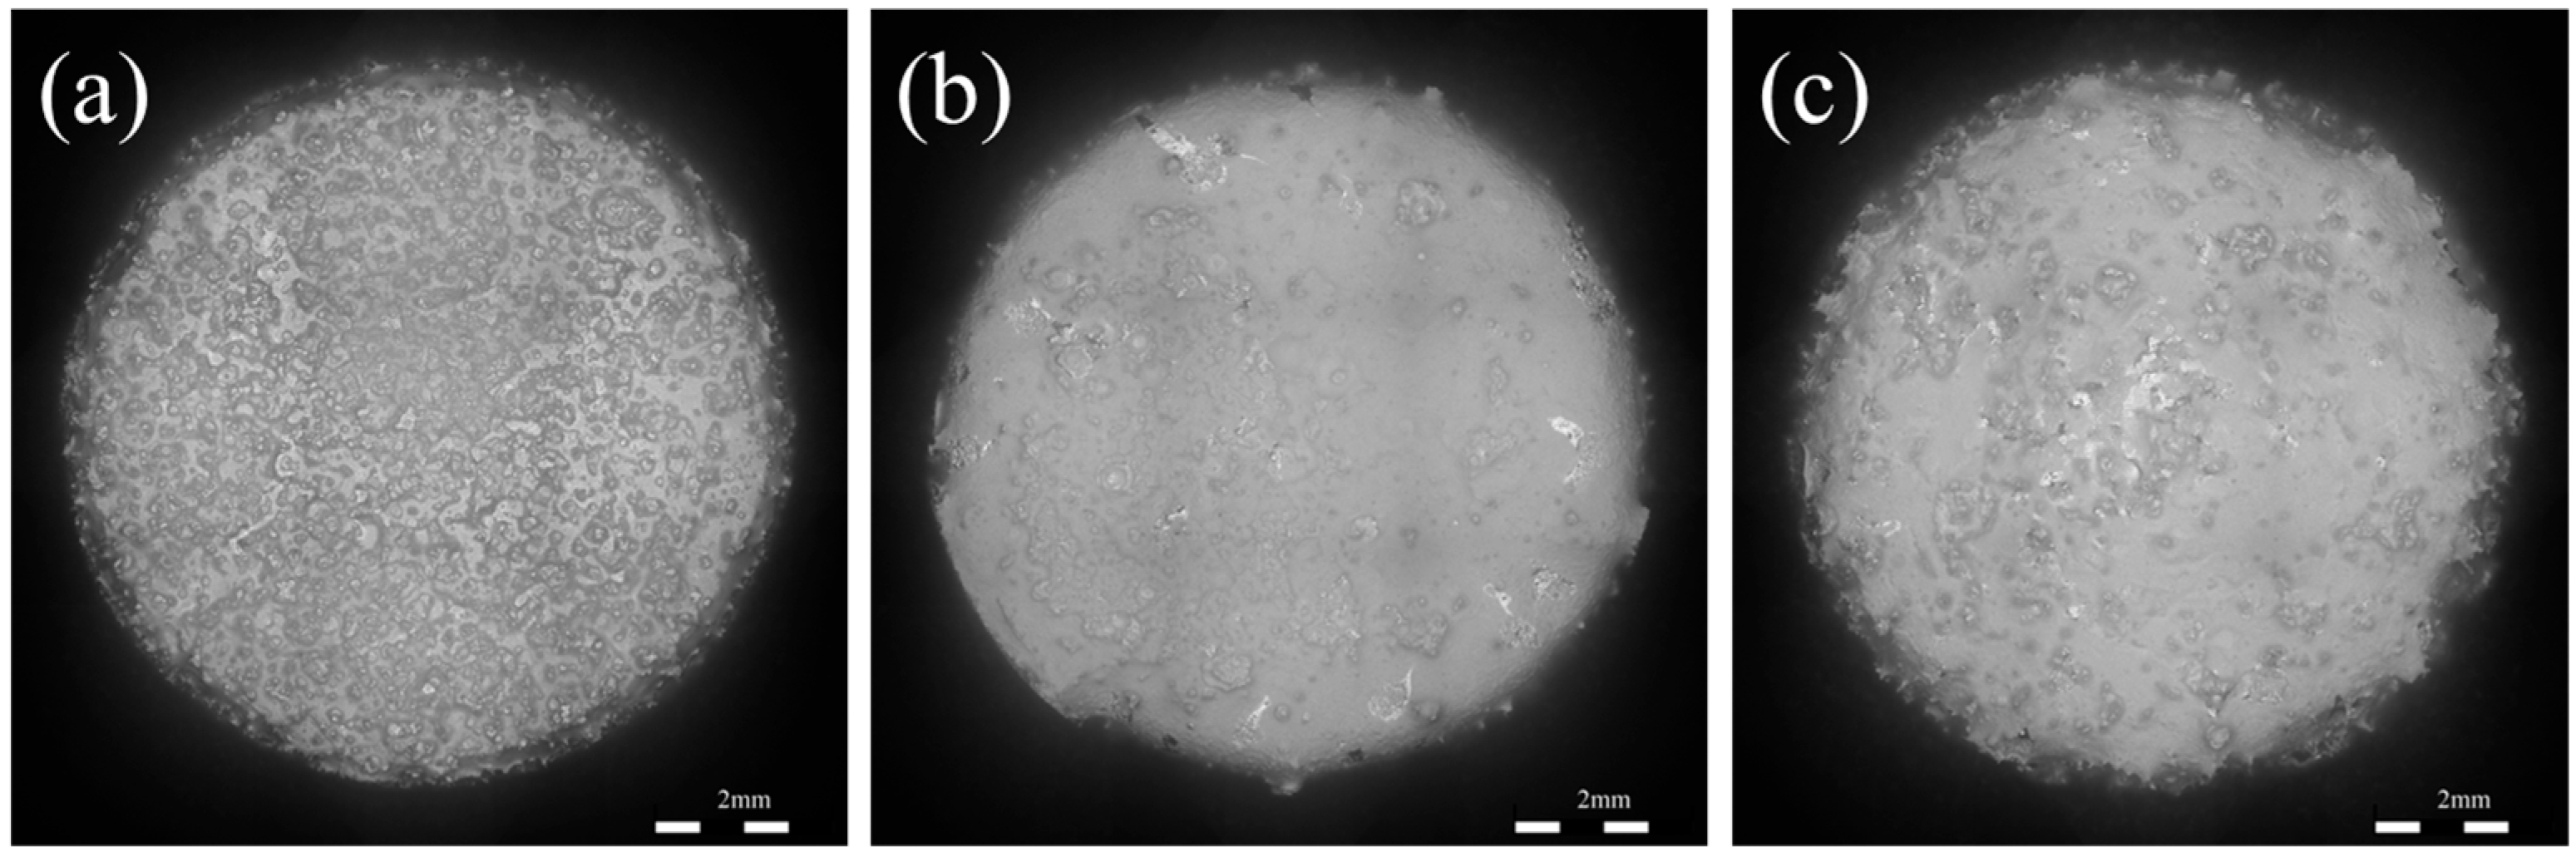
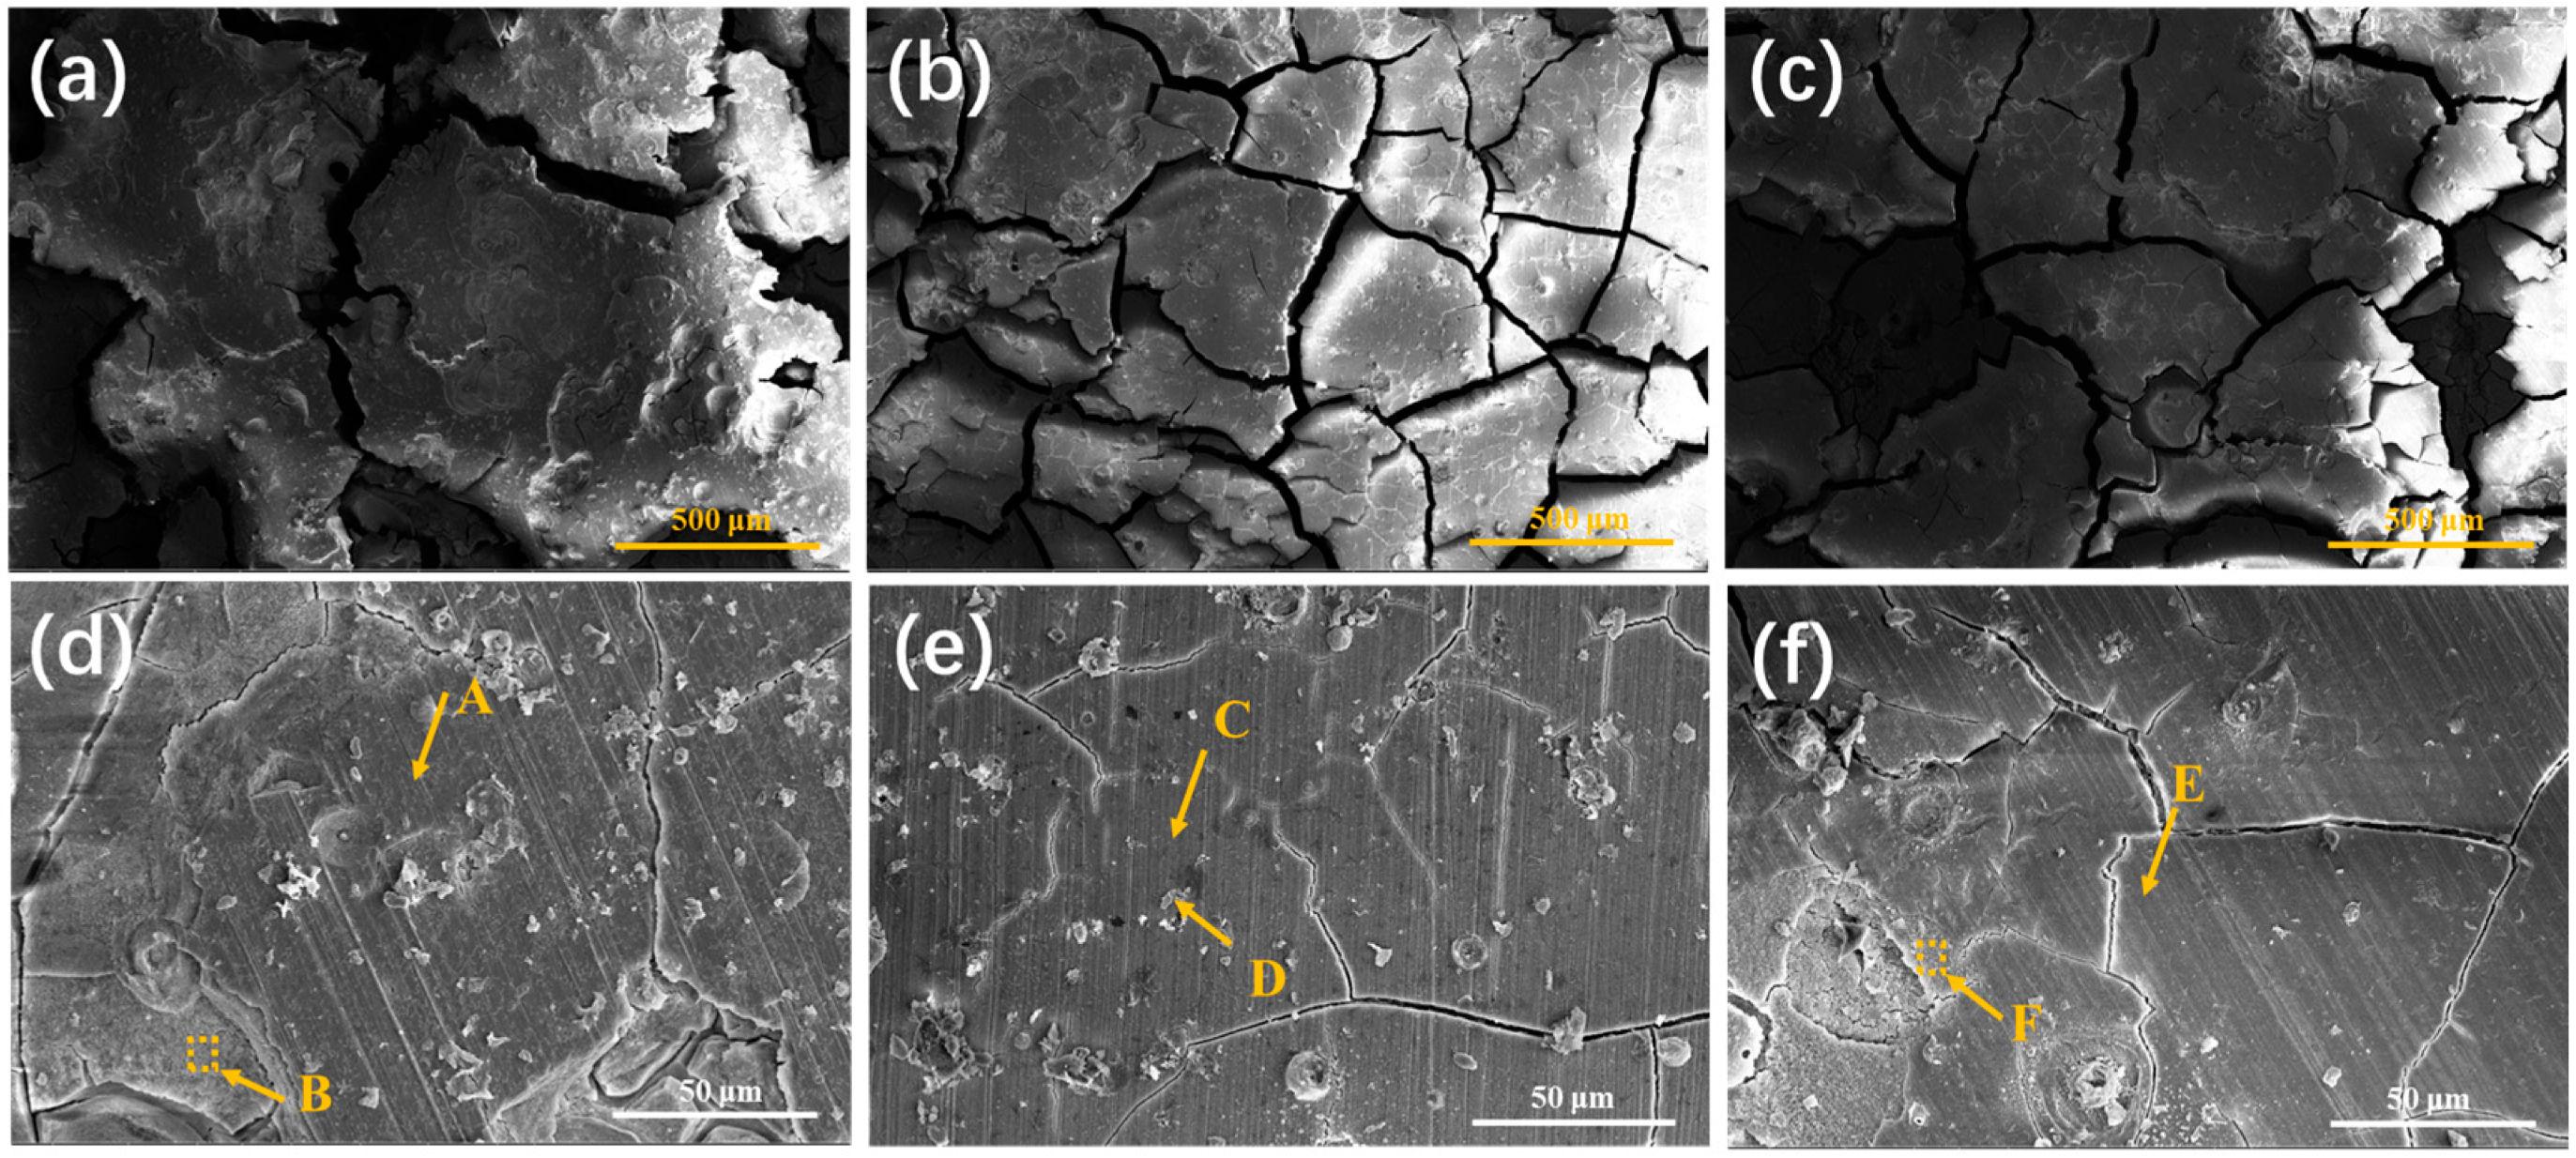
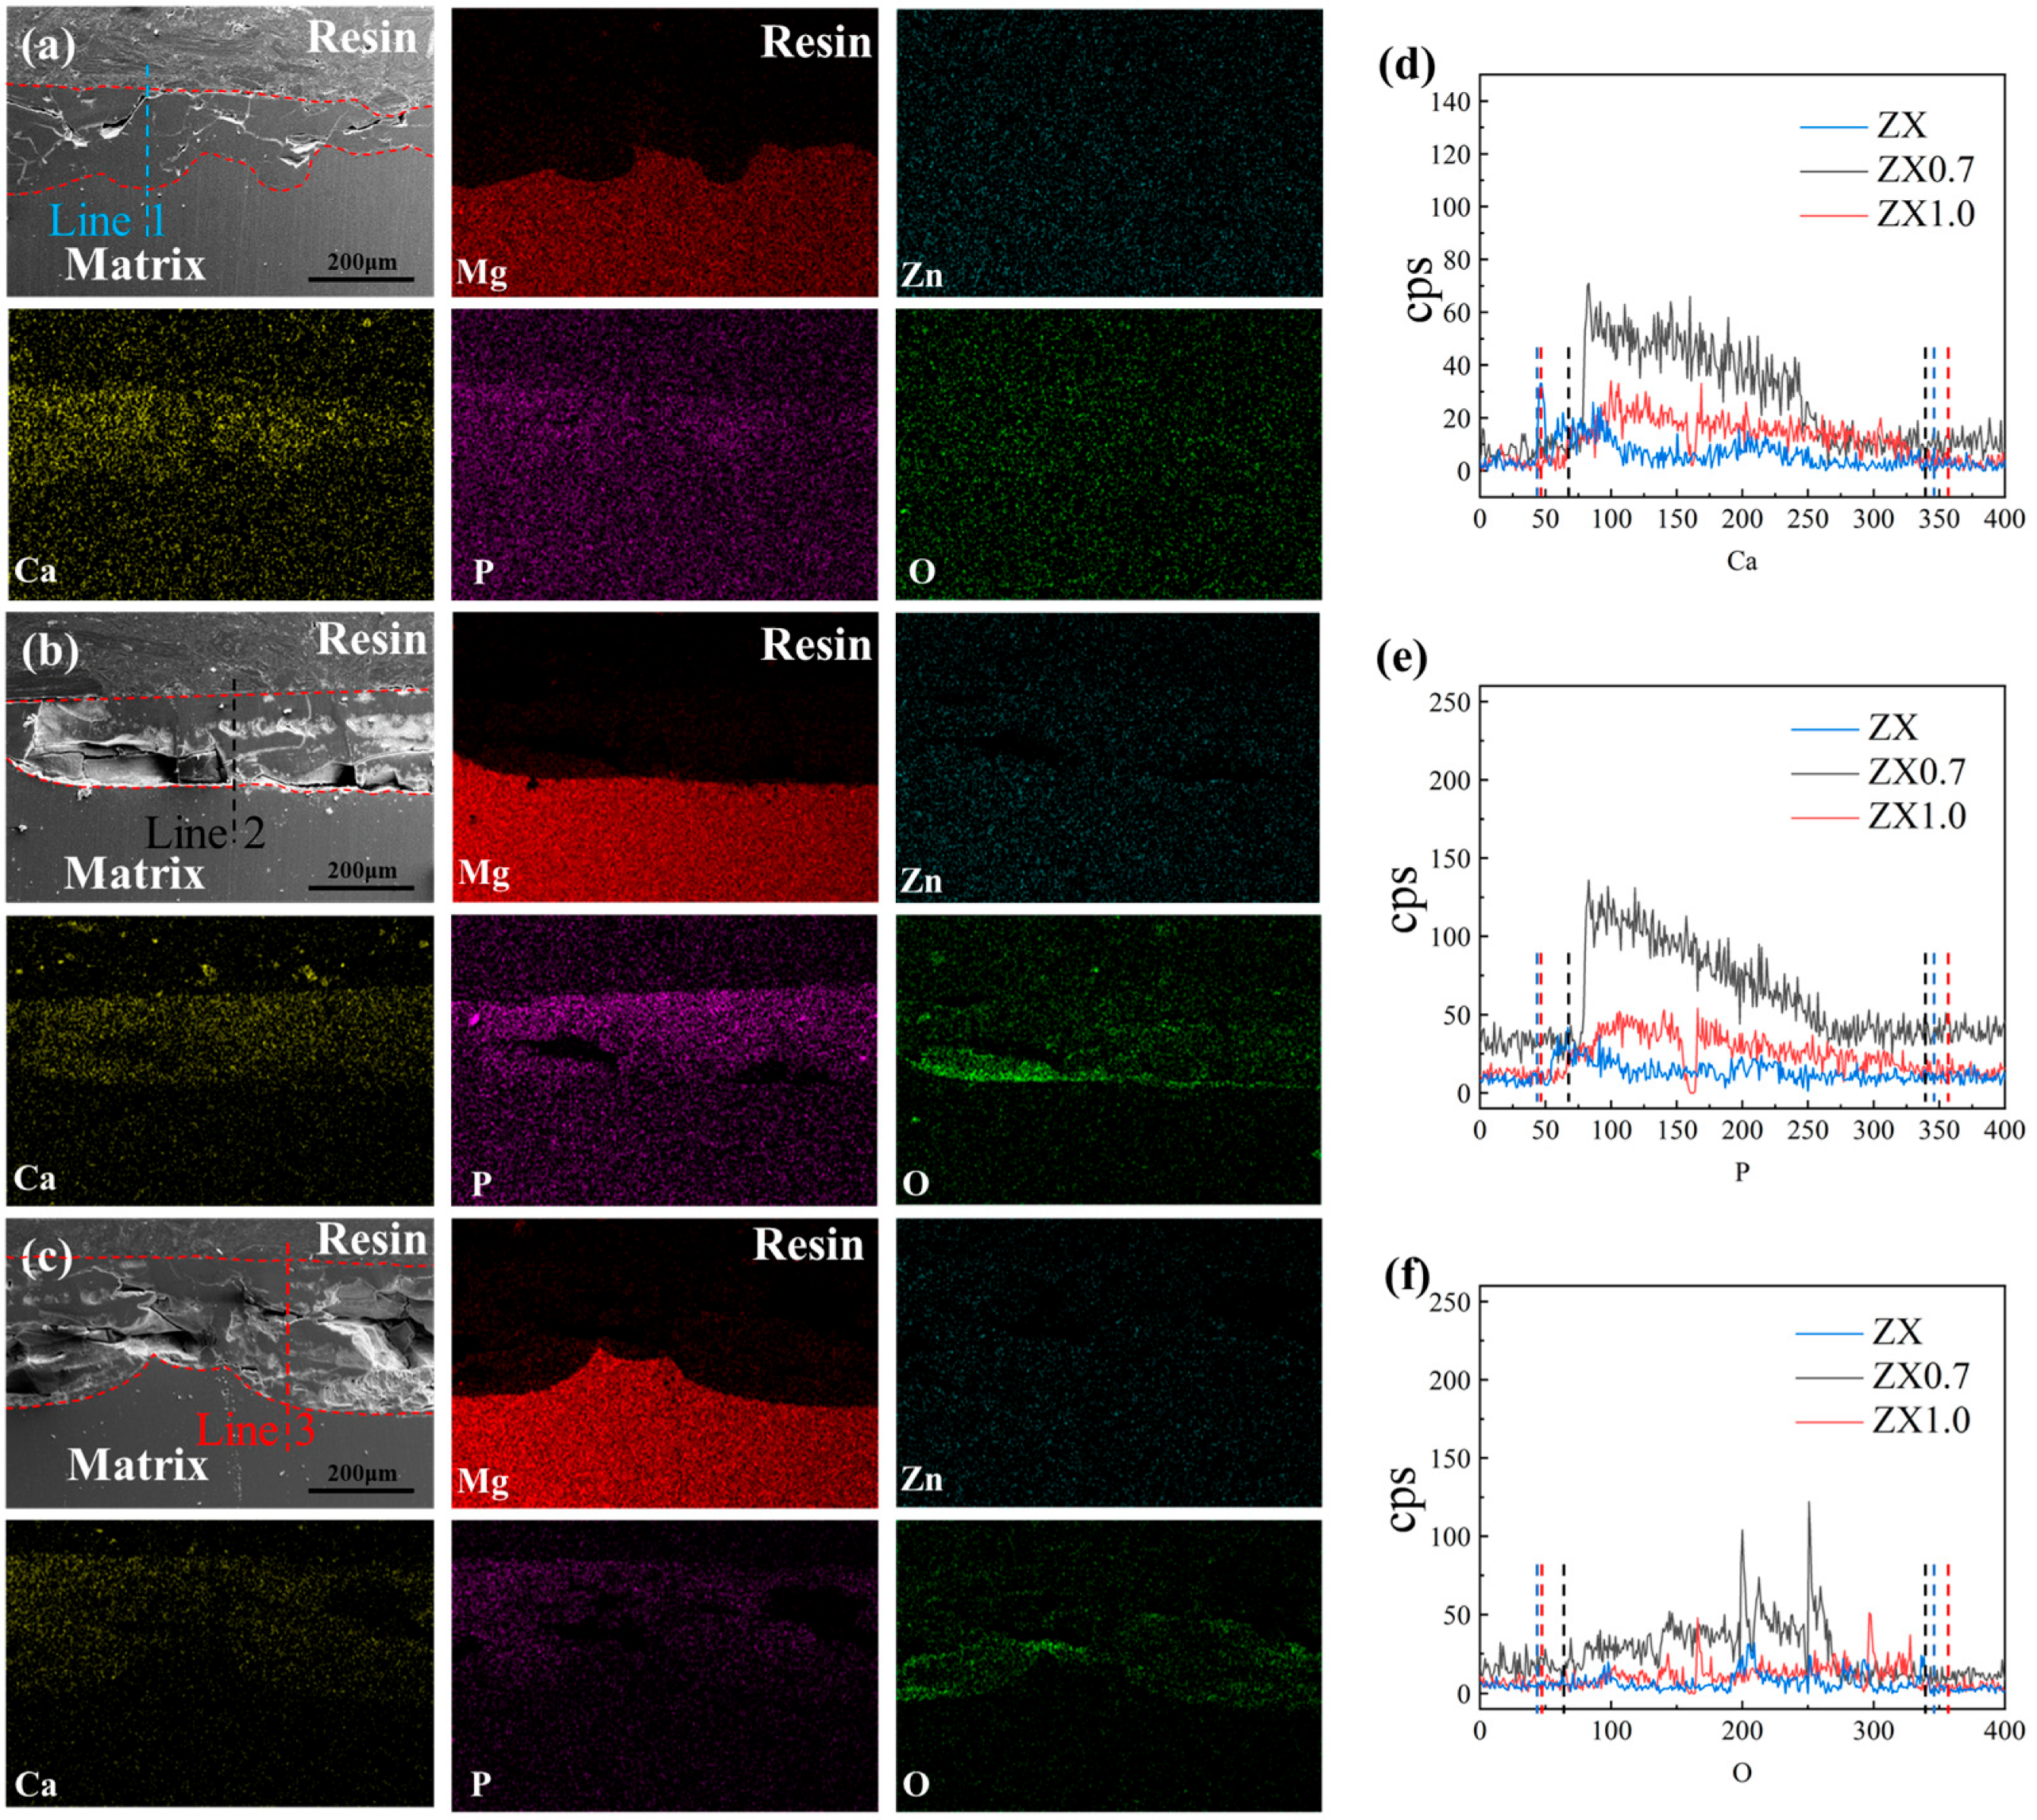
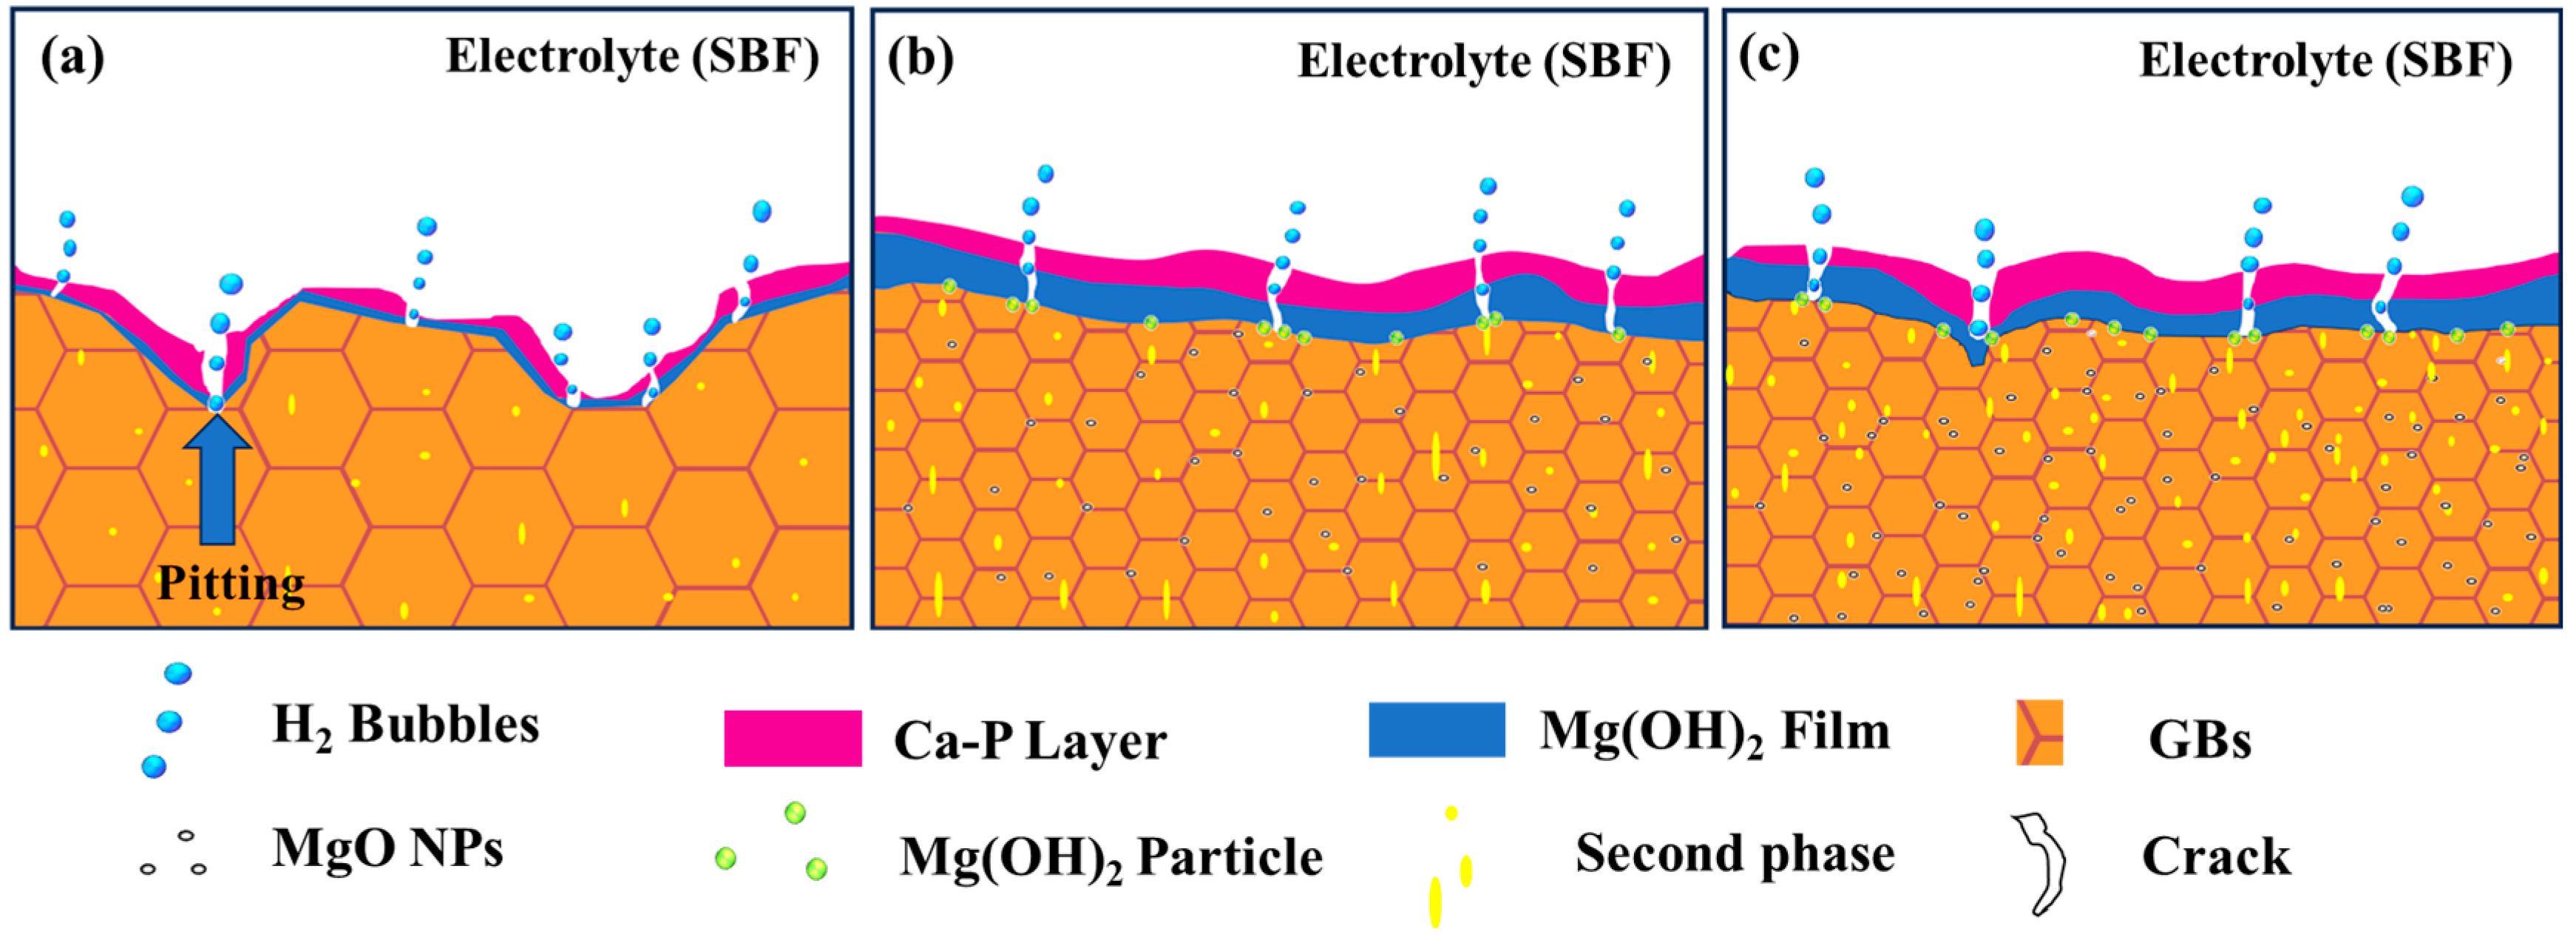
- The differences in corrosion resistance of the ZX composites are influenced by grain size as well as the type and distribution of the second phase. The ZX alloy corrodes rapidly due to the large grain size and the low adhesion of the corrosion product film. The ZX0.7 composite (ZX0.3, ZX0.5 and ZX) exhibited the best corrosion performance with the corrosion rate of 0.77 g/m2/h owing to the fine grain size, evenly distributed fine second phase as well as the enhanced corrosion product layer by the hydrolysis of MgO. However, excessive MgO (1.0 wt.%) caused the self-agglomeration and increasing second phases, which accelerated the speed of galvanic corrosion. Therefore, ZX1.0 had a faster corrosion rate of 0.82 g/m2/h than the ZX0.7 composite.
Author Contributions
Funding
Data Availability Statement
Conflicts of Interest
References
- Verma, A.; Ogata, S. Magnesium based alloys for reinforcing biopolymer composites and coatings: A critical overview on biomedical materials. Adv. Ind. Eng. Polym. Res. 2023, 6, 341–355. [Google Scholar] [CrossRef]
- Meenachi, P.; Subashini, R.; Lakshminarayanan, A.K.; Gupta, M. Comparative study of the biocompatibility and corrosion behaviour of pure Mg, Mg Ni/Ti, and Mg 0.4Ce/ZnO2 nanocomposites for orthopaedic implant applications. Mater. Res. Express. 2023, 10, 056503. [Google Scholar]
- Yang, Y.; Xiong, X.M.; Chen, J.; Peng, X.D.; Chen, D.L.; Pan, F.S. Research advances of magnesium and magnesium alloys worldwide in 2022. J. Magnes. Alloy. 2023, 11, 2611–2654. [Google Scholar] [CrossRef]
- Yang, J.; Jiang, P.; Qiu, Y.; Jao, C.; Blawert, C.; Lamaka, S.; Bouali, A.; Lu, X.; Zheludkevich, M.L.; Li, W. Experimental and quantum chemical studies of carboxylates as corrosion inhibitors for AM50 alloy in pH neutral NaCl solution. J. Magnes. Alloy. 2022, 10, 555–568. [Google Scholar] [CrossRef]
- Du, P.; Mei, D.; Furushima, T.; Zhu, S.; Wang, L.; Zhou, Y.; Guan, S. In vitro corrosion properties of HTHEed Mg-Zn-Y-Nd alloy microtubes for stent applications: Influence of second phase particles and crystal orientation. J. Magnes. Alloy. 2022, 10, 1286–1295. [Google Scholar] [CrossRef]
- Gao, M.; Yang, K.; Tan, L.; Ma, Z. Role of bimodal-grained structure with random texture on mechanical and corrosion properties of a Mg-Zn-Nd alloy. J. Magnes. Alloy. 2022, 10, 2147–2157. [Google Scholar] [CrossRef]
- Gnedenkov, A.S.; Sinebryukhov, S.L.; Filonina, V.S.; Egorkin, V.S.; Ustinov, A.Y.; Sergienko, V.; Gnedenkov, S. The detailed corrosion performance of bioresorbable Mg-0.8Ca alloy in physiological solutions. J. Magnes. Alloy. 2022, 10, 1326–1350. [Google Scholar] [CrossRef]
- Liu, S.; Li, G.; Qi, Y.; Peng, Z.; Ye, Y.; Liang, J. Corrosion and tribocorrosion resistance of MAO-based composite coating on AZ31 magnesium alloy. J. Magnes. Alloy. 2022, 10, 3406–3417. [Google Scholar] [CrossRef]
- Feng, B.; Liu, G.; Yang, P.; Huang, S.; Qi, D.; Chen, P.; Wang, C.; Du, J.; Zhang, S.; Liu, J. Different role of second phase in the micro-galvanic corrosion of WE43 Mg alloy in NaCl and Na2SO4 solution. J. Magnes. Alloy. 2022, 10, 1598–1608. [Google Scholar] [CrossRef]
- Liu, Y.; Zheng, Y.F.; Chen, X.H.; Yang, J.A.; Pan, H.B.; Chen, D.F.; Wang, L.N.; Zhang, J.L.; Zhu, D.H.; Wu, S.L.; et al. Fundamental Theory of Biodegradable Metals-Definition, Criteria, and Design. Adv. Funct. Mater. 2019, 29, 1805402. [Google Scholar] [CrossRef]
- Hassan, N.; Krieg, T.; Zinser, M.; Schröder, K.; Kröger, N. An Overview of Scaffolds and Biomaterials for Skin Expansion and Soft Tissue Regeneration: Insights on Zinc and Magnesium as New Potential Key Elements. Polymers 2023, 15, 3854. [Google Scholar] [CrossRef]
- Bowen, P.K.; Drelich, J.; Goldman, J. Zinc Exhibits Ideal Physiological Corrosion Behavior for Bioabsorbable Stents. Adv. Mater. 2013, 25, 2577–2582. [Google Scholar] [CrossRef]
- Cai, S.; Lei, T.; Li, N.; Feng, F. Effects of Zn on microstructure, mechanical properties and corrosion behavior of Mg–Zn alloys. Mater. Sci. Eng. C-Mater. Biol. Appl. 2012, 32, 2570–2577. [Google Scholar] [CrossRef]
- Hurley, M.F.; Efaw, C.M.; Davis, P.H.; Croteau, J.R.; Graugnard, E.; Birbilis, N. Volta Potentials Measured by Scanning Kelvin Probe Force Microscopy as Relevant to Corrosion of Magnesium Alloys. Corrosion 2014, 71, 160–170. [Google Scholar] [CrossRef]
- Suh, J.S.; Ha, H.Y.; Suh, B.C.; Kang, J.W. Determination of Optimum Zn Content for Mg-xZn-0.5Mn-0.5Sr Alloy in Terms of Mechanical Properties and In Vitro Corrosion Resistance. Met. Mater. Int. 2023, 29, 1841–1852. [Google Scholar] [CrossRef]
- Fang, H.; Wang, C.; Zhou, S.; Zheng, Z.; Lu, T.; Li, G.; Tian, Y.; Suga, T. Enhanced adhesion and anticorrosion of silk fibroin coated biodegradable Mg-Zn-Ca alloy via a two-step plasma activation. Corros. Sci. 2020, 168, 108466. [Google Scholar] [CrossRef]
- Li, Z.; Gu, X.; Lou, S.; Zheng, Y. The development of binary Mg–Ca alloys for use as biodegradable materials within bone. Biomaterials 2008, 29, 1329–1344. [Google Scholar] [CrossRef] [PubMed]
- Kim, B.; Hong, C.H.; Kim, J.C.; Lee, S.; Baek, S.; Jeong, H.Y.; Park, S.S. Factors affecting the grain refinement of extruded Mg–6Zn–0.5Zr alloy by Ca addition. Scr. Mater. 2020, 187, 24–29. [Google Scholar] [CrossRef]
- Liu, R.X.; Wang, J.; Wang, L.Y.; Zeng, X.Q.; Jin, Z.H. Cluster Hardening Effects on Twinning in Mg-Zn-Ca Alloys. Metals 2022, 12, 693. [Google Scholar] [CrossRef]
- Jin, Y.M.; Blawert, C.; Feyerabend, F.; Bohlen, J.; Campos, M.S.; Gavras, S.; Wiese, B.; Mei, D.; Deng, M.; Yang, H.; et al. Time-sequential corrosion behaviour observation of micro-alloyed Mg-0.5Zn-0.2Ca alloy via a quasi-in situ approach. Corros. Sci. 2019, 158, 108096. [Google Scholar] [CrossRef]
- Zhang, C.; Peng, C.; Huang, J.; Zhao, Y.C.; Han, T.Z.; Wang, G.G.; Wu, L.; Huang, G.S. Effect of Ca Element on Microstructure and Corrosion Behavior of Single-Phase Mg-Sc Alloy. Metals 2022, 12, 93. [Google Scholar] [CrossRef]
- Zhang, Y.; Feng, X.H.; Huang, Q.Y.; Li, Y.J.; Yang, Y.S. Effect of the microstructure parameters on the corrosion characteristics of Mg-Zn-Ca alloy with columnar structure. J. Magnes. Alloy. 2023, 11, 1709–1720. [Google Scholar] [CrossRef]
- Radha, R.; Sreekanth, D. Insight of magnesium alloys and composites for orthopedic implant applications—A review. J. Magnes. Alloy. 2017, 5, 286–312. [Google Scholar] [CrossRef]
- Venkatesh, R.; Kanagasabapath, H. Analysing the characteristics of magnesium based composites for biomedical applications. Mater. Today. Proc. 2023. [Google Scholar] [CrossRef]
- Tang, C.K.; Lyu, S.; Zhao, Z.H.; Chen, M.F. Effects of MgO nano particles on the mechanical properties and corrosion behavior of Mg-Zn-Ca alloy. Mater. Chem. Phys. 2023, 297, 127380. [Google Scholar] [CrossRef]
- GB/T 24176-2009; Metallic Materials—Fatigue Testing—Statistical Planning and Analysis of Data. China Quality and Standards Publishing & Media Co., Ltd.: Beijing, China, 2010.
- Lindström, R.; Johansson, L.G.; Thompson, G.E.; Skeldon, P.; Svensson, J.E. Corrosion of magnesium in humid air. Corros. Sci. 2004, 46, 1141–1158. [Google Scholar] [CrossRef]
- Fan, Z.; Gao, F.; Wang, Y.; Wang, S.; Patel, J.B. Grain refinement of Mg-alloys by native MgO particles: An overview. J. Magnes. Alloy. 2022, 10, 2919–2945. [Google Scholar] [CrossRef]
- Shen, G.X.; Lyu, S.Y.; Zhao, Y.; You, C.; Wang, X.W.; Chen, M.F. The first principle research of CaO and MgO particulate heterogeneous nucleation in Mg alloys. Appl. Surf. Sci. 2022, 593, 153224. [Google Scholar] [CrossRef]
- Abazari, S.; Shamsipur, A.; Bakhsheshi-Rad, H.R.; Keshavarz, M.; Kehtari, M.; Ramakrishna, S.; Berto, F. MgO-incorporated carbon nanotubes-reinforced Mg-based composites to improve mechanical, corrosion, and biological properties targeting biomedical applications. J. Mater. Res. Technol. 2022, 20, 976–990. [Google Scholar] [CrossRef]
- Tang, C.; Lyu, S.; Zheng, R.; Li, G.; Liu, Z.; Chen, M.; Jiang, B. Realizing ultra-high strength and excellent ductility in a low-alloyed biomedical Mg-Zn-Ca-MgO composite. J. Magnes. Alloy. 2024. [Google Scholar] [CrossRef]
- Pul, M.; Erdem, U.; Turkoz, M.B.; Yildirim, G. The effect of sintering parameters and MgO ratio on structural properties in Al7075/MgO composites: A review. J. Mater. Sci. 2023, 58, 664–684. [Google Scholar] [CrossRef]
- Yang, L.; Zhang, E.L. Biocorrosion behavior of magnesium alloy in different simulated fluids for biomedical application. Mater. Sci. Eng. C-Mater. Biol. Appl. 2009, 29, 1691–1696. [Google Scholar] [CrossRef]
- Habibi, M.K.; Joshi, S.P.; Gupta, M. Hierarchical magnesium nano-composites for enhanced mechanical response. Acta Mater. 2010, 58, 6104–6114. [Google Scholar] [CrossRef]
- Op’T Hoog, C.; Birbilis, N.; Estrin, Y. Corrosion of Pure Mg as a Function of Grain Size and Processing Route. Adv. Eng. Mater. 2008, 10, 579–582. [Google Scholar] [CrossRef]
- Zhang, H.F.; Ding, Y.T.; Li, R.M.; Gao, Y.B. Enhanced strength-ductility synergy and activation of non-basal slip in as-extruded Mg-Zn-Ca alloy via heterostructure. J. Mater. Res. Technol. 2024, 28, 1841–1851. [Google Scholar] [CrossRef]
- Dobkowska, A.; Adamczyk Cieślak, B.; Kuc, D.; Hadasik, E.; Płociński, T.; Ura-Bińczyk, E.; Mizera, J. Influence of bimodal grain size distribution on the corrosion resistance of Mg–4Li–3Al–1Zn (LAZ431). J. Mater. Res. Technol. 2021, 13, 346–358. [Google Scholar] [CrossRef]
- Wang, X.; Chen, C.; Miao, B.; Wang, Z.; Huang, H.; Guan, S.; Yuan, G. Mechanical and corrosion properties of biodegradable magnesium mini-tubes with different grain morphologies: Size and distribution. J. Mater. Sci. Technol. 2024, 183, 165–174. [Google Scholar] [CrossRef]
- Wu, H.; Zhao, C.; Ni, J.; Zhang, S.; Liu, J.; Yan, J.; Chen, Y.; Zhang, X. Research of a novel biodegradable surgical staple made of high purity magnesium. Bioact. Mater. 2016, 1, 122–126. [Google Scholar] [CrossRef]
- Ravi Kumar, N.V.; Blandin, J.J.; Desrayaud, C.; Montheillet, F.; Suéry, M. Grain refinement in AZ91 magnesium alloy during thermomechanical processing. Mater. Sci. Eng. A-Struct. Mater. Prop. Microstruct. Process. 2003, 359, 150–157. [Google Scholar] [CrossRef]
- Saha, P.; Roy, M.; Datta, M.K.; Lee, B.; Kumta, P.N. Effects of grain refinement on the biocorrosion and in vitro bioactivity of magnesium. Mater. Sci. Eng. C-Mater. Biol. Appl. 2015, 57, 294–303. [Google Scholar] [CrossRef] [PubMed]
- Asgari, M.; Hang, R.Q.; Wang, C.; Yu, Z.T.; Li, Z.Y.; Xiao, Y. Biodegradable Metallic Wires in Dental and Orthopedic Applications: A Review. Metals 2018, 8, 212. [Google Scholar] [CrossRef]
- Hu, Z.; Yin, Z.; Yin, Z.; Wang, K.; Liu, Q.D.; Sun, P.F.; Yan, H.; Song, H.G.; Luo, C.; Guan, H.; et al. Corrosion behavior characterization of as extruded Mg-8Li-3Al alloy with minor alloying elements (Gd, Sn and Cu) by scanning Kelvin probe force microscopy. Corros. Sci. 2020, 176, 108923. [Google Scholar] [CrossRef]
- Baek, S.; Kang, J.S.; Shin, H.; Yim, C.D.; You, B.S.; Ha, H.; Park, S.S. Role of alloyed Y in improving the corrosion resistance of extruded Mg–Al–Ca-based alloy. Corros. Sci. 2017, 118, 227–232. [Google Scholar] [CrossRef]
- Holweg, P.; Berger, L.; Cihova, M.; Donohue, N.; Clement, B.; Schwarze, U.; Sommer, N.G.; Hohenberger, G.; van den Beucken, J.J.J.P.; Seibert, F.; et al. A lean magnesium–zinc–calcium alloy ZX00 used for bone fracture stabilization in a large growing-animal model. Acta Biomater. 2020, 113, 646–659. [Google Scholar] [CrossRef] [PubMed]
- Xu, C.; Wang, J.F.; Chen, C.; Wang, C.; Sun, Y.F.; Zhu, S.J.; Guan, S.K. Initial micro-galvanic corrosion behavior between Mg2Ca and α-Mg via quasi-in situ SEM approach and first-principles calculation. J. Magnes. Alloy. 2023, 11, 958–965. [Google Scholar] [CrossRef]
- Cha, P.R.; Han, H.S.; Yang, G.F.; Kim, Y.C.; Hong, K.H.; Lee, S.C.; Jung, J.Y.; Ahn, J.P.; Kim, Y.Y.; Cho, S.Y.; et al. Biodegradability engineering of biodegradable Mg alloys: Tailoring the electrochemical properties and microstructure of constituent phases. Sci. Rep. 2013, 3, srep02367. [Google Scholar] [CrossRef]
- Fan, Z.; Wang, Y.; Xia, M.; Arumuganathar, S. Enhanced heterogeneous nucleation in AZ91D alloy by intensive melt shearing. Acta Mater. 2009, 57, 4891–4901. [Google Scholar] [CrossRef]
- Ma, Z.Q.; Li, C.B.; Du, J.; Zhan, M.Y. Grain Refinement of Mg-Al Alloys Inoculated by MgO Powder. Int. J. Met. 2019, 13, 674–685. [Google Scholar] [CrossRef]
- Lin, G.; Liu, D.; Chen, M.; You, C.; Li, Z.; Wang, Y.; Li, W. Preparation and characterization of biodegradable Mg-Zn-Ca/MgO nanocomposites for biomedical applications. Mater. Charact. 2018, 144, 120–130. [Google Scholar] [CrossRef]


| Literature Number | Main Research Work |
|---|---|
| 1, 3, 10, 11 | Review articles that summarize existing data and suggest directions for future research. |
| 2, 12 | The main focus is on biocompatibility over blood compatibility, biomineralization, and in vivo implantation. |
| 4, 7, 9 | Exploring the corrosion behavior of magnesium alloys by comparing different corrosion solutions. |
| 5, 6, 18, 22, 2 | Study of grain size on mechanical and corrosion properties of magnesium alloys |
| 8, 13, 14, 15, 16, 17, 19, 20, 21, 24 | The effects of different alloying elements on the mechanical and corrosion properties of magnesium alloys were investigated by controlling the elemental content, where the effects of Zn and Ca were mainly studied. |
| 1, 2, 24, 25 | The study of composites, which affect the mechanical and corrosion properties of magnesium alloys through factors such as the type and content of composites, is mainly for MgO addition. |
| Alloys | Average Grain Size/μm | Average Mg2Ca Size/nm | Average Ca2Mg6Zn3 Size/nm |
|---|---|---|---|
| ZX | 17.73 ± 2.37 | 186.46 ± 3.31 | 107.67 ± 3.21 |
| ZX0.3 | 5.54 ± 1.73 | 189.66 ± 2.47 | 114.29 ± 2.24 |
| ZX0.5 | 4.96 ± 1.81 | 190.36 ± 1.95 | 113.34 ± 2.47 |
| ZX0.7 | 4.37 ± 1.64 | 204.58 ± 2.31 | 117.13 ± 3.40 |
| ZX1.0 | 3.95 ± 1.43 | 229.61 ± 2.77 | 128.15 ± 3.69 |
| Points | Elements (at. %) | |||
|---|---|---|---|---|
| Mg | Zn | Ca | O | |
| matrix | 98.31 | 0.03 | 0.38 | 1.28 |
| A | 87.64 | 7.34 | 2.71 | 2.31 |
| B | 94.76 | 1.11 | 1.50 | 2.64 |
| C | 61.23 | 0.37 | 0.48 | 37.92 |
| Alloys | E (V) | I (μA‧cm−2) | Rct (Ω‧cm2) | RL (Ω‧cm2) |
|---|---|---|---|---|
| ZX | −1.521 | 35.3 | 520 | 238.6 |
| ZX0.3 | −1.456 | 19.9 | 652.3 | 183.1 |
| ZX0.5 | −1.359 | 14.4 | 735.7 | 221.2 |
| ZX0.7 | −1.298 | 9.7 | 761.6 | 400.2 |
| ZX1.0 | −1.281 | 16.5 | 679.3 | 186.7 |
| Points | Alloys | Elements (at. %) | ||||
|---|---|---|---|---|---|---|
| Mg | Zn | Ca | P | O | ||
| A | ZX | 10.67 | 1.38 | 15.78 | 7.28 | 64.89 |
| B | 11.66 | 1.38 | 18.58 | 8.09 | 60.29 | |
| C | ZX0.7 | 11.51 | 1.26 | 16.84 | 7.05 | 63.34 |
| D | 9.99 | 1.23 | 14.72 | 7.06 | 66.98 | |
| E | ZX1.0 | 13.64 | 1.57 | 16.78 | 7.16 | 60.86 |
| F | 11.21 | 2.21 | 15.91 | 6.70 | 63.98 | |
| Alloys | /MPa | /MPa | /MPa | Theoretical Intensity/MPa | Experimental Strength/MPa |
|---|---|---|---|---|---|
| ZX | \ | 12.48 | \ | 102 | 102 |
| ZX0.3 | 39.35 | 28.73 | 0.08 | 157.68 | 172.9 |
| ZX0.5 | 44.42 | 31.70 | 0.11 | 165.75 | 183.5 |
| ZX0.7 | 50.58 | 32.38 | 0.13 | 172.61 | 197.8 |
| ZX1.0 | 55.79 | 33.71 | 0.15 | 179.17 | 209.5 |
Disclaimer/Publisher’s Note: The statements, opinions and data contained in all publications are solely those of the individual author(s) and contributor(s) and not of MDPI and/or the editor(s). MDPI and/or the editor(s) disclaim responsibility for any injury to people or property resulting from any ideas, methods, instructions or products referred to in the content. |
© 2024 by the authors. Licensee MDPI, Basel, Switzerland. This article is an open access article distributed under the terms and conditions of the Creative Commons Attribution (CC BY) license (https://creativecommons.org/licenses/by/4.0/).
Share and Cite
Zhao, Q.; Lyu, S.; Zhang, G.; Chen, M. Effect of MgO Contents on the Microstructure, Mechanical Properties and Corrosion Behavior of Low-Alloyed Mg-Zn-Ca Alloy. Metals 2024, 14, 274. https://doi.org/10.3390/met14030274
Zhao Q, Lyu S, Zhang G, Chen M. Effect of MgO Contents on the Microstructure, Mechanical Properties and Corrosion Behavior of Low-Alloyed Mg-Zn-Ca Alloy. Metals. 2024; 14(3):274. https://doi.org/10.3390/met14030274
Chicago/Turabian StyleZhao, Qian, Shaoyuan Lyu, Guopeng Zhang, and Minfang Chen. 2024. "Effect of MgO Contents on the Microstructure, Mechanical Properties and Corrosion Behavior of Low-Alloyed Mg-Zn-Ca Alloy" Metals 14, no. 3: 274. https://doi.org/10.3390/met14030274
APA StyleZhao, Q., Lyu, S., Zhang, G., & Chen, M. (2024). Effect of MgO Contents on the Microstructure, Mechanical Properties and Corrosion Behavior of Low-Alloyed Mg-Zn-Ca Alloy. Metals, 14(3), 274. https://doi.org/10.3390/met14030274