Abstract
This work aims to improve the surface integrity and LCF life of machined Inconel 718. The correlation between the LCF life of Inconel 718 and various states of machined surface integrity is explored. In this paper, the surface integrity of Inconel 718 specimens is enhanced by low-plasticity burnishing (LPB). The LCF life of specimens with different surface integrity is predicted using a micro–macro finite element method (FEM). Firstly, the LCF specimens with different surface integrity are machined by turning (turned specimen), polishing (matrix specimen), and LPB process (LPBed specimen). Secondly, the LCF experiment is carried out to reveal the effect of surface integrity on LCF life. Finally, the LCF micro–macro FEM model is proposed to predict the LCF of machined Inconel 718 specimens. The representative volume element (RVE) model is established based on the measured surface integrity and microstructure of Inconel 718 specimens. The effect of surface integrity on LCF life is transformed to equivalent load. The micro–macro FEM model combined with Tanaka–Mura dislocation crack initiation theory and extended finite element method (XFEM) is applied to predict the LCF life of the machined specimens. The study results show that the LCF life of LPBed specimens can be improved by 90.5% and 36.1% compared with that of turned specimens and polished matrix specimens, respectively. The errors between FEM prediction results and experimental results are 13.1%, 9.2%, and 12.2%, respectively. The proposed micro–macro FEM model could be utilized to predict the LCF life of Inconel 718 with different surface integrities, and to apply the LCF life prediction further in industry.
1. Introduction
Inconel 718 is widely used to manufacture aircraft engine turbine disks due to its excellent mechanical properties. The high mechanical load makes low cycle fatigue (LCF) failure one of the main failure modes of Inconel 718 parts.
Fatigue cracks tend to initiate at the surface and subsurface of parts [1]. Hence, the fatigue life of machined parts is significantly affected by machined surface integrity, especially surface roughness and residual stress [2,3]. The lower surface roughness and compressive residual stress contribute to improving the fatigue properties of machined parts [4,5,6]. Madariaga [7] studied the effect of turned surface integrity on LCF life of Inconel 718. The effect of surface integrity was normalized as total stress. The fatigue life of machined specimens was experimentally correlated with the total stress. Suraratchai et al. [8] proposed an experimental fatigue life prediction model based on Paris’ law and the Basquin model. By normalizing surface roughness as total stress, the model was used to predict the fatigue life of aluminum alloy 7010 with different surface roughnesses. Wu et al. [9] introduced surface stress concentration factor and residual stress into Paris’ law and the Basquin model. The model was used to predict the fatigue life of GH4169 with different surface integrity. However, the above models are compatible only under experimental conditions due to regression parameters [10]. In this paper, a LCF prediction model based on fatigue crack initiation and propagation mechanism was proposed.
Total fatigue life consists of the crack initiation life and crack propagation life. The fatigue crack initiation mechanism of polycrystalline metallic materials is shown in Figure 1 [11,12]. Firstly, dislocations accumulate within grains under cyclic loading. Subsequently, persistent slip bands are formed in the grains. Microcracks are generated from the persistent bands as cyclic loading proceeds. As cyclic load proceeds further, the microcracks expand to surrounding grains due to the stress concentration at the crack tips. Finally, microcracks accumulate and are transformed to a macrocrack [13,14]. The formation of persistent slip bands and microcracks within Inconel 718 was observed using the replica method [15].
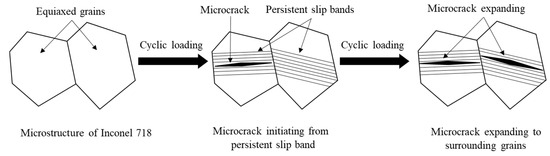
Figure 1.
Crack initiation dislocation mechanism of Inconel 718.
Tanaka and Mura proposed a theoretical cyclic slip dislocation pile-up model to describe crack nucleation in a single-crystal [16], which is expressed as Equation (1).
where G is the shear modulus, Ws is the specific fracture energy per unit area of the material, ν is the Poisson’s ratio, Δτ is the average shear stress range on the slip band, k is the frictional stress of dislocations on the slip plane, and d is the length of the slip band.
The Tanaka–Mura crack initiation cycle slip theory is suitable for single-crystal crack initiation life prediction. The model needs to be integrated with a finite elements method (FEM) to predict the crack initiation life of polycrystalline metallic materials. Bruckner et al. [17] analyzed the crack initiation process of martensitic stainless steel using Tanaka–Mura theory and FEM. Rahim et al. [18] predicted the crack initiation life of steel P91 at room temperature. The Tanaka–Mura model has also been utilized in predicting the crack initiation life of welded structure [19]. However, the Tanaka–Mura model has seldom been applied to investigate the effect of different surface integrity on crack initiation life [20,21].
Crack propagation life is related to the crack stress intensity factor. Crack propagation life can be estimated analytically by integrating Paris’ law for simple cracks [9,22]. However, the analytical integrating method is rarely applicable to complicated cracks [23]. The eXtended Finite Element Method (XFEM) was proposed to simulate crack propagation process [24,25]. The XFEM has already been utilized for simulating fatigue crack propagation [26,27] and predicting fatigue life [28,29].
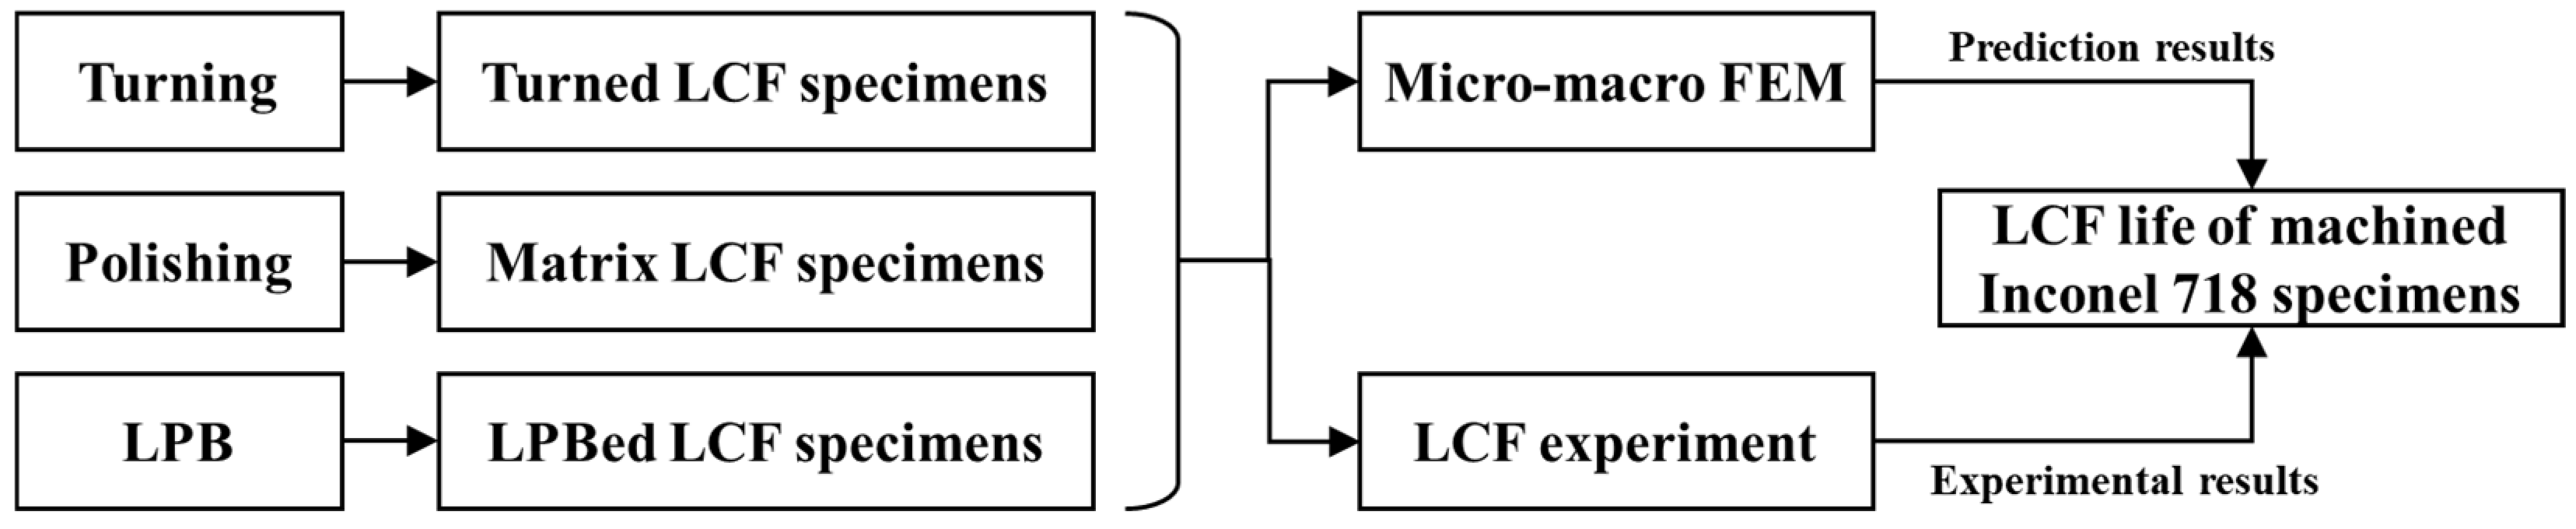
In this study, the micro–macro FEM model was established based on Tanaka–Mura model and XFEM. Firstly, three groups of LCF specimens with different surface integrity were machined using polishing (matrix LCF specimen), turning (turned LCF specimen), and LPB process (LPBed LCF specimen). The surface integrity of the specimens was measured and induced to the representative volume element (RVE) model. Subsequently, the effect of surface integrity on the Inconel 718 LCF life was investigated using the proposed model. The LCF life of the three groups specimens was predicted. Finally, LCF experiments were conduct to verify the proposed model. The flow diagram of this research is shown in Figure 2.
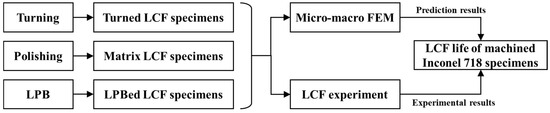
Figure 2.
Research framework.
2. Experiments
2.1. Materials
The workpiece material of Inconel 718 was treated with solution and aging treatment. In order to avoid the error caused by differences in material batches, all specimens were manufactured from the same batch of material. The mechanical properties of Inconel 718 are shown in Table 1.

Table 1.
Mechanical properties of superalloy Inconel 718 [30].
2.2. Experimental Method and Process
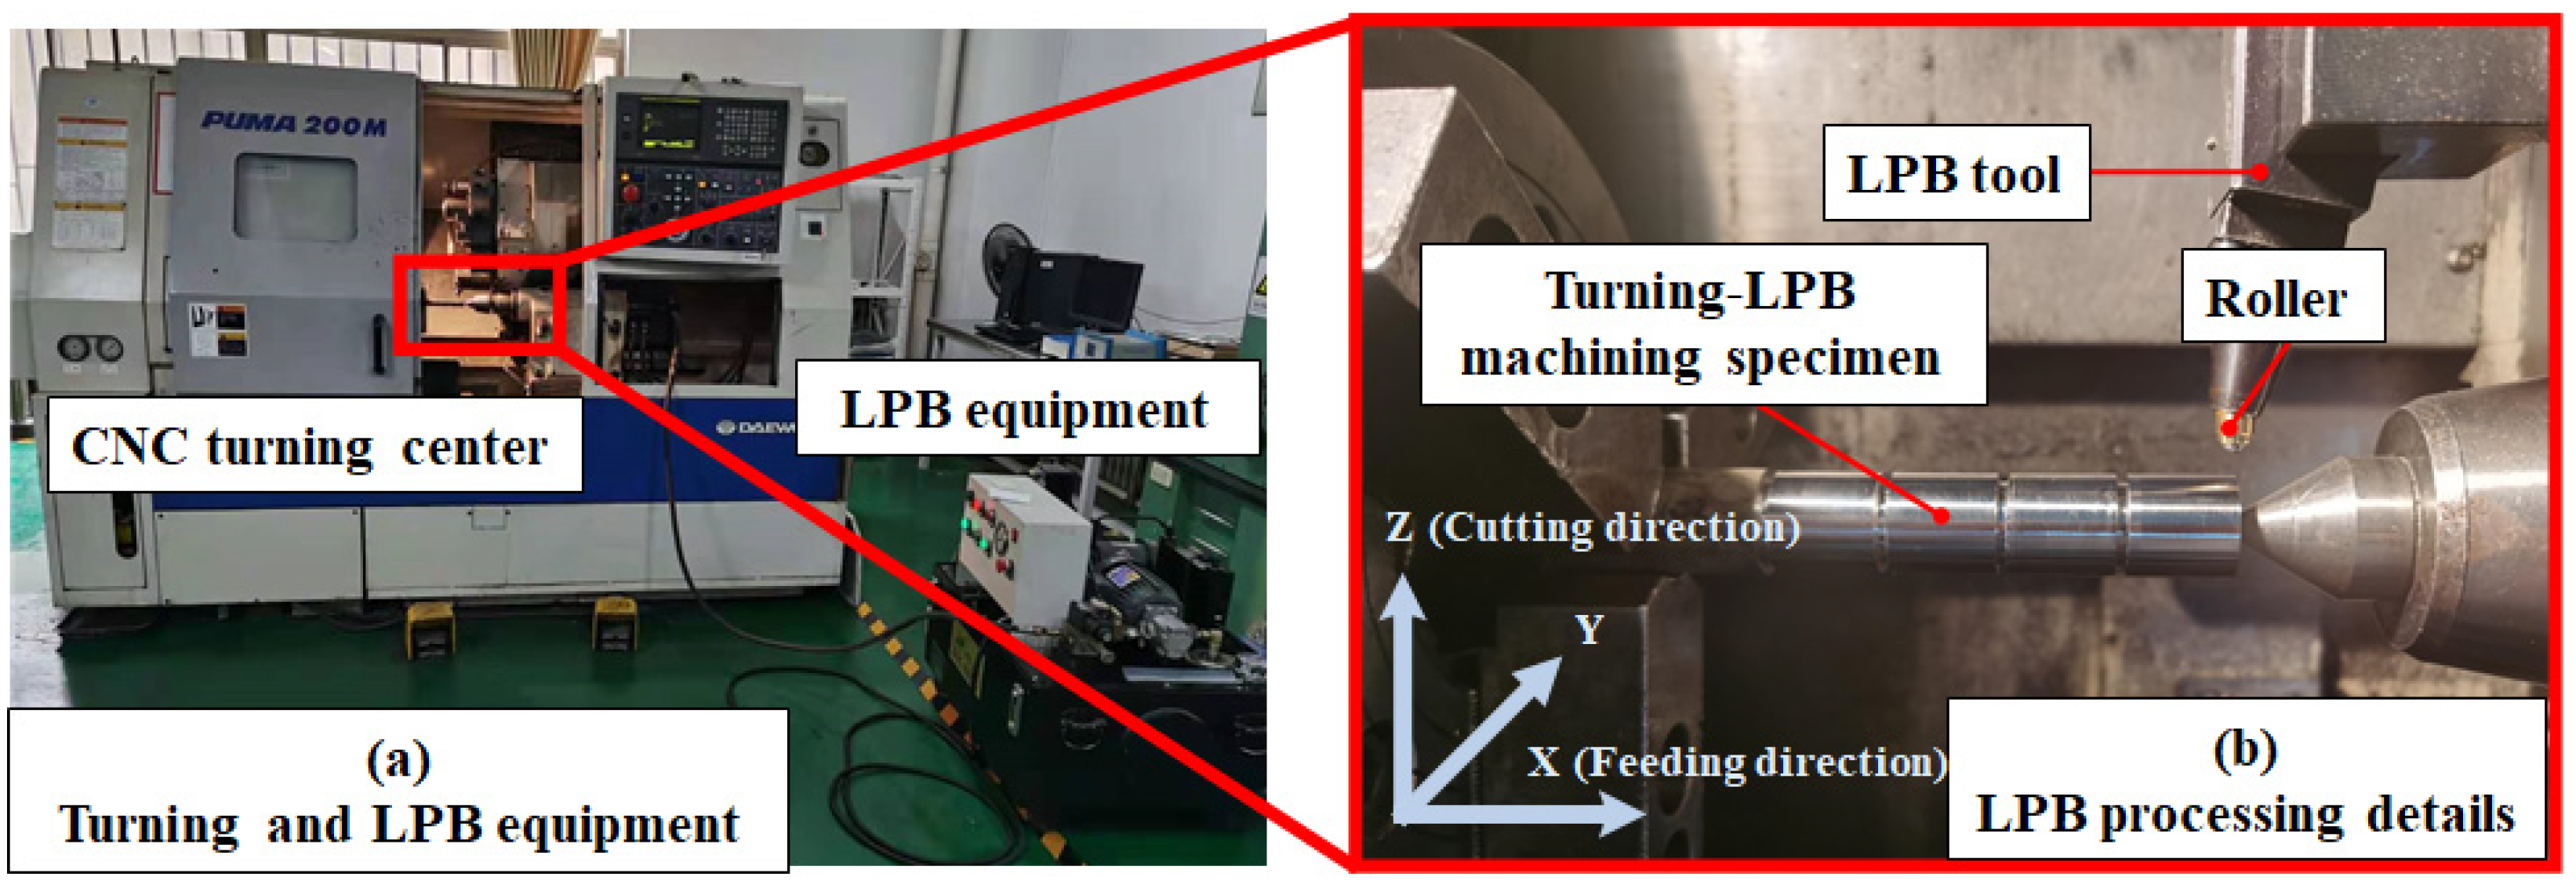
The turning and LPB process is shown in Figure 3. The turning and LPB process were carried out on CNC turning center PUMA 200 MA (DAEWOO, Incheon, Republic of Korea). Coated carbide inserts VBMT160404-MF1105 (Sandvik, Sandviken, Sweden) were utilized for turning. The following turning parameters were applied: turning cutting speed v = 50 m/min, feed rate f = 0.1 mm/r, turning depth ap = 0.1 mm. The turned specimen was subjected to LPB process. The following LPB parameters were applied: LPB speed v = 50 m/min, feed rate f = 0.1 mm/r, LPB pressure P = 15 MPa, LPB times N = 2.
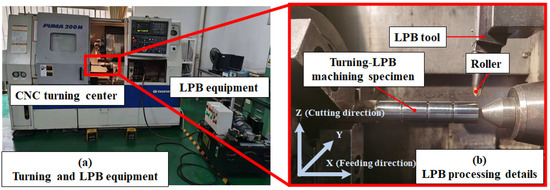
Figure 3.
Turning and LPB process.
The surface morphology and surface roughness of the turned LPBed specimens were measured using laser confocal microscope VK-X250K (Keyence, Osaka, Japan), as shown in Figure 4. The surface roughness Ry was measured along feed direction. The surface roughness was measured three times, and the average values were taken as the measurement result to reduce the measurement error.
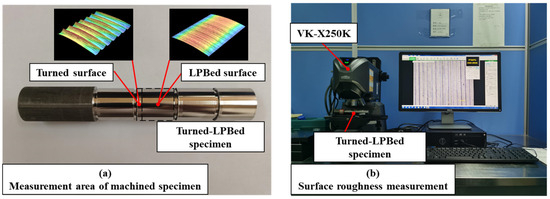
Figure 4.
Surface roughness measurement of machined specimens.
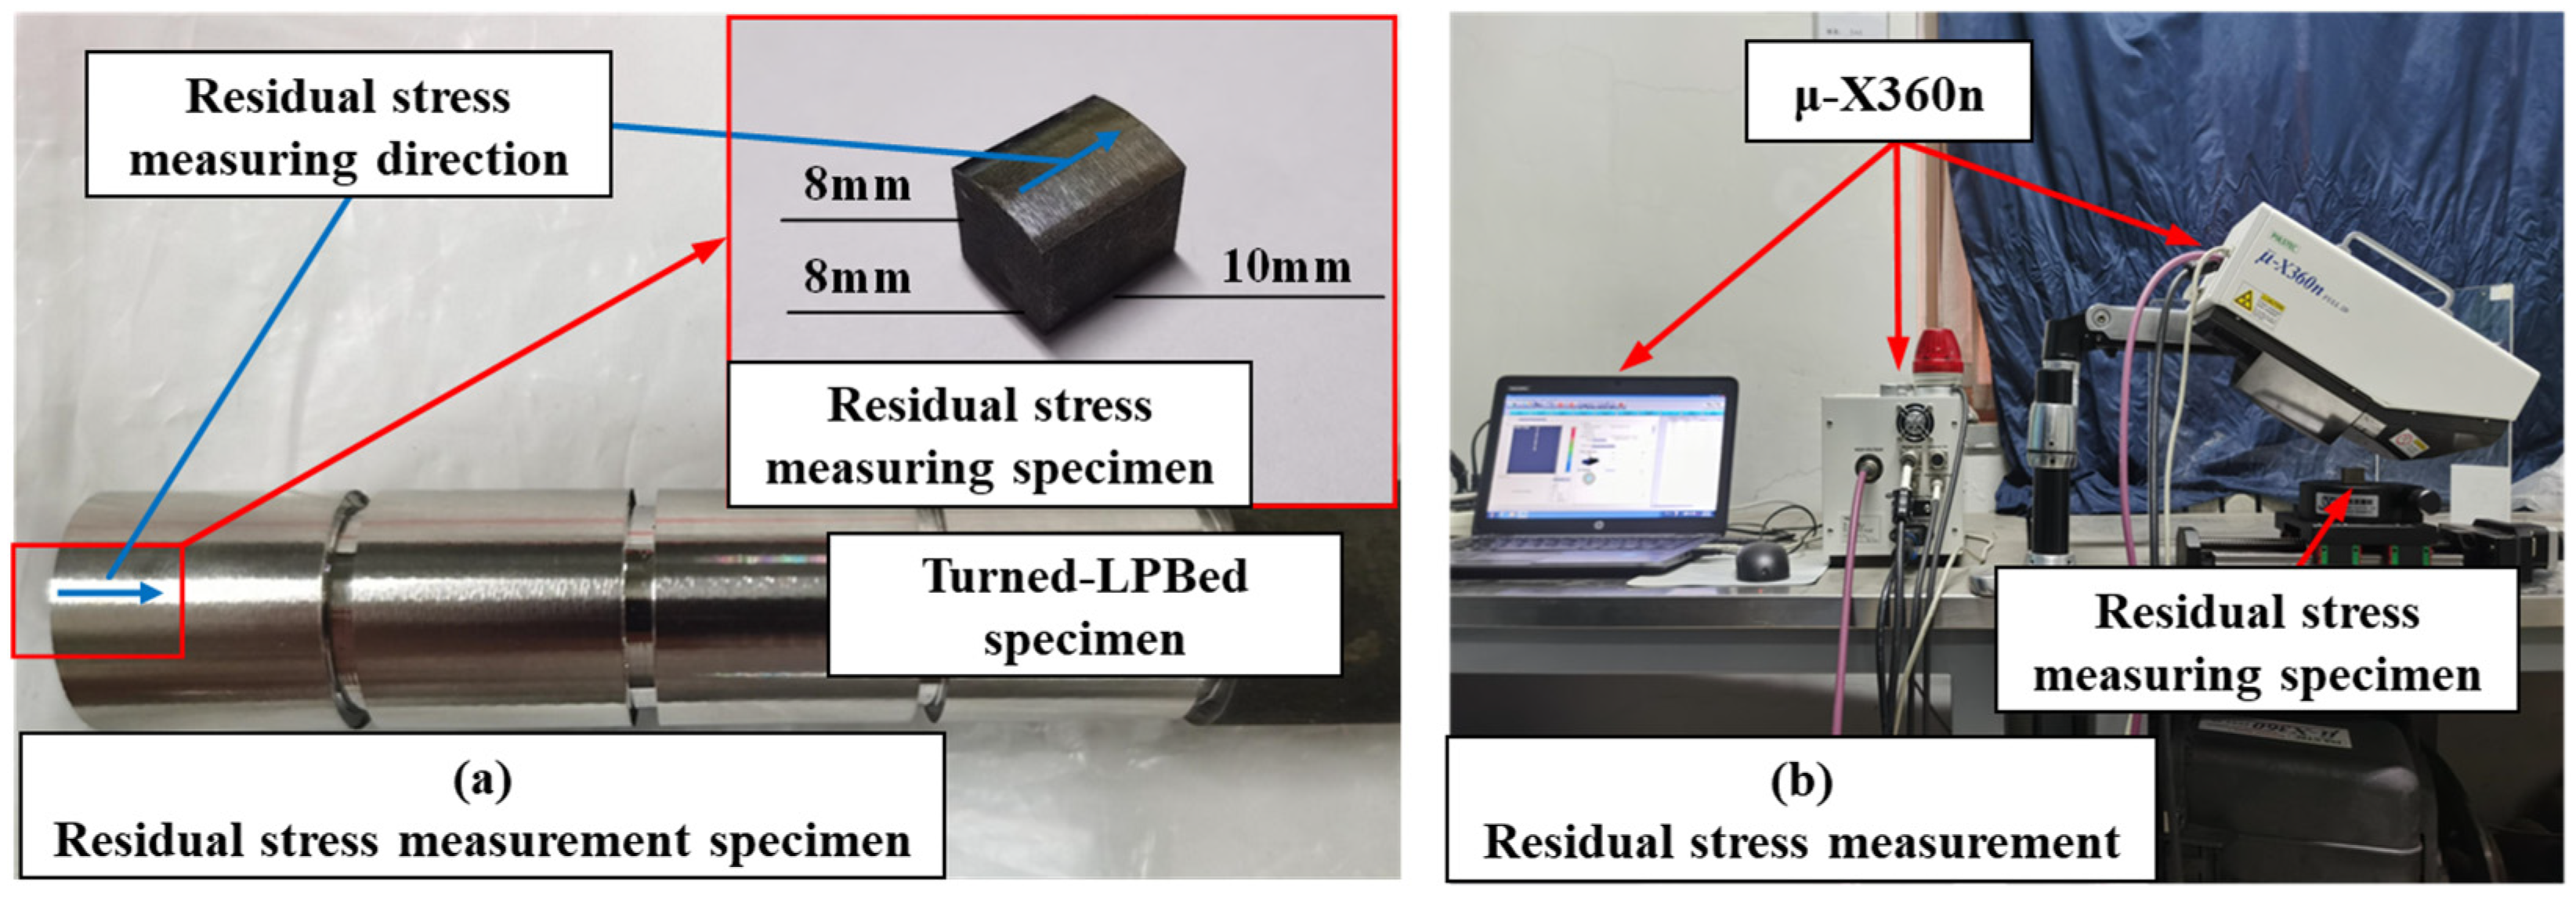
The rsidual stress measuring process is shown in Figure 5. The residual stresses measuring specimens were machined using wire electrical discharge machining, as shown in Figure 5a. The residual stress was measured along feed direction since its significant effect on fatigue property [25]. The residual stresses were measured using the X-ray residual stress analyzer μ-X360n (Pulstec, Shizuoka, Japan). In order to measure residual stresses at different depths, the specimens were subjected to layer-by-layer stress-free electrolytic polishing using electrolytic polisher DPF-2 (Zhunquan, Shanghai, China). Saturated NaCl solution (mass fraction 26.5%) was used for electrolytic polishing. The removal depth was measured using a micrometer screw. The residual stress measuring process is shown in Figure 5b.
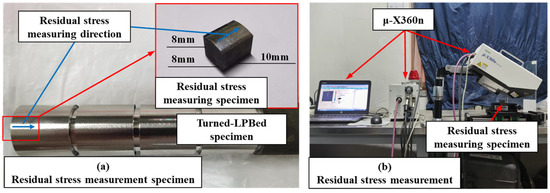
Figure 5.
Residual stress measurement of machined specimens.
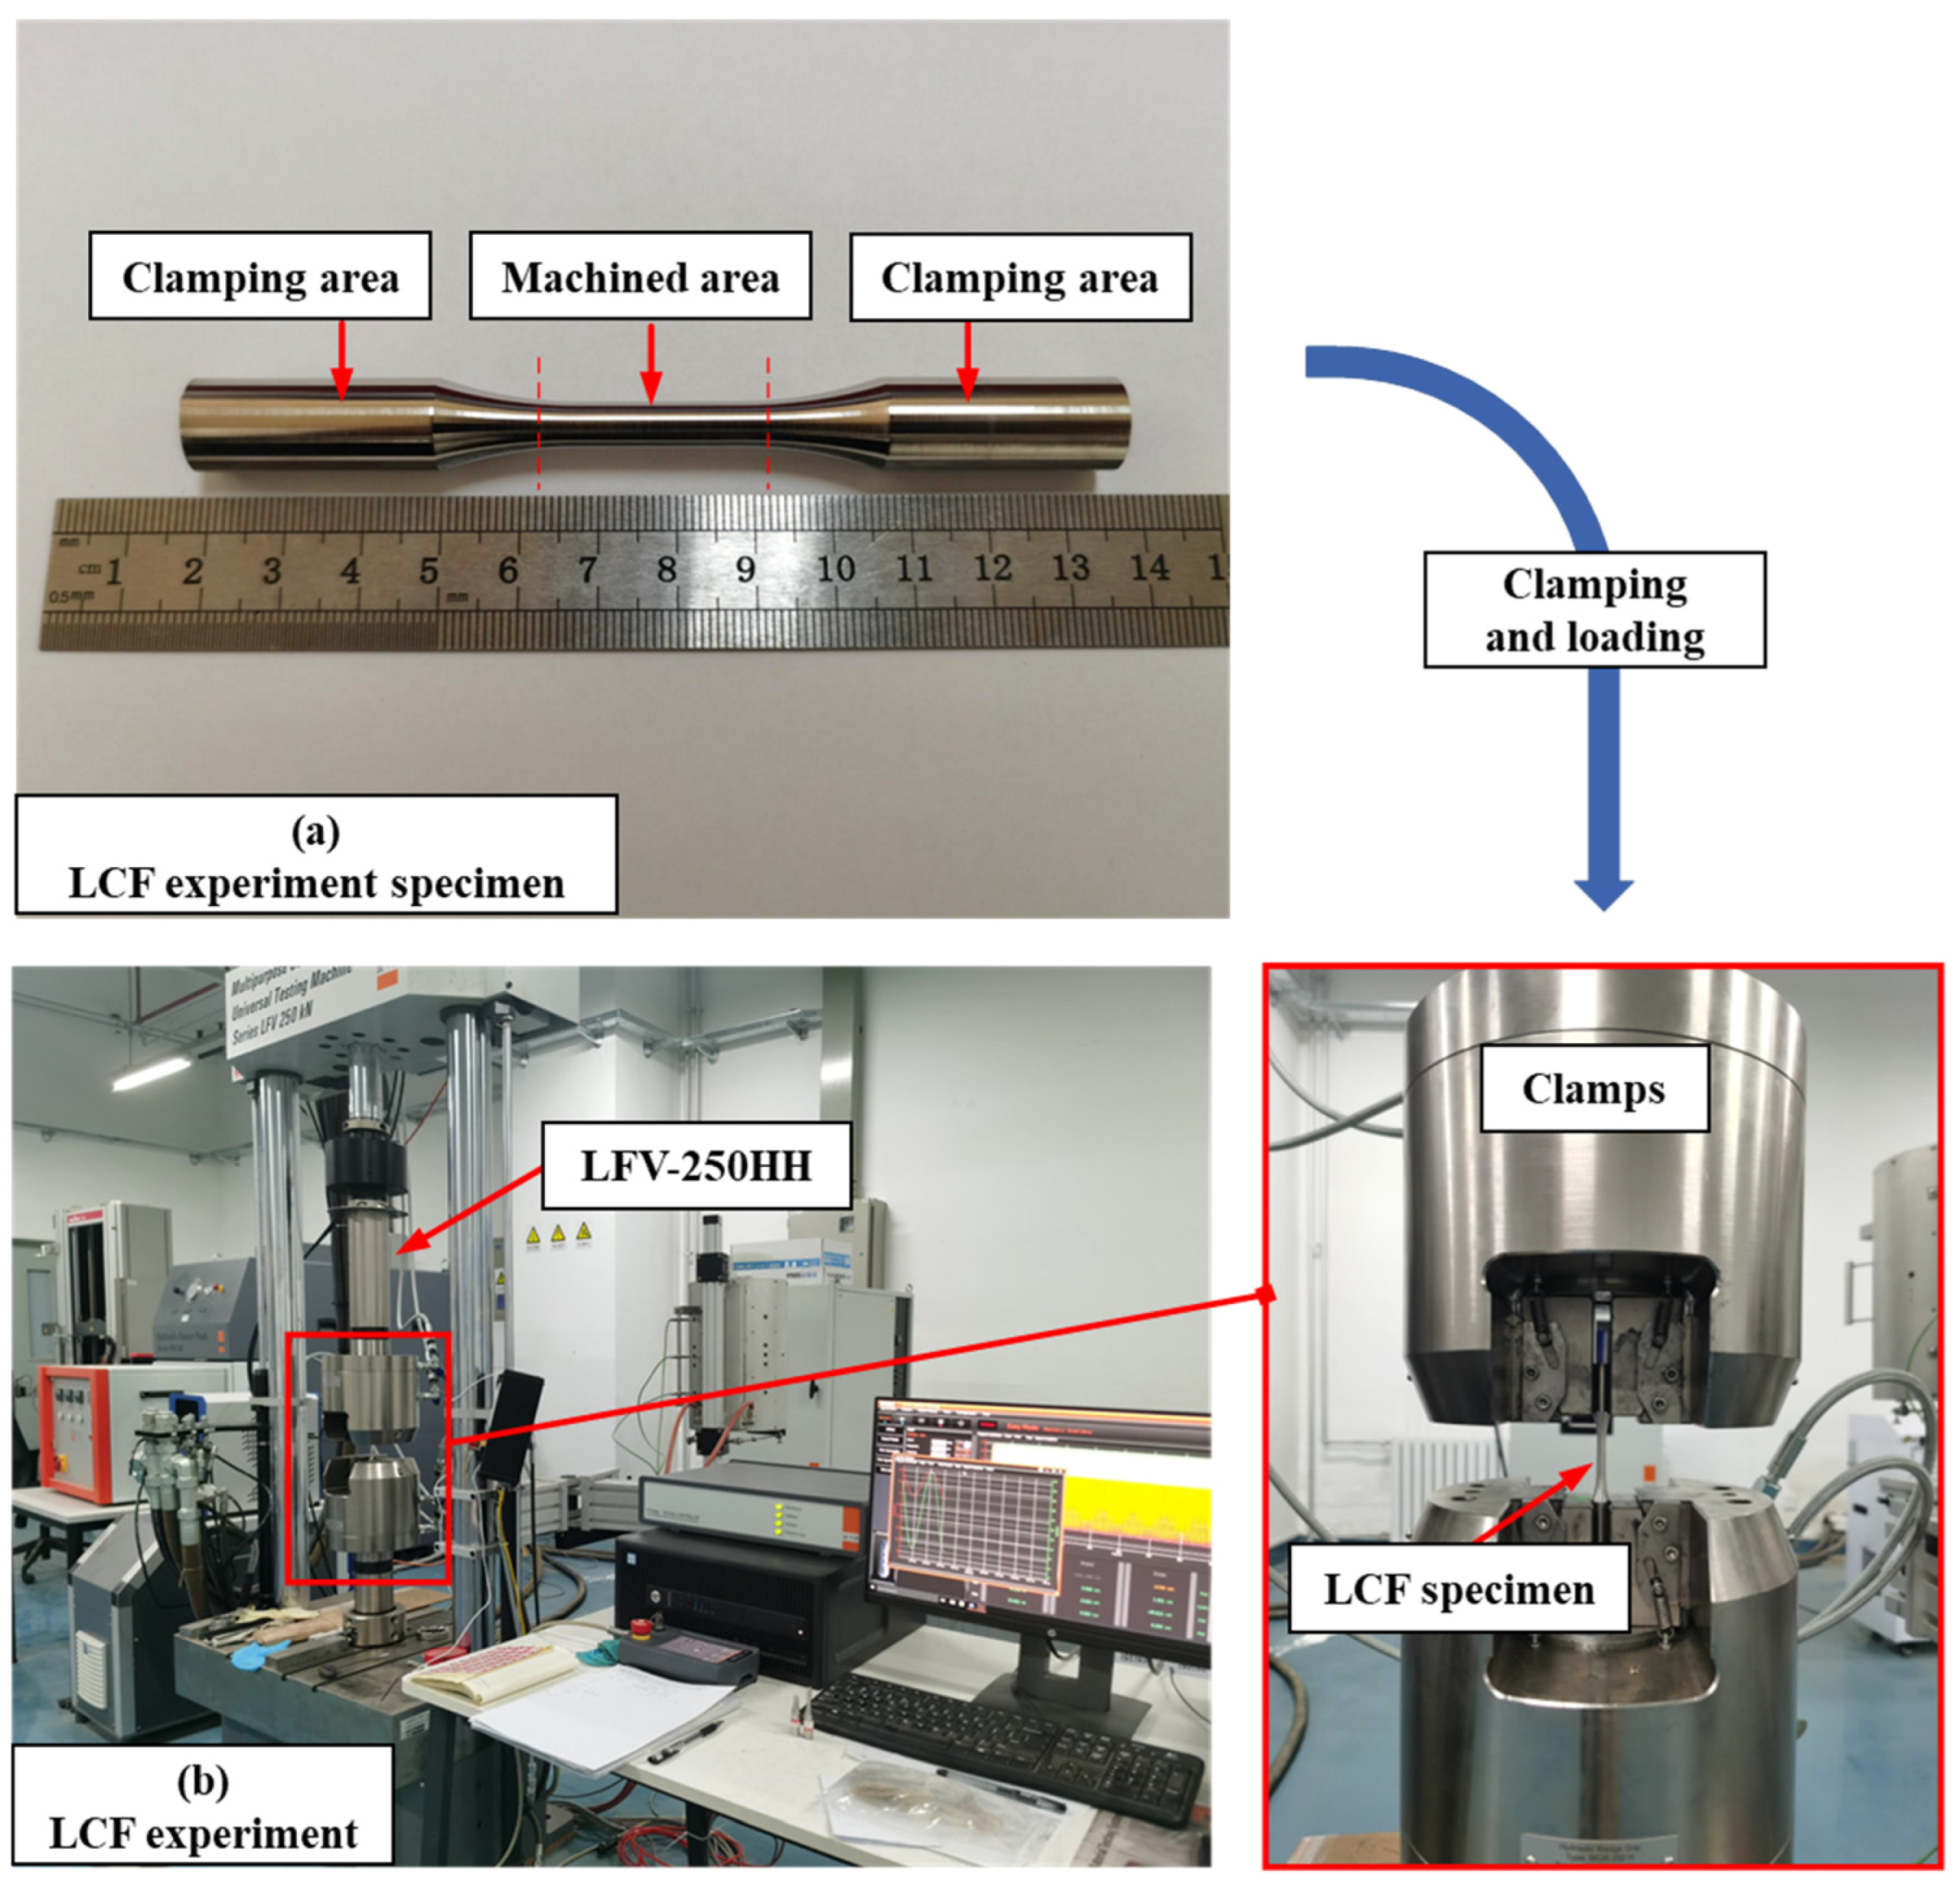
Single-factor experiment was conducted to investigate the effect of different surface integrity on LCF life. The LCF experiment process is shown in Figure 6. The experimental specimens are shown in Figure 6a. Three groups of LCF specimens were machined using polishing (polished matrix LCF specimens), turning (turned LCF specimens), and LPB (LPBed LCF specimens). The LCF experiments were carried out on the electro-hydraulic servo fatigue testing machine LFV-250HH (Walter+bai, Löhningen, Switzerland), as shown in Figure 6b. The load formation was tensile–tensile sinusoidal loading with following loading parameters: maximum load σmax = 1360 MPa, stress ratio R = 0.1. The LCF fatigue life of the test was recorded when the fatigue specimen fractured. In order to reduce error, three specimens were tested for each group, and the average value was taken as the LCF life of the tested group.
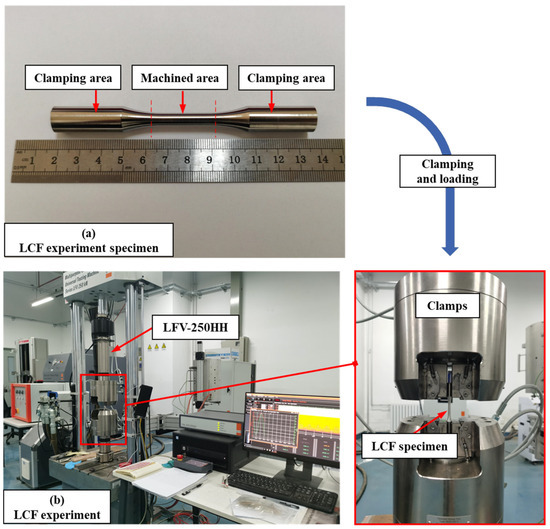
Figure 6.
LCF experiment of machined LCF specimens with different surface integrity.
3. Micro–Macro FEM LCF Life Prediction Model for Inconel 718
The LCF life of Inconel 718 was subdivided into crack initiation life and crack propagation life. The crack initiation life was predicted utilizing the micro FEM model based on Tanaka–Mura theory. The crack propagation life was predicted using macro FEM model based on an XFEM method.
The micro FEM model was established based on the Tanaka–Mura theoretical cyclic slip dislocation pile-up model shown in Equation (1). The material parameters of Inconel 718 used in the Tanaka–Mura model are shown in Table 2. The length of the slip band d and average shear stress range on the slip band Δτ are parameters to be determined. For the polycrystalline material Inconel 718, the micro FEM analysis was performed cyclically to simulate crack initiation process and predict crack initiation life.
Table 2.
The Tanaka–Mura model parameters of Inconel 718 [31,32].
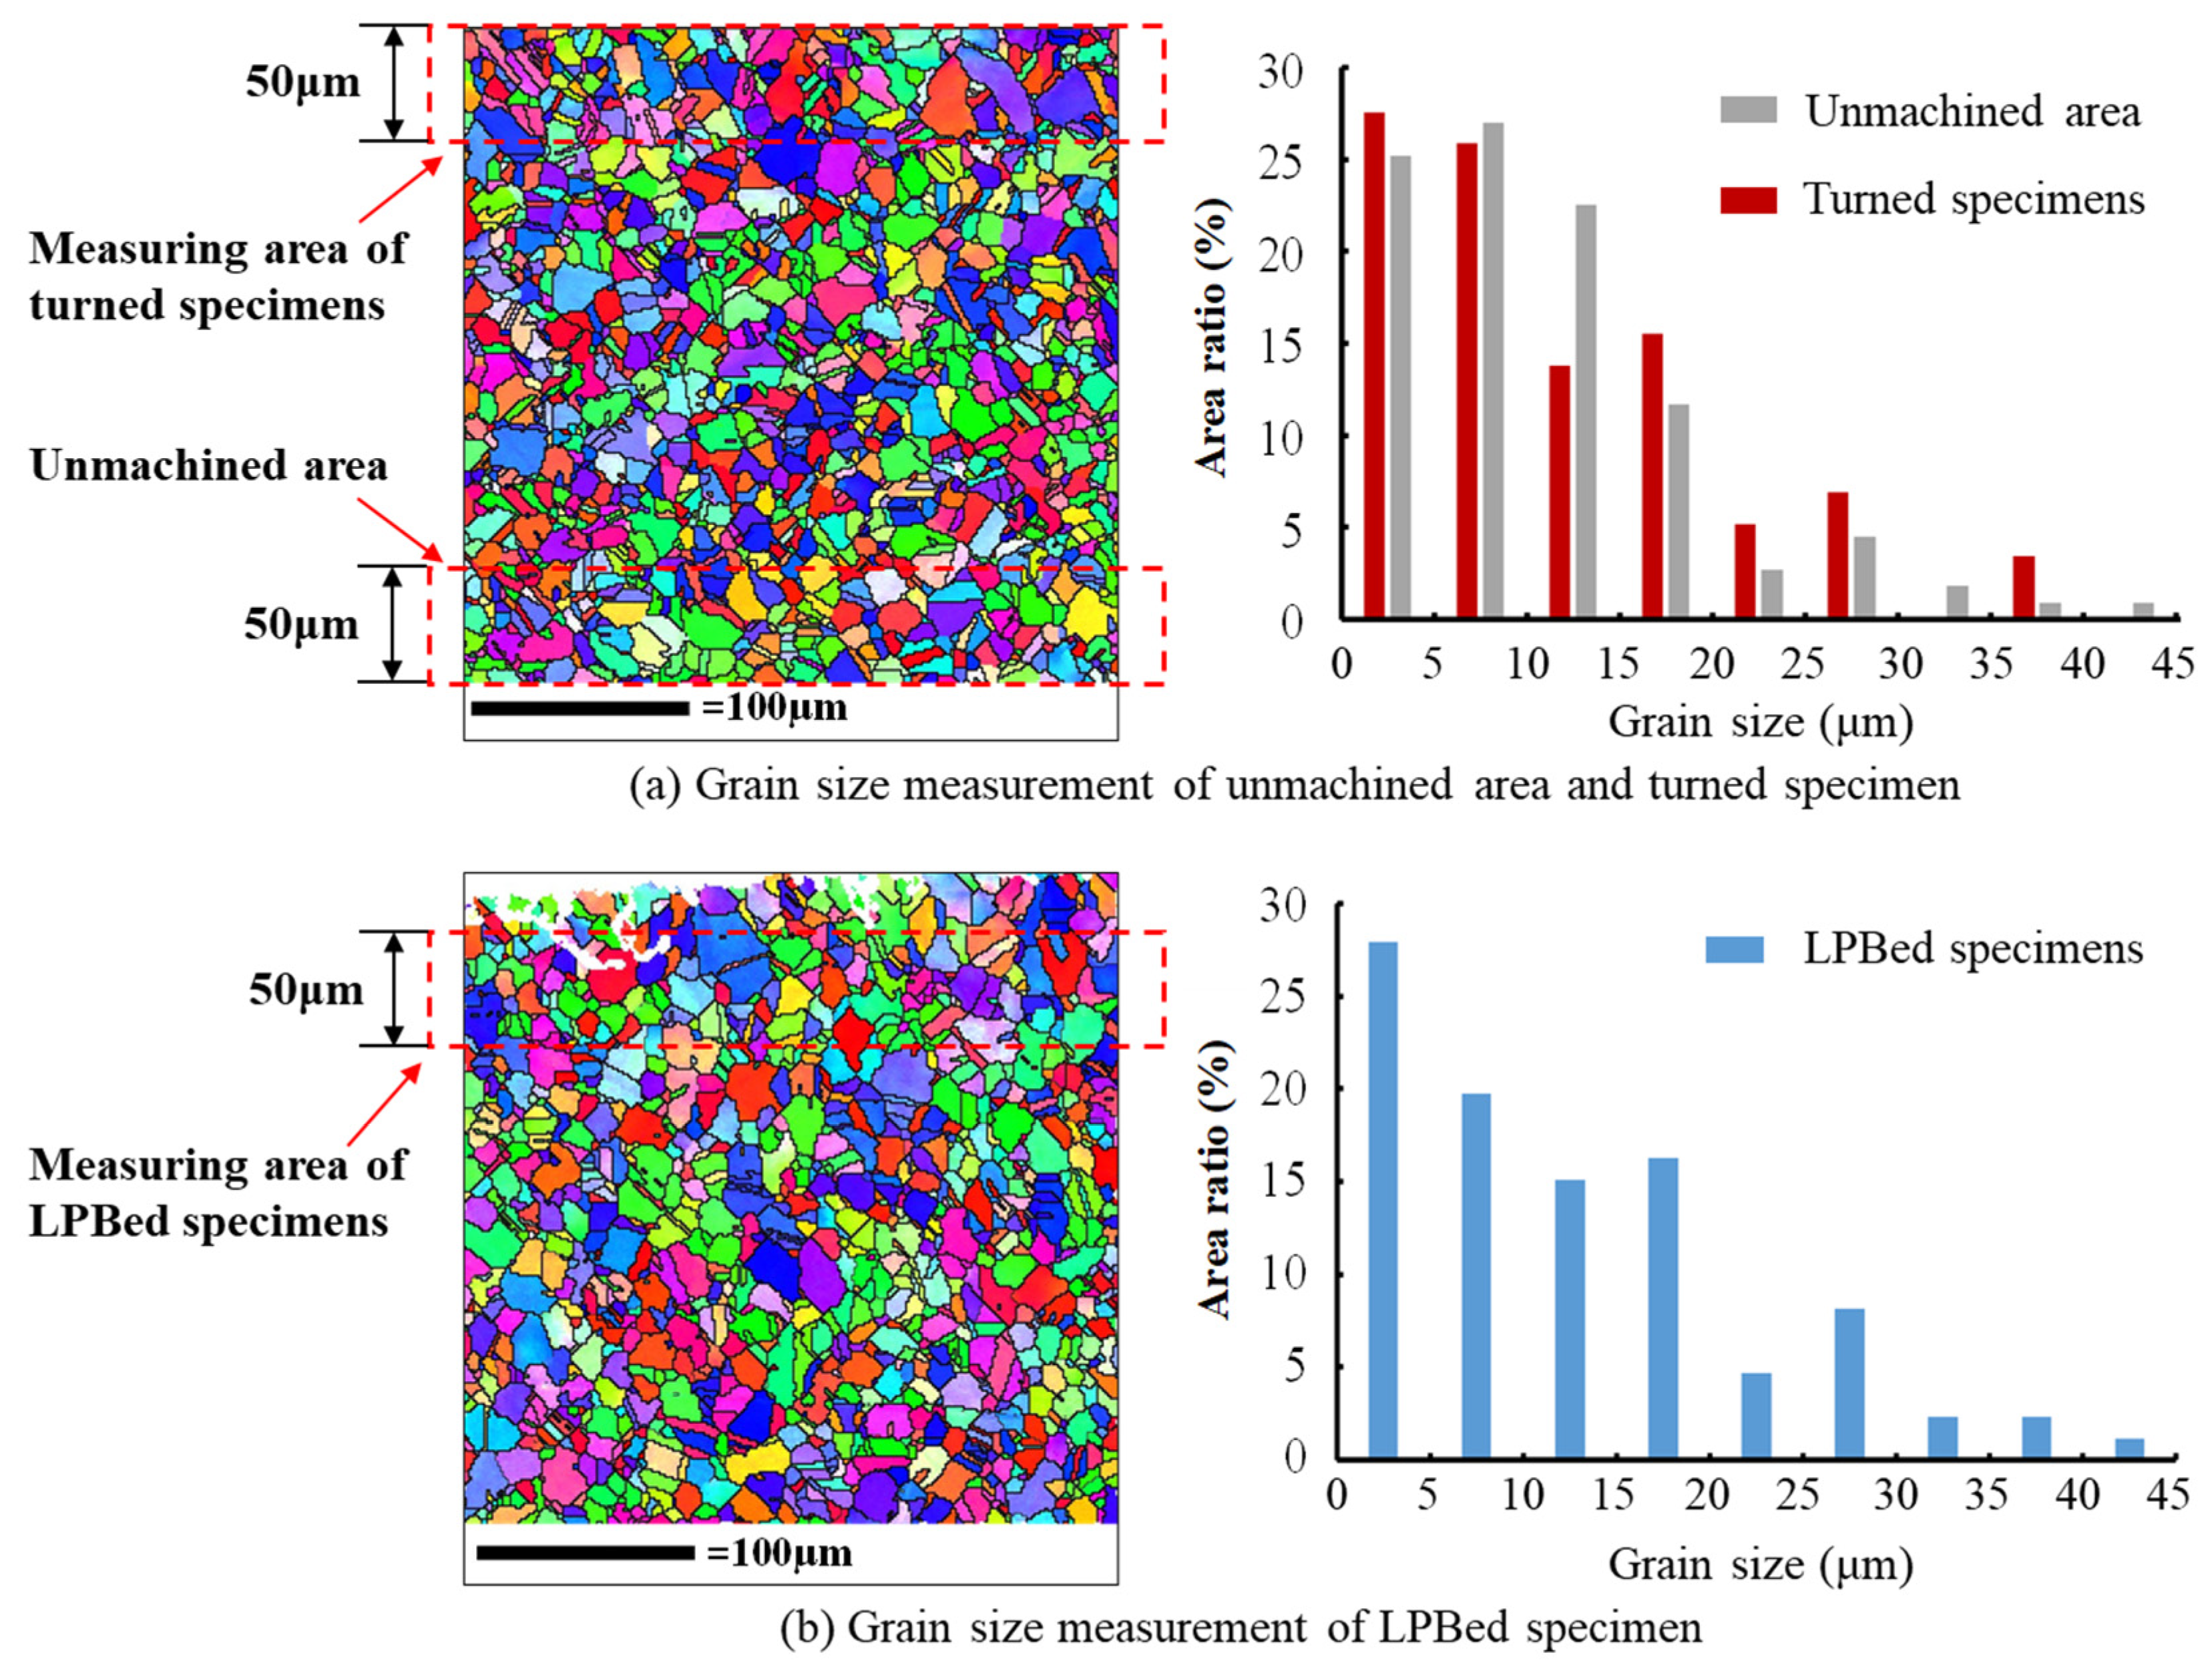
Firstly, the microstructure and grain size of the specimens were measured using electron backscatter diffraction (EBSD), as shown in Figure 7. The grain size was measured within a range of 50 μm from the machined surface excluding poorly identified areas in order to prevent the errors from the substrate material and poorly identified area. The microstructure of Inconel 718 was composed of equiaxed grains and crystal twin. The grain average size in the unmachined area, turned specimen, and LPBed specimen were measured as 12.27 μm, 12.26 μm, and 13.42 μm, respectively.
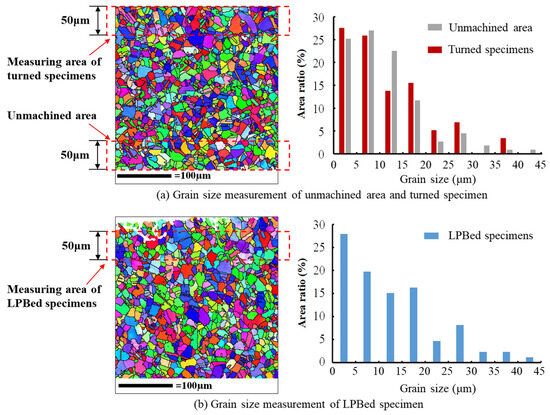
Figure 7.
Surface microstructure and grain size statistics of the unmachined area, turned specimen, and LPBed specimen using EBSD.
Subsequently, the representative volume element (RVE) model of Inconel 718 was established based on the observed Inconel 718 microstructure. The Voronoi diagram, a diagram consistent with the microstructure formation process of metal materials [33], was employed to simulate the microstructure of Inconel 718 specimens.
Finally, the shear stress internal the grains during LCF loading was calculated using FEM. The microcracks were set up in grains according to the Tanaka–Mura model. According to the study of Kramberger et al. [20], the crack initiation stage concluded when the crack expanded to 300 μm. Therefore, the RVE model with 600 grains was established within a 300 μm by 300 μm square. The crack initiation simulation concluded when the microcracks penetrated the RVE model. The loading cycles corresponded to the crack initiation lifetime.
The mechanical properties of the Inconel 718 grains are anisotropic. The elastic orthotropic matrix parameters of Inconel 718 are shown in Table 3. Grain principal directions were assigned using a random number method since the grain directions are randomly distributed in Inconel 718.
Table 3.
The orthotropic elastic matrix constants of Inconel 718 [34].
According to the Tanaka–Mura crack initiation cycle slip theory, cracks initiate at the persistent slip bands internal to the grains. Therefore, the slip bands were drawn inside the grains at an angle of 45° to the main direction, as shown in Figure 8. The length of the slip bands and shear stress amplitude was substituted into the Tanaka–Mura model to calculate the crack initiation life of the grain. The RVE model was meshed using CPE4R and CPE3 with the size of 1 μm. The established RVE model of Inconel 718 is shown in Figure 8.
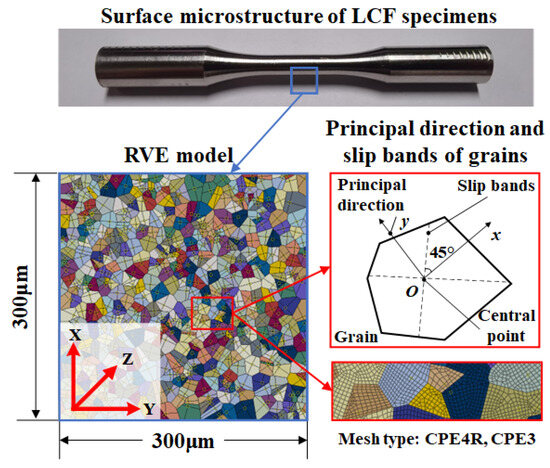
Figure 8.
RVE model of Inconel 718 LCF specimens.
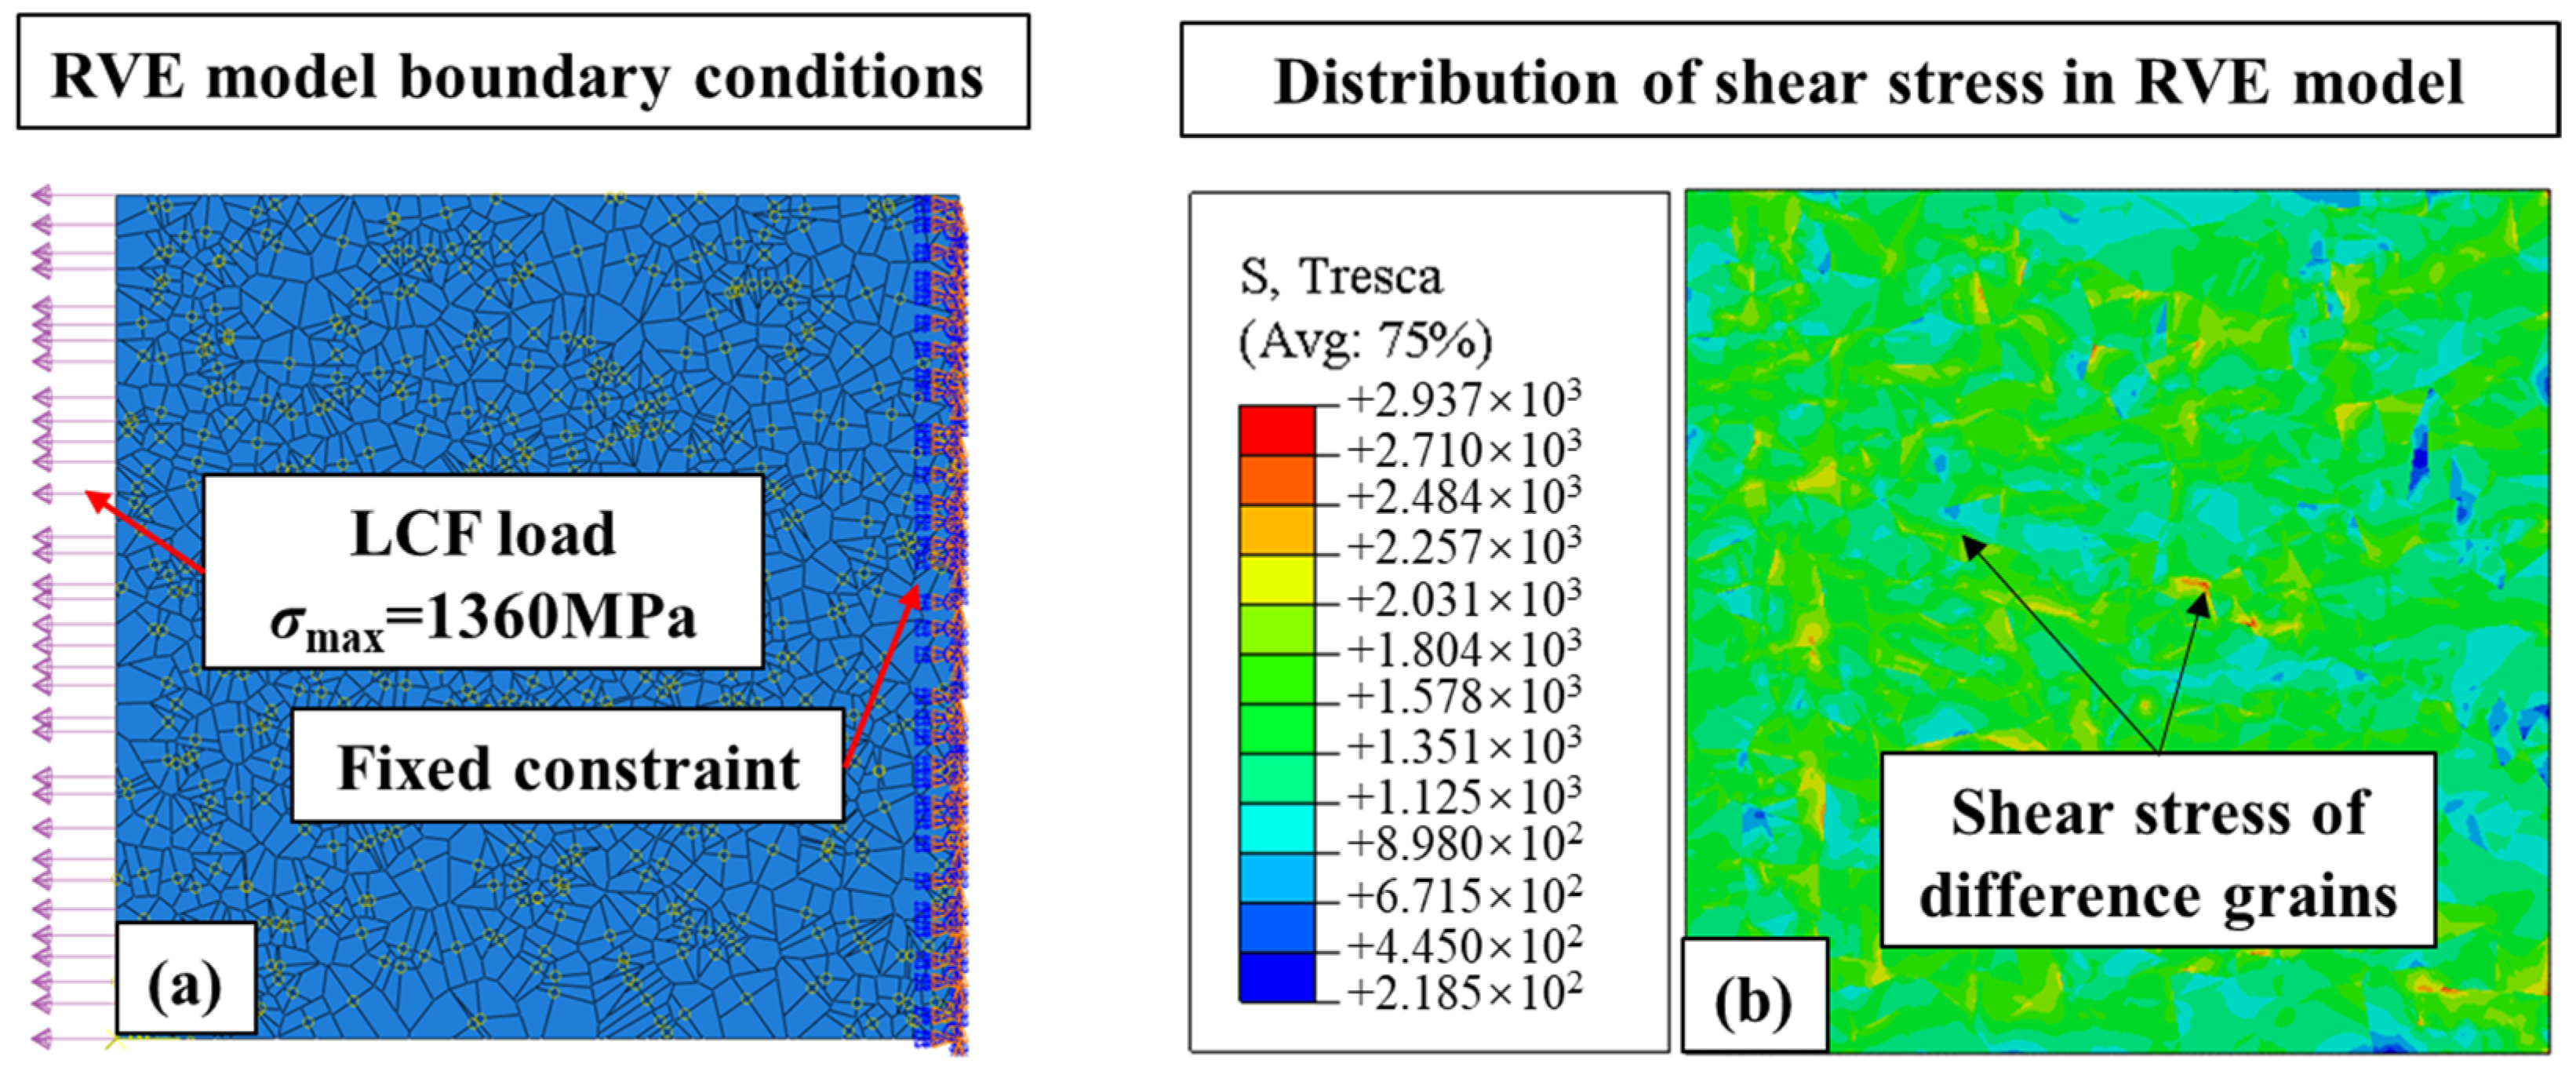
The boundary conditions were specified based on the surface integrity of the fatigue specimen and the LCF experiment. The maximum load was σmax=1360 MPa and R=0.1 for stress ratio. The fixed constraint and load were applied to the RVE model as shown in Figure 9a. The distribution of shear stress in the RVE model is shown in Figure 9b. The shear stress was uniformly distributed within each grain while varied between different grains. It was due to the anisotropic mechanical properties of the grains.
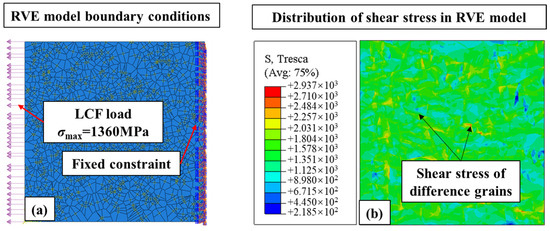
Figure 9.
Boundary conditions and shear stress of the RVE model.
The maximum load σmax and minimum load σmin were applied to the RVE model. The maximum shear stress τmax and minimum shear stress τmin of each grain were extracted using Python and Matlab. The average shear stress range Δτ and the length of the slip band d were substituted into Equation (1) to calculate the crack initiation life of each grain. The grain with the lowest crack initiation lifetime was marked as the critical grain. The critical grain was cracked at the end of a single simulation, and its crack initiation life was considered as the lifetime of the simulation.
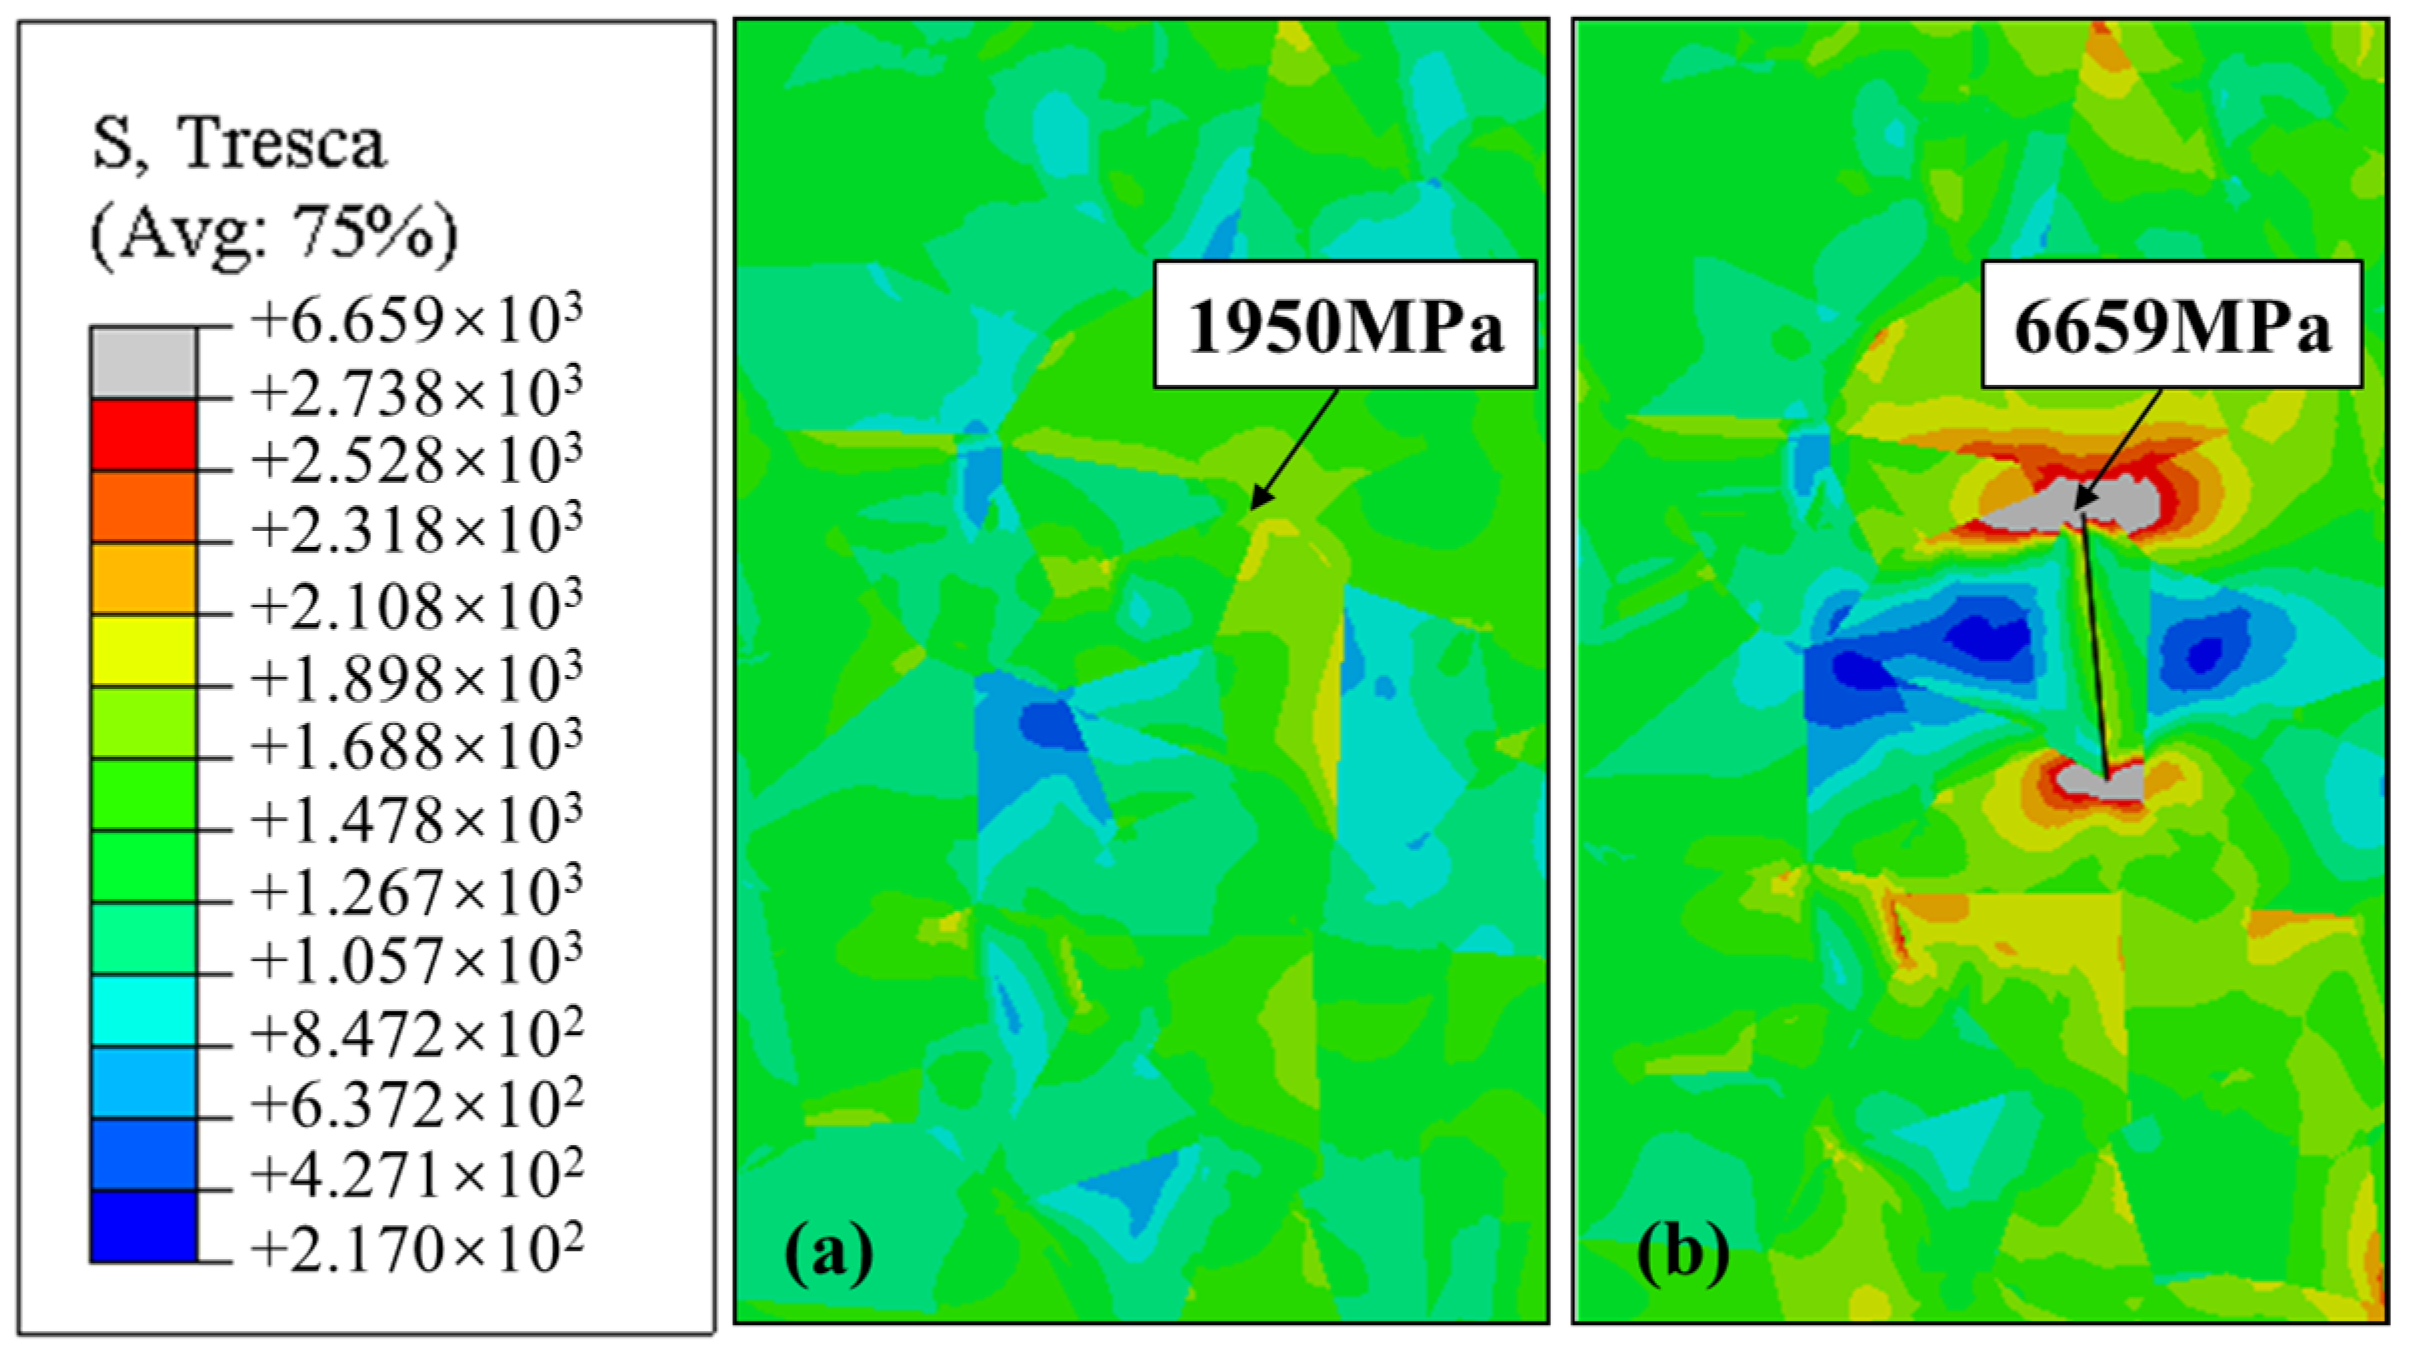
The shear stress distribution of the RVE model is shown in Figure 10. The shear stress within surrounding grains was changed by the stress concentration at the crack tip. Cyclic FEM simulation was used to simulate the crack initiation process and predict the crack initiation life. The crack was assigned in the critical grain at the end of each single simulation, and then the FEM process proceeded to the subsequent simulation cycle. The simulation of the crack initiation cycle stopped when the crack length exceeded the criterion length (0.3 mm), and the total crack initiation life was then output.
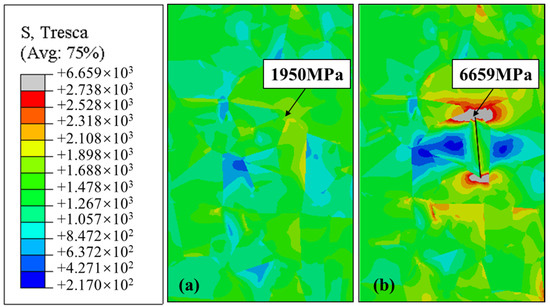
Figure 10.
Shear stress distribution of RVE model (a) without crack and (b) with crack.
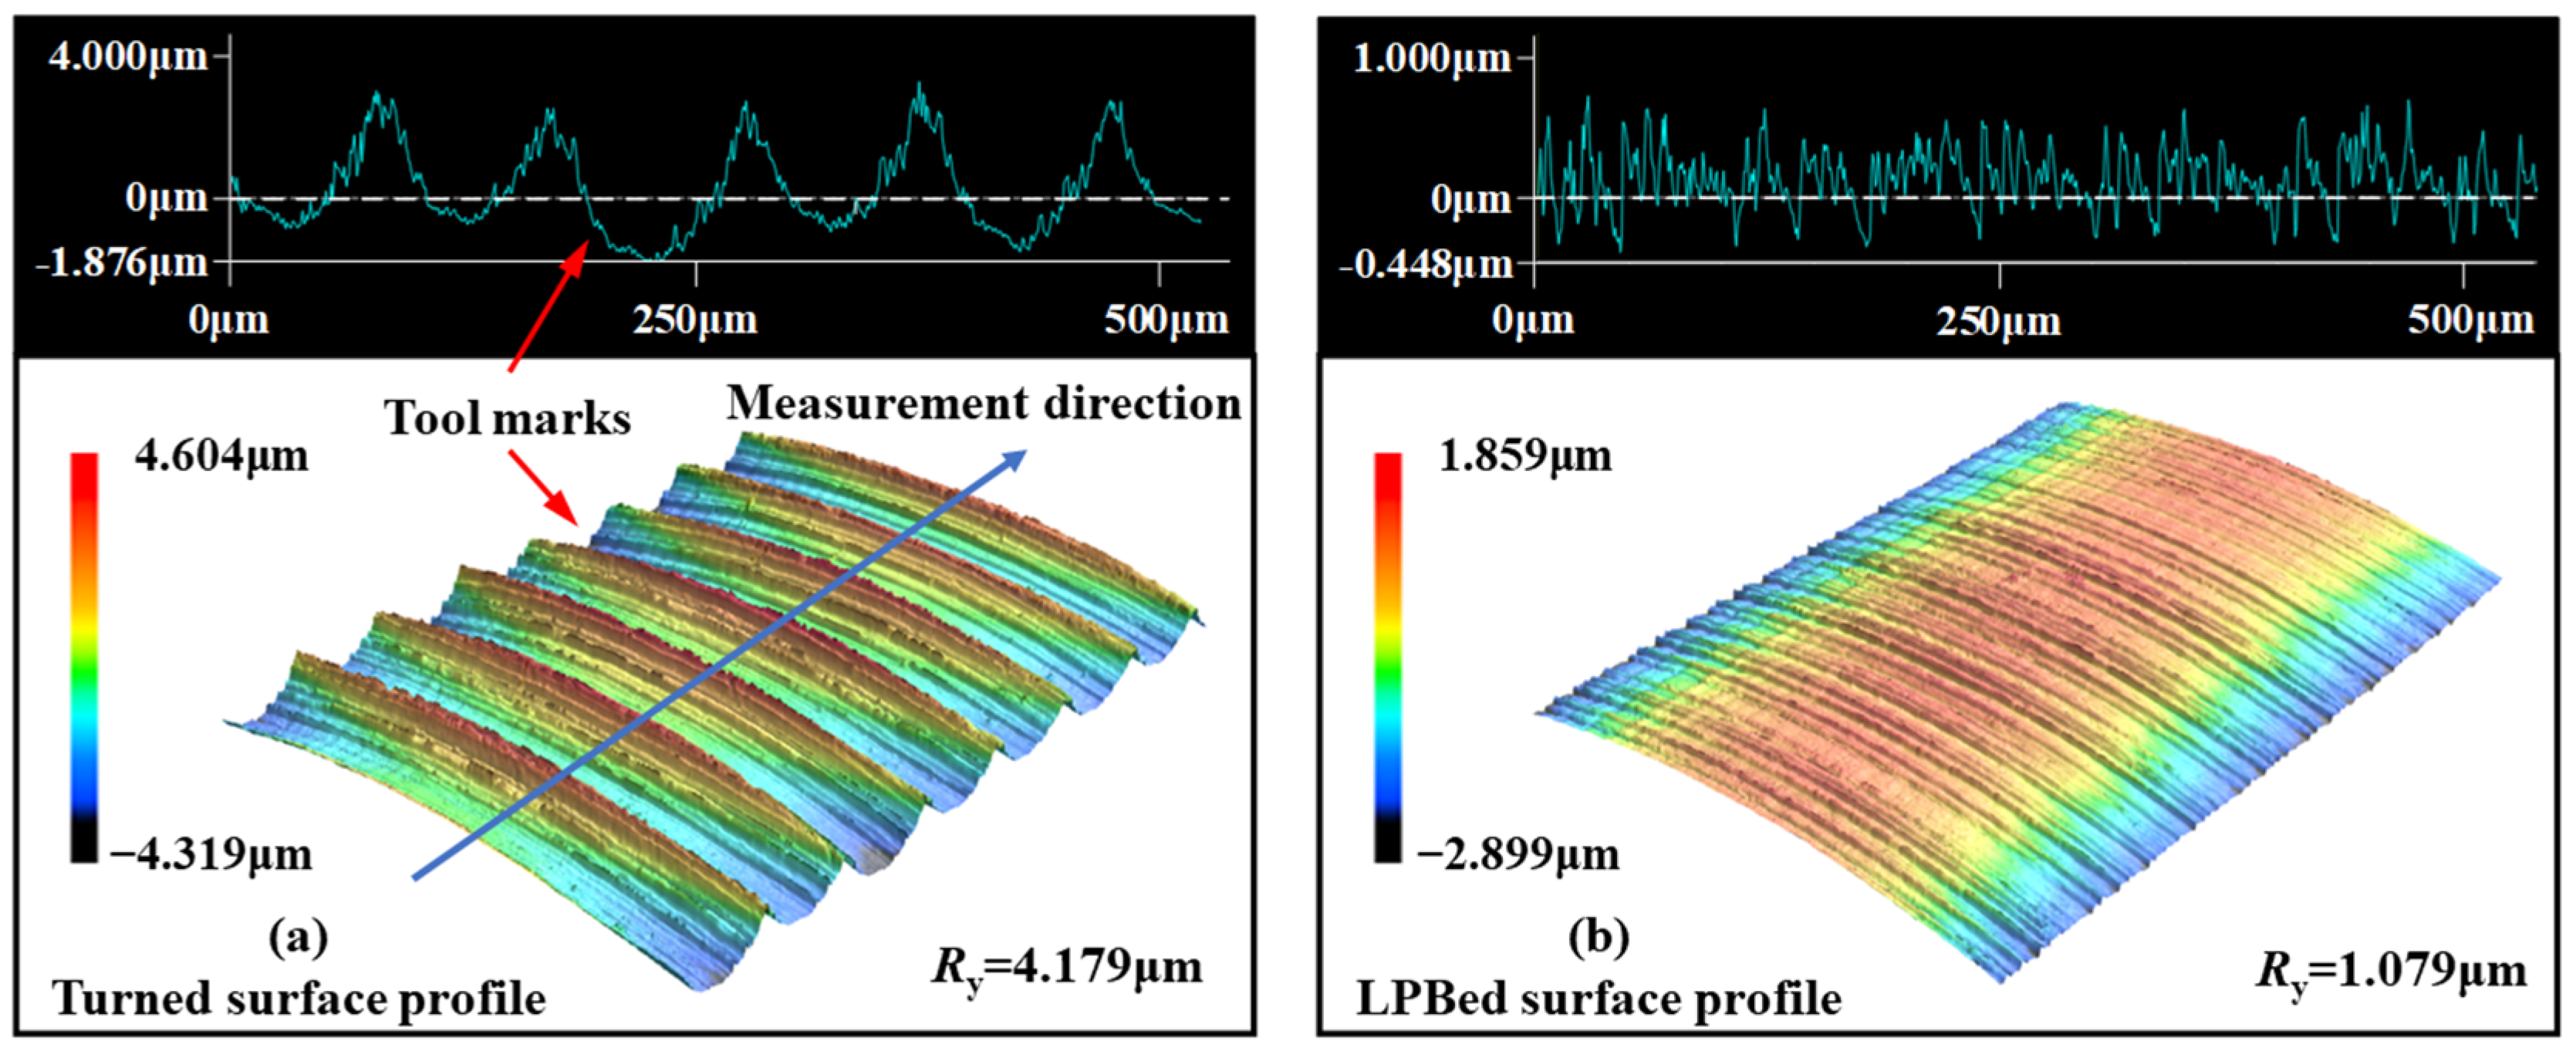
The surface integrity of the specimens was measured experimentally in Section 2.2. The surface morphology and surface roughness of the turned specimen and LPBed specimen are shown in Figure 11. As shown in Figure 11a, tool marks were observed on the turned surface. The surface roughness of the turned specimen was 4.179 μm. Tool marks were smoothed after the LPB process as shown in Figure 11b, and the surface roughness was decreased to 1.079 μm. The LPBed surface roughness was reduced by 77.6% compared to the turning results.

Figure 11.
Surface topography and surface roughness of turned and LPBed specimens.
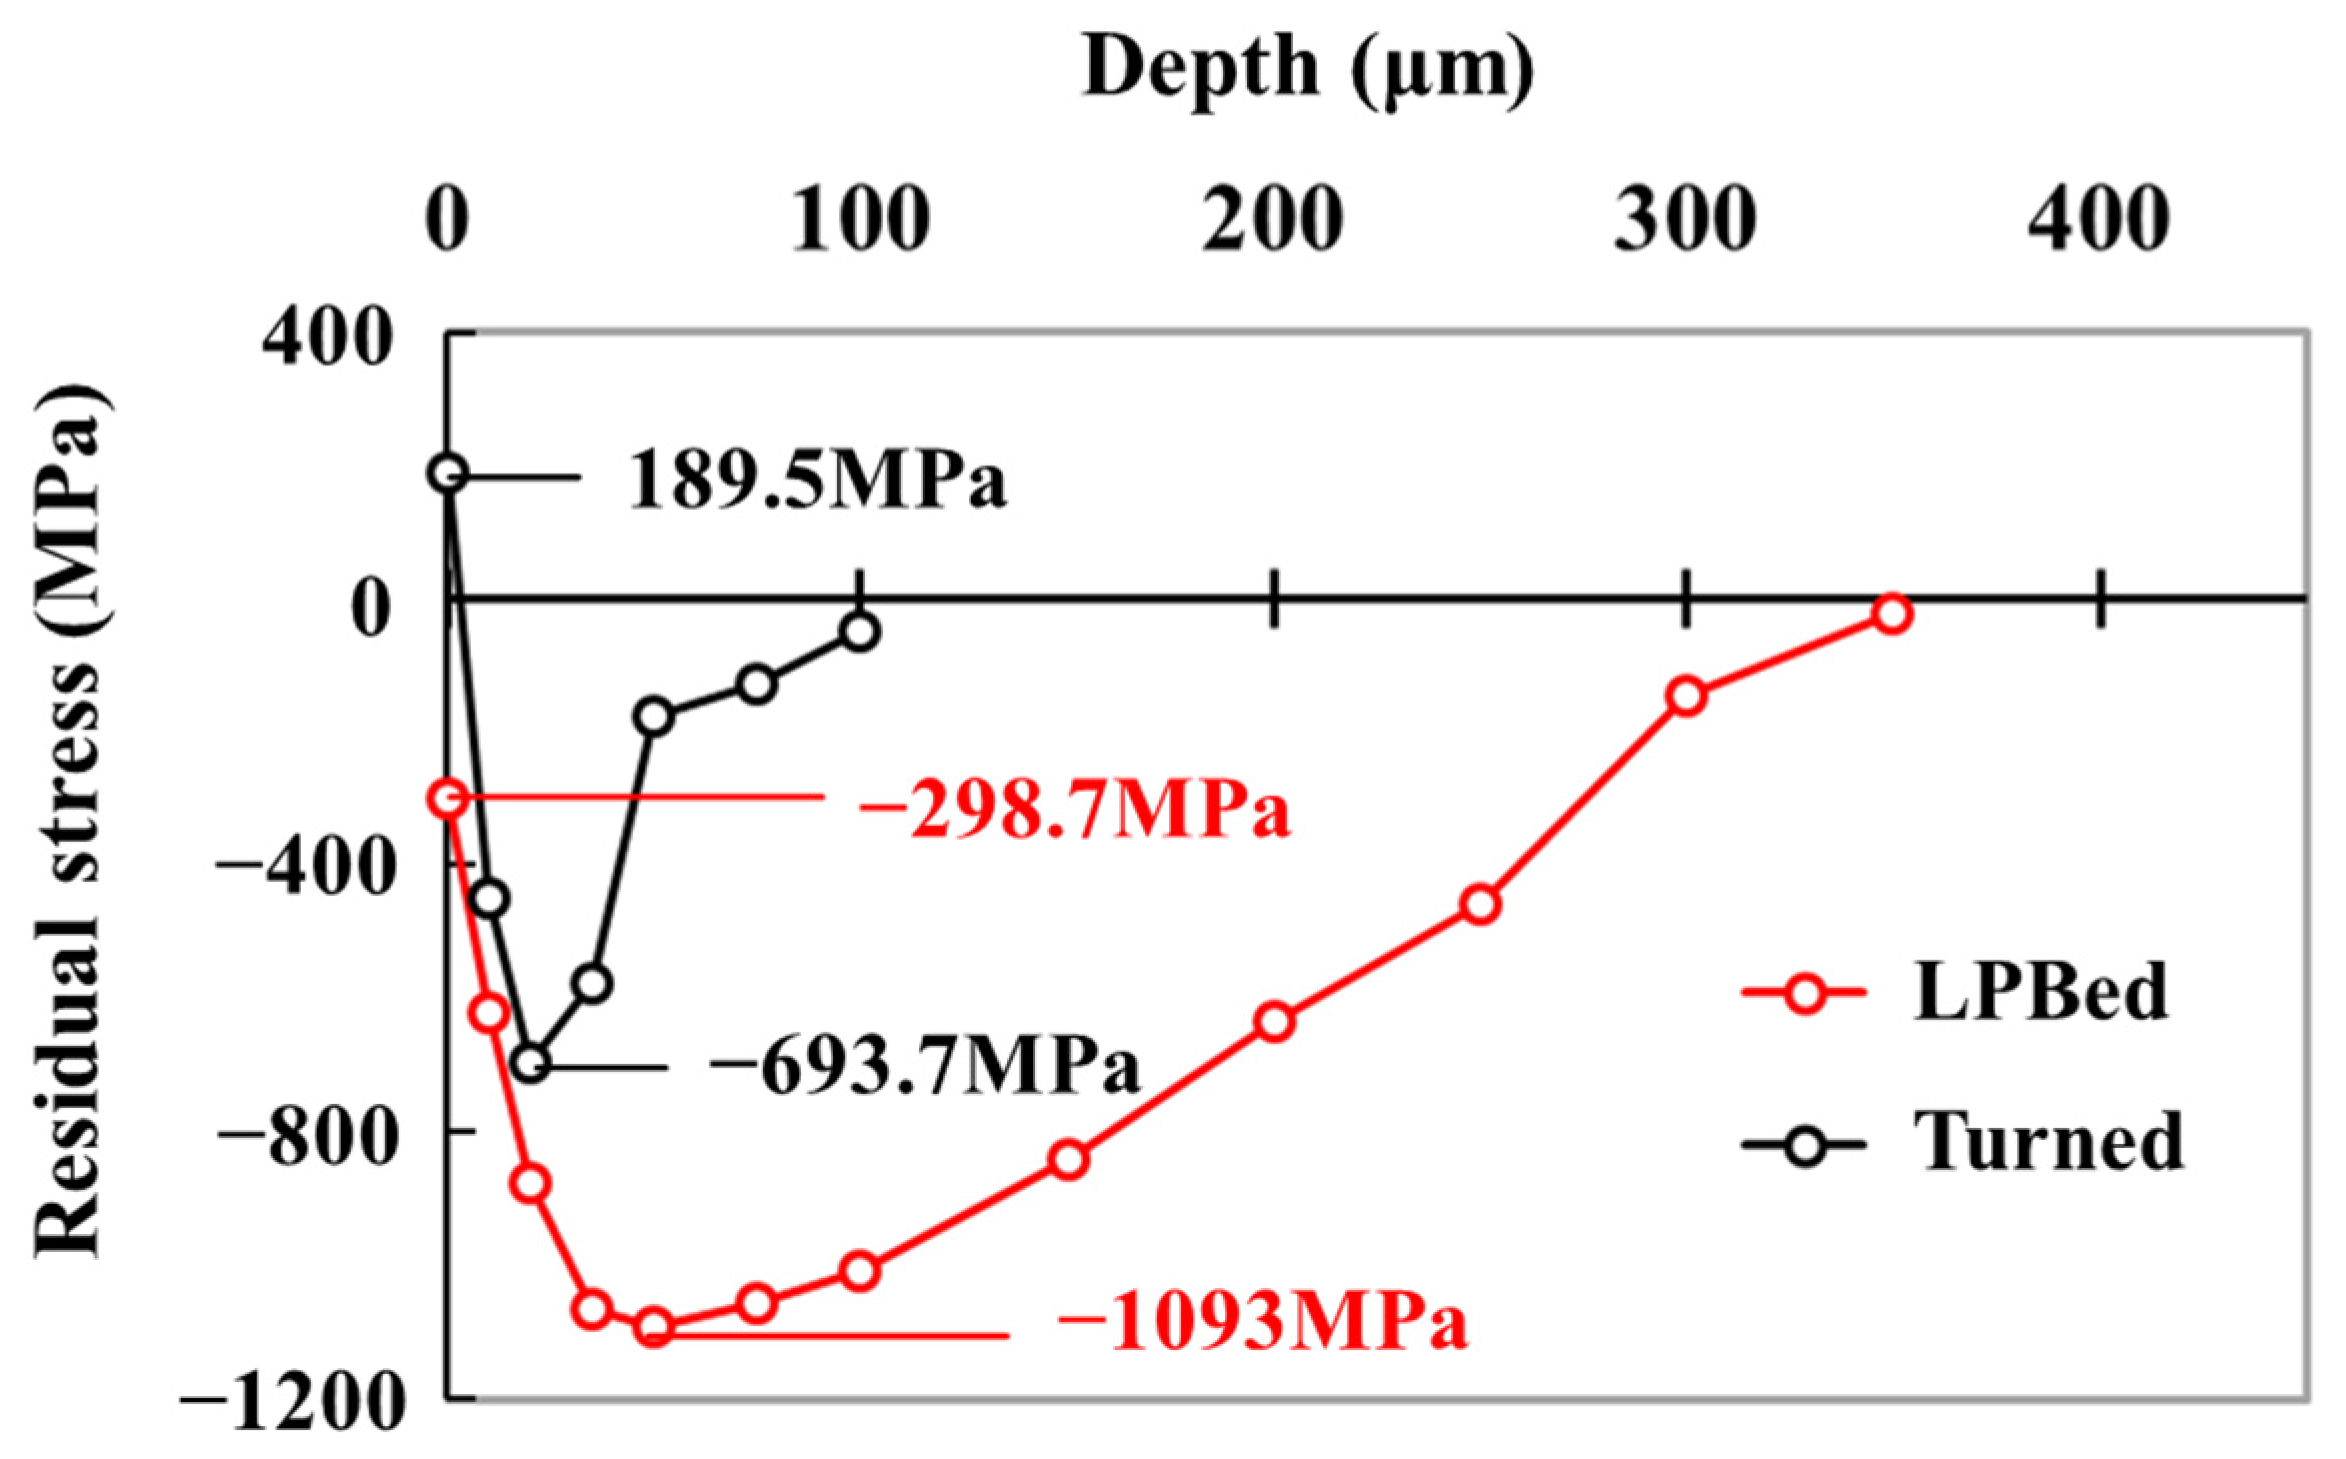
The residual stress field of the turned and LPBed specimens is depicted in Figure 12. Tensile residual stress with the value of 189.5 MPa was induced on the turned surface. The maximum compressive residual stress of turned specimen was −693.7 MPa. The depth of the turned residual stress field was 100 μm. The surface compressive residual stress of the LPBed specimen was −298.7 MPa. The maximum compressive residual stress of LPBed specimen was measured at 50 μm from the surface with the value of −1093 MPa (57.6% increasing compared with turned specimen). The depth of the LPBed residual stress field was 350 μm.
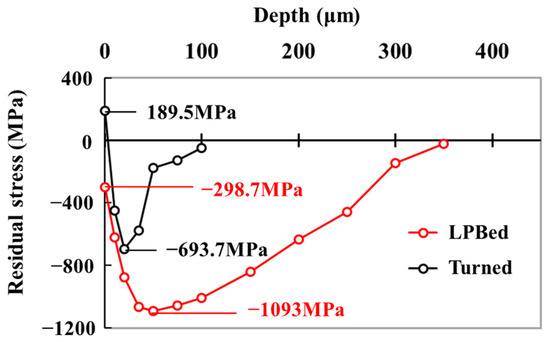
Figure 12.
Residual stress field of turning and LPB specimens.
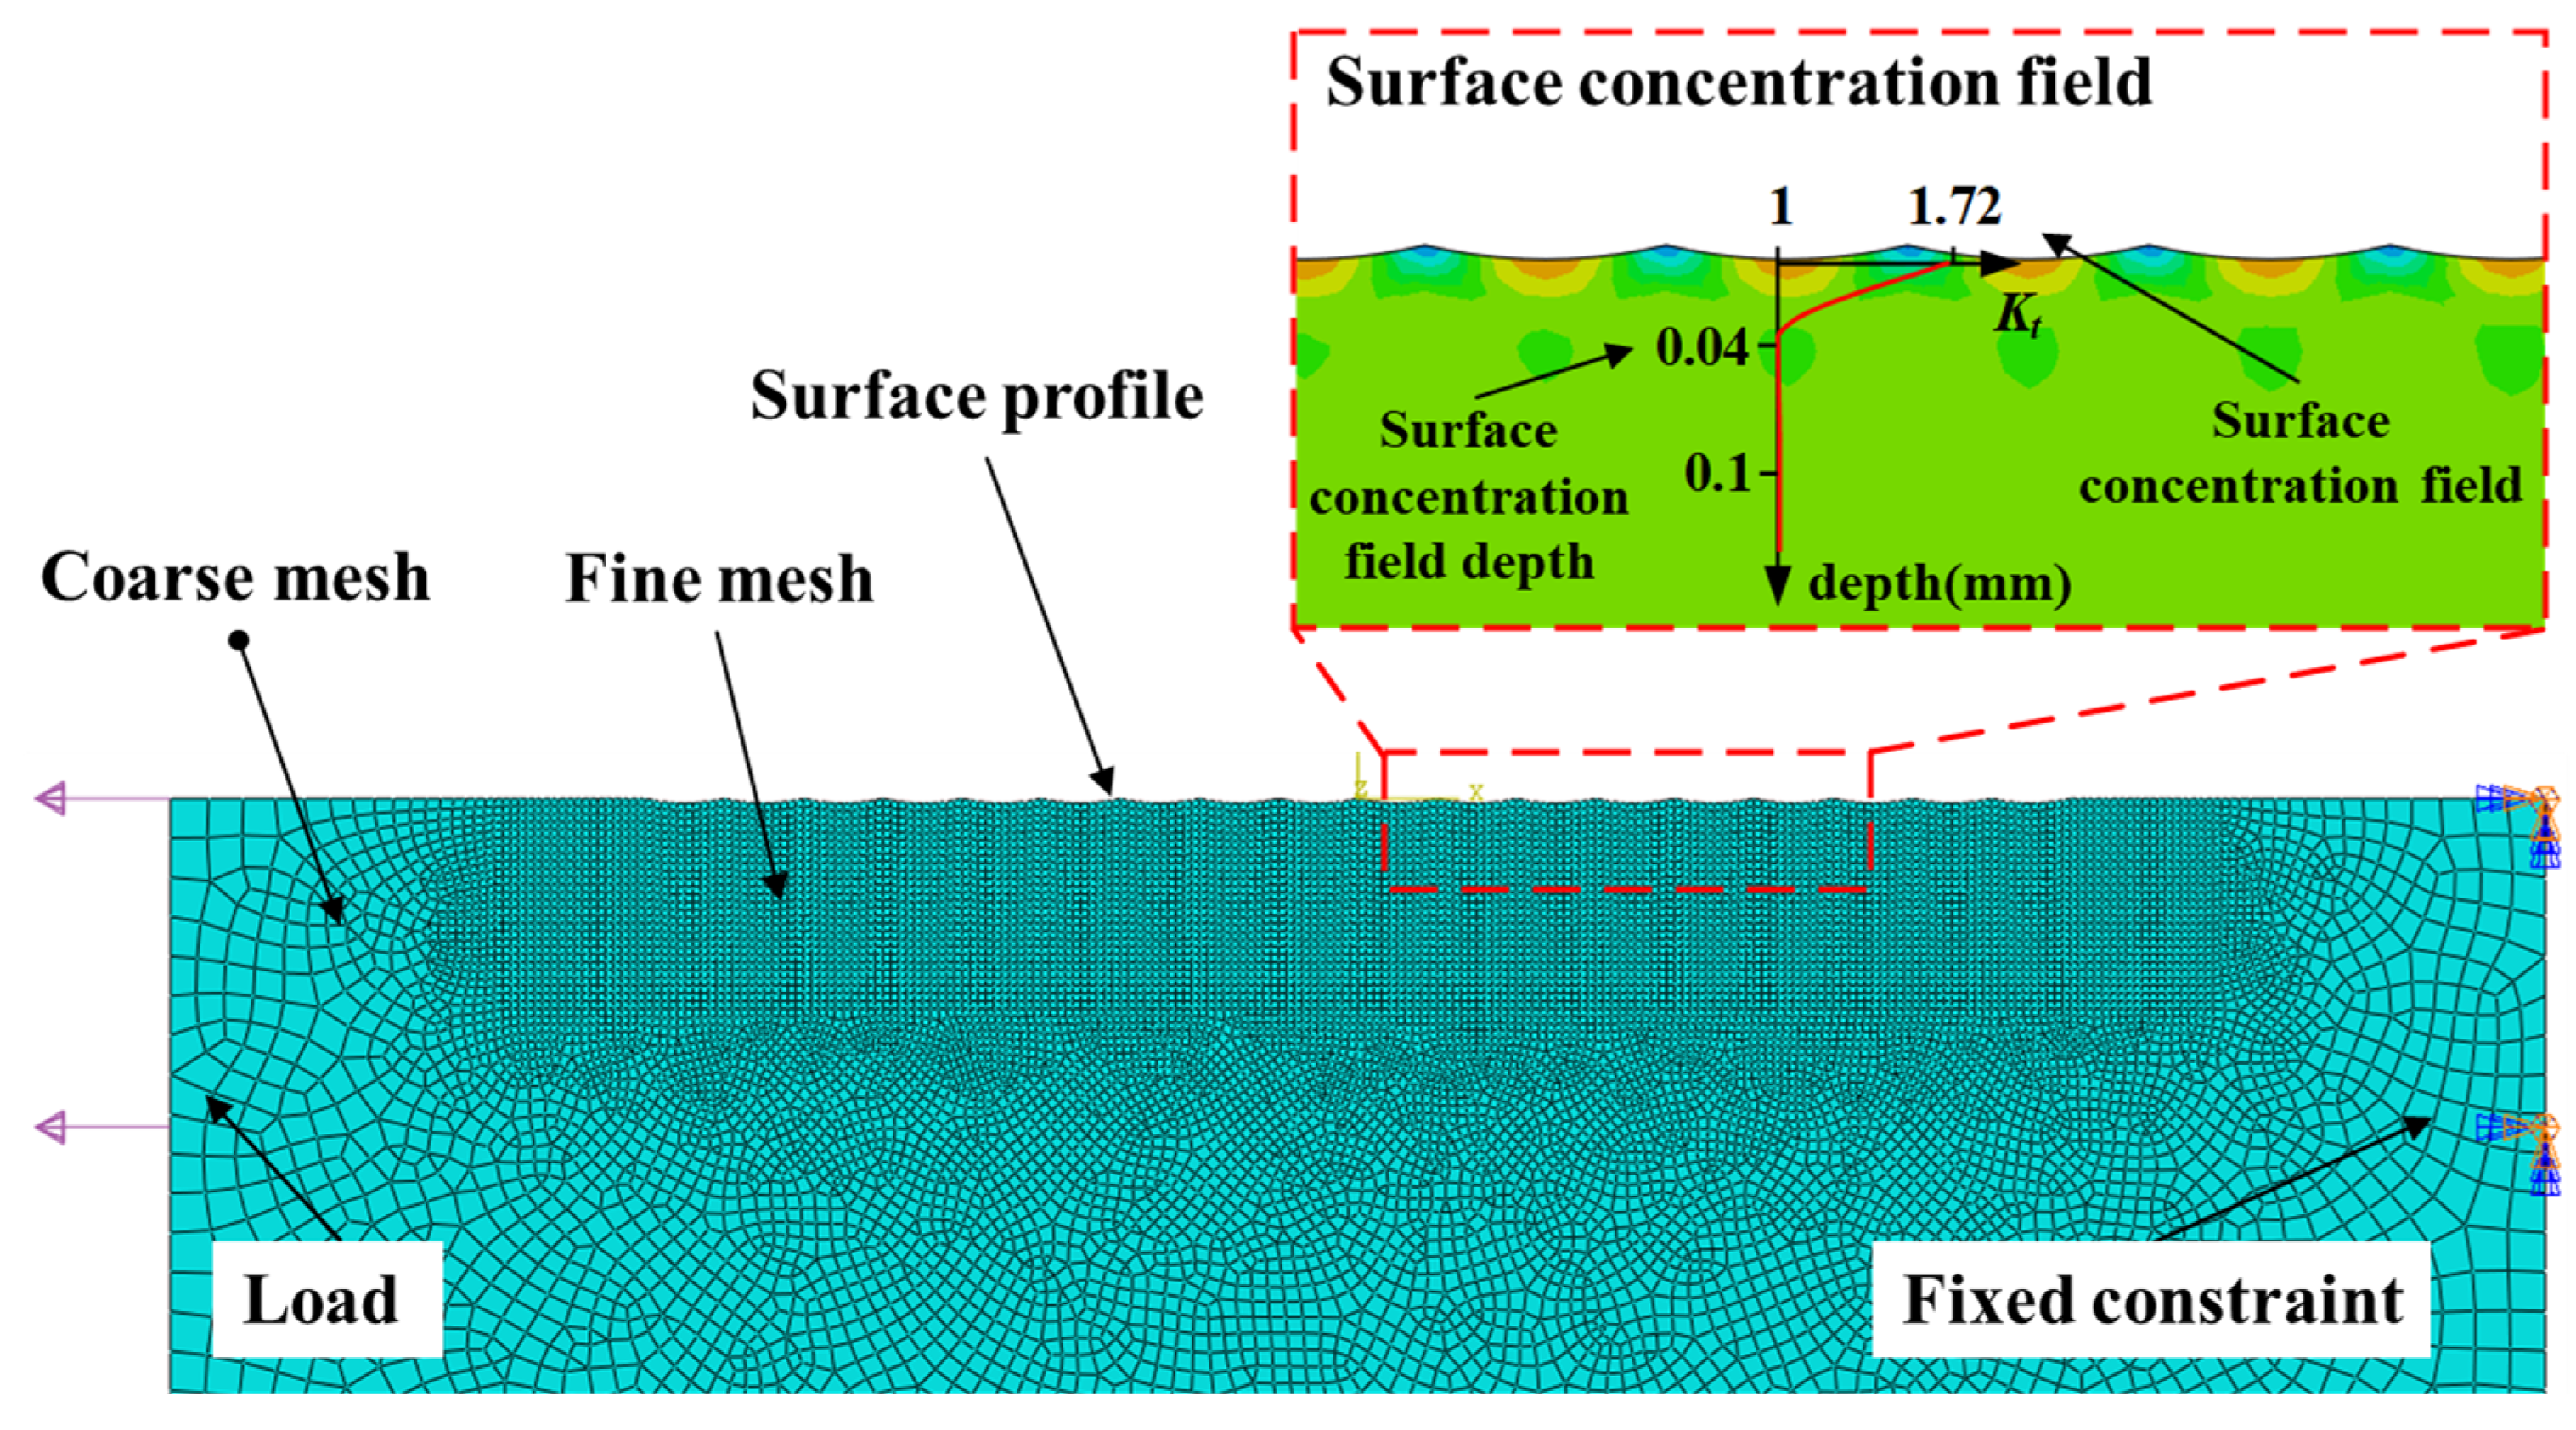
Surface integrity affects the LCF life by altering the actual stress applied on the LCF specimens [3,35]. Stress concentration, caused by surface roughness, increases the surface stress, which in turn reduces the LCF life of specimen [36]. The stress concentration field depth of the turned specimen was calculated using FEM, as shown in Figure 13. The multi-notch model was established according to the turning surface topography. Material mechanical parameters of Inconel 718 are shown in Table 1. The model was meshed using CPE4R. The size of fine meshes was 0.01 mm. A fixed constraint was applied to the right side of the model, and load was applied to the left side. Microscopic morphology of the turned surface could not be replicated by FEM, so the surface roughness stress concentration coefficient was corrected using Arola’s model [37], as shown in Equation (2).
where Ra is the arithmetic mean deviation, ρ is the radius of the arc at notch bottom, and Rz is the maximum height. The surface roughness parameters of the turning process are shown in Table 4. The stress concentration coefficient of the turned surface roughness was 1.72, and the depth of the stress concentration field was 40 μm.
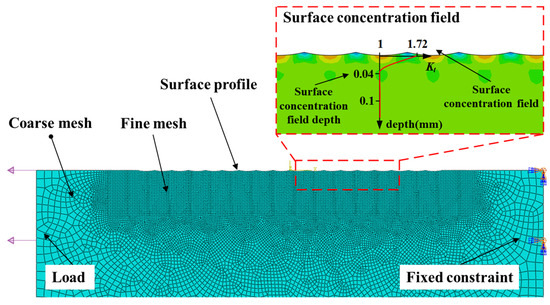
Figure 13.
Surface stress concentration field FEM model of turned Inconel 718 specimen.
Table 4.
Stress concentration factor of turned surface.
The actual stress of specimens considering surface integrity is expressed as Equation (3).
The actual stress on the turned specimen surface was 1645.5 MPa and 1360 MPa internally in the specimen. The compressive residual stress was applied to the LPBed specimen according to the measurement result shown in Figure 12. The boundary conditions for polished matrix, turned, and LPBed RVE models are shown in Figure 14.
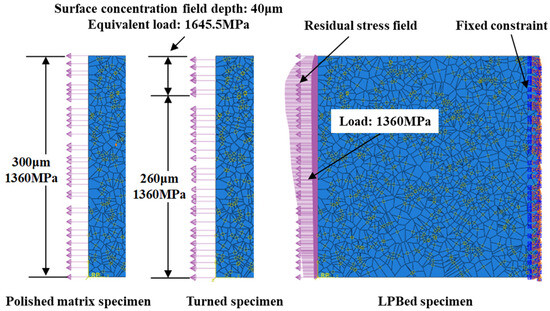
Figure 14.
Boundary conditions of polished matrix, turned, and LPBed RVE model.
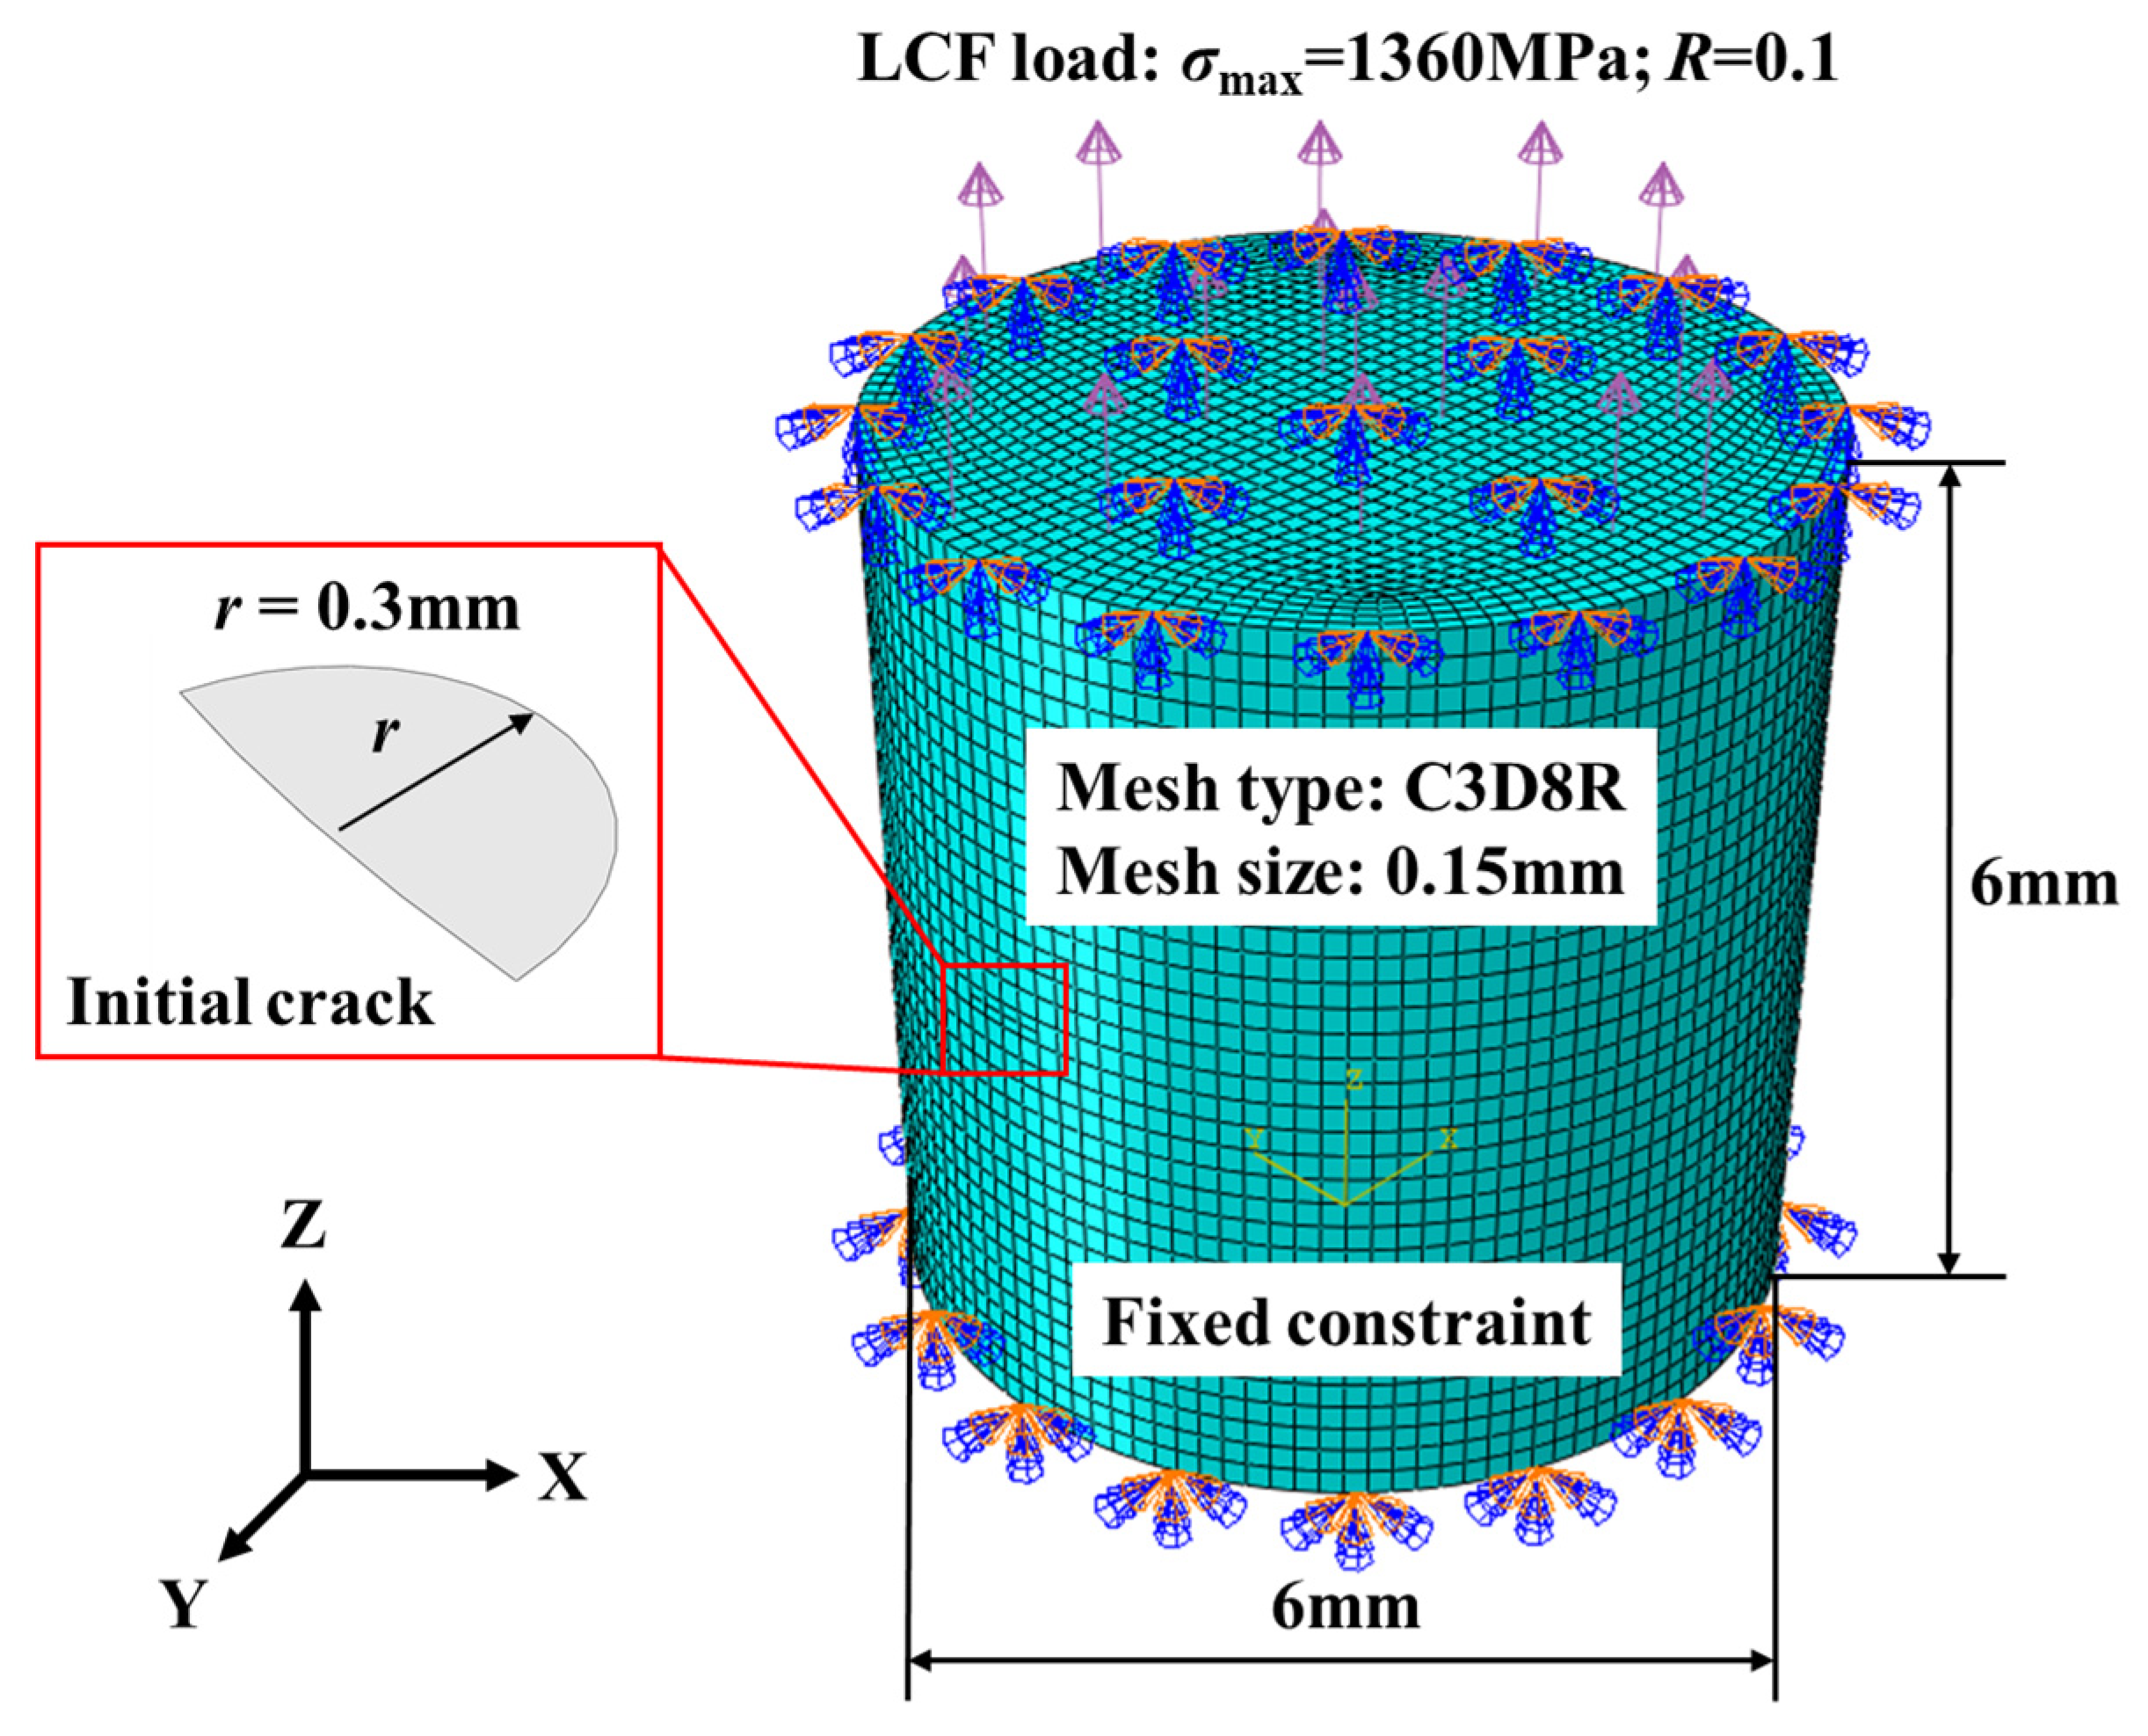
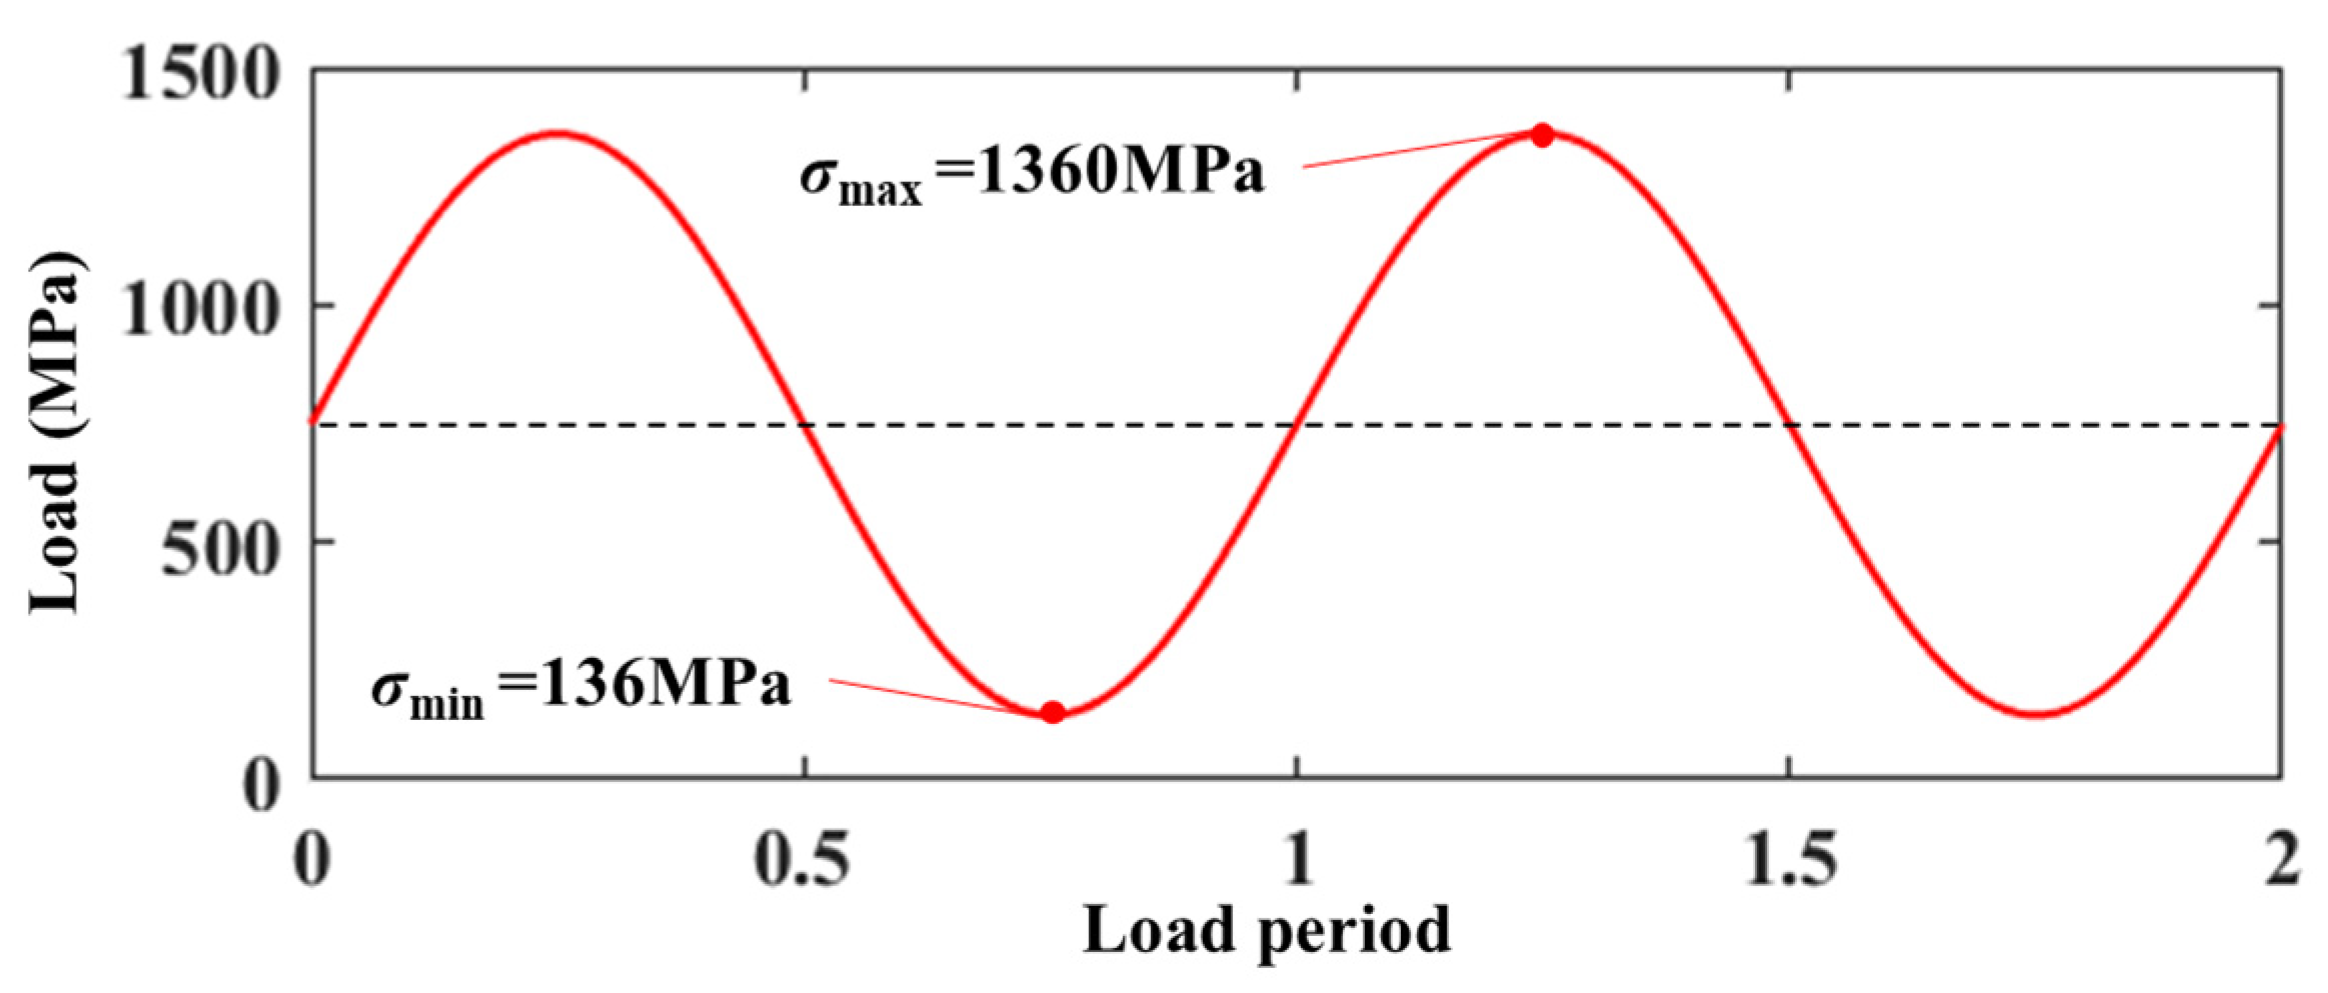
The crack propagation life of the specimens was predicted using the XFEM finite method. The 3D XFEM model was established based on the fatigue specimen structure, as shown in Figure 15. The initial crack with a smooth curved front was formed after the crack initiation stage [38]. A semi-circular crack with the radius of 0.3 mm was set up in middle of the model. Hexahedral meshes are the only suitable mesh for XFEM. The model was meshed using C3D8R with a size of 0.15 mm to ensure convergence of XFEM simulation. The material parameters of Inconel 718 crack extension finite element analysis are shown in Table 5. The cyclic loading analysis step was used to simulate LCF cyclic loading process. A fixed constraint was set on the bottom of the model. The freedom of the upper surface was constrained, except the z-direction displacement. A sinusoidal load was applied to the model. The maximum load σmax = 1360 MPa, the stress ratio R = 0.1. The LCF load spectrum is shown in Figure 16.
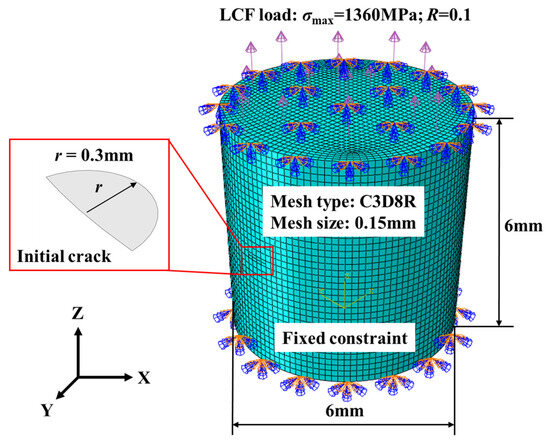
Figure 15.
Crack propagation XFEM model.
Table 5.
Crack propagation XFEM model parameters of Inconel 718 [39].
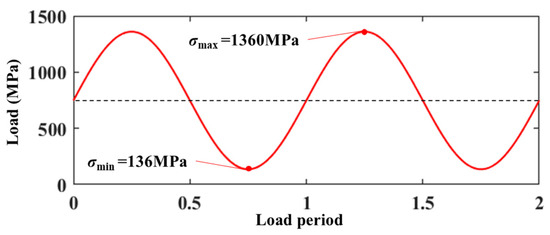
Figure 16.
LCF load spectrum of Inconel 718 specimens.
4. Result and discussion
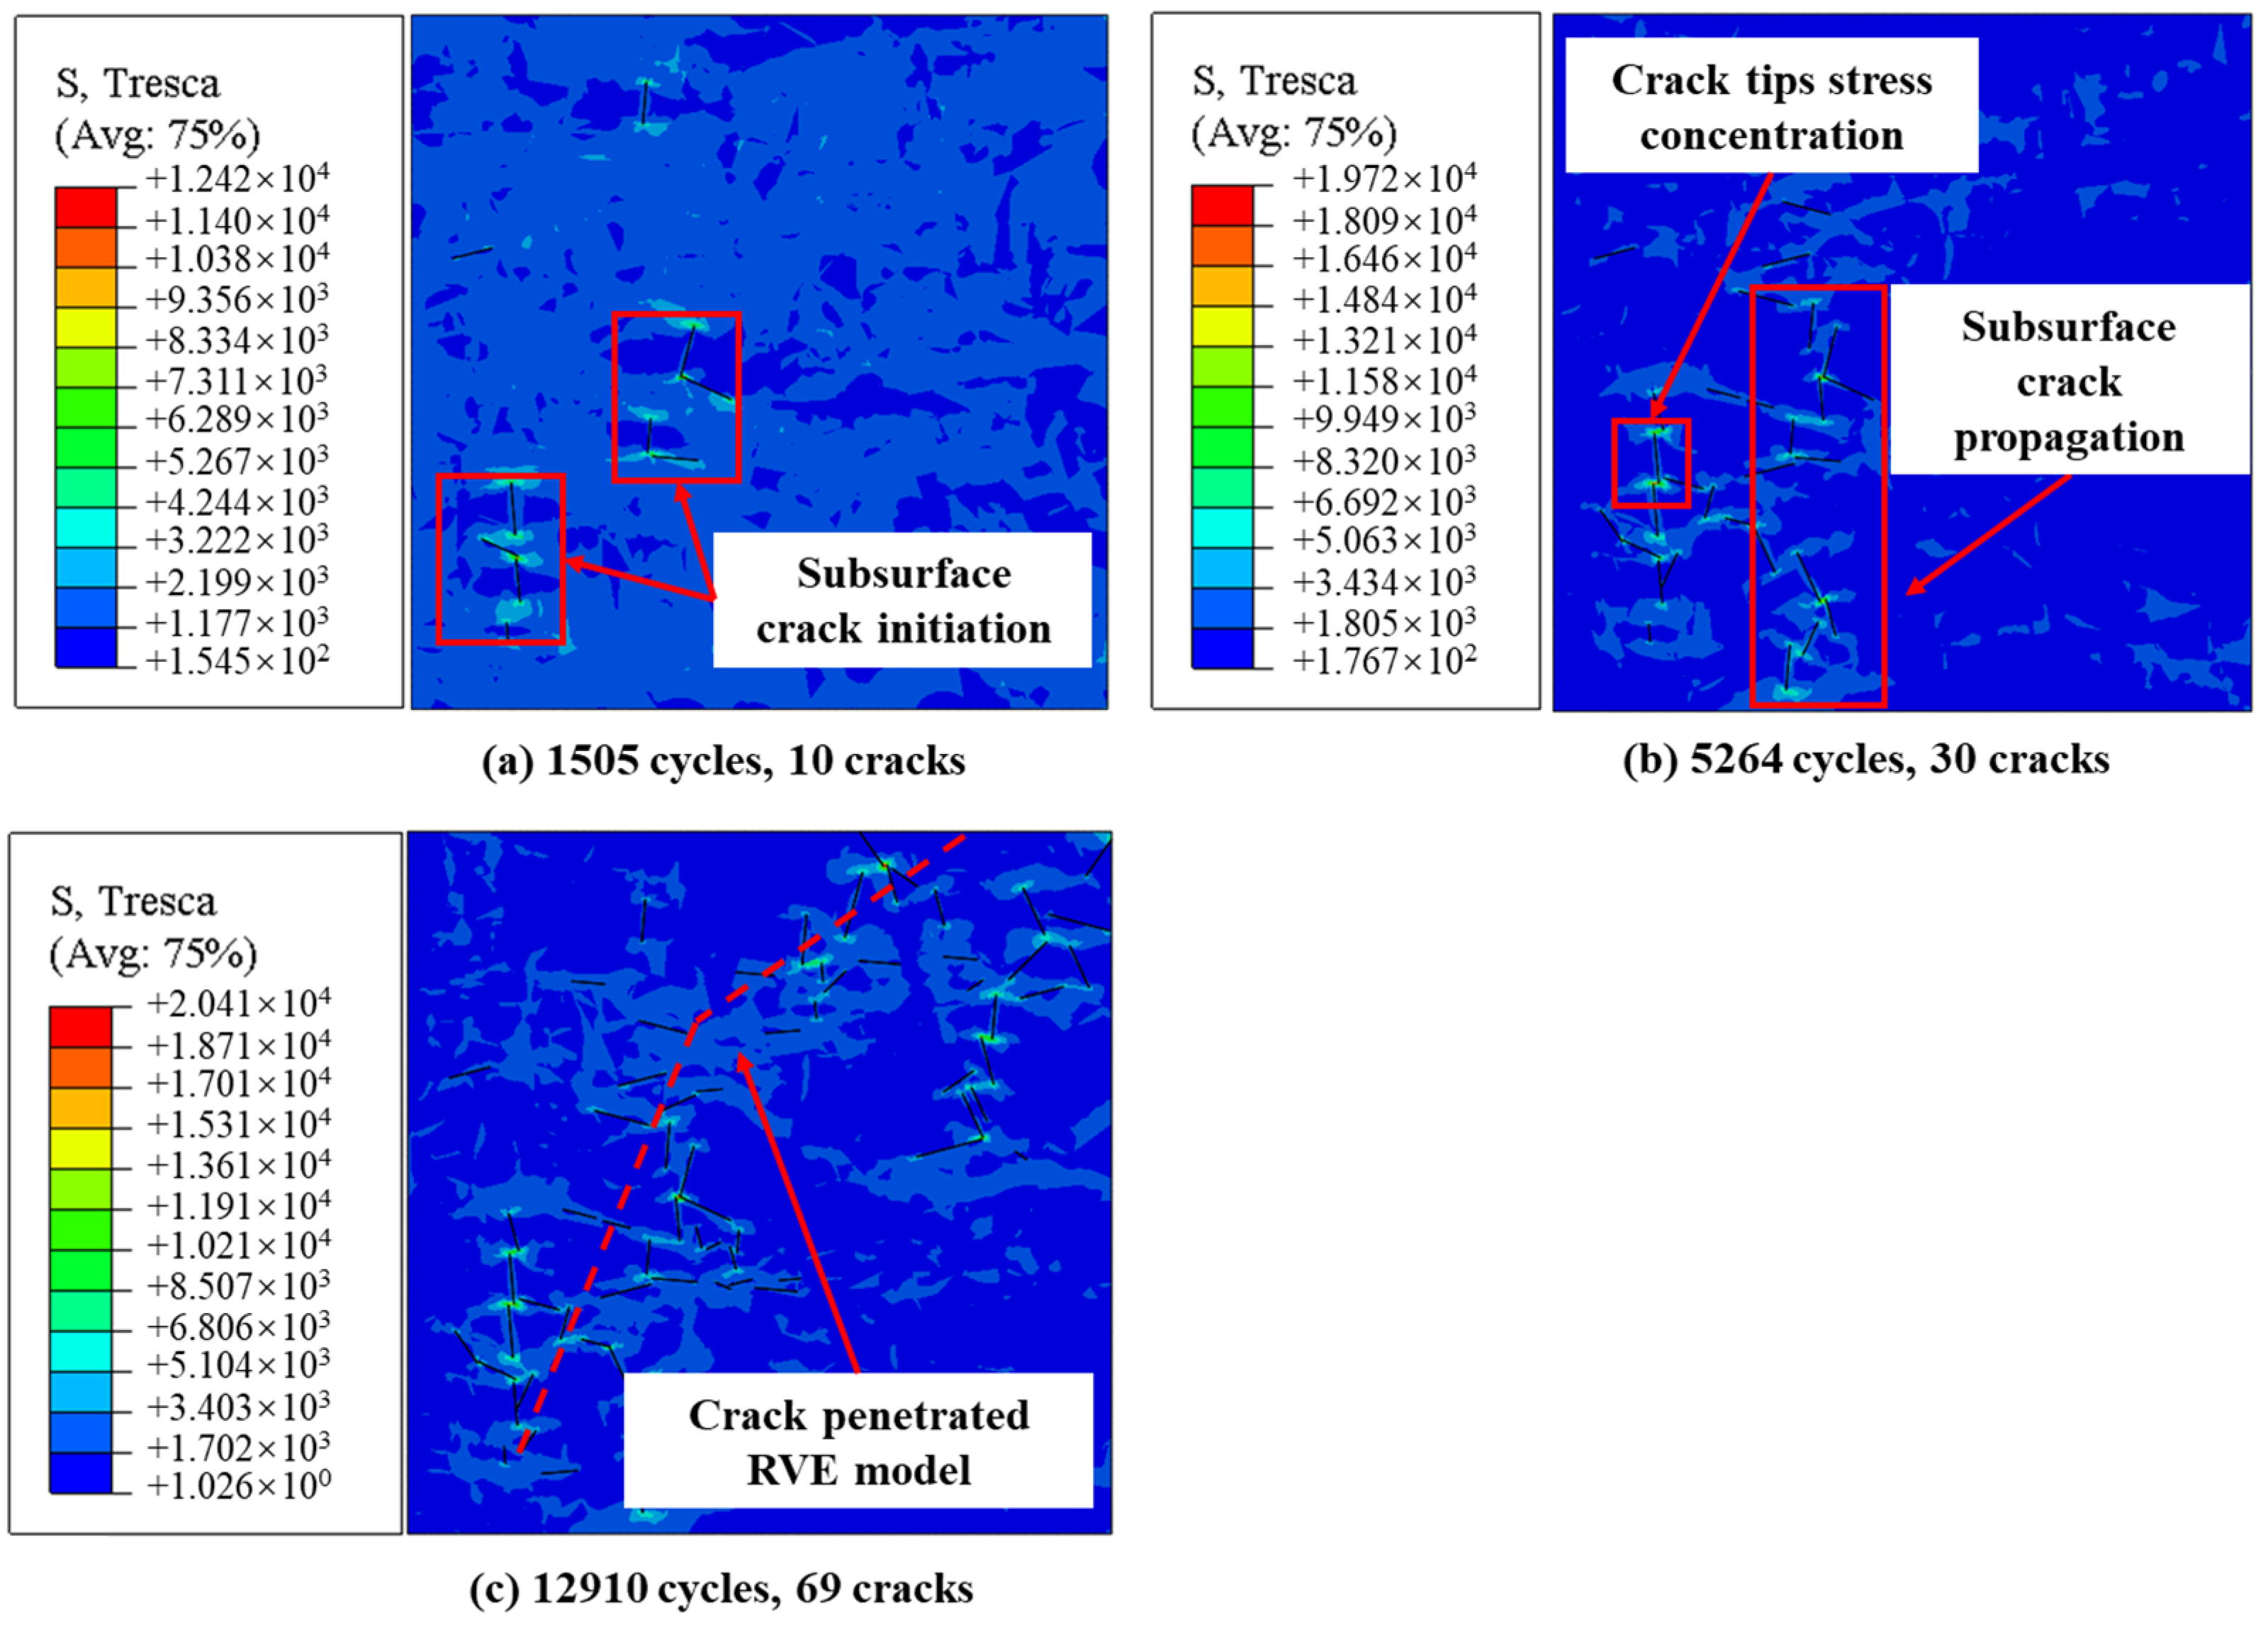
The crack initiation process of the polished matrix specimen simulated using FEM is shown in Figure 17. Microcracks were initiated in subsurface grains when loaded after 1505 cycles, as shown in Figure 17a. This was attributed to the absence of the surface stress concentration on the polished matrix specimen surface. The microcracks gathered and propagated to the surface with load proceeding, as shown in Figure 17b. The microcracks penetrated the RVE model after 12,910 cycles, as shown in Figure 17c. The predicted crack initiation life for the polished matrix specimen was 9718 cycles.
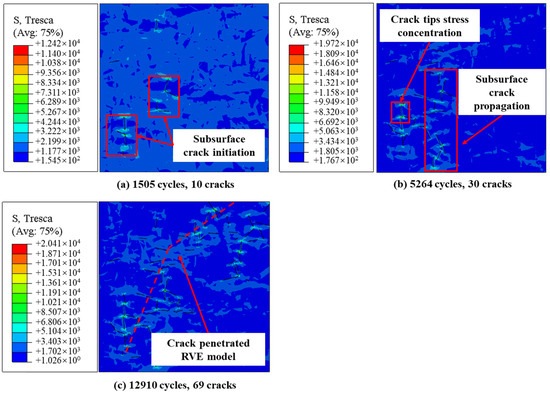
Figure 17.
Crack initiation process of the polished matrix RVE model.
The crack initiation process in the turned specimen simulated using FEM is shown in Figure 18. As shown in Figure 18a, microcracks initiated in the surface grains of the turned specimen at 1554 cycles. The rapid crack initiation at the turned surface was attributed to the stress concentration induced by surface roughness. The actual stress on turned surface was much higher than the stress in the substrate. As shown in Figure 18b, microcracks initiated in both the surface and the subsurface, indicating that the compressive residual stress of the turned specimen was not sufficient to inhibit crack initiation inside the specimen. The two microcracks merged and penetrated the RVE model at 9718 cycles, as depicted in Figure 18c. The predicted crack initiation life of the turned specimen was 9718 cycles.
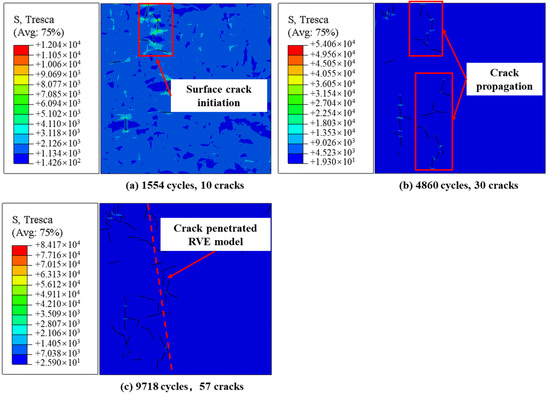
Figure 18.
Crack initiation process of the turned RVE model.
The crack initiation process in the LPBed specimen was simulated using FEM, as shown in Figure 19. Microcracks were initiated in the subsurface layer of the LPBed specimen at 2355 cycles, as shown in Figure 19a. This was attributed to the low surface roughness and compressive residual stress field induced by the LPB process. The microcracks extended slowly within the LPBed specimen. The compressive residual stress delayed microcrack propagation to the surrounding grains by mitigating the stress at the microcrack tips. The surface microcracks merged into the main crack penetrating the RVE model at 18,787 cycles. The predicted crack initiation life of the LPBed specimen was 18,787 cycles.
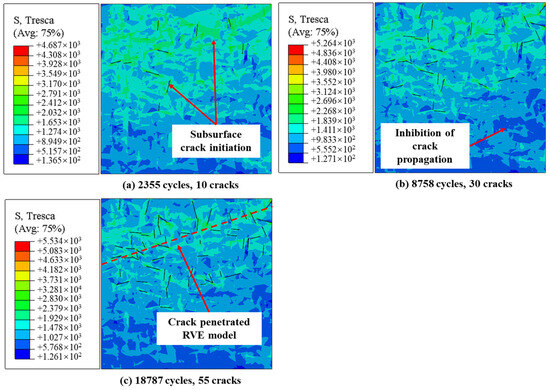
Figure 19.
Crack initiation process of the LPBed RVE model.
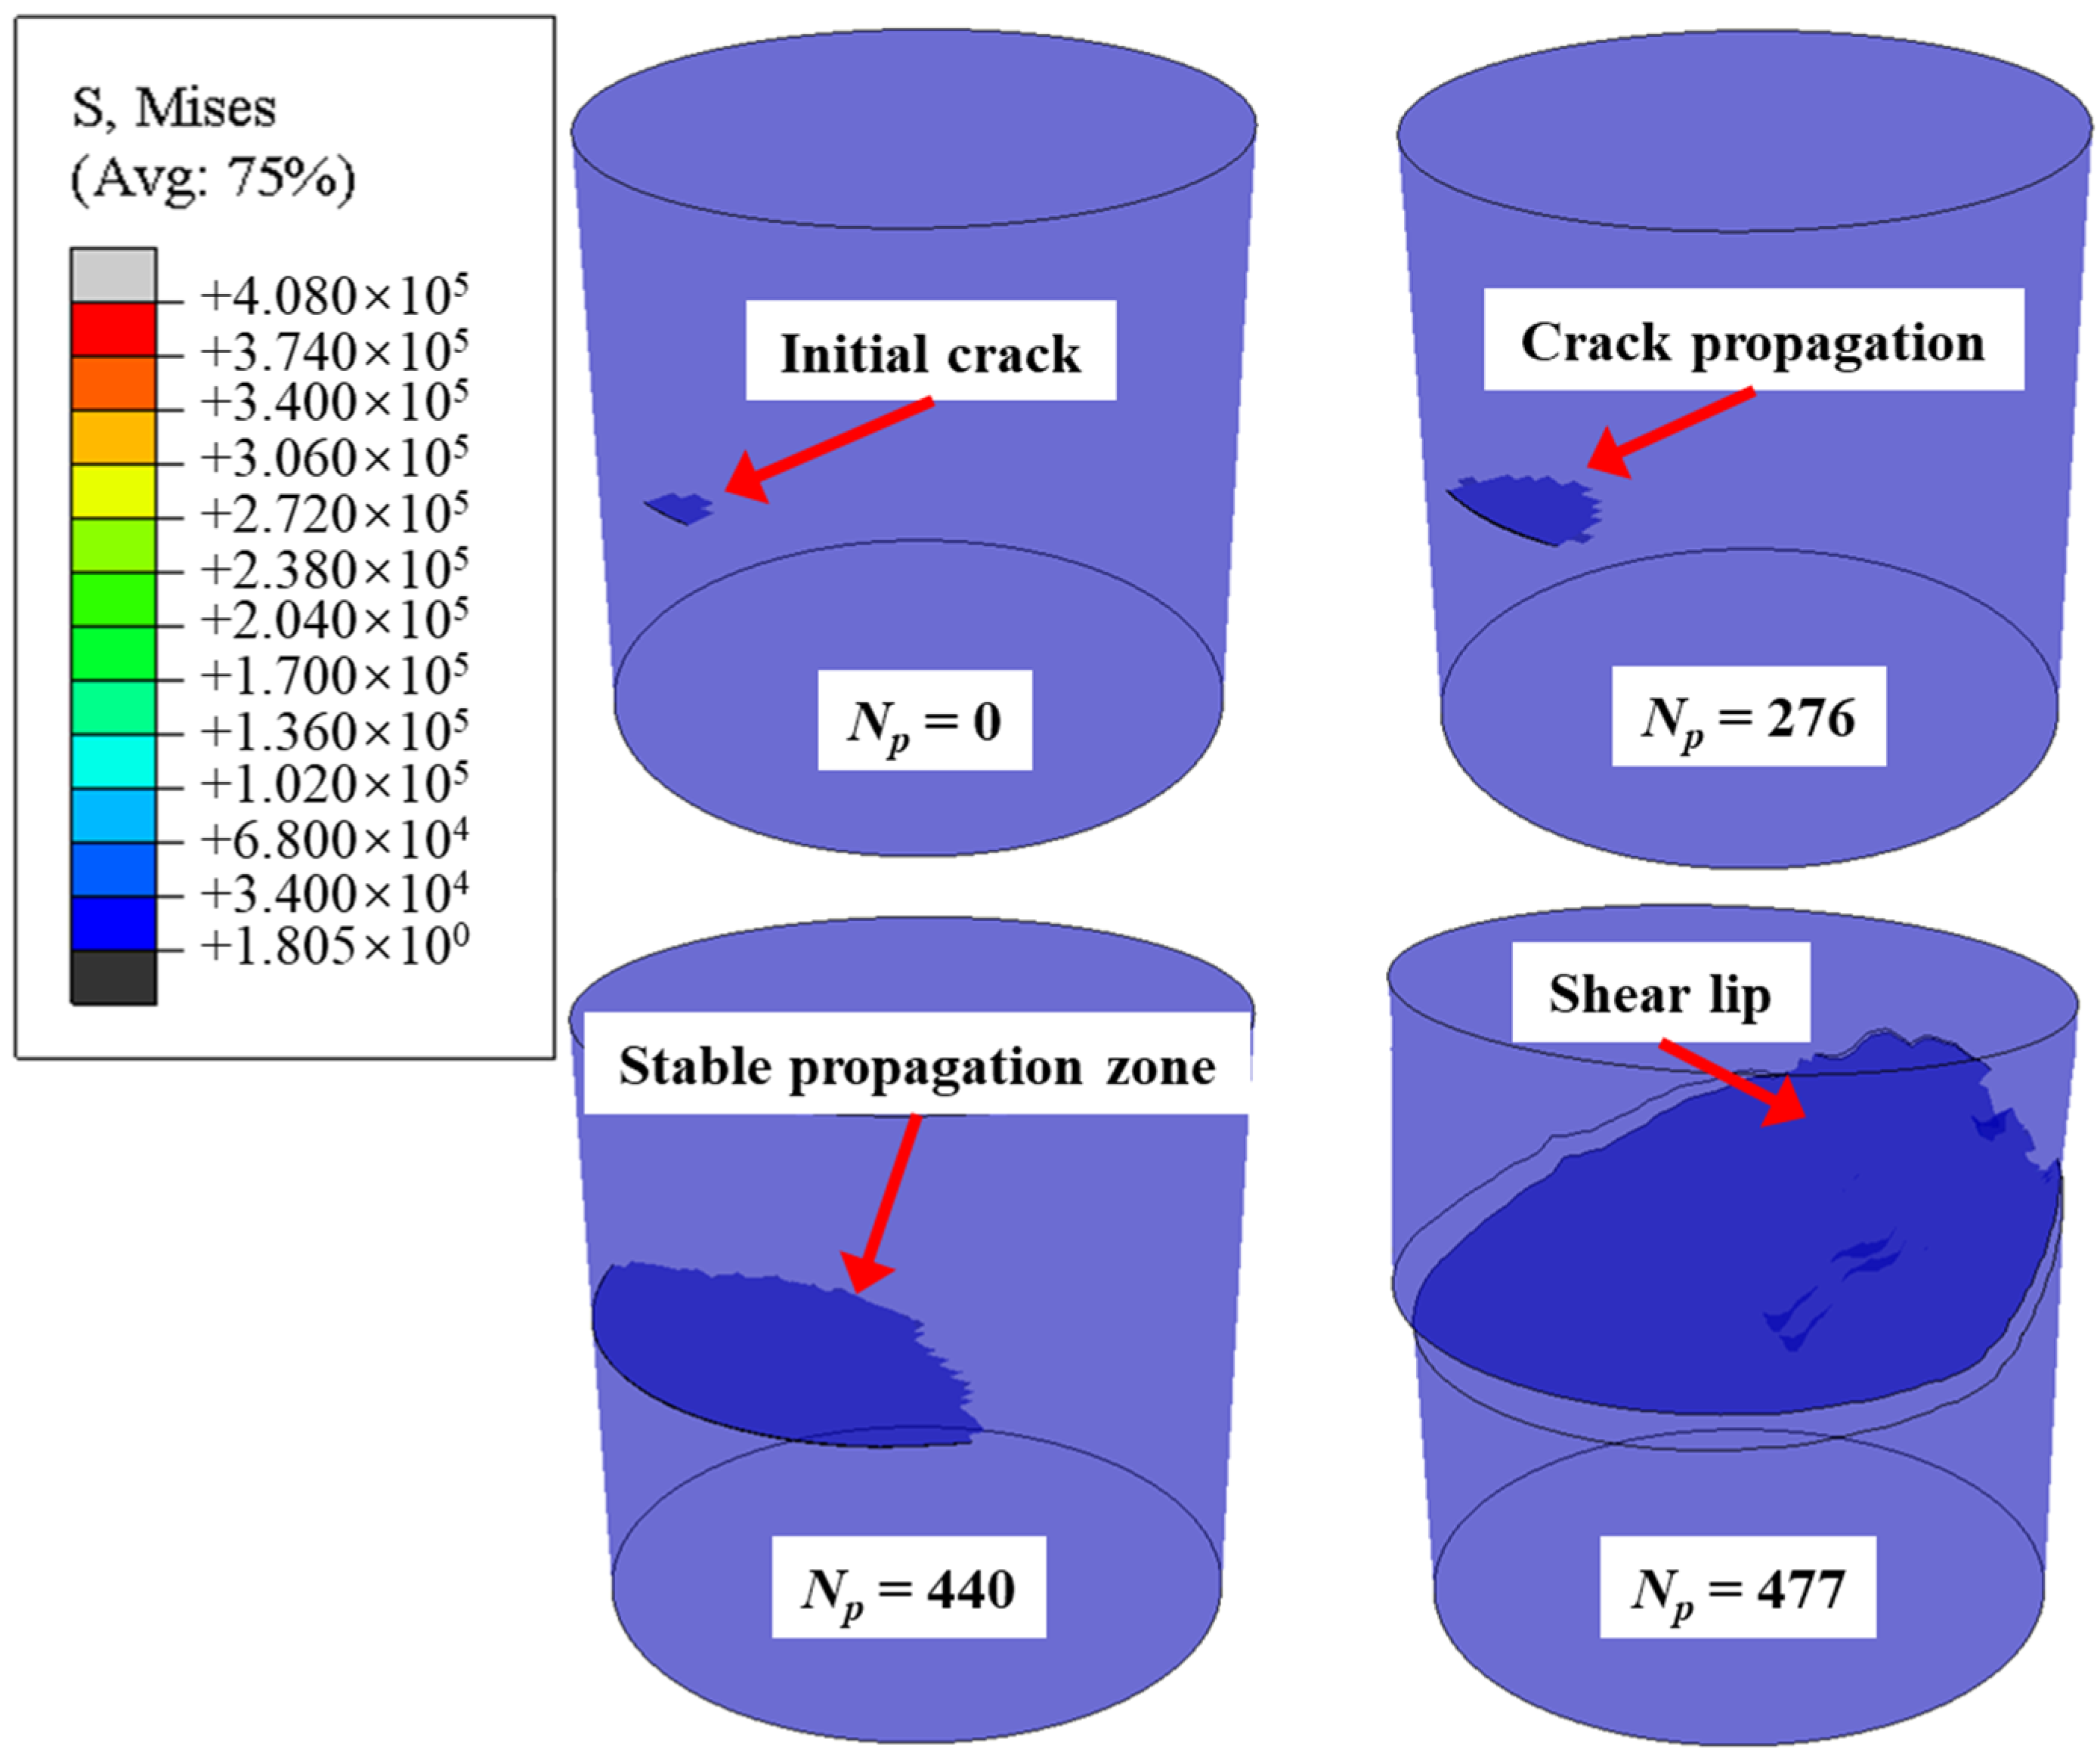
The XFEM model predicted crack propagation life is shown in Figure 20. The crack extended slowly perpendicular to the load at the beginning of the crack propagation stage. This was due to the lower intensity factor. As the crack length increased, the crack propagation accelerated as the stress intensity factor increased. The shear lip formed at the end of the crack propagation was attributed to ductile fracture. The XFEM-predicted crack propagation life Np of Inconel 718 was 477.
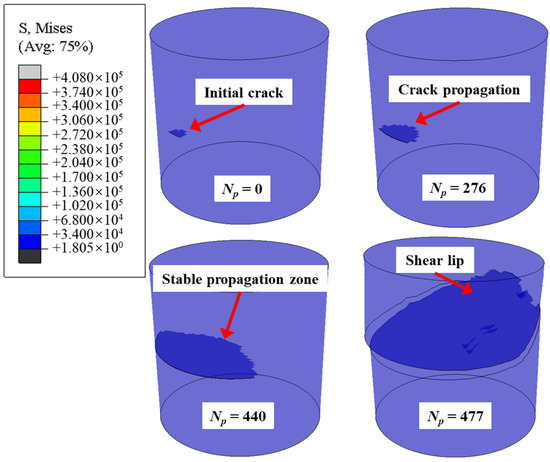
Figure 20.
Crack propagation XFEM analysis of Inconel 718 specimen.
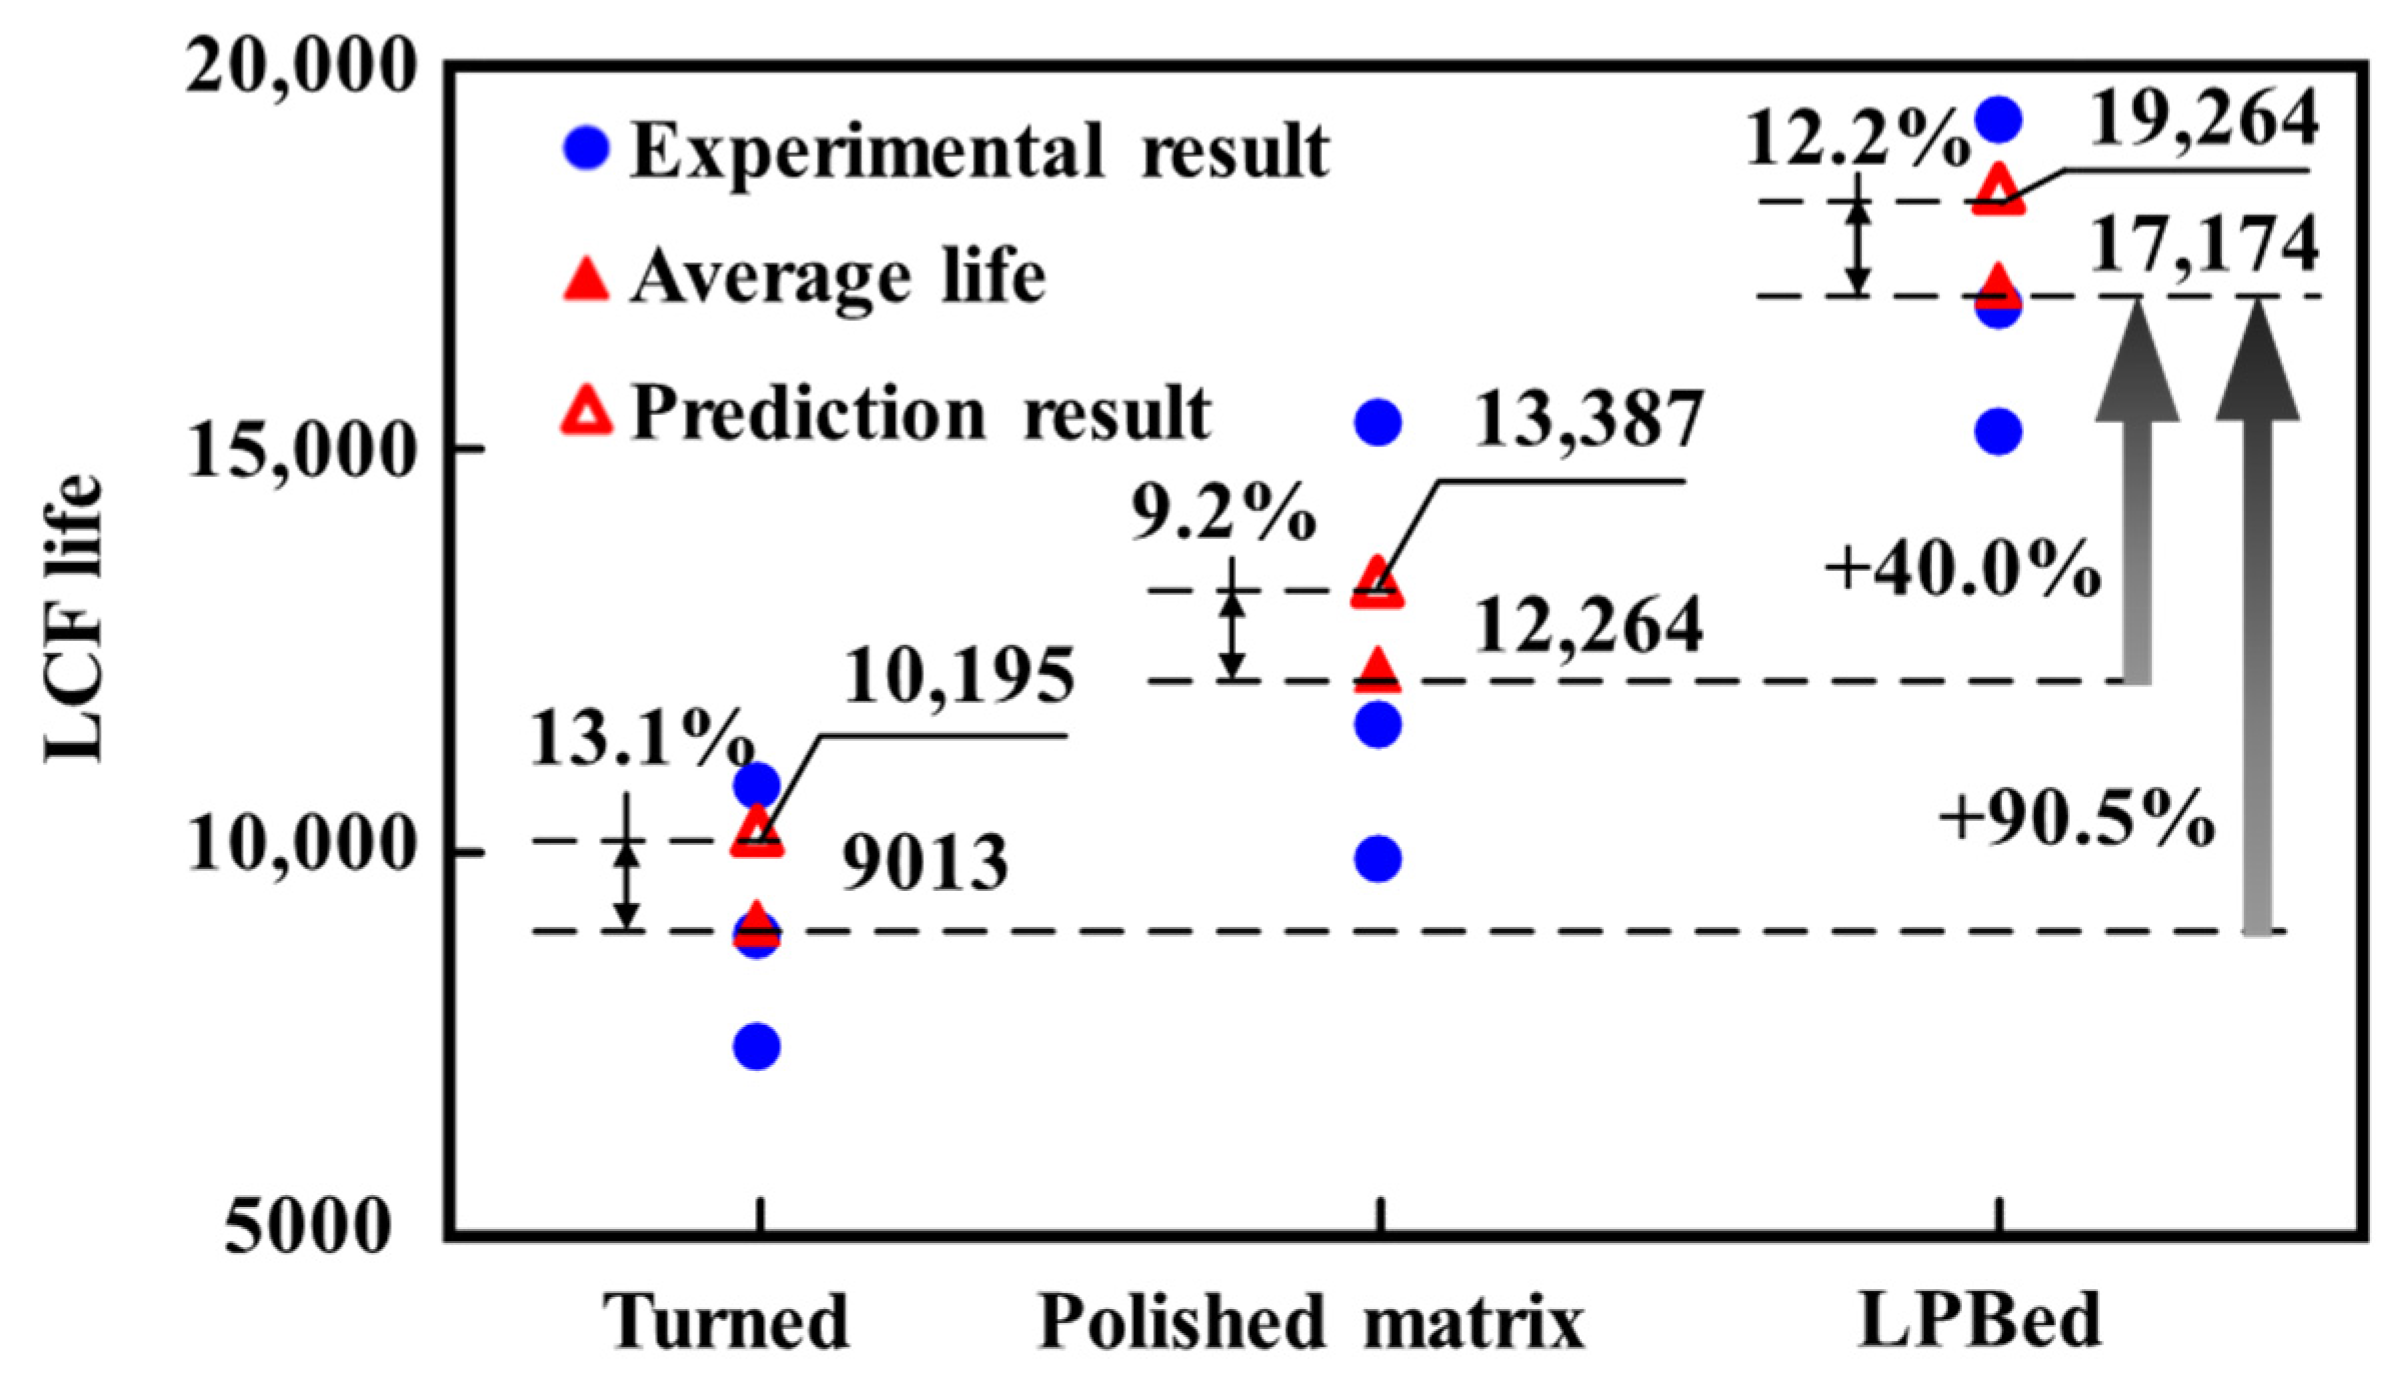
The experimental and FEM predicted results of Inconel 718 LCF life are shown in Figure 21. The average experimental LCF life of the polished matrix specimen was 12,264 cycles. The turned specimen exhibited the lowest average experimental LCF life (9013 cycles), which decreased by 26.5% compared with the polished matrix specimen. It was due to the surface stress concentration induced by turned surface roughness. The average experimental LCF life of the LPBed specimen was the highest (17,174 cycles), which was increased by 40.0% and 90.5% compared with the polished matrix and turned specimen, respectively. It was attributed to the deep compressive residual stress field and low surface roughness induced by the LPB process, which reduced the stress on the specimen surface.
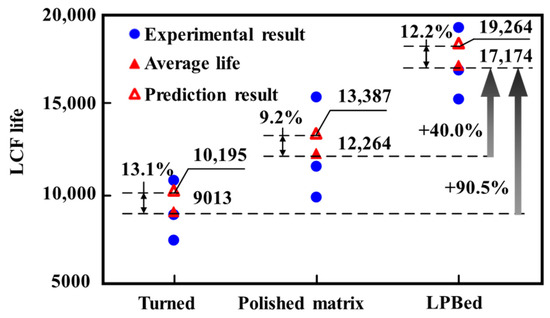
Figure 21.
Experimental and FEM prediction results for Inconel 718 specimens.
The LCF life of Inconel 718 with different surface integrity was predicted by the proposed micro–macro FEM model, as shown in Figure 21. The model predicted LCF life of Inconel 718 was all located within the range experimental results. The respective errors between the prediction and experimental results of the turned specimen, polished matrix specimen, and LPBed specimen were 13.1%, 9.2%, and 12.2%. It suggested that the micro–macro FEM method based on crack initiation and propagation mechanisms can be used to predict the LCF life of Inconel 718 with different surface integrity. Compared with the experimental result, the predicted LCF life by micromacro FEM model was slightly higher. The overestimation of the LCF life was due to the fact that the grain boundary crack was not considered in FEM model.
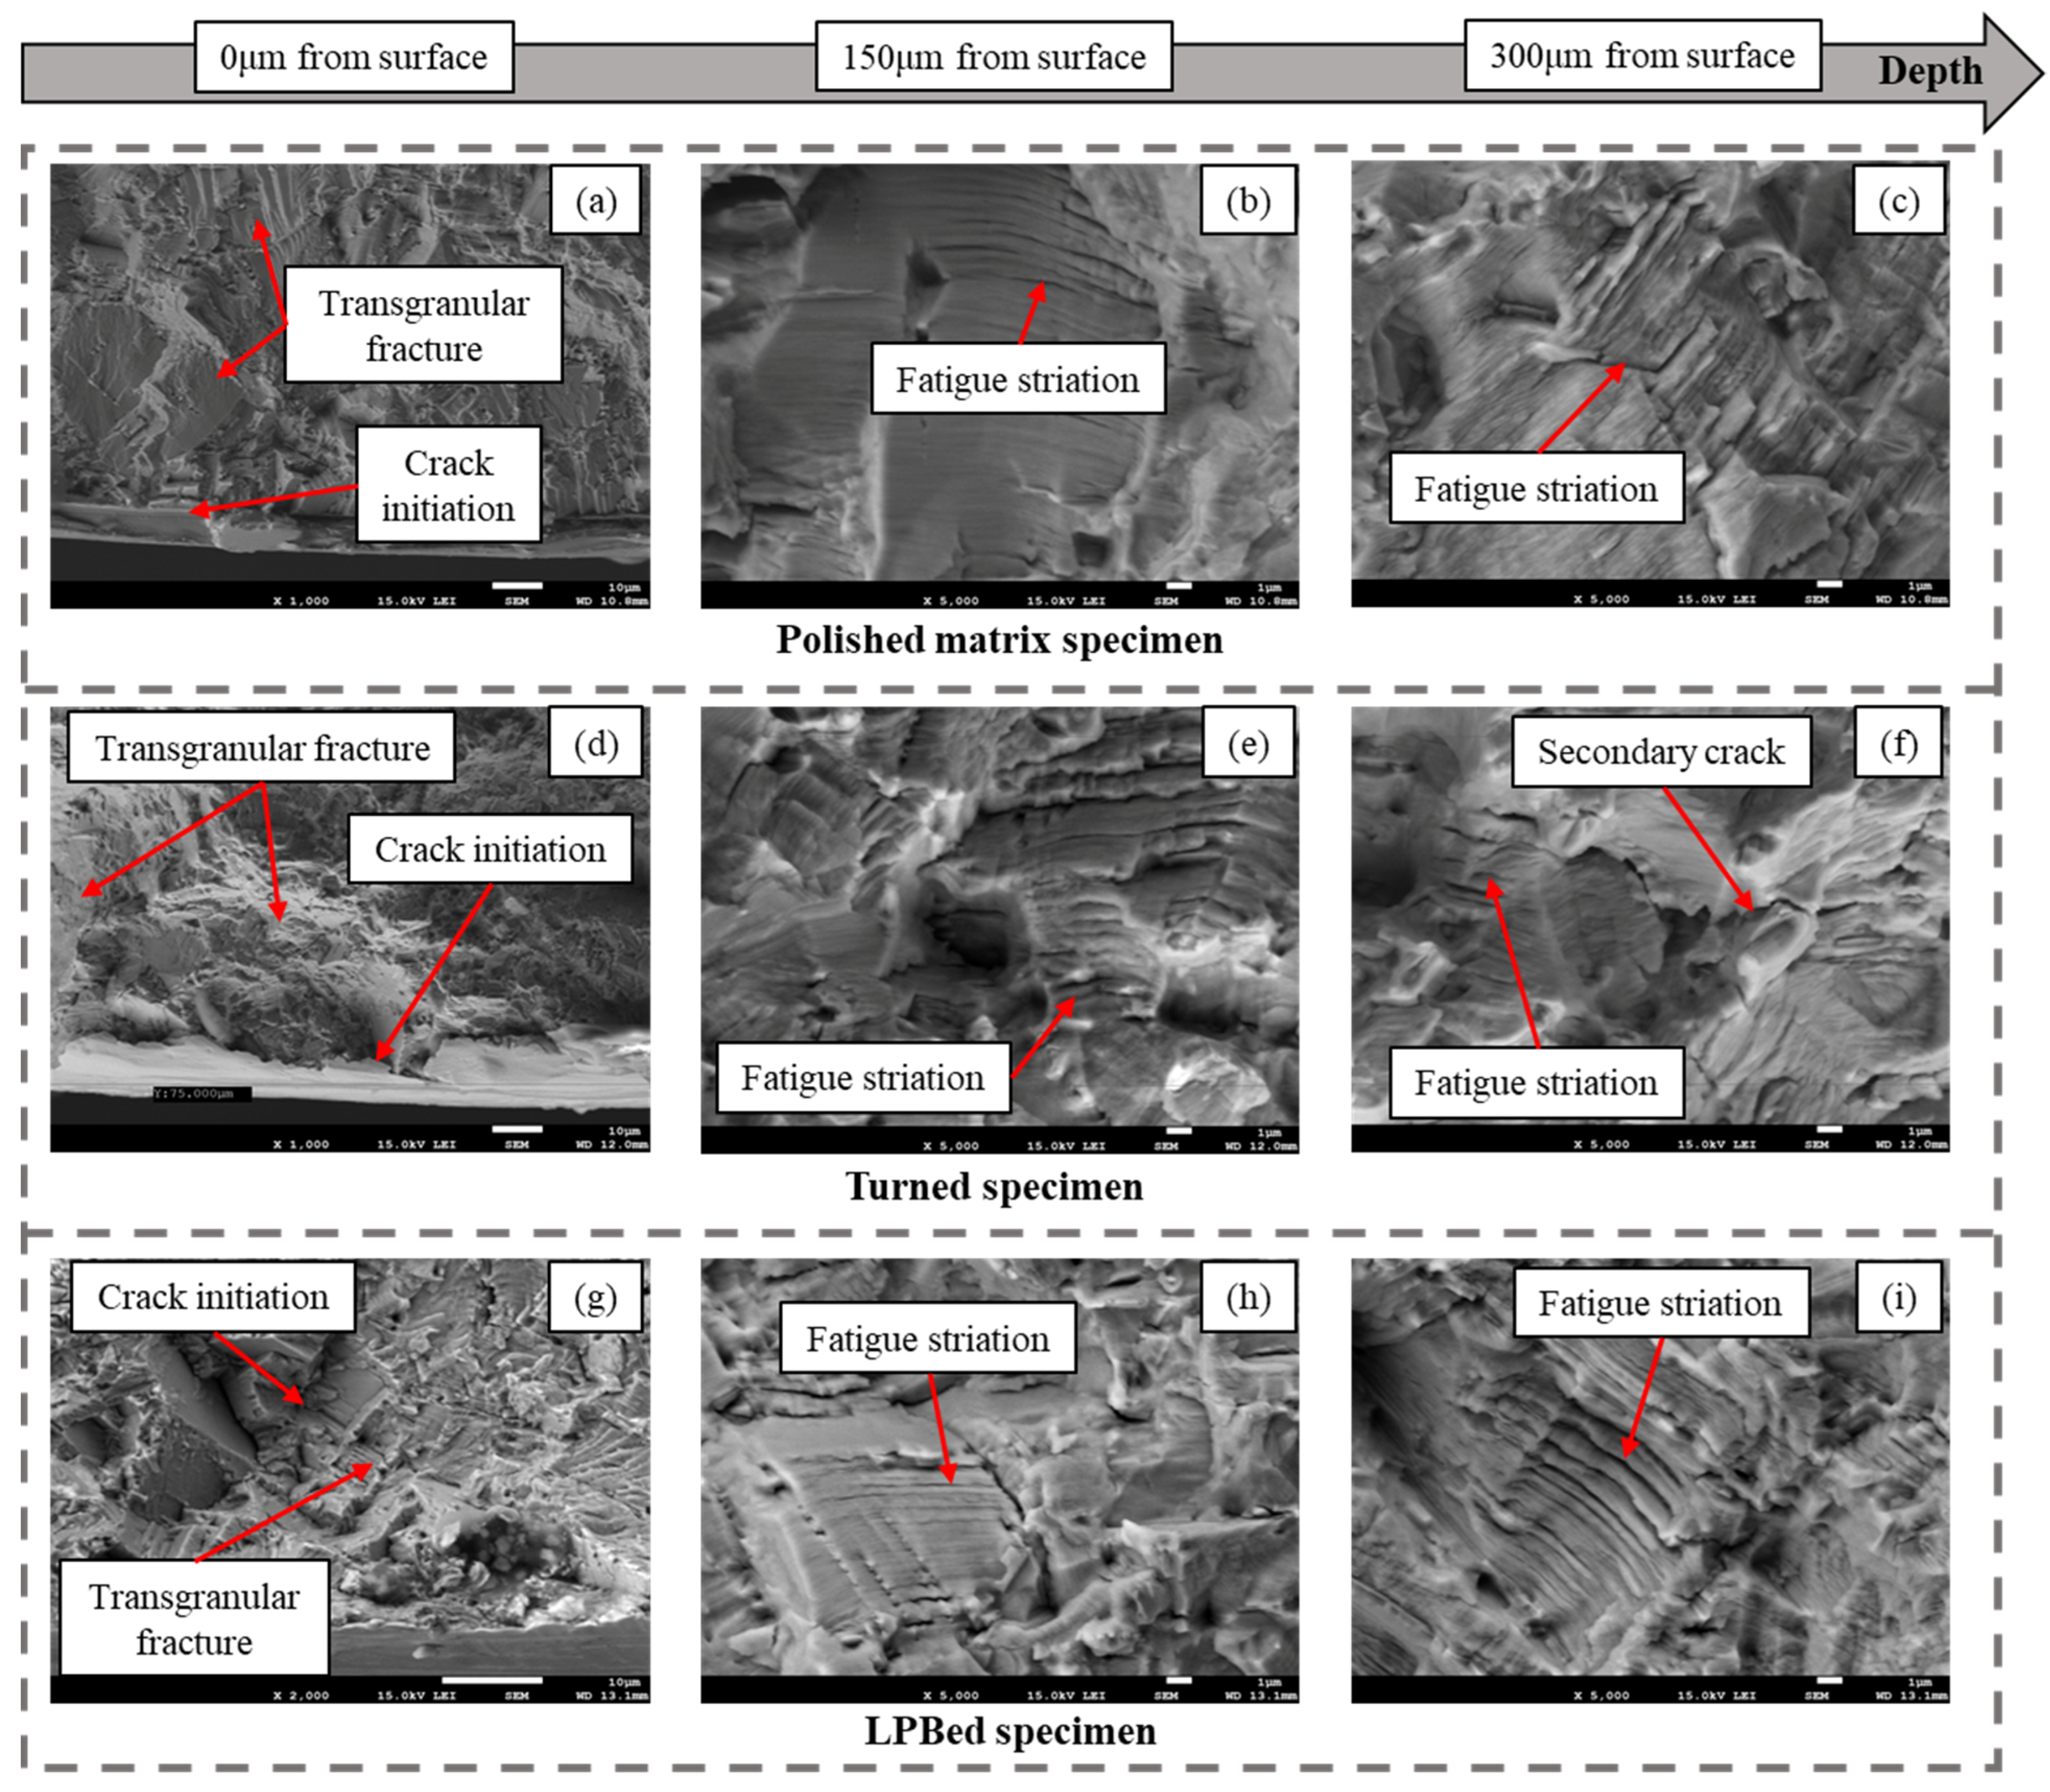
The fracture morphology of the polished matrix specimen, turned specimen, and LPBed specimen is shown in Figure 22. The fracture morphology of the polished matrix specimen is shown in Figure 22a–c. The fatigue crack initiated on the surface of the polished matrix specimen as shown in Figure 22a. The transgranular fracture was observed at the crack initiation area, which was consistent with the macro–micro FEM model prediction. This is due to the lower surface stress concentration of the polished surface. The transgranular fracture and fatigue striation were observed at 150 μm from the surface, as shown in Figure 22b. Fatigue striations perpendicular to the direction of crack propagation were observed in the crack propagation region. Each striation corresponds to one stress cycle, and the width of two adjacent striations represented the advancement of the crack tip in one cycle [40]. The crack propagation rate was calculated by counting fatigue striations per micrometer [41]. The crack propagation rate was calculated as 0.43 μm per cycle by measuring fatigue striation per micron. The propagation rate increased to 0.80 μm per cycle at 300 μm from the surface, as shown in Figure 22c. This was due to the increment of the stress intensity factor with the crack propagating.
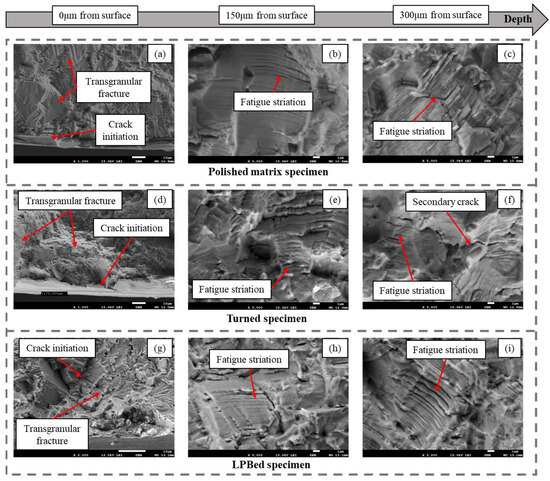
Figure 22.
Fracture surface morphology (a) Polished specimen at surface; (b) Polished specimen at 150 μm from surface. (c) Polished specimen at 300 μm from surface. (d) Turned specimen at surface; (e) Turned specimen at 150 μm from surface. (f) Turned specimen at 300 μm from surface. (g) LPBed specimen at surface; (h) LPBed specimen at 150 μm from surface. (i) LPBed specimen at 300 μm from surface.
The fracture morphology of the turned specimen is shown in Figure 22d–f. As shown in Figure 22d, the fatigue cracks initiated at the surface tool marks, which is consistent with micro FEM simulation results. It was attributed to the high surface stress induced by stress concentration. The stress at tool marks was greater than the stress inside the specimen, which resulted in subsurface crack initiation. As shown in Figure 22e, fatigue streaks were observed at 150 μm from turned surface. The crack propagation rate at 150 μm from the turned specimen was measured at 0.57 μm per cycle. The propagation rate increased to 0.67 μm per cycle when the crack length grew to 300 μm as shown in Figure 22f.
The fracture morphology of the LPBed specimen is shown in Figure 22g–i. As shown in Figure 22g, the crack was initiated at the subsurface of the LPBed specimen, which is consistent with model prediction. The finished surface and compressive residual stress field were induced by the LPB process. The finished surface prevented surface stress concentration, and the compressive residual stress field offset the fatigue load. This resulted in the subsurface crack initiation. The transgranular fracture and fatigue striation was observed at 150 μm from the surface, as shown in Figure 22h. The LPBed specimens showed the densest fatigue striation compared with the other groups, and the crack propagation rate was calculated as 0.32 μm per cycle. The surface crack initiation and propagation were delayed by the lower surface roughness and compressive residual stress field induced by LPB processing. The crack propagation rate at 300 μm from surface was measured as 0.76 μm per cycle as shown in Figure 22i, which was similar to the other groups. This was because the crack propagation at 300 μm was seldom affected by the surface integrity since the crack propagated beyond the surface integrity influence field.
5. Conclusions
In this study, the LCF life of Inconel 718 with different surface integrity was researched using theoretical and experimental methods. The micro–macro FEM model was established based on the fatigue crack initiation and propagation mechanisms. The LCF life of the turned specimen, polished matrix specimen, and LPBed specimen was predicted using the proposed model. The LCF experiment was conducted to validate the proposed model. The conclusions are emphasized as follows:
(1) Compared with the turned specimen, the surface roughness Ry of the LPBed specimen was 77.6% lower, and the maximum compressive residual stress was increased by 57.1%. The compressive residual stress field depth was increased by 2.5 times after LPB processing. LPB process can significantly improve surface integrity after the turning process.
(2) The LCF life of specimens was improved after the LPB process. The LCF life of the LPBed specimens increased by 36.1% compared with the polished matrix specimen, and increased by 90.5% compared with the turned specimen. This was attributed to the low surface roughness and compressive residual stress field induced by the LPB process.
(3) The LCF micro–macro FEM model was combined with Tanaka–Mura dislocation crack initiation theory and XFEM. The established model was applied to predict the LCF life of Inconel 718 specimens with different surface integrity. The LCF life of Inconel 718 specimens with different surface integrity was predicted by the proposed model. The error between the prediction results and the experimental results was 13.1%.
Author Contributions
Conceptualization, P.C. and Z.L.; methodology, P.C. and Z.L.; validation, P.C., Z.L. and J.Z.; formal analysis, P.C. and Z.L.; investigation, P.C. and X.R.; data curation, P.C.; writing—original draft preparation, P.C., X.R. and Z.L.; project administration, Z.L.; funding acquisition, Z.L. All authors have read and agreed to the published version of the manuscript.
Funding
This research was funded by the grants from National Natural Science Foundation of China (No. 52275444), National Natural Science Foundation of China (No. 52205482), National Natural Science Foundation of China (No. 92360311), Natural Science Foundation of Shandong Province (ZR202111150191), and Shandong Province Key Research and Development Plan (2023JMRH0307).
Data Availability Statement
The original contributions presented in the study are included in the article, further inquiries can be directed to the corresponding author.
Conflicts of Interest
The authors declare no conflict of interest.
References
- Vayssette, B.; Saintier, N.; Brugger, C.; Mohamed, E. Surface roughness effect of SLM and EBM Ti-6Al-4V on multiaxial high cycle fatigue. Theor. Appl. Fract. Mec. 2020, 108, 102581. [Google Scholar] [CrossRef]
- Javadi, H.; Jomaa, W.; Songmene, V.; Brochu, M.; Bocher, P. Inconel 718 superalloy controlled surface integrity for fatigue applications produced by precision turning. Int. J. Precis. Eng. Man. 2019, 20, 1297–1310. [Google Scholar] [CrossRef]
- Javadi, H.; Jomaa, W.; Dalgaard, E.; Brochu, M.; Bocher, P. Influence of surface residual stresses on the fatigue life and crack propagation behavior of turned Inconel 718 super-alloy. In MATEC Web of Conferences; EDP Sciences: Les Ulis, France, 2018; Volume 165, p. 18004. [Google Scholar]
- Gao, Y.; Yang, W.; Huang, Z.; Lu, Z. Effects of residual stress and surface roughness on the fatigue life of nickel aluminium bronze alloy under laser shock peening. Eng. Fract. Mech. 2021, 244, 107524. [Google Scholar] [CrossRef]
- Seemikeri, C.Y.; Brahmankar, P.K.; Mahagaonkar, S.B. Improvements in surface integrity and fatigue life of low plasticity burnished surfaces. Int. J. Microstruct. Mater. Prop. 2012, 7, 27–48. [Google Scholar] [CrossRef]
- Ren, X.; Liu, Z.; Liang, X.; Cui, P. Effects of machined surface integrity on high-temperature low-cycle fatigue life and process parameters optimization of turning superalloy Inconel 718. Materials 2021, 14, 2428. [Google Scholar] [CrossRef] [PubMed]
- Madariaga, A.; Garay, A.; Esnaola, J.A.; Arrazola, P.J.; Linaza, A. Effect of surface integrity generated by machining on isothermal low cycle fatigue performance of Inconel 718. Eng. Failure Anal. 2022, 137, 106422. [Google Scholar] [CrossRef]
- Suraratchai, M.; Limido, J.; Mabru, C.; Chieragatti, R. Modelling the influence of machined surface roughness on the fatigue life of aluminium alloy. Int. J. Fatigue 2008, 30, 2119–2126. [Google Scholar] [CrossRef]
- Wu, Z.; Wang, S.; Yang, X.; Pan, L.; Song, Y. Fatigue life prediction for Ni-based superalloy GH4169 considering machined surface roughness and residual stress effects. J. Mec. Theor. Appl. 2021, 59, 215–226. [Google Scholar] [CrossRef]
- Yang, S.; Yang, L.; Wang, Y. Determining the fatigue parameters in total strain life equation of a material based on monotonic tensile mechanical properties. Eng. Fract. Mech. 2020, 226, 106866. [Google Scholar] [CrossRef]
- Li, L.; Zhang, Z.; Zhang, P.; Li, C.; Zhang, Z. Dislocation arrangements within slip bands during fatigue cracking. Mater. Charact. 2018, 145, 96–100. [Google Scholar] [CrossRef]
- He, C.; Wu, Y.; Peng, L.; Su, N.; Li, X.; Yang, K.; Liu, Y.; Yuan, S.; Tian, R. Cyclic deformation and correspondent crack initiation at low-stress amplitudes in Mg–Gd–Y–Zr alloy. Materials 2018, 11, 2429. [Google Scholar] [CrossRef] [PubMed]
- Jablonski, D.A. The effect of ceramic inclusions on the low cycle fatigue life of low carbon astroloy subjected to hot isostatic pressing. Mater. Sci. Eng. 1981, 48, 189–198. [Google Scholar] [CrossRef]
- Alexandre, F.; Deyber, S.; Pineau, A. Modelling the optimum grain size on the low cycle fatigue life of a Ni based superalloy in the presence of two possible crack initiation sites. Scr. Mater. 2004, 50, 25–30. [Google Scholar] [CrossRef]
- Guo, G.; Jiang, W.; Liu, X.; Chen, J.; Li, L.; Wang, J.; Zhang, Y.; Zhang, Z. In-situ SEM-EBSD investigation of the low-cycle fatigue deformation behavior of Inconel 718 at grain-scale. J. Mater. Res. Technol. 2023, 24, 5007–5023. [Google Scholar] [CrossRef]
- Tanaka, K.; Mura, T. A dislocation model for fatigue crack initiation. J. Appl. Mech. 1981, 1, 97–103. [Google Scholar] [CrossRef]
- Brucknerfoit, A.; Huang, X. Numerical simulation of micro-crack initiation of martensitic steel under fatigue loading. Int. J. Fatigue 2006, 28, 963–971. [Google Scholar] [CrossRef]
- Rahim, M.R.A.; Schmauder, S.; Manurung, Y.H.P.; Binkele, P.; Ahmad, M.I.M.; Dogahe, K. Cycle number estimation method on fatigue crack initiation using Voronoi tessellation and the Tanaka Mura model. J. Fail anal. Prev. 2023, 23, 548–555. [Google Scholar] [CrossRef]
- Zhou, J.; Barrett, R.A.; Leen, S.B. A physically-based method for predicting high temperature fatigue crack initiation in P91 welded steel. Int. J. Fatigue 2021, 153, 106480. [Google Scholar] [CrossRef]
- Kramberger, J.; Jezernik, N.; Göncz, P.; Glodež, S. Extension of the Tanaka–Mura model for fatigue crack initiation in thermally cut martensitic steels. Eng. Fract. Mech. 2010, 77, 2040–2050. [Google Scholar] [CrossRef]
- Wang, J.; Zhang, Y.; Liu, S.; Sun, Q.; Lu, H. Competitive giga-fatigue life analysis owing to surface defect and internal inclusion for FV520B-I. Int. J. Fatigue 2016, 87, 203–209. [Google Scholar] [CrossRef]
- Kang, G.; Luo, H. Review on fatigue life prediction models of welded joint. Acta Mech. Sin. 2020, 36, 701–726. [Google Scholar] [CrossRef]
- Singh, I.V.; Mishra, B.K.; Bhattacharya, S.; Patil, R.U. The numerical simulation of fatigue crack growth using extended finite element method. Int. J. Fatigue 2012, 36, 109–119. [Google Scholar] [CrossRef]
- Moës, N.; Dolbow, J.; Belytschko, T. A finite element method for crack growth without remeshing. Int. J. Numer. Meth. Eng. 1999, 46, 131–150. [Google Scholar] [CrossRef]
- Nikishkov, G.P.; Park, J.H.; Atluri, S.N. SGBEM-FEM alternating method for analyzing 3D non-planar cracks and their growth in structural components. Cmes-comp. Model. Eng. 2001, 2, 401–422. [Google Scholar]
- Chopp, D.L.; Sukumar, N. Fatigue crack propagation of multiple coplanar cracks with the coupled extended finite element/fast marching method. Int. J. Eng. Sci. 2003, 41, 845–869. [Google Scholar] [CrossRef]
- Bergara, A.; Dorado, J.I.; Martín-Meizoso, A.; Martínez-Esnaola, J.M. Fatigue crack propagation in complex stress fields: Experiments and numerical simulations using the extended finite element method (XFEM). Int. J. Fatigue 2017, 103, 112–121. [Google Scholar] [CrossRef]
- Naderi, M.; Iyyer, N. Fatigue life prediction of cracked attachment lugs using XFEM. Int. J. Fatigue 2015, 77, 186–193. [Google Scholar] [CrossRef]
- Chen, Z.; Bao, H.; Dai, Y.; Liu, Y. Numerical prediction based on XFEM for mixed-mode crack growth path and fatigue life under cyclic overload. Int. J. Fatigue 2022, 162, 106943. [Google Scholar] [CrossRef]
- Hua, Y.; Liu, Z. Experimental investigation of principal residual stress and fatigue performance for turned nickel-based superalloy Inconel 718. Appl. Sci. 2019, 9, 4750. [Google Scholar] [CrossRef]
- Deng, C.; Liu, G.; Gong, B.; Liu, Y. Fatigue crack initiation life prediction based on Tanaka-Mura dislocation model. Trans. China Weld. Inst. 2021, 42, 30–37. [Google Scholar]
- Zhao, Y.Y.; Nieh, T.G. Correlation between lattice distortion and friction stress in Ni-based equiatomic alloys. Intermetallics 2017, 86, 45–50. [Google Scholar] [CrossRef]
- Glodež, S.; Šori, M.; Kramberger, J. Prediction of micro-crack initiation in high strength steels using Weibull distribution. Eng. Fract. Mech. 2013, 108, 263–274. [Google Scholar] [CrossRef]
- Ou, C.; Voothaluru, R.; Liu, C.R. Fatigue crack initiation of metals fabricated by additive manufacturing—A crystal plasticity energy-based approach to IN718 life prediction. Crystals 2020, 10, 905. [Google Scholar] [CrossRef]
- Wang, X.; Huang, C.; Zou, B.; Liu, G.; Zhu, H.; Wang, J. Experimental study of surface integrity and fatigue life in the face milling of Inconel 718. Front. Mech. Eng. 2018, 13, 243–250. [Google Scholar] [CrossRef]
- Itoga, H.; Tokaji, K.; Nakajima, M.; Ko, H.N. Effect of surface roughness on step-wise s–n characteristics in high strength steel. Int. J. Fatigue 2003, 25, 379–385. [Google Scholar] [CrossRef]
- Arola, D.; Williams, C.L. Estimating the fatigue stress concentration factor of machined surfaces. Int. J. Fatigue 2002, 24, 923–930. [Google Scholar] [CrossRef]
- Yadollahi, A.; Mahmoudi, M.; Elwany, A.; Doude, H.; Bian, L.; Newman, J.C., Jr. Fatigue-life prediction of additively manufactured material: Effects of heat treatment and build orientation. Fatigue Fract. Eng. Mater. Struct. 2020, 43, 831–844. [Google Scholar] [CrossRef]
- Cai, W. Effect of Long-Term Aging on Microstructure Evolvement and Fatigue Crack Growth Behavior of GH4169 Alloy. Master’s Thesis, Northeastern University, Shenyang, China, 2015. [Google Scholar]
- Zhao, X.; Zhou, H.; Liu, Y. Effect of shot peening on the fatigue properties of nickel-based superalloy GH4169 at high temperature. Results Phys. 2018, 11, 452–460. [Google Scholar] [CrossRef]
- Hua, Y.; Liu, Z.; Wang, B.; Hou, X. Surface modification through combination of finish turning with low plasticity burnishing and its effect on fatigue performance for Inconel 718. Surf. Coat. Technol. 2019, 375, 508–517. [Google Scholar] [CrossRef]


Disclaimer/Publisher’s Note: The statements, opinions and data contained in all publications are solely those of the individual author(s) and contributor(s) and not of MDPI and/or the editor(s). MDPI and/or the editor(s) disclaim responsibility for any injury to people or property resulting from any ideas, methods, instructions or products referred to in the content. |
© 2024 by the authors. Licensee MDPI, Basel, Switzerland. This article is an open access article distributed under the terms and conditions of the Creative Commons Attribution (CC BY) license (https://creativecommons.org/licenses/by/4.0/).