Review

Evolution of Microstructure and Crystallographic Texture in Deformed and Annealed BCC Metals and Alloys: A Review

by
Vipin Tandon
1,†,
Ki-Seong Park
2,†,
Rajesh Khatirkar
3,
Aman Gupta
2,* and
Shi-Hoon Choi
2,*
1
Center of Sustainable Built Environment, Manipal School of Architecture and Planning, Manipal Academy of Higher Education, Manipal 576104, India
2
Department of Advanced Components and Materials Engineering, Sunchon National University, Suncheon 57922, Republic of Korea
3
Department of Metallurgical and Materials Engineering, Visvesvaraya National Institute of Technology (VNIT)-Nagpur, Nagpur 440010, India
*
Authors to whom correspondence should be addressed.
These authors contributed equally to this work.
Metals 2024, 14(2), 149; https://doi.org/10.3390/met14020149
Submission received: 18 December 2023 / Revised: 16 January 2024 / Accepted: 22 January 2024 / Published: 25 January 2024

Abstract

:
Dislocation slips, twinning, shear banding (SBs), strain localization, and martensite formation are a few deformation modes that are activated in BCC metals and alloys. Strain, strain rate, and deformation temperature are other parameters that determine the activation of deformation modes in BCC alloys. This review focuses on several BCC alloys, such as beta-titanium (β-Ti), tantalum (Ta), and ferritic stainless steels (FSSs), all of which exhibit differences in deformation behavior. These alloys often undergo thermo-mechanical processing (TMP) to enhance their mechanical properties. TMP leads to the evolution of deformation-induced products, such as SBs, strain-induced martensite (SIM), strain localizations, and mechanical/deformation twins (DTs) during plastic deformation, while also influencing crystallographic texture. The deformation modes in β-Ti depend upon the stability of the β-phase (i.e., β-stabilizers); low-stability alloys show the formation of SIM along with slips and twins, whereas in highly stable β-Ti alloys, only slip+twin modes are observed as the primary deformation mechanisms. In the case of Ta, slip activity predominantly occurs on {110} planes, but it can also occur on planes with the highest resolved shear stress. The breakdown of Schmid’s law or non-Schmid behavior for Ta and Ta-W alloys has been discussed in detail. The cold rolling (CR) of FSSs results in the formation of ridges, which is an undesirable phenomenon leading to very low formability. The microstructures of the rolled sheets consist of elongated ferrite grains with in-grain SBs, which are preferentially formed in the γ-fiber-oriented grains. The formation of finer grains after recrystallization improves both the mechanical properties and ridging resistance in FSS. Therefore, this review comprehensively reports on the impact of TMP on the microstructural and crystallographic texture evolution during the plastic deformation and annealing treatment of β-Ti, Ta alloys, and FSSs in BCC materials, using results obtained from electron microscopy and X-ray diffraction.

1. Introduction

Structural materials are the basic building blocks underpinning day-to-day life activities. Whether discussing everyday transportation or construction, these materials are extensively used [1]. They are valued for their high mechanical strength along with good formability. Based on crystal structure, body-centered cubic (BCC) and face-centered cubic (FCC) are two commonly used grades of structural materials. This review work provides a detailed discussion about BCC materials (beta-titanium (β-Ti), ferritic stainless steel (FSS), and tantalum (Ta) alloys), characterized by high strength, high impact toughness, good fatigue properties and excellent corrosion resistance [2]. These features make BCC metals/alloys suitable for various applications in the aerospace, aircraft, ship building, and armaments industries [3,4]. The mechanical and chemical properties of these alloys are strongly related to the microstructure and crystallographic texture. Prior to delving into the details of each material, the authors will provide an overview of the content in this review work. This review is systematically compiled, focusing on discussing the deformation microstructure and the evolution of crystallographic texture in the aforementioned BCC alloys. Subsequently, the authors also aim to elucidate the annealed microstructure and its correlation with recrystallization texture.
Beta-titanium (β-Ti) alloys possess excellent cold formability and room-temperature ductility, and are attractive structural materials due to their high strength and good corrosion resistance [5]. They are also known for their lightweight, high-strength properties and have a wide range of applications in the aerospace, marine, and chemical industries [6]. These alloys consist of a single body-centered cubic (BCC) phase microstructure; however, new phases such as orthorhombic martensite (α″), hexagonal close-packed (HCP) martensite (α′) or HCP omega (ω) are formed when subjected to plastic deformation and/or heat treatment [7]. The consideration of the β-transus temperature is crucial when heating β-Ti alloys; above this temperature, there is a complete β-phase, whereas heating below it causes the evolution of α and β phases [8]. Similarly, the cooling rate also affects the microstructure; a very fast cooling rate causes the diffusionless transformation from β→α″, whereas the low-temperature aging of deformed β-Ti alloys leads to the evolution of ω and α phases [9]. The literature indicates that microstructure and crystallographic texture evolution in β-Ti alloys after heat treatment depend on the heating temperature range and cooling rates [10]. This review work aims to discuss the evolution of deformation-induced microstructure (such as α″, mechanical twins, ω and slip) along with the evolution of deformation texture in β-Ti alloys. Discussions based on heat-treated microstructures and crystallographic texture for different grades of β-Ti alloys are reported in subsequent sections.
Tantalum (Ta) possesses excellent chemical, physical, and biomedical properties, making it suitable for medical components [11]. Ta metals have an ultra-high stacking fault energy (SFE) of 220 mJ/m2 [12]. Due to its excellent RT ductility, Ta is used for the cold forming of intricate parts, minimizing potential damage. These characteristics enhance the use of Ta alloys in the military, electronics, medical, and aerospace industries [13,14]. Ta’s properties can also be achieved through the addition of solute elements. The introduction of tungsten (W) into Ta forms a single-phase substitutional solid solution in Ta-W alloys [15]. Ta-W alloys offer the means to tailor and optimize high-temperature properties, corrosion resistance, and mechanical characteristics [15,16]. It has been revealed that the addition of W enhances yield strength and the work hardening rate because of the increased dislocation friction stress [17,18]. Hence, W has the potential to influence the deformation texture and microstructure of Ta and Ta-W alloys. As a result, numerous studies have been undertaken to investigate these aspects comprehensively [19,20]. Ta and Ta-W alloys are typically produced as thin sheets/foils and tubes for application purposes. The gradient distribution of heat flow during solidification causes an inhomogeneous microstructure and grain size (GS) distribution that can reach up to millimeter or centimeter scales. Hence, further thermo-mechanical processing (TMP) is required to achieve uniform and fine grains with the required properties for final products. The effect of strain path, severe plastic deformation, and deformation-induced products on the deformed and annealed microstructure of Ta alloys are discussed in a subsequent section based on the results obtained from electron backscatter diffraction (EBSD) techniques.
Further, in recent years, another BCC material, ferritic stainless steels (FSSs), has gained prominence in applications such as home appliances, medical devices, automobile exhaust systems, railway transport equipment, mining machinery, etc. [21,22]. These alloys are known for their high strength and toughness, good weldability, good corrosion resistance, and high thermal conductivity [23,24]. Moreover, the absence of nickel (Ni) in FSS makes the material more economical compared to other types of stainless steels. There has been the development of a new category of heat-resistant FSS alloys containing alloying elements such as Nb, Ti, and Mo, intended to replace 304 austenitic stainless steels (ASS) in various environments, specifically in automobile vent pipes, where exceptional corrosion resistance and formability are necessary [25,26]. However, the addition of these alloying elements can result in the formation of precipitates such as TiC, TiN, and NbC in the form of carbides and nitrides, especially in super-FSS (as it contains a higher content of Cr and Mo) [27]. This review discusses the effects of rolling deformation, grain size (GS), and heating temperature on the microstructure and texture of various grades of FSS. It systematically addresses the formation of intermetallics and ridging based on heat-treatment temperature and strain, respectively.
The energy released during the recovery and recrystallization processes is an important aspect during the annealing of deformed samples [28]. Studies on various metals like Cu, Ni, and Fe have highlighted that recrystallization is the dominant process responsible for releasing stored energy [29]. However, findings from Deng et al. [30] demonstrated that recovery, rather than recrystallization, is a prolonged process and releases the majority (approximately 70%) of the total stored energy. Previous studies [31] have reported that several factors, including strain, annealing temperature, and the material’s nature can influence the extent of recovery. Among these factors, the SFE is particularly important. Metals with low SFE, such as copper, austenitic stainless steel, and brass, exhibit minimal recovery of the dislocation structure before recrystallization due to difficulties in dislocation climb [32]. Conversely, metals with high SFE, like aluminum and iron, where dislocation climb is more rapid, exhibit significant recovery during the heating process. Ta has a higher SFE compared to aluminum and iron [12]. Also, the degree of recovery is significantly influenced by the purity of materials.
The present review work covers a wide range of microstructure and crystallographic texture evolution in different grades of BCC metals/alloys. Of course, differences can also be observed by changing the strain, strain rate, annealing time and temperature either during deformation or annealing treatment. The authors also discuss the evolution of secondary phases (or precipitates) in β-Ti and FSS alloys and their effect on further physical and chemical properties. For example, the formation of Laves phases, NbC, TiN, and sigma (σ) phase in 27Cr–4Mo–2Ni super-FSS affects the recrystallization phenomena [22,33]. It has been observed that if careful selection of annealing temperature has not been made, there is a chance of forming the α-phase in metastable β-Ti alloys, which restricts RT deformation [8,34]. FSS also suffers from the unwanted ridging phenomenon during forming, which significantly affects the surface finish of the product. Optimum TMP can reduce the ridge formation, which is discussed in the discussion section. The authors studied previous review works on BCC metals/alloys published over time and discussed important features related to microstructure, deformation, softening mechanisms, texture evolution, etc. Taylor discussed deformation at high temperatures (dislocation glides) in BCC metals/alloys, published long ago in 1992 [35]. The discussions were not based on their microstructures due to limitations in electron microscopy. Similarly, Reid discussed the correlation between brittle fracture and mechanical twinning in BCC materials back in 1981 [36]. Four conclusions were made after reviewing various deformation conditions: (1) twinning and brittle fracture are independent responses of a material to stress; (2) twins are nucleated by a propagating crack; (3) twins nucleate cracks, which may or may not continue to propagate and cause failure; and (4) twins provide a preferred path for the growth of cracks [36]. Liu et al. [37] reported on the mechanical properties at RT and high temperatures of BCC high-entropy alloys prepared by different processes (including vacuum arc-melting, powder sintering and additive manufacturing). Liu et al. also compared the effect of alloying on the mechanical properties of BCC alloys [37]. However, this study also had limited discussions about deformation-induced products (DIPs) and orientation microscopy. The present review work provides a detailed discussion on the deformation mechanisms in β-Ti and Ta alloys in the discussion sections. This review attempts to address deformation microstructural observation via electron microscopy. Grain boundary characteristics, static and dynamic softening behavior, and microstructural heterogeneities are discussed in detail for the given BCC alloys. Various TMP routes have been developed for β-Ti, Ta, and FSS alloys to improve their mechanical properties and formability, which also have a strong correlation with their crystallographic texture. Hence, the subsequent sections discuss various types of microstructures and texture evolution in BCC metals/alloys.

2. Beta-Ti Alloys

β-Ti alloys are known for their excellent corrosion resistance, biocompatibility (in Ti-Nb alloys), and high strength-to-weight ratios, and some grades have a relatively low Young’s modulus (E). These favorable properties have led to the use of these alloys in the automotive, aerospace, biomedical, and industrial sectors [34]. To develop the final products, β-Ti alloys are subjected to different TMP after casting. TMP includes various processes, such as the homogenization of cast ingots, hot (HR)/cold rolling (CR), heating the alloys to different temperatures (above and below the β-transus temperature) followed by final CR deformation, and aging treatment [38]. It is well documented that phase stability in Ti alloys depends on their composition or alloy additions, since α-Ti consists of α-stabilizers (Al, N, O, Sn) and β-Ti consists of β-stabilizers (V, Nb, Cr, Fe, Mo) [39,40]. Based on the alloy’s constituents, β-Ti alloys are further divided into near β, metastable β, and stable β-Ti alloys. A high fraction of β-stabilizers stabilizes the BCC microstructure even at RT, whereas a decrease in the fraction of β-stabilizers may develop α-phase within the β-matrix. Ti-4Al-7Mo-3Cr-3V (Ti-4733) [41], Ti-7Mo-3Nb-3Cr-3Al (Ti-7333) [42], Ti-5Al-4Zr-8Mo-7V (Ti-5487), and Ti-15Nb-5Zr-4Sn-1Fe (Ti-15541) [43] are a few β-Ti alloys possessing high strength, a low Young’s modulus (E), fatigue resistance, high toughness, and superplasticity. Plastic deformation such as uniaxial tension/compression, or the hot/CR of various β-Ti alloys triggers complex deformation mechanisms in the β-matrix [44]. These are associated with the evolution of deformation-induced products such as dislocations/sub-grain formation, stress-induced phase transformation (β→α″ (SIM) and β→ω), deformation twins, and kink bands [45]. Annealing treatment is another method to develop different types of microstructures in deformed β-Ti alloys. Usually, shear bands (SBs), strain-induced martensite (SIM, α″), and deformed grain boundaries (GBs) are regions of high stored energy and hence preferential nucleation starts at these locations [46,47].

2.1. Deformed Microstructure and Texture Evolution

The low-strain-rate deformation of metallic materials often involves mechanisms of slip and twinning deformation. Dislocation slip bands were observed at low strain rates when deforming β-Ti alloys [48,49]. During the tensile loading of two-phase Ti alloy [50], it was found that fracture was initiated at GBs, and GB sliding through dislocation slip was responsible for intergranular cracks at slow strain rates. On the other hand, at high strain rates (>103 s−1) most metallic material failures are associated with the formation of adiabatic SBs. The compressive deformation (10−3 s−1 and 103 s−1) behavior of a solution-treated Ti-25Nb-3Mo-2Sn-3Zr alloy (near β-Ti alloy) was studied in [51]. The evolution of adiabatic SBs, α″ martensite, and slip bands inside the β-matrix were observed. The α″ martensite phase consisted of fine needle twinned domains intersecting each other at 120° or 90° [51].
In another study, the deformation mechanism of uniaxially compressed (3%-35% reduction) Ti-4Al-7Mo-3V-3Cr (wt.%, Ti-4733) was studied using microstructural and X-ray diffraction (XRD) analysis [52]. The formation of stress-induced martensite (SIM (α″); Figure 1a,b) and mechanical twins were observed in the compressed Ti-4733 samples. The evolution of two types of SIM was reported: primary α″ and secondary α″ [53]. Micrographs in Figure 1a,b show the positions of these SIMs. A 20% compressed sample showed some secondary thin α″ laths emerging between the primary α″ [52]. The secondary α″ appears in the microstructure with a higher level of deformation straining, as was also discussed in [51]. The effect of β grain size (GS) on the SIM fraction was observed, in which results showed that in a given GS, the volume fraction of SIM initially increases intensively and then saturates [52]. It was found that with an increase in GS from 150 μm to 250 μm (Figure 1c,d), the volume fraction of α″ increased, while a further increase in GS up to 500 μm led to a decrease in SIM volume fraction [52].
RT rolling/CR leads to the evolution of various deformation-induced products as well as development of α- and γ-fiber texture components. These are well-known texture fibers, in which <100>//RD refers to an α-fiber and <111>//ND indicates a γ-fiber texture. In the case of Ti-15V-3Al-3Sn-3Cr alloys (Ti-15333), unidirectional rolling (UDR) leads to strong α- and γ-fiber textures, whereas multistep cross-rolling (MSCR) shows a strong rotated cube component {100}<110> [54]. Lan et al. [55] reported the texture evolution in cold-rolled Ti-32.5Nb-6.8Zr-2.7Sn biomedical β-Ti alloy. The transition from an α-fiber texture to γ-fiber texture took place during 90% CR. With the increase in the reduction ratio (RR), an increase in micro-strain, dislocation density, and grain refinement was observed [55]. The formation of SBs in an 85% cold-rolled Ti-35Nb alloy was reported in [56]. Its crystallographic texture shows that the β phase had a BCC rolling texture combination of a cube {100}<001>, and rotated cube, with a strong α-fiber and weak γ-fiber texture at low RRs (<65%), whereas the 85% rolled sample showed a strong γ-fiber and weak α-fiber texture [56]. In another study, Cojocaru et al. [57] reported crystallographic texture evolution in a Ti-29Nb-9Ta-10Zr alloy after cold-rolling with different amounts of RR, up to 60%. The major texture components developed during cold-rolling were γ-fiber, {112}<111>, {001}<010> and {010}<001> texture components [57]. A decrease in Young’s modulus (E) after different cold-rolling was observed, which was mainly due to the α″ phase formation. At 60% RR, an E close to 45 GPa was obtained, coupled with an average Vickers microhardness close to 279 Hv [57].
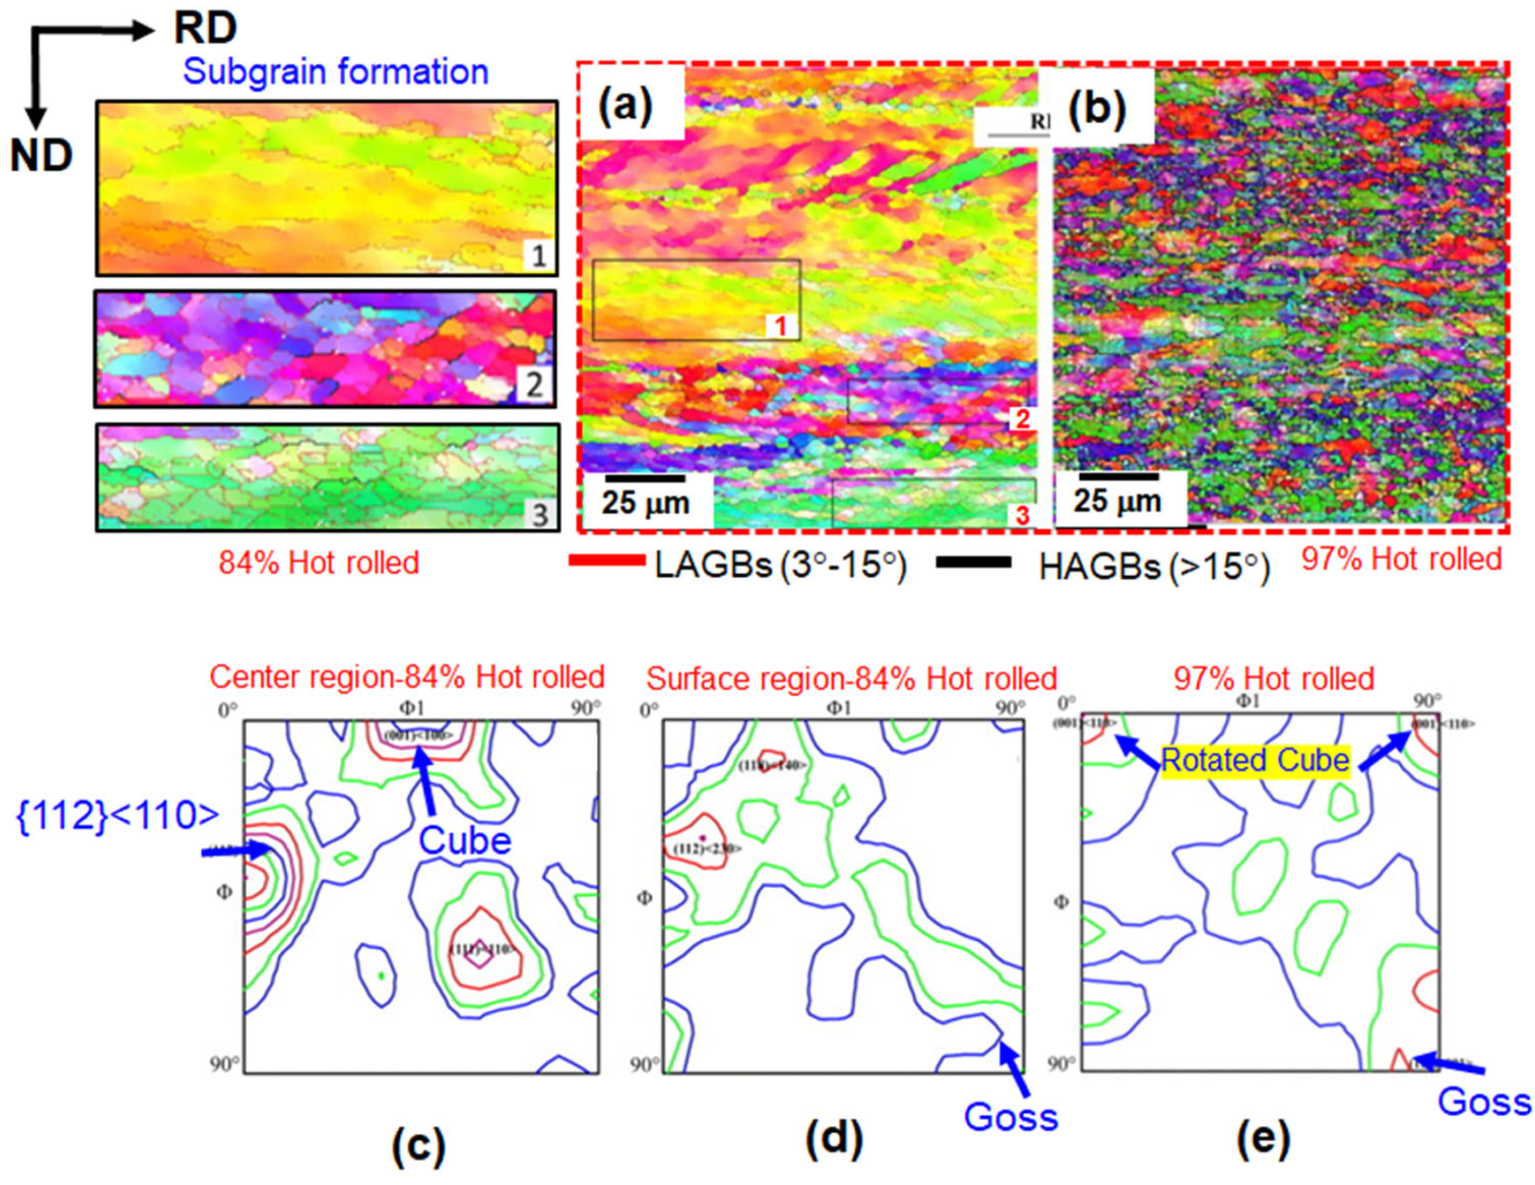
In contrast to CR, where only external stresses induce plastic deformation, hot rolling involves the additional factor of temperature. Hence, differences in microstructural and crystallographic texture can be observed between hot-rolled and cold-rolled conditions. In one such study, heterogeneities in the crystallographic texture evolution in a Ti-15Mo-3Al-2.7Nb-0.2Si alloy were observed during hot-rolling (84 and 97% RR) [58]. The development of shear strain in the surface region leads to weakening of texture intensity, which in turn gives rise to significant through-thickness texture gradients. Dynamic recrystallization (DRX), during hot-rolling, occurs and weakens the deformation texture [58]. The mechanism of the formation and evolution of the DRX grains in 84% and 97% RR, revealed by IPF maps, is shown in Figure 2a,b. Figure 2a shows that the DRX grains tend to form along original GBs and at triple junctions during the deformation process up to 84% RR. Many subgrains with low-angle grain boundaries (LAGBs, 3–15°) in the deformed matrix were formed during hot rolling, as shown in the magnified view of the area under black rectangles in Figure 2a. Small-sized grains surrounded by LAGBs were formed at 84% RR, and further deformation up to 97% RR caused the evolution of even more LAGBs/subgrain structures, rotating them to form separate grains surrounded by high-angle grain boundaries (HAGBs, >15°) [58]. A significant DRX microstructure was observed after 97% RR, as shown in Figure 2b.
The measured volume fraction of DRX grains was about 10.4% for the 84% RR and 78.6% for the 97% RR. Texture evolution in those samples was also measured using EBSD micro-texture [58]. Figure 2c–e show the texture evolution in 84% and 97% hot-rolled Ti-15Mo-3Al-2.7Nb-0.2Si alloys [58]. ODF maps suggested that the weakening of the texture in the hot-rolled samples was associated with the rotation of the DRX grains towards the preferred slip systems having large misorientations between themselves (Figure 2c–e) [58]. The center region shows the maxima of texture around the cube and {112}<110> components, whereas the surface region shows a very weak texture for the 84% rolled sample (Figure 2c,d). A rotated cube texture was observed in the 97% rolled sample [58]. Similarly, the crystallographic texture of a Ti-35Nb-7Zr-5Ta alloy was studied after warm rolling [59]. The main observations were the formation of a strong through-thickness texture and microstructure gradients at larger strains (70% and 90% RRs). Both the DRX volume fraction and the texture depend on the thickness reduction [59]. At small reductions (≤50%) texture gradients were also small, showing α- and γ-fiber texture components [59]. At larger strains (70–90%), the texture and microstructure gradients are characterized by shear texture components particularly close to surface regions and plane strain texture components at the center layer [59].

2.2. Heat-Treated Microstructure and Texture Evolution

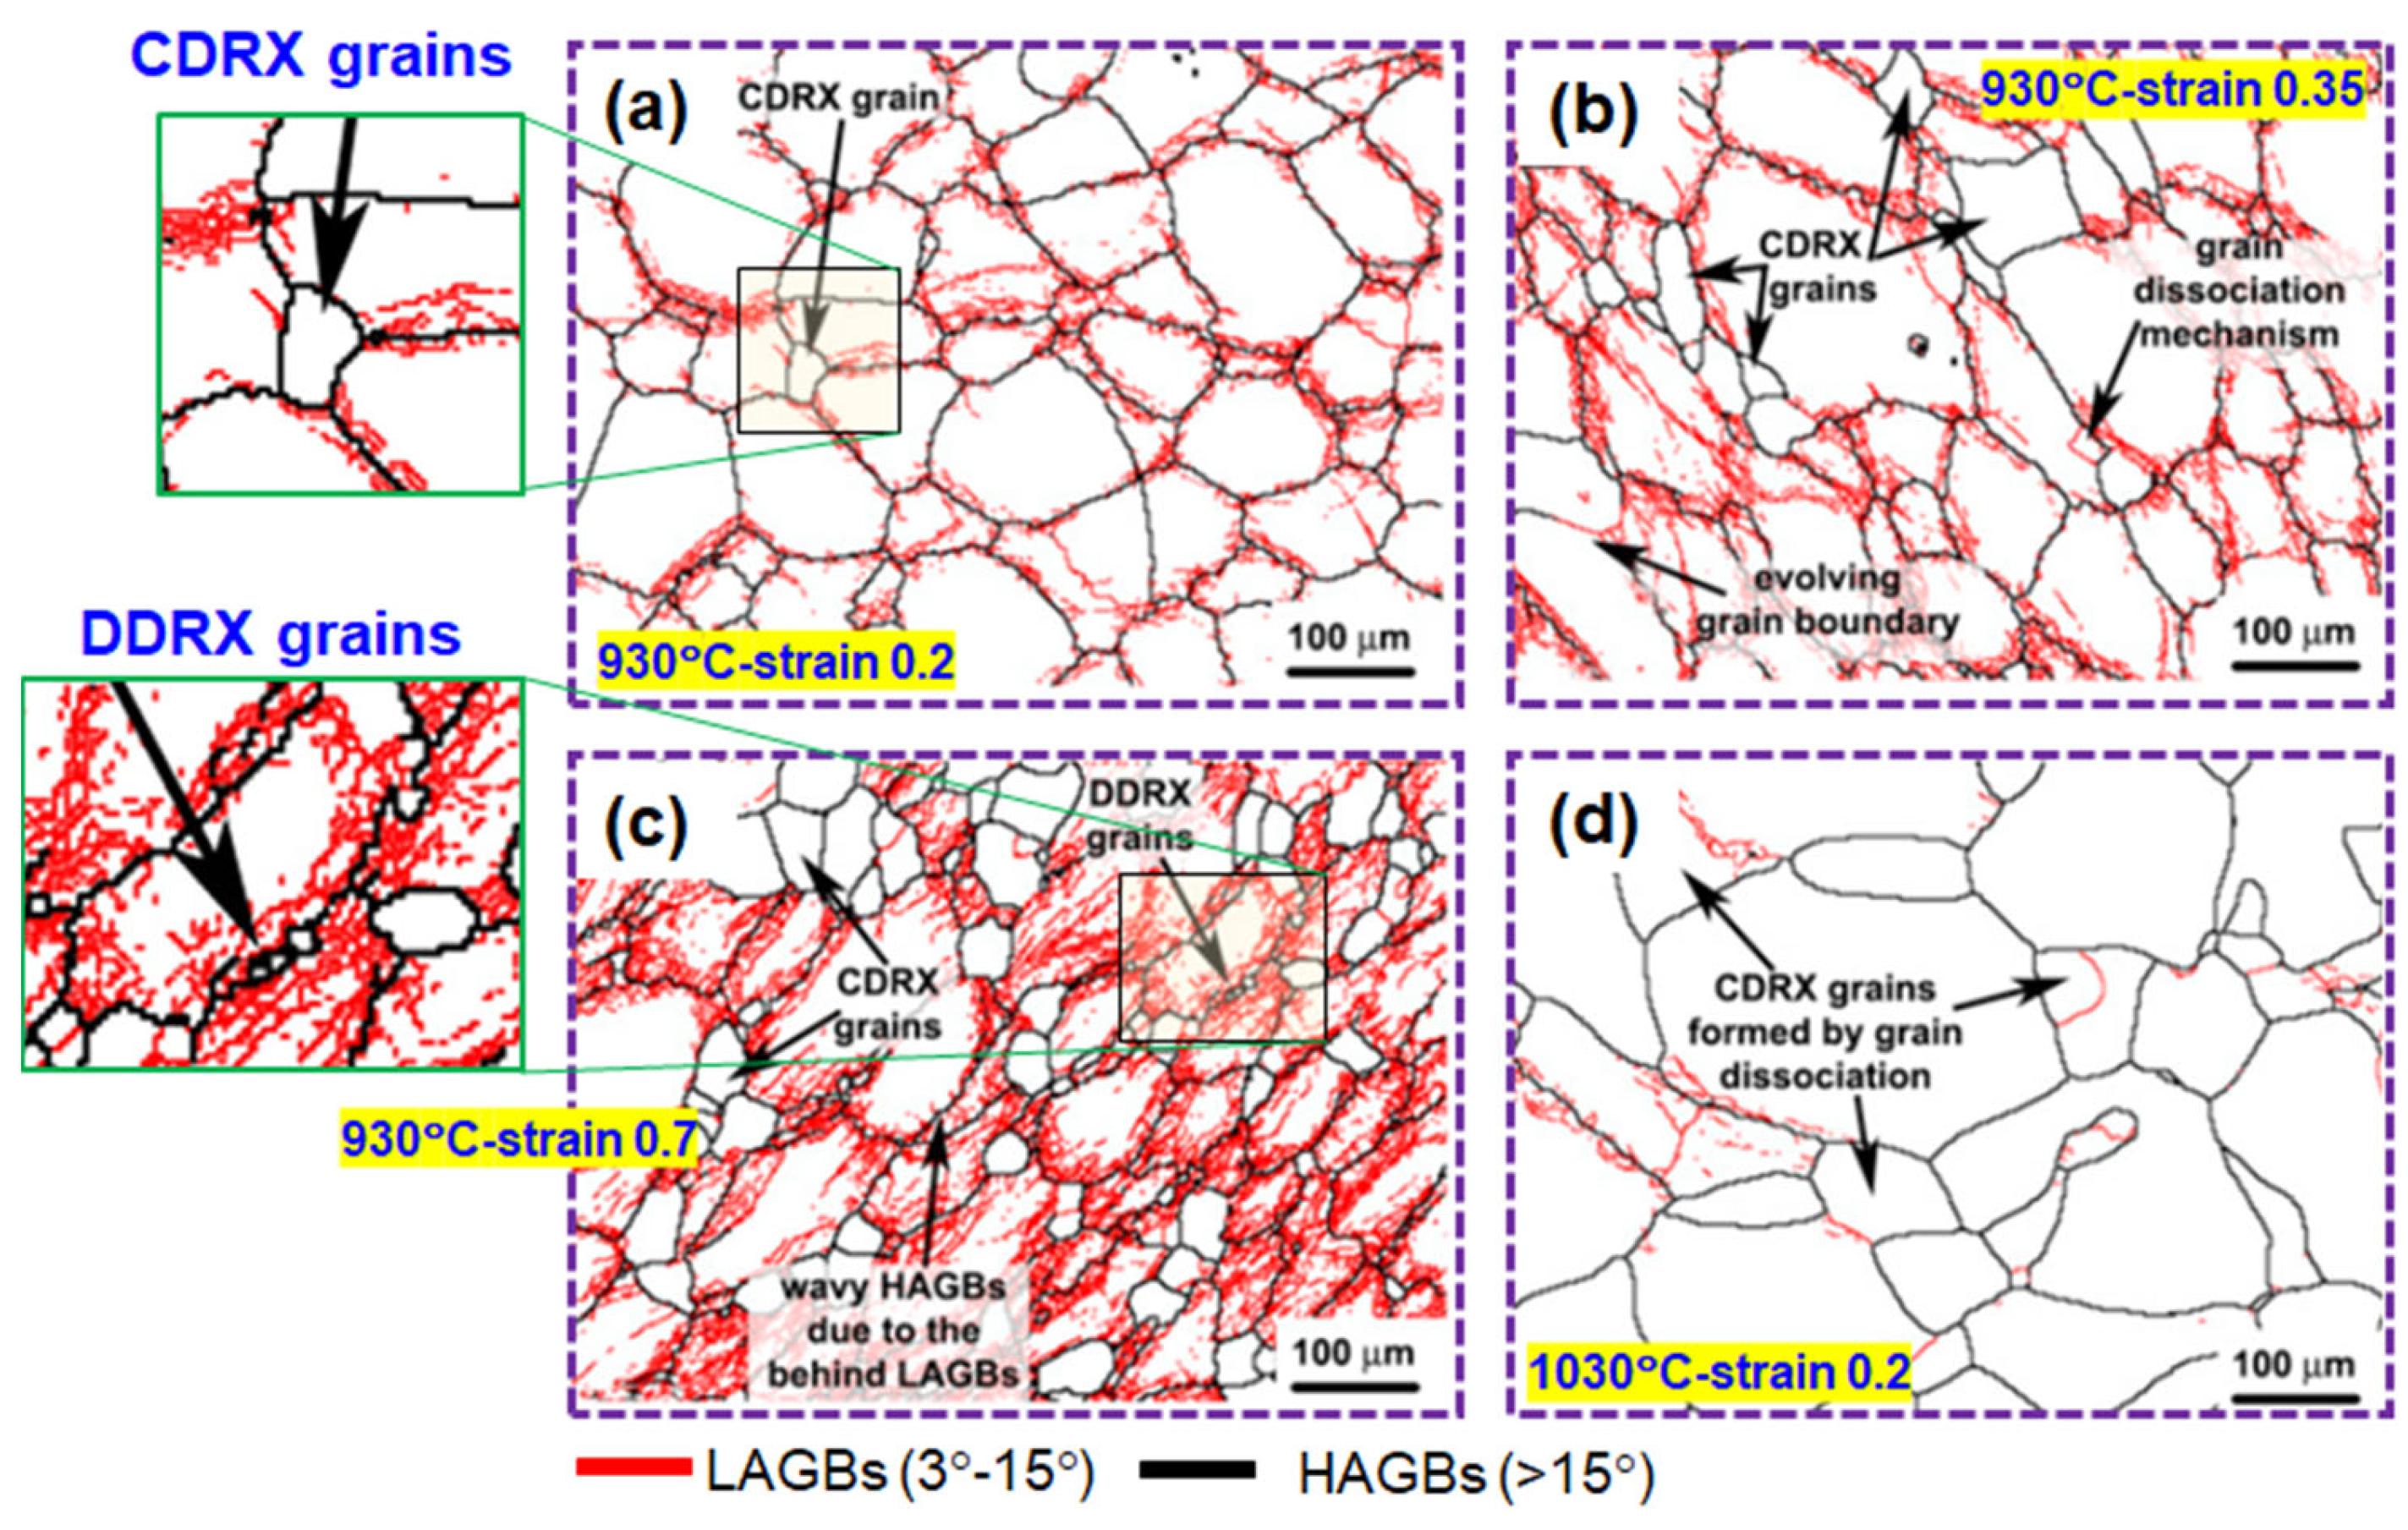
The annealing treatment of deformed β-Ti alloys leads to the evolution of α and ω phases when applied temperatures are below the β-transus, whereas temperatures above the β-transus lead to nucleations and grain growth of the single β microstructure [60]. The effect of heating rate and temperature (500–600 °C) on the aging behavior of TIMETAL-LCB, VT22, and Ti-15333 β-Ti alloys were reported in [61]. TIMETAL-LCB and VT22 formed fine plate-like α at slow heating rates due to the precipitation of isothermal ω at low temperatures, which serves as nucleation sites for α [61]. However, at high heating rates, the formation of isothermal ω was avoided, leading to coarse, plate-like α microstructures with less desirable properties. Ti-15333, on the other hand, exhibited β phase separation (β′+βmatrix) during isothermal aging rather than isothermal ω formation. It has been reported that like isothermal ω, β′ can also act as a nucleation site for α [61,62]. It is crucial to note that there are three categories of ω phase, depending on the process of formation: (1) a deformation-induced ω phase, (2) athermal ω phase, and (3) isothermal ω phase. The athermal ω phase, resulting from rapid quenching [63], is a diffusionless transformation but is not related to martensitic transformation, while the isothermal ω phase forms during the low-temperature aging of β-Ti alloys. The deformation-induced ω-phase forms under applied stress/strain [63]. Evolving phases during the heat treatment can also affect the mechanical strength of the β-Ti alloys. Precipitation of α or ω precipitates in solution-treated or deformed β-type Ti alloys is useful to obtain improved static and fatigue strength values. On the other hand, α and ω phases have significantly higher intrinsic E (E(ω) ≈ 153 GPa, E(α) ≈ 115 GPa) than the β phase (E(β) ≈ 60–65 GPa) and hence are not useful for bio-implants [64]. A heat-treated microstructure was observed in the hot-compressed Ti-13V-11Cr-3Al alloy samples. GB maps were reported (Figure 3) for samples subjected to hot compression tests at 930 and 1030 °C and a strain rate of 0.1 s−1 [65]. EBSD analyses showed that continuous DRX (CDRX) leads to considerable grain refinement through the dissociation of coarse deformed grains [65,66]. It was observed that well-developed subgrains formed by extended dynamic recovery (DRV) were responsible for the grain dissociation. Inhomogeneous compressive deformation, due to the faster evolution of the substructure at regions adjacent to the GBs, can be observed in (Figure 3a–c). Severe deformation causes the evolution of a large number of dislocations near the GBs. The existence of these dislocations at the GB regions favors DRV and leads to accelerating substructure formation (Figure 3c). The micrographs also showed the formation of some small substructure-free volumes of the old grains via CDRX, which were surrounded by LAGBs + HAGBs [65]. Grain boundary serrations and nucleations were typical of the propensity for discontinuous DRX (DDRX) (Figure 3c). However, the decreased fraction of subgrains and the absence of GB serrations as well as DDRX were observed in samples processed at 1030 °C (Figure 3d) [65]. Since the processing temperature (930 and 1030 °C) was above the β-transus, this caused the presence of a single β phase during compression deformation. In contrast, a low-temperature compression test (700 °C) of Ti-7Mo-3Al-3Nb-Cr (Ti-7333) caused the precipitation of the α phase [67]. A fine α phase was precipitated during isothermal deformation at 700 °C-10−3 s−1 [67]. The evolution of intragranular α (spherical precipitates) and grain boundary α (αGB) with a combination of HAGBs+LAGBs was observed [67].
The annealing treatment of a cold-rolled Ti-5Al-5Mo-5V-3Cr (Ti-5553) alloy was performed [68]. The as-received Ti-5553 alloy showed a weak texture and its intensity got strengthened near a partial α- and complete γ-fiber texture after 40% RR. Annealing treatment (860 °C–5 min) of a cold-rolled Ti-5553 alloy led to decreased intensity of the deformation texture [68]. Further, aging treatment of the as-received sample (below β-transus) at 670 and 770 °C caused the evolution of a fine α-phase inside the coarse β-grains. The evolution of the α-phase diminishes the texture of the aged samples. In our previous investigation on the annealing treatment of a cold-rolled Ti-15333 alloy, microstructure and crystallographic texture evolution have been discussed [69]. Figure 4 shows the ND-IPF maps and φ2 = 45° ODFs for the as-rolled, partially and fully recrystallized samples. Strong α- and γ-fiber textures were observed for the 80% CR Ti-15333 alloy (Figure 4a), whose microstructure inferred long-elongated grains, and few of them consisted of SBs. Annealing treatment at 780 °C for 1 and 5 min showed the grain nucleations at the deformed GBs and SBs and grain growth, respectively (Figure 4b,c). Interesting results were observed after the complete recrystallization, in which disappearance of the α-fiber texture and enhancement of γ-fiber texture was reported (Figure 4d). In another study, the effects of cooling rate following β- and α/β-region (920–1000 °C) heat treatment on microstructure and phase transformation were investigated for a Ti-6.5Al-2Sn-4Zr-4Mo-1W-0.2Si (BT25y) alloy [70]. The BT25y alloy was soaked at 920–1000 °C for 10 min, and then cooled at a rate of either 0.15 °C/s–150 °C/s to RT [70]. Microstructure observations indicated that the microstructure of the BT25y alloy was significantly influenced by the cooling rate. When the material was cooled from the β phase field at a lower rate, the grain boundary α (αGB) and Widmanstatten α (αWGB) phases were precipitated [70]. However, increasing the cooling rate greatly restrained the precipitations of αGB and αWGB phases. In this case, acicular martensite (α′) was precipitated inside the β grain. The primary equiaxed-α was retained when the material was cooled down from the α/β phase field [70]. The content and size of equiaxed-α decreased with the increasing solution temperature but were independent of the cooling rate [70]. Texture evolution in a heat-treated Ti-22Nb-6Ta alloy was investigated in [71]. A well-developed {001}<1–10> texture was obtained in the cold-rolled sample and after heat treatment at 600 °C for 10 min. Moreover, a recrystallization texture of {112}<1–10> was developed at 900 °C for 30 min [71].

3. Tantalum and Its Alloys

Ta is a refractory transition metal in Group V widely used for key structural components often exposed to harsh physico-chemical environments, due to its superb strength, ductility and corrosion and radiation resistance over a wide range of strains, strain rates and temperatures [72,73]. The mechanical behavior of Ta and its alloys has been a focal point of research to facilitate their applications in diverse mechanical, thermal and chemical conditions. In BCC materials, there are three slip systems that can be activated during plastic deformation, i.e., {110}<111>, {112}<111>, and {123}<111>. The activation of these slip systems depends on factors such as the temperature, strain rate, chemical composition, and crystal orientations [74]. In the case of Ta, it has been generally observed that slip activity predominantly occurs on {110} planes, but it can also occur on planes with the highest resolved shear stress [75]. However, a breakdown of Schmid’s law was reported for group V and VI BCC transition metals, including Ta, by numerous atomistic simulation and physically informed continuum crystal plasticity model studies [72]. The main reason for non-Schmid behavior in transition metals was revealed to be the cores of 1/2<111> screw dislocations spreading on various {110} planes in the <111> zone. Most studies of the non-Schmid effect in Ta and other BCC transition metals focused on the anomalous glide of screw dislocations, especially on the {110} planes. Only a few recent studies have investigated the non-Schmid behaviors on the {112}<111> slip system using empirical models [76,77,78]. In the subsequent sections, detailed discussions about the microstructure and texture heterogeneities during TMP, the Schmid behavior of Ta alloys, and the strain path effect have been discussed elaborately.

3.1. Deformed Microstructure and Texture Evolution

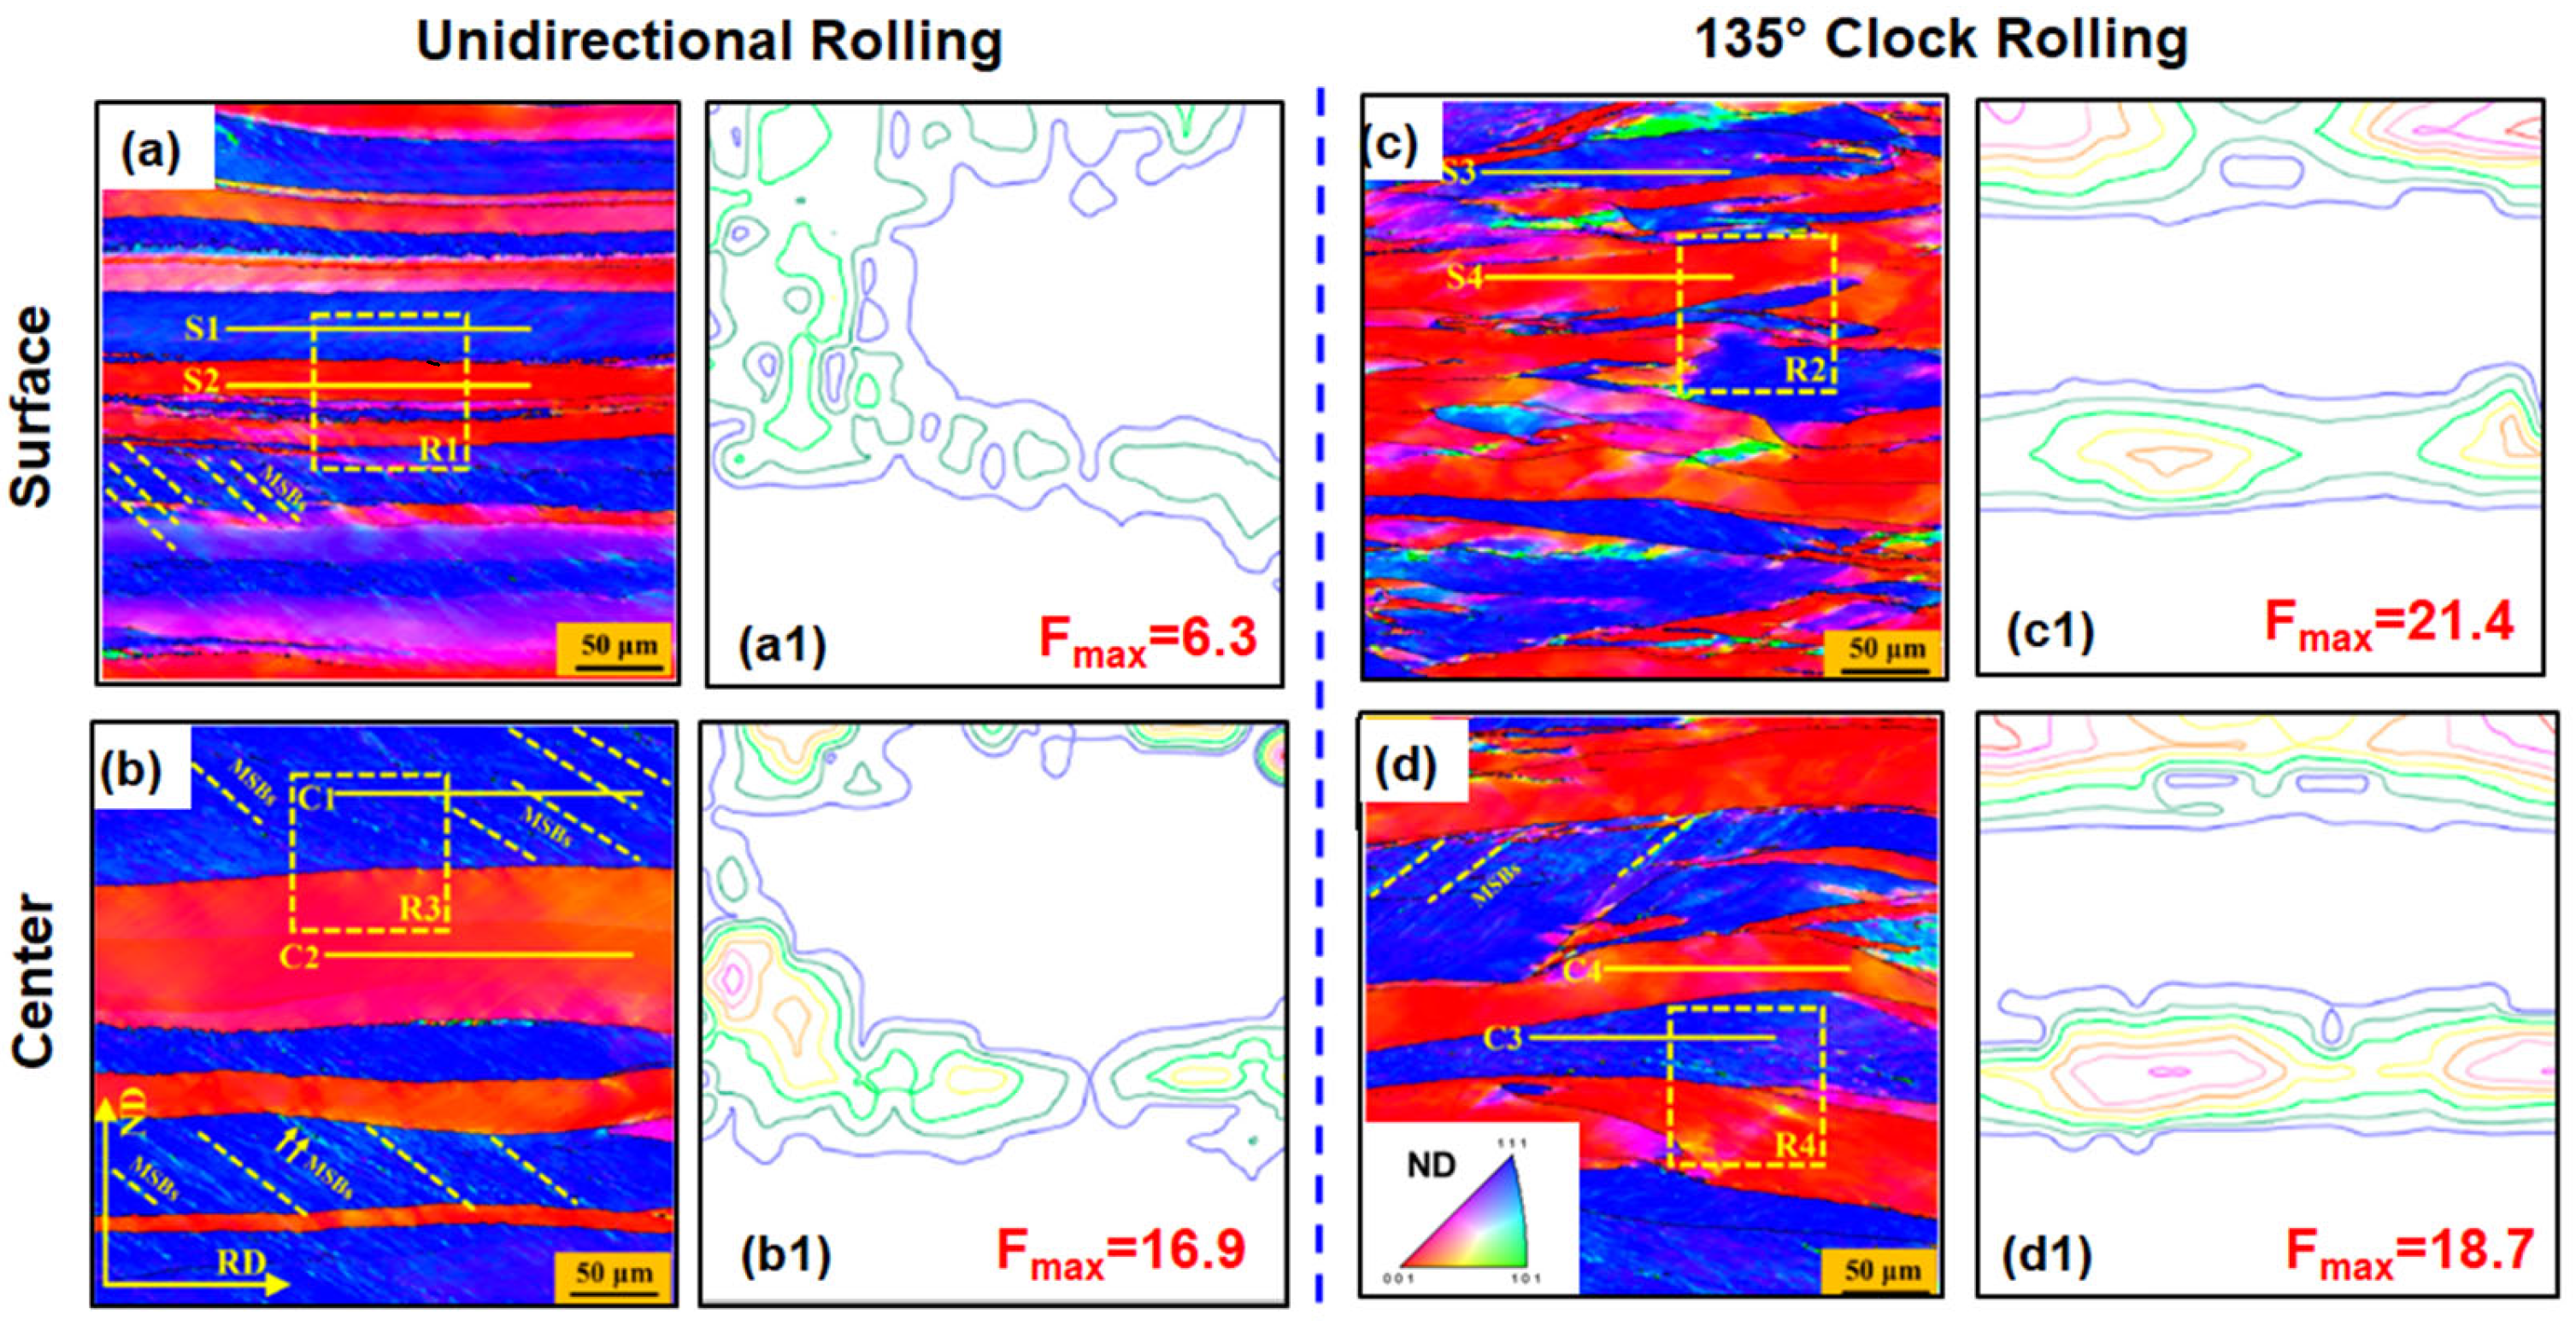
Traditional processing techniques like CR and/or forging followed by annealing treatment are effective methods to reduce grain size (GS), which often results in a texture gradient along the through-thickness [79]. In the case of Ta sheets, a prominent {111}<uvw> texture develops in the central layer, whereas the surface layer processed solely using traditional methods is primarily characterized by a {100}<uvw> texture. The main textures formed during CR are α- and γ-fiber [80]. It has been observed that the size of grains, the development of crystallographic texture, the arrangement of dislocations, and the kinetics of recrystallization are greatly influenced by their initial deformation process, such as unidirectional rolling (UDR), clock rolling, asymmetrical rolling (ASR), and cross-roll rolling. In one report, UDR with an 87% RR results in the evolution of {111}/γ-fiber and {100}/α-fiber grains near the center region. Also, the degree of deformation in the {111} grains was significantly higher compared to the {100} grains, with a stored energy ratio of approximately 2.5 between the two orientations. However, clock rolling effectively reduces the through-thickness texture gradient, suggesting that changing the strain path enhances deformation uniformity [81]. The comparison of a UDR and clock-rolling microstructure and crystallographic texture is reported in [3]. Ta samples were deformed to 87% via UDR and 135° clock rolling in 16 passes. The predominant micro-textures observed were <100>//ND and <111>//ND. On the surface, the {111} and {100} elongated grains were arranged more densely. Moreover, a substantial difference in grain morphology was observed between the two different rolling processes (Figure 5a,c). The UDR sample shows relatively straight and planar grain boundaries (GBs) (Figure 5a,b), whereas the GBs in the clock-rolled sample demonstrate bending and fluctuations along the RD (Figure 5c,d).
In the center region of the UDR sample, numerous micro-SBs (yellow lines in Figure 5a) were observed within the {111} deformed matrix, which typically have a γ-fiber orientation [82]. In terms of misorientation, micro-SBs within the {111} matrix (C1) caused higher misorientation angles (more than 15°; (Figure 5b)), whereas misorientation angles in the {100} matrix (S2 and C2) were considerably lower (Figure 5a,b), inferring no formation of SBs in those grains. Conversely, in the clock-rolled deformed sample, misorientations in {111} and {100} deformed matrices were generally below 10° (Figure 5c,d). This indicates that deformation within the {111} and {100} matrices was relatively homogeneous throughout the thickness in the clock-rolling deformation. The texture throughout the thickness of the UDR sample exhibited a similar pattern, consisting of θ-, α-, and γ-fibers, and its intensity in the center region was significantly stronger (Figure 5a1,b1). On the other hand, the clock-rolled samples showed a similar nature of texture for the surface and center regions (Figure 5c1,d1) and resulted in a more complete {111} and {100} orientation along the γ- and θ-fibers, respectively.
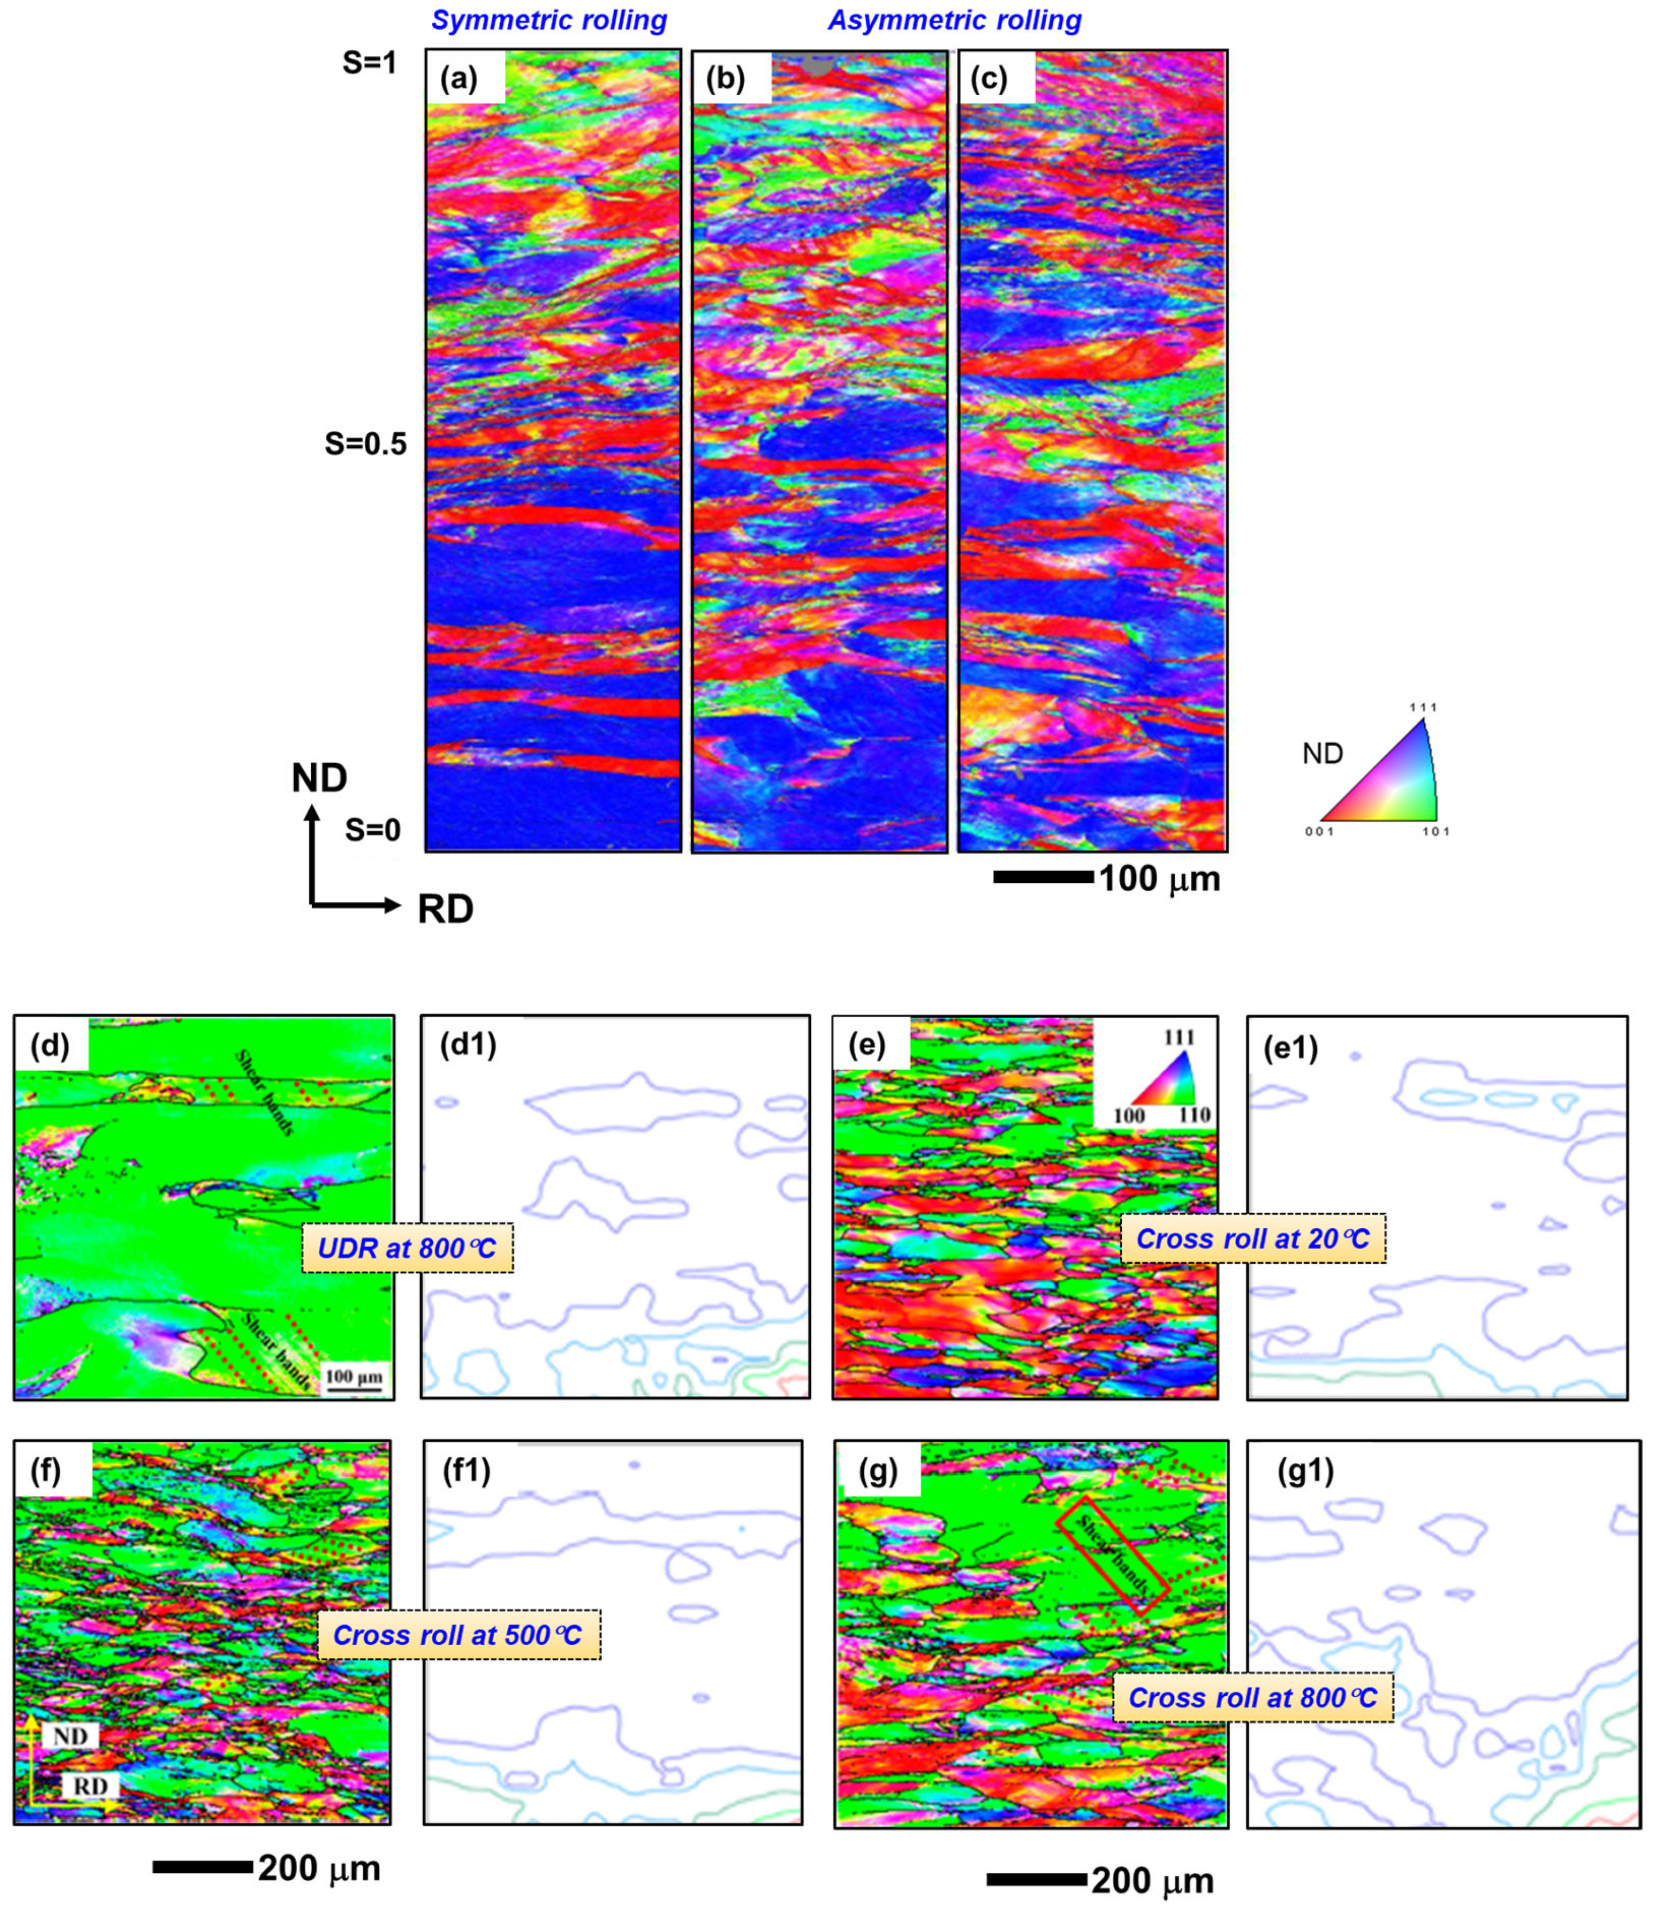
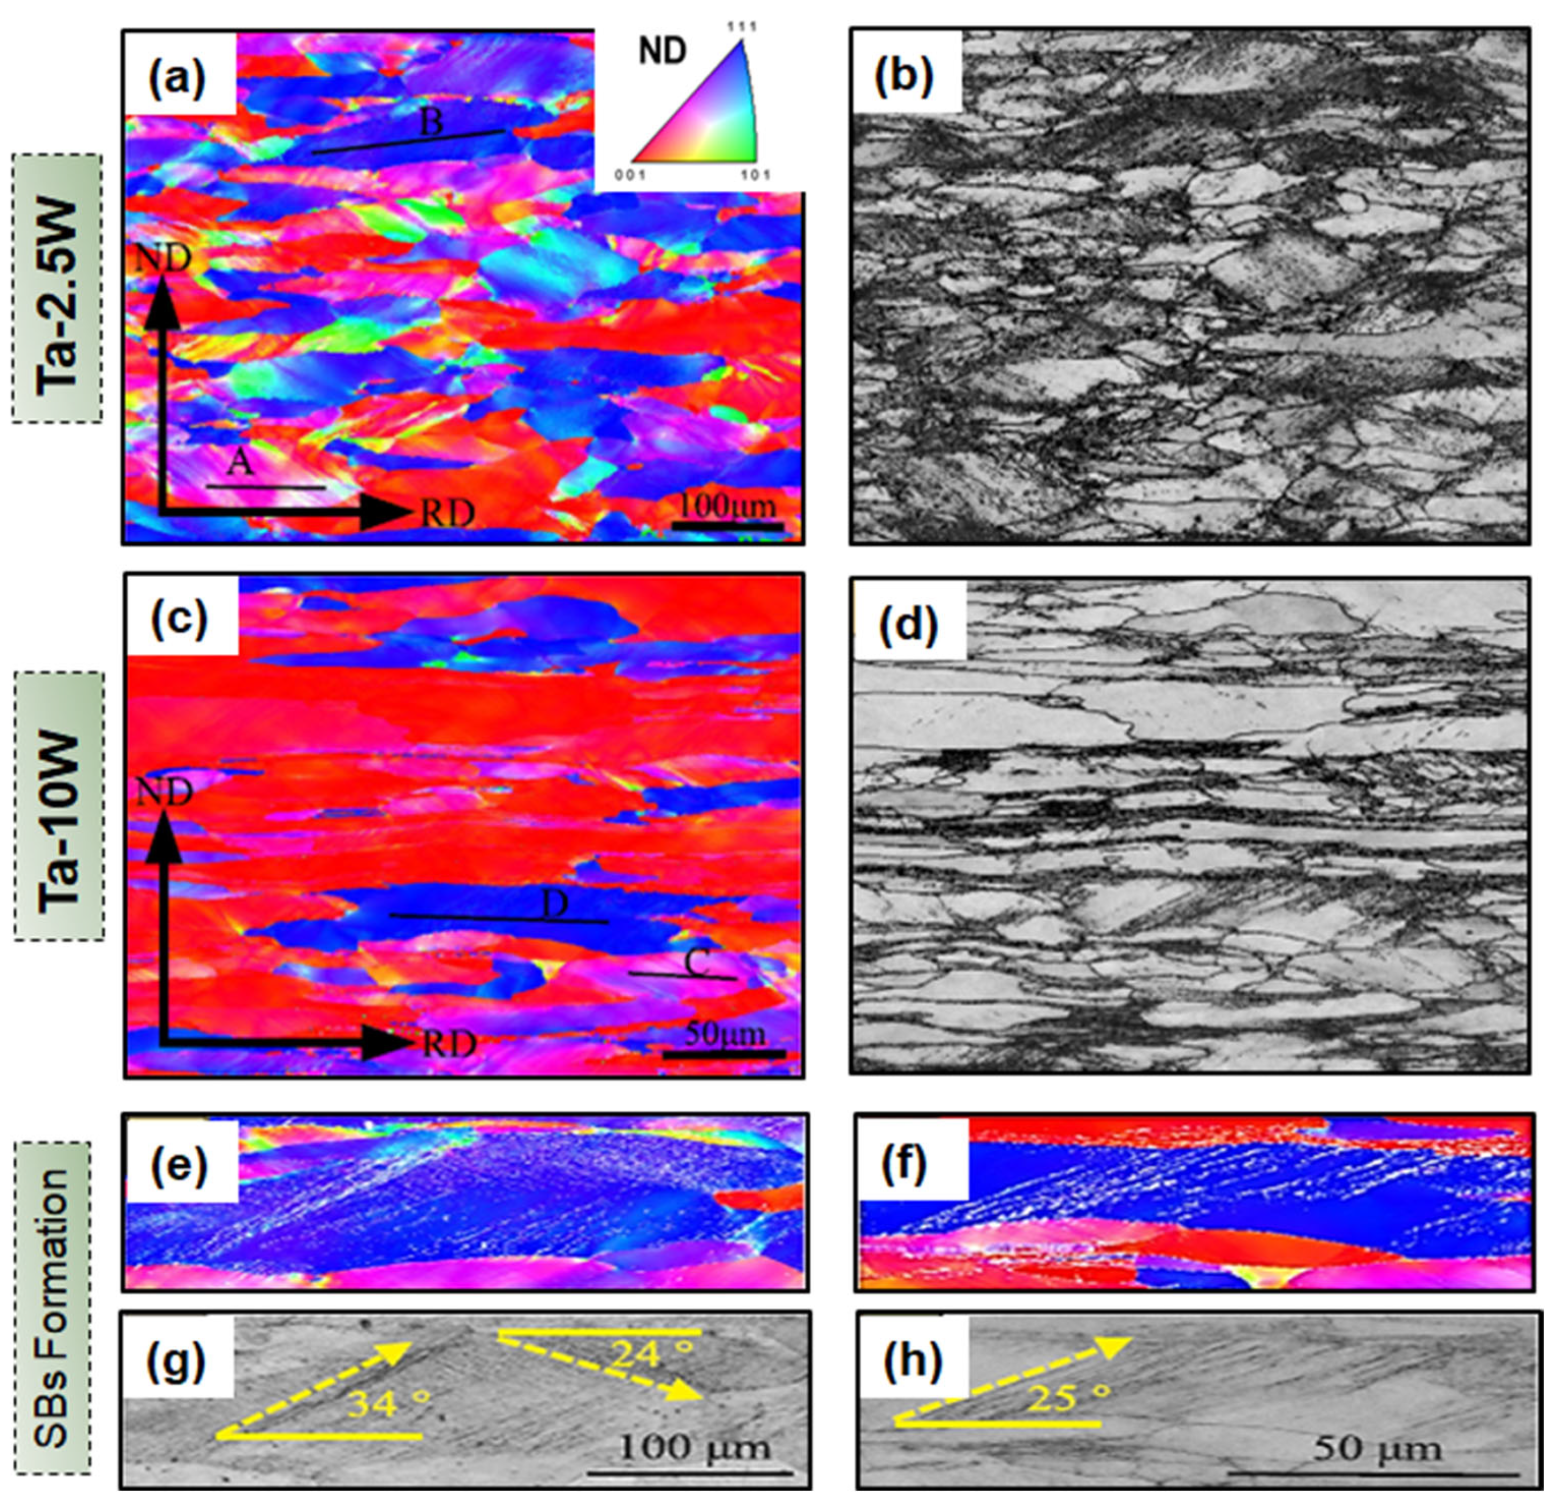
Differences in the microstructure and crystallographic texture evolution were studied between symmetric (SR) and ASR [83]. ASR was performed with a speed ratio of 1.1 and 1.2 between the two rolls. Inverse pole figure (IPF) maps of 80% deformed Ta via SR and ASR are shown in Figure 6a–c. In SR, the grain splitting was uneven throughout the entire regions, which was most severe at S = 1 (surface layer of rolled specimen) and lightest at S = 0 (center layer of rolled specimen). Near-surface grains were predominantly oriented along {110} and {100}, while a significant proportion of {111} orientations were observed near S = 0, indicating a pronounced texture gradient throughout the thickness (Figure 6a). In the ASR (rolling speed ratio of 1.1), the grain refinement at each position was greater compared to the corresponding positions in the SR sample. The most significant component of grain subdivision still occurred at S = 1, where numerous grains were divided into strips (Figure 6b). In the ASR sample with a rolling speed ratio of 1:2, many grains were seen to split into slender lamellar structures and the deformation was more severe at each corresponding position (Figure 6c) as compared to its counterparts (Figure 6a,b), resulting in a higher degree of grain subdivision. In both ASR samples, a uniform distribution of the microstructure throughout the thickness was observed [83]. The study on the 70% warm rolling (UDR and cross rolled at 800 °C) of Ta is reported [84]. In the near-surface region of the samples, the predominant grain orientations were {110}<uvw> and {100}<uvw> (Figure 6d–g). Comparatively, with the UDR at 800 °C, cross-rolled samples exhibited more pronounced {110} SBs in the near-surface layer. The addition of W into Ta plays a very important role in the microstructure and crystallographic texture evolution of the alloy. W addition can decrease the tendency to develop γ-fiber during CR [20,73]. Further, both Ta and Ta-W alloys exhibit the formation of α- and γ-fiber on CR. However, upon comparison of Ta and Ta-10W, increasing the W content results in ten times the dislocation trapping rate, two times the dislocation friction stress and three times the recovery activation barrier increase [18]. The evolution of microstructure and texture upon CR (5–40%) in Ta-2.5W was reported in [85]. The deformation bands were observed on 10% CR and few deformation bands could be seen. However, the density of micro-bands and the <111>//ND grains increased with increasing CR RRs. However, the mature α- and γ-fiber did not develop until 40% CR. At all strain levels, the structure subdivision occurred in the form of elongated, alternative misorientation domains of a specific orientation. The domains, commonly called the deformation bands, were separated by roughly parallel families of geometrically necessary boundaries. At small strain, the geometrically necessary boundaries bounding cell blocks were long single dense dislocation walls parallel to the transverse direction and of a specific orientation with respect to the rolling direction. These new cell blocks were defined as micro-bands [86]. Further, the effect of GS on the rolling texture of Ta-2.5W was studied in [87]. The micro-bands began to form at 20% CR, and their density increased with increasing CR reduction. The α- and γ-fibers developed in these two alloys with fine and coarse grain structures. CR alloys with fine grains exhibit a higher intensity of γ-fiber texture compared with the CR alloy with coarse grains and this texture is primarily composed of micro-bands. Wang et al. [88] discussed the microstructural and texture variation in Ta-2.5W and Ta-10W alloy samples. The activation of different slip systems during CR was reported to result in varying deformation textures. Enhanced cross-slip and dislocation loops were observed in the Ta-2.5W alloy. The morphology of SB also differed in the two alloys, as discussed in Figure 7. An increase in W content leads to a decrease in the wavelength of wavy SBs. Figure 7 illustrates the EBSD (IPF and IQ maps) microstructures of the 40% CR of Ta-W alloys (Ta-2.5W and Ta-10W) [88]. Elongated grains were observed along the RD (Figure 7a–d). Various types of deformation microstructures were formed in different orientation grains and SBs were visible in many grains, except for those with α-fiber orientation. These SBs were aligned parallel to each other and inclined at an angle relative to the RD. Notably, the density of SBs in the Ta-2.5W alloy was considerably higher than that in the Ta-10W alloy (Figure 7a–d). Also, it was observed that grain A (Figure 7a) and grain C (Figure 7c) exhibited an orientation of {112}<110>, while grain B (Figure 7a) and grain D (Figure 7c) exhibited an orientation of {111}<112>. The density of SBs in grains B and D was higher (as can be seen in respective IQ maps) compared to that in grains A and C (Figure 7a,c), and the misorientation of dislocation boundaries in grains B and D reached approximately 4° [88].
However, the misorientation of dislocation boundaries in grain C was only around 1°. Further, in the Ta-2.5W alloy, both well-developed α- and γ-fibers were formed; however, in the Ta-10W alloy, the α-fiber was well-developed while the γ-fiber was incomplete. The SBs in the {111}<11 2 ¯ > orientation for both alloys are shown in Figure 7e–h. In the Ta-2.5W alloy, two groups of SBs were observed (~34° and 24° inclined), while the Ta-10W alloy showed a single set of SBs (~25° inclined). Both alloys exhibited a similar group of SBs inclined at approximately ~±25° relative to the RD [88]. However, the Ta-2.5W alloy displayed a more pronounced group of SBs inclined at around ±34° with respect to the RD. This suggests that distinct deformation behaviors were activated in alloys with the same orientations but different compositions. The volume fraction of both α- and γ-fibers increased as the RRs rose in both alloys, but the volume fraction of α-fiber in the Ta-10W alloy was greater than that in the Ta-2.5W alloy [88].

3.2. Heat-Treated Microstructure and Texture Evolution

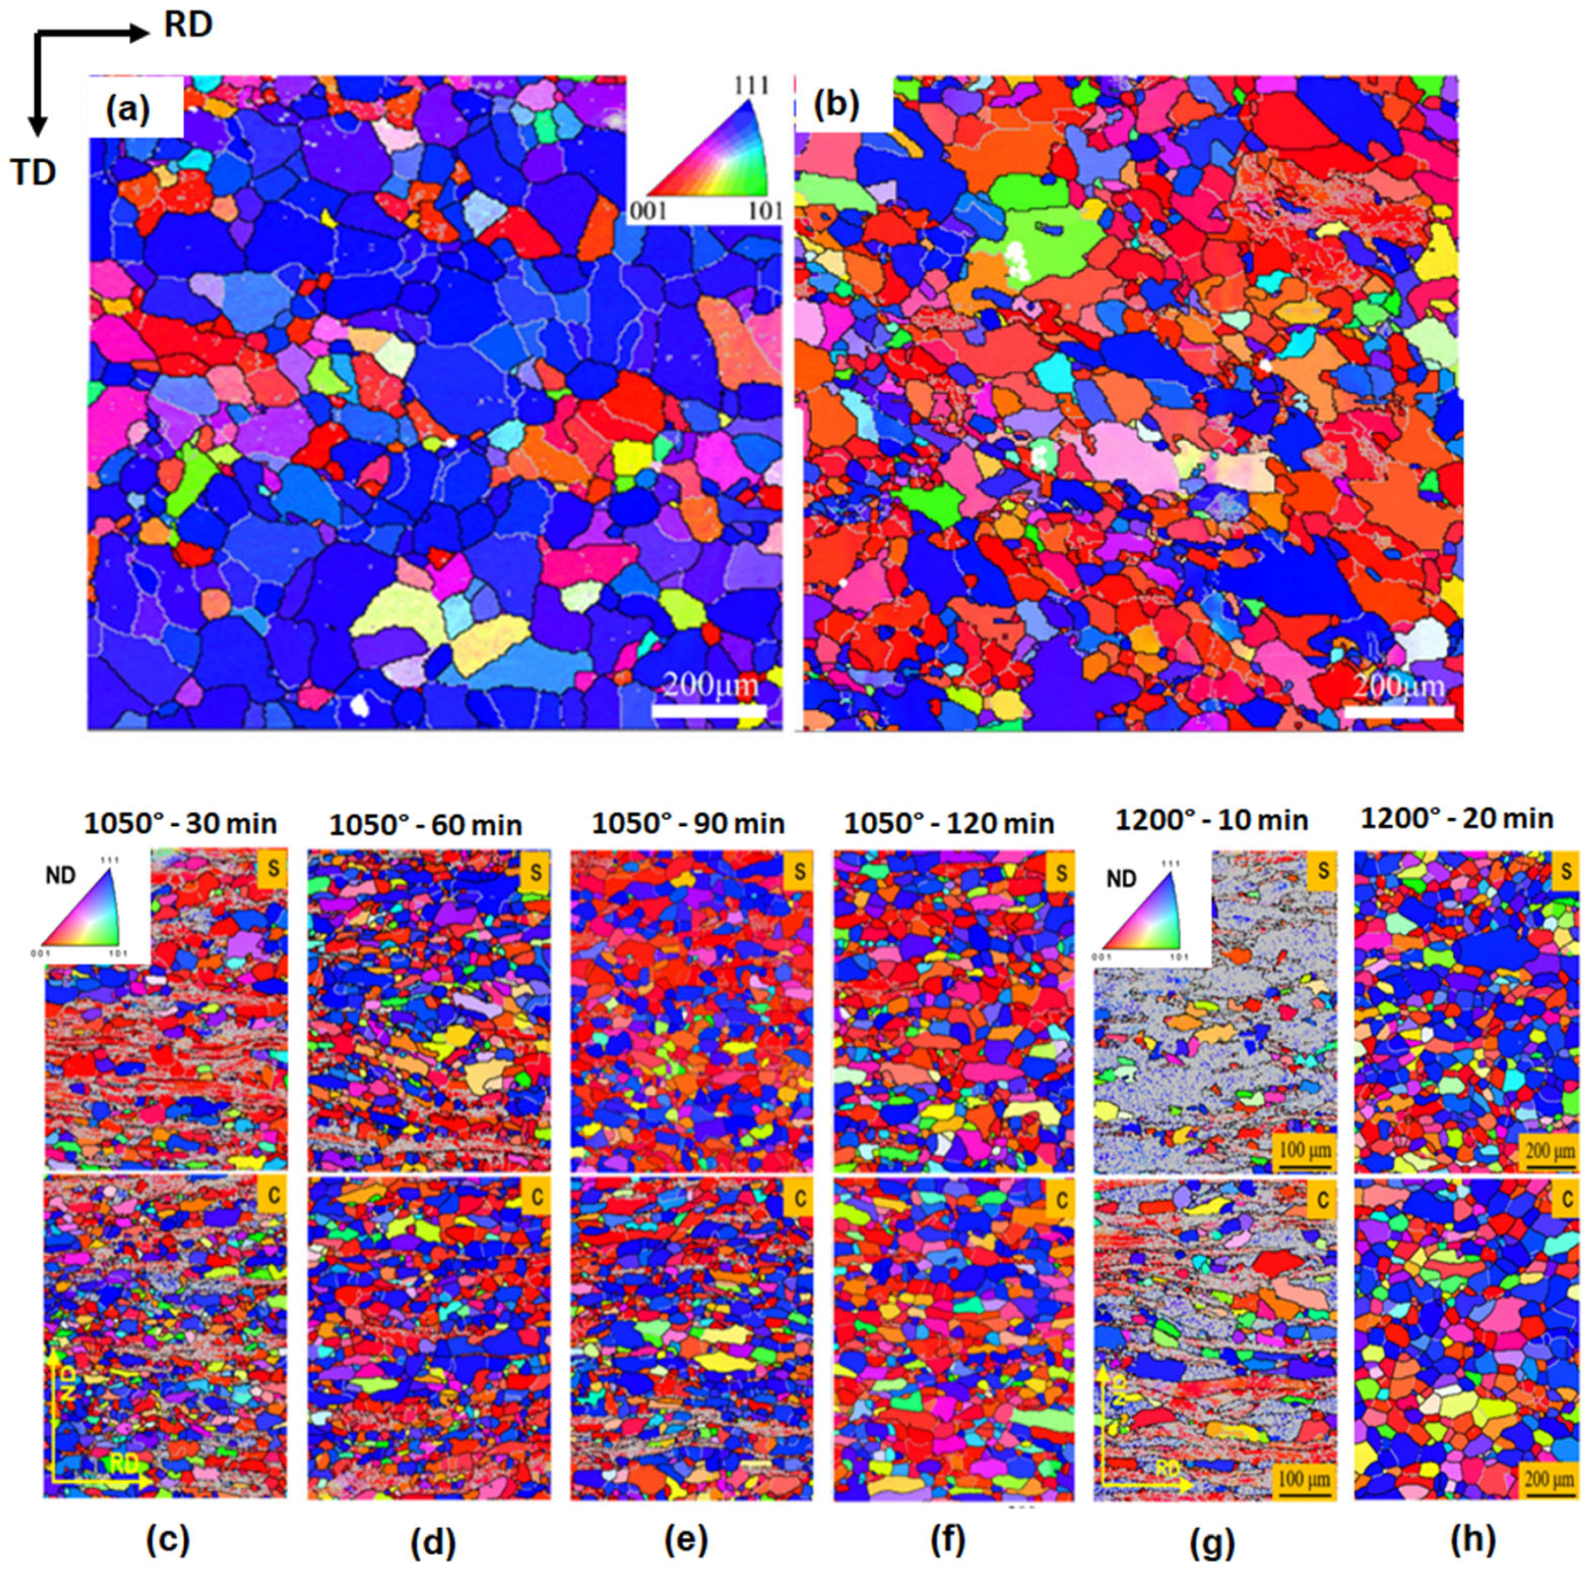
Heat treatment is the most viable solution to obtain finer microstructures with a decrease in internal stored energy. The influence of strain path (UDR and clock-rolled) on the recrystallization of 87% deformed Ta is reported in [89]. The UDR samples recrystallized at a faster rate compared to the clock-rolled samples. Upon annealing at 1200 °C for 1 h, the UDR plate exhibited a strong γ-fiber texture, whereas the clock-rolled sample exhibited a combination of a strong cube and a relatively weak γ-fiber texture. Proportions of {100}- and {111}-fiber regions in the surface of the recrystallized clock-rolled samples (Figure 8b) were almost similar (31.3% and 21.4%), with smaller and less variation in GSavg, thus indicating a more homogeneous microstructure and texture along the thickness compared to the UDR sample (Figure 8a). Further, the GSavg of the UDR (Figure 8a) was noted to be approximately 87.5 µm compared to the clock-rolled sample GSavg of approximately 49.5 µm (Figure 8b), indicating the formation of finer grains [89].
The effect of annealing temperature on the recrystallization of Ta was studied in [90]. The recrystallization was not yet fully completed at 1050 °C for 30 min and notably, a substantial presence of a {100} deformed matrix was observed at both the surface and center layers after 30 min of annealing (Figure 8c). However, as the annealing time increased, the {100} deformed matrix gradually diminished (Figure 8d–f). Complete recrystallization at the surface and center regions was observed at 1050 °C for 120 min (Figure 8f), resulting in the evolution of random orientations and distribution of orientations along both the γ- and θ-fibers. Upon annealing at 1200 °C for 10 min. (Figure 8g), numerous newly formed defect-free grains developed within the deformed matrix, with larger recrystallization grains observed in the center layer compared to the surface layer. When the annealing time was extended to 20 min (Figure 8h), complete recrystallization of the sample was observed with the prominent γ-fiber recrystallization texture. The increase in W content, as discussed previously, due to the increase in dislocation trapping rate, dislocation friction stress and recovery activation barrier [18], leads to an increase in recrystallization temperature [91]. However, no studies have reported on the annealing and recrystallization behaviors of Ta-W alloys until now.
Recrystallization typically involves two-stage processes: nucleation and subsequent grain growth, which are influenced by the stored energy present within the matrix grain. In the UDR, the micro-SBs within the {111} matrix of the material serve as preferred nucleation sites during annealing [92]. Moreover, the stored energy within these nucleation sites was considerably higher, serving as a driving force for the subsequent growth of nuclei. Recrystallization occurs more easily and rapidly in the center region compared to the surface. Clock rolling exhibits a relatively uniform and consistent recrystallization process throughout its thickness. The nucleation sites and stored energy are distributed in a more homogeneous manner, leading to the appearance of recrystallized nuclei primarily along the {111} and {100} matrices, as well as the {111} and {100} boundaries. It has been reported that the energy stored in BCC materials in deformed grains is ordered as E{110} > E{111} > E{112} > E{100} sequentially [93,94]. Recovery involves the annihilation and rearrangement of dislocations, as well as the elimination of point defects. These mechanisms significantly decrease the level of stored energy and modify the arrangement of dislocations, thus influencing the nucleation process. Two primary mechanisms for nucleation during annealing are the migration of sub-grain boundaries and high-angle grain boundaries (HAGBs). At low-temperature annealing, the nucleation mechanism through sub-grain boundaries plays a crucial role since HAGBs have limited mobility. When the sample is annealed at low temperatures, recrystallization occurs slowly, allowing ample time for recovery (Figure 8c–f). Specifically, during recovery, dislocation rearrangement and the gradual transformation of low-angle grain boundaries (LAGBs) into sub-grains take place, leading to recrystallization predominantly driven by sub-grain nucleation mechanisms. Nuclei tend to grow faster into the {111} matrix, characterized by higher stored energy, while their growth into the {100} matrix is slower. This discrepancy results in a less uniform GS distribution (Figure 8g,h) as compared to low-temperature annealing (Figure 8c–f) [90].

4. Ferritic Stainless Steels

FSSs with the addition of Cr, Nb, Ti, and Mo have been developed to replace AISI 304 ASS for use in automobile vent pipes, which require excellent corrosion resistance as well as formability. Cr addition can increase corrosion resistance, whereas high Ti and Nb additions can lead to a less stable microstructure susceptible to the formation of some intermetallic compounds [95]. Super-ferritic stainless steels (SFSSs) are another grade of FSSs known as high-performance ferritic steels, containing a high Cr (25–30 mass%) and Mo (1–4 mass%) content. Carbon and nitrogen are present in negligible quantities, which is a requirement for SFSSs, since the pernicious effect of interstitial atoms on mechanical properties is reduced to a minimum [96]. The control of crystallographic texture plays a very important role in improving the formability of FSS sheets. The crystallographic texture is governed by the TMP during the manufacturing process [97]. As previously discussed, BCC metals/alloys tend to form fiber textures, such as α- and γ-fiber, after rolling deformation. The α-fiber texture comprises orientations of <110>//RD, which consist of {001}<110>, {112}<110> and {111}<110> orientations. The γ-fiber comprises orientations with <111>//ND, including {111}<110> and {111}<112> [98]. FSSs do not undergo or undergo very limited phase transformation (γ/α) during HR, which limits the opportunities for the randomization of texture during TMP [99]. Therefore, the hot bands exhibit strong textures and through-thickness texture gradients, which largely control the evolution of texture and mechanical properties.

4.1. Deformed Microstructure and Texture Evolution

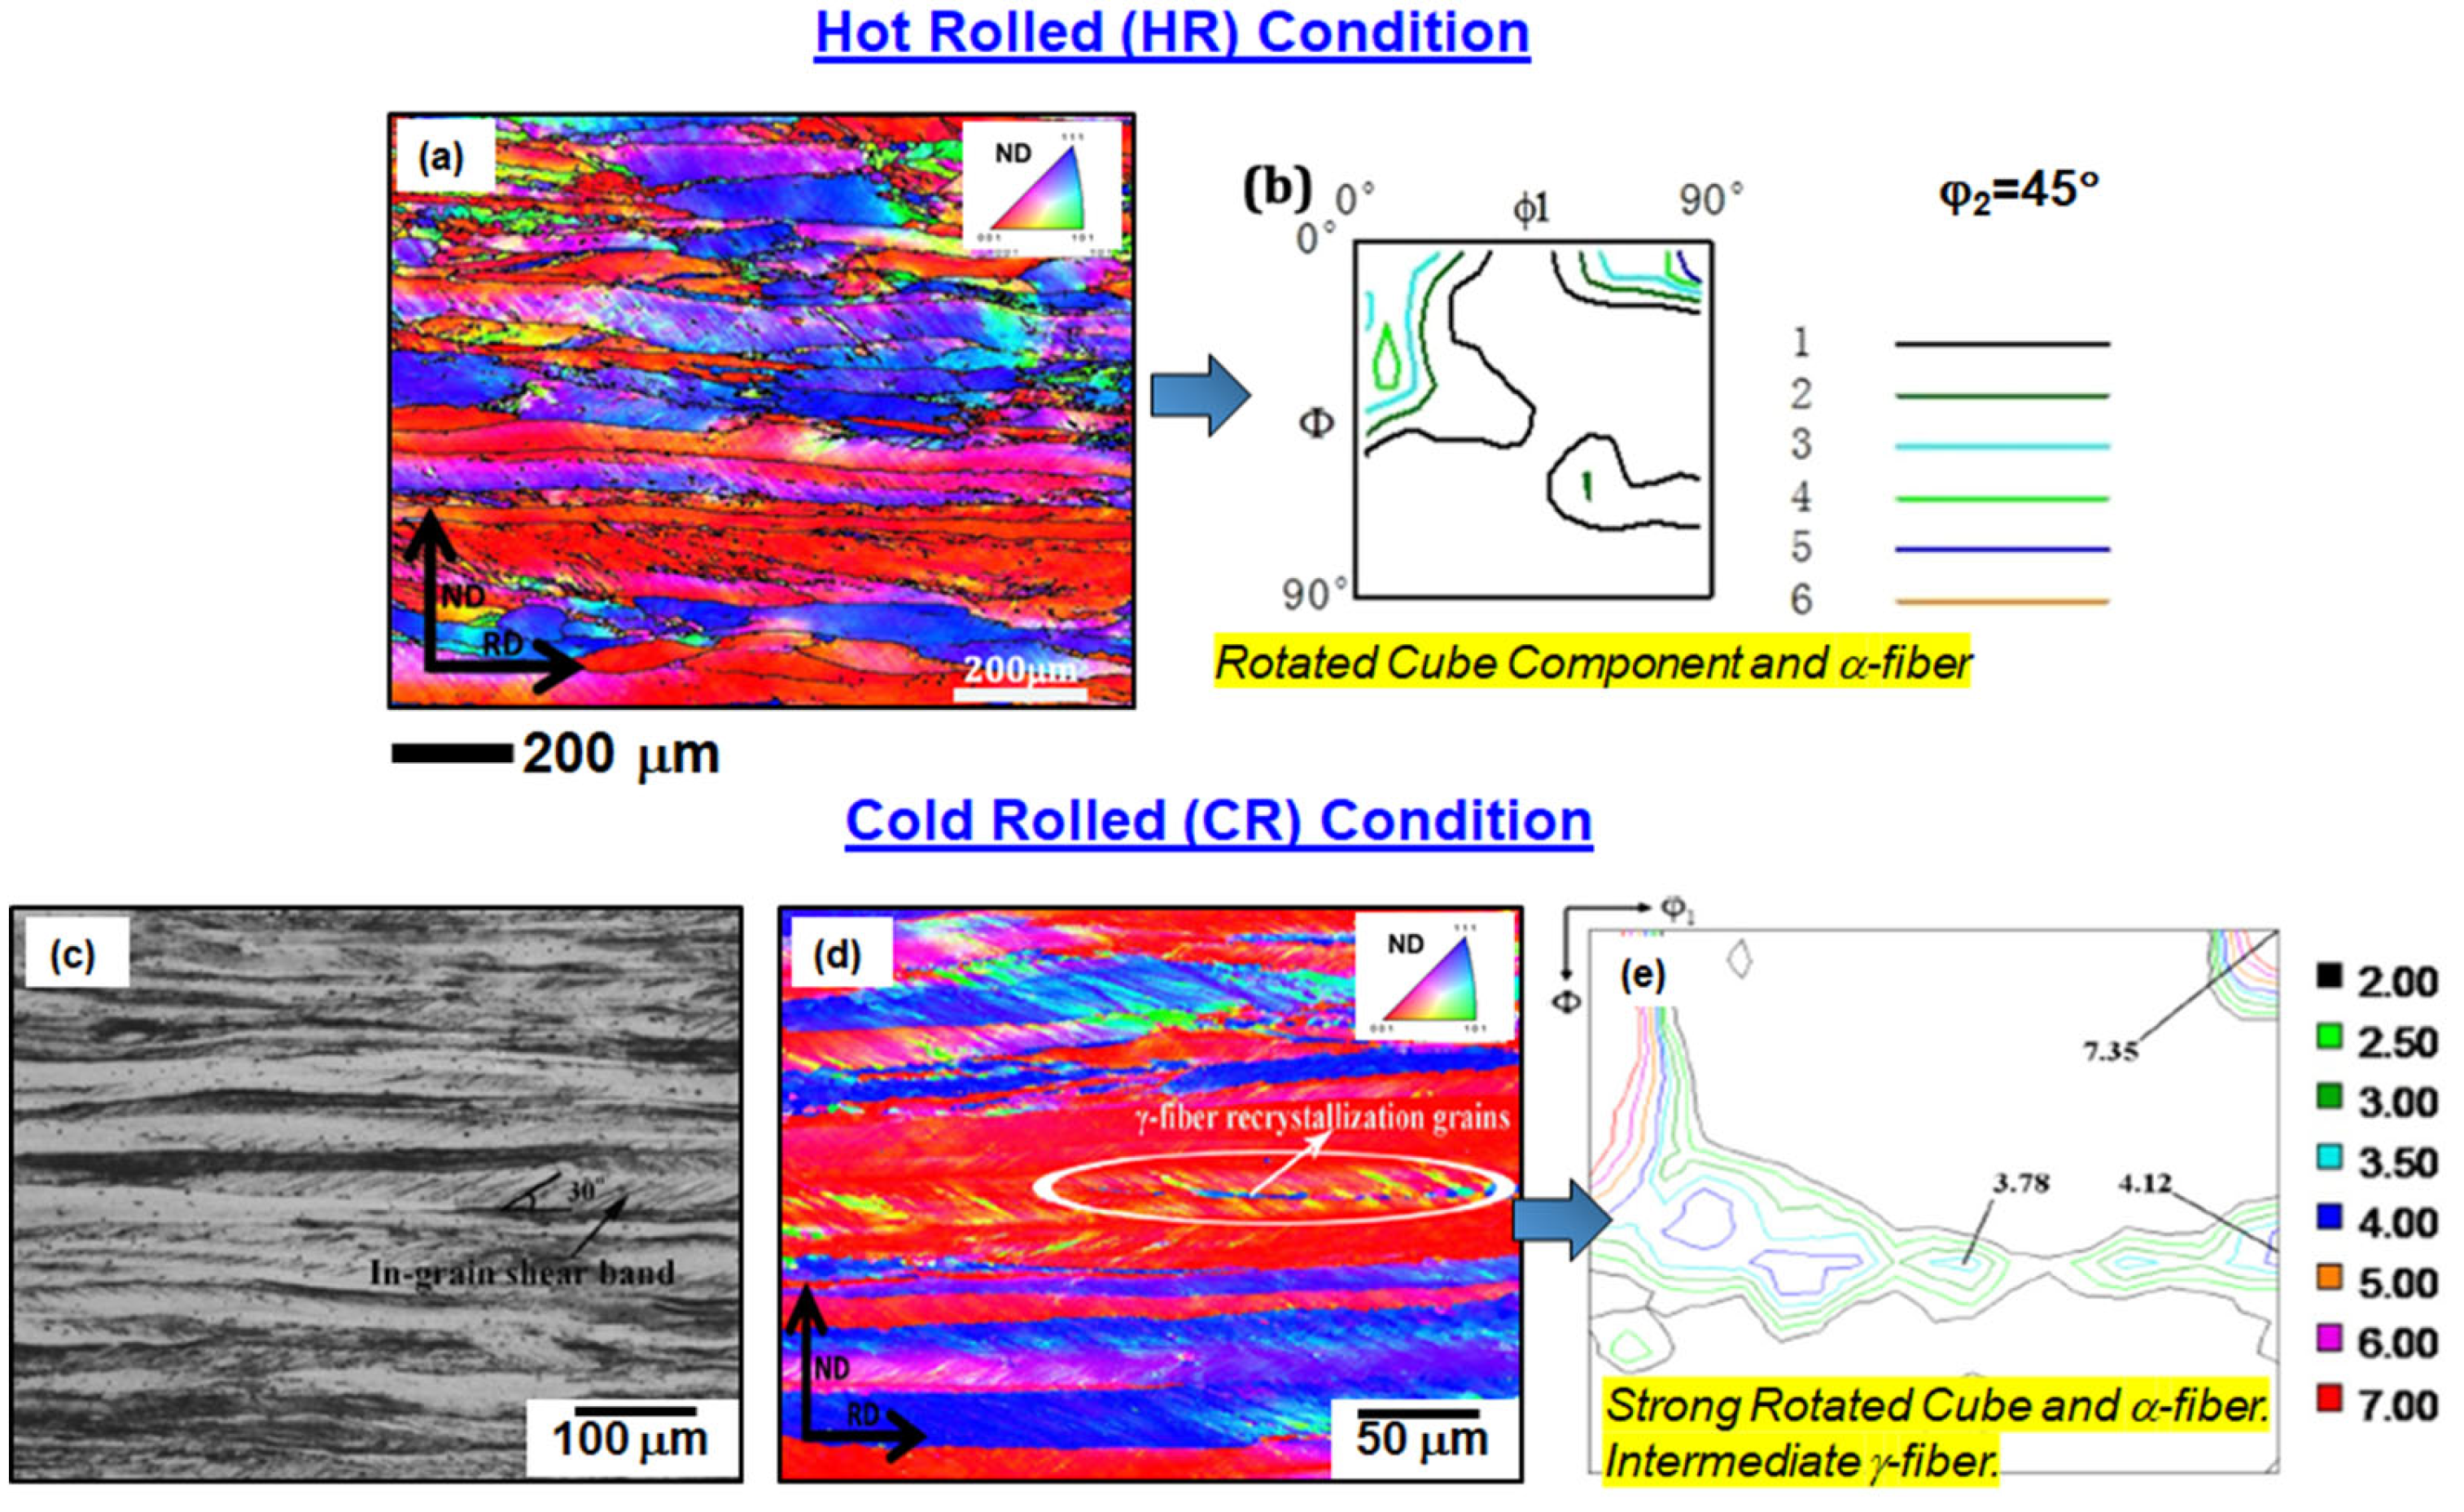
The microstructural evolution during deformation results in deformed and elongated grains along with strain-induced GBs, which appear as micro-bands or SBs [100]. During deformation, the distance between the deformed GBs decreases and these boundaries align themselves nearly parallel to the deformation axis as the strain increases. Consequently, ribbon-like deformed microstructures are formed at higher strains and during CR, and these ribbon-like microstructures transform into chains of somewhat-elongated fine grains [101]. Figure 9 shows the microstructural and texture evolution of Fe-19Cr-2Mo-Ni-Ti FSS during the deformation process [95]. In this study, the FSS was 95% HR at 1150–850 °C, annealed at 1050 °C, and CR to 30% RR. On HR, the formation of elongated grains was observed (Figure 9a). In the center region, a continuous {100} orientation comprised cube ({100}<001>) and rotated cube ({100}<011>) orientations, while {111} and Goss-orientated grains were developed in the surface layer (Figure 9a). Due to the applied shear stress during HR, the formation of Goss-oriented grains primarily occurred within or in the vicinity of the deformed elongated grains with the {111} orientations. On CR, a fish bone-grained structure and some in-grain SBs (30° inclined angle to RD) were observed in Figure 9c and it was reported that these in-grain SBs had γ-fiber orientations [102]. Further to annealing, these in-grain SBs can provide nucleation sites for recrystallization with γ-fiber orientations (Figure 9d) [103]. The CR texture in the center layer mainly consisted of strong α- and weak γ-fiber and a strong {001}<110> component (Figure 9e). Also, it has been reported that CR results in a strong α-fiber texture in all layers, with the maximum in the center [104].
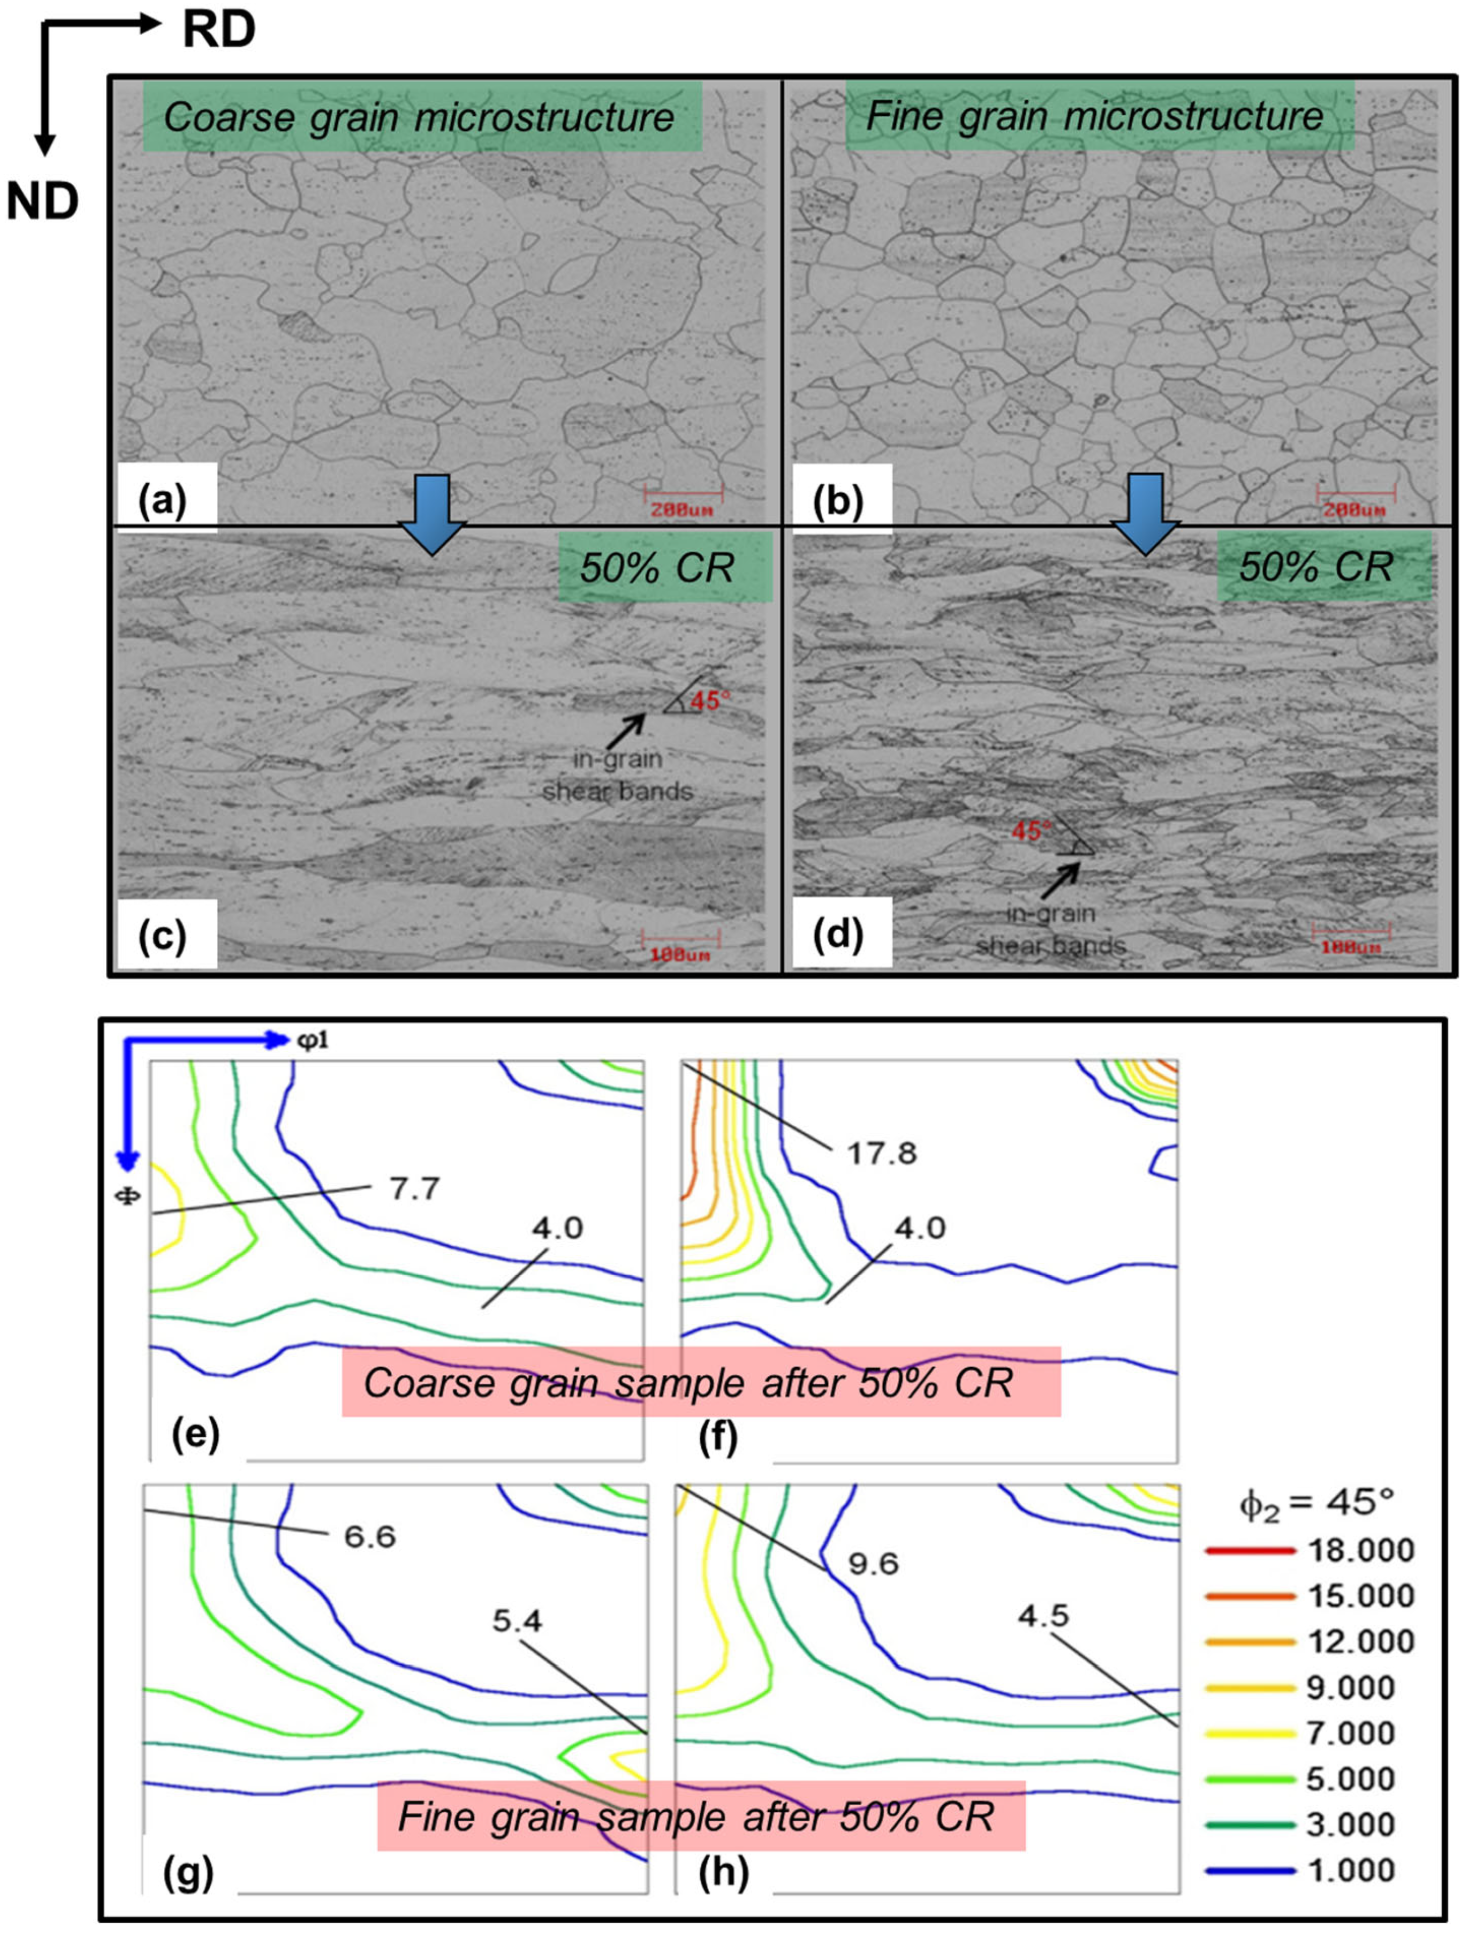
Yan et al. [100] reported that the texture of CR Nb+Ti-stabilized FSS was dominated by a strong α-fiber (maximum between {001}<110> and {112}<110>) and weak γ-fiber texture (<111>//ND). The initial microstructure before deformation can have a significant impact on the microstructure formed after the CR process. The comparison of the initial GS on the microstructure and texture of Nb-stabilized FSS was studied in [105] and is shown in Figure 10. In their study, coarse-grained and fine-grained HR samples were CR to 50% RR. The variation in GS in the initial microstructure of coarse-grained (Figure 10a; GSavg = 110 ± 21 µm) and fine-grained HR (Figure 10b; GSavg = 50 ± 7 µm) samples and its significant impact on the CR are shown in Figure 10c,d.
The flattened and elongated grains along the RD were formed in both samples. However, it should be noted that the spacing between the elongated grains was lower for the fine-grained sample than the coarse-grained sample. Within some grains, in-grain SBs were observed, particularly in γ-fiber grains [106] with an approximately 45° inclination with respect to RD. This non-uniform deformation led to the fragmentation of the microstructure and localized strain within the γ-oriented grains [107]. Campos et al. [108] also reported evidence of significant variations in strain within larger grains (approximately 500 µm). Some grains exhibited a higher number of in-grain SBs, while others had none. Further, the GS had a significant impact on the stored energy. During deformation, the slip processes that occur in the grain become difficult due to the GBs. The reduction in GS can enhance the constraints imposed by GBs, thus promoting more uniform deformation [105]. According to Humphreys [31], the stored energy generally increases as the GS decreases due to low and medium deformations. Further, in the 50% CR coarse-grained sample, the texture was more intense in the center than on the surface (Figure 10e,f). In the center, the texture was dominated by α-fiber and weak γ-fiber; on the surface, the α-fiber occurred at {112}<110> and notably, the γ-fiber was slightly more intense on the surface than the center. In the 50% CR fine-grained sample (Figure 10g,h), the α-fiber was more intense in the center than on the surface. On comparison, it was noted that the γ-fiber ({111}<112>) was more intense in the fine-grained sample than the coarse-grained sample, which can be attributed to the initial GS of the samples. Moreover, in the study by Sakai et al. [109], 430 FSS was HR at 1000 °C without lubrication at 20 m/s and water-quenched at intervals of 3.5–250 ms. The authors observed the heavily sheared zone beneath the surface as a result of redundant shear deformation due to friction and the texture near the surface was mainly consisted of {110}<001>, {110}<112> and {112}<111>. The <110>//ND component density increased, while the <111>//ND component density decreased with an increase in shear strain. They reported that only shear deformation was required for the formation of the {110}<001> component. <110>//ND was the strong component in the severely sheared region (in the absence of recrystallization) [109]. In general, the intensity of rolling texture components becomes more pronounced with higher RRs due to the dislocation slip occurring in the crystallographic slip systems, causing grain rotation towards stable orientations under the applied strain during rolling. However, Lee et al. [110] reported that upon comparison of texture evolution in 80% CR and multi-step cross-rolled (MSCR) 430 FSS (17% Cr), the rolling texture did not develop significantly in the typically CR sample. This is because certain texture components, especially orientations along the {hkl}<110> α-fiber, exhibit stability, thereby resisting substantial changes during the CR process. In contrast, the MSCR samples exhibited significant alterations in the CR textures as the rolling reduction increased. Since the sample was rotated, the highest intensity was observed at the cube, and upon further increase in the rolling reduction, the location of the texture peak gradually shifted towards the rotated cube. Notably, the overall texture of the MSCR sample was weaker than the normal CR sample [110].

4.2. Heat-Treated Microstructure and Texture Evolution

To obtain finer microstructures with relieved strain, heat treatment after deformation is one of the viable solutions. Of course, during this process, there is a change in the microstructure evolution and texture changes in the heat-treated materials. As the crystallographic texture is crucial to improve the formability of FSS, Gao et al. [111] studied the evolution of texture during two different rolling processes of ultra-purified FSS. In one rolling route, CR samples were subjected to a final annealing treatment, whereas in the second route, samples were subjected to intermediate annealing before the final CR and annealing treatment [111]. In the first TMP route, non-uniform γ-fiber recrystallized textures evolved, whereas in the second TMP route, the formation of uniform γ-fiber textures occurred after the final annealing treatment. In comparison, the second rolling process depicted a more homogeneous distribution of grain colonies [111].
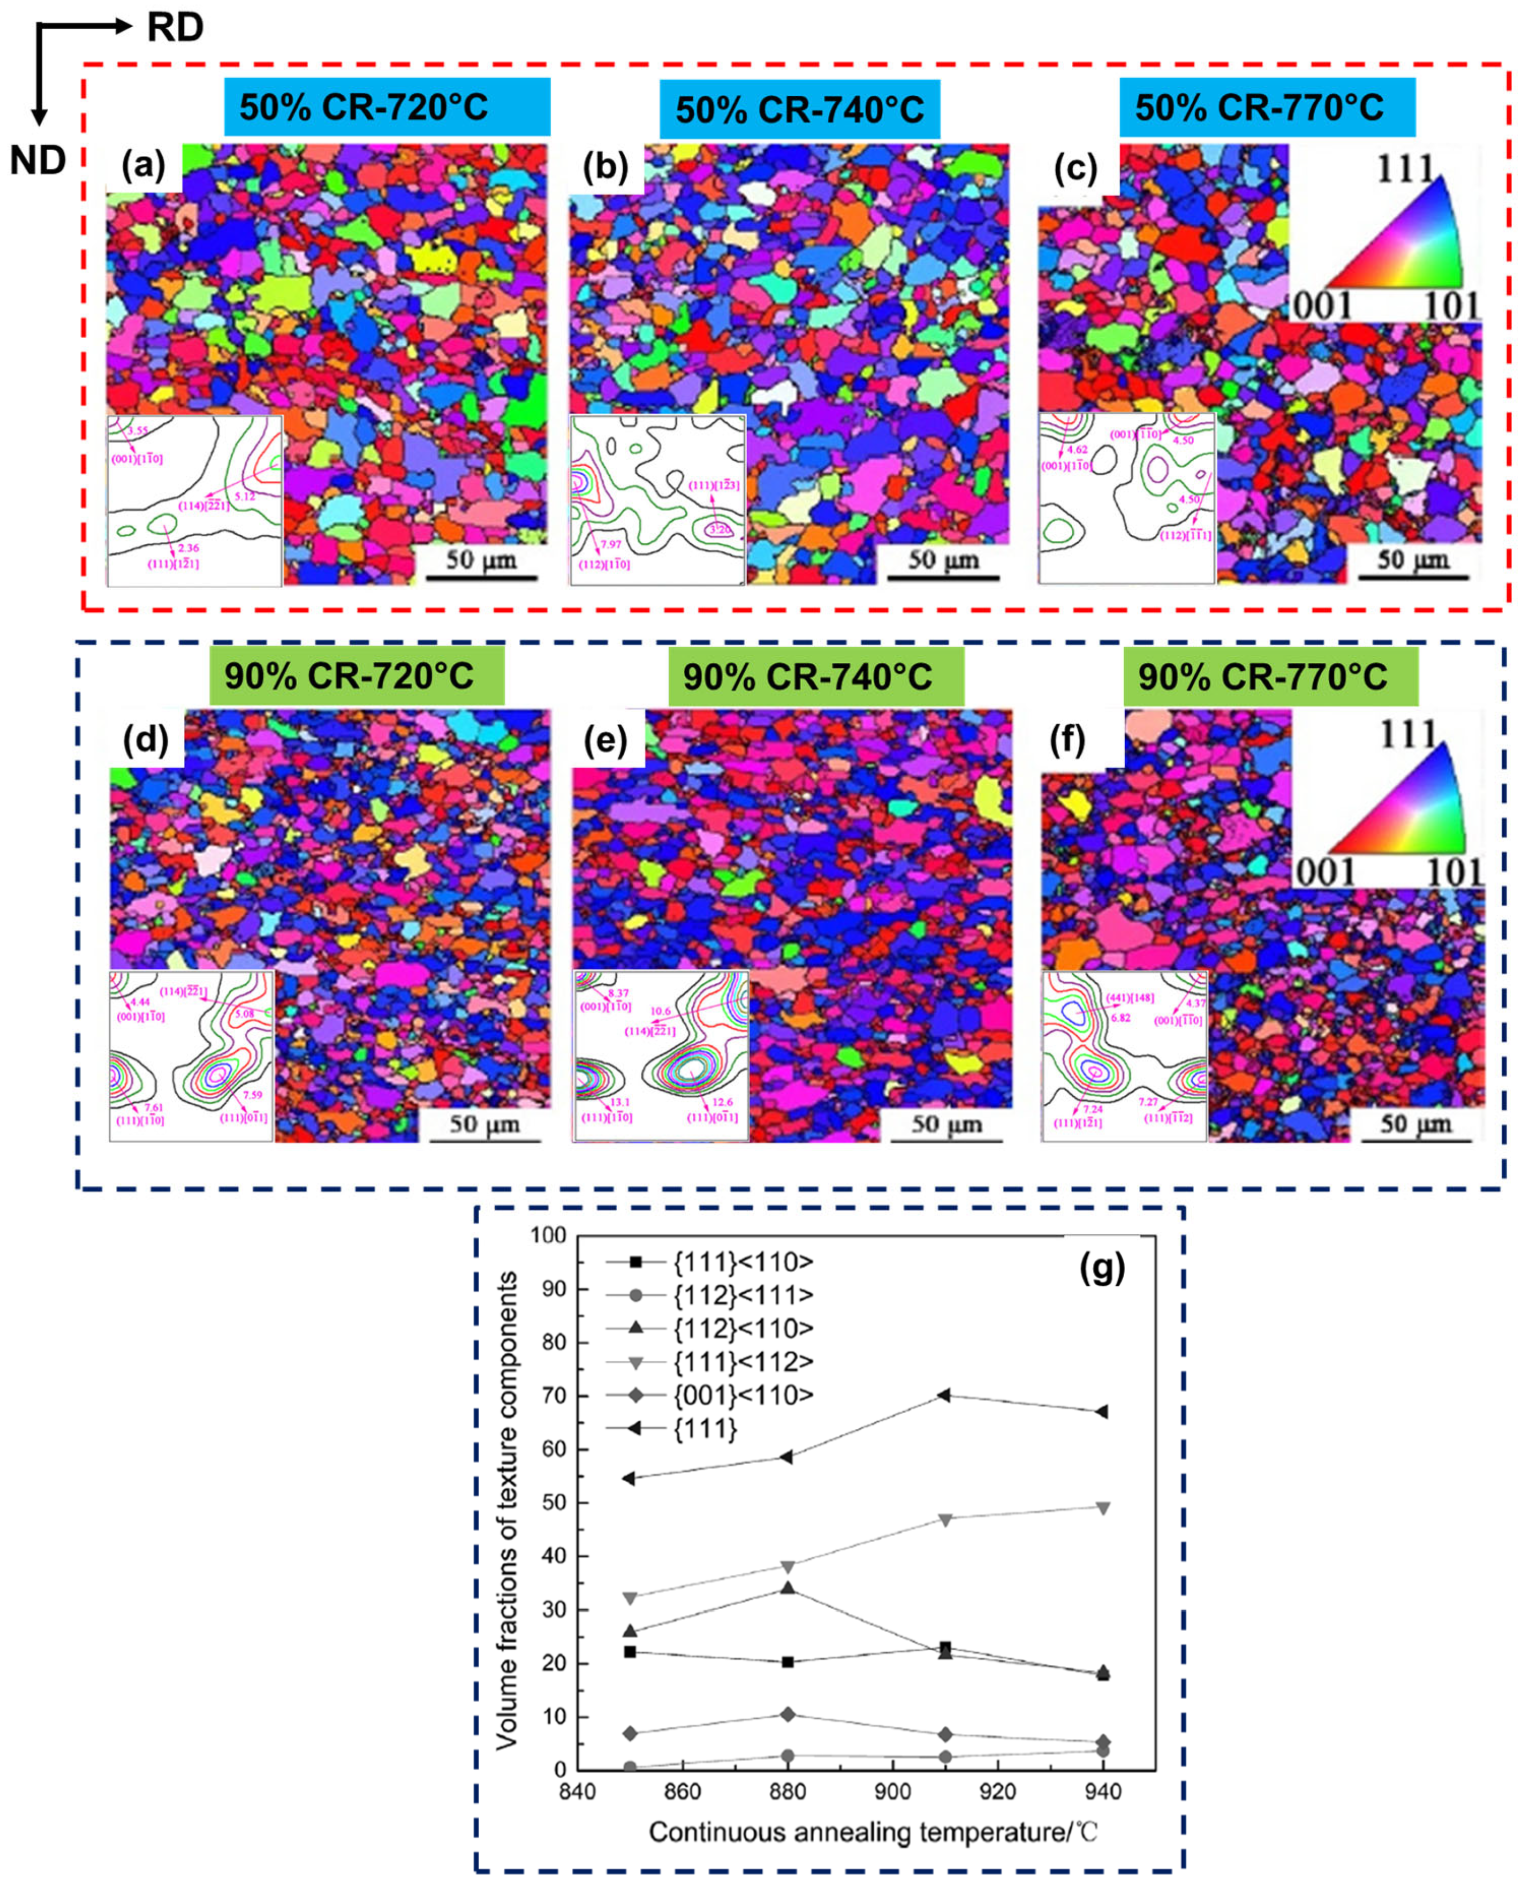
The role of the degree of RRs during CR and subsequent annealing on X2CrNi12 FSS has also been reported, and the evolution of different texture components and their corresponding volume fractions are shown in Figure 11a–f [112]. Figure 11a–c demonstrates the recrystallization of ferrite grains following heat treatment of 50% CR samples. Recrystallized grains are predominantly distributed randomly, with a relatively small number of recrystallized grains exhibiting the {111}<uvw> orientation. Conversely, as shown in Figure 11d–f, the crystal orientation in the 90% CR annealed sheets is primarily composed of {111}<uvw> and partially {112}<uvw> components, with smaller GS.
Upon annealing of 50% CR at different temperatures, the texture was very weak (Figure 11a–c), whereas upon annealing of 90% CR, the texture strength increased and a strong γ-fiber ({111}<110>) was formed, while the α-fiber ({112}<110>) decreased (Figure 11d–f) [112]. As discussed previously in [110], 80% MSCR 430 FSS (17% Cr) showed weak {hkl}<110> orientations, whereas subsequent annealing (700 °C–1 h) resulted in an improved recrystallization texture comprising well-developed {111}//ND γ-fiber throughout the thickness layers. Lu et al. [22] reported that upon annealing to 950–1100 °C for 60 min, few grains were elongated and few grains were recrystallized for annealing less than 1000 °C, and upon increasing the temperature to more than 1000 °C, the grains were fully recrystallized. The authors further reported that as the annealing temperature increases, the texture gradually progresses to γ-fiber from α-fiber [22]. The volumetric fractions of different texture components on CR and continuous annealing treatment in ultra-purified FSS are shown in Figure 11g [113]. It shows that the components of the γ-fiber ({111}<112> and {111}<110>) increase, and the component of the α-fiber ({112}<110>) decreases with continuous annealing [113].
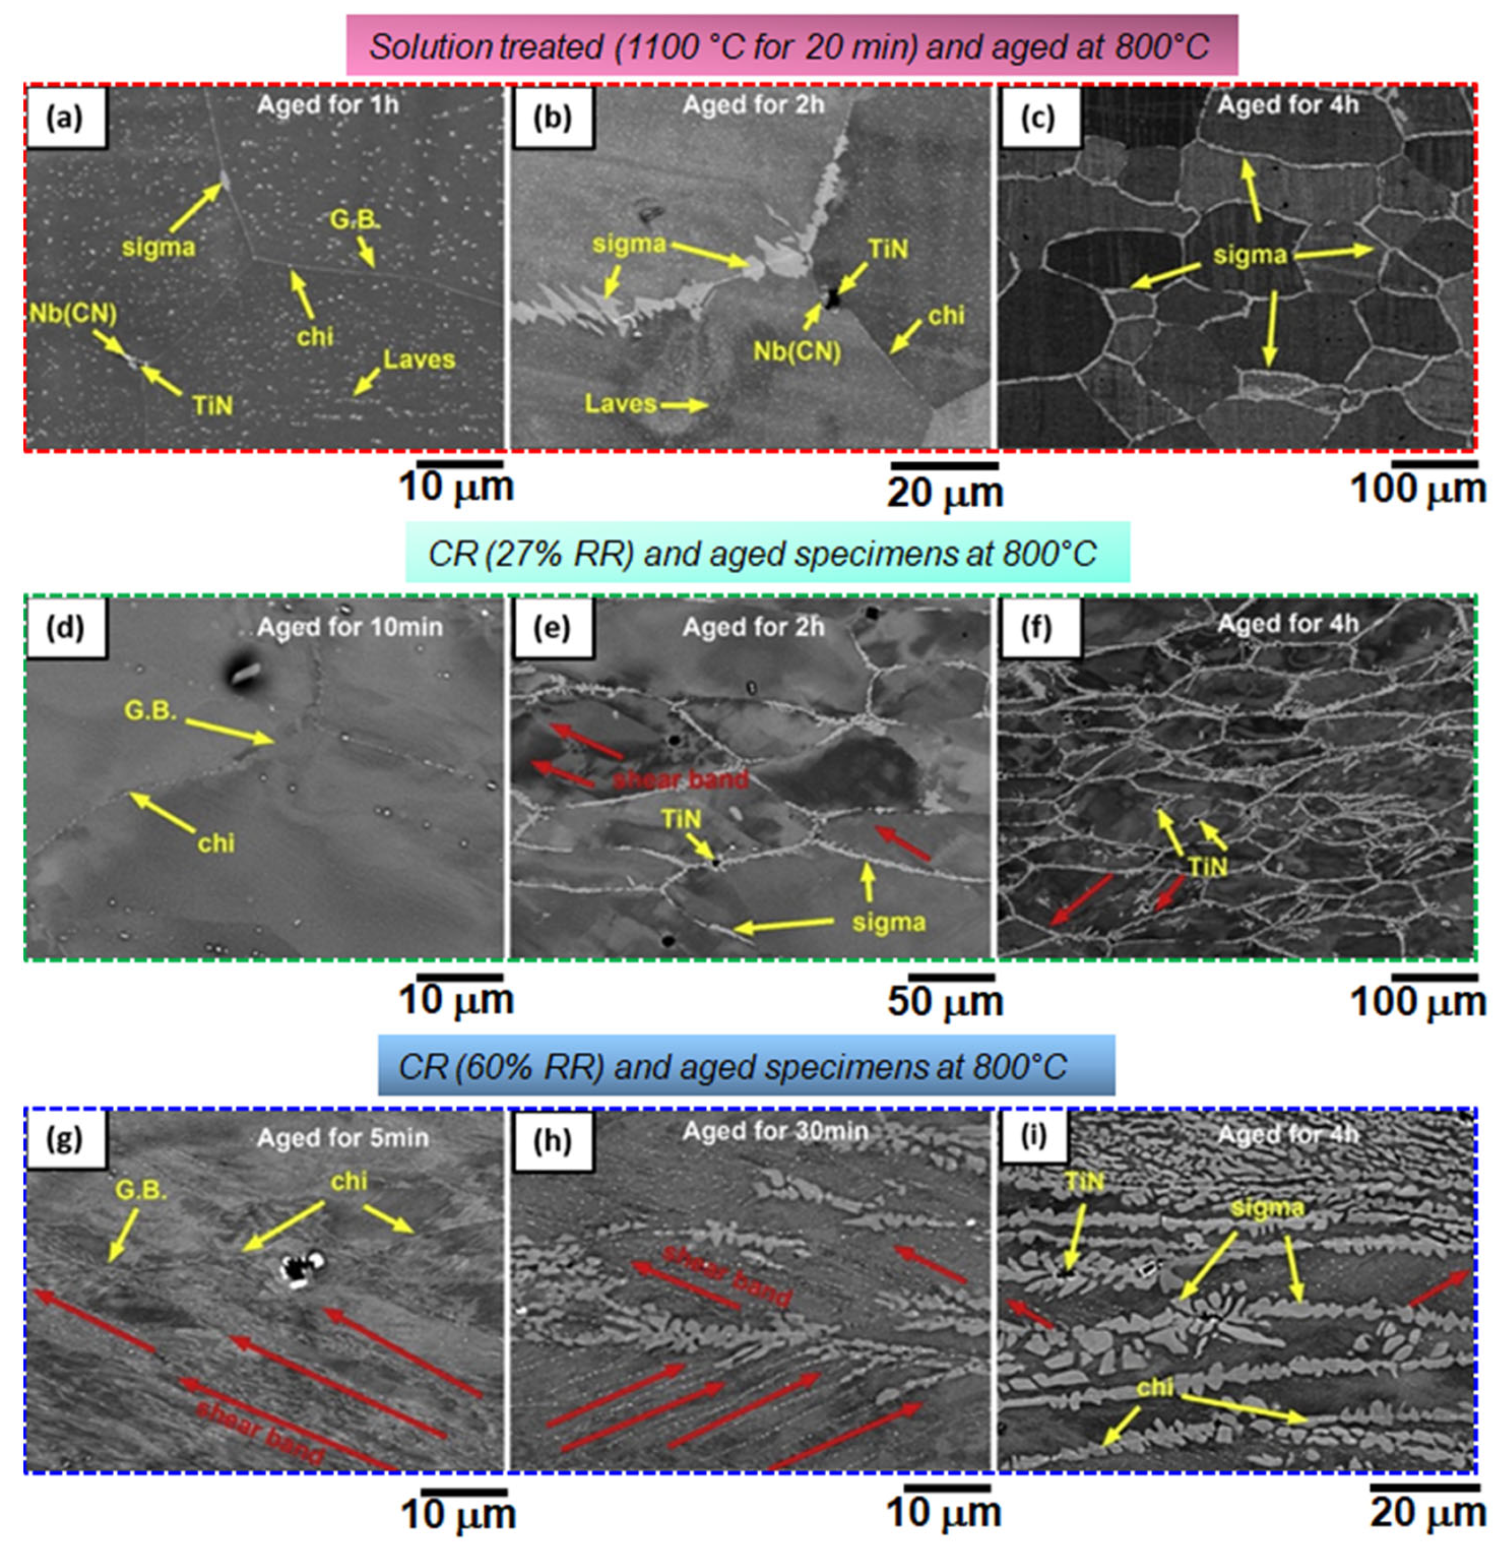
Asymmetric rolling is another way to impose severe rolling deformation in FSSs that results in the formation of more SBs, higher-deformation SE, and increased dislocation slip systems. These SBs fragment the microstructure, which enhances nucleation in the grain interiors and consequently modifies the evolution of texture. Further, higher amounts of Ti or Nb added to the FSS may result in the formation of some detrimental intermetallic compounds during heat treatment. The sigma phase (σ), chi phase (χ) and Laves phase can precipitate during HR or subsequent solution treatment, which induces cracks or fractures during CR for industrial applications [114,115]. It was reported that the χ phase formed during the heat treatment of 29Cr-4Mo-2Ni steels at 760 °C [116]. Also, Brown [117] reported the formation of the σ, χ, and Laves phases at a temperature range of 600–1000 °C for Nb- and Ti-stabilized FSSs. Figure 12 shows the formation of different intermetallic compounds in 27Cr-Mo-2Ni super-FSS in the solution-treated (1100 °C for 20 min), CR (≈27% RR) and CR samples (60% RR) after HR and aged at 800 °C for different time periods, respectively [118].
The formation of titanium nitride (TiN), σ, χ, and laves phases are clearly visible after aging; however, the TiN were formed during the solidification process and randomly distributed and fragmented during CR. On the solution-treated samples (Figure 12a–c), the σ and χ phases were formed along the GBs. The Laves phase was also observed inside the grains, which had a GS of 50–500 nm (Figure 12a). The σ phase grew as a dendritic structure after a prolonged aging time (Figure 12b). Further increases in the aging time caused the σ phase to dominate all the GBs (Figure 12c). In the HR (Figure 12d–f) and RTR (Figure 12g–i) samples, the Laves phase was observed at the sub-GBs and the χ and σ phases were precipitated around the TiN particles and SBs with prolonged aging time. The formation of intermetallic compounds enhances microhardness but decreases tensile elongation, resulting in ductile-to-brittle transformation [118]. Gao et al. [119] reported that during the low-temperature rolling (start at 800 °C and finish at 730 °C) of 17% Cr FSS, a considerable amount of small and dense TiC precipitates were formed, which persisted in the final sheet even after annealing. These precipitates facilitating the nucleation of randomly oriented grains by promoting the formation of an inhomogeneous CR microstructure. Also, the presence of precipitates at the deformed GBs strongly restricts the growth of recrystallized grains by impeding GB migration, leading to a weakening of the γ-fiber recrystallization texture and hence a decline in the formability of the final sheet. On the other hand, in samples with sparsely distributed coarse precipitates (high temperature HR: starting at 900 °C and finishing at 820 °C), a robust γ-fiber developed. Hence, the size and distribution of precipitates formed during HR significantly influence the nucleation of randomly oriented grains and the growth of recrystallized grains during recrystallization annealing [119]. Further, it has been widely accepted that the development of {111} orientation is primarily influenced by the resistance found in the textures associated with {100} orientations, while the {111} textures exhibit relatively less resistance and the presence of fine precipitates can increase the resistance to γ-fiber recrystallization nucleation. When numerous precipitates were dispersed in the 950 °C annealed sheet of CR Fe-19Cr-2Mo-Nb-Ti FSS, they acted as obstacles, impeding crystal slip and accelerating crystal rotation, which led to an enhancement of the α-fiber texture and a weakening of the γ-fiber texture [95]. As the annealing temperature increased, the precipitates tended to coarsen, resulting in a decrease in the resistance of γ-fiber recrystallization nucleation and a strengthening of the γ-fiber texture [95].

5. Discussion

Deformation mechanisms in BCC materials primarily consist of slip deformation. Sometimes, severe deformation leads to the formation of SBs, α″ or mechanical twins, which also serve as alternative routes for plastic deformation in BCC materials [120]. Further annealing treatment is necessary to soften the material to enhance its formability for use in automotive, aerospace, and ship building applications [28]. Researchers continually seek the optimal balance between mechanical strength and ductility by using the best deformation routes. As previously discussed, there have been numerous studies addressing the types of deformation-induced products that evolved in β-Ti alloys [52], the characteristics of GBs for DRX grains [65], orientation micrography for rolled Ta sheets [3], and the effect of W addition on the deformation and texture behavior of Ta alloys [88]. Discussions also included the preferential formation of SBs in FSS [95], the effect of annealing temperature on recrystallized microstructure and texture in FSS [113], and the formation of precipitate/intermetallic in aged FSS alloys [118]. This information is crucial for gaining a deeper understanding of the deformation and annealing behavior in BCC metals/alloys. The following sections elaborate on individual topics for β-Ti, Ta, and FSS alloys.

5.1. Slip and Twin Deformation in β-Ti Alloys

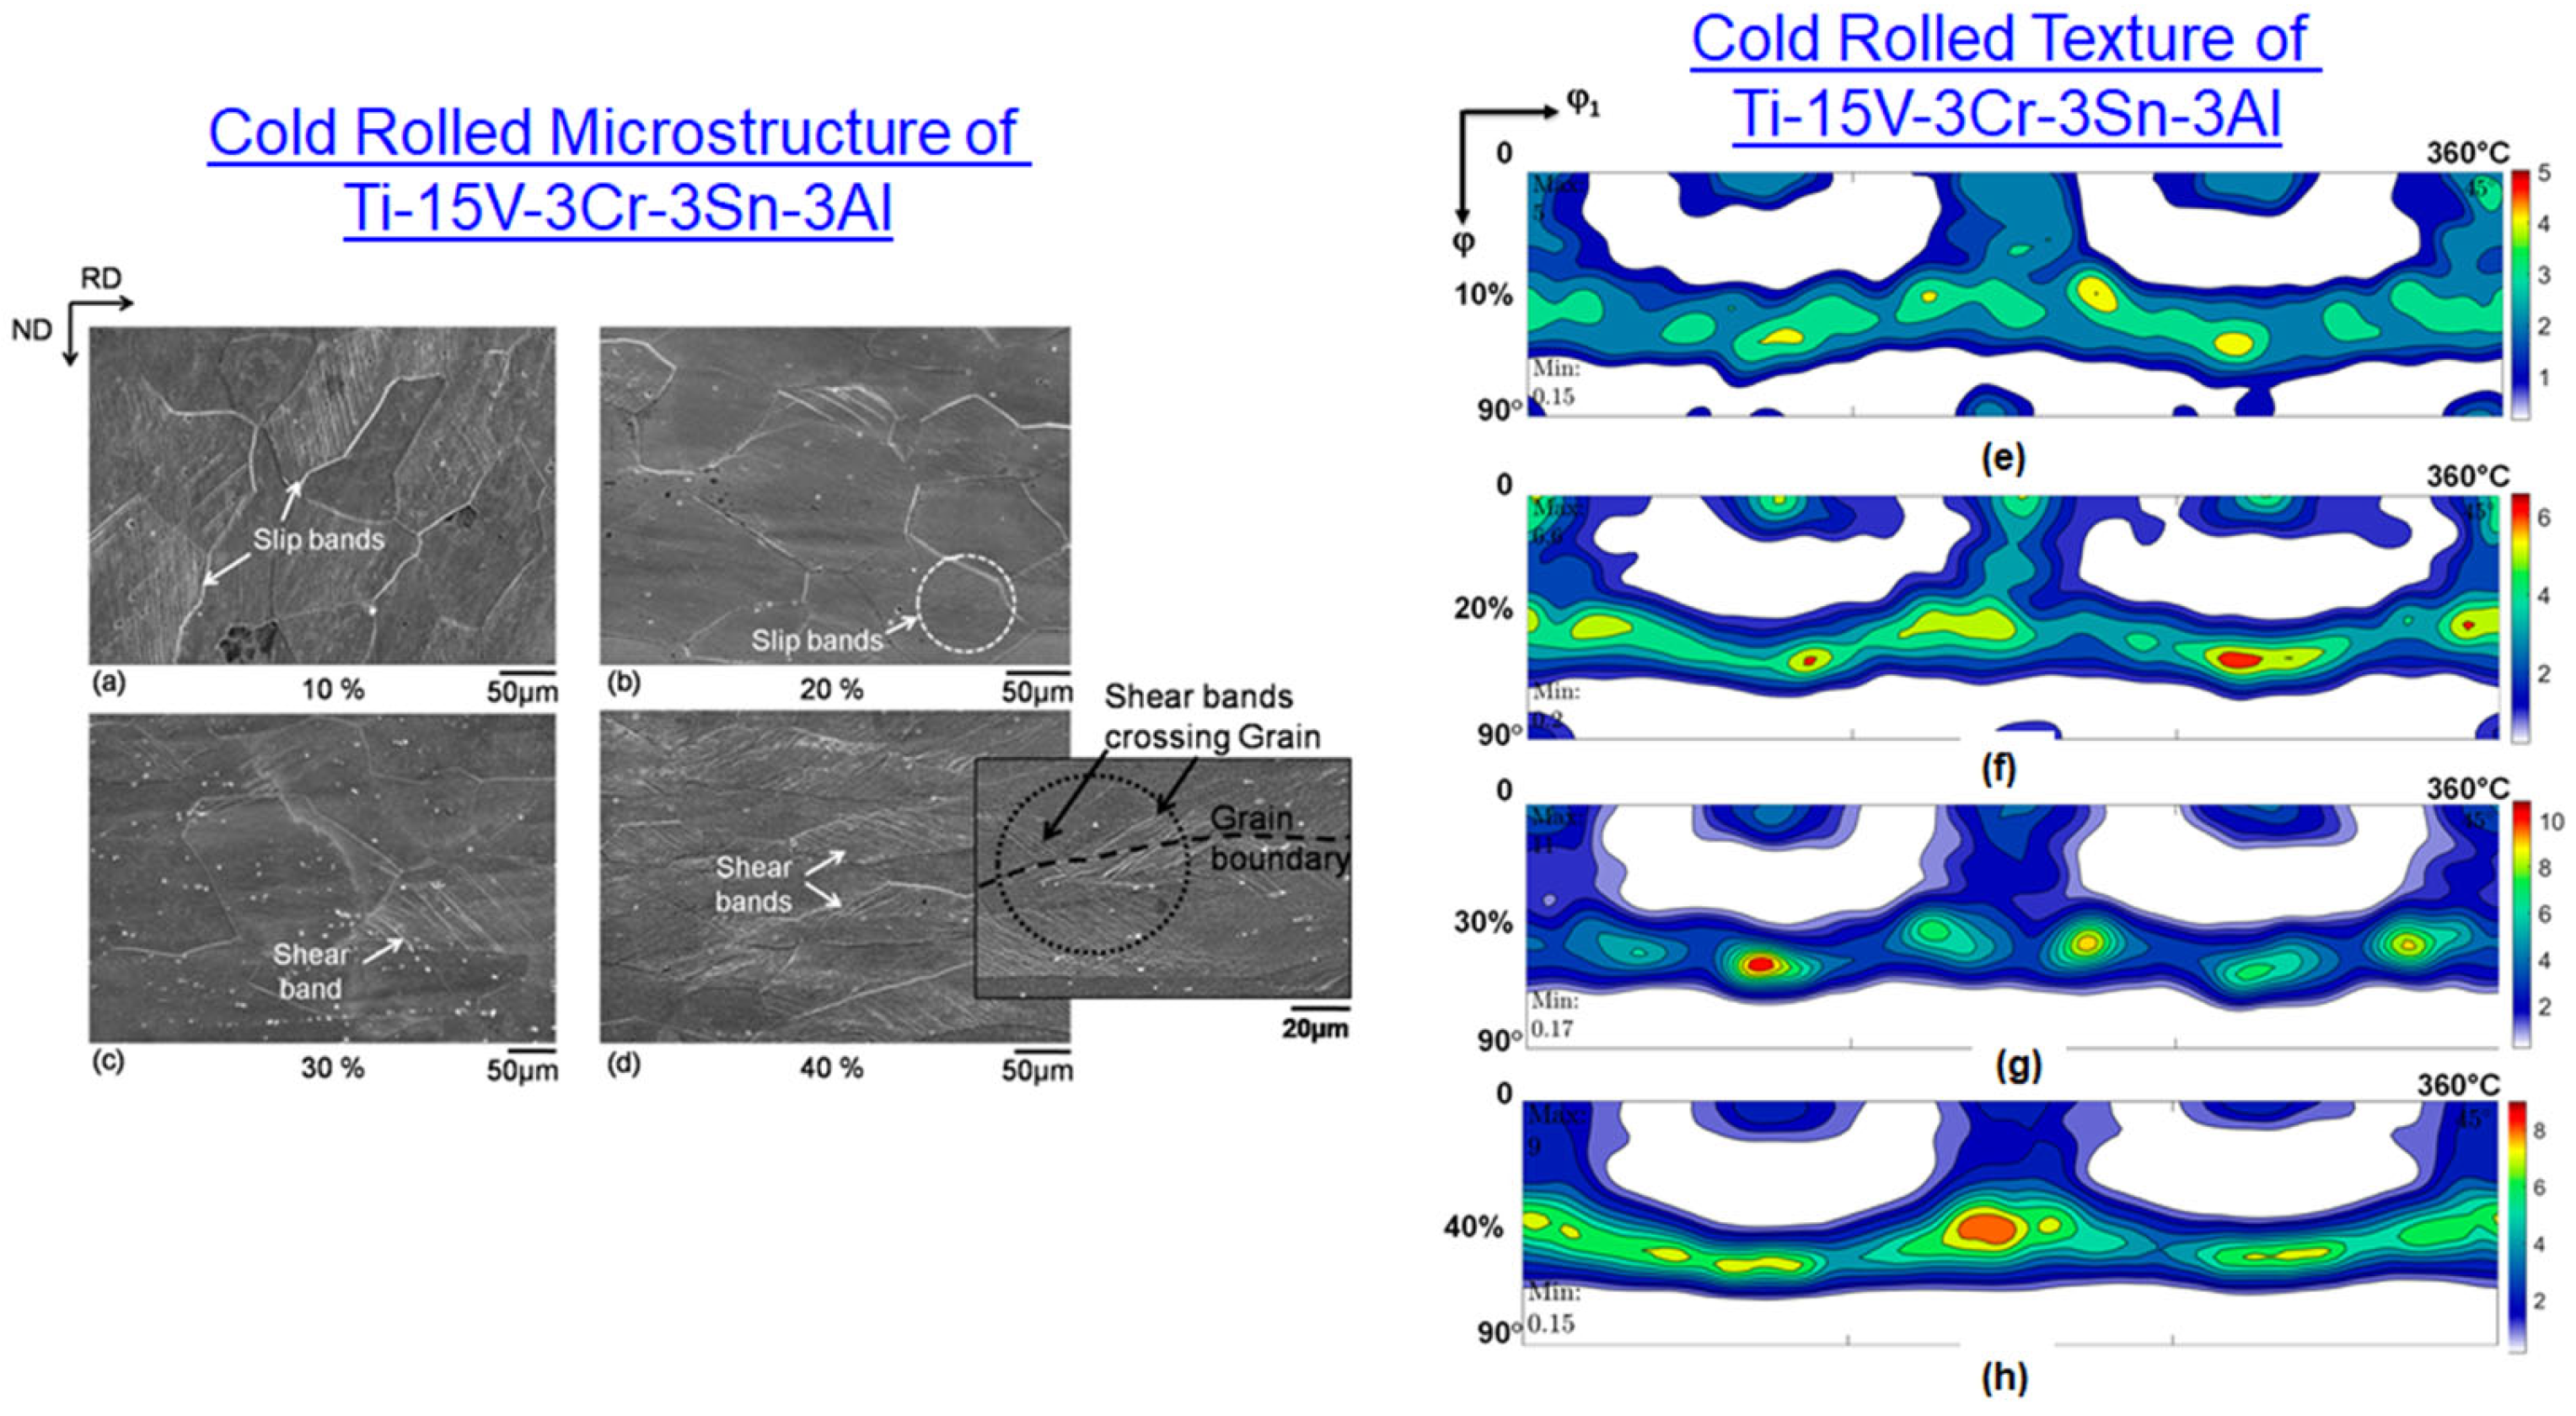
During the CR of β-Ti alloys, slip is the primary deformation mode, leading to slip band formation. This occurs along specific crystallographic planes and directions, known as slip systems. β-Ti alloys have 12 slip systems, with {110}<111> being the most common mode of deformation [121,122]. β-Ti alloys also slip on planes other than {110} in the <111> direction, such as {112}<111> and {123}<111>. Severe deformation may activate additional deformation modes, such as SIM, mechanical twins, and SBs in deformed β-Ti alloys [48]. It is important to note that, similar to stacking fault energy in FCC alloys, β-phase stability can act as a criterion for the deformation mode in BCC β-Ti alloys. Low- and intermediate-stability β-Ti alloys exhibit SIM along with other deformation modes during CR, while alloys with the highest stability (a high fraction of β stabilizers) primarily exhibit dislocation slip at low strain rates and twinning at high strain rates [123]. Mahadule et al. [48] discussed the evolution of slip bands and differentiated them from SBs in a cold-rolled Ti-15333 alloy (Figure 13a,b). It was observed that at lower RRs, slip bands formed, but as RR increased, deformation shifted from slip to shear banding. The evolved SBs crossed GB interfaces, indicating the non-crystallographic nature of SBs in 30% and 40% RRs Ti-15333 samples (Figure 13c,d). A macro-texture study was also conducted for the cold-rolled Ti-15333 alloy samples (Figure 13e–h). It was noted that the 30% rolled sample showed the highest texture intensity of 11, which decreased to 9 with further deformation. The formation of a large fraction of SBs could be the cause of decreased intensity in the 40% RR sample. A stronger intensity around the γ-fiber than the α-fiber was observed in the cold-rolled Ti-15333 alloy samples [48].
In β-Ti alloys, {332} twinning occurs on the {332} crystallographic plane and is unusual for other BCC materials. {332} twinning supports a high work-hardening rate, improving mechanical properties and enhancing ductility [124]. This plane is known as the twinning plane, with twinning occurring along the <113> direction. It has been reported in stable β-Ti alloys, dislocation slip is the dominant plastic deformation mode, while in low- and intermediate-stability β-Ti alloys, additional deformation mechanisms such as {112}<111> and {332}<113> twinning, as well as α″ transformation, are activated [125]. Lai et al. [124] reported the initiation and propagation of {332} twinning as a fundamental deformation mode in Ti-36Nb-2Ta-Zr and other β-Ti alloys [126]. During uniaxial deformation (in situ tensile testing), α″ was also observed near the surface adjacent to {332} mechanical twins [45,124]. Further annealing at 900 °C transformed the α″ phase into the adjacent twin rather than into the β matrix, indicating that the {332} twin nucleated within α″ martensite [124]. It has been noted that {332}<113> twins are characteristic of either a high density of dislocations or stress-induced ω depending on β phase stability. In alloys with higher β phase stability, parallel straight dislocations traversing the {332}<113> twins have been observed. Detailed discussions about the evolution and propagation of {332}<113> twins can be found elsewhere [124,126].

5.2. Schmid Factor (SF) and Ta Alloys

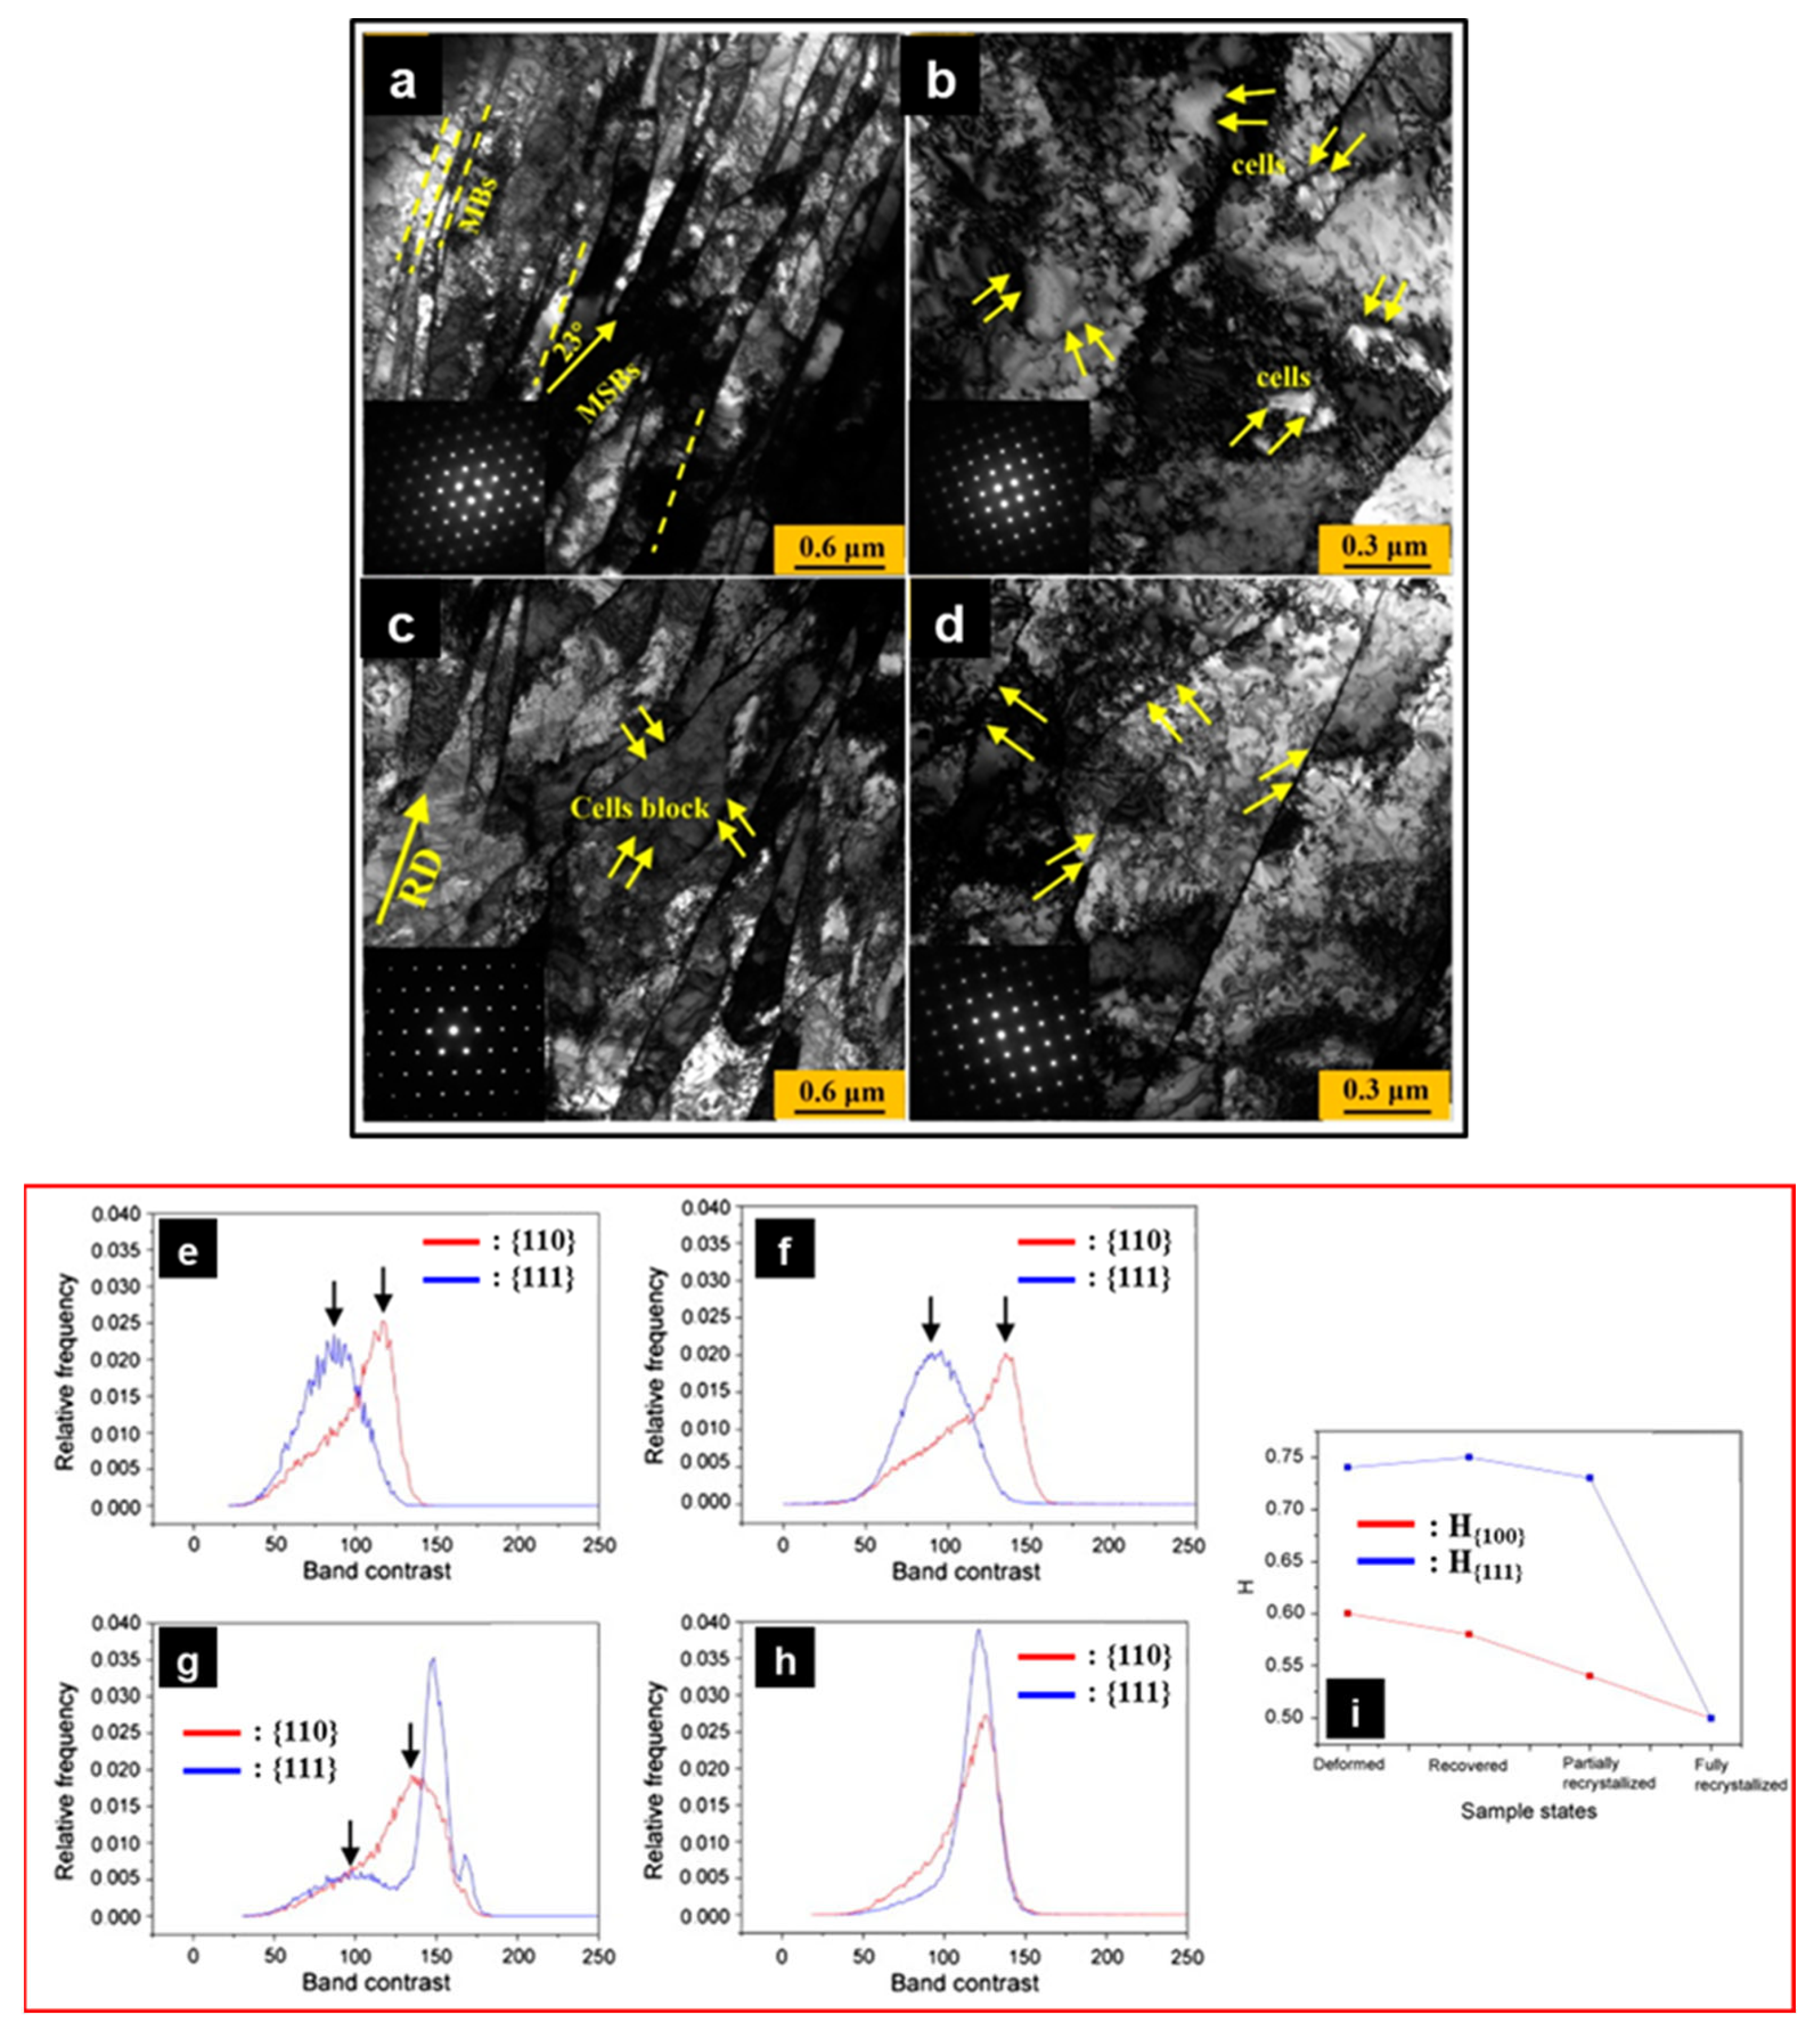
Clock rolling provided better results than UDR for Ta in terms of the homogeneous distribution of microstructure and crystallographic texture through thickness. The deformation behavior between these two strain paths was analyzed using the Schmid factor (SF) and activated slip systems [3]. A larger SF value indicates the activation of single-slip systems, while a smaller value suggests the activation of multiple-slip systems. The SF difference ratio of α- and γ-fibers across the thickness indicated that the {111} matrix in the UDR sample exhibited larger values, especially in the center region, while the {110} matrix had relatively lower values. If one slip system is more active than others, concentrated shear on a specific plane during the rolling process is likely. This concentrated shear would contribute to the development of a highly deformed substructure within the {111} matrix of the UDR sheets [127], resulting in numerous straight micro-bands (parallel walls of densely packed dislocations) and micro-SBs observed in the {111} matrix of the UDR sheets (Figure 14a). In contrast, only a few dislocation cells were visible in the {100} matrix (Figure 14b). This significant disparity in the morphology and density of the dislocations in Figure 14a–d, due to the SF difference ratio values, especially in the central region, effectively widened the gap in stored energy between the {111} and {100} matrices. In the case of the clock-rolled sample, the deformation exhibits a relatively uniform distribution, and multiple slip systems are activated in both the {111} and {100} matrices (lower SF difference ratio) along the thickness. The activation of multiple slip systems can lead to the reorganization and elimination of dislocations due to changes in the strain path, resulting in the formation of cell blocks (Figure 14c). Furthermore, the {100} matrix displayed increased activity, leading to the formation of numerous randomly arranged dense dislocation walls (Figure 14d). This increased activity can be attributed to the activation of latent slip systems, a beneficial way to eliminate the orientation-dependent stored energy distribution. Moreover, the addition of varying fractions of W in Ta resulted in varied textures during rolling [88]. The addition of W increases the dislocation friction stress and the slip systems in Ta [18]. Different types of shear banding get activated in the same orientation with varied W contents (Ta-2.5W and Ta-10W; Figure 7e–h). The trace of the SBs in the Ta-10W alloy is consistent with {112} slip planes. Meanwhile, the trace of the SBs in the Ta-2.5W alloy lies on both {110} and {112} slip planes, which is typical behavior for rolling textures of BCC metals considering {110}<111>, {112}<111> and {123}<111> slip systems [128]. Therefore, different slip systems are activated with varied W contents, resulting in different rolling textures.

5.3. Ridging in FSSs

The forming of FSSs results in ridging along the RD, an undesirable phenomenon [97]. Ridging usually forms ridges and valleys along the RD during tensile deformation [97], significantly affecting the material’s surface finish and requiring additional finishing (polishing) operations to improve it. Typically, the ridges have a depth of approximately 20–50 µm [129,130]. During rolling, numerous elongated grain colonies with similar crystal orientations form and persist even after annealing. The presence of these elongated grain colonies leads to localized strain and banding, which increases surface roughness during forming [130], a challenge that can be addressed through microstructure and texture optimization [130,131,132]. By controlling the development of coarse bands and texture, crystallographic anisotropy can be minimized. The development of different ferrite GSs after the TMP causes different crystallographic textures, playing a significant role in ridge formation [133,134]. According to Patra et al. [131], two phenomena cause ridging: (1) as per the Hall–Petch effect, the clustering of different GSs or GS bands can yield differently under tensile deformation, and (2) differential plastic deformation caused by the clustering of GSs is ascribed to a local difference in the Taylor factor. Correlation between ridging and crystallographic texture can also be made, as specific orientations may support ridging either after cold deformation or post-annealing deformation. According to Ray et al. [99], the stored energy in cold-rolled BCC sheets follows the order SE{111}<uvw> > SE{112}<uvw> > SE{110}<110> > SE{110}<001>. A significant reduction in CR promotes the deformed orientation of {111}<uvw>- or γ-fiber-oriented grains, resulting in higher stored energy and providing a greater driving force for recrystallization [135]. During rolling, grains at the surface experience shear strain, while grains in the central layers undergo deformation primarily due to plane strain. Consequently, notable texture gradients emerge, with {001}<110> and {112}<110> components predominantly forming in the central layers, while the Goss component prevails in the surface layers [136]. After recrystallization, the transformation of the rotated cube ({001}<110>) component into the {111}<112> component is notably slow due to limited stored energy. As a result, numerous {001}<110> colonies persist both during the rolling and subsequent annealing processes. These rotated cube-oriented grain colonies exhibit distinct plastic deformation characteristics compared to the surrounding matrix of FSS, influencing the height of ridges formed during the forming process. A decrease in the volumetric fraction of {001}<110> resulted in increased ridging resistance [136].
Furthermore, the Goss orientation contributes to ridging formation, a typical characteristic of the BCC shear deformation texture observed after HR [136,137]. Studies [138] have suggested that enhancing the formability of ferritic steels can be achieved by increasing the plastic strain ratio (r value), which is strongly associated with the {111} recrystallization texture. The correlation between the formation of coarser grains and ridging resistance in 409L FSS has been reported, as shown in Figure 15 [131]. All the samples were HR at 1170 °C for 3 h and then (a) CR (70%) + annealed (980 °C, 2 min), (b) annealed (850 °C, 6 min) + CR (70%) + annealed (980 °C, 2 min) and (c) annealed (940 °C, 6 min) + CR (70%) + annealed (980 °C, 2 min). Accordingly, the formation of ridges was observed in Figure 15a–c. The surface roughness profile (Figure 15d,e) revealed that the maximum profile peak height was for the sample in Figure 15a, and the minimum was for the sample in Figure 15c. In the samples in Figure 15a,b, coarse grain-sized bands were observed in the thickness section of the tensile-strained samples; however, finer and more homogeneous grains were observed in Figure 15c. Therefore, the sample in Figure 15c was free from ridges, and also showed a higher r-value (2.1) compared to its counterparts. The authors concluded that the formation of coarser grains should be prevented to avoid ridging and that the annealing temperature (to prevent the formation of coarser grains) should be above 940 °C prior to CR and annealing [131]. The impact of textures on the r-bar values for Fe-19Cr-2Mo-Nb-Ti FSS is shown in Figure 15i, which demonstrated that the {111} recrystallization texture significantly reduces ridging [95]. The formation of a strong γ-fiber is noted to be beneficial for the formability of FSSs [112]. The significance of a two-step CR process and final annealing to enhance the ridging resistance of high-purity FSS was employed by Gao et al. [139,140]. Furthermore, Liu et al. [141] reported differences in microstructure and texture evolution in HR and CR FSS. They observed that as CR thickness reduction increased, a gradual strengthening in the {223}<110> component occurred. Simultaneously, the {111}<121> component intensified, and the deviation from the ideal γ-fiber axis weakened after annealing. Higher CR RRs resulted in a finer microstructure and a greater fraction of <111>//ND-oriented grains, leading to an outstanding combination of strength and formability [141].

6. Conclusions

In the current review, TMP and its impact on microstructure and texture evolution were thoroughly investigated for β-Ti and Ta alloys, as well as FSSs. Various features of a deformed microstructure in BCC materials, such as grain fragmentation, deformation heterogeneities, SBs, and SIM formation, were discussed for the aforementioned alloys. Similarly, texture evolution during deformation and annealing treatment and the effects of deformation heterogeneities, severe plastic deformation, the strain rate, the deformation temperature, and the strain path effect on the evolved crystallographic texture were examined for various grades of given BCC metals/alloys. A concise summary is provided for each alloy case as follows:
  • SIM (α″/α′), SBs, deformation induced ω, and mechanical twins are typical deformation-induced products that form during the plastic deformation of β-Ti alloys. The density of these products increases during plastic deformation, serving as an additional deformation mode. The evolution of α (αGB, αWGB, transgranular α) and ω (isothermal and athermal) depends on the heating temperature range and cooling rate. The α-phase, isothermal ω and athermal ω phases precipitate during low-temperature heat treatment and quenching, respectively. The development of crystallographic texture in cold-rolled β-Ti alloys typically shows the evolution of α- and γ-fiber texture components. Furthermore, hot rolling contributes to the formation of DRX grains, which diminish the strength of the texture. During hot deformation, grain boundary serrations contribute to DDRX, while the progressive rotation of subgrains suggests the CDRX mechanism.
  • The rolling texture of Ta and Ta-W alloys results in the formation of α- and γ-fiber. The homogeneous distribution of through-thickness orientations depends on the rolling strain path. Clock rolling leads to a homogenous texture through thickness compared to UDR. With the addition of W in varying contents, the development of texture in Ta-W alloys differs from pure Ta as various slip systems are activated with the varied W content. The Schmid factor (SF) shows orientation dependency in individual grains of deformed Ta and Ta-W alloys. In particular, in the center region, the {111} matrix exhibits a significantly higher SF, while the {110} matrix exhibits a relatively lower SF. This SF difference is due to varying concentrations of shear deformation within the {111} and {110} substructures. Higher orientation gradients in {111} grains were observed in pure Ta, attributed to the evolution of micro-SBs. In Ta-2.5W, {111}<112> oriented grains exhibited a higher intensity of SBs compared to {112}<110>-oriented grains.
  • The microstructures of the FSS-rolled sheets consist of elongated ferrite grains and in-grain SBs, with a preference for γ-fiber orientation. The CR texture of FSSs typically results in the formation of strong α- and weak γ-fiber. Grain size plays a significant role in rolling texture evolution, as a more intense γ-fiber is formed in fine-grained CR samples compared to coarse-grained CR samples. Upon annealing FSSs, a strong γ-fiber forms. Intermediate annealing leads to the formation of uniform γ-fiber textures and a more homogeneous distribution of grain colonies. This intermediate annealing also aids in resisting the phenomenon of ridging. The {111} recrystallization texture significantly reduces ridging and is beneficial for the formability of FSSs. The formation of the intermetallics such as σ, χ, and Laves phases occurs at a temperature range of 600–1000 °C in Nb- and Ti-stabilized FSSs.

Author Contributions

V.T.: Investigation, writing: review and editing, writing—original draft preparation; K.-S.P.: writing—Ta section; R.K.: writing—review and editing; A.G.: writing—review and editing, writing—Beta-Ti section; S.-H.C.: conceptualization, writing—review and editing, supervision, funding. All authors have read and agreed to the published version of the manuscript.

Funding

This research was supported by the Agency for Defense Development under the Leading Defense Core Technology R&D project (Fabrication and Forming of Tantalum Alloys) (Contract No. UC200031GD).

Data Availability Statement

Not applicable.

Conflicts of Interest

The authors declare no conflicts of interest.

Abbreviations

ASR: asymmetric rolling; BC: band contrast; BCC: body centered cubic; CDRX: continuous dynamic recrystallization; CR: cold rolling; DRX: dynamic recrystallization; DDRX: discontinuous dynamic recrystallization; EBSD: electron back-scattered diffraction; FSSs: ferritic stainless steels; GBs: grain boundaries; GS: grain size; HAGBs: high-angle grain boundaries; IPF: inverse pole figure; IQ: image quality; LAGBs: low-angle grain boundaries; ND: normal direction; omega phase (ω); martensite (α″); RD: rolling direction; RR: reduction ratio; SIM: stress-induced martensite; SB: shear bands; SF: Schmid factor; SFE: stacking fault energy; TMP: thermomechanical processing; UDR: unidirectional rolling; XRD: X-ray diffraction.

References

  1. Kim, M.-S.; Kim, J.G.; Kwon, S.-C.; Jeong, D.H.; Lee, S.; Jeong, H.-T.; Choi, S.-H. Evolution of the Microstructure and Mechanical Properties of Interstitial-Free Steel during Multi-Axial Diagonal Forging. Mater. Sci. Eng. A 2022, 846, 143242. [Google Scholar] [CrossRef]
  2. Baton, J.; Geslin, W.; Moussa, C. Influence of Crystallographic Orientation on the Recrystallization of Pure Tantalum through Microstructure-Based Estimation of the Stored Energy. Int. J. Refract. Met. Hard Mater. 2022, 104, 105786. [Google Scholar] [CrossRef]
  3. Zhu, J.; Liu, S.; Yuan, X.; Liu, Q. Comparing the Through-Thickness Gradient of the Deformed and Recrystallized Microstructure in Tantalum with Unidirectional and Clock Rolling. Materials 2019, 12, 169. [Google Scholar] [CrossRef] [PubMed]
  4. Fan, H.; Liu, S.; Deng, C.; Wu, X.; Cao, L.; Liu, Q. Quantitative Analysis: How Annealing Temperature Influences Recrystallization Texture and Grain Shape in Tantalum. Int. J. Refract. Met. Hard Mater. 2018, 72, 244–252. [Google Scholar] [CrossRef]
  5. Gupta, A.; Khatirkar, R.K.; Dandekar, T.; Mahadule, D. Texture Development during Multi-Step cross Rolling of a β Titanium Alloy: Experiments and Simulations. J. Alloys Compd. 2023, 850, 156824. [Google Scholar] [CrossRef]
  6. Zhu, C.; Zhang, X.Y.; Li, C.; Liu, C.; Zhou, K. A Strengthening Strategy for Metastable β Titanium Alloys: Synergy Effect of Primary α Phase and β Phase Stability. Mater. Sci. Eng. A 2022, 852, 143736. [Google Scholar] [CrossRef]
  7. Wang, M.; Jiang, Y.; Li, Z.; Xiao, Z.; Gong, S.; Qiu, W.; Lei, Q. Microstructure Evolution and Deformation Behaviour of Cu-10 Wt%Fe Alloy during Cold Rolling. Mater. Sci. Eng. A 2021, 801, 140379. [Google Scholar] [CrossRef]
  8. Mahadule, D.; Khatirkar, R.K.; Gupta, A.; Kumar, R. Effect of Heating Temperature and Cooling Rate on the Microstructure and Mechanical Properties of a Mo-Rich Two Phase α + β Titanium Alloy. J. Mater. Res. 2021, 36, 751–763. [Google Scholar] [CrossRef]
  9. Li, M.; Min, X. Origin of ω-Phase Formation in Metastable β-Type Ti-Mo Alloys: Cluster Structure and Stacking Fault. Sci. Rep. 2020, 10, 8664. [Google Scholar] [CrossRef]
  10. Shao, B.; Wang, J.; Tang, W.; Huang, S.; Zong, Y.; Shan, D.; Guo, B. Microstructural Evolution and Slip during Yielding in Ti-5Al-5V-2Mo-2Cr Alloy. J. Alloys Compd. 2023, 945, 169269. [Google Scholar] [CrossRef]
  11. Sim, J.-J.; Choi, S.-H.; Lee, Y.-K.; Heo, S.G.; Kim, T.-S.; Seo, S.-J.; Park, K.-T. Consideration of Diluents Selection and Input Amounts of the Hunter Process for Tantalum Production. Met. Mater. Int. 2021, 27, 1980–1987. [Google Scholar] [CrossRef]
  12. Pegel, B. Stacking Faults on {110} Planes in the B.C.C. Lattice. Phys. Status Solidi 1968, 28, 603–609. [Google Scholar] [CrossRef]
  13. Tang, Y.; Liu, Y.; Peng, Y.; Xiong, W.; Long, J.; Tan, D. Dynamic Restoration and Texture Evolution of Pure Tantalum during Warm Deformation. Int. J. Refract. Met. Hard Mater. 2023, 115, 106279. [Google Scholar] [CrossRef]
  14. Song, C.; Deng, Z.; Chen, J.; Yang, Z.; Zou, Z.; Liu, L.; Yang, Y.; Xu, K.; Wang, J. Study on the Influence of Oxygen Content Evolution on the Mechanical Properties of Tantalum Powder Fabricated by Laser Powder Bed Fusion. Mater. Charact. 2023, 205, 113235. [Google Scholar] [CrossRef]
  15. Stelmakh, V.; Rinnerbauer, V.; Geil, R.D.; Aimone, P.R.; Senkevich, J.J.; Joannopoulos, J.D.; Soljačić, M.; Celanovic, I. High-Temperature Tantalum Tungsten Alloy Photonic Crystals: Stability, Optical Properties, and Fabrication. Appl. Phys. Lett. 2013, 103. [Google Scholar] [CrossRef]
  16. Jakubowicz, J.; Adamek, G.; Sopata, M.; Koper, J.K.; Kachlicki, T.; Jarzebski, M. Microstructure and Electrochemical Properties of Refractory Nanocrystalline Tantalum-Based Alloys. Int. J. Electrochem. Sci. 2018, 13, 1956–1975. [Google Scholar] [CrossRef]
  17. Arsenault, R.J.; Lawley, A. Work Hardening and Dislocation Structure in Ta and Ta-Base Alloys. Philos. Mag. 1967, 15, 549–565. [Google Scholar] [CrossRef]
  18. Knezevic, M.; Zecevic, M.; Beyerlein, I.J.; Bhattacharyya, A.; McCabe, R.J. Predicting Texture Evolution in Ta and Ta-10W Alloys Using Polycrystal Plasticity. JOM 2015, 67, 2670–2674. [Google Scholar] [CrossRef]
  19. Whiteman, G.; Case, S.; Millett, J.C.F.; Cox, M.J.; Avraam, P.; Dear, J.P.; Sancho, A.; Hooper, P.A. Uniaxial Compression of Single Crystal and Polycrystalline Tantalum. Mater. Sci. Eng. A 2019, 759, 70–77. [Google Scholar] [CrossRef]
  20. Gray, G.T.; Bingert, S.R.; Wright, S.I.; Chen, S.R. Influence of Tungsten Alloying Additions on the Mechanical Properties and Texture of Tantalum. Mater. Res. Soc. Symp. Proc. 1994, 322, 407–412. [Google Scholar] [CrossRef]
  21. Martin, H.; Dierk, R.; Kurt, L. Rolling and Recrystallization Textures of Bcc Steels. Steel Res. 2018, 62, 567–575. [Google Scholar] [CrossRef]
  22. Lu, H.H.; Guo, H.K.; Liang, W.; Li, J.C.; Zhang, G.W.; Li, T.T. High-Temperature Laves Precipitation and Its Effects on Recrystallisation Behaviour and Lüders Deformation in Super Ferritic Stainless Steels. Mater. Des. 2020, 188, 108477. [Google Scholar] [CrossRef]
  23. Gupta, S.K.; Patil, A.P.; Rathod, R.C.; Tandon, V.; Vashishtha, H. Investigation on Impact of Heat Input on Microstructural, Mechanical, and Intergranular Corrosion Properties of Gas Tungsten Arc-Welded Ti-Stabilized 439 Ferritic Stainless Steel. J. Mater. Eng. Perform. 2022, 31, 4084–4097. [Google Scholar] [CrossRef]
  24. Ma, X.; Zhao, J.; Du, W.; Zhang, X.; Jiang, L.; Jiang, Z. Quantification of Texture-Induced Ridging in Ferritic Stainless Steels 430 and 430LR during Tensile Deformation. J. Mater. Res. Technol. 2019, 8, 2041–2051. [Google Scholar] [CrossRef]
  25. Hou, Y.; Cheng, G.; Cheng, H. Effect of Oxide Composition on the Orientation Relationship and Disregistry in Complex Nucleus of Ti and Nb Stabilized Ferritic Stainless Steel Revealed by EBSD Measurement. Metall. Mater. Trans. B 2020, 51, 709–721. [Google Scholar] [CrossRef]
  26. Luiz, V.D.; dos Santos, A.J.; Câmara, M.A.; Rodrigues, P.C.d.M. Influence of Different Contact Conditions on Friction Properties of AISI 430 Steel Sheet with Deep Drawing Quality. Coatings 2023, 13, 771. [Google Scholar] [CrossRef]
  27. Shin, E.; Choi, S.-H.; Seong, B.-S.; Lee, H.-C.; Lee, K.H. Small-Angle Neutron Scattering Study on the Cold Rolled Steel Sheets. Appl. Phys. A 2010, 99, 621–625. [Google Scholar] [CrossRef]
  28. Choi, S.; Hyung, J. Primary Recrystallization Modelling for Interstitial Free Steels. Mater. Sci. Eng. A 2005, 405, 86–101. [Google Scholar] [CrossRef]
  29. Kim, D.I.; Kim, J.S.; Kim, J.H.; Choi, S.H. A Study on the Annealing Behavior of Cu-Added Bake-Hardenable Steel Using an in Situ EBSD Technique. Acta Mater. 2014, 68, 9–18. [Google Scholar] [CrossRef]
  30. Deng, C.; Liu, S.F.; Hao, X.B.; Ji, J.L.; Zhang, Z.Q.; Liu, Q. Orientation Dependence of Stored Energy Release and Microstructure Evolution in Cold Rolled Tantalum. Int. J. Refract. Met. Hard Mater. 2014, 46, 24–29. [Google Scholar] [CrossRef]
  31. Hatherly, M.; Humphreys, F.J. Recrystallization and Related Annealing Phenomena; Elsevier: Amsterdam, The Netherlands, 2012. [Google Scholar]
  32. Kim, J.S.; Kim, S.I.; Choi, S.H. Microstructure Characterization Based on the Type of Deformed Grains in Cold-Rolled, Cu-Added, Bake-Hardenable Steel. Mater. Charact. 2014, 92, 159–170. [Google Scholar] [CrossRef]
  33. Raabe, D. On the Influence of the Chromium Content on the Evolution of Rolling Textures in Ferritic Stainless Steels. J. Mater. Sci. 1996, 31, 3839–3845. [Google Scholar] [CrossRef]
  34. Liu, L.; Huang, M.; Geng, D.; Liu, J.; Wang, X.; Sun, Q.; Sun, J. Achieving High Strength and Ductility of a Metastable β-Titanium Alloy via Coupling Thermomechanical Processing and Heat Treatments. Mater. Sci. Eng. A 2024, 891, 145970. [Google Scholar] [CrossRef]
  35. Taylor, G. Thermally-Activated Deformation of BCC Metals and Alloys. Prog. Mater. Sci. 1992, 36, 29–61. [Google Scholar] [CrossRef]
  36. Reid, C.N. The Association of Twinning and Fracture in Bcc Metals. Metall. Trans. A 1981, 12, 371–377. [Google Scholar] [CrossRef]
  37. Liu, F.; Liaw, P.K.; Zhang, Y. Recent Progress with BCC-Structured High-Entropy Alloys. Metals 2022, 12, 501. [Google Scholar] [CrossRef]
  38. Lee, W.T.; Yeom, J.T.; Kim, J.G.; Oh, J.S.; Lee, T.; Liu, Y.; Li, S.; Nam, T.H. Precipitation of Metastable Intermetallic Phases and Nanoindentation Behaviors of a Ti-20Zr-9 Nb-4Sn (At%) Alloy during Aging Treatment. J. Alloys Compd. 2023, 933, 167762. [Google Scholar] [CrossRef]
  39. Lütjering, G.; Williams, J.C. Titanium, 2nd ed.; Engineering Materials and Processes, Ed.; Springer: Berlin/Heidelberg, Germany, 2007. [Google Scholar]
  40. Choi, K.; Lee, K.H.; Ali, B.; Choi, S.-H.; Park, K.-T.; Sohn, I. Magnesiothermic Reduction for Direct Synthesis of Ti-Nb Alloy at 1073 K (800 °C). Met. Mater. Int. 2017, 23, 1037–1044. [Google Scholar] [CrossRef]
  41. Sadeghpour, S.; Abbasi, S.M.; Morakabati, M.; Bruschi, S. Correlation between Alpha Phase Morphology and Tensile Properties of a New Beta Titanium Alloy. Mater. Des. 2017, 121, 24–35. [Google Scholar] [CrossRef]
  42. Fan, J.; Li, J.; Kou, H.; Hua, K.; Tang, B.; Zhang, Y. Microstructure and Mechanical Property Correlation and Property Optimization of a near β Titanium Alloy Ti-7333. J. Alloys Compd. 2016, 682, 517–524. [Google Scholar] [CrossRef]
  43. Fu, Y.; Xiao, W.; Wang, J.; Ren, L.; Zhao, X.; Ma, C. A Novel Strategy for Developing α + β Dual-Phase Titanium Alloys with Low Young’s Modulus and High Yield Strength. J. Mater. Sci. Technol. 2021, 76, 122–128. [Google Scholar] [CrossRef]
  44. Zhang, C.; Jiang, X.; Han, J.; Zhang, S.; Peng, P.; Feng, H.; Wang, T.; Cao, P. Probing the Texture Transition Sequence of near β Titanium Matrix Composites by Observing the Uneven Hot Deformation Microstructure. Mater. Charact. 2023, 198, 112728. [Google Scholar] [CrossRef]
  45. Du, Z.; He, Q.; Chen, R.; Liu, F.; Zhang, J.; Yang, F.; Zhao, X.; Cui, X.; Cheng, J. Rolling Reduction—Dependent Deformation Mechanisms and Tensile Properties in a β Titanium Alloy. J. Mater. Sci. Technol. 2022, 104, 183–193. [Google Scholar] [CrossRef]
  46. Kim, J.S.; Kim, S.I.; Choi, S.H. Effect of the Initial Texture Components of Hot-Rolled BH Steel on the Evolution of Deformation Texture and Stored Energy during the Cold-Rolling Process. Met. Mater. Int. 2013, 19, 759–765. [Google Scholar] [CrossRef]
  47. Talbot, C.E.P.; Church, N.L.; Jones, N.G. Effect of Prior Processing on the Decomposition of the β Phase in Ti–Nb Alloys during Intermediate Heat Treatments. Scr. Mater. 2024, 238, 115729. [Google Scholar] [CrossRef]
  48. Mahadule, D.; Demiral, M.; Mulki, H.; Khatirkar, R.K. Experiments and Crystal Plasticity Finite Element Simulations of Texture Development during Cold Rolling in a Ti-15V-3Cr-3Sn-3Al Alloy. Crystals 2023, 13, 137. [Google Scholar] [CrossRef]
  49. Maxwell, P.C.; Goldberg, A.; Shyne, J.C. Stress-Assisted and Strain-Induced Martensites in FE-NI-C Alloys. Metall. Trans. 1974, 5, 1305–1318. [Google Scholar] [CrossRef]
  50. Zhou, W.; Chew, K.G. The Rate Dependent Response of a Titanium Alloy Subjected to Quasi-Static Loading in Ambient Environment. J. Mater. Sci. 2002, 37, 5159–5165. [Google Scholar] [CrossRef]
  51. Song, W.Q.; Sun, S.; Zhu, S.; Wang, G.; Wang, J.; Dargusch, M.S. Compressive Deformation Behavior of a Near-Beta Titanium Alloy. Mater. Des. 2012, 34, 739–745. [Google Scholar] [CrossRef]
  52. Sadeghpour, S.; Abbasi, S.M.; Morakabati, M. Deformation-Induced Martensitic Transformation in a New Metastable Beta Titanium Alloy. J. Alloys Compd. 2015, 650, 22–29. [Google Scholar] [CrossRef]
  53. Banerjee, S.; Mukhopadhyay, P.B.T.-P.M.S. (Eds.) Chapter 1—Phases and Crystal Structures. In Phase Transformations; Elsevier: Pergamon, Turkey, 2007; Volume 12, pp. 1–86. ISBN 1470-1804. [Google Scholar]
  54. Gupta, A.; Khatirkar, R.K.; Kumar, A.; Thool, K.; Bibhanshu, N.; Suwas, S. Microstructure and Texture Development in Ti-15V-3Cr-3Sn-3Al Alloy—Possible Role of Strain Path. Mater. Charact. 2019, 156, 109884. [Google Scholar] [CrossRef]
  55. Lan, C.; Wu, Y.; Guo, L.; Chen, H.; Chen, F. Microstructure, Texture Evolution and Mechanical Properties of Cold Rolled Ti-32.5Nb-6.8Zr-2.7Sn Biomedical Beta Titanium Alloy. J. Mater. Sci. Technol. 2018, 34, 788–792. [Google Scholar] [CrossRef]
  56. Hayama, A.O.F.; Lopes, J.F.S.C.; Gomes da Silva, M.J.; Abreu, H.F.G.; Caram, R. Crystallographic Texture Evolution in Ti-35Nb Alloy Deformed by Cold Rolling. Mater. Des. 2014, 60, 653–660. [Google Scholar] [CrossRef]
  57. Cojocaru, V.D.; Raducanu, D.; Gloriant, T.; Gordin, D.M.; Cinca, I. Effects of Cold-Rolling Deformation on Texture Evolution and Mechanical Properties of Ti–29Nb–9Ta–0Zr Alloy. Mater. Sci. Eng. A 2013, 586, 1–10. [Google Scholar] [CrossRef]
  58. Chen, Y.; Li, J.; Tang, B.; Kou, H.; Xue, X.; Cui, Y. Texture Evolution and Dynamic Recrystallization in a Beta Titanium Alloy during Hot-Rolling Process. J. Alloys Compd. 2015, 618, 146–152. [Google Scholar] [CrossRef]
  59. Sander, B.; Raabe, D. Texture Inhomogeneity in a Ti–Nb-Based β-Titanium Alloy after Warm Rolling and Recrystallization. Mater. Sci. Eng. A 2008, 479, 236–247. [Google Scholar] [CrossRef]
  60. Dong, Y.; Liu, X.; Xu, H.; He, Y.; Ke, Y.; Zhang, W. Relationship between Β→α Dynamic Transformation and Dynamic Recrystallization under Thermomechanical Coupling in Ti-5Al-5Mo-5V-1Cr-1Fe Alloy. J. Mater. Sci. Technol. 2024, 179, 98–113. [Google Scholar] [CrossRef]
  61. Ivasishin, O.M.; Markovsky, P.E.; Semiatin, S.L.; Ward, C.H. Aging Response of Coarse- and Fine-Grained β Titanium Alloys. Mater. Sci. Eng. A 2005, 405, 296–305. [Google Scholar] [CrossRef]
  62. Choi, G.; Lee, K. Effect of Aging Treatment on the Formation of α Precipitates in β-Type Ti–6Mo–6V–5Cr–3Sn–2.5Zr Alloys. Met. Mater. Int. 2018, 24, 441–447. [Google Scholar] [CrossRef]
  63. Ballor, J.; Li, T.; Prima, F.; Boehlert, C.J.; Devaraj, A. A Review of the Metastable Omega Phase in Beta Titanium Alloys: The Phase Transformation Mechanisms and Its Effect on Mechanical Properties. Int. Mater. Rev. 2023, 68, 26–45. [Google Scholar] [CrossRef]
  64. Pilz, S.; Hariharan, A.; Günther, F.; Zimmermann, M.; Gebert, A. Influence of Isothermal Omega Precipitation Aging on Deformation Mechanisms and Mechanical Properties of a β-Type Ti-Nb Alloy. J. Alloys Compd. 2023, 930, 167309. [Google Scholar] [CrossRef]
  65. Abbasi, S.M.; Momeni, A.; Lin, Y.C.; Jafarian, H.R. Dynamic Softening Mechanism in Ti-13V-11Cr-3Al Beta Ti Alloy during Hot Compressive Deformation. Mater. Sci. Eng. A 2016, 665, 154–160. [Google Scholar] [CrossRef]
  66. Nasiri, Z.; Ghaemifar, S.; Naghizadeh, M.; Mirzadeh, H. Thermal Mechanisms of Grain Refinement in Steels: A Review. Met. Mater. Int. 2021, 27, 2078–2094. [Google Scholar] [CrossRef]
  67. Hua, K.; Li, J.; Kou, H.; Fan, J.; Sun, M.; Tang, B. Phase Precipitation Behavior during Isothermal Deformation in Beta-Quenched near Beta Titanium Alloy Ti-7333. J. Alloys Compd. 2016, 671, 381–388. [Google Scholar] [CrossRef]
  68. Alireza, G.; Hodgson, P.D.; Barnett, M.R. Microstructure and Texture Development in Ti-5Al-5Mo-5V-3Cr Alloy during Cold Rolling and Annealing. Key Eng. Mater. 2013, 551, 210–216. [Google Scholar] [CrossRef]
  69. Gupta, A.; Khatirkar, R.K.; Dandekar, T.; Jha, J.S.; Mishra, S. Recrystallization Behavior of a Cold Rolled Ti–15V–3Sn–3Cr–3Al Alloy. J. Mater. Res. 2019, 34, 3082–3092. [Google Scholar] [CrossRef]
  70. Xu, J.; Zeng, W.; Zhao, Y.; Sun, X.; Du, Z. Influence of Cooling Rate Following Heat Treatment on Microstructure and Phase Transformation for a Two-Phase Alloy. J. Alloys Compd. 2016, 688, 301–309. [Google Scholar] [CrossRef]
  71. Kim, H.Y.; Sasaki, T.; Okutsu, K.; Kim, J.I.; Inamura, T.; Hosoda, H.; Miyazaki, S. Texture and Shape Memory Behavior of Ti-22Nb-6Ta Alloy. Acta Mater. 2006, 54, 423–433. [Google Scholar] [CrossRef]
  72. Lee, S.; Cho, H.; Bronkhorst, C.A.; Pokharel, R.; Brown, D.W.; Clausen, B.; Vogel, S.C.; Anghel, V.; Gray, G.T.; Mayeur, J.R. Deformation, Dislocation Evolution and the Non-Schmid Effect in Body-Centered-Cubic Single- and Polycrystal Tantalum. Int. J. Plast. 2023, 163, 103529. [Google Scholar] [CrossRef]
  73. Salman, M.B.; Park, M.; Banisalman, M.J. Revealing the Effects of Strain and Alloying on Primary Irradiation Defects Evolution in Tantalum Through Atomistic Simulations. Met. Mater. Int. 2023, 29, 3618–3629. [Google Scholar] [CrossRef]
  74. Hull, D.; Bacon, D.J. Dislocations in Other Crystal Structures. In Introduction to Dislocations; Elsevier: Amsterdam, The Netherlands, 2011; pp. 109–136. [Google Scholar]
  75. Weinberger, C.R.; Boyce, B.L.; Battaile, C.C. Slip Planes in Bcc Transition Metals. Int. Mater. Rev. 2013, 58, 296–314. [Google Scholar] [CrossRef]
  76. Savage, D.J.; Beyerlein, I.J.; Knezevic, M. Coupled Texture and Non-Schmid Effects on Yield Surfaces of Body-Centered Cubic Polycrystals Predicted by a Crystal Plasticity Finite Element Approach. Int. J. Solids Struct. 2017, 109, 22–32. [Google Scholar] [CrossRef]
  77. Savage, D.J.; Chandola, N.; Cazacu, O.; McWilliams, B.A.; Knezevic, M. Validation of Recent Analytical Dilatational Models for Porous Polycrystals Using Crystal Plasticity Finite Element Models with Schmid and Non-Schmid Activation Laws. Mech. Mater. 2018, 126, 148–162. [Google Scholar] [CrossRef]
  78. Zecevic, M.; Knezevic, M. A New Visco-Plastic Self-Consistent Formulation Implicit in Dislocation-Based Hardening within Implicit Finite Elements: Application to High Strain Rate and Impact Deformation of Tantalum. Comput. Methods Appl. Mech. Eng. 2018, 341, 888–916. [Google Scholar] [CrossRef]
  79. Raabe, D.; Schlenkert, G.; Weisshaupt, H.; Lücke, K. Texture and Microstructure of Rolled and Annealed Tantalum. Mater. Sci. Technol. 1994, 10, 299–305. [Google Scholar] [CrossRef]
  80. Bhattacharyya, A.; Knezevic, M.; Abouaf, M. Characterization of Crystallographic Texture and Intra-Grain Morphology in Cross-Rolled Tantalum. Metall. Mater. Trans. A Phys. Metall. Mater. Sci. 2015, 46, 1085–1096. [Google Scholar] [CrossRef]
  81. Liu, Y.H.; Liu, S.F.; Zhu, J.L.; Deng, C.; Fan, H.Y.; Cao, L.F.; Liu, Q. Strain Path Dependence of Microstructure and Annealing Behavior in High Purity Tantalum. Mater. Sci. Eng. A 2017, 707, 518–530. [Google Scholar] [CrossRef]
  82. Liu, Y.; Liu, S.; Zhu, J.; Fan, H.; Deng, C.; Cao, L.; Wu, X.; Liu, Q. Strain Accommodation of <110>-Normal Direction-Oriented Grains in Micro-Shear Bands of High-Purity Tantalum. J. Mater. Sci. 2018, 53, 12543–12552. [Google Scholar] [CrossRef]
  83. Lin, N.; Liu, S.; Liu, Y.; Fan, H.; Zhu, J.; Deng, C.; Liu, Q. Effects of Asymmetrical Rolling on Through-Thickness Microstructure and Texture of Body-Centered Cubic (BCC) Tantalum. Int. J. Refract. Met. Hard Mater. 2019, 78, 51–60. [Google Scholar] [CrossRef]
  84. Ding, Y.; Wang, S.; Zhang, M.; Zhou, S.; Liu, S.; Yuan, X. Effect of Warm Crossing Rolling on the Microstructure, Texture and Annealing Behavior of High-Purity Tantalum. Metals 2023, 13, 838. [Google Scholar] [CrossRef]
  85. Wang, S.; Chen, C.; Jia, Y.; Wang, M. Evolution of Texture and Deformation Microstructure in Ta-2.5W Alloy during Cold Rolling. J. Mater. Res. 2015, 30, 2792–2803. [Google Scholar] [CrossRef]
  86. Kratochvíl, J.; Kružík, M. Statistically Motivated Model of Mechanisms Controlling Evolution of Deformation Band Substructure. Int. J. Plast. 2016, 81, 196–208. [Google Scholar] [CrossRef]
  87. Wang, S.; Chen, C.; Jia, Y.L.; Xiao, Z.; Wang, M.P.; Li, Z.; Wu, Y.C. Effects of Grain Size on the Microstructure and Texture of Cold-Rolled Ta-2.5W Alloy. Int. J. Refract. Met. Hard Mater. 2016, 58, 125–136. [Google Scholar] [CrossRef]
  88. Wang, S.; Wu, Z.H.; Xie, M.Y.; Si, D.H.; Li, L.Y.; Chen, C.; Zhang, Z.; Wu, Y.C. The Effect of Tungsten Content on the Rolling Texture and Microstructure of Ta-W Alloys. Mater. Charact. 2020, 159, 110067. [Google Scholar] [CrossRef]
  89. Zhang, Z.; Chen, D.; Zhao, H.; Liu, S. A Comparative Study of Clock Rolling and Unidirectional Rolling on Deformation/Recrystallization Microstructure and Texture of High Purity Tantalum Plates. Int. J. Refract. Met. Hard Mater. 2013, 41, 453–460. [Google Scholar] [CrossRef]
  90. Zhu, J.; Deng, C.; Liu, Y.; Lin, N.; Liu, S. Effects of Annealing Temperature on Recrystallization Texture and Microstructure Uniformity of High Purity Tantalum. Metals 2019, 9, 75. [Google Scholar] [CrossRef]
  91. Wang, S.; Wang, L.; Wu, Z.H.; Hou, X.S.; Chen, C.; Zhang, Z.; Zhong, Z.H.; Wu, Y.C. The Characteristics of Lamellar Bands Developed in Cold-Rolled Ta–10W Alloy at Low Strains. Int. J. Refract. Met. Hard Mater. 2021, 97, 105521. [Google Scholar] [CrossRef]
  92. Hines, J.A.; Vecchio, K.S. Recrystallization Kinetics within Adiabatic Shear Bands. Acta Mater. 1997, 45, 635–649. [Google Scholar] [CrossRef]
  93. Borbély, A.; Driver, J.H.; Ungár, T. An X-Ray Method for the Determination of Stored Energies in Texture Components of Deformed Metals; Application to Cold Worked Ultra High Purity Iron. Acta Mater. 2000, 48, 2005–2016. [Google Scholar] [CrossRef]
  94. Willemse, P.F. Some Aspects of Stored Energy and Recrystallization Texture in Cold Drawn Steel Wire. Scr. Metall. 1989, 23, 543–546. [Google Scholar] [CrossRef]
  95. Cai, G.; Li, C.; Wang, D.; Zhou, Y. Investigation of Annealing Temperature on Microstructure and Texture of Fe-19Cr-2Mo-Nb-Ti Ferritic Stainless Steel. Mater. Charact. 2018, 141, 169–176. [Google Scholar] [CrossRef]
  96. Lu, H.H.; Lei, W.W.; Luo, Y.; Li, J.C.; Liu, Z.G.; Liang, W. Microstructural Evolution, Precipitation and Mechanical Properties of 27Cr-4Mo-2Ni Super-Ferritic Stainless Steels. JOM 2019, 71, 4086–4095. [Google Scholar] [CrossRef]
  97. Peirce, D.; Asaro, R.J.; Needleman, A. An Analysis of Nonuniform and Localized Deformation in Ductile Single Crystals. Acta Metall. 1982, 30, 1087–1119. [Google Scholar] [CrossRef]
  98. Huh, M.Y.; Engler, O. Effect of Intermediate Annealing on Texture, Formability and Ridging of 17%Cr Ferritic Stainless Steel Sheet. Mater. Sci. Eng. A 2001, 308, 74–87. [Google Scholar] [CrossRef]
  99. Ray, R.K.; Jonas, J.J.; Hook, R.E. Cold Rolling and Annealing Textures in Low Carbon and Extra Low Carbon Steels. Int. Mater. Rev. 1994, 39, 129–172. [Google Scholar] [CrossRef]
  100. Yan, H.; Bi, H.; Li, X.; Xu, Z. Microstructure and Texture of Nb + Ti Stabilized Ferritic Stainless Steel. Mater. Charact. 2008, 59, 1741–1746. [Google Scholar] [CrossRef]
  101. Belyakov, A.; Tsuzaki, K.; Kimura, Y.; Kimura, Y.; Mishima, Y. Comparative Study on Microstructure Evolution upon Unidirectional and Multidirectional Cold Working in an Fe–15%Cr Ferritic Alloy. Mater. Sci. Eng. A 2007, 456, 323–331. [Google Scholar] [CrossRef]
  102. Vanderschueren, D.; Yoshinaga, N.; Koyama, K. Recrystallisation of Ti If Steel Investigated with Electron Back-Scattering Pattern (EBSP). ISIJ Int. 1996, 36, 1046–1054. [Google Scholar] [CrossRef]
  103. Jonas, J.J. Effects of Shear Band Formation on Texture Development in Warm-Rolled IF Steels. J. Mater. Process. Technol. 2001, 117, 293–299. [Google Scholar] [CrossRef]
  104. Raabe, D.; Lüucke, K. Textures of Ferritic Stainless Steels. Mater. Sci. Technol. 1993, 9, 302–312. [Google Scholar] [CrossRef]
  105. Rodrigues, D.G.; de Alcântara, C.M.; de Oliveira, T.R.; Gonzalez, B.M. The Effect of Grain Size and Initial Texture on Microstructure, Texture, and Formability of Nb Stabilized Ferritic Stainless Steel Manufactured by Two-Step Cold Rolling. J. Mater. Res. Technol. 2019, 8, 4151–4162. [Google Scholar] [CrossRef]
  106. Hutchinson, B. Deformation Microstructures and Textures in Steels. Philos. Trans. R. Soc. A Math. Phys. Eng. Sci. 1999, 357, 1471–1485. [Google Scholar] [CrossRef]
  107. Nandedkar, V.M.; Samajdar, I.; Narasimhan, K. Transformations and Microstructures-Development of Grain Interior Strain Localizations during Plane Strain Deformation of a Deep Drawing Quality Sheet Steel. ISIJ Int. 2001, 41, 1517–1523. [Google Scholar] [CrossRef]
  108. de Campos, M.F.; Landgraf, F.J.G.; Takanohashi, R.; Chagas, F.C.; Falleiros, I.G.S.; Fronzaglia, G.C.; Kahn, H. Effect of the Hot Band Grain Size and Intermediate Annealing on the Deformation and Recrystallization Textures in Low Silicon Electrical Steels. ISIJ Int. 2004, 44, 591–597. [Google Scholar] [CrossRef]
  109. Sakai, T.; Saito, Y.; Matsuo, M.; Kawasaki, K. Inhomogeneous Texture Formation in High Speed Hot Rolling of Ferritic Stainless Steel. ISIJ Int. 1991, 31, 86–94. [Google Scholar] [CrossRef]
  110. Lee, J.H.; Park, S.H.; Huh, M.Y. Modification of the Recrystallization Texture by Means of Cross Rolling in Ferritic Stainless Steel Sheets. Mater. Sci. Forum 2004, 449–452, 113–116. [Google Scholar] [CrossRef]
  111. Gao, F.; Yu, F.X.; Misra, R.D.K.; Zhang, X.J.; Zhang, S.M.; Liu, Z.Y. Microstructure, Texture, and Deep Drawability Under Two Different Cold-Rolling Processes in Ferritic Stainless Steel. J. Mater. Eng. Perform. 2015, 24, 3862–3880. [Google Scholar] [CrossRef]
  112. Li, R.; Fu, B.; Wang, Y.; Li, J.; Dong, T.; Li, G.; Zhang, G.; Liu, J. Effect of Cold-Rolling Reduction on Recrystallization Microstructure, Texture and Corrosion Properties of the X2CrNi12 Ferritic Stainless Steel. Materials 2022, 15, 6914. [Google Scholar] [CrossRef]
  113. Sun, S.; Zhao, A.; Zeng, Q.; Yin, H. Effect of Continuous Annealing Temperature on Microstructure and Properties of Ultra-Purified Ferritic Stainless Steel. Steel Res. Int. 2017, 88, 1600347. [Google Scholar] [CrossRef]
  114. Lu, H.H.; Guo, H.K.; Luo, Y.; Liu, Z.G.; Li, W.Q.; Li, J.C.; Liang, W. Microstructural Evolution, Precipitation and Mechanical Properties of Hot Rolled 27Cr-4Mo-2Ni Ferritic Steel during 800 °C Aging. Mater. Des. 2018, 160, 999–1009. [Google Scholar] [CrossRef]
  115. Kondo, S.; Chai, Y.W.; Kanai, K.; Dosung, L.; Watanabe, M.; Ishikawa, S.; Yamasita, T.; Kimura, Y. Intermetallic Phase Precipitation and Oxidation Behavior of Fe–20Cr–0.5Nb–2Mo (At%) High-Cr Ferritic Alloy at High Temperatures. Acta Mater. 2023, 246, 118677. [Google Scholar] [CrossRef]
  116. Nichol, T.J. Mechanical Properties of a 29 Pct Cr-4 Pct Mo-2 Pct Ni Ferritic Stainless Steel. Metall. Trans. A 1977, 8, 229–237. [Google Scholar] [CrossRef]
  117. Brown, E.L.; Burnett, M.E.; Purtscher, P.T.; Krauss, G. Intermetallic Phase Formation in 25Cr-3Mo-4Ni Ferritic Stainless Steel. Metall. Trans. A 1983, 14, 791–800. [Google Scholar] [CrossRef]
  118. Lu, H.H.; Guo, H.K.; Zhang, W.G.; Liang, W.; Liu, Y.M. Effects of Prior Deformation on Precipitation Behavior and Mechanical Properties of Super-Ferritic Stainless Steel. J. Mater. Process. Technol. 2020, 281, 116645. [Google Scholar] [CrossRef]
  119. Gao, F.; Liu, Z.-Y.; Wang, G.-D. Effect of the Size and Dispersion of Precipitates Formed in Hot Rolling on Recrystallization Texture in Ferritic Stainless Steels. J. Mater. Sci. 2013, 48, 2404–2415. [Google Scholar] [CrossRef]
  120. Gupta, A.; Khatirkar, R.K.; Singh, J. A Review of Microstructure and Texture Evolution during Plastic Deformation and Heat Treatment of β-Ti Alloys. J. Alloys Compd. 2022, 899, 163242. [Google Scholar] [CrossRef]
  121. Abdel, M.; Gepreel, H. Texturing Tendency (chapter 5) in β-Type Ti-Alloys. In Recent Developments in the Study of Recrystallization; IntechOpen: Rijeka, Croatia, 2013; pp. 117–138. [Google Scholar]
  122. Guo, Z.; Liu, R.; Wang, C.T.; He, Y.; He, Y.; Ma, Y.; Hu, X. Compressive Mechanical Properties and Shock-Induced Reaction Behavior of a Ti–29Nb–13Ta–4.6Zr Alloy. Met. Mater. Int. 2020, 26, 1498–1505. [Google Scholar] [CrossRef]
  123. Sadeghpour, S.; Javaheri, V.; Bruschi, S.; Kömi, J.; Karjalainen, P. Strain Rate and Mechanical Stability in Determining Deformation Behavior of Beta Ti Alloys. Mater. Sci. Eng. A 2020, 798, 140274. [Google Scholar] [CrossRef]
  124. Lai, M.J.; Tasan, C.C.; Raabe, D. On the Mechanism of {332} Twinning in Metastable β Titanium Alloys. Acta Mater. 2016, 111, 173–186. [Google Scholar] [CrossRef]
  125. Xu, Y.; Gao, J.; Huang, Y.; Rainforth, W.M. A Low-Cost Metastable Beta Ti Alloy with High Elastic Admissible Strain and Enhanced Ductility for Orthopaedic Application. J. Alloys Compd. 2020, 835, 155391. [Google Scholar] [CrossRef]
  126. Xiao, J.F.; He, B.B.; Tan, C.W. Effect of Martensite on {332} Twinning Formation in a Metastable Beta Titanium Alloy. J. Alloys Compd. 2022, 895, 162598. [Google Scholar] [CrossRef]
  127. Sakharova, N.A.; Fernandes, J.V. Strain Path Change Effect on Dislocation Microstructure of Multicrystalline Copper Sheets. Mater. Chem. Phys. 2006, 98, 44–50. [Google Scholar] [CrossRef]
  128. Raabe, D. Simulation of Rolling Textures of b.c.c. Metals Considering Grain Interactions and Crystallographic Slip on {110}, {112} and {123} Planes. Mater. Sci. Eng. A 1995, 197, 31–37. [Google Scholar] [CrossRef]
  129. Zhang, C.; Liu, Z.; Wang, G. Effects of Hot Rolled Shear Bands on Formability and Surface Ridging of an Ultra Purified 21%Cr Ferritic Stainless Steel. J. Mater. Process. Technol. 2011, 211, 1051–1059. [Google Scholar] [CrossRef]
  130. Da Costa Viana, C.S.; Pinto, A.L.; Candido, F.S.; Matheus, R.G. Analysis of Ridging in Three Ferritic Stainless Steel Sheets. Mater. Sci. Technol. 2006, 22, 293–300. [Google Scholar] [CrossRef]
  131. Patra, S.; Ghosh, A.; Sood, J.; Singhal, L.K.; Podder, A.S.; Chakrabarti, D. Effect of Coarse Grain Band on the Ridging Severity of 409L Ferritic Stainless Steel. Mater. Des. 2016, 106, 336–348. [Google Scholar] [CrossRef]
  132. Utama, M.I.; Ammar, A.A.; Park, N.; Baek, E.R. Origin of Surface Irregularities on Ti–10V–2Fe–3Al Beta Titanium Alloy. Met. Mater. Int. 2018, 24, 291–299. [Google Scholar] [CrossRef]
  133. Samajdar, I.; Verlinden, B.; Van Houtte, P.; Vanderschueren, D. γ-Fibre Recrystallization Texture in IF-Steel: An Investigation on the Recrystallization Mechanisms. Mater. Sci. Eng. A 1997, 238, 343–350. [Google Scholar] [CrossRef]
  134. Martínez-de-Guerenu, A.; Arizti, F.; Díaz-Fuentes, M.; Gutiérrez, I. Recovery during Annealing in a Cold Rolled Low Carbon Steel. Part I: Kinetics and Microstructural Characterization. Acta Mater. 2004, 52, 3657–3664. [Google Scholar] [CrossRef]
  135. Han, S.-H.; Choi, S.-H.; Choi, J.-K.; Seong, H.-G.; Kim, I.-B. Effect of Hot-Rolling Processing on Texture and r-Value of Annealed Dual-Phase Steels. Mater. Sci. Eng. A 2010, 527, 1686–1694. [Google Scholar] [CrossRef]
  136. Ma, X.; Zhao, J.; Du, W.; Zhang, X.; Jiang, Z. Effects of Rolling Processes on Ridging Generation of Ferritic Stainless Steel. Mater. Charact. 2018, 137, 201–211. [Google Scholar] [CrossRef]
  137. Bai, Y.; Liu, Y.; He, T.; Shao, F.; Liu, F. Effects of Hot Rolling Finishing Temperature on Texture, Formability, and Surface Ridging of Sn Microalloyed Ferritic Stainless Steel. J. Mater. Eng. Perform. 2023. [Google Scholar] [CrossRef]
  138. Barnett, M.R.; Jonas, J.J. Influence of Ferrite Rolling Temperature on Grain Size and Texture in Annealed Low C and IF Steels. ISIJ Int. 1997, 37, 706–714. [Google Scholar] [CrossRef]
  139. Gao, F.; Chen, Y.; Zhu, Q.; Nan, Y.; Tang, S.; Cai, Z.; Zhang, F.; Xue, W.; Cai, X.; Yu, F.; et al. Formation of Recrystallization Texture and Its Effect on Deep Drawability for High-Purified Ferritic Stainless Steel by Two Step Cold Rolling. Mater. Des. 2023, 226, 111679. [Google Scholar] [CrossRef]
  140. Gao, F.; Zhu, Q.; Xue, W.; Chen, Y.; Zhang, F.; Nan, Y.; Tang, S.; Zhang, J.; Tie, D.; Cai, X.; et al. Correlation between Formability, Ridging and Recrystallization Texture Development in Ferritic Stainless Steel Fabricated by Introducing Intermediate Annealing during Cold Rolling. Mater. Charact. 2023, 205, 113296. [Google Scholar] [CrossRef]
  141. Liu, H.; Li, H.; Liu, C.; Wu, J. Effect of Rolling Reduction on Microstructure and Formability of a Ferritic Stainless Steel. J. Mater. Eng. Perform. 2023. [Google Scholar] [CrossRef]
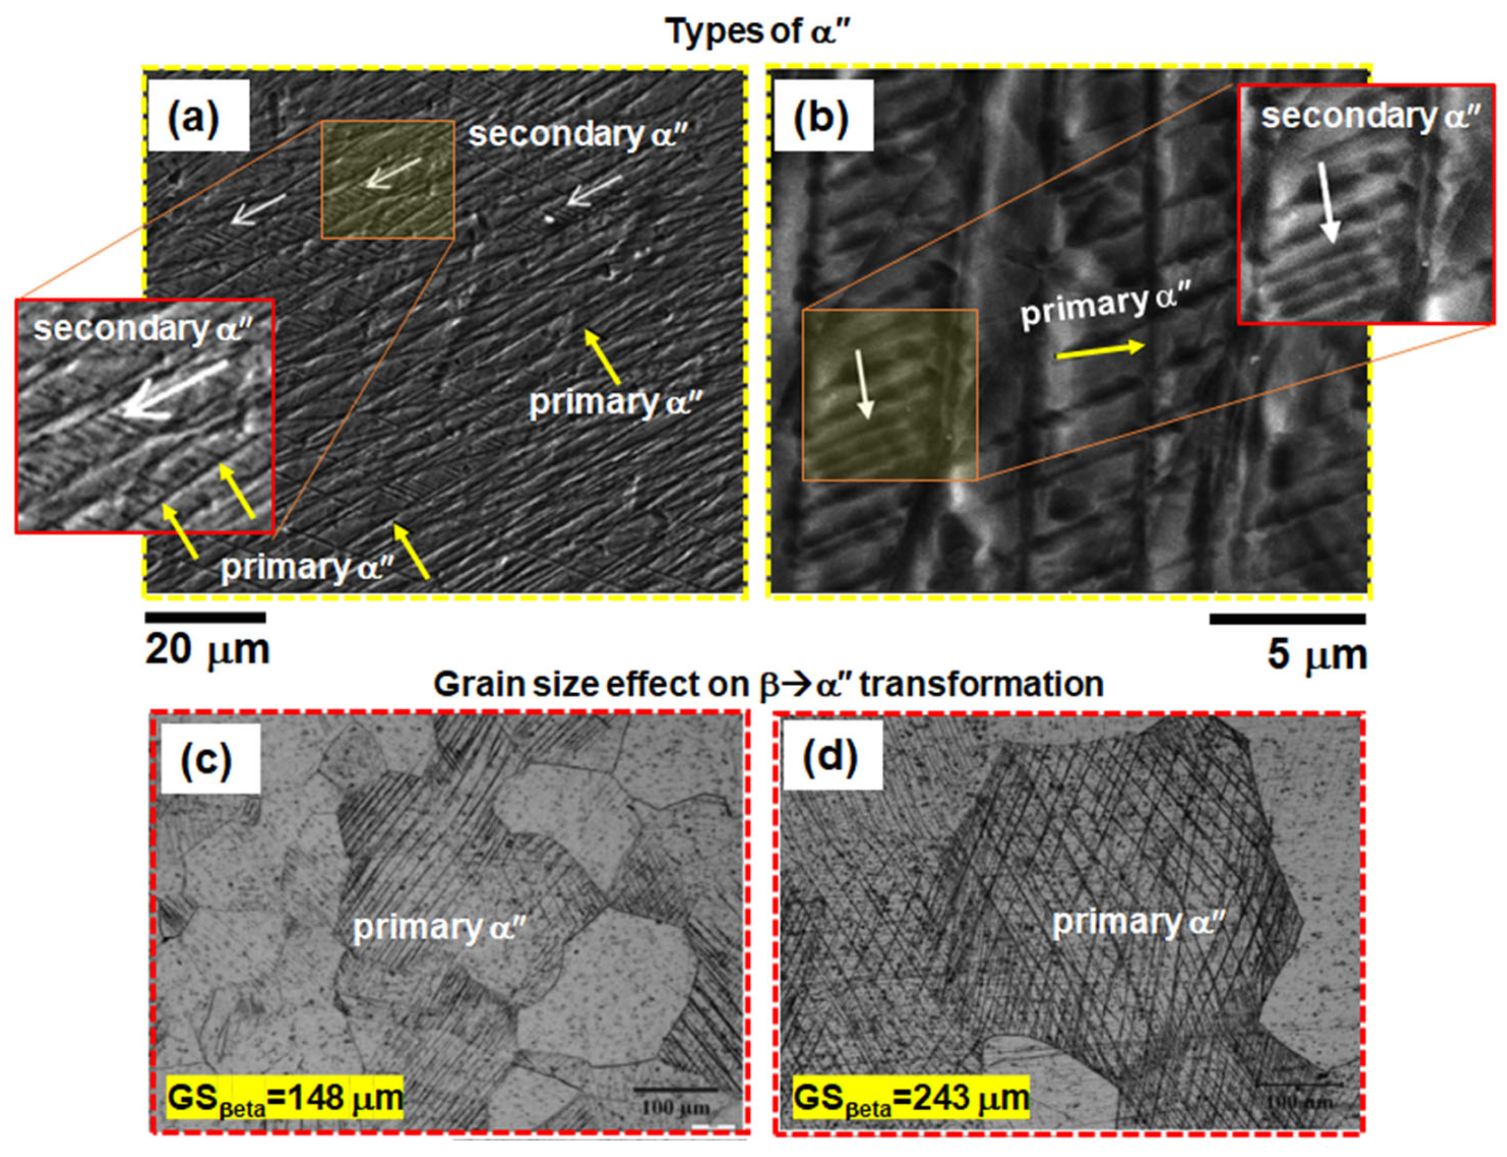
Figure 1. Room temperature compressed Ti-4Al-7Mo-3V-3Cr conditions: (a) Micrograph showing primary (indicated by yellow arrows) and secondary (indicated by white arrows) α″ martensite. (b) A higher-magnification view of part (a), highlighting the secondary α″ martensite situated between the primary ones in a sample deformed by 20%. (c,d) Micrographs depicting deformation-induced products following 10% cold reduction in specimens with initial β grain sizes of 148 μm and 243 μm, respectively. (Reprinted with permission from ref. [52]. Copyright 2015 Elsevier).
Metals 14 00149 g001
Figure 2. Hot rolled Ti–15Mo–3Al–2.7Nb–0.2Si samples: EBSD analysis of (a) samples deformed by 84% and (b) samples deformed by 97%. φ2 = 45° ODF sections of the 84% deformed samples, showing (c) center area and (d) surface area; (e) φ2 = 45° ODF section of the 97% deformed samples. Note: Black lines represent high-angle grain boundaries (HAGB) with misorientation greater than 15°, and red lines represent LAGB. Contours for ODF plots (multiple of random distribution) for—(c) 1, 2, 4, 6, 8, 9.6, (d) 1, 2, 3.7, (e) 1, 2, 4, 6. (Reprinted with permission from ref. [58]. Copyright 2015 Elsevier).
Metals 14 00149 g002
Figure 3. Hot compressed Ti-13V-11Cr-3Al conditions: Grain boundary maps obtained from EBSD measurements at (a) 930 °C, strain 0.2; (b) 930 °C, strain 0.35; (c) 930 °C, strain 0.7; and (d) 1030 °C, strain 0.2. Note: HAGBs are colored black, and LAGBs are red. The magnified image in (a) shows coarse CDRX grains; (c) displays small-sized DDRX grains surrounded by large sub-boundaries. (Reprinted with permission from ref. [65]. Copyright 2016 Elsevier).
Metals 14 00149 g003
Figure 4. (a) IPF and ODF maps of 80% CR β-Ti alloy sample; IPF maps of 80% cold-rolled β-Ti alloy sample recrystallized (b) at 780 °C for 1 min, (c) at 780 °C for 5 min, and (d) at 780 °C for 10 min. Note: LAGBs (2–15° misorientation) and HAGBs (>15° misorientation). Contours for ODF plots (multiple of random distribution): 2, 3, 3.5, 4.5, 5.5, 7, 10, 13, 19, 24. The micron bar applies to all the micrographs. (Reprinted with permission from ref. [69]. Copyright 2019 Springer Nature).
Metals 14 00149 g004
Figure 5. IPF maps (ad) and corresponding ODF sections (φ2 = 45°) (a1d1) for UDR samples (a,b,a1,b1) and 135° clock-rolled samples (c,d,c1,d1). Note: IPF color map in (d) is applicable for the IPF maps in (ac). (Reprinted from ref. [3]).
Metals 14 00149 g005
Figure 6. IPF maps of 80% deformed Ta processed through (a) symmetric rolling, (b) asymmetric rolling (speed ratio 1.1), and (c) asymmetric rolling (speed ratio 1.2) [83]. (dg) IPF and (d1g1) ODF sections (φ2 = 45°) of the near-surface region of Ta, 70% deformed via (d,d1) UDR at 800 °C, (e,e1) cross-rolling at 20 °C, (f,f1) cross-rolling at 500 °C and (g,g1) cross-rolling at 800 °C [84]). Note: IPF color map in (e) is applicable for the IPF maps in (d,f,g). (Reprinted with permission from ref. [83]. Copyright 2019 Elsevier. Reprinted from ref. [84]).
Metals 14 00149 g006
Figure 7. (a) ND orientation images of Ta-2.5W alloy; (b) the corresponding IQ map of (a); (c) ND orientation image of Ta-10W alloy; (d) the corresponding IQ map of (c); (e) the formation of shear bands (SBs) in ND orientation image of Ta-2.5W alloy; (g) the corresponding IQ map of (e); (f) the formation of shear bands (SBs) in the ND orientation image of the Ta-10W alloy; and (h) the corresponding IQ map of (f) at 40% CR reduction. Note: IPF color code in (a) is applicable to all IPF maps. (Reprinted with permission from ref. [88]. Copyright 2020 Elsevier).
Metals 14 00149 g007
Figure 8. IPF maps of 87% deformed Ta, followed by annealing at 1100 °C for 1 h, using (a) UDR and (b) 135° clock rolling [89]. (ch) IPF maps of 87% 135° clock-rolled Ta with subsequent annealing [90]. Note: In (ch), ‘s’ denotes surface and ‘c’ denotes center regions. Note: IPF color code in (a,c,g) are similar and applicable to all IPF maps. (Reprinted with permission from ref. [89]. Copyright 2013 Elsevier). (Reprinted from ref. [90]).
Metals 14 00149 g008
Figure 9. Microstructures of Fe-19Cr-2Mo-Nb-Ti FSS: (a) ND-IPF of HR sample, (b) corresponding φ2 = 45° section of ODF of HR sample, (c) microstructure of CR sample, (d) ND-IPF map of CR sample, and (e) corresponding φ2 = 45° section in the center layer of the CR sample. (Reprinted with permission from ref. [95]. Copyright 2018 Elsevier).
Metals 14 00149 g009
Figure 10. Microstructures and textures of Nb-stabilized FSS: OM images of (a) coarse-grained HR sample, (b) fine-grained HR sample, (c) 50% CR coarse-grained HR sample, and (d) 50% CR fine-grained HR sample; texture via XRD of 50% CR HR samples at (e,f) surface and center for coarse-grained, and (g,h) surface and center for fine-grained. (Reprinted with permission from ref. [105]. Copyright 2019 Elsevier).
Metals 14 00149 g010
Figure 11. IPF orientation maps and corresponding ODFs (φ2 = 45° section) of X2CrNi12 FSS, CR and annealed for 30 min at various temperatures: (a) 50% CR + 720 °C, (b) 50% CR + 740 °C, (c) 50% CR + 770 °C, (d) 90% CR + 720 °C, (e) 90% CR + 740 °C, and (f) 90% CR + 770 °C [112]. (g) Phase volumetric fraction of texture components of ultra-purified FSS after CR and continuous annealing [113]. Note: IPF color code in (c,f) is applicable to all IPF maps. (Reprinted from ref. [112]) (Reprinted with permission from ref. [113]. Copyright 2016 John Wiley and Sons).
Metals 14 00149 g011
Figure 12. SEM images showing the precipitation of various phases in 27Cr-Mo-2Ni super-FSS under various conditions: (ac) solution treated (1100 °C for 20 min) and aged at 800 °C for various time periods, (df) CR (27% RR) and aged specimens at 800 °C for various time periods, and (gi) CR (60% RR) and aged specimens at 800 °C for various time periods. Note: G.B. denotes grain boundary; TiN represents titanium nitride, red arrows in (ei) indicating SBs orientations. (Reprinted with permission from ref. [118]. Copyright 2020 Elsevier).
Metals 14 00149 g012
Figure 13. Secondary electron SEM images of (a) 10%, (b) 20%, (c) 30% and (d) 40% cold-rolled Ti-15333 alloy samples; φ2 = 45° constant section of ODF for (e) 10%, (f) 20%, (g) 30% and (h) 40% cold-rolled Ti-15333 alloy samples. Note: a magnified image of a 40% rolled sample with a shear band crossing the grain boundary is also shown in (d). (Reprinted from ref. [48]).
Metals 14 00149 g013
Figure 14. TEM images of UDR Ta (a,b) {111} and {100} matrix, respectively, and clock-rolled Ta (c,d) {111} and {100} matrix, respectively [3]. Band contrast of {111} grains and {100} grains of Ta at (e) deformed, (f) recovered, (g) partial recrystallized, (h) fully recrystallized and (i) stored energy of {1 0 0} and {1 1 1} grains at various heating stages [30]. Note: Yellow arrow in (a) referring to micro-SBs. Yellow arrows in (c,d) referring cell boundaries. (Reprinted from ref. [3]) (Reprinted with permission from ref. [30]. Copyright 2014 Elsevier).
Metals 14 00149 g014
Figure 15. (ac) Photographs showing surface ridges present in 409L FSS (marked with red arrows) following different TMPs after 20% tensile elongation; (de) surface roughness profiles for samples (a,c), respectively; (fh) microstructure of thickness section of tensile-strained samples upon TMP [131]; and (i) effect of texture on r-bar in Fe-19Cr-2Mo-Nb-Ti FSS [95]. (Reprinted with permission from ref. [95,131]. Copyright 2016 and 2018 Elsevier).
Metals 14 00149 g015
Disclaimer/Publisher’s Note: The statements, opinions and data contained in all publications are solely those of the individual author(s) and contributor(s) and not of MDPI and/or the editor(s). MDPI and/or the editor(s) disclaim responsibility for any injury to people or property resulting from any ideas, methods, instructions or products referred to in the content.