Article

A Link between Neutron and Ion Irradiation Hardening for Stainless Austenitic and Ferritic-Martensitic Steels

National Research Center “Kurchatov Institute”—Central Research Institute of Structural Materials “Prometey”, 191015 Saint Petersburg, Russia
*
Author to whom correspondence should be addressed.
Metals 2024, 14(1), 99; https://doi.org/10.3390/met14010099
Submission received: 9 December 2023 / Revised: 5 January 2024 / Accepted: 11 January 2024 / Published: 14 January 2024
(This article belongs to the Special Issue Radiation Damages in Metallic Materials)

Abstract

:
Radiation hardening is studied for stainless austenitic and ferritic-martensitic chromium steels after ion and neutron irradiation at various temperatures. Austenitic and ferritic-martensitic steels irradiated up to 30 dpa in various nuclear reactors and ion accelerators are studied at various temperatures. A change in Vickers microhardness is used as the radiation hardening parameter. A methodology is developed that allows one to determine the ion irradiation parameters, which ensure the radiation hardening of ferritic-martensitic and austenitic steels, as close as possible to the radiation hardening of the same steels under neutron irradiation. A transferability function is introduced to connect the irradiation temperatures for ion and neutron irradiation that provides the same radiation hardening. On the basis of the obtained experimental data, after ion and neutron irradiation the transferability functions are determined for the investigated austenitic and ferritic-martensitic steels, which connect the temperatures for ion and neutron irradiation and provide the same radiation hardening at a given damage dose.

1. Introduction

One of the promising directions of radiation materials science is the modeling of the neutron irradiation effects in materials by ion irradiation in accelerators. The application of ion irradiation instead of neutron irradiation can significantly reduce the time for irradiation and the cost. Moreover, further investigation of the ion-irradiated material is easier than of the neutron-irradiated material.
At present, a large number of studies is being carried out on the use of ion accelerators for modeling radiation damage in structural materials under neutron irradiation.
The methodology of conducting simulation tests is presented in detail in the monographs [1,2]. A new wave of research started in the frame of the IAEA program “Accelerator simulation and theoretical modeling of radiation effects in structural materials” [3]. In addition, the simulation testing program “Simulation of Neutron Damage for High Dose Exposure of Advanced Reactor Materials” was launched in the USA [4]. The current state of simulation tests is presented in [5,6,7,8,9]. The standard for accelerated testing developed by ASTM [10] has already undergone several revisions. Simulation experiments on ion beams and subsequent studies are being conducted in a significant number of research centers. In Russia, such studies are conducted mainly in the Institute for Physics and Power Engineering, National Research Center “Kurchatov Institute”—Central Research Institute of Structural Materials “Prometey” and NRC “Kurchatov Institute”—Institute for Theoretical and Experimental Physics.
The application of ion irradiation in accelerators allows one to assess the degradation of the studied material at high values of the damage dose (100 dpa and above). The duration of irradiation is reduced from several years in the reactor to several hours in the ion accelerator due to the much higher damage dose rate in accelerator compared to reactor irradiation. For example, it takes about 5 years to obtain the damage dose of 100 dpa in material with a BOR-60 fast neutron research reactor. The same dose can be provided in a few hours when the material is irradiated in the ion accelerator.
Another undoubted advantage of ion irradiation compared to neutron irradiation is the absence of induced activity in the irradiated material due to the lack of interaction of heavy ions with the nuclei of chemical elements of the material and so the absence of nuclear reactions.
At the same time, this advantage turns into a disadvantage from the viewpoint of modeling material damage under irradiation. Under neutron irradiation of a material, nuclear reactions of the n → p or/and n → α type usually occur that lead to an increase in the hydrogen (H) and helium (He) concentration in the material. As known, He has a strong influence on the formation of radiation defects—in particular, vacancy voids—and also leads to a decrease in the strength of grain boundaries [11].
The above nuclear reactions do not occur under ion irradiation. Therefore, for the necessary H and He concentration to be created in the irradiated layer, light He and H ions should be used in addition to heavy ions under irradiation in the ion accelerator.
Another significant disadvantage of ion irradiation is the very small depth of the irradiated layer. This depth is the penetration depth of the heavy ion in the material under irradiation. For typical energies used in accelerators, the irradiated layer depth usually does not exceed 2–3 microns.
The depth of the irradiated layer under neutron irradiation is usually tens of millimeters. Therefore, various standard and special specimens may be machined and tested to obtain the performance properties such as tensile strength, impact strength and fracture toughness for the neutron-irradiated metal. The minimum size of the net sections of these specimens exceeds (3 ÷ 5) mm. It is clear that such specimens cannot be used to study metal after ion irradiation, because the minimum size of the specimens exceeds the irradiated layer depth by more than 1000 times.
Precisely for this reason, the small-scale material evaluation methods should be used to assess the ion irradiation effect on microstructural changes and mechanical properties. Many sufficient methods are currently available that may be used for studying the microstructure evolution. It is another situation entirely for the assessment of the mechanical properties of ion-irradiated thin layers, which are important characteristics for a material that has undergone neutron irradiation.
One of the consequences of neutron irradiation, which limits the lifetime of irradiated reactor components, is radiation embrittlement. In steels with a BCC lattice, including ferritic-martensitic steels (FMS), radiation embrittlement may occur by hardening and non-hardening mechanisms [12,13,14,15,16,17]. The hardening mechanism is connected to a radiation-induced increase in the yield strength (i.e., with radiation hardening). The non-hardening mechanism is connected with the formation of intragranular interphase or/and intergranular segregations. This mechanism does not lead to an increase in the yield strength.
The estimation of the radiation embrittlement of polycrystalline metals with a BCC lattice, including FMS, can be performed using the following empirical dependence [16,18,19,20,21,22]:
ΔTtr = kσ·ΔσY,
where ΔσY is the radiation hardening in terms of the increment of material yield strength, ΔTtr is the brittle-to-ductile transition temperature shift and kσ is a numerical coefficient dependent on the test method used (impact strength or fracture toughness tests) and the phosphorus content in the material.
When impact strength specimens are tested, the ΔTtr value is determined as the shift of the Charpy impact transition curve [23]. When fracture toughness specimens are tested, the ΔTtr value is determined as the reference temperature shift ΔT0 in the Master Curve method [24,25] or the reference temperature shift ΔT100 in the Unified Curve method [26].
Dependence (1) may describe the radiation embrittlement of FMS by both hardening and non-hardening mechanisms. The non-hardening mechanism is taken into account by changing the value of the coefficient kσ depending on the phosphorus content. FMS with an impurity content below the threshold (required for the formation of segregation) are embrittled only by the hardening mechanism [27]. For such materials, the coefficient kσ does not depend on the content of impurities.
It is known that the change in the yield strength is linearly related to the change in its microhardness Hv [28,29,30,31]
Δ σ Y = a v · Δ H v ,
where av is a proportionality coefficient.
Based on this, the radiation hardening under ion irradiation and the associated radiation embrittlement of FMS can be determined from the measurement of microhardness. Measuring the microhardness of the ion-irradiated layer H v i and the unirradiated material H v 0 makes it possible to determine the radiation-induced change in microhardness as Δ H v i = H v i H v 0 .
Austenitic steels also undergo significant radiation hardening under neutron irradiation [2,32,33,34,35,36]. Despite the fact that the embrittlement mechanism of austenitic steels is fundamentally different from the embrittlement of FMS, radiation hardening also has a noticeable effect on the embrittlement of austenitic steels under irradiation when radiation swelling is absent [2,33,37]. In addition, radiation hardening has a strong effect on the corrosion cracking resistance of irradiated austenitic steels in a water environment, which is the coolant of the first circuit of WWER and PWR type reactors [34,38,39,40,41]. Moreover radiation hardening may affect the properties at high temperatures when helium embrittlement occurs with radiation hardening in a grain [42,43].
Thus, the change in microhardness under ion irradiation can be used as a characteristic controlling the embrittlement of materials by various mechanisms. Modeling the effect of neutron irradiation by ion irradiation can be considered adequate from the viewpoint of modelling the embrittlement mechanisms controlled by radiation hardening if such an ion irradiation regime is found for which the following condition is met:
Δ H v i = Δ H v n ,
where Δ H v i and Δ H v n are the radiation-induced change in microhardness under ion and neutron irradiations, respectively.
The question is now how to provide radiation hardening for ion-irradiated material that is identical to that realized under neutron irradiation.
At present, despite the high intensity of research conducted in the direction of developing the methodology of simulation tests, there are still no recommendations on the choice of ion irradiation conditions that provide the above requirement.
Some recommendations on the choice of ion irradiation condition are given in [5] from the viewpoint of the identity of the evolution of microstructures (vacancy void, dislocation loops and radiation-induced phases). However, the analysis in [5] was performed only for one pair of neutron and ion irradiation temperatures. In common cases, the temperature shift between neutron and ion irradiation may depend on the temperature of neutron irradiation. Moreover, in paper [5], the difference in the sizes and densities of microstructure parameters between neutron and ion irradiation is about double. For this case the difference in radiation hardening after neutron and ion irradiation may be significant.
Thus, the objectives of this article are as follows:
-
The development of a methodology for determining the ion irradiation parameters, which ensure the radiation hardening of ferritic-martensitic and austenitic steels, as close as possible to the radiation hardening of the same steels under neutron irradiation;
-
The determination of microhardness and radiation hardening for ferritic-martensitic and austenitic steels after ion and neutron irradiation in various states;
-
The development of some transferability function which connects the temperatures under neutron and ion irradiation for ferritic-martensitic and austenitic steels and that provides the same hardening at a given damage dose.

2. Methodology for Determining the Ion Irradiation Parameters and Development of the Transferability Function from Neutron to Ion Irradiation

The radiation embrittlement of ferrite–martensitic steels is much more strongly associated with radiation hardening than the embrittlement of austenitic steels. Therefore, when developing a methodology for determining the ion irradiation parameters for modeling hardening, it is advisable, first of all, to focus on the processes occurring in ferrite–martensitic steels.
The embrittlement of ferritic-martensitic steels under irradiation occurs by two mechanisms: hardening and non-hardening [12,13,14,15,16,17]. Embrittlement by the hardening mechanism occurs due to the radiation hardening of the material, which leads to an increase in the acting stresses in the sample or structural element. The increase in stresses, in turn, facilitates the nucleation and growth of microcracks in the material. The non–hardening mechanism of embrittlement is connected with a weakening of the interphase or grain boundaries in the material due to the segregation of impurity elements (mainly phosphorus). Such segregation also facilitates the nucleation of intragranular cleavage microcracks and intergranular microcracks, as well as the growth of intergranular microcracks. The non-hardening embrittlement mechanism does not lead to the radiation hardening of the material.
The non-hardening mechanism in FMS, connected with phosphorus segregation, does not practically depend on the damage dose rate, and the degree of embrittlement of FMS (with the same phosphorus content) is determined practically only by the accumulated damage dose [15]. Therefore, the non-hardening mechanism of embrittlement of FMS under ion irradiation may be modeled without taking into account the difference in the damage dose rates between ion and neutron irradiation. Hence, for FMS, the same degree of embrittlement for a non-hardening mechanism will be obtained when the ion irradiation damage dose equals the neutron irradiation damage dose.
Let us consider approaches to modeling the hardening mechanism of embrittlement by the ion irradiation for ferritic-martensitic and austenitic steels.
In cases where the hardening is mainly due to the formation of point defects and dislocation loops, as well as thermally activated processes of their annihilation, an increase in the dose rate leads to an increase in the radiation hardening degree under irradiation of the same dose.
At a constant damage dose rate, an increase in the irradiation temperature increases the annihilation of radiation defects and leads to a decrease in radiation hardening [16,44,45,46].
In connection with the above, to compensate for the difference in the dose rates under neutron irradiation in the reactor and ion irradiation in the accelerator when modeling the hardening embrittlement mechanism, the temperature of ion irradiation should, in general, exceed the temperature of neutron irradiation. It should be noted that ion irradiation leads to a temperature shift not only for radiation hardening, but also for radiation swelling, as well as the segregation of alloying and impurity elements.
Therefore, for modeling the hardening embrittlement mechanism, the difference in the dose rates under neutron irradiation in the reactor and ion irradiation in the accelerator may be compensated, in general, by increasing the temperature of ion irradiation.
The most adequate method for determining the hardening of a material under ion irradiation is the microhardness measurement.
Let a value δ T irr n i be
δ T irr n i = T irr n T irr i ,
where T irr n and T irr i are temperatures of the neutron irradiation in reactor and the ion irradiation in the accelerator for which Condition (3) is met. As can be seen, the δ T irr n i value describes the shift of the ion irradiation temperature relative to the neutron one.
In general, the value δ T irr n i depends on T irr n . Let us call this dependence the transferability function from neutron irradiation to ion irradiation: δ T irr n i = φ( T irr n ). The transferability function φ( T irr n ) is monotonically decreasing, since the relaxation processes connected with the annihilation of radiation-induced defects occurs faster with an increase in the irradiation temperature and the effect of the dose rate on the material hardening decreases.
Thus, for the radiation hardening to be modeled by ion irradiation, the following ion irradiation parameters should be used.
1. The target damage dose for ion irradiation Di should be equal to the dose Dn for modeled neutron irradiation. Then, the non-hardening embrittlement mechanism of FMS is automatically modeled.
2. The ion irradiation temperature T irr i should be set using the transferability function T irr i  =  T irr n  + φ( T irr n ). Then, the hardening embrittlement mechanism of FMS is modeled.
Since the damage dose distribution over the depth of the ion-irradiated layer is extremely heterogeneous, a separate task is to choose the distance from the ion-irradiated surface for which the target dose Di = Dn should be obtained. As an example, Figure 1 shows the dependence of the relative damage dose D i   /   D max i on the relative depth of the ion-irradiated layer for 12Cr-Ni-Mo-V-Nb steel. The calculation was carried out with the SRIM2008 software package for the case of irradiation with Fe3+ ions with an energy of 11.5 MeV in Institute for Physics and Power Engineering (JSC “SSC RF-FEI”). Figure 1 also shows a calculated relative concentration C Fe / C max Fe of the Fe3+ ions over the depth of the sample.
It should be noted that, when irradiating austenitic steels with Ni3+ or Ni4+ ions of the same energy, the dependences of the relative damage dose and the concentration of injected heavy ions are practically the same as those shown in Figure 1.
In Figure 1, the designations are used as follows: D max i and C max Fe are the maximum values of the damage dose Di and the concentration of injected Fe3+ ions; and tirr is the depth of the ion-irradiated layer.
Let us denote x* as the distance from the irradiated surface to the layer for which the condition Di = Dn should be satisfied.
As follows from the presented dose distribution, with a decrease in the x* value, the value D i   /   D max i also decreases. Based on this, the maximum dose of ion irradiation D max i should be increased when the x* value decreases to fulfill the condition Di = Dn. In other words, the degree of ion irradiation of the sample depends on the choice of the x* value.
To estimate the x* value when modeling radiation hardening by ion irradiation, let us divide the whole irradiated layer on three test zones adjoined to each other. Every test zone is the area where the irradiation effect on material is investigated for the average calculated dose in the area.
The damage doses on the left (closest to the surface) and right (farthest from the surface) boundaries of the zones are denoted, respectively, as D j - 1 i and D j i , where j is the number of the test zone from 1 to 3.
The left boundary of the first zone closest to the surface should be located a distance of 0.2–0.3 microns from the surface. This limitation is due to the fact that the surface distorts radiation-stimulated processes.
As can be seen from Figure 1, the location of the maximum damage dose and the concentration of injected ions is extremely close. It is clear that the injected ions change the microstructure of the investigated material, and the test zones should be located closer to the surface than the maximum concentration of injected ions. In order to avoid the influence of injected heavy ions on the microstructure, it is recommended to place the right border of the last test zone (in our case, the third) no deeper than the distance from the surface corresponding to 20% of the maximum implanted heavy ions concentration.
Based on this, let us set the location of the right border of the third zone. According to the calculations shown in Figure 1, the depth where the concentration of injected heavy ions is 20% of the maximum corresponds to approximately D 3 i ≈ 0.8 D max i .
As can be seen from Figure 1, the damage dose is D 0 i ≈ 0.12 D max i for the left boundary of the first test zone when the maximum dose is located at a depth of ≈2 microns.
Assume that the ratio of damage doses D j i / D j - 1 i on the borders of each zone should be the same. Then, the ratio of the maximum dose (on the right border of the third zone) to the minimum (on the left border of the first zone) is equal to
D 3 i D 0 i = D j i D j - 1 i N ,
where N is a number of test zones.
Based on (5), the ratio of damage doses on the boundaries of each test zone for N = 3 is equal to
D j i D j - 1 i = D 3 i D 0 i 3 = 1 . 88
Let us choose the middle of the third test zone as the x* value. Then, the condition Di = Dn can be written as
D 3 i + D 2 i 2 = D n .
The choice of the third test zone, in which the target dose Di = Dn is set, allows one to set a smaller value of D max i for ion irradiation compared to the choice of the first or second test zones. At the same time, it is obvious that the choice of one or another test zone for setting the parameters of ion irradiation should allow for modeling the radiation hardening of the material in terms of microhardness.
Approaches to measuring the microhardness of the irradiated layer should be proposed that take into account the strong gradient of the damage dose over the depth of the irradiated layer and some features of the material hardening under ion irradiation.
Radiation hardening in terms of the yield strength ΔσY increment is known to increase monotonically with an increase in the damage dose D. The dependence ΔσY(D) tends to saturate when a dose of 15 ÷ 30 dpa is reached for FMS [47,48,49,50] and a dose of 10 dpa for austenitic steels [3,33,35,36]. In other words, with a further increase in the dose, hardening does not practically increase.
Hence, for these doses, the hardening of the ion-irradiated layer is homogeneous if the minimum damage dose (dose on the sample surface) is greater than Dsat, where Dsat is the dose corresponding to the saturation of the dependence ΔσY (D). For other cases, the variation in ΔσY over the irradiated layer depth is at least partially similar to the dose variation.
Denote the radiation hardening in each zone as Δ σ Y ( j ) , where j = 1 … 3 is the number of the test zone. As a common case, Δ σ Y ( 3 )  ≥  Δ σ Y ( 2 )  ≥  Δ σ Y ( 1 ) . The average hardening for all three zones is denoted as Δ σ ¯ Y . As shown above, for D0 ≥ Dsat, the equality Δ σ Y ( 1 ) = Δ σ Y ( 2 ) = Δ σ Y ( 3 ) = Δ σ ¯ Y is practically met, and for D0 < Dsat, the value Δ σ Y ( 3 ) is greater than Δ σ ¯ Y .
As noted above, an increase in radiation hardening ΔσY occurs with an increase in the dose rate. Therefore, when the condition Di = Dn is met, one should expect Δ σ Y ( 3 ) > Δ σ Y n , where Δ σ Y n is the radiation hardening of the material after neutron irradiation. Considering that, in common cases, the inequalities Δ σ Y ( 3 ) Δ σ ¯ Y and Δ σ Y ( 3 ) > Δ σ Y n are fulfilled, the value Δ σ ¯ Y can be either less or more than Δ σ Y n , depending on the influence of the dose rate on material hardening. If the influence is strong, then Δ σ ¯ Y > Δ σ Y n . If the effect of the dose rate is weak and D0 ≥ Dsat, then Δ σ ¯ Y = Δ σ Y n , and for D0 < Dsat, it should be expected that Δ σ ¯ Y < Δ σ Y n .
When measuring the hardness, the material is consistently plastically deformed under the indentation process, starting from the surface. As is well known [51,52,53,54], the depth of the plastic deformation area exceeds the depth of indentation. In this regard, it should be taken into account that the microhardness of the irradiated layer, depending on the indentation depth, is affected by the substrate (the material of the sample located deeper than the irradiated layer). For a homogeneous material (unirradiated or irradiated by neutrons), the value H v does not practically depend on the depth of indentation.
Since the unirradiated material usually has a lower σY value compared with the irradiated layer, the dependence H v i on x/tirr has a non-monotonic character with a maximum. The microhardness dependence on the indentation depth for the ion-irradiated layer is schematically shown in Figure 2. The increasing part of the dependence H v i on x/tirr is due to an increase in the damage dose, and the decreasing part is connected with the influence of a soft substrate. It should be noted that the depth of the location of the microhardness maximum in the irradiated layer does not coincide with the location of the damage dose maximum and is much closer to the surface.
In connection with the above, to assess the microhardness of the ion-irradiated layer, it is advisable to take the maximum value H v i determined in the irradiated zone for different indentation depths. If this value corresponds to an indentation depth less than half the thickness of the ion-irradiated layer, then it corresponds to the value of Δ σ ¯ Y to a certain extent.
This is consistent with the recommendations of the international standard for measuring the microhardness of a thin coating [55]. According to [55], when determining the hardness of the hardened layer on a soft substrate, the maximum value in the area of indentation depths less than half of the layer thickness is recommended for use as the microhardness of the hardened layer.
Then, the radiation hardening after ion irradiation in terms of changes in microhardness can be written as
Δ H v i = max   ( H v i )     H v 0 ,
where H v 0 is the value of Hv for unirradiated material.
Since the value of max( H v i ) depends on the microhardness of each test zone in the ion-irradiated layer, the value Δ H v i determines the radiation hardening Δ σ ¯ Y in the irradiated layer. As shown above, the value of Δ σ ¯ Y under ion irradiation can be either greater or less Δ σ Y n , which depends on the sensitivity of the hardening to the damage dose rate. Thus, the algorithm may be recommended for constructing the dependence δ T irr i n = φ( T irr n ) as follows.
  • The dependence Δ H v n ( T irr n ) is constructed for the material irradiated by neutrons for the dose Dn or for doses Dn > Dsat, as Figure 3 illustrates.
  • The investigated material is irradiated in an ion accelerator at various temperatures T irr i until the target damage dose is reached in the third test zone D 3 i + D 2 i 2 = D n or D 3 i + D 2 i 2 > D sat .
  • The microhardness of the irradiated layer is measured for the material after ion irradiation at various T irr i and the dependence Δ H v i ( T irr i ) is determined.
  • If the dependence Δ H v i ( T irr i ) corresponds to variant A in Figure 3, then the transferability function δ T irr i n = φ( T irr n ) is determined.
  • If the dependence Δ H v i ( T irr i ) corresponds to variant B in Figure 3, ion irradiation should be repeated, choosing another test zone in which the target dose is set closer to the surface (second or first). This stage provides an increase in the maximum dose of ion irradiation D max i and an increase in the Δ H v i value.
Variant B corresponds to the case when D0 << Dsat and radiation hardening is practically invariant to the dose rate.
6.
The test zone in which the target dose is set varies until the dependence Δ H v i ( T irr i ) begins to correspond to variant A.

3. Investigated Materials and Specimens

3.1. Investigated Materials

Two grades of stainless FMS were taken for research, 12Cr-Ni-Mo-V-Nb (denoted hereafter as F1 material) and EP-823 (denoted hereafter as F2 material), and two grades of stainless chromium–nickel austenitic steels, 18Cr-10Ni-Ti (denoted hereafter as A1 material) and 16Cr-20Ni-2.5Mo-Ti (denoted hereafter as A2 material). The chemical compositions of F1 and F2 materials according to the technical specifications are presented in Table 1. The actual chemical compositions of A1 and A2 materials are shown in Table 2.
The presented steels were studied in the initial condition and after ion and neutron irradiation at different temperatures.

3.2. Specimens for Ion Irradiation

Special disk specimens 12 mm in diameter and 2 mm in thickness were developed and manufactured for ion irradiation. A sketch of the disk specimen is shown in Figure 4. A cylindrical hole with a diameter of 1 mm and length of 2–3 mm was drilled into the disc-shaped samples for thermocouple installation to control the irradiation temperature (see Figure 4).
Disk specimens were made using the electro spark technique, which excludes the strain hardening of the surface. The surface intended for irradiation was subjected to sequential grinding and polishing with a finishing pass with “soft” abrasives based on colloidal silica with a dispersion of 0.3–0.5 µm.
The absence of strain hardening was checked by scanning electron microscopy by the diffraction of backscattered electrons by a visualization of the so-called Kikuchi lines [56,57].
Disk specimens of F1 material were cut via cylindrical forging. Disk specimens of F2 material were cut from sheet metal with a thickness of 2 mm. Disk specimens of A1 and A2 materials were cut from small forgings of 500 kg in weight which were annealed over a temperature range 1040–1060 °C with subsequent air cooling.

3.3. Specimens for Neutron Irradiation

Specimens from F1, A1 and A2 materials, intended for study of the effects of neutron irradiation, were made from the same forgings that were used for specimens for ion irradiation. The measurement of the microhardness of these materials after neutron irradiation was carried out on microsections made from the heads of cylindrical tensile specimens irradiated in the reactor and tested at room temperature.
The measurement of the microhardness of F2 material after neutron irradiation was carried out on the metal shells of experimental fuel elements. To determine the microhardness of the metal fuel element shells in the initial state, they were subjected to tempering for 2 h at 720 °C.
Additionally, the measurement of the microhardness for the irradiated A1 material was carried out on the metal cut from the baffle-former-barrel assembly or, briefly, from the baffle of the decommissioned WWER-440 from Unit 3 of the Novovoronezh nuclear power plant. This reactor was in service for 45 years and was decommissioned in 2016 [58].

4. Neutron and Ion Irradiation Conditions

4.1. Neutron Irradiation

4.1.1. Ferritic-Martensitic Steels

Specimens of the F1 material were irradiated in a research fast reactor with sodium coolant BOR-60 at temperatures T irr n  = 390 °C up to damage doses Dn = 10.3 and 11.6 dpa and T irr n  = 550 °C up to Dn = 14.6 dpa.
To simulate Tirr = 450 °C and 500 °C, annealing of the F1 material irradiated at T irr n = 390 °C to Dn = 11.6 dpa was carried out. One sample was annealed at 450 °C, another sample at 500 °C. During annealing at Tann > T irr n , some part of the radiation defects, such as point defects and dislocation loops, formed at neutron irradiation dissociates. The non-dissociable part of radiation defects corresponds to the radiation defects formed at T irr n = Tann. The possibility of neutron irradiation simulation at temperatures exceeding the actual irradiation temperature by annealing was demonstrated in [16,59].
Such an approach was verified as follows.
The radiation hardening of the F2 material, irradiated at T irr n = 390 °C to Dn = 11.6 dpa and annealed at Tann = 500 °C for 10 h, was compared with the radiation hardening of 12% Cr steel with a similar chemical composition irradiated at T irr n = 490 °C to Dn = 13 dpa in a BN-350 fast reactor [50]. The radiation hardening of irradiated 12% Cr steel was Δ σ Y n = 50 MPa [50]. This specified value may be recalculated in terms of changes in microhardness using the following equation [28]:
Δ σ Y = 0.306 · Δ H v , MPa
Equation (9) provides for 12% Cr steel Δ H v n = 163 MPa. This estimation coincides with Δ H v n = 160 MPa, represented hereafter for F1 material irradiated at T irr n = 390 °C and annealed at Tann = 500 °C.
This allows us to conclude that the simulation of higher neutron irradiation temperatures by thermal annealing is adequate, at least from the viewpoint of modeling radiation hardening.
Specimens from F2 materials were cut from the shells of experimental fuel elements irradiated in a BN-600 reactor with damage doses from 14 dpa to 33 dpa. Disk specimens cut from different zones on the shell height provided the data for various irradiation temperatures ranging from 380 °C to 580 °C.
The damage doses and irradiation temperatures for F1 and F2 materials are given in Table 3.

4.1.2. Austenitic Steels

Specimens from A1 and A2 materials were irradiated under various conditions in reactors, such as the research fast neutron reactor BOR-60, the research pressure water reactor SM-3 (both reactors are located in NRC RIAR, Dimitrovgrad, Russia) and the power pressure water reactor WWER-440, over temperatures ranging from T irr n = 60 °C to T irr n = 500 °C up to damage doses from Dn = 10.2 dpa to Dn = 33.7 dpa. Irradiation condition, designated in Table 4 as (SM-3 + BOR-60,) means a two-stage irradiation for which the first stage is irradiation in the side reflector of SM-3 at T irr n ≈ 320 °C up to Dn ≈ 3 dpa and the second stage is additional irradiation in a BOR-60 reactor under various conditions.
For studying the radiation-induced variation in microhardeness over a wider temperature range, the procedure described above for FM steels was also used for austenitic A1 and A2 steels. Post-irradiated annealing of irradiated A1 and A2 steels was carried out over temperatures ranging from 400 to 600 °C.
The stacking fault energy for austenitic steels is lower than for ferrite–martensitic steels. Therefore, diffusion processes in austenitic steels are slower than in ferrite–martensitic steels and, as a result, the equilibrium state under annealing takes a longer time to be achieved. Based on this, the duration of post-irradiation annealing of austenitic steels was doubled in comparison with ferrite–martensitic steels and was 20 h.
Radiation hardening, in terms of yield strength increment for austenitic steels, has a maximum in the temperature range of ~300–450 °C [35,36]. Therefore, specimens after irradiation in a SM-3 reactor at 60 °C were not used for post-irradiation annealing to model various temperatures of neutron irradiation.
The conditions of neutron irradiation and post-irradiation annealing for A1 and A2 materials are represented in Table 4.

4.2. Ion Irradiation

4.2.1. Ferritic-Martensitic Steels

Disc-shaped samples from the studied F1 and F2 materials were irradiated in the ion accelerator 3MV Tandetron (at “Institute for Physics and Power Engineering”) by a continuous beam of heavy ions with Fe3+ or Fe4+ ions in combination with He ions.
The main condition of irradiation was cyclic irradiation, in which the time of heavy ion irradiation required to set the target dose was divided into five identical cycles, between which the samples were irradiated with He ions. To assess the effect of He on radiation hardening for the F2 material, a continuous irradiation condition with Fe3+ or Fe4+ ions without injecting He was also used. The target dose Di corresponding to the average dose in the third test zone was set at a depth of 1.4 µm of the irradiated layer.
The values of target doses for the studied materials, F1 and F2, were selected based on the parameters of neutron irradiation of these materials given in Table 3.
The energy of heavy Fe3+ or Fe4+ ions under irradiation in all conditions was 11.5 MeV. The depth of the location of the maximum damage dose is ~2 µm for this ion energy. Figure 5 shows the damage dose variation on the irradiated layer depth for Di = 13 dpa and 30 dpa under the ion irradiation of the studied ferrite–martensitic steels.
The energy of He ions was varied under irradiation to ensure the same specific concentration of injected He η = CHe/D over the depth range of the irradiated layer from 1.1 µm to 1.8 µm (here, CHe is the atomic concentration of helium).
The value of the specific concentration η was chosen corresponding to the actual He concentration under the operation of a fast reactor due to the nuclear reactions of fast-spectrum neutrons with the studied FMS. According to the performed estimates, for the spectrum of the core of the BOR-60 reactor, η = 0.2 appm/dpa.
For studying the He effect on radiation hardening, some samples from the F2 material were irradiated with a higher value of η = 4 appm/dpa.
The irradiation temperature was controlled by a thermocouple installed directly in the sample and maintained by an infrared heater installed behind the target with the sample.
The ion beam after the diaphragm created a spot with a diameter of 6 mm on the irradiated sample surface with a decrease in the damage dose along the edges of the spot relative to the target dose of no more than 10%.
Table 5 shows the ion irradiation conditions for samples from F1 and F2 materials.

4.2.2. Austenitic Steels

The ion irradiation of disk samples from austenitic steels was carried out in the ion accelerator 3MV Tandetron (at the “Institute for Physics and Power Engineering”) with a continuous beam of heavy Ni3+ or Ni4+ ions in combination with He ions.
Two conditions of irradiation were applied, as well as for ferrite–martensitic steels:
-
Continuous irradiation with Ni3+ or Ni4+ ions without injection of He;
-
Cyclic irradiation, in which the time of heavy ion irradiation required to set the target dose was divided into five identical cycles, between which the samples were irradiated with He+ ions.
The energy of heavy Ni3+ or Ni4+ ions in all conditions was 11.5 MeV.
The parameters of irradiation with He ions were similar to those for irradiation of ferrite–martensitic steels (F1 and F2 materials) to ensure the same η value over the depth range of the irradiated layer from 1.1 µm to 1.8 µm.
The value of η was assigned equal to the actual specific He concentration for the thermal spectrum of the WWER. This type of reactor leads to a higher specific He concentration in austenitic steels.
The actual specific He concentration in 18Cr-10Ni-Ti steel is 5–7 appm/dpa for the spectrum of neutrons typical for the Internals of WWER type reactors [60]; therefore, the value of η was chosen to be 7 appm/dpa.
The target dose Di, corresponding to the average dose in the third test zone, was set to a depth of 1.4 µm of the irradiated layer.
The values of target doses for the studied A1 and A2 materials were selected based on the parameters of neutron irradiation of these materials given in Table 4. The dose of Di = 30 dpa was chosen as the first target dose, and Di = 13 dpa was chosen as the second.
Figure 6 shows the variation in the damage dose over the depth of the ion-irradiated layer for both target doses.
Table 6 shows the ion irradiation conditions for the studied austenitic steels.

5. Microhardness Measurement Procedure

The microhardness was measured by microhardness tester CPX 25-099 from “CSM-instruments” using the Vickers pyramid indentation method, with a given strain rate equal to 0.1 s−1 up to a given load. The given load was withstood for 10 s in accordance with GOST R 8.748-2011 [61].
The microhardness tester CPX 25-099 was equipped with a remote control for measuring the microhardness of irradiated samples in the hot cell of the Laboratory of Radiation Materials Science of CRISM “Promethey”.
The microhardness value was determined as the ratio of the load to the contact area of the indenter with the material. The contact area of the indenter was calculated based on the measured projection area of the indent on the sample surface.
Thin sections from samples irradiated in reactors were made on a Saphir 520 machine from QATM with a remote control, which was also installed in a hot cell.
The microhardness of neutron-irradiated samples was measured at two loads, P = 0.5 N and 1 N. For the studied steels, the indentation depth, h, at these loads was h = 2.5–3.8 µm. The error in measurement of the microhardness did not exceed 30 MPa. The microhardness value was determined as the average value determined for loads of 0.5 N and 1 N.
The microhardness of ion-irradiated samples was determined when using the same equipment as for samples after neutron irradiation. The microhardness of ion-irradiated samples was measured at a greater number of loads due to the shallow depth of the ion-irradiated layer and the inhomogeneity of the damage dose at its depth. The load level itself was chosen to be lower than for samples after neutron irradiation. The following series of loads was taken to determine the microhardness after ion irradiation: P = 0.03, 0.04, 0.05, 0.06, 0.07, 0.08, 0.1, 0.2, 0.5 N and 1 N. These loads correspond to the range of depth from h = 0.4 to h = 5.5 µm. For P = 0.03–0.05 N, at least five measurements were performed; for P = 0.06–1 N—at least three. The root-mean-square error of measuring the microhardness value for P = 0.03 ÷ 0.05 N was ±120 MPa; for P = 0.06 ÷ 1.0 N, the error was ±60 MPa.
The microhardness measurement results were processed in accordance with the standards for the microhardness measurement of a thin solid layer on a soft substrate [55]. The standard [55] recommends taking the thin solid layer microhardness as the maximum value of microhardness measured over a depth range of less than half a thin layer. Hence, for the irradiated layer thickness of ~2 microns, the microhardness should be measured for the depth, h < 1 µm.
When determining radiation hardening after neutron and ion irradiation, the microhardness of the unirradiated samples was determined at P = 1.0 N, which corresponds to the indentation depths, h = 2.5–3.0 µm.
The exception is the determination of the hardening of ferrite–martensitic steels (F1 and F2 materials) after ion irradiation. In this case, the microhardness of the irradiated and unirradiated metal was determined for the same sample. The microhardness of the unirradiated metal was determined outside the ion irradiation spot at P = 0.5 N, which corresponds to h = 2.5–3.0 µm.
Figure 7 shows a photograph of indents at P = 0.03 and 0.05 N. As seen, the shape of the indent is close to square, indicating the negligible influence of the jumper at the top of the Vickers pyramid used at minimal loads.

6. Experimental Results

6.1. Microhardness of Ferritic-Martensitic Steels

6.1.1. After Neutron Irradiation

The microhardness values of samples from F1 and F2 materials are represented in Table 7 and Table 8, respectively, as follows: H v 0 is the microhardness in the initial (unirradiated) state and H v n is the same in the irradiated state, with the difference Δ H v n = H v n H v 0 being a measure of the radiation hardening (see Equation (2)). Hereafter, this short difference is called the radiation hardening.
In addition to the original data, the results from paper [50] have been added to Table 8. It should be noted that, in paper [50], the radiation hardening is presented in terms of changes in yield strength Δ σ Y n . For comparison, the changes in the microhardness in the data from [50] were recalculated using the correlation Dependence (9) presented above. These data have been used due to the absence of original data for the F2 material at T irr n over the range from 425 to 580 °C.
An analysis of the data presented in Table 7 and Table 8 allows us to draw the following conclusions. The data obtained at T irr n = 380–390 °C show that Dsat for F2 material does not exceed at least 14 dpa, since there is no increase in hardening with an increase in the damage dose. For F1 material, such an unambiguous conclusion cannot be made as the increase in hardening with an increase in dose at T irr n  = 390 °C can be explained both by the scatter of experimental data and by the fact that Dsat > 10.3 dpa.
For both FMS, the radiation hardening monotonically decreases with increasing T irr n over the range of the investigated temperatures. Moreover, for F1 material, an almost complete annealing of radiation hardening can already be observed at T irr n = 550 °C, while, for F2 material at T irr n = 580 °C, some radiation hardening is still observed.

6.1.2. After Ion Irradiation

The typical dependences of microhardness on the indentation depth, h, are shown in Figure 8 for the irradiated and unirradiated regions of samples from F1 and F2 materials after ion irradiation.
As can be seen from Figure 8, the microhardness of the unirradiated regions does not practically depend on the indentation depth. This indicates the invariance of the Vickers microhardness value from the indentation depth, h, when measuring the microhardness of a homogeneous material with a constant strain rate.
The microhardness of the initial (unirradiated) material H v 0 was determined outside the ion irradiation spot at P = 0.5 N, corresponding to h = 2.5–3.0 µm.
The microhardness of samples from F1 and F2 materials in the initial state H v 0 , after ion irradiation H v i and the radiation hardening Δ H v i = H v i H v 0 are shown in Table 9 and Table 10, respectively.
The results presented in these tables show that, for all the samples studied, the maximum value of the dependence H v (h) was observed at h = 0.3–0.8 µm. This makes it possible to use the standard approaches for measuring the hardness of a thin-layer coating [55], as described earlier in Section 6 of this article. According to [55], the maximum value of microhardness over an indentation depth range of 0.3–0.8 µm was taken as the microhardness of the ion-irradiated layer, Δ H v i .
As can be seen from the data presented in Table 9, the maximum radiation hardening for F1 material after ion irradiation is observed over the T irr i range from 350 to 400 °C and reaches a value of Δ H v i ≈ 1350–1390 MPa. At higher irradiation temperatures, the radiation hardening decreases, reaching a minimum value of 40 MPa at T irr i = 600 °C.
A similar trend is observed for F2 material. Based on the data obtained for samples irradiated up to 14–15 dpa, radiation hardening does not change at T irr i  = 350–400 °C and begins to decrease at higher temperatures (see the data for samples irradiated up to 30 dpa).
It can be noted that the maximum values of radiation hardening for F1 and F2 materials after ion and neutron irradiation are close (see Table 7, Table 8, Table 9 and Table 10).
Comparing the data in Table 10, for samples irradiated with and without implantation of He, the following can be noted. For all temperatures at two levels of the target dose Di, irradiation with only heavy ions and without He ions leads to weaker radiation hardening than after combined irradiation with heavy and light He ions. An increase in the helium content from 0.2 to 4 appm/dpa does not practically affect the radiation hardening (see samples P49, P21, P22 and P26 in Table 10).
Figure 9 shows the temperature dependences of radiation hardening for the F2 material after ion irradiation at various doses with heavy ions with and without implantation of He.
It can be seen from the presented data that combined irradiation with heavy ions and light He ions leads to an earlier saturation of the dose dependence of radiation hardening, compared with irradiation with heavy ions only. At the same time, irradiation without He leads to a more intensive decrease in radiation hardening with an increase in T irr i in comparison to irradiation with He. This effect is apparently due to the stabilization of dislocation loops (one of the main sources of FMS hardening) by implanted helium that leads to the less intense dissociation of loops with the growth of T irr i in comparison to irradiation with heavy ions only.

6.2. Microhardness for Austenitic Steels

6.2.1. After Neutron Irradiation

The microhardness of samples from materials A1 and A2 in the initial (unirradiated) state H v 0 , irradiated condition H v n and the radiation hardening Δ H v n = H v n H v 0 are shown in Table 11.
To expand the range of neutron irradiation temperatures for the austenitic steels under consideration, additional data from [62] were also used. Reference [62] presents the study results of the effect of post-irradiation annealing on the microstructure and hardening of HC-18Cr-10Ni-Ti steel with a carbon content of 0.12% after irradiation in a BOR-60 reactor up to doses over 100 dpa over the T irr n range from 330 to 360 °C [62]. The radiation swelling of these samples did not exceed 1%. The mechanical properties of the irradiated HC-18Cr-10Ni-Ti steel were studied in the irradiation condition and after post-irradiation annealing for 20 h at temperatures Tann = 600, 700, 800 and 900 °C. The test temperature was equal to 290 °C.
In reference [62], it was shown that, for Tann > 800 °C, an almost complete recovery of hardening was observed. Therefore, in this work, we only used the data for Tann ≤ 800 °C.
Table 12 shows the values of radiation hardening in terms of ΔσY for HC-18Cr-10Ni-Ti steel after neutron irradiation and post-irradiation annealing at Tann = 600–800 °C [62], and the calculated values of Δ H v n . The Δ H v n value was calculated using th equation obtained in [28] for austenitic steels:
Δ H v   =   3.03 · Δ σ Y , MPa
It was assumed that the value Δ H v n , calculated from the data on the yield strength at 290 °C, is equal to that determined at a temperature of 20 °C.
Figure 10 shows the dependences of radiation hardening Δ H v n on T irr n for the austenitic steels under investigation. Some of the irradiation temperatures were modeled by the post-irradiation annealing of neutron-irradiated samples at higher temperatures.
It can be seen that the presented dependencies are close for both investigated steels, regardless of the irradiation dose.
The dependence Δ H v n ( T irr n ) has a maximum over the T irr n range from 280 to 450 °C, which is a plateau when radiation swelling is absent. The obtained result fully corresponds to the data presented in [35], where the effect of T irr n on the yield strength increase under neutron irradiation is studied.
This type of the temperature dependence can be explained as follows. Dislocation loops and radiation-induced phases are the main contributors to the radiation hardening of austenitic steels, with the contribution of dislocation loops being dominant.
At low irradiation temperatures (up to 300 °C), at which there is no phase formation, the radiation hardening is determined only by dislocation loops. The concentration of dislocation loops corresponding to the saturation level (the equilibrium concentration of loops at a given temperature) increases with the irradiation temperature increase, reaching a maximum at ~300 °C [63]. Therefore, the radiation hardening increases with an increase in the irradiation temperature at doses corresponding the saturation of the dislocation loops concentration. A further increase in the irradiation temperature from ~300 °C to ~450 °C leads to a decrease in the saturation level of the dislocation loops concentration and a decrease in their contribution to hardening. On the other hand, T irr n increase leads to phase formation and an increase in their concentration that leads to the further hardening of the material. These two processes compensate for each other, so that, over a range from T irr n = 280 to T irr n = 450 °C, radiation hardening practically does not change.
With a further increase in the irradiation temperature, thermally activated processes of the annihilation of radiation defects lead to a decrease in the concentration of dislocation loops. In addition, the size of the radiation-induced phases increases and their concentration drops drastically. This leads to a decrease in the radiation hardening induced by both phases and dislocation loops (see Figure 10).

6.2.2. After Ion Irradiation

Figure 11 and Figure 12 show the typical dependences of the microhardness H v on the indentation depth, h, for A1 and A2 materials, respectively, after ion irradiation. The results are given for different irradiation temperatures and damage doses.
The processing of microhardness measurements of all studied austenitic steels after ion irradiation showed that the dependence H v (h) sees a maximum at h = 0.5–1.0 µm.
According to the methodology presented above, the microhardness after ion irradiation was determined as the maximum value at an indentation depth up to 1 micron.
Table 13 and Table 14 present the results of measuring the microhardness of the studied austenitic steels after ion irradiation and the calculated radiation hardening Δ H v i = H v i H v 0 . Here, the values H v 0 presented in Table 11 were used as the microhardness in the initial state.
Figure 13 shows the dependencies of radiation hardening Δ H v i on the temperature of ion irradiation T irr i for samples of A1 and A2 materials.
From the presented data, it can be concluded that, for ion irradiation with Di = 30 dpa, the dependence Δ H v i ( T irr i ) is similar to the dependence Δ H v n ( T irr n ) for neutron irradiation. The maximum radiation hardening is observed at T irr i = 400 °C and this coincides with the hardening under neutron irradiation.
The radiation hardening at T irr i = 400–500 °C is significantly lower (by 1000–1200 MPa) for Di = 13 dpa than for Di = 30 dpa. The dependence Δ H v i ( T irr i ) decreases with increasing temperature, without having a maximum in the temperature range T irr i = 400–500 °C.
Estimating the effect of implanted He on the radiation hardening, the following can be noted. As can be seen from Figure 13a, for Di = 30 dpa, He has practically no effect for the temperatures of maximum hardening. For Di = 13 dpa, the implantation of He leads to a stronger hardening compared to irradiation without He.

7. Construction of the Transferability Functions

7.1. Ferritic-Martensitic Steels

Figure 14 and Figure 15 show the dependences of radiation hardening on the irradiation temperature for F1 and F2 materials after neutron (see Table 7 and Table 8) and ion irradiation (see Table 9 and Table 10). For ion irradiation, the data were used only for regimes with implantation of He.
It can be seen that the dependences Δ H v ( T irr ) for FMS for both types of irradiation monotonically decrease. The maximum value of ΔHv is observed at Tirr = 350–400 °C, and this maximum value for ion and neutron irradiation is close for both steels. At higher irradiation temperatures, the condition Δ H v n < Δ H v i is fulfilled, which corresponds to variant “A” presented in Figure 3. This means that the change in microhardness after ion irradiation corresponds to the target dose in the third test zone.
To construct the transferability function, the temperature dependences of the radiation hardening of F1 and F2 materials for both types of irradiation were approximated using the following function:
Δ H v = Δ H v max 1 exp A T irr B ω + Δ H v min ,
where Δ H v max and Δ H v min are the maximum and minimum values of the radiation hardening over the considered irradiation temperature range; A, B and ω are some coefficients.
An analysis of the obtained data shows, that for both steels, the values Δ H v max and Δ H v min are close for ion and neutron irradiation. Therefore, when approximating experimental data, these values were taken to be the same for both irradiation types.
The coefficients in Equation (11) for the investigated steels were determined using the least squares method. As a result, the following dependencies were obtained.
For F1 material:
-
After neutron irradiation:
Δ H v n = 1320 1 exp 630 T irr 171 . 8 8 . 43 + 40 ,   MPa
-
After ion irradiation:
Δ H v i = 1320 1 exp 630 T irr 159 . 7 5 . 82 + 40 ,   MPa .
For F2 material:
-
After neutron irradiation:
Δ H v n = 1615 1 exp 630 T irr 186 . 1 5 . 35 + 190 ,   MPa ;
-
After ion irradiation:
Δ H v i = 1615 1 exp 630 T irr 159 . 0 4 . 9 + 190 ,   MPa ;
The obtained equations are valid for T irr ≤ 630 °C.
The obtained equations are also presented in Figure 14 and Figure 15.
The data in Figure 14 and Figure 15 allow one to determine the transferability function δ T irr i n = φ( T irr n ), which describes the shift of the ion irradiation temperature relative to the neutron one.
As can be seen from Figure 14, the transferability function δ T irr i n = φ( T irr n ) for F1 material is non-monotonic with maximum value of about 27 °C. It is appropriate to use the following conservative approach to describe the transferability function. For F1 material, the value δ T irr i n in the irradiation temperature range from 350 to 600 °C can be assumed to be constant and equal to 10 °C. This estimation provides adequate modeling for the radiation hardening Δ H v n at T irr n ≤ 450 °C, while the error in Δ H v n at T irr n > 450 °C is small.
For F2 material (see Figure 15), a monotonous decrease in δ T irr i n is observed with irradiation temperature increase. It should be noted that the difference between Δ H v i and Δ H v n at Tirr = 490 °C, as observed in Figure 15, should be less, since the microhardness under neutron irradiation corresponds to Dn = 11 dpa, which, apparently, may be slightly lower than Dsat. At the same time, since Dsat, for this steel, does not exceed 14 dpa (see above), the error in the estimation of δ T irr i n at Tirr = 490 °C is not significant.
By solving Equations (9) and (10), the transferability function δ T irr i n = φ( T irr n ) was obtained as a function of the T irr n value normalized to 100 °C in the temperature range 390–620 °C. This function, as shown in Figure 16, can be approximated using the following power dependence:
δ T irr i n = 32.6 3.2 10 3 T irr n 100   ° C 5 ,   ° C
For neutron irradiation temperatures T irr n < 390 °C, it is allowable to take δ T irr i n = 0 for F2 material.
Figure 14 and Figure 15 solely include data with implantation of He. It is interesting to consider the data without implantation of He.
Figure 17 shows a comparison of the dependences Δ H v ( T irr ) for F2 material after neutron and ion irradiation to Di = 30 dpa without implantation of He. As seen, the radiation hardening for both types of irradiation is close.
Apparently, in the absence of He, the relaxation processes increase that cause the annihilation of dislocation loops. Consequently, the dynamic equilibrium between the generation and annihilation of dislocation loops shifts towards a decrease in their density. As a result, in the absence of He, the equilibrium concentration of dislocation loops at a given irradiation temperature becomes smaller, relative to the combined ion irradiation with implantation of He. Therefore, in the absence of He, the hardening also decreases.
The coincidence of radiation hardening after neutron irradiation and ion irradiation without He implantation seems to be the result of compensation of two processes: an increase in hardening due to an increase in dose rate and a decrease in hardening due to ion irradiation without He implantation, which is generated under neutron irradiation.
It is clear that, in the general case, such compensation may not occur and ion irradiation without implantation of He may lead to the underestimation of hardening. At the same time, the obtained experimental data show that the possible underestimation of hardening is insignificant at sufficiently high values of the target damage dose (Di = 30 dpa). For a more accurate assessment of the effect of implanted He on the radiation hardening of FMS under ion irradiation, additional studies are required.
Based on the results obtained, in general, for the conservative modeling of radiation hardening of FMS under neutron irradiation, ion irradiation with implantation of He is required and δ T irr i n = 0 should be taken.

7.2. Austenitic Steels

The results obtained for austenitic steels after ion irradiation, and their comparison with the results after neutron irradiation, show the following.
For the target dose Di = 30 dpa in the third test zone, the maximum value of radiation hardening after ion irradiation max( Δ H v i ) and after neutron irradiation max( Δ H v n ) are equal over the temperature range from 300 to 650°. This equality allows us to construct a transferability function φ( T irr n ) for Di = 30 dpa, since it is possible to find such a shift of the ion irradiation temperature relative to the neutron irradiation temperature when Condition (3) is met.
For the target dose Di = 13 dpa in the third test zone, the inequality max( Δ H v i ) < max( Δ H v n ) is satisfied; therefore, any correction of T irr i does not provide the fulfillment of Condition (3). Therefore, according to the presented above methodology, it is necessary to change the test zone with the target dose from the third to the second or first.
Thus, the choice of test zone with the target dose for austenitic steels differs from that for ferrite–martensitic steels.
Let us consider a possible reason for this difference.
In the second section, it was shown that the choosing of the third test zone as a zone with target dose for ion irradiation can lead to the fulfillment of the inequality Δ σ ¯ Y = Δ σ Y n for the same neutron dose in the case where the dose on the surface of the ion-irradiated sample D0 < Dsat and the radiation hardening of the material is weakly sensitive to the dose rate.
In the case where D0 ≥ Dsat, regardless of the sensitivity of hardening to the dose rate, the condition Δ σ ¯ Y = Δ σ Y n is met.
As can be seen from the data presented in Figure 10, the shape of the temperature dependence of the radiation hardening, and the values of hardening after neutron irradiation, are close for the studied austenitic steels, regardless of the damage dose. This result indicates that Dsat ≤ 10.8 dpa, regardless of the irradiation temperature (see Table 11). This Dsat value is also confirmed by other studies of irradiated chromium–nickel austenitic steels [3,33,35,36].
Figure 6 shows that, for samples from A1 and A2 materials irradiated to Di = 30 dpa in the third test zone, D0 ≈ Dsat. At the same time, for these samples, max( Δ H v i ) = max( Δ H v n ) or, in other words, Δ σ ¯ Y = Δ σ Y n .
For samples irradiated to Di = 13 dpa, D0 < Dsat (see Figure 6). For these samples, the inequality Δ σ ¯ Y < Δ σ Y n is met as max( Δ H v i ) < max( Δ H v n ). This means that the sensitivity of radiation hardening to the dose rate for the studied austenitic steels is weak.
The choice of the second test zone as a target for A1 and A2 materials leads to the following.
It follows from the definition of the test zones given in Section 2 that the average damage dose in the second zone is 1.88 times less than the dose in the third zone used as the target for ion irradiation. Then, when Di = 13 dpa in the second test zone, the ion irradiation dose should be Di = 24.4 dpa in the third test zone at a depth of 1.4 µm.
As seen, the change in the test zone from the third to the second with Di = 13 dpa is, in fact, close to the ion irradiation with Di = 30 dpa in the third test zone. At the same time, the distribution of the damage dose over the irradiated layer depth shows that the value of Dsat = 10.8 dpa is achieved at a depth of ≈0.5 µm (see Figure 6). In this case, the condition D ≥ Dsat is met for almost the entire ion-irradiated layer.
Thus, it may be concluded that, for austenitic steels after neutron irradiation up to doses Dn ≥ Dsat, it is possible to find a transferability function if the condition D ≥ Dsat is met under ion irradiation in almost the entire irradiated layer.
Apparently, for D0 < Dsat, the transferability function can be used when setting the target dose in the second test zone.
In connection with the above, all the data on the temperature dependence of radiation hardening of A1 and A2 materials and HC-18Cr-10Ni-Ti steel, including data after post-irradiation annealing, were used to determine the transferability function for austenitic steels. Data on the radiation hardening of A1 and A2 materials after ion irradiation were used only for regimes when a saturation of radiation hardening is achieved, namely, after ion irradiation to Di = 30 dpa at all irradiation temperatures T irr i .
Figure 18 shows a comparison of the temperature dependences of radiation hardening after ion and neutron irradiation for A1 and A2 materials and HC-18Cr-10Ni-Ti steel.
As can be seen from Figure 18, for the studied austenitic steels, the level of maximum radiation hardening after ion and neutron irradiation coincides. The temperature dependence after the maximum also coincides for ion and neutron irradiation for the studied steels. In other words, in this temperature range, the transferability function φ( T irr n ) = 0. At T irr n ≤ 300 °C, the temperature of ion irradiation should be increased compared to neutron irradiation to obtain the same radiation hardening.
Based on the experimental data presented in Figure 18, the following transferability function φ( T irr n ) was constructed:
φ ( T irr n ) = - 0 . 56 T irr n + 276.8 ,   for   60   T irr n   280   ° C - T irr n + 400 ,   for   280   < T irr n   400   ° C 0 ,   for   T irr n > 280   ° C
The obtained function is presented in Figure 19. It should be noted that the obtained function is applicable when radiation swelling is less than 1% and only for doses D equal to or above Dsat, corresponding to the saturation of radiation hardening.
In common cases, in order to adequately simulate hardening under neutron irradiation, it is recommended to perform ion irradiation with the implantation of He. At the same time, the necessity of He implantation under ion irradiation cannot be fully confirmed based on the results obtained. On the one hand, the effect of He on the radiation hardening of austenitic steels is practically absent at ion irradiation temperatures corresponding to the maximal hardening for doses corresponding to the saturation of radiation hardening (in the presented case, at Di = 30 dpa). On the other hand, it is shown for FMS that the absence of He implantation can lead to a significant decrease in hardening.

8. Conclusions

1. A methodology for the ion irradiation and determination of microhardness and radiation hardening of an ion-irradiated layer is proposed, which allows one to obtain the radiation hardening of ferritic-martensitic and austenitic steels, as close as possible to the radiation hardening under neutron irradiation.
2. For ferritic-martensitic steels (FMS) of 12Cr-Ni-Mo-V-Nb grade (F1 material) and EP-823 grade (F2 material), and for austenitic steels of 18Cr-10Ni-Ti grade (A1 material) and 16Cr-20Ni-2.5Mo-Ti grade (A2 material), microhardness values were measured in the initial state and after neutron and ion irradiation at different temperatures. The dependences of radiation hardening, in terms of changes in microhardness ∆Hv on the irradiation temperature, are constructed. It is shown that the dependence of ∆Hv on the irradiation temperature for austenitic steels has a maximum.
3. The concept of a target zone in an ion-irradiated layer is formulated, in which the value of the damage dose should be equal to the damage dose under neutron irradiation. It is shown that, in order to obtain the same radiation hardening under neutron and ion irradiation, in general, the ion irradiation temperature must exceed the neutron irradiation temperature by a value of δ T irr i n , depending on the neutron irradiation temperature. Moreover, an equality of damage doses in the target zone and under neutron irradiation should be ensured. The dependence δ T irr i n on the neutron irradiation temperature T irr n is called the transferability function δ T irr i n = φ( T irr n ).
4. The effect of ion irradiation with the implantation of helium on the radiation hardening of FMS and austenitic steels is determined. It is shown that combined ion irradiation with helium implantation leads to a more intense radiation hardening with an increase in the damage dose and to a decrease in the dose Dsat at which the hardening saturation occurs.
5. The transferability functions for FMS and austenitic steels are determined on the basis of the obtained experimental data. These functions determine the connection between neutron and ion irradiation temperatures, for which the same radiation hardening is provided.
6. It is shown that, for austenitic steels, in contrast to ferrite–martensitic, the damage dose rate has a weak effect on radiation hardening. As a result, for austenitic steels, the transferability function can be obtained only for damage doses corresponding to the saturation of radiation hardening and such a dose should be provided practically over the entire depth of the ion-irradiated layer.

Author Contributions

Conceptualization, B.M.; methodology, B.M. and A.S.; formal analysis, A.S. and L.B.; investigation, A.S. and L.B.; writing—original draft, B.M.; writing—review and editing, A.S. and L.B.; visualization, A.S. All authors have read and agreed to the published version of the manuscript.

Funding

This work has been carried out within the framework of contract 17706413348220001050 with State Atomic Energy Corporation Rosatom.

Data Availability Statement

Data is contained within the article.

Conflicts of Interest

The authors declare no conflict of interest.

References

  1. Zelensky, V.F.; Neklydov, I.M. Radiation Defects and Swelling of Metals; Naukova Dumka: Kiev, Ukraine, 1988. (In Russian) [Google Scholar]
  2. Was, G.S. Fundamentals of Radiation Materials Science; Springer: Berlin/Heidelberg, Germany, 2007. [Google Scholar]
  3. INTERNATIONAL ATOMIC ENERGY AGENCY, Accelerator Simulation and Theoretical Modelling of Radiation Effects in Structural Materials; IAEA Nuclear Energy Series; No. NF-T-2.2; IAEA: Vienna, Austria, 2018; ISSN 1995–7807.
  4. Available online: https://neup.inl.gov/SiteAssets/FY%202013%20Abstracts/IRP/IRP-University%20of%20Michigan.pdf (accessed on 1 November 2023).
  5. Was, G.S.; Jiao, Z.; Getto, E.; Sun, K.; Monterrosa, A.M.; Maloy, S.A.; Anderoglu, O.; Sencer, B.H.; Hackett, M. Emulation of reactor irradiation damage using ion beams. Scr. Mater. 2014, 88, 33. [Google Scholar] [CrossRef]
  6. Zinkle, S.J.; Snead, L.L. Opportunities and limitations for ion beams in radiation effects studies: Bridging critical gaps between charged particle and neutron irradiations. Scr. Mater. 2018, 143, 154–160. [Google Scholar] [CrossRef]
  7. Taller, S.; Coevering, G.V.; Wirth, B.D.; Was, G.S. Predicting structural material degradation in advanced nuclear reactors with ion irradiation. Sci. Rep. 2021, 11, 2949. [Google Scholar] [CrossRef] [PubMed]
  8. Rogozhkin, S.V.; Nikitin, A.A.; Khomich, A.A.; Iskandarov, N.A.; Khoroshilov, V.V.; Bogachev, A.A.; Lukyanchuk, A.A.; Raznitsyn, O.A.; Shutov, A.S.; Fedin, P.A.; et al. Emulation of Radiation Damage of Structural Materials for Fission and Fusion Power Plants Using Heavy Ion Beams. Phys. Atom. Nuclei 2019, 82, 1239–1251. [Google Scholar] [CrossRef]
  9. Grudzevich, O.T.; Pechenkin, V.A.; Kobetz, U.A.; Gurbich, A.F.; Bokhovko, M.V.; Shaginyan, R.A.; Margolin, B.Z.; Petrov, S.N.; Mikhailov, M.S.; Vasileva, E.A. Investigation of structural materials radiation resistance with ion accelerators. Probl. At. Sci. Technol. Ser. Nucl. React. Constants 2022, 3, 127–145. (In Russian) [Google Scholar]
  10. ASTM E521-96; Standard Practice for Neutron Radiation Damage Simulation by Charged-Particle Irradiation. ASTM International: West Conshohocken, PA, USA, 2017.
  11. Taller, S.; Jiao, Z.; Field, K.; Was, G.S. Emulation of Fast Reactor Irradiated T91 Using Duallon Beam Irradiation. J. Nucl. Mater. 2019, 527, 151831. [Google Scholar] [CrossRef]
  12. Phythian, W.J.; English, C.A. Microstructural evolution in reactor pressure vessel steels. J. Nucl. Mater. 1993, 205, 162–177. [Google Scholar] [CrossRef]
  13. Al Mazouzi, A.; Alamo, A.; Lidbury, D.; Moinereau, D.; Van Dyck, S. PERFORM 60: Prediction of the effects of radiation for reactor pressure vessel and in-core materials using multi-scale modelling—60 years foreseen plant lifetime. Nucl. Eng. Des. 2011, 241, 3403–3415. [Google Scholar] [CrossRef]
  14. Margolin, B.Z.; Shvetsova, V.A.; Gulenko, A.G. Radiation embrittlement modeling in multiscale approach to brittle fracture of RPV steel. Int. J. Fract. 2013, 179, 87–108. [Google Scholar] [CrossRef]
  15. Margolin, B.Z.; Yurchenko, E.V.; Morozov, A.M.; Pirogova, N.E.; Brumovsky, M. Analysis of a link of embrittlement mechanisms and neutron flux effect as applied to reactor pressure vessel materials of WWER. J. Nucl. Mater. 2013, 434, 347–356. [Google Scholar] [CrossRef]
  16. Alekseenko, N.N.; Amaev, A.D.; Gorynin, I.V.; Nikolaev, V.A. Radiation Damage of Nuclear Power Plant Pressure Vessel Steels; American Nuclear Society: La Grangeark, IL, USA, 1997. [Google Scholar]
  17. Ortner, S.; English, C. Contribution of Laboratory Experiments to Unravelling the Mechanisms of RPV Embrittlement. In Proceedings of the Materials: PAMELA Workshop, Mol, Belgium, 19–21 September 2011. [Google Scholar]
  18. Lidbury, D.; Bugat, S.; Diard, O.; Keim, E.; Marini, B.; Viehrig, H.-W.; Planman, T.; Wallin, K. PERFECT (prediction of irradiation damage effects on reactor components): Progress with multi-scale modelling in RPV mechanics sub-project. In Local Approach to Fracture; Besson, J., Moinerau, D., Steglich, D., Eds.; Ecole des Mines de Paris: Paris, France, 2006; pp. 459–464. [Google Scholar]
  19. Eason, E.D.; Odette, G.R.; Nanstad, R.K.; Yamamoto, T. A Physically Based Correlation of Irradiation-Induced Transition Temperature Shifts for RPV Steels. J. Nucl. Mater. 2013, 433, 240–254. [Google Scholar] [CrossRef]
  20. Kirk, M. Assessment of flux effect exhibited by IVAR database. In Proceedings of the IAEA Technical Meeting on Radiation Embrittlement and Life Management of Reactor Pressure Vessels, Znojmo, Czech Republic, 18–22 October 2010. [Google Scholar]
  21. Amaev, A.D.; Kryukov, A.M.; Neklyudov, I.M. Radiation Damage and Operability of Structural Materials; Parshin, A.M., Platonov, P.A., Eds.; Politekhnika: St. Petersburg, Russia, 1997. (In Russian) [Google Scholar]
  22. Lu, Z.; Faulkner, R.G.; Jones, R.B.; Flewitt, P.E.J. Radiation-and thermally-induced phosphorus inter-granular segregation in pressure vessel steels. J. ASTM Int. 2005, 2, 180–194. [Google Scholar] [CrossRef]
  23. GOST R 70431-2022; The State System of Ensuring Unity of Measurement (GSI). Materials for Equipment and Pipes of Nuclear Power Plants. Methods for Determination of Impact Strength and Critical Temperature of Brittleness by Impact Bending Test. Russian Standardization Institute: Moscow, Russian, 2023.
  24. ASTM E 1921-22a; Standard Test Method for Determination of Reference Temperature, T0, for Ferritic Steels in the Transition Range. Annual Book of ASTM Standards: West Conshohocken, PA, USA, 2022; Volume 03.01.
  25. Wallin, K. Fracture Toughness of Engineering Materials—Estimation and Application; EMAS Publishing: Warrington, OR, USA, 2011. [Google Scholar]
  26. Margolin, B.Z.; Gulenko, A.G.; Fomenko, V.N.; Kostylev, V.I. Further Improvement of the Prometey Model and Unified Curve Method. Part 2. Improvement of the Unified Curve Method. Eng. Fract. Mech. 2018, 191, 383–402. [Google Scholar] [CrossRef]
  27. Margolin, B.; Yurchenko, E. Trend Curves for WWER RPV Materials and Their Supported Structures. In Radiation Embrittlement Trend Curves and Equations and Their Use for RPV Integrity Evaluations; ASTM STP 1647-EB; ASTM: West Conshohocken, PA, USA, 2023; pp. 174–203. [Google Scholar]
  28. Busby, J.T.; Hash, M.C.; Was, G.S. The relationship between hardness and yield stress in irradiated austenitic and ferritic steels. J. Nucl. Mater. 2005, 336, 267–278. [Google Scholar] [CrossRef]
  29. Gorynin, I.V.; Nesterova, E.V.; Nikolaev, V.A.; Rybin, V.V. Microstructure and Mechanical Properties of WWER-440 Reactor Vessel Metal after Service Life Expiration and Recovery Anneal. In Effects of Radiation on Materials: 17th International Symposium, Sun Valley, Idaho, 20–23 June 1994; ASTM STP 1270; American Society for Testing and Materials: West Conshohocken, PA, USA, 1996; p. 248. [Google Scholar]
  30. Lucas, G.E.; Odette, G.R.; Maiti, R.; Sheckherd, J.W. Tensile Properties of Irradiated Pressure Vessel Steels. In Influence of Radiation on Material Properties: 13th International Symposium, Seattle, WA, 23–25 June 1986; Part II, ASTM STP 956; American Society for Testing and Materials: West Conshohocken, PA, USA, 1987; p. 379. [Google Scholar]
  31. Higgy, H.R.; Hammand, F.H. Effect of fast-neutron irradiation on mechanical properties of stainless steels: AISI types 304,316 and 347. J. Nucl. Mater. 1975, 55, 177. [Google Scholar] [CrossRef]
  32. Kalin, B.A. Physical Materials Science; MIFI: Moscow, Russia, 2008; ISBN 978-5-7262-0821-3. (In Russian) [Google Scholar]
  33. Garner, F.A. Radiation Damage in Austenitic Steels. Compr. Nucl. Mater. 2012, 4, 33–95. [Google Scholar]
  34. Fukuya, K. Current understanding of radiation-induced degradation in light water reactor structural materials. J. Nucl. Sci. Technol. 2013, 50, 213–254. [Google Scholar] [CrossRef]
  35. Kursevich, I.P.; Margolin, B.Z.; Prokoshev, O.Y.; Kokhonov, V.I. Mechanical properties of austenitic steels under neutron irradiation: Influence of various factors. Vopr. Materialoved. (Probl. Mater. Sci.) 2006, 48, 55–68. (In Russian) [Google Scholar]
  36. Sorokin, A.A.; Margolin, B.Z.; Kursevich, I.P.; Minkin, A.J.; Neustroev, V.S. Effect of neutron irradiation on tensile properties of materials for pressure vessel internals of WWE type reactors. J. Nucl. Mater. 2014, 444, 373–384. [Google Scholar] [CrossRef]
  37. Margolin, B.; Sorokin, A.; Smirnov, V.; Potapova, V. Physical and mechanical modelling of neutron irradiation effect on ductile fracture. Part 1. Prediction of fracture strain and fracture toughness of austenitic steels. J. Nucl. Mater. 2014, 452, 595–606. [Google Scholar] [CrossRef]
  38. Chopra, O.K.; Rao, A.S. A review of irradiation effects on LWR core internal materials—IASCC susceptibility and crack growth rates of austenitic stainless steels. J. Nucl. Mater. 2011, 409, 235–256. [Google Scholar] [CrossRef]
  39. Kenik, E.A.; Busby, J.T. Radiation-induced degradation of stainless steel light water reactor internals. Mater. Sci. Eng. R 2012, 73, 67–83. [Google Scholar] [CrossRef]
  40. Margolin, B.Z.; Pirogova, N.E.; Sorokin, A.A.; Kokhonov, V.I. Mechanisms of Stress Corrosion Cracking of Irradiated Austenitic Chromium–Nickel Steels Used for WWER and PWR Vessel Internals. Inorg. Mater. Appl. Res. 2021, 12, 1701–1720. [Google Scholar] [CrossRef]
  41. Logan, H.L. Stress Corrosion of Metals; John Wiley & Sons Inc.: Hoboken, NJ, USA, 1967. [Google Scholar]
  42. Margolin, B.; Sorokin, A.; Shvetsova, V.; Buchatsky, A.; Pirogova, N. Fracture mechanisms and properties for irradiated austenitic chromium-nickel steel over elevated temperature range and formulation of intergranular fracture criterion. Eng. Fract. Mech. 2019, 281, 109087. [Google Scholar] [CrossRef]
  43. Claudson, T.T.; Barker, R.W. The effects of fast flux irradiation on the mechanical properties and dimensional stability of stainless steel. Nucl. Appl. Technol. 1970, 9, 10–23. [Google Scholar] [CrossRef]
  44. Hawthorne, J. Irradiation embrittlement. In Treatise on Materials Science and Technology; Elsevier: Amsterdam, The Netherlands, 1983; Volume 25, pp. 461–524. [Google Scholar]
  45. Jones, R.; Williams, T. The Dependence of Radiation Hardening and Embrittlement on Irradiation Temperature. In Effects of Radiation on Materials: 17th International Symposium, Sun Valley, Idaho, 20–23 June 1994; ASTM STP 1270; American Society for Testing and Materials: West Conshohocken, PA, USA, 1996; p. 569. [Google Scholar]
  46. Odette, G.R.; Yamamoto, T.; Klingensmith, D. On the effect of dose rate on irradiation hardening of RPV steels. Philosophical Magazine 2005, 85, 779–797. [Google Scholar] [CrossRef]
  47. Gaganidze, E.; Petersen, C.; Aktaa, J. Study of helium embrittlement in boron doped EUROFER97 steels. J. Nucl. Mater. 2009, 386, 349–352. [Google Scholar] [CrossRef]
  48. Lysova, G.V.; Birzhevoy, G.A. Kinetics of the radiation-induced hardening of EP-823 steel after Ni++ ion irradiation, annealing and re-irradiation. J. Surf. Investig. X-Ray Synchrotron Neutron Tech. 2012, 6, 326–329. [Google Scholar] [CrossRef]
  49. Maloy Henry, S.A. Irradiation-resistant ferritic and martensitic steels as core materials for Generation IV nuclear reactors. In Structural Materials for Generation IV Nuclear Reactors; Woodhead Publishing: Sawston, UK, 2017; Chapter 9; pp. 329–355. [Google Scholar]
  50. Ivanov, A.A.; Shulepin, S.V.; Dvoryashin, A.M.; Konobeev, Y.V.; Ivanov, S.N.; Alekseev, Y.V.; Porollo, S.I. Structure and mechanical properties of EP-823 steel, 20Kh12MN steel and experimental versions of 12% chromium steels after irradiation in the BN-350 reactor. In Proceedings of the IX Russian Conference on Reactor Material Science, Dimitrvgrad, Russia, 14–18 September 2009; pp. 560–573. (In Russian). [Google Scholar]
  51. Grigorovich, V.K. Hardness and Microhardness of Metals; Nauka: Moscow, Russia, 1976. (In Russian) [Google Scholar]
  52. Golovin, Y.I. Nanoindentation and Its Capabilities; Mashinostroenie: Moscow, Russia, 2009; ISBN 978-5-94275-476-1. (In Russian) [Google Scholar]
  53. Dolph, C.K.; da Silva, D.J.; Swenson, M.J.; Wharry, J.P. Plastic zone size for nanoindentation of irradiated Fe-9%Cr ODS. J. Nucl. Mat. 2016, 481, 33–45. [Google Scholar] [CrossRef]
  54. Xiao, X.; Yu, L. Nano-indentation of ion-irradiated nuclear structural materials: A review. Nucl. Mater. Energy 2020, 22, 100721. [Google Scholar] [CrossRef]
  55. ISO 14577-4:2016 (E); Metallic Materials—Instrumented Indentation Test for Hardness and Materials Parameters—Part 4: Test Method for Metallic and Nonmetallic Coatings. ISO: Geneva, Switzerland, 2016.
  56. Angus, J.; Wilkinson, T. Ben. Britton. Strains, planes, and EBSD in materials science. Materialstoday 2012, 15, 366–376. [Google Scholar]
  57. Gusev, M.N.; de Bellefon, G.M.; Rosseel, T.M. Analysis of Localized Deformation Processes in Highly Irradiated Austenitic Stainless Steel through In Situ Techniques; ORNL/TM-2019/1274; Report of Oak Ridge National Laboratory; Oak Ridge National Laboratory: Oak Ridge, TN, USA, 2019; p. 36. [Google Scholar]
  58. Margolin, B.; Shvetsova, V.; Sorokin, A.; Minkin, A.; Pirogova, N. Mechanisms of plastic deformation and fracture of austenitic chromium-nickel steel irradiated during 45 years in WWER-440. J. Nucl. Mater. 2021, 549, 152911. [Google Scholar] [CrossRef]
  59. Kryukov, A.; Debarberis, L.; Hähner, P.; Gillemot, F.; Oszvald, F. Thermal annealing as a method to predict results of high temperature irradiation embrittlement. J. Nucl. Mater. 2013, 432, 501–504. [Google Scholar] [CrossRef]
  60. Belozerov, S.V.; Neustroyev, V.S.; Shamardin, V.K. Studying helium accumulation in austenitic steels for evaluating radiation damage in internals of water-moderated water-cooled power reactors. Phys. Met. Metallogr. 2008, 106, 503–509. [Google Scholar] [CrossRef]
  61. GOST R 8.748-2011 (ISO 14577-1:2002); The State System of Ensuring Unity of Measurement (GSI). Metals and Alloys. Hardness and Other Characteristics of Materials at Instrumental Indentation Test. FSUE “STANDARTINFORM”: Moscow, Russia, 2013. (In Russian)
  62. Gurovich, B.A.; Kuleshova, E.A.; Frolov, A.S.; Maltsev, D.A.; Prikhodko, K.E.; Prikhodko, K.E.; Margolin, B.Z.; Prikhodko, K.E. Investigation of high temperature annealing effectiveness for recovery of radiation-induced structural changes and properties of 18Cr10NiTi austenitic stainless steels. J. Nucl. Mater. 2015, 465, 565–581. [Google Scholar] [CrossRef]
  63. Zincle, S.J.; Maziasz, P.J.; Stoller, R.E. Dose Dependence of the Microstructual Evolution in Neutron Irradiated Steel. J. Nucl. Mater. 1993, 206, 266–286. [Google Scholar] [CrossRef]
Figure 1. The depth-variation in the relative damage dose and the relative concentration of implanted Fe ions for the irradiated layer of the sample from the FMS 12Cr-Ni-Mo-V-Nb irradiated with Fe3+ ions with an energy of 11.5 MeV.
Metals 14 00099 g001
Figure 2. General view of the dependence H v i on x/tirr for ion-irradiated layer.
Metals 14 00099 g002
Figure 3. Common view of the dependence of ΔHv on Tirr.
Metals 14 00099 g003
Figure 4. Sketch of disk specimen for ion irradiation (unit: mm).
Metals 14 00099 g004
Figure 5. The depth-variation in the damage dose for the irradiated layer for F1 and F2 materials irradiated with Fe3+ and Fe4+ ions up to two target doses of Di.
Metals 14 00099 g005
Figure 6. The depth-variation in the damage dose for the irradiated layer for A1 and A2 materials irradiated with Ni3+ and Ni4+ ions up to two target doses of Di.
Metals 14 00099 g006
Figure 7. Photo of indents at P = 0.03 N (on the right) and 0.05 N (on the left).
Metals 14 00099 g007
Figure 8. The dependence of microhardness on the indentation depth, h, for samples from F1 and F2 materials after the combined Fe4+ and He ions irradiation in various states (the legends for each sample are given in Table 9 and Table 10). Metals 14 00099 i001
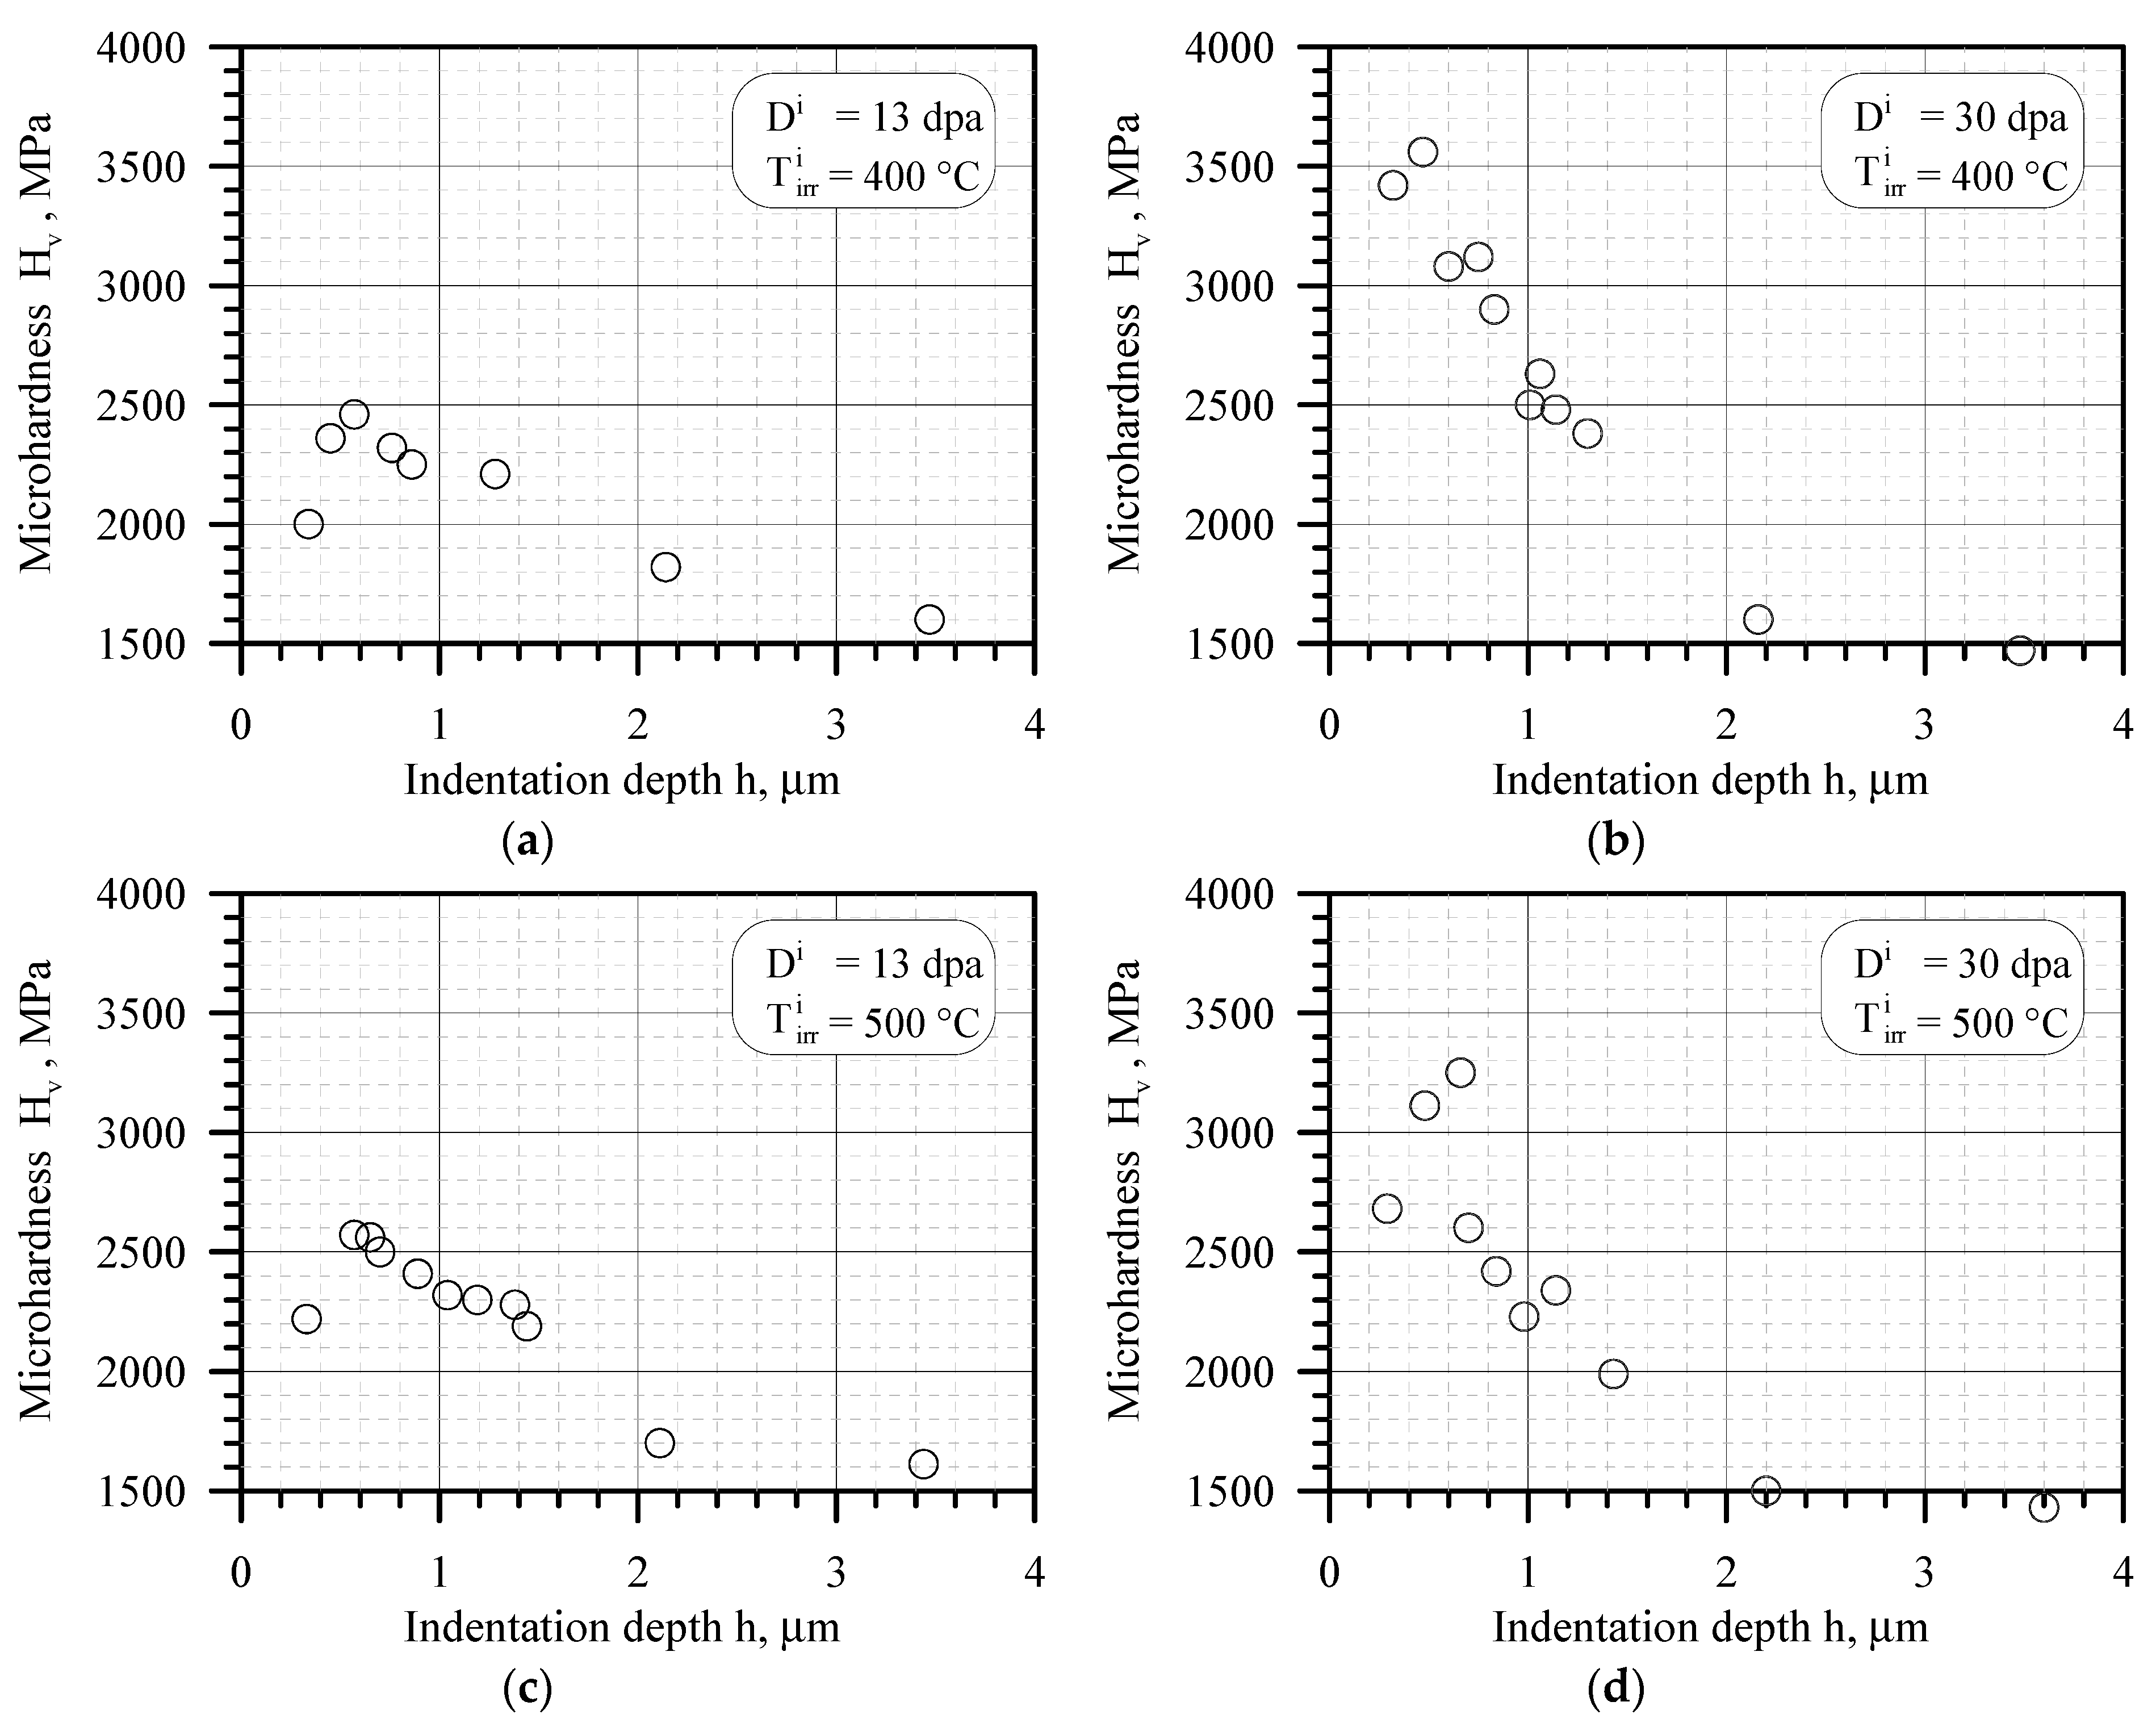
—ion irradiated region of sample, ○—unirradiated region of sample: (a) specimen X55, (b) specimen X56, (c) specimen P62, (d) specimen P49, (e) specimen X58, (f) specimen (P29).
Metals 14 00099 g008
Figure 9. The dependencies Δ H v i ( T irr i ) for F2 material after ion irradiation with heavy ions: Fe only (a) and after the combined irradiation with heavy ions Fe and He with η = 0.2 appm/dpa (b). ○—Di = 14–15 dpa, ●—Di = 30 dpa.
Metals 14 00099 g009
Figure 10. The dependence Δ H v n ( T irr n ) for A1 and A2 materials and for HC-18Cr-10Ni-Ti steel irradiated in reactors of various types with doses of 10.2–33.7 dpa: Metals 14 00099 i001
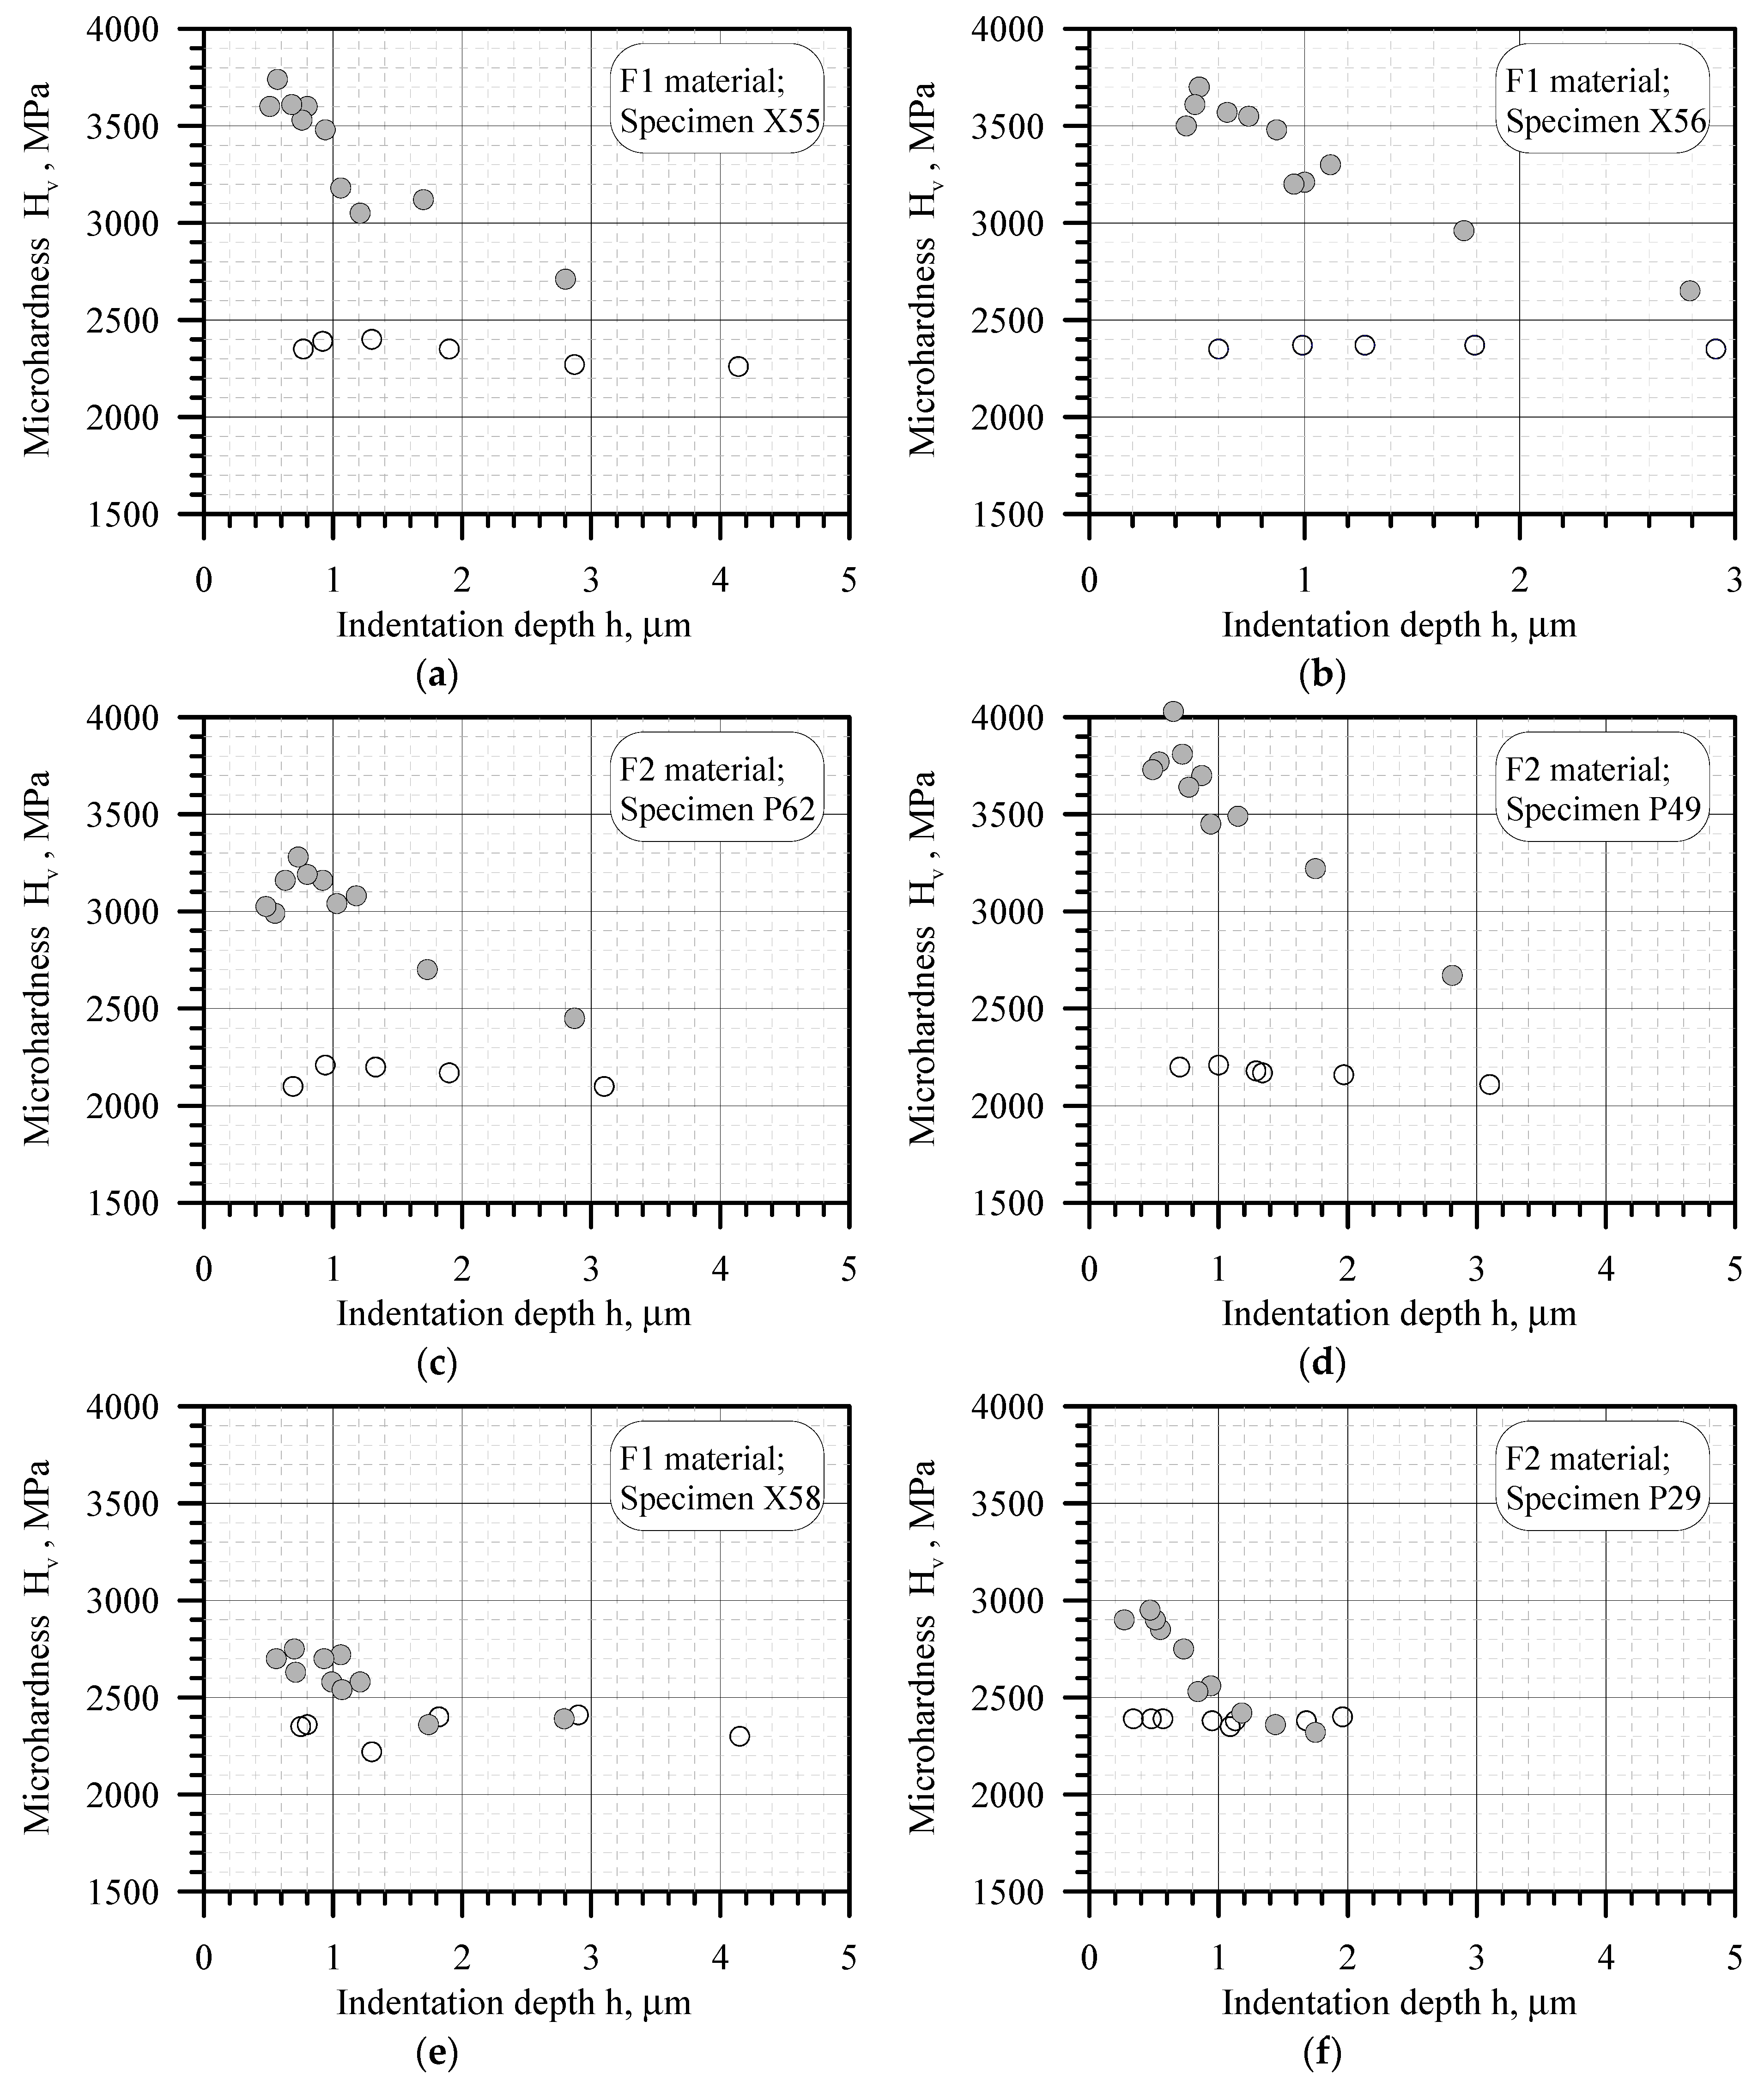
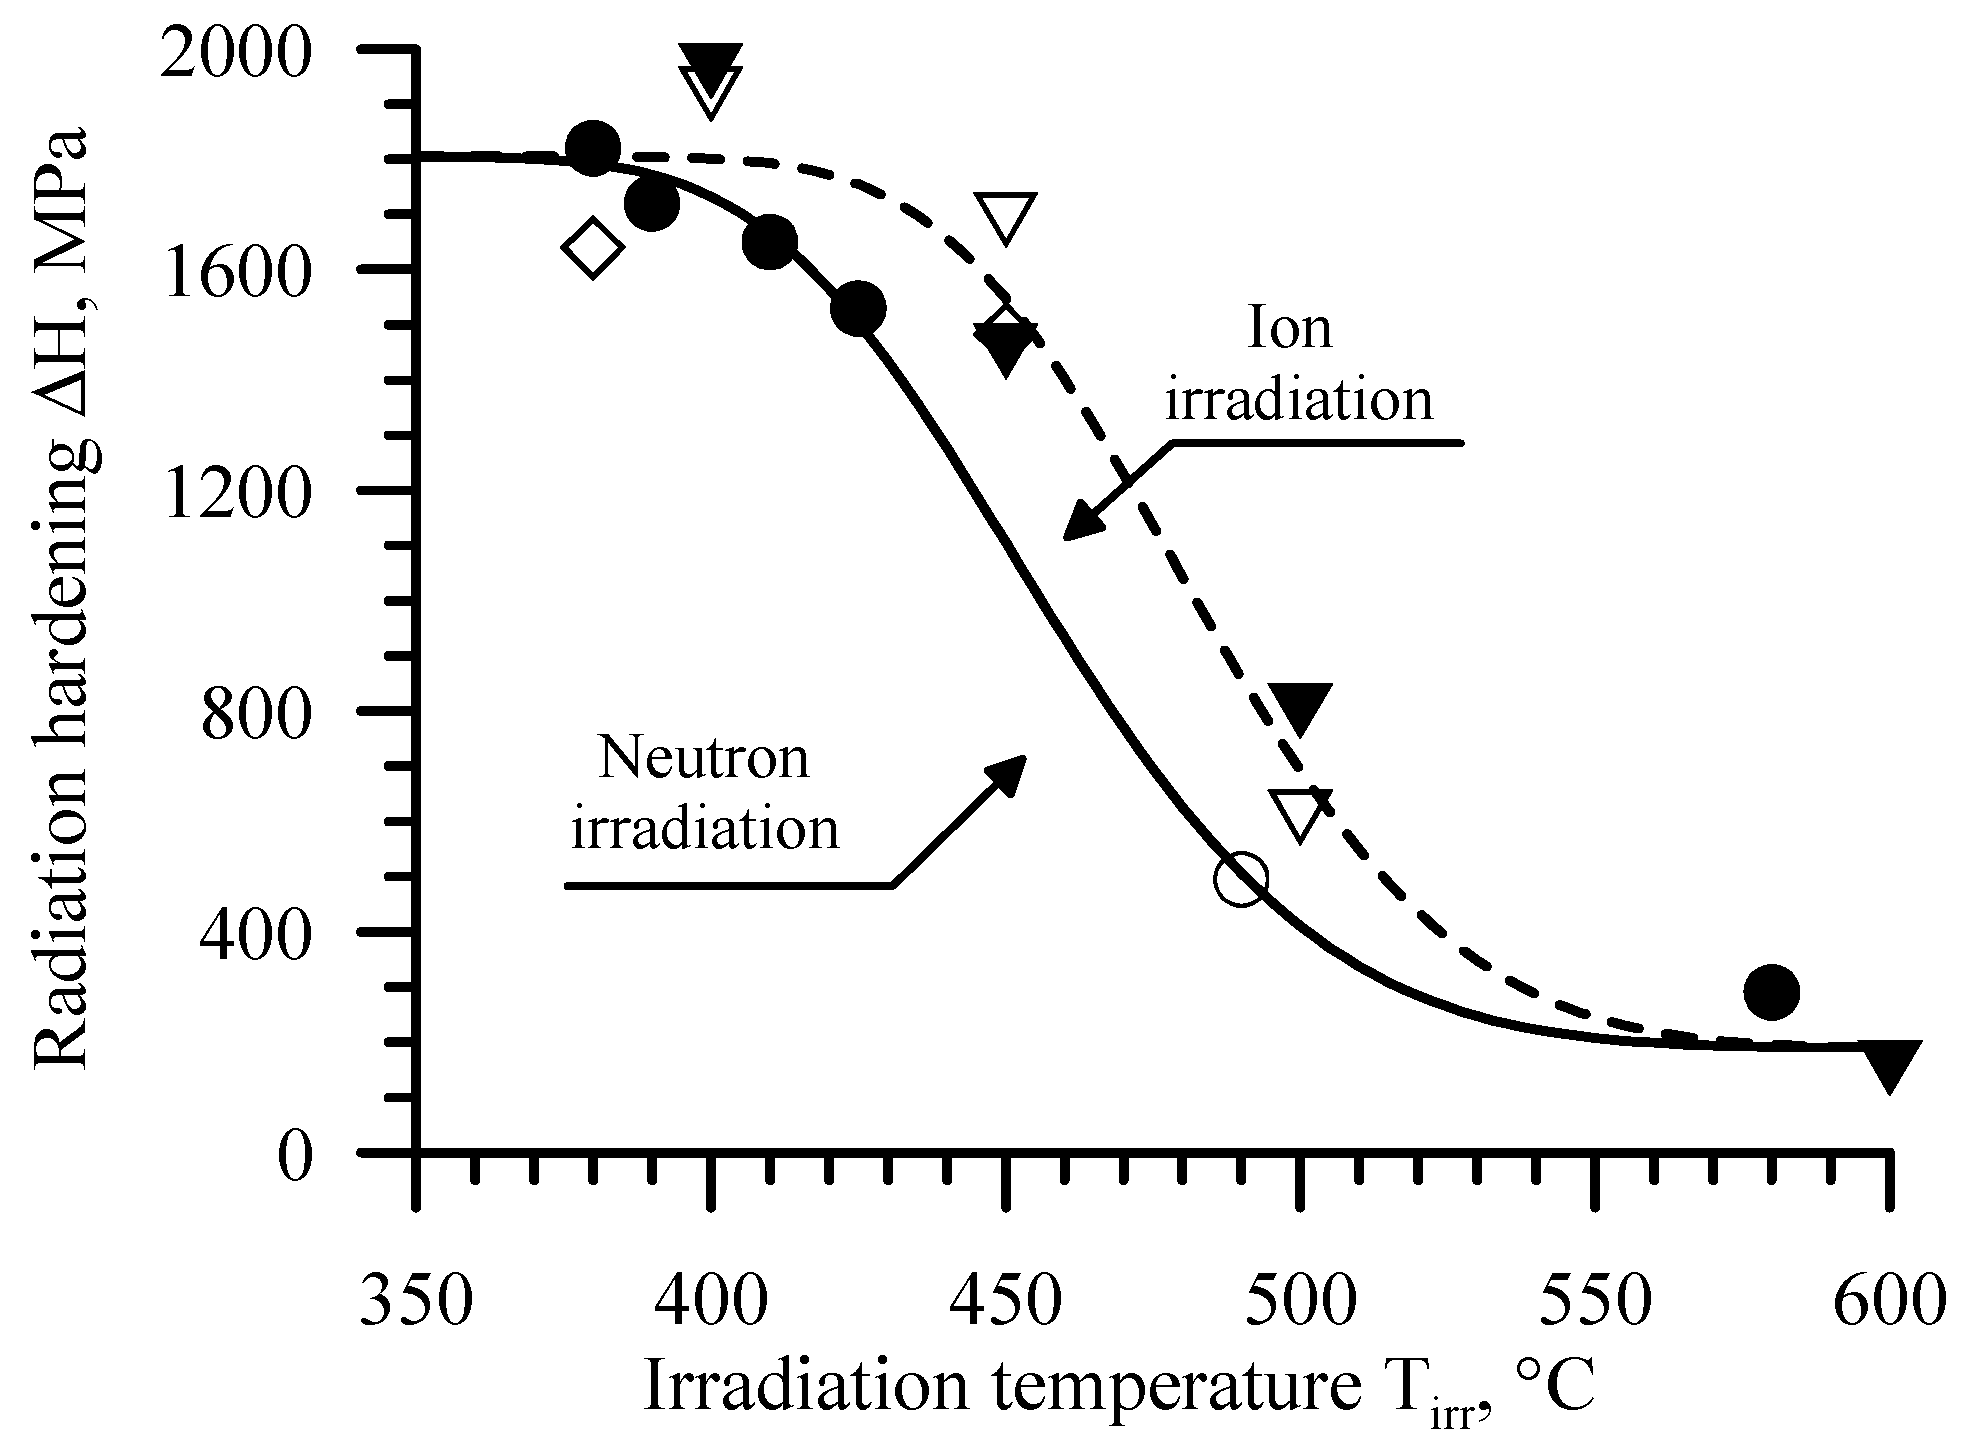
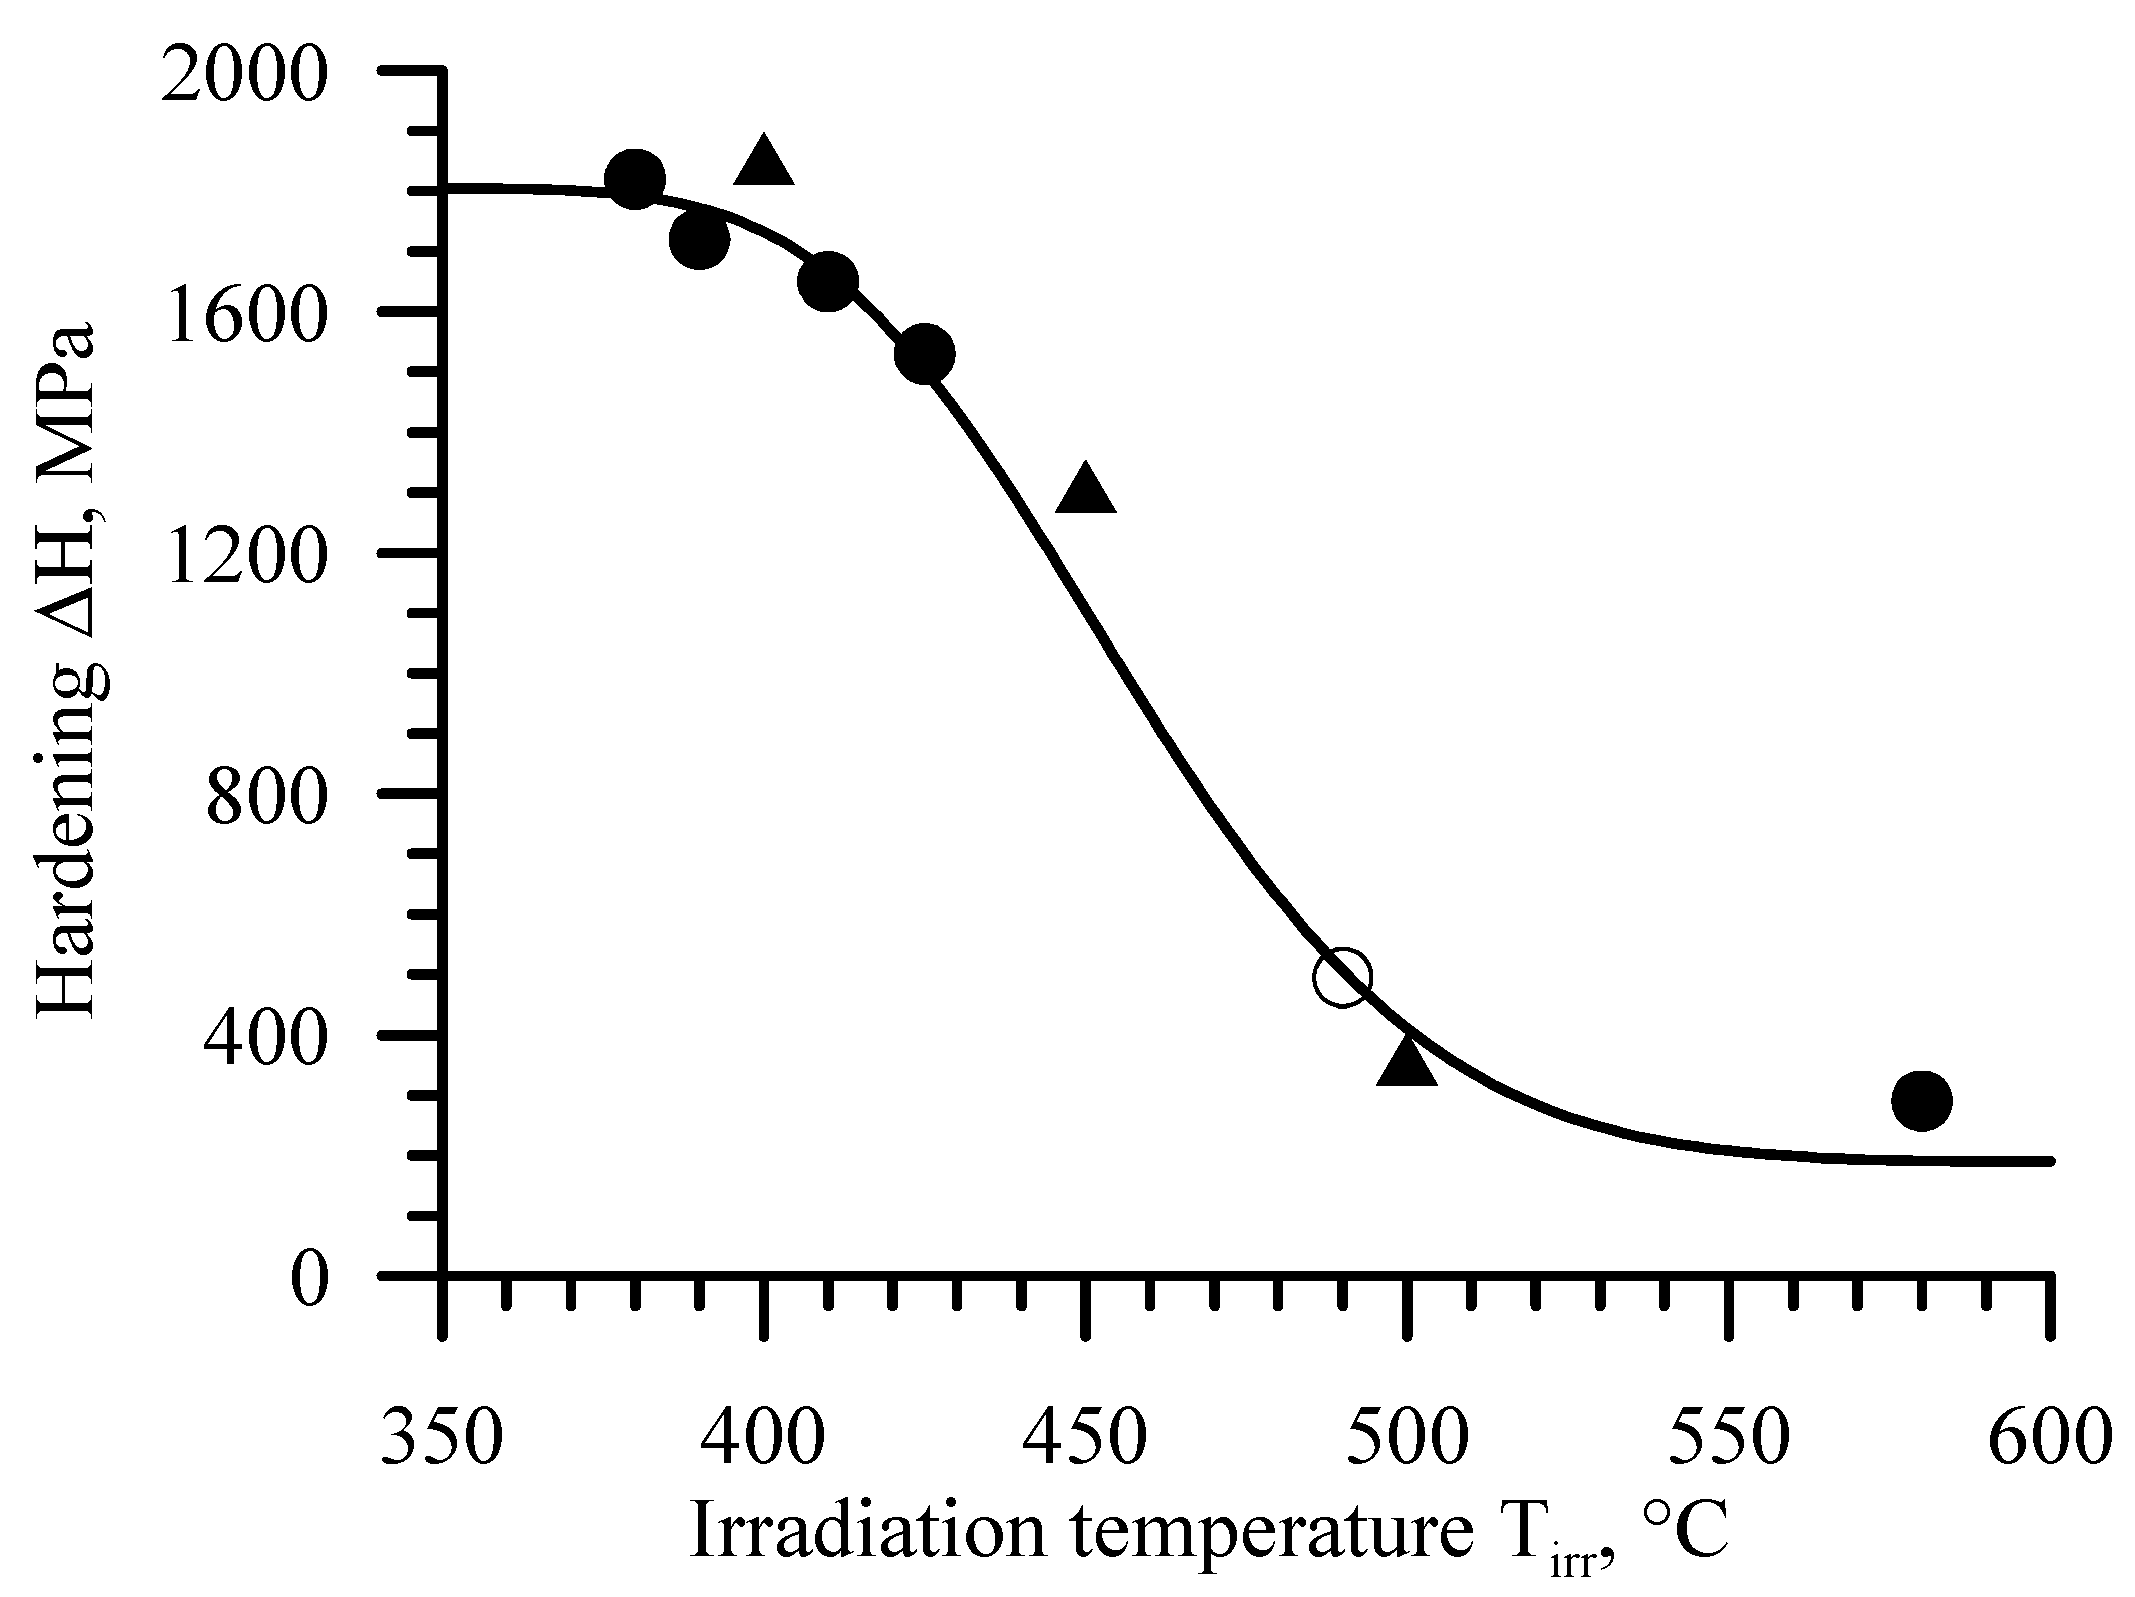
—A1 material after neutron irradiation; ○—A1 material and HC-18Cr-10Ni-Ti steel after post-irradiation annealing; ◆—A2 material after neutron irradiation; ◇—A1 material after post-irradiation annealing.
Metals 14 00099 g010
Figure 11. The dependences of microhardness on the indentation depth, h, for samples from A1 material after ion irradiation at different temperatures T irr i and target doses Di: ○—irradiation without implantation of He; Metals 14 00099 i001
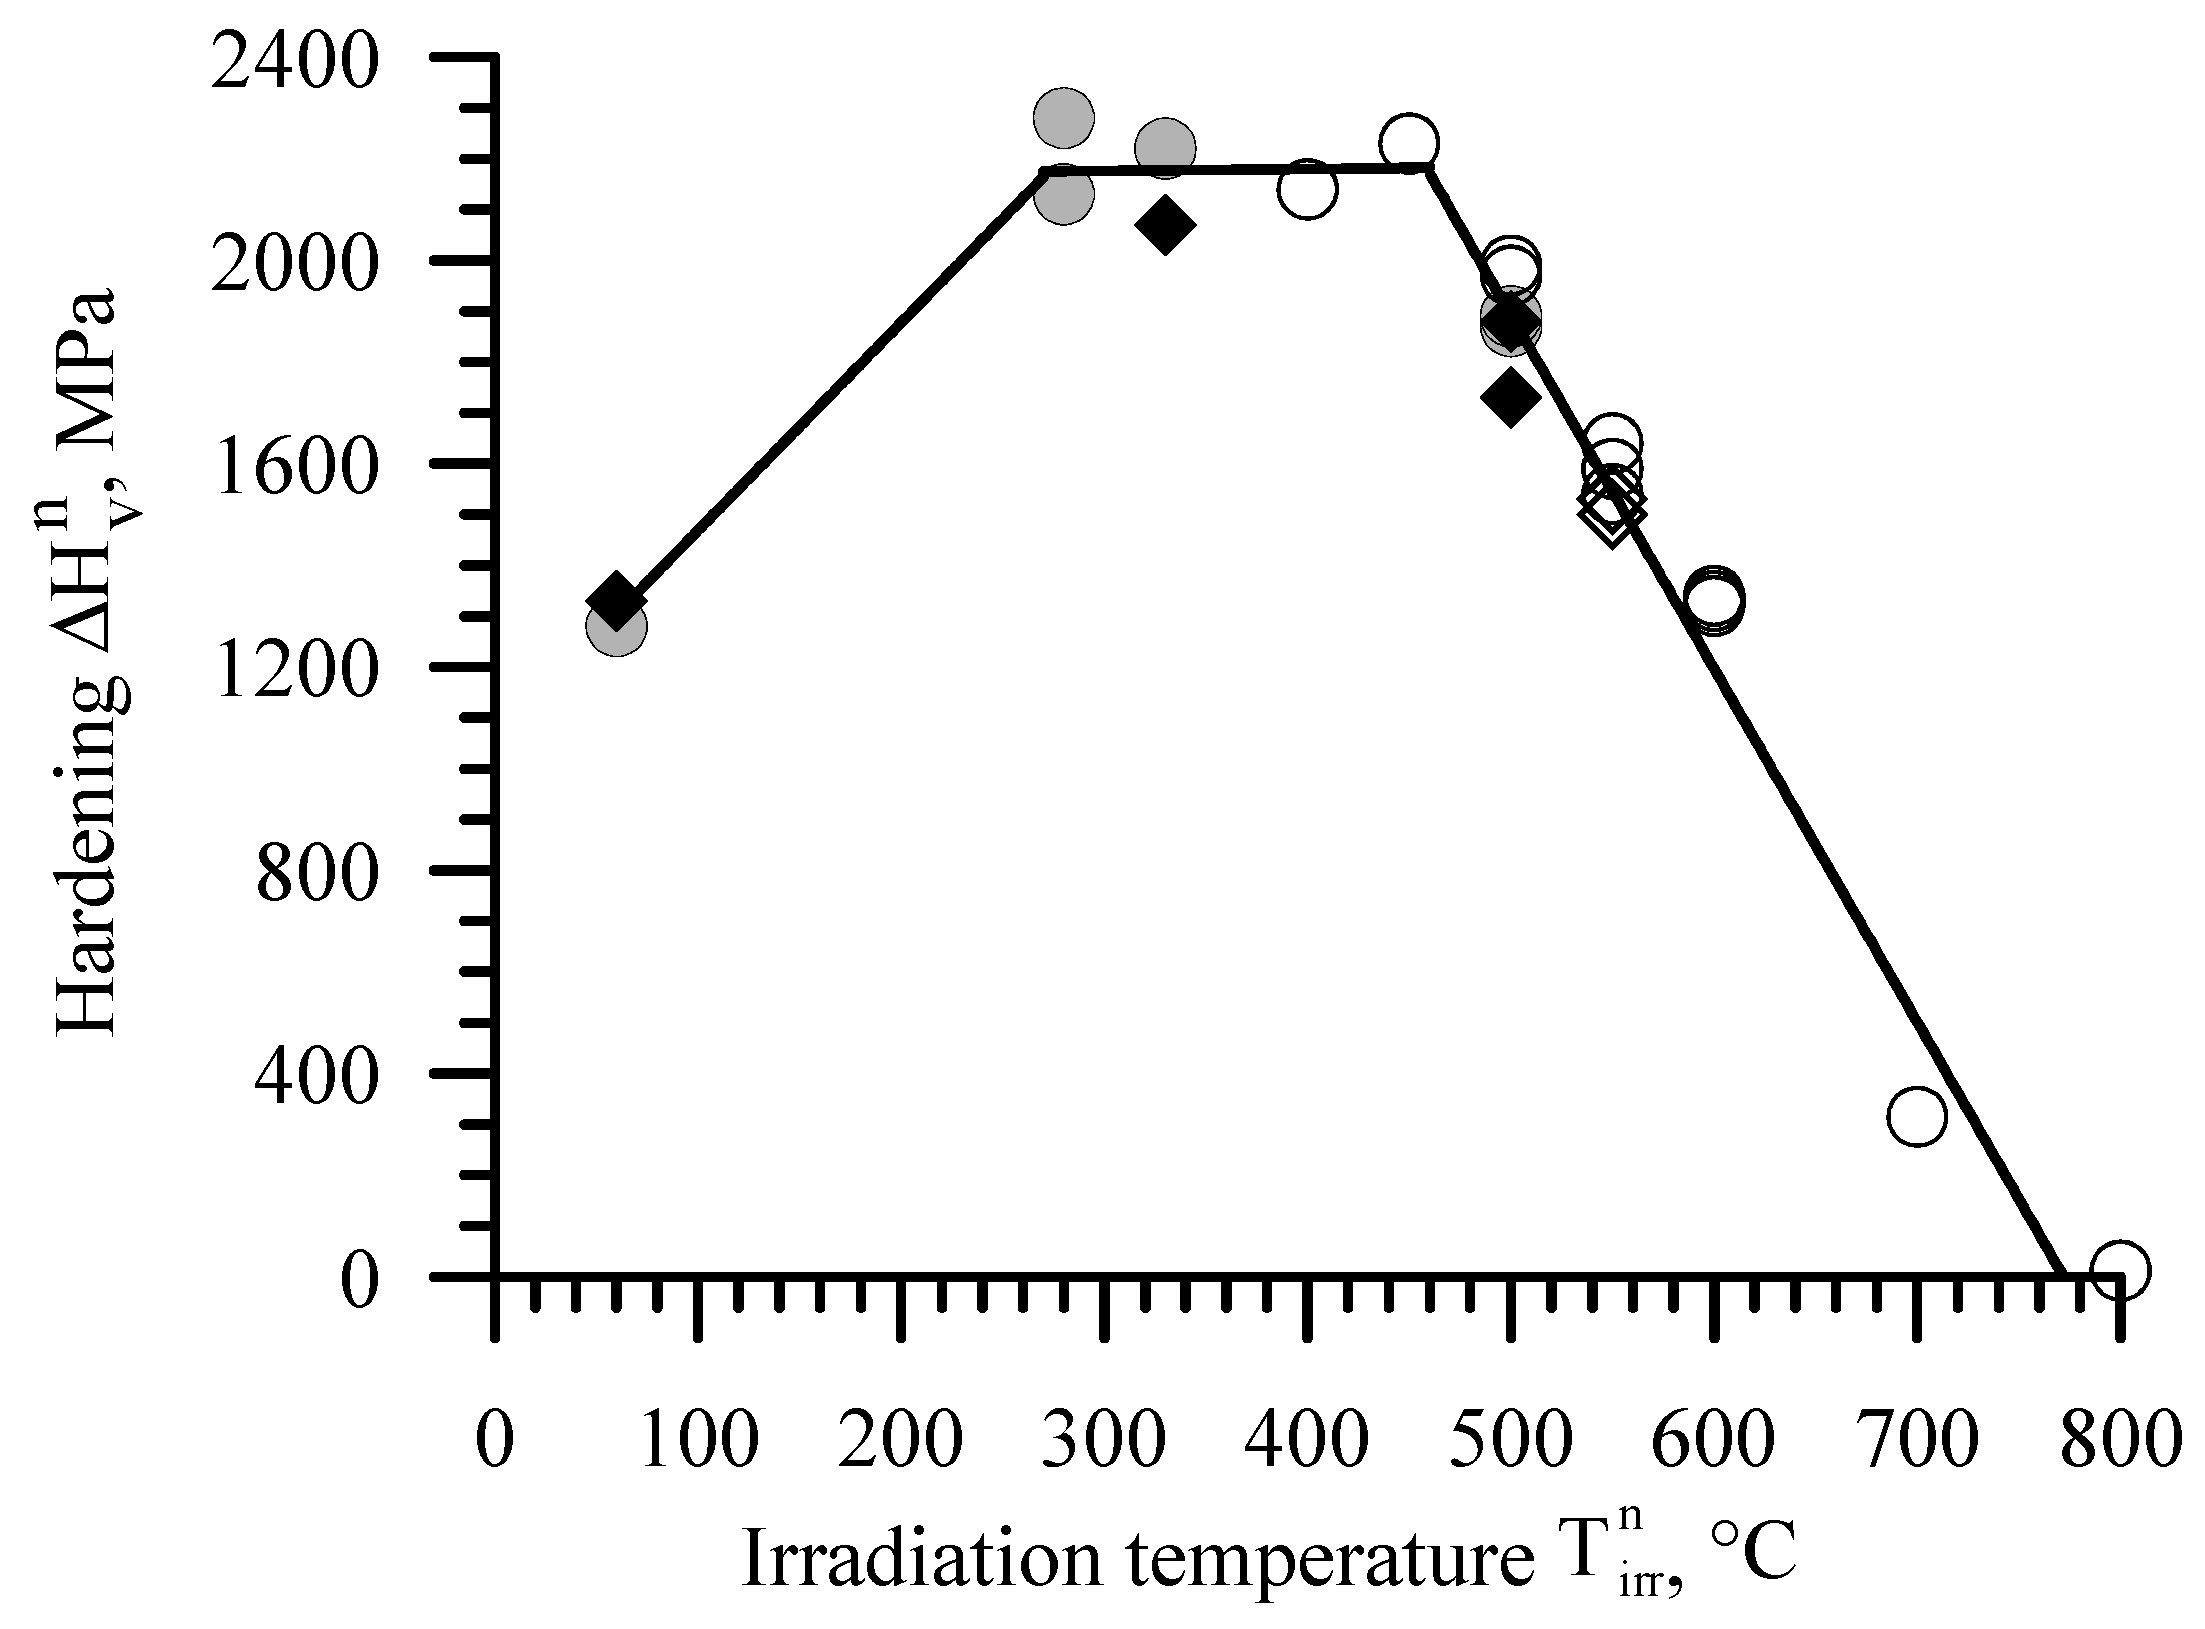
—irradiation with implantation of He to η = 7 appm/dpa. (a) Di = 13 dpa, T irr i  = 300 °C; (b) Di = 30 dpa, T irr i  = 300 °C; (c) Di = 13 dpa, T irr i  = 500 °C; (d) Di = 30 dpa, T irr i  = 500 °C; (e) Di = 13 dpa, T irr i  = 650 °C; (f) Di = 30 dpa, T irr i  = 650 °C.
Metals 14 00099 g011
Figure 12. The dependences of microhardness on the indentation depth, h, for samples from A2 material after ion irradiation at different temperatures T irr i and target doses Di without implantation of He. (a) Di = 13 dpa, T irr i  = 400 °C; (b) Di = 30 dpa, T irr i  = 400 °C; (c) Di = 13 dpa, T irr i  = 500 °C; (d) Di = 30 dpa, T irr i  = 500 °C.
Metals 14 00099 g012
Figure 13. The dependencies of radiation hardening Δ H v i on the temperature of ion irradiation T irr i for samples of A1 (a) and A2 (b) materials: ○—Di = 13 dpa, without He implantation; Metals 14 00099 i001
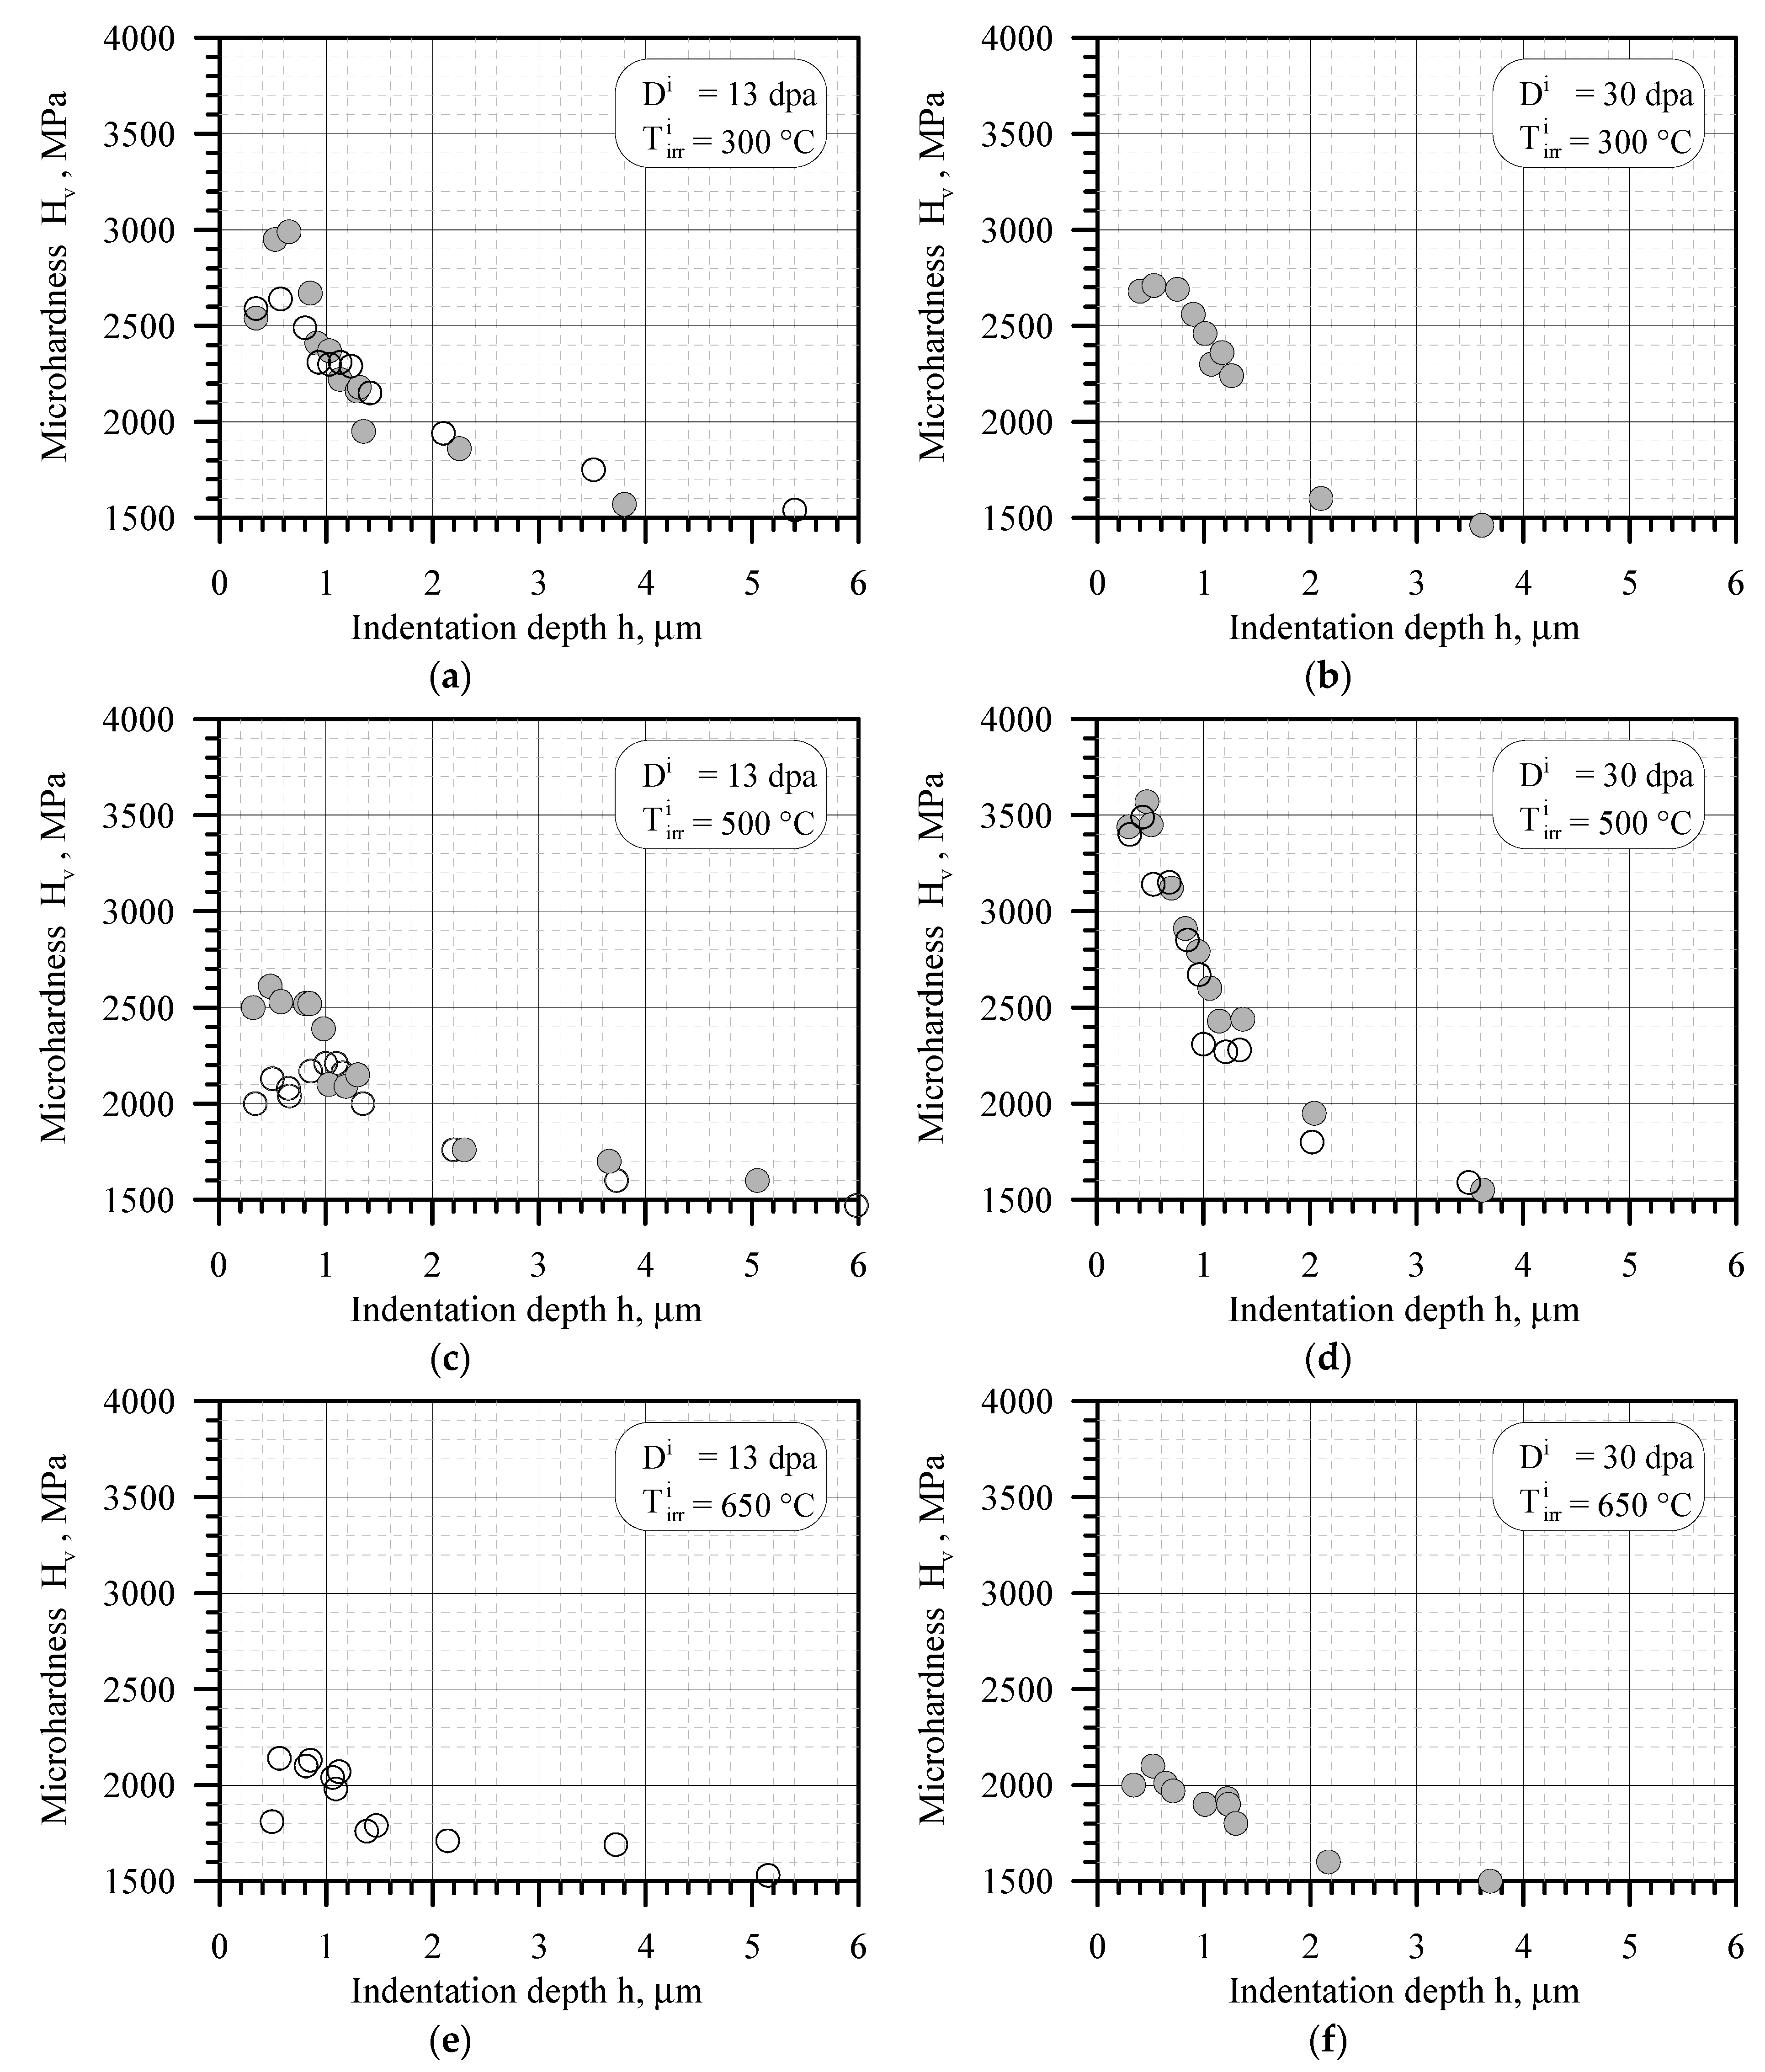
—Di = 13 dpa with He implantation to η = 7 appm/dpa; ◇—Di = 30 dpa, without He implantation; Metals 14 00099 i002—Di = 30 dpa with He implantation to η = 7 appm/dpa.
Metals 14 00099 g013
Figure 14. The dependences Δ H v ( T irr ) for F1 material after neutron and ion irradiation: ●—neutron irradiation up to Dn = 10–14 dpa; ▼—ion irradiation up to Di = 13 dpa with implantation of He to η = 0.2 appm/dpa; curves—approximation by Dependence (11).
Metals 14 00099 g014
Figure 15. The dependences Δ H v ( T irr ) for F2 material after neutron and ion irradiation: ●—neutron irradiation up to Dn = 14–33 dpa; ○—neutron irradiation up to Di =11 dpa [50]; ▼—ion irradiation up to Di = 30 dpa with implantation of He to η = 0.2 appm/dpa; ▽—ion irradiation up to Di = 30 dpa with implantation of He to η = 4 appm/dpa; ◇—ion irradiation up to Di = 14 dpa with implantation of He to η = 0.2 appm/dpa; curves—approximation by Dependence (11).
Metals 14 00099 g015
Figure 16. The transferability function δ T irr i n = φ( T irr n ) for F2 material: ○—the results of the joint solution of Equations (14) and (15); the curve is the Dependence (16).
Metals 14 00099 g016
Figure 17. The dependences Δ H v ( T irr ) for F2 material after neutron and ion irradiation without implantation of He: ●—neutron irradiation to Dn = 14–33 dpa; ○—neutron irradiation to Dn = 11 dpa [50]; ▲—ion irradiation to Di = 30 dpa without implantation of He; curve—approximation by Equation (11).
Metals 14 00099 g017
Figure 18. Comparison of the dependences of radiation hardening Δ H v n (○) and Δ H v i (Metals 14 00099 i001
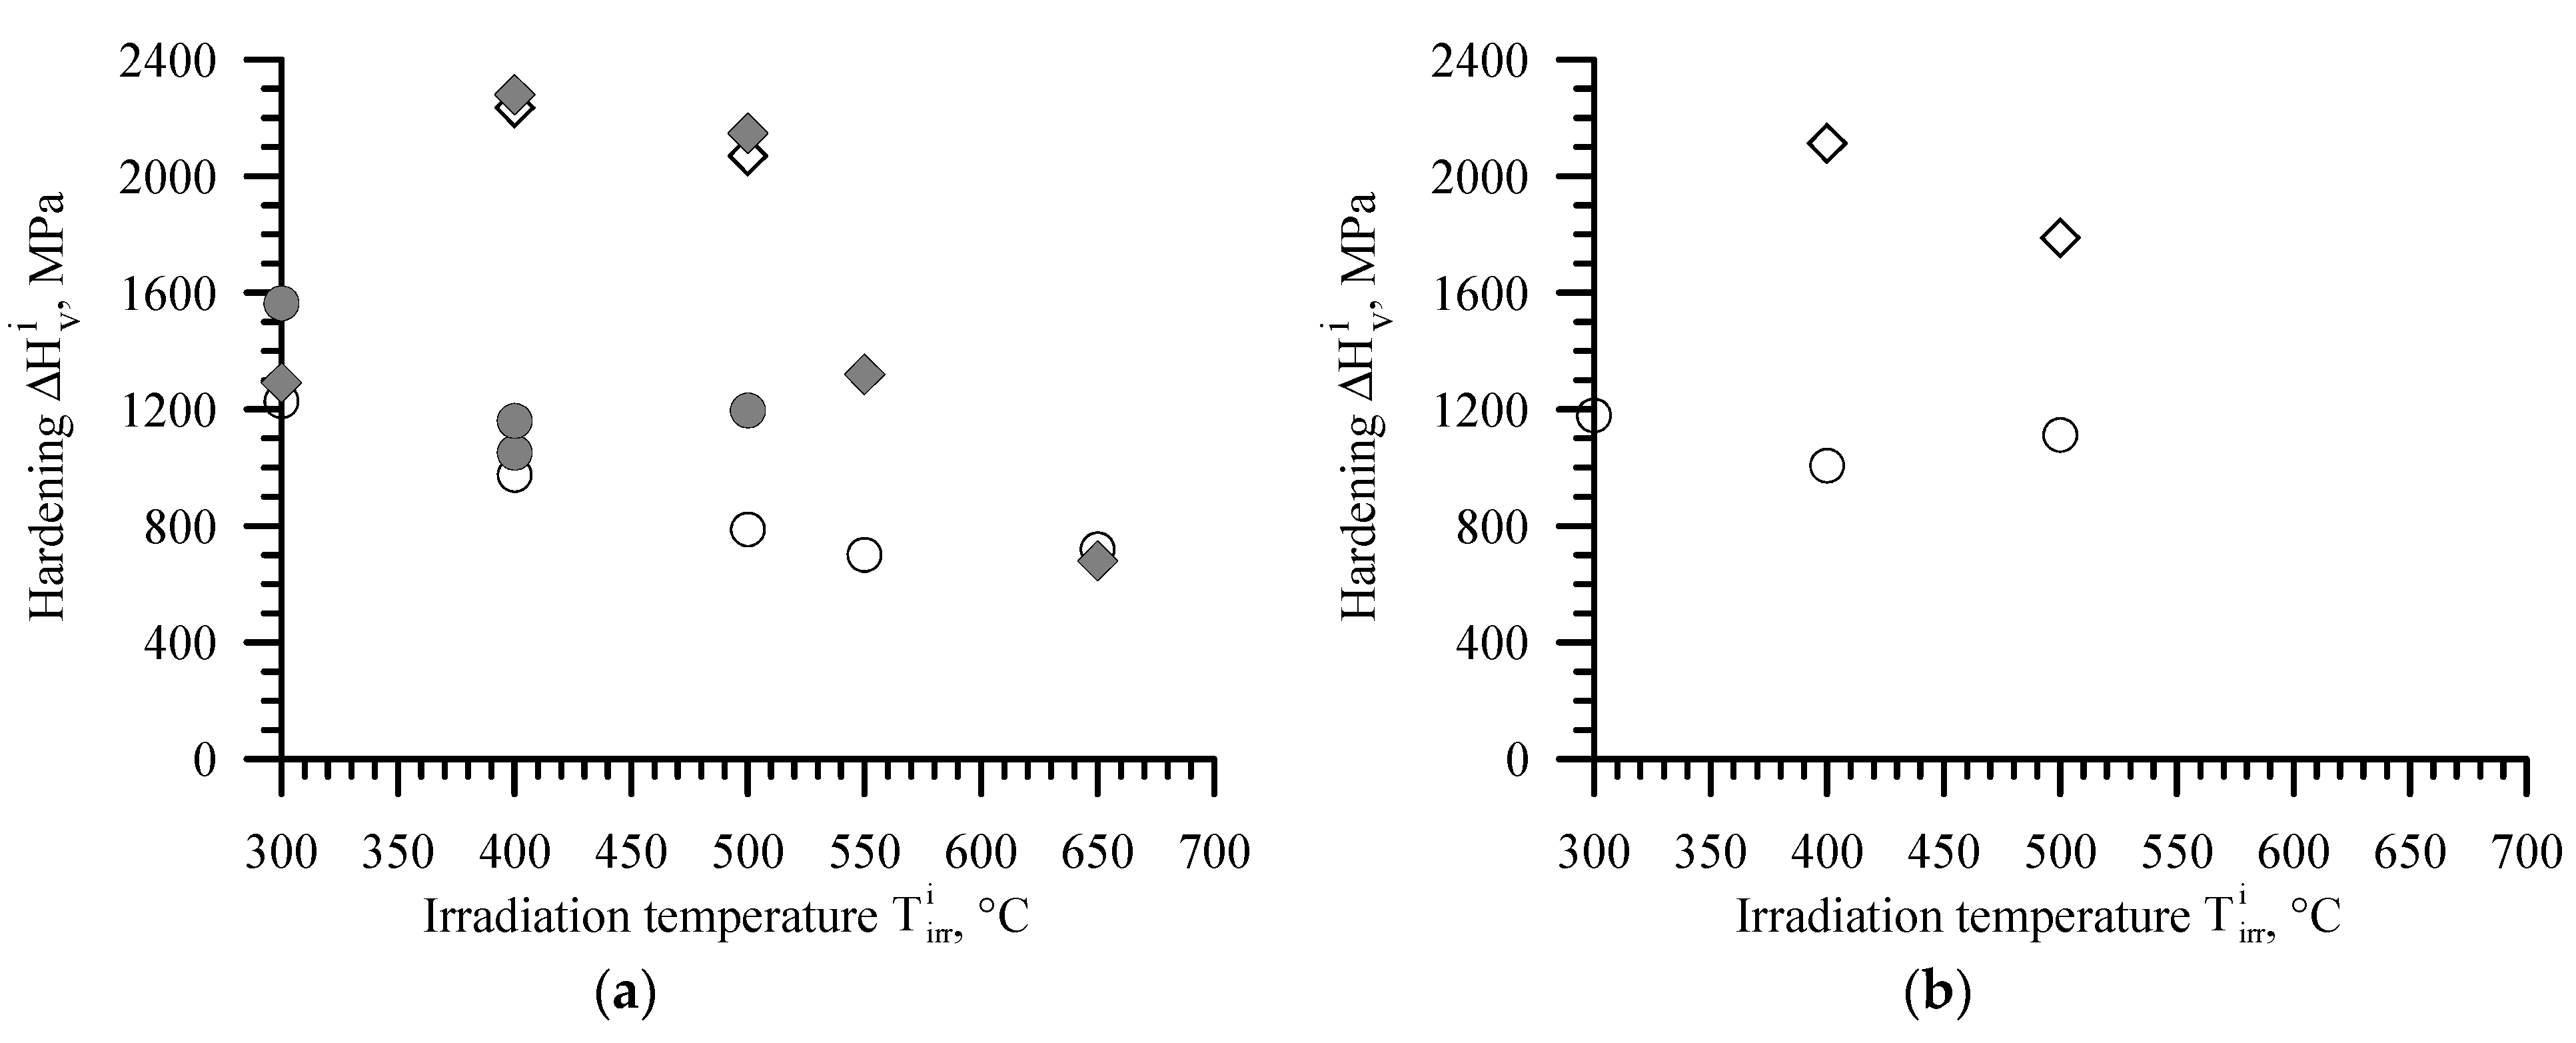
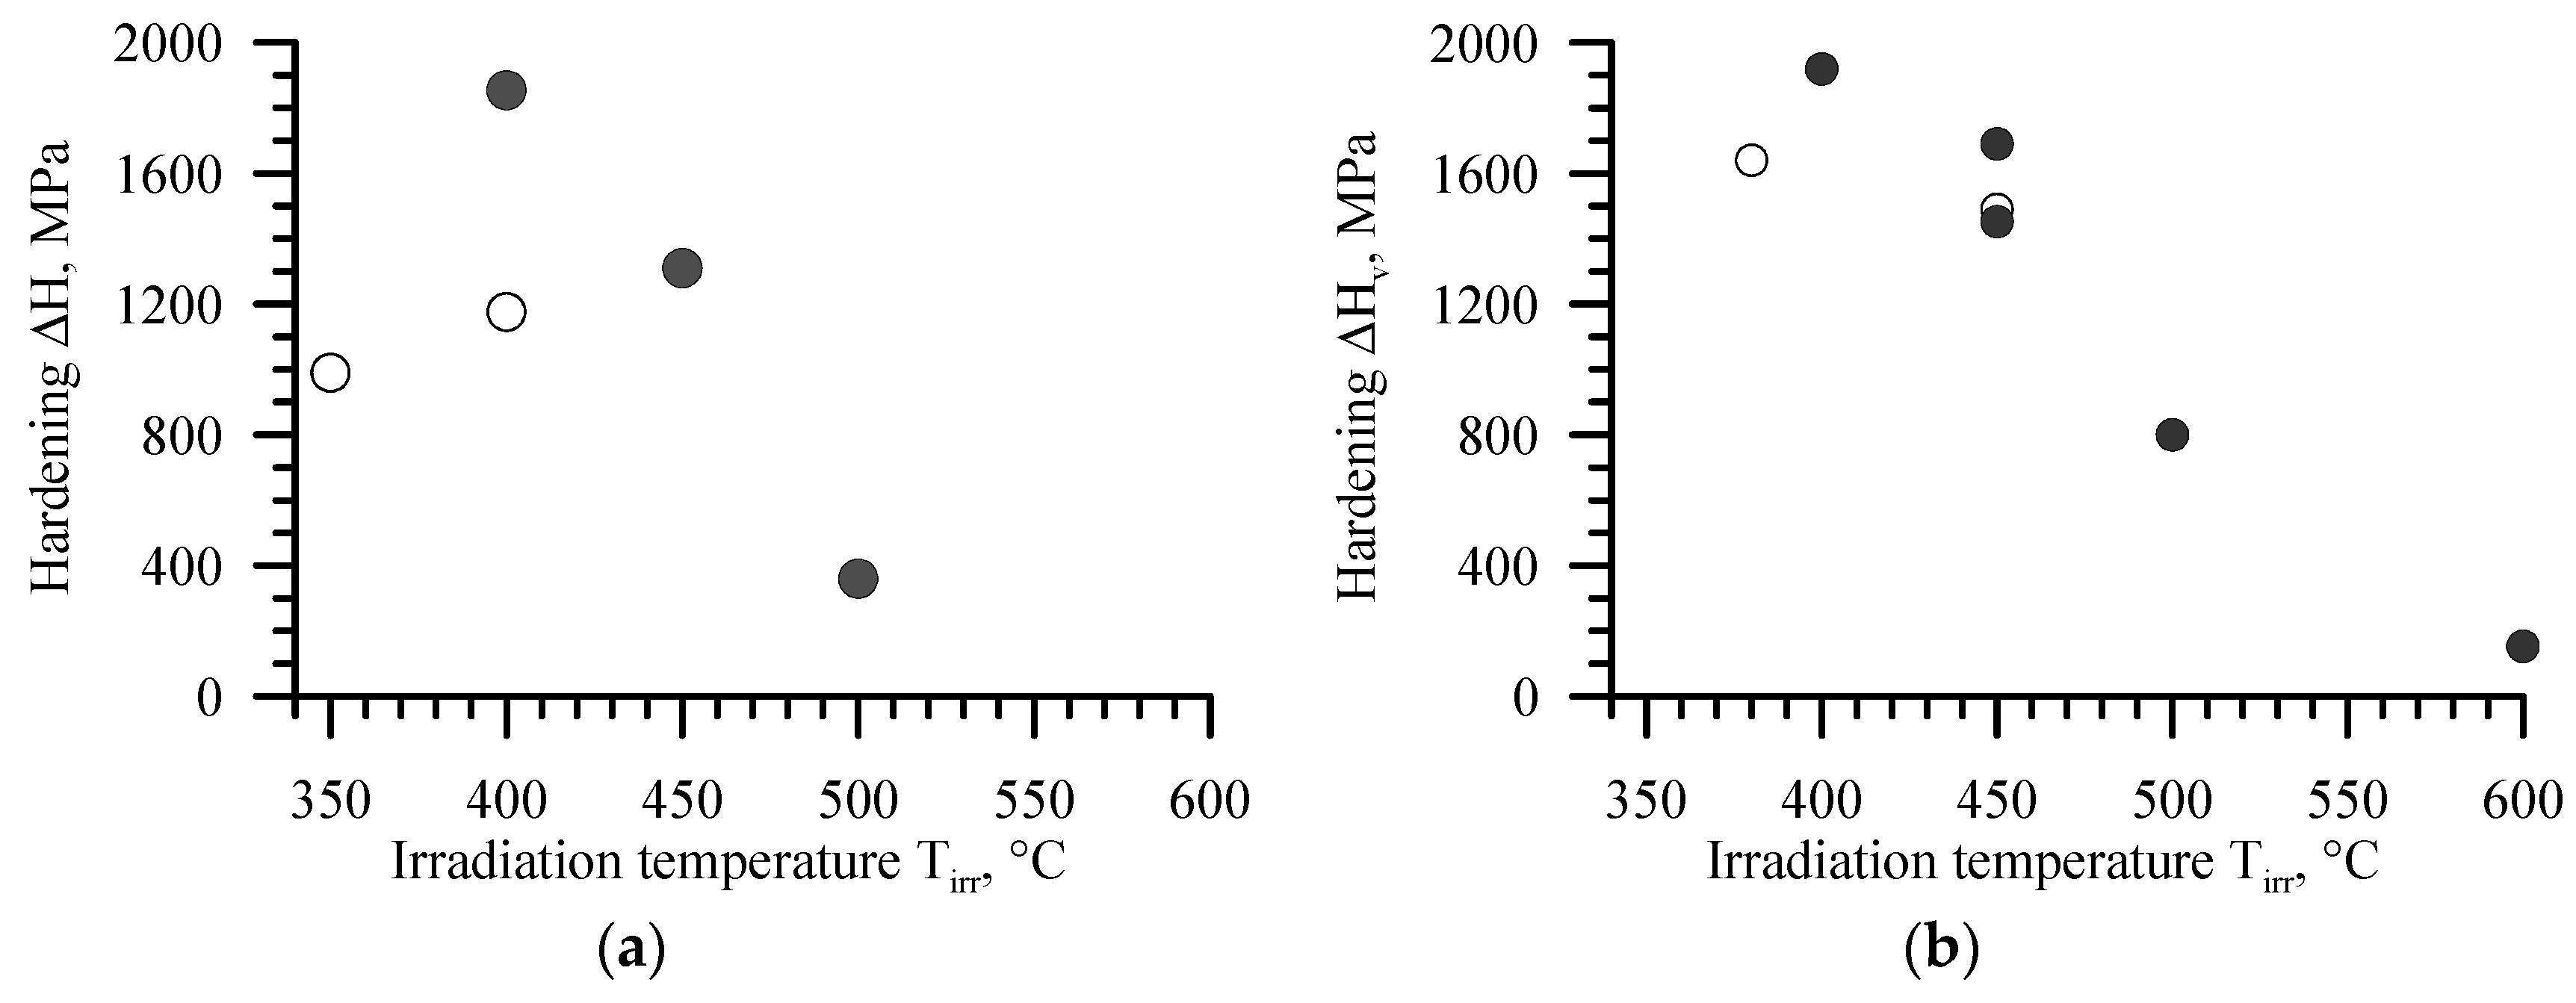
) on the irradiation temperature for A1 material and HC-18Cr-10Ni-Ti steel (a) and for A2 material (b) for the irradiation conditions when saturation of radiation hardening is achieved; point with arrow demonstrates similar trends between materials A1 and A2, corresponding to 13 dpa of ion irradiation. Realistic hardening for point with arrow is higher than measured value.
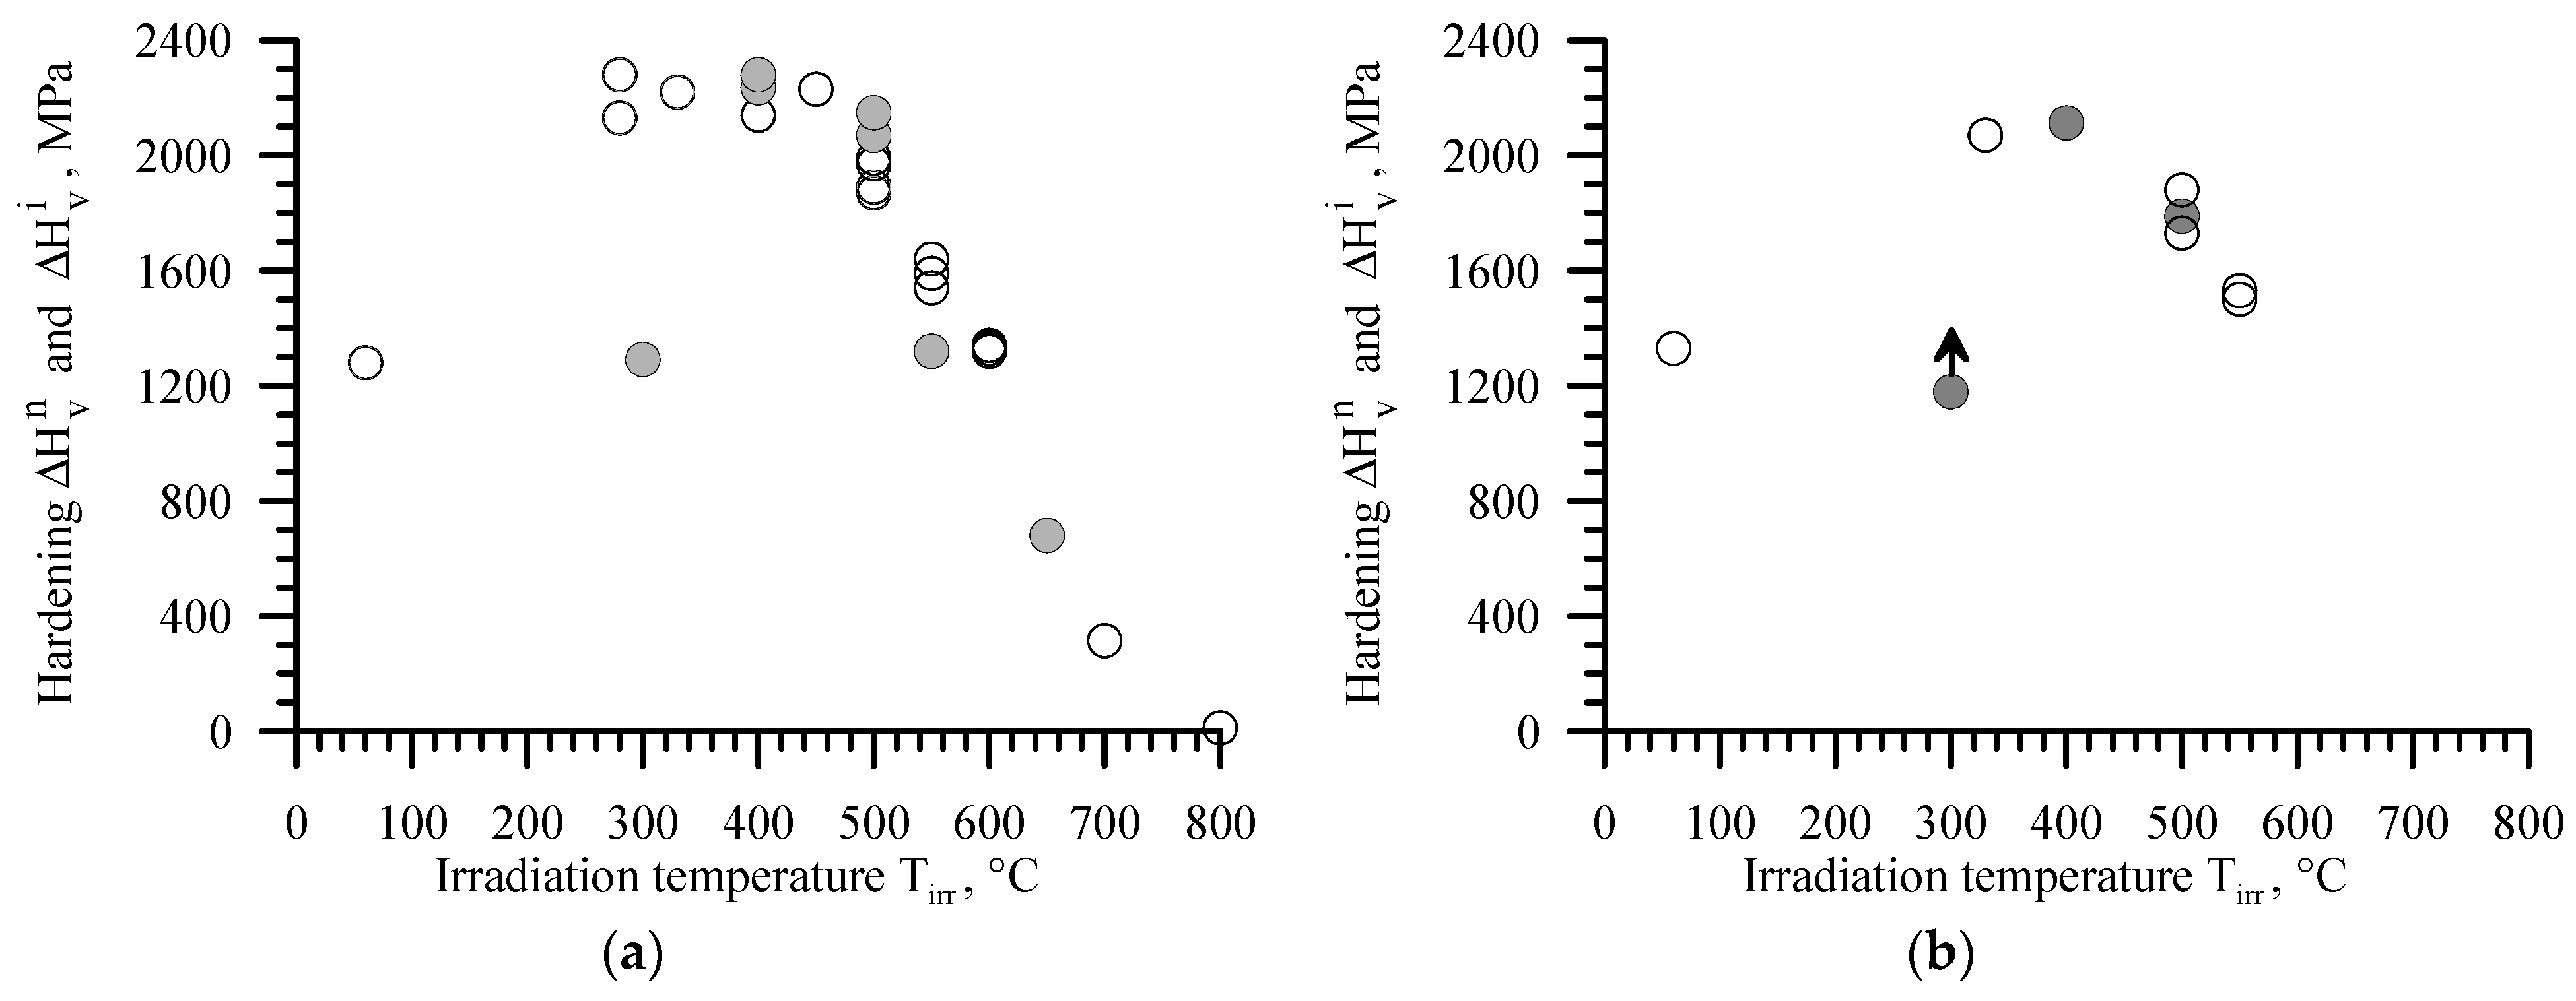
Metals 14 00099 g018
Figure 19. The transferability function φ( T irr n ) for austenitic steels provided the fulfillment of Condition (3).
Metals 14 00099 g019
Table 1. Chemical composition of 12Cr-Ni-Mo-V-Nb steel (material F1) and EP-823 steel (material F2) according to the technical specifications.
MaterialMass Fraction of Chemical Elements, %
CSiMnCrNiMoSP
F10.080.290.7012.11.060.940.0030.013
F20.161.180.6510.70.620.760.0020.015
NbVWTiAlBN
F10.110.20--0.0290.030.059
F20.330.330.540.010.020.0030.04
Table 2. The actual chemical composition of 18Cr-10Ni-Ti steel (material A1) and 16Cr-20Ni-2.5Mo-Ti steel (material A2).
MaterialMass Fraction of Chemical Elements, %
CSiMnSPCrNiCoMo
A10.0710.521.710.0020.02817.510.20.0210.01
A20.0650.481.650.0040.02615.320.20.0272.59
TiAlWVNbCuNOH
A10.530.110-0.025-0.0180.00590.00120.00050
A20.630.146---0.0400.00810.00420.00041
Table 3. Condition of neutron irradiation for F1 and F2 materials.
Material Irradiation   Temperature   T i r r n , °CDamage Dose,
Dn, dpa
F139010.3
39011.6
450 *11.6
500 *11.6
55014.6
F238014
39022
41033
42533
58022
*—irradiation temperature modeled by annealing.
Table 4. Conditions of neutron irradiation and post-irradiation annealing for A1 and A2 materials.
MaterialReactor Irradiation   Temperature   T i r r n , °CDamage Dose,
Dn, dpa
A1SM-36010.2
WWER-44028015.7
WWER-44028033.7
WWER-440400 (280) **33.7
WWER-440450 (280) **33.7
WWER-440500 (280) **33.7
WWER-440550 (280) **33.7
WWER-440600 (280) **33.7
BOR-6033010.8
BOR-60500 (330) **10.8
BOR-6050029.0
BOR-60550 (500) **29.0
BOR-60600 (500) **29.0
SM-3 + BOR-60 *50011.3
SM-3 + BOR-60 *550 (500) **11.3
A2SM-36012.1
BOR-6033010.8
BOR-6050029.0
BOR-60550 (500) **29.0
SM-3 + BOR-60 *50011.3
SM-3 + BOR-60 *550 (500) **11.3
* two-stage irradiation was carried out: the first-stage irradiation was carried out in the side reflector of SM-3 at T irr n ≈ 320 °C up to Dn ≈ 3 dpa; in the second stage, additional irradiation was carried out in a BOR-60 reactor under the conditions indicated in the table. ** specimens were subjected to post-irradiated annealing: irradiation temperature is given in brackets and annealing temperature—without brackets.
Table 5. The ion irradiation conditions for samples from F1 and F2 materials.
MaterialIdentification
Sample Marking
Irradiation   Temperature ,   T i r r i ,   ° C Damage Dose,
Di, dpa
Specific He Concentration,
η, appm/dpa
F1X55350130.2
X56400130.2
X57450130.2
X58500130.2
X59550130.2
X60600130.2
F2P30350150
P31380140.2
P62400150
P59450140.2
P29400300
P49400300.2
P21400304.0
P28450300
P27450304.0
P60450300.2
P61500300
P22500300.2
P26500304.0
P18600300.2
Table 6. The ion irradiation conditions for A1 and A2 materials.
MaterialIrradiation Condition
The Specific He Concentration,
η, appm/dpa
The Target Damage Dose Di *, dpa Irradiation   Temperature   T i r r i , °C
A1013300, 400, 500, 550, 650
030400, 500
713300, 400, 500
730300, 400, 500, 550, 650
A2013300, 400, 500
030400, 500
*—Di is the damage dose for a depth of 1.4 microns.
Table 7. Neutron irradiation parameters, microhardness in the initial H v 0 and irradiated H v n states and radiation hardening Δ H v n for F1 material.
Irradiation   Temperature   T i r r n ,   ° C Damage Dose Dn, dpa H v n ,   MPa H v 0 ,   MPa Δ H v n ,   MPa
39010.3365023701280
39011.6378023701410
450 *11.6343023701060
500 *11.625302370160
55014.62380237010
*—the irradiation temperature has been modeled by annealing of metal irradiated at 390 °C up to 11.6 dpa at the specified temperature over 10 h.
Table 8. Neutron irradiation parameters, microhardness in the initial H v 0 and irradiated H v n states and radiation hardening Δ H v n for F2 material.
Irradiation   Temperature   T i r r n , °CDamage Dose Dn, dpa H v n , MPa H v 0 , MPa Δ H v n , MPa
38014422024001820
39022412024001720
41033405024001650
42533393024001530
495 *11 *--490 *
5802226962400296
*—the data from paper [50] recalculated using the Dependence (9).
Table 9. Ion irradiation parameters, microhardness in the initial H v 0 and irradiated H v i state and radiation hardening Δ H v i for F1 material.
SampleIrradiation Parameters Indentation   Depth   h   for   H v i , µmMicrohardness Radiation   Hardening Δ H v i ,
MPa
T i r r i , °CDi,
dpa
η, appm/dpa Irradiated   Region H v i ,
MPa
Unirradiated   Region   H v 0 ,
MPa
X55350130.20.57374023501390
X56400130.20.51370023501350
X57450130.20.78355023501200
X58500130.20.5627002350350
X59550130.20.8025072270237
X60600130.20.802240220040
Table 10. Ion irradiation parameters, microhardness in the initial H v 0 and irradiated H v i state and radiation hardening Δ H v i for F2 material.
SampleIrradiation Parameters Indentation   Depth   h   for   H v i ,
µm
Microhardness Radiation   Hardening Δ H v i ,
MPa
T i r r i , °CDi,
dpa
η, appm/dpa Irradiated   Region H v i ,
MPa
Unirradiated   Region   H v 0 ,
MPa
P303501500.3433502360990
P31380140.20.37400023601640
P624001500.70327621001176
P59450140.20.47384323601483
P294003000.43421423601854
P49400300.20.65401921001919
P21400304.00.33427823601918
P284503000.47367023601310
P27450304.00.54405023601690
P60450300.20.60355221001452
P615003000.6024602100360
P22500300.20.6429662166866
P26500304.00.4729532360607
P18600300.20.6022532100153
Table 11. Neutron irradiation parameters, microhardness in the initial H v 0 and irradiated H v n states and the radiation hardening Δ H v n for A1 and A2 materials.
MaterialsReactor T i r r n , °CD,
dpa
H v n ,
MPa
H v 0 ,
MPa
Δ H v n ,
MPa
A1SM-36010.2270014201280
WWER-44028015.7370014202280
WWER-44028033.7355014202130
WWER-440400 (280)33.7354014202120
WWER-440450 (280)33.7365014202230
WWER-440500 (280)33.7341014201990
WWER-440550 (280)33.7306014201640
WWER-440600 (280)33.7274014201320
BOR-6033010.8364014202220
BOR-60500 (330)10.8339014201970
BOR-6050029.0329014201870
BOR-60550 (500)29.0294014201520
BOR-60600 (500)29.0276014201340
SM-3 +
BOR-60
50011.3331014201890
SM-3 +
BOR-60
550 (500)11.3301014201590
A2SM-36012.1278014501330
BOR-6033010.8352014502070
BOR-6050029.0333014501880
BOR-60550 (500)29.0295014501500
SM-3 +
BOR-60
50011.3318014501730
SM-3 +
BOR-60
550 (500)11.3298014501530
Table 12. Radiation hardening in terms of ΔσY and Δ H v n for HC-18Cr-10Ni-Ti steel after neutron irradiation at T irr n = 330–360 °C up to D = 130–145 dpa and post-irradiation annealing [62].
Temperature of Post-Irradiation Annealing, °CΔσY, MPa Δ H v n , MPa
6004391330
700104315
800412
Table 13. Ion irradiation parameters, microhardness in the irradiated condition H v i and radiation hardening Δ H v i for A1 material.
SampleIrradiation Parameters Indentation   Depth   h   for   H v i ,   µ m Microhardness   after   Ion   Irradiation H v i ,   MPa Radiation   Hardening   Δ H v i ,   MPa
T i r r i ,   ° C Di,
dpa
η, appm/dpa
S383001300.5226481228
S394001300.442395975
S184003000.4536852265
S405001300.982208788
S195003000.4434902070
S415501300.842121701
S426501300.572140720
S353001370.6529841564
S233003070.5127111291
S364001370.7024711051
S434001370.5725801160
S204003070.4037002280
S375001370.4726161196
S215003070.4735682148
S445503070.4327401320
S226503070.512100680
Table 14. Ion irradiation parameters, microhardness in the irradiated condition H v i and radiation hardening Δ H v i for A2 material.
SampleIrradiation Parameters Indentation   Depth   h   for   H v i ,   µ m Microhardness   after   Ion   Irradiation H v i ,   MPa Radiation   Hardening   Δ H v i ,   MPa
T i r r i ,   ° C Di,
dpa
η, appm/dpa
2.953001300.5826291179
2.964001300.5824571007
2.985001300.5825621112
2.934003000.4635632113
2.945003000.6532391789
Disclaimer/Publisher’s Note: The statements, opinions and data contained in all publications are solely those of the individual author(s) and contributor(s) and not of MDPI and/or the editor(s). MDPI and/or the editor(s) disclaim responsibility for any injury to people or property resulting from any ideas, methods, instructions or products referred to in the content.

