Article

The Effects of Strain Rate and Anisotropy on the Formability and Mechanical Behaviour of Aluminium Alloy 2024-T3

1
Faculty of Mechanical Engineering, Brno University of Technology, Technická 2896/2, 616 69 Brno, Czech Republic
2
MST-DyMaLab, Department of Electromechanical, Systems and Metal Engineering, Ghent University, Technologiepark 46, 9052 Zwijnaarde, Belgium
*
Authors to whom correspondence should be addressed.
Metals 2024, 14(1), 98; https://doi.org/10.3390/met14010098
Submission received: 2 December 2023 / Revised: 9 January 2024 / Accepted: 11 January 2024 / Published: 13 January 2024
(This article belongs to the Topic Alloys and Composites Corrosion and Mechanical Properties)

Abstract

:
The present study focuses on the mechanical behaviour and formability of the aluminium alloy 2024-T3 in sheet form with a thickness of 0.8 mm. For this purpose, tensile tests at quasi-static and intermediate strain rates were performed using a universal testing machine, and high strain rate experiments were performed using a split Hopkinson tension bar (SHTB) facility. The material’s anisotropy was investigated by considering seven different specimen orientations relative to the rolling direction. Digital image correlation (DIC) was used to measure specimen deformation. Based on the true stress–strain curves, the alloy exhibited negative strain rate sensitivity (NSRS). Dynamic strain aging (DSA) was investigated as a possible cause. However, neither the strain distribution nor the stress–strain curves gave further indications of the occurrence of DSA. A higher deformation capacity was observed in the high strain rate experiments. The alloy displayed anisotropic mechanical properties. Values of the Lankford coefficient lower than 1, more specifically, varying between 0.45 and 0.87 depending on specimen orientations and strain rate, were found. The hardening exponent was not significantly dependent on specimen orientation and only moderately affected by strain rate. An average value of 0.183 was observed for specimens tested at a quasi-static strain rate. Scanning electron microscopy (SEM) revealed a typical ductile fracture morphology with fine dimples. Dimple sizes were hardly affected by specimen orientation and strain rate.

1. Introduction

Aluminium is one of the most frequently used metals. However, its application in pure form is limited because of its low strength. By adding alloying elements such as copper, magnesium, or manganese, aluminium alloys with high strength-to-weight ratios can be obtained. Additionally, several heat treatments can be imposed to achieve specific properties. The aluminium alloy 2024-T3 of the present study has been used in the automotive and aerospace industry thanks to its excellent resistance to fatigue crack propagation and its high damage tolerance. Aluminium 2024-T3 is primarily alloyed with copper and magnesium, which form Al2Cu and Al2CuMg phases responsible for its hardening. The presence of copper, however, has a negative effect on the corrosion resistance. The T3 condition refers to solution heat treatment, cold working, and natural aging [1,2,3,4].
During manufacturing, processing, and use, materials are subjected to various loading conditions and a wide range of strain rates and temperatures, which affect their properties. Moreover, the materials’ behaviour can also be anisotropic, which can have major implications for forming operations. The strain rate and directional dependence of the mechanical behaviour of aluminium alloy 2024-T3 have been studied by several authors. Li et al. [5] analysed the compressive behaviour of specimens machined from a plate at three different strain rates, i.e., 0.001, 10, and 3500 s−1. The alloy showed a low, though positive, strain rate sensitivity. This resulted in a 3% increase in engineering stress at an engineering strain of 0.05% and an 8% increase at a strain of 0.2% at the highest strain rate compared to the lowest quasi-static strain rate. For compression tests at strain rates ranging from 0.006 to 11,000 s−1 on specimens cut out of rods, on the other hand, a strain rate-insensitive response was observed by Abotula and Chalivendra [6]. Rodríguez-Martínez et al. [7] investigated the influence of strain rate and temperature by tensile tests. A reduced strain rate sensitivity was reported at room temperature for strain rates ranging from 0.001 to 200 s−1. A decreasing strain hardening was observed with increasing temperatures in the range from −50 to 200 °C. Shamchi et al. [8] studied the mechanical behaviour of 2 mm thick 2024-T3 plates cladded at both sides by pure aluminium with a thickness of 0.05 mm. Tension experiments were performed at strain rates ranging from 0.001 to 1150 s−1, at temperatures from 24 up to 250 °C for the dynamic and up to 350 °C for the quasi-static experiments. The temperature had a significant effect on the plastic flow: at temperatures higher than 300 °C, no more hardening was observed at quasi-static rates. Comparing the dynamic flow stress levels with the quasi-static values, an NSRS was observed at 24 °C. Additionally, the failure strain increased by 28%, moving from quasi-static to dynamic tension.
Low to negative strain rate sensitivity is characteristic of many aluminium alloys. It is often attributed to DSA and/or thermal softening. Next to an NSRS, DSA can also result in serrated flow, known as the Portevin–Le Chatelier effect, accompanied by a localisation of the deformation in bands which can be detected using full-field DIC deformation measurements [9,10]. Thermal softening might result from the adiabatic temperature rise at dynamic strain rates. Indeed, a major part of plastic work is converted into heat. At high strain rates, the heat is not dissipated to the environment and results in a temperature rise in the specimen. Shamchi et al. [8] used an infrared camera and observed a significant temperature rise within the experiment at the strain rate of 500 s−1. The lower flow stress at this strain rate is considered to be a result of thermal softening.
The anisotropy of aluminium 2024-T3 was studied by Barlat et al. [11], who tested specimens from a 0.3 mm thick sheet, which were machined in seven different orientations relative to the rolling direction (0°—rolling direction; 15°, 30°, 45°, 60°, 75°, and 90°—transverse direction). The results of tensile tests at a quasi-static strain rate clearly showed anisotropic properties. Lesuer [12] examined the alloy in the form of a 4 mm thick plate under compression at a strain rate of 4000 s−1 (specimen orientations: 0°, 90°, and through thickness) and tension at a strain rate of 8000 s−1 (specimen orientations: 0° and 90°). Only small deviations between true stress–strain curves for the different specimen orientations were observed, and it was concluded that the material was isotropic. Houria et al. [13] performed tensile tests at a strain rate of 0.0005 s−1 on specimens cut out along the 0°, 45°, and 90° directions of a 0.6 mm thick plate. The tests showed anisotropic properties. A mild anisotropy was also observed by Shamchi et al. [8], who considered two test orientations, 0° and 90°, at a strain rate of 0.001 s−1.
The above-mentioned investigations reveal inconsistencies in the influence of strain rate on the mechanical properties of aluminium alloy 2024-T3. Furthermore, there is a lack of studies focusing on the material’s anisotropy and formability indicators at different strain rates. Hence, in the present work, the alloy in sheet form with a thickness of 0.8 mm was subjected to tensile loading at quasi-static (0.001 s−1), intermediate (1 s−1), and high strain rates (≈800 s−1). The anisotropy at different strain rate regimes was examined using specimens cut out in seven different orientations relative to the rolling direction. The mechanical behaviour and formability were evaluated based on the true stress–strain curves, hardening exponents, and Lankford coefficients [14]. Moreover, the fracture behaviour was examined using scanning electron microscopy.

2. Materials and Methods

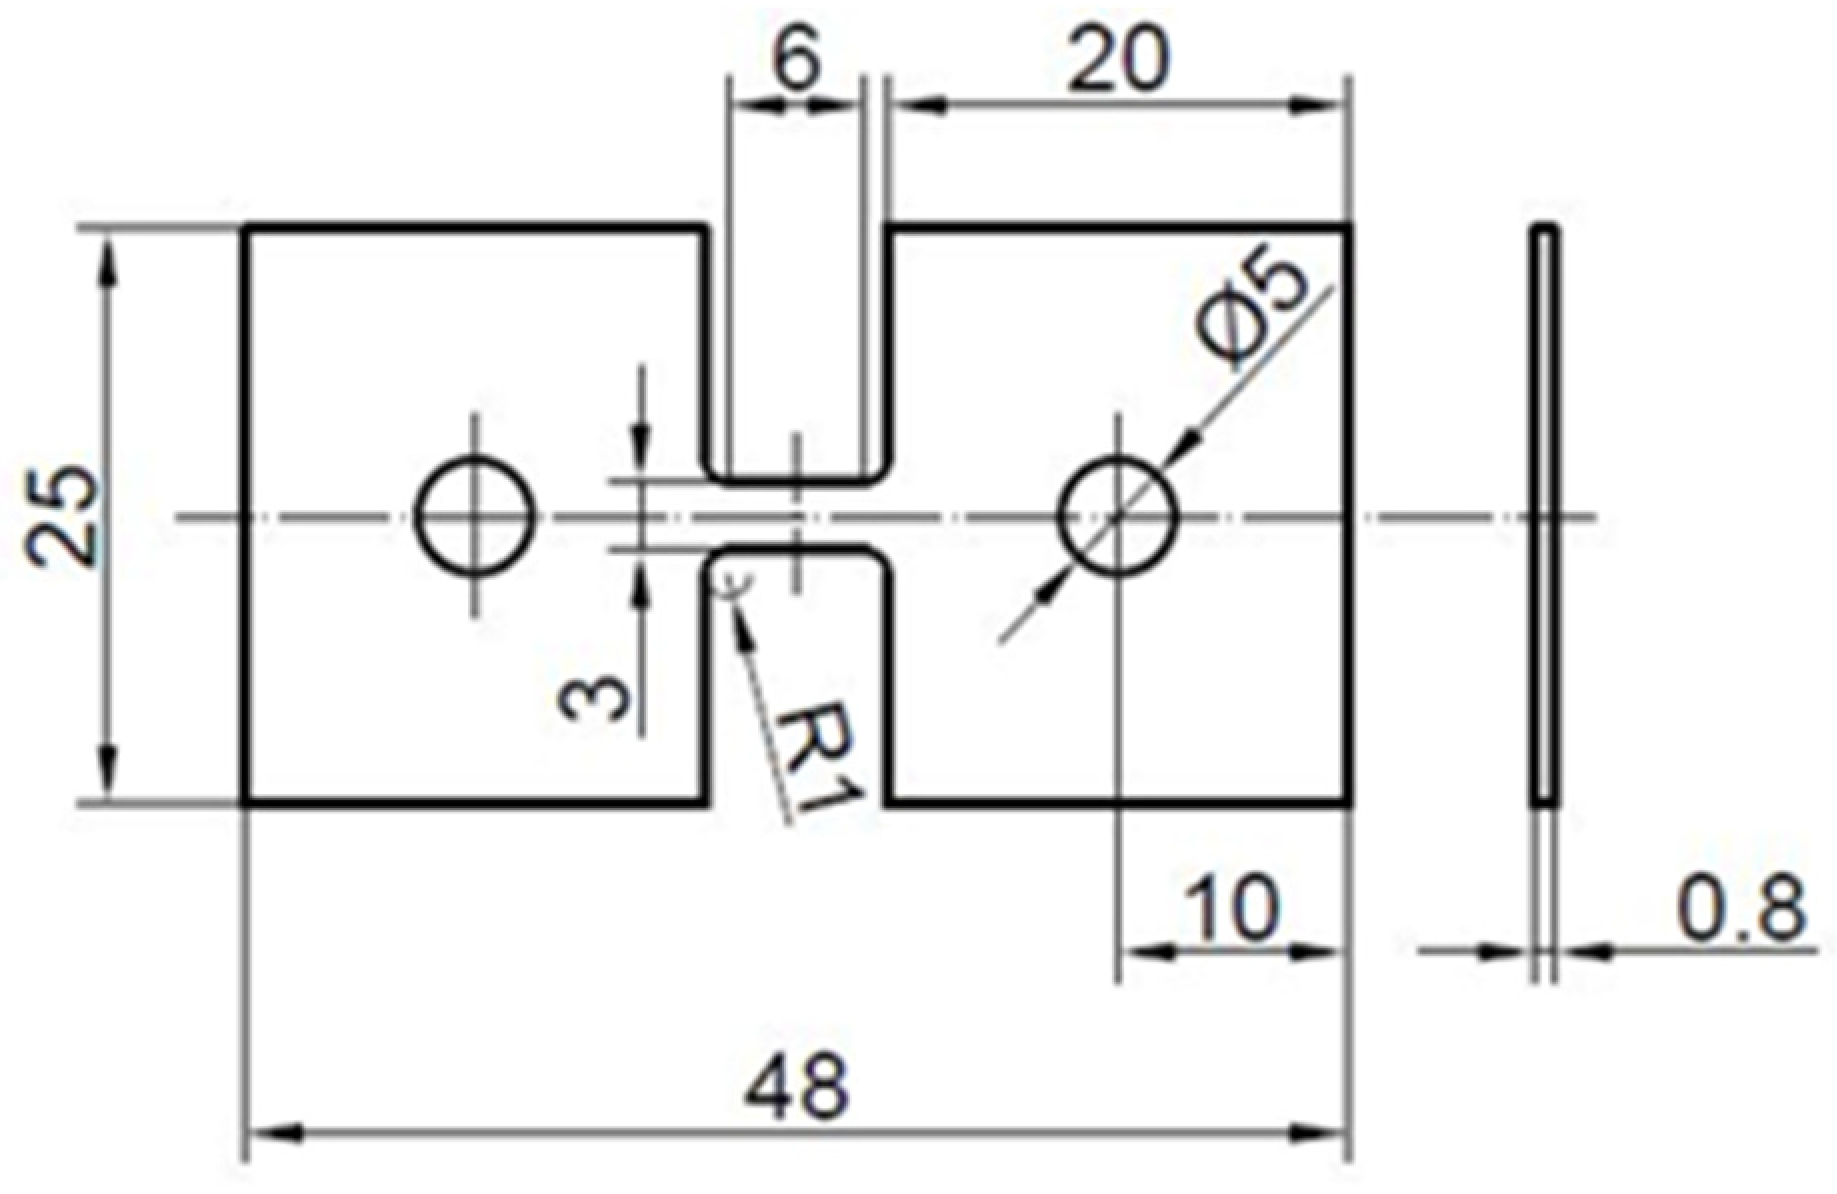
2.1. Material and Geometry of Specimen

The tensile specimens were cut using electrodischarge machining from a 0.8 mm thick aluminium alloy 2024-T3 sheet. The chemical composition of the material is provided in Table 1. Figure 1 depicts the microstructure of the alloy in the as-received state in the rolling plane observed by a Zeiss Axio Observer Z1m light microscope (Carl Zeiss AG, Oberkochen, Germany). The metallographic specimens were ground using emery papers and finely polished with 1 µm diamond paste. To reveal the microstructure, specimens were etched with Keller’s reagent (2.5 mL HNO3, 1.5 mL HCl, 1 mL HF, and 95 mL distilled water). The average grain size was measured using Stream Motion software version 2.4 (Olympus Corporation, Tokyo, Japan) with a built-in module for the “Grain Intercept method”. The measurement was performed according to ASTM E112 applying the cross-and-circles pattern [15].
To study material anisotropy, specimens were taken along 0°, 15°, 30°, 45°, 60°, 75°, and 90° relative to the rolling direction. The same specimen geometry with a pin connection presented in Figure 2 was used for all tests, regardless of the strain rate. In this way, the effects of both geometry and boundary conditions on the results was suppressed.

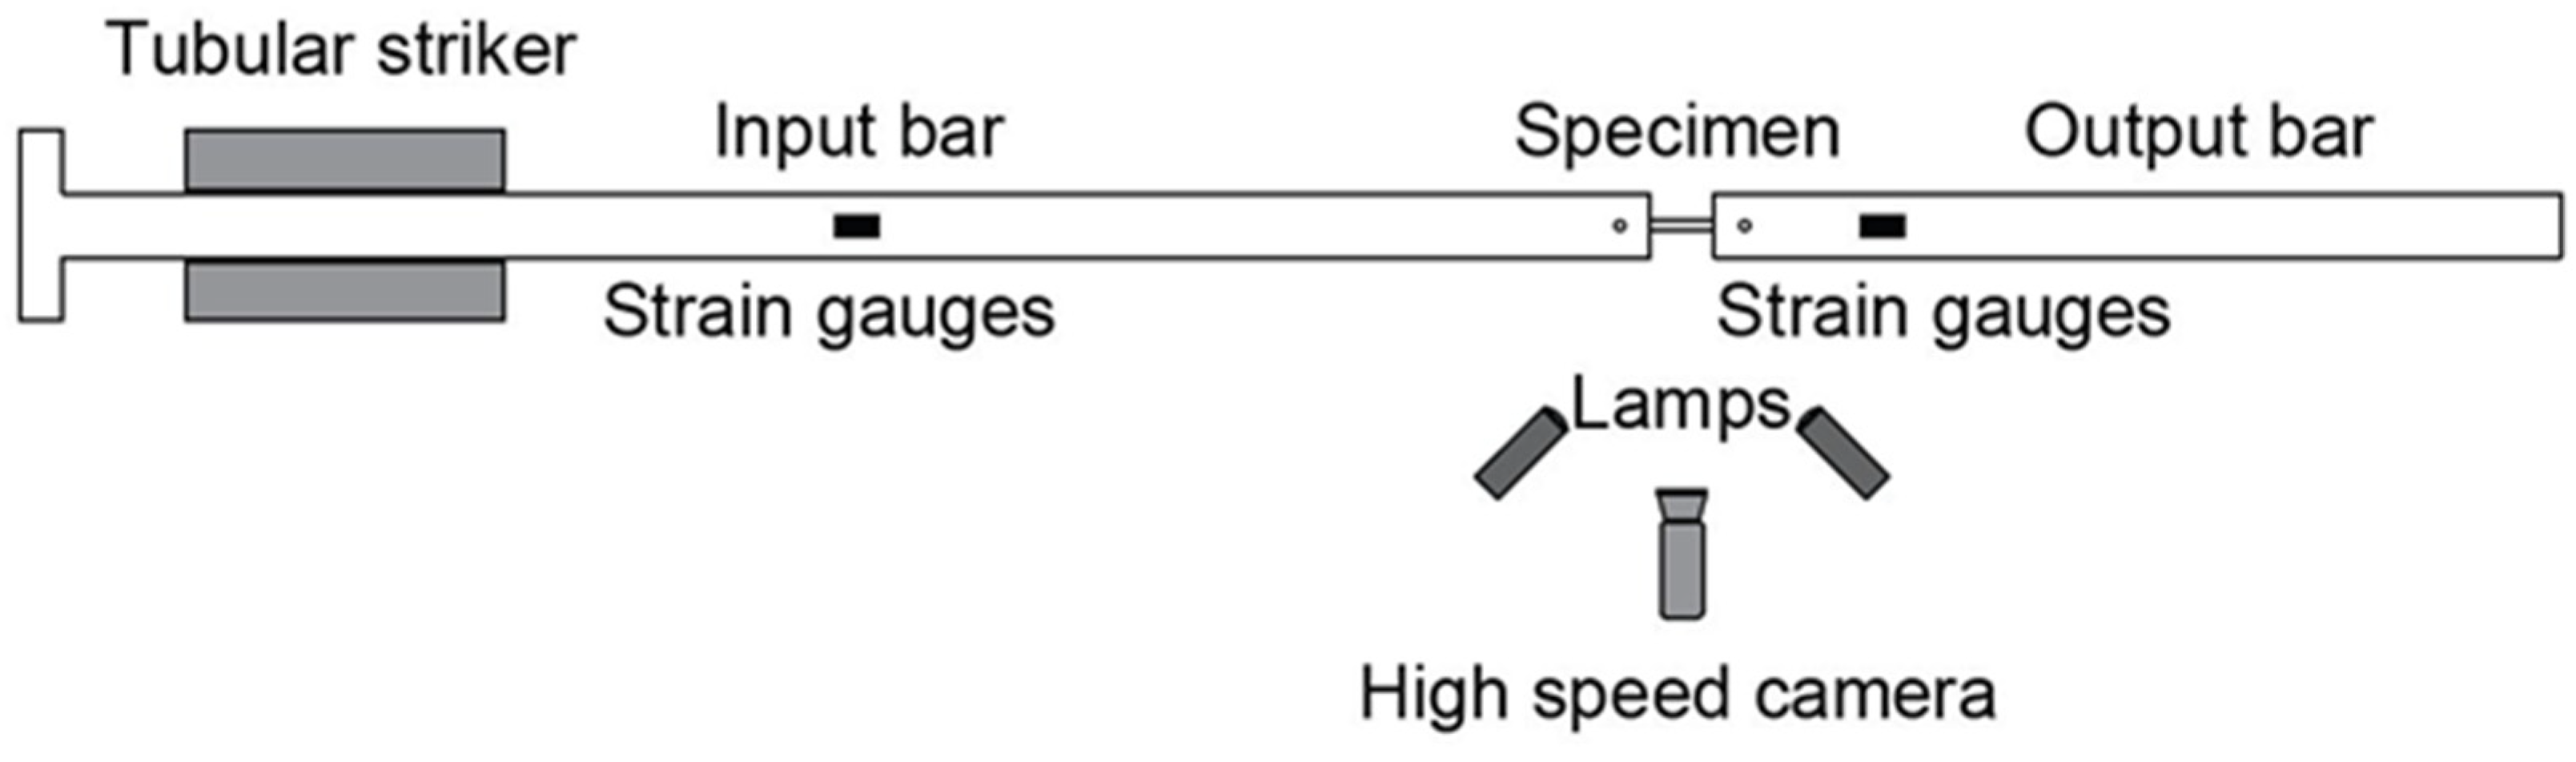
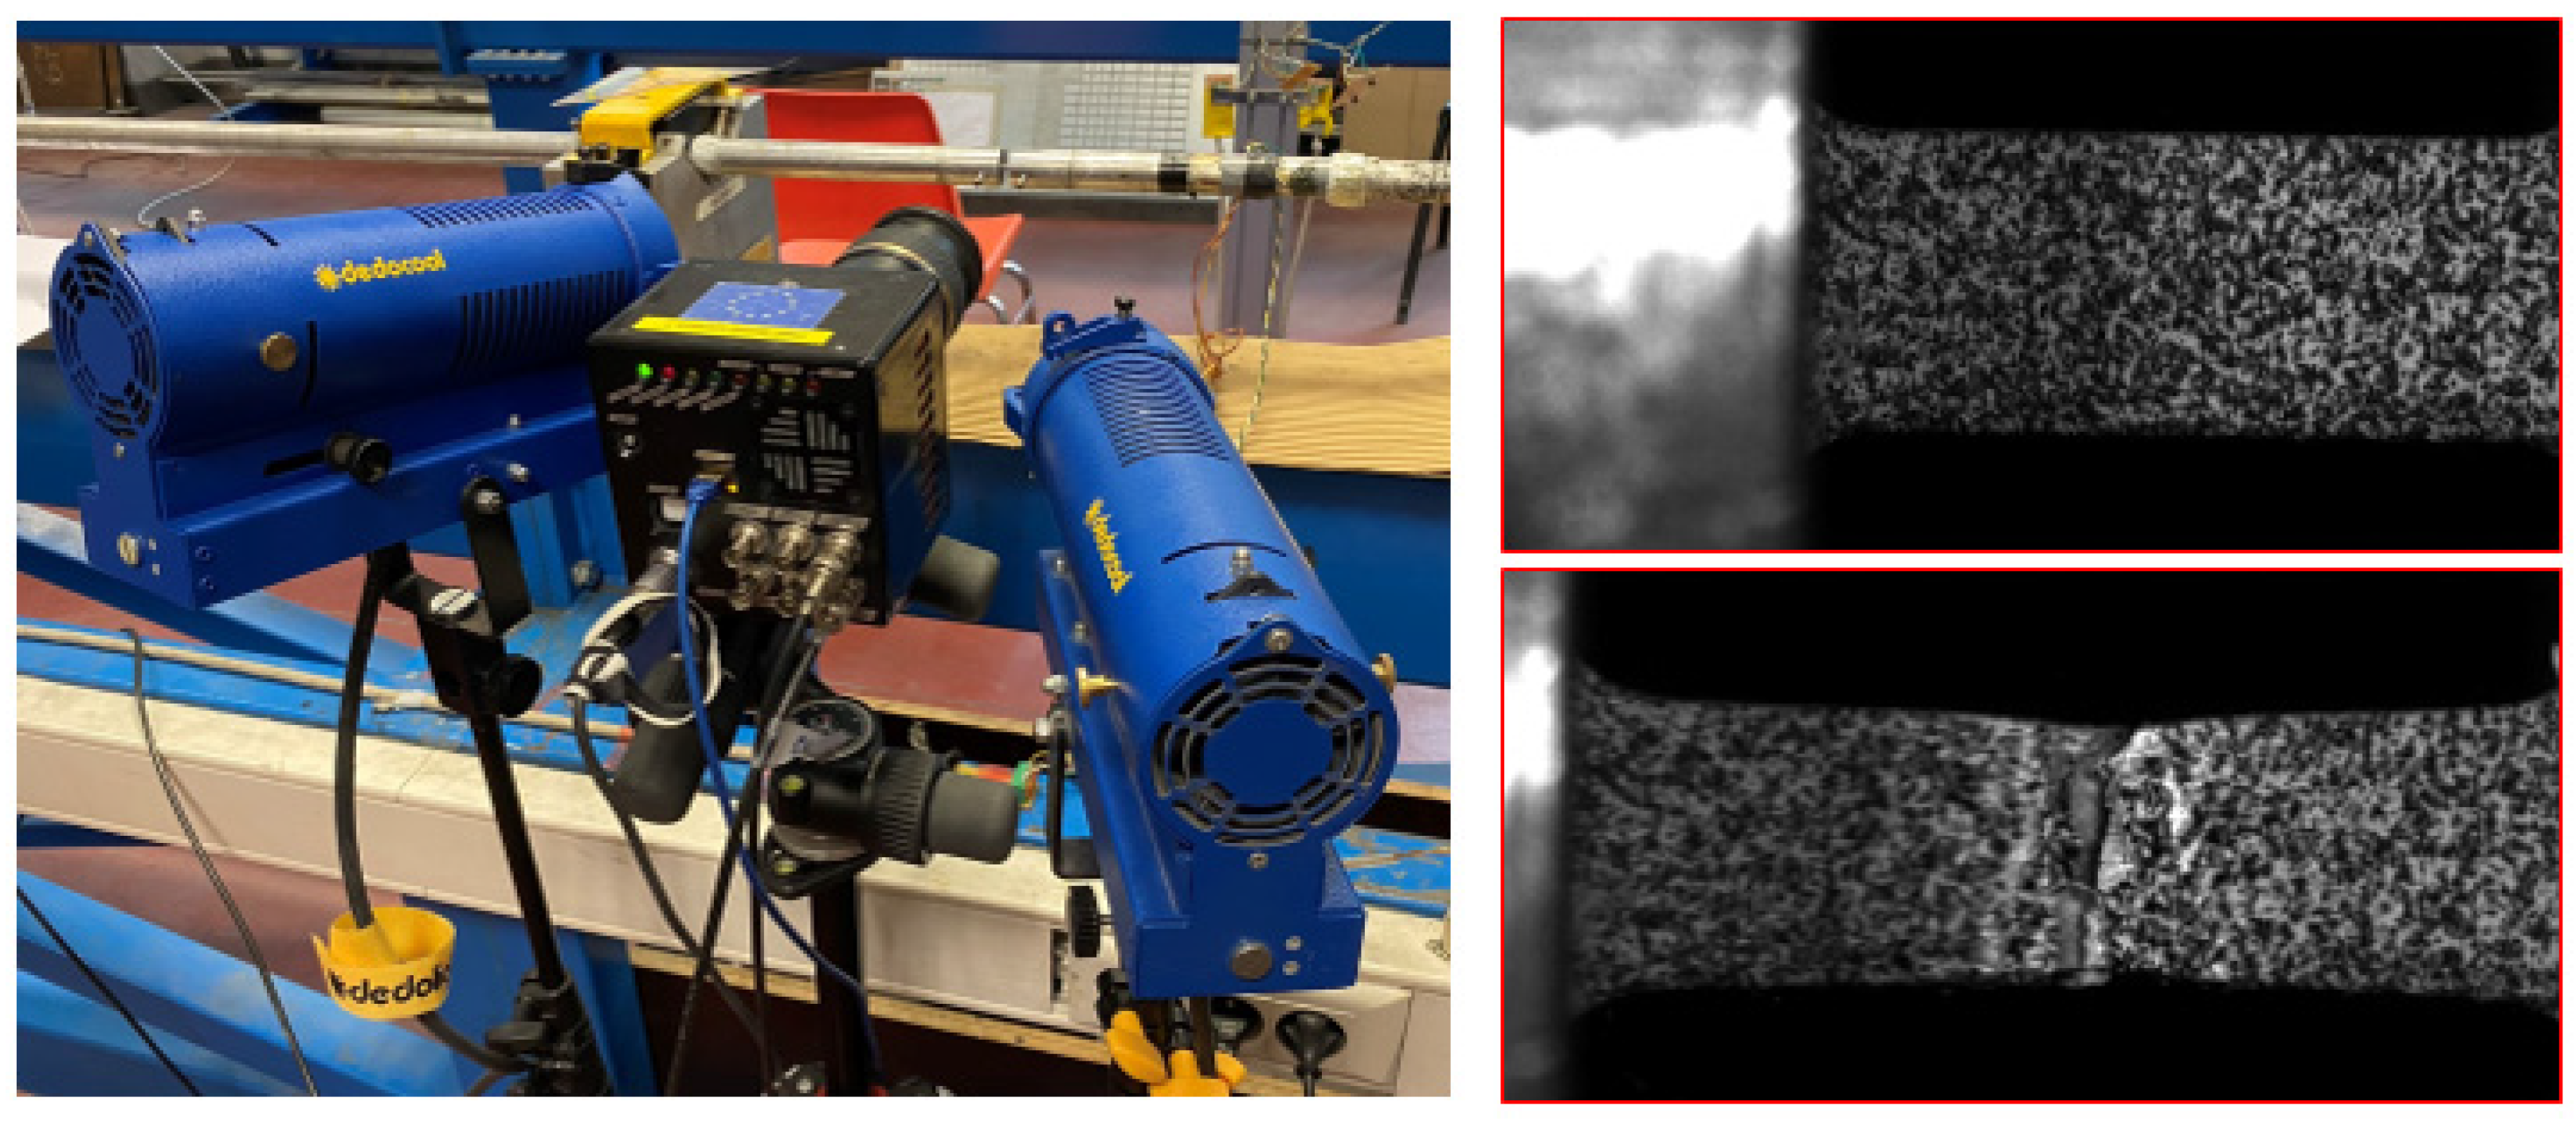
2.2. Experimental Methods

The tensile tests were carried out at ambient temperature using setups available at DyMaLab at Ghent University. Two experiments were performed for each test condition, i.e., the seven specimen orientations and the three strain rate regimes. For testing at quasi-static and intermediate strain rates, an Instron 5569 (Instron GmbH, Darmstadt, Germany) machine equipped with a 50 kN load cell was used. Crosshead speeds of 0.36 mm·min−1 and 360 mm·min−1 were used to obtain strain rates of 0.001 s−1 and 1 s−1, respectively. Specimens were fixed to the setup using pins.
An SHTB setup was used for the experiments at high strain rates (≈800 s−1). The setup is schematically presented in Figure 3 and consisted of an input and output bar between which the specimen was fixed. The input and output bars were made of aluminium alloy and had a diameter of 25 mm and lengths of 6 m and 3 m, respectively. A tubular striker made of ertalon was put around the input bar and was accelerated by a pneumatic mechanism towards a flange at the end of the input bar. The impact with the flange generated an incident tensile wave that propagated to the specimen. The wave interacted with the specimen and was partly reflected as a compressive wave and partly transmitted to the output bar as a tensile wave. The waves were measured using strain gages wired in full Wheatstone bridge configuration attached to the bars. As elaborated below, from the acquired data, it was possible to evaluate the stress–strain curve and to calculate the strain rate. Indeed, as soon as force equilibrium is established in the specimen and during uniform deformation, stress and strain rate in the specimen can be calculated from the transmitted and reflected wave [16]. The strain rate can be adjusted by the striker impact velocity, which was chosen to be 13 m·s−1 [17].
Analysis of SHTB tests relies on the one-dimensional wave propagation theory [18]. The amplitudes of the waves are kept below the elastic limit of the input and output bars, allowing the use of Hooke’s law to calculate the forces F 1 t and F 2 t at the interfaces between the specimen and the input bar and output bar, respectively:
F 1 t = E B · A B · ε I t + ε R t ,
F 2 t = E B · A B · ε T t ,
where EB is the Young’s modulus of the bars, AB is the bar’s cross-section area, ε I t is the incident strain wave, ε R t is the reflected strain wave, and ε T t is the transmitted strain wave.
Assuming force equilibrium in the specimen, i.e., F 1 t = F 2 t , the following equation can be applied to calculate the engineering stress and strain rate [18]:
σ t = A B A S · E B · ε T t ,
ε ˙ t = 2 · C B L S · ε R t ,
where CB is the velocity of wave propagation in the bars, and LS is the specimen gauge length.
Figure 4 shows incident, reflected, and transmitted stress waves shifted in time to the specimen/bar interfaces for test in the rolling direction. The sign of the reflected compression wave was reversed.
The true stress was calculated as
σ t r u e = F A S i ,
where F is the actual tensile force (for experiments at dynamic strain rate, it was calculated using Equation (2)), and ASi is the actual specimen cross section area:
A S i = A S · e φ ,
where φ is the true longitudinal strain obtained from optical deformation measurements.
For all tests, the specimen deformation was measured using DIC [19]. The method is non-contact and provides a complex full-field deformation analysis. The measurement process consists of four stages, i.e., specimen surface preparation, calibration of devices, image recording (before and during the experiment), and image processing [20]. The accuracy of the technique is affected by factors that can be grouped as errors related to the specimen, loading, and imaging (size of the speckle pattern, image resolution, illumination intensity, etc.) and errors related to the correlation algorithm (inappropriate subset size, correlation function, shape function, etc.) [21,22]. The speckle pattern (Figure 5) was applied to the gauge section prior to the experiment. The pattern was made by spraying black paint on a white background. To measure in-plane deformations at quasi-static strain rates, a 5Mpxl F-504B Allied Vision Stingray camera (Allied Vision Technologies GmbH, Stadtroda, Germany) was used. The specimen was illuminated by two LED lamps. The experiments at intermediate and high strain rates were captured by a high-speed Photron Mini AX200 camera (Photron, Tokyo, Japan) and illuminated with two Dedocool lamps (see Figure 5).
The images were analysed by the commercial software MatchID 2D version 2021.2.1. The parameters of the optical deformation measurement are presented in Table 2.
Crystallographic texture resulting from material processing steps, such as rolling, gives rise to anisotropic material properties, which significantly affect the formability. To assess the anisotropy of a sheet, the Lankford coefficient [14] was used and determined by the following equation:
r = φ w φ t ,
where φ w and φ t are the true strain in the width and thickness direction, respectively. The thickness strain was obtained using the volume conservation principle: φ t = ( φ + φ w ) . The DIC technique allowed for the evaluation of the Lankford coefficients for each frame from the onset of yielding to necking, from which the average value was calculated. Typical values of the Lankford coefficient for aluminium alloys are close to the values obtained for isotropic materials, i.e., 1 [23].
The formability of a material is also affected by strain hardening, commonly quantified by the hardening exponent n. The n-value is derived from the slope of the true ln(stress)–ln(strain) curve from yielding to necking. For materials following Hollomon’s law, the following equation was used:
σ t r u e = K · φ n ,
where K is the strength coefficient, and the n-value is equal to the true necking strain. Higher n-values, thus, result in better formability.

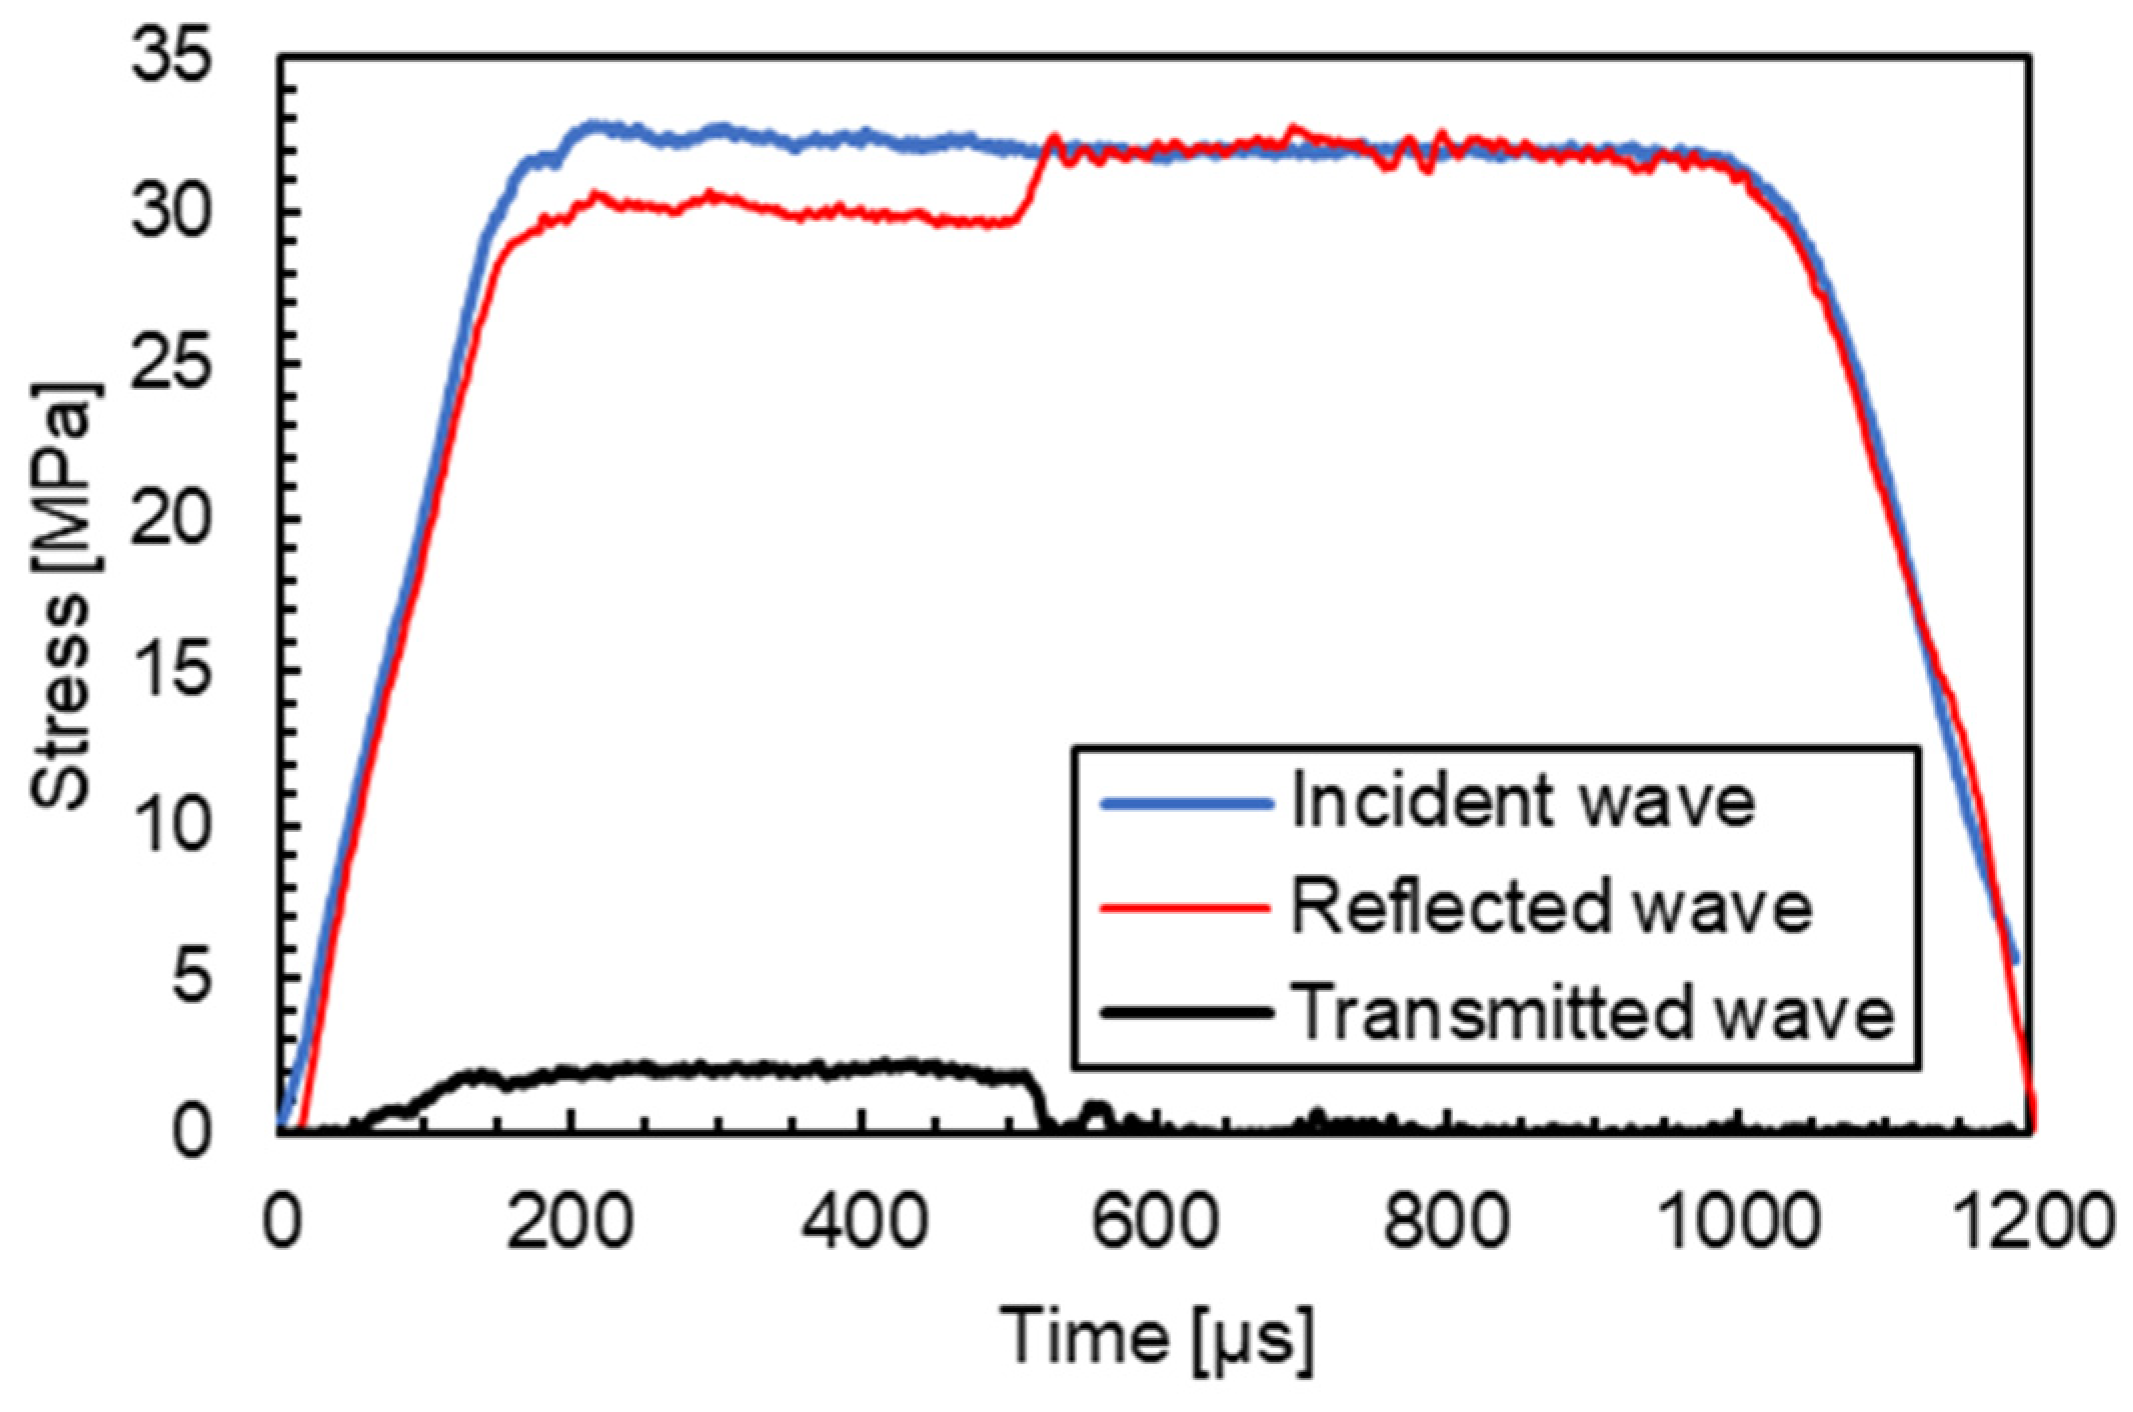
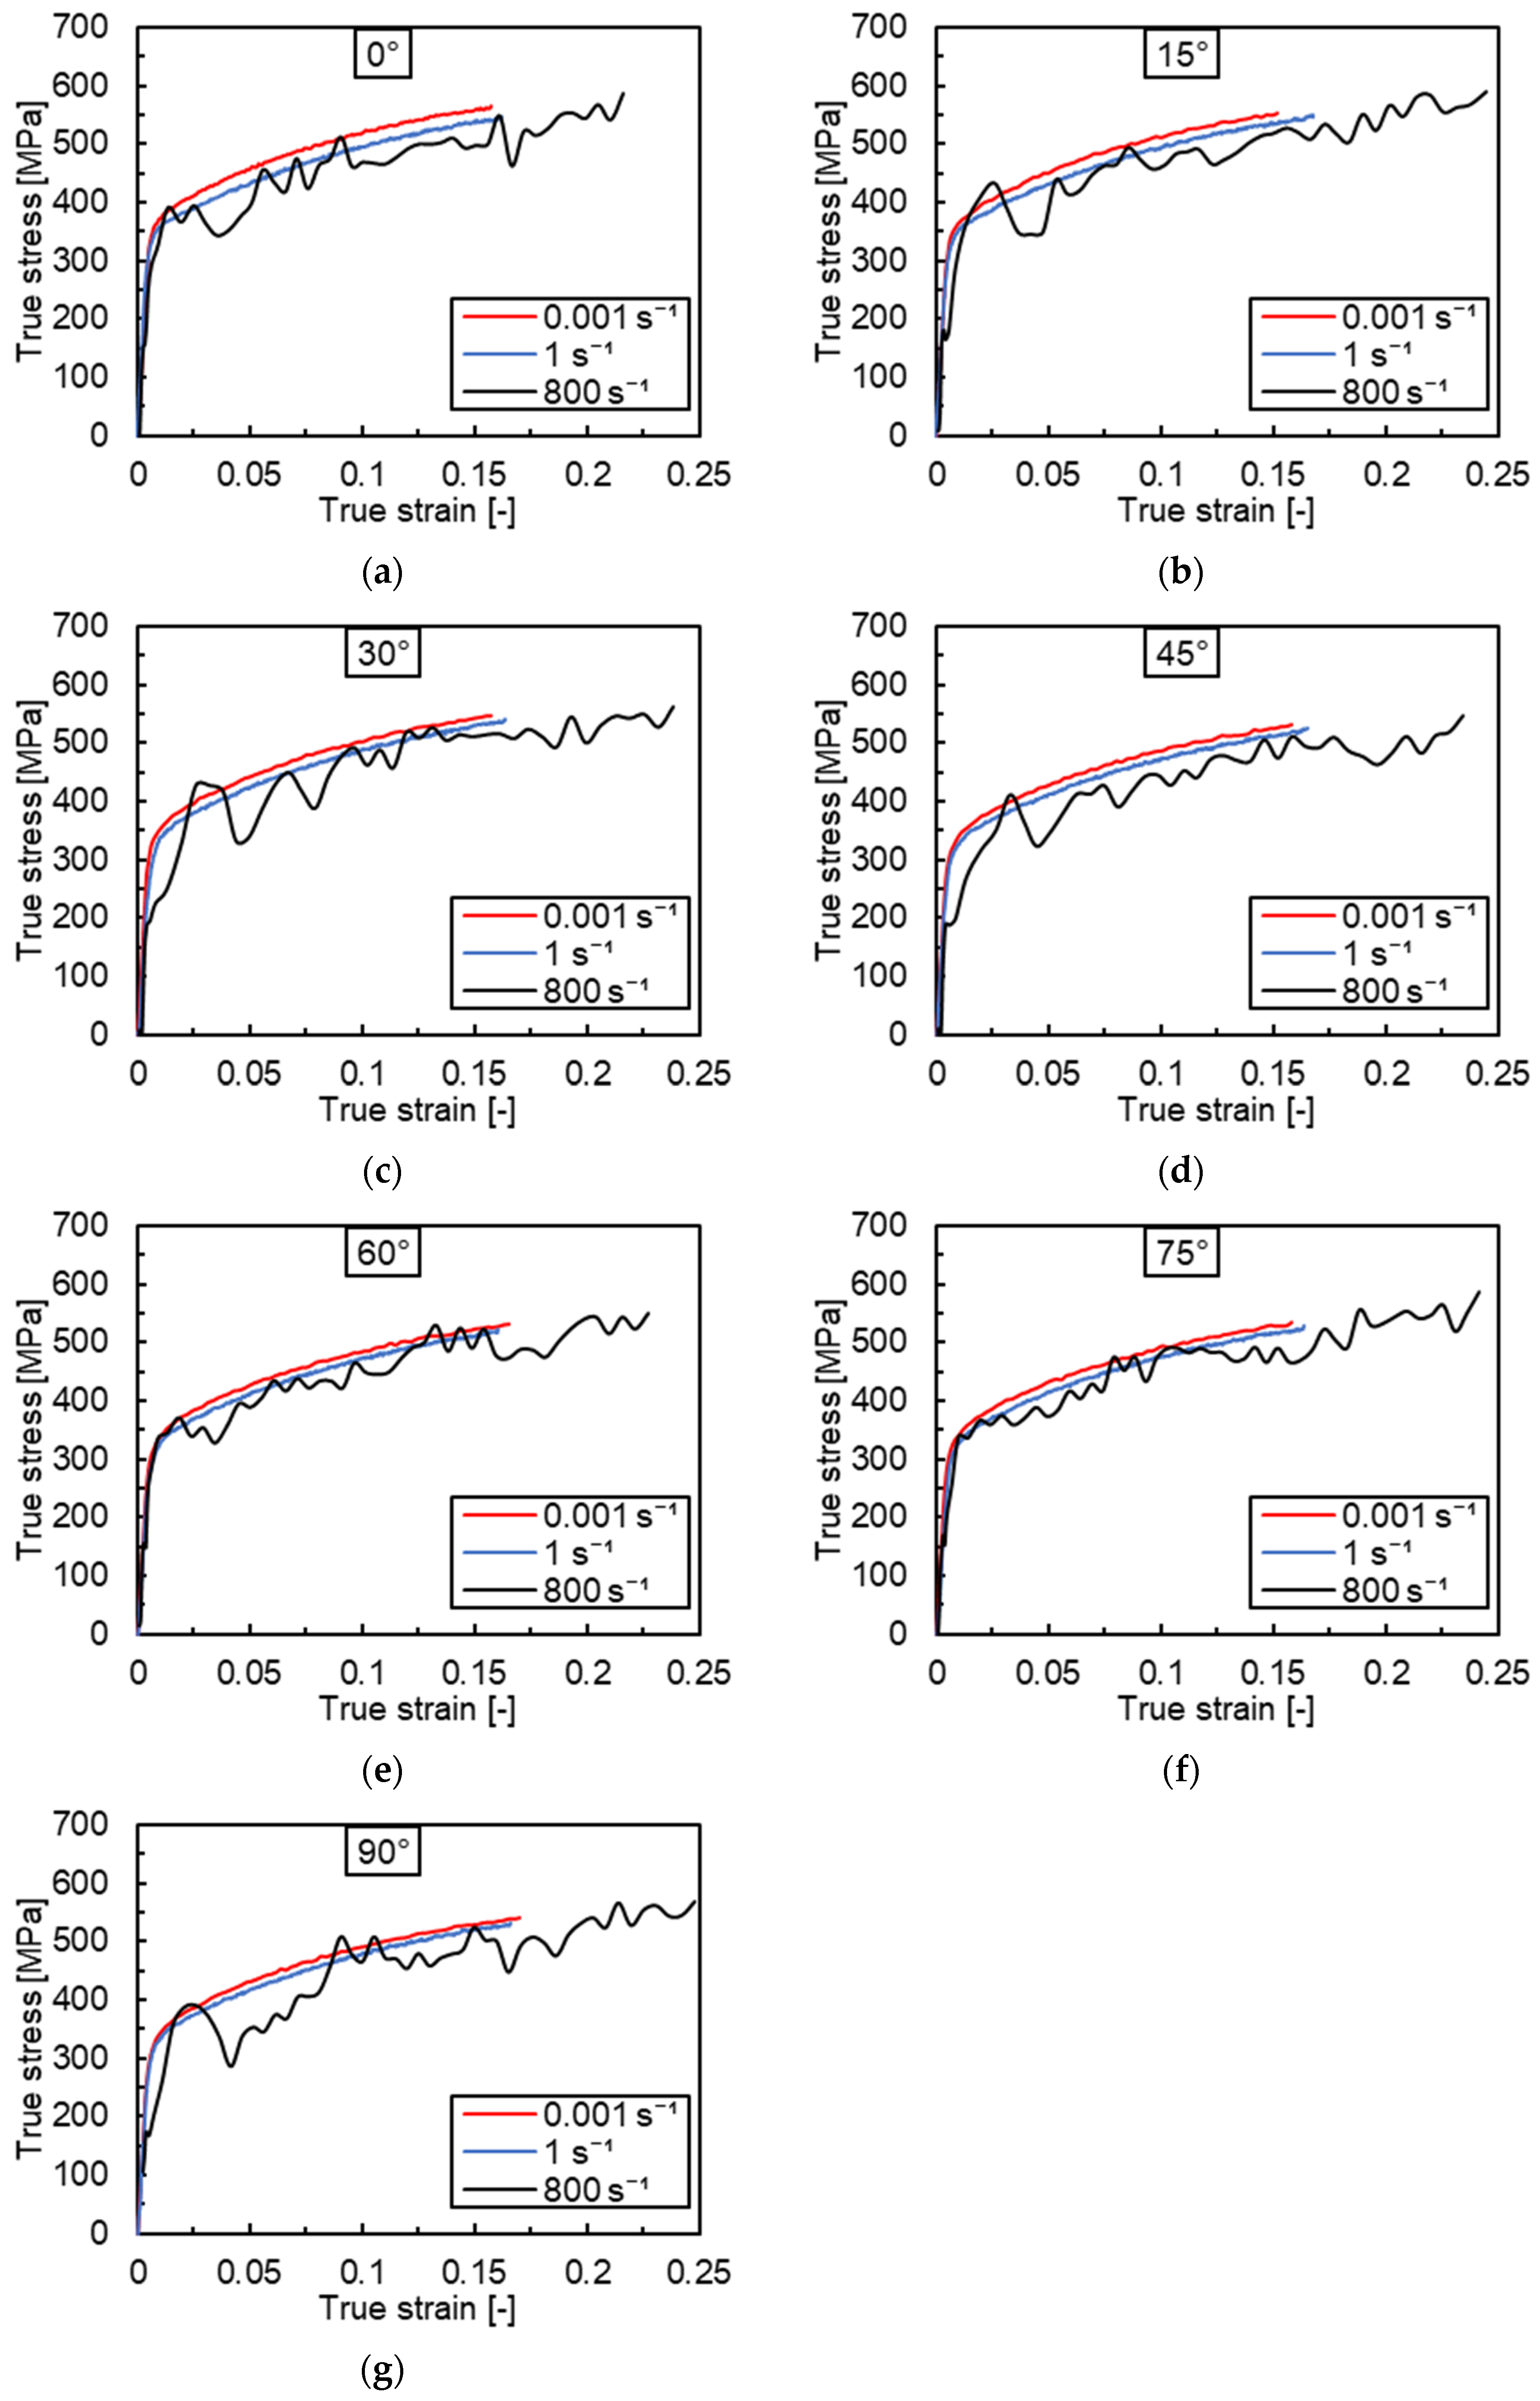
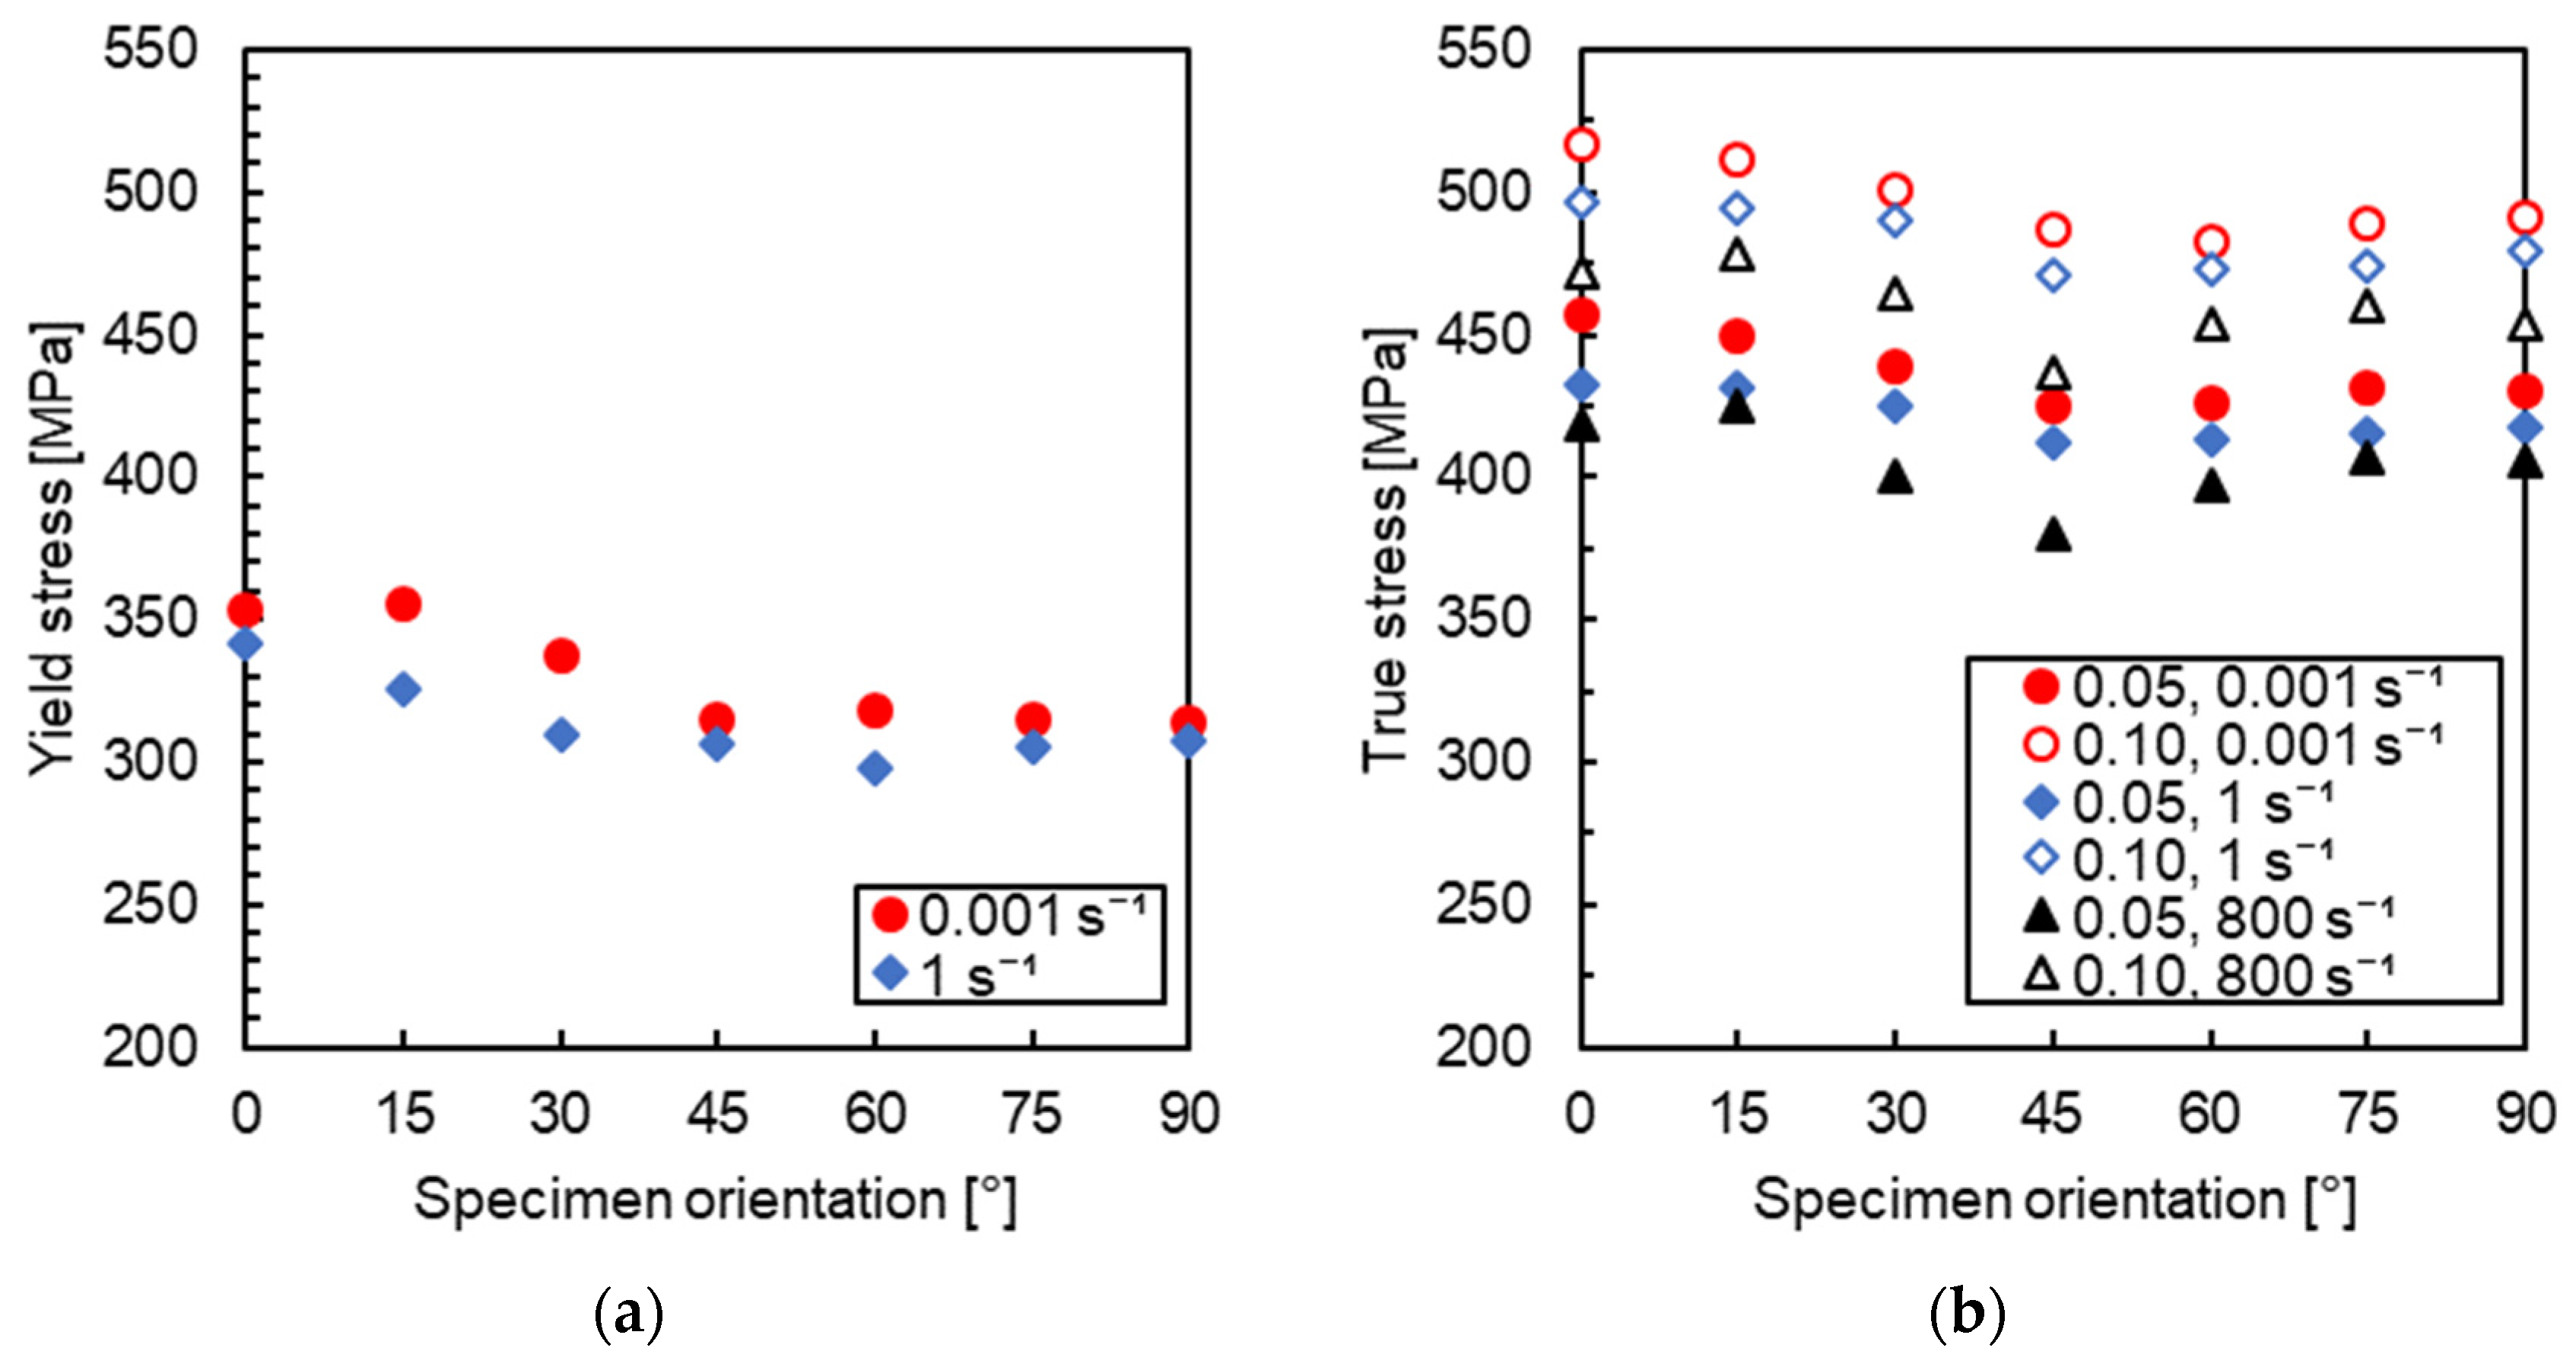
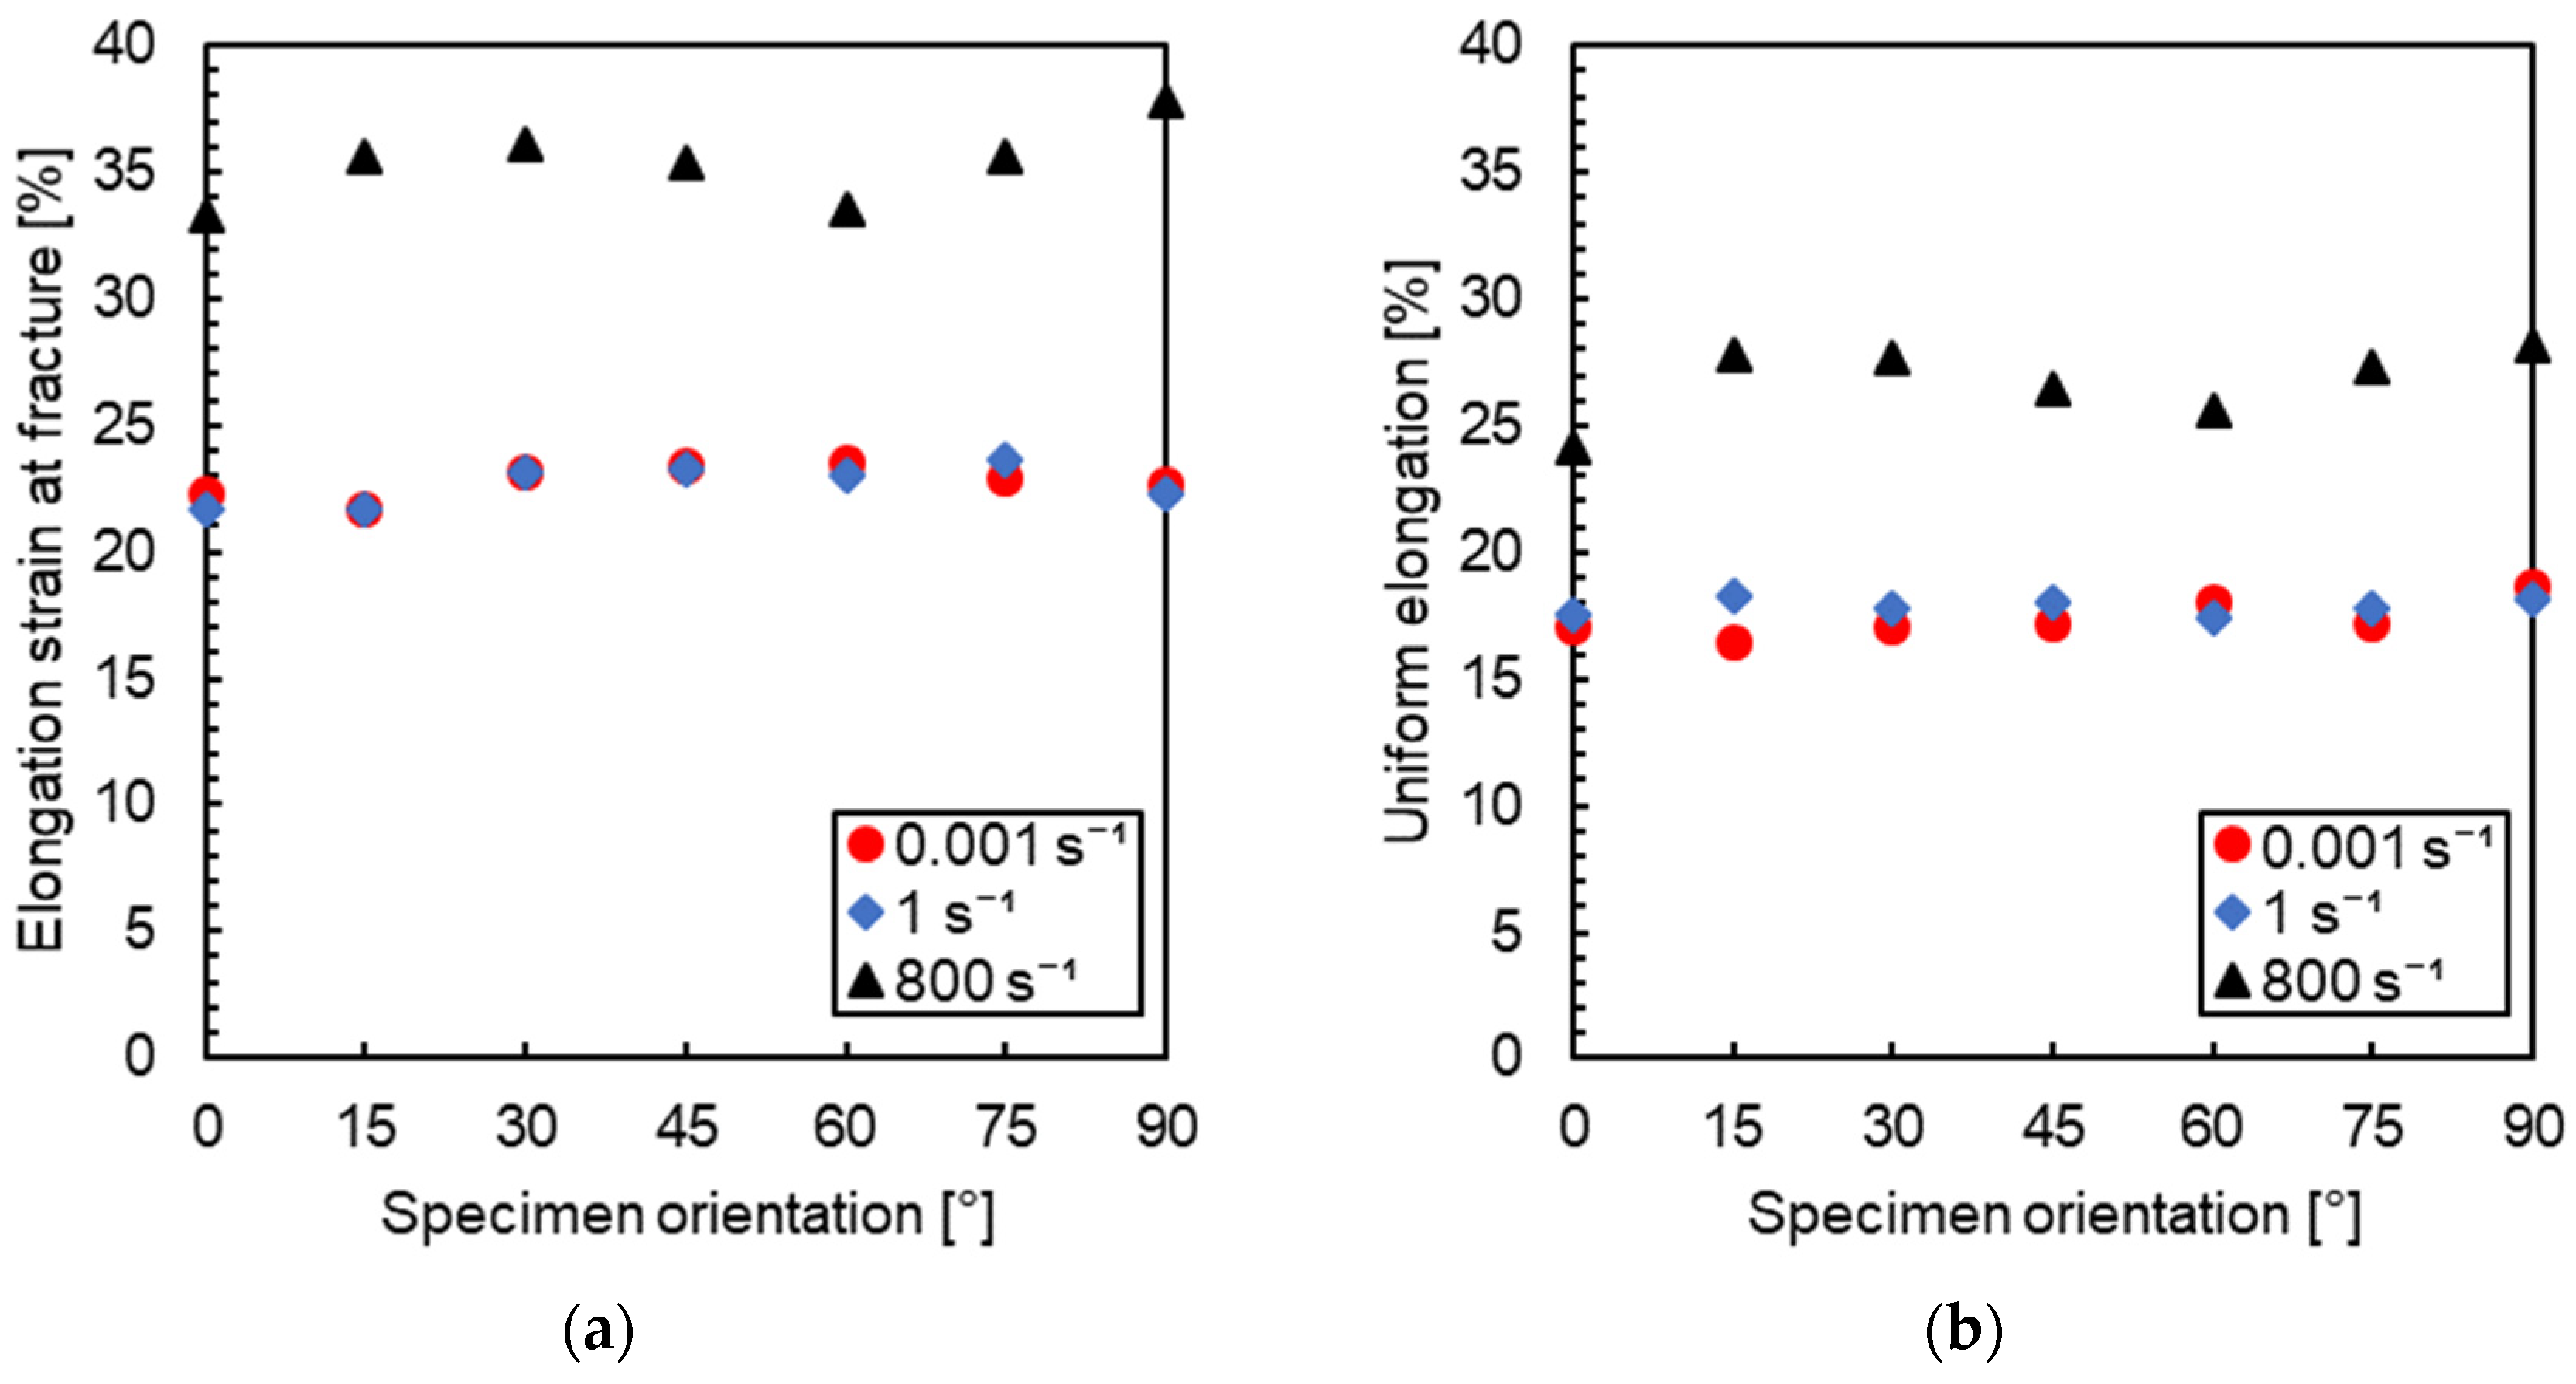
3. Results and Discussion

Grain size influences material properties, such as ductility, machinability, and mechanical properties. Decreasing grain size results in an increase in hardness, yield stress, or strength [24]. The etched microstructure of 2024-T3 (Figure 1) is composed of grains with an average size of 17.4 µm and coarse inclusions. Following [1,25,26], the microstructure can, thus, be considered fine-grained.
Representative true stress–strain curves up to necking from tensile tests at quasi-static, intermediate, and high strain rates for different specimen orientations are shown in Figure 6. The curves show a moderate NSRS in the considered strain rate regime. Indeed, the flow stress decreases when the strain rate increases from 0.001 s−1 to 1 s−1 and then further to 800 s−1.
Figure 7a shows the 0.2% value of yield stress versus specimen orientation for quasi-static and intermediate strain rates. Results from SHTB were not included, as oscillations prevented the calculation of reliable values. NSRS was observed for yield stress values at all specimen orientations. The maximum and minimum yield stresses at the strain rate of 0.001 s−1 were 355 MPa (specimen orientation: 15°) and 314 MPa (specimen orientation: 90°), respectively. The values at the strain rate of 1 s−1 ranged from 294 MPa to 342 MPa. Figure 7b depicts flow stresses extracted at a true strain of 0.05 and 0.1 for the different specimen orientations. To exclude the effect of oscillations, values at the highest strain rate were calculated from curves fitted to the Hollomon law (see Equation (8)). The flow stress values confirm the NSRS. The evolution of the flow stresses at different specimen orientations followed the trend seen for the yield stress in Figure 7a.
The strain rate sensitivity can be quantified using the semi-logarithmic parameter S:
S = d σ d l n ε ˙ ,
For the stress σ in the equation, the yield stress, the stress at a specific strain level, or the ultimate stress can be taken. The S parameter can be determined as the slope of σ– l n ε ˙ curves.
Based on the values represented in Figure 7, the S parameter at different specimen orientations was calculated as the slope of σ– l n ε ˙ curves for the yield stress, as well as for true stresses at strain levels of 0.05 and 0.1. An overview of corresponding S-values is presented in Table 3.
For all specimen orientations and considered stresses, S-values were negative. The NSRS might be attributed to DSA [27,28]. However, the strain fields obtained from the tests did not show any indication of strain bands. Also, no Portevin–Le Chatelier (PLC) serrations were observed in the true stress–strain curves. The oscillations in the high strain rate curves are believed to have a mechanical origin. Thermal softening might also result in a negative SRS. Indeed, the adiabatic temperature rise in specimens tested at high strain rates might have a softening effect on the flow stress. It is worth noting that the strain rate limit above which adiabatic conditions prevail is relatively low, i.e., typically around 1 s−1 for metals [29]. Consequently, dynamic tests reflect the combined influence of strain rate and temperature. However, adiabatic heating does not occur at the onset of plastic deformation. Therefore, changes in stress levels with a strain rate at yielding or low strain levels can be attributed solely to the effect of the strain rate, and the corresponding SRS parameters provide the most reliable insight into strain rate sensitivity. The negative S-values for the yield stress indicate that the NSRS cannot be attributed to thermal softening. The fact that S-values do not systematically decrease with increasing deformation further points towards a non-dominant role of thermal softening.
For high strain rate experiments, the elongation strain at fracture was significantly higher compared to the values at other strain rates (see Figure 8a), thus confirming the findings in [8]. Moreover, the uniform elongation calculated from the gauge length at maximum force (Figure 8b) exhibited the same trend. Compared to the flow stresses, the effect of specimen orientation was less pronounced at all strain rates considered.
The plastic anisotropy exhibited by the sheet metal resulted in Lankford coefficients being significantly lower than 1 and the variation of the Lankford coefficient with respect to the rolling direction, as can be seen in Figure 9a. The maximum values for all strain rates were located at specimen orientations of 30° and 40°. Coefficients lower than 1 indicate higher strains along the thickness direction compared to the width direction, which is critical for forming applications. A similar evolution of the Lankford coefficient with testing direction is presented in Barlat et al. [11]. The hardening exponent (Figure 9b), on the contrary, showed a negligible dependence on the specimen orientation. The deviations of dynamic strain rates could be due to the oscillations of the stress–strain curves from which the hardening exponent was extracted. As was the case for the Lankford coefficient, the hardening exponent was only moderately influenced by the strain rate.
Figure 10 shows the fracture surfaces of specimens cut along the 45° (Figure 10a,c,e) and 90° (Figure 10b,d,f) directions relative to the rolling direction. The micrographs were taken at a high magnification (5000×) to comprehensively identify the fine dimple morphology typical of a ductile fracture process resulting from the nucleation, propagation, and coalescence of voids. A combination of very shallow and deeper dimples is a typical type of fracture for aluminium alloys and other metals tested at ambient temperature [30]. The aluminium alloy 2024-T3 was subjected to natural aging, which resulted in the precipitation of homogeneously distributed submicron particles, causing strengthening and acting as initiation points for the creation of very fine dimples on the fracture surfaces (Figure 10c). No clear relationship between fracture morphology and strain rate was observed. Indeed, no noticeable changes were observed in the size or shape of the dimples when the strain rate was increased.

4. Conclusions

The mechanical behaviour and formability of aluminium alloy 2024-T3 in sheet form with a thickness of 0.8 mm were investigated under tensile loading from quasi-static to dynamic strain rates for seven different specimen orientations. The DIC technique was used to measure the evolution of the deformation fields in the specimens. An NSRS was observed from the onset of yielding over the entire strain rate regime and in all directions. The NSRS might have been induced by DSA. However, the DIC strain fields and true stress–strain curves did not show further indications of DSA, such as propagating strain bands or PLC serrations. The values of uniform elongation and fracture elongation showed a significant increase in deformation capacity at high strain rates. The specimens cut at a 15° angle against the rolling direction showed the highest increase in both uniform and fracture elongation, with values of 9.8% and 11.5%, respectively, moving from quasi-static to dynamic strain rates. The Lankford coefficients revealed a pronounced anisotropy over the entire strain rate regime. Indeed, strongly directional-dependent coefficients, varying between 0.45 and 0.87, were found. The underlying dominant thinning in the thickness direction limited the materials’ formability. The influence of the strain rate on the Lankford coefficient was negligible. No noticeable dependency of the hardening exponent on the specimen orientation or the strain rate was seen. An average value of 0.183 was obtained at quasi-static strain rates. The fracture mode proved to be ductile within the entire analysed range of strain rates. Variations in the size and depth of dimples between the considered orientations were minimal.

Author Contributions

Conceptualisation, M.H. and P.V.; methodology, M.H. and P.V.; validation, P.V.; formal analysis, M.H.; investigation, M.H.; resources, P.V.; data curation, M.H. and P.V.; writing—original draft preparation, M.H. and S.K.; writing—review and editing, M.H., P.V. and M.F.; visualisation, M.H. and S.K.; supervision, P.V. and M.F. All authors have read and agreed to the published version of the manuscript.

Funding

This research was supported by the project “Development of an apparatus for testing of flat specimens in tension” no. FV 22-06 within the projects of the Faculty of Mechanical Engineering, Brno University of Technology.

Data Availability Statement

The data that support the findings of this study are available from the corresponding authors. The data are not publicly available due to privacy.

Acknowledgments

We thank Sarath Chandran from the Department of Electromechanical, Systems and Metal Engineering, MST-DyMaLab Research Group, Ghent University, for assistance with tensile testing. We also express our gratitude to Marek Doubrava and Libor Pantělejev from the Institute of Materials Science and Engineering, Faculty of Mechanical Engineering, Brno University of Technology, for providing the fractographic images of tensile specimens.

Conflicts of Interest

The authors declare no conflicts of interest.

References

  1. Huda, Z.; Taib, I.; Zaharinie, T. Characterization of 2024-T3: An aerospace aluminum alloy. Mater. Chem. Phys. 2009, 113, 515–517. [Google Scholar] [CrossRef]
  2. Moy, C.K.S.; Weiss, M.; Xia, J.; Sha, G.; Ringer, S.P.; Ranzi, G. Influence of heat treatment on the microstructure, texture and formability of 2024 aluminium alloy. Mat. Sci. Eng. A 2012, 552, 48–60. [Google Scholar] [CrossRef]
  3. Lin, Y.C.; Xia, Y.; Jiang, Y.; Zhou, H.; Li, L. Precipitation hardening of 2024-T3 aluminum alloy during creep aging. Mat. Sci. Eng. A 2013, 565, 420–429. [Google Scholar] [CrossRef]
  4. Dursun, T.; Soutis, C. Recent developments in advanced aircraft aluminium alloys. Mater. Des. 2014, 56, 862–871. [Google Scholar] [CrossRef]
  5. Li, P.; Siviour, C.R.; Petrinic, N. The Effect of Strain Rate, Specimen Geometry and Lubrication on Responses of Aluminium AA2024 in Uniaxial Compression Experiments. Exp. Mech. 2009, 49, 587–593. [Google Scholar] [CrossRef]
  6. Abotula, S.; Chalivendra, V.B. An experimental and numerical investigation of the static and dynamic constitutive behaviour of aluminium alloys. J. Strain Anal. Eng. 2010, 45, 555–565. [Google Scholar] [CrossRef]
  7. Rodríguez-Martínez, J.A.; Rusinek, A.; Arias, A. Thermo-viscoplastic behaviour of 2024-T3 aluminium sheets subjected to low velocity perforation at different temperatures. Thin Wall Struct. 2011, 49, 819–832. [Google Scholar] [CrossRef]
  8. Shamchi, S.P.; Queirós de Melo, F.J.M.; Tavares, P.J.; Moreira, P.M.G.P. Thermomechanical characterization of Alclad AA2024-T3 aluminum alloy using split Hopkinson tension bar. Mech. Mater. 2019, 139, 103198. [Google Scholar] [CrossRef]
  9. Lee, S.; Takushima, C.; Hamada, J.; Nakada, N. Macroscopic and microscopic characterizations of Portevin-LeChatelier effect in austenitic stainless steel using high-temperature digital image correlation analysis. Acta Mater. 2021, 205, 116560. [Google Scholar] [CrossRef]
  10. Xu, J.; Holmedal, B.; Hopperstad, O.S.; Mánik, T.; Marthinsen, K. Dynamic strain ageing in an AlMg alloy at different strain rates and temperatures: Experiments and constitutive modelling. Int. J. Plast. 2022, 151, 103215. [Google Scholar] [CrossRef]
  11. Barlat, F.; Lege, D.J.; Brem, J.C. A six-component yield function for anisotropic materials. Int. J. Plast. 1991, 7, 693–712. [Google Scholar] [CrossRef]
  12. Lesuer, D.R. Experimental Investigations of Material Models for Ti-6Al-4V Titanium and 2024-T3 Aluminum: Final Report; Report No.—DOT/FAA/AR-00/25 20591; Office of Aviation Research: Washington, DC, USA, 2000. [Google Scholar]
  13. Houria, M.; Matougui, N.; Mehdi, B.; Kherrouba, N.; Jahazi, M. Effect of Plastic Anisotropy on the Kinetics of Static Softening in AA2024–T3 Aluminum Alloy. Met. Mater. Int. 2022, 28, 2042–2058. [Google Scholar] [CrossRef]
  14. Lankford, W.T.; Snyder, S.C.; Bausher, J.A. New criteria for predicting the press performance of deep drawing sheets. Trans. Am. Soc. Met. 1950, 42, 1197–1232. [Google Scholar]
  15. ASTM E112-13; Standard Test Method for Determining Average Grain Size. ASTM International: West Conshohocken, PA, USA, 2021.
  16. Kuhn, H.; Medlin, D. (Eds.) Mechanical Testing and Evaluation, ASM Handbook; ASM International: Materials Park, OH, USA, 2000. [Google Scholar]
  17. Chen, W.W.; Song, B. Split Hopkinson (Kolsky) Bar: Design, Testing and Applications; Springer: New York, NY, USA, 2011. [Google Scholar]
  18. Meyers, M.A. Dynamic Behavior of Materials; John Wiley and Sons: New York, NY, USA, 1994. [Google Scholar]
  19. Chu, T.C.; Ranson, W.F.; Sutton, M.A. Applications of digital-image-correlation techniques to experimental mechanics. Exp. Mech. 1985, 25, 232–244. [Google Scholar] [CrossRef]
  20. Górszczyk, J.; Malicki, K.; Zych, T. Application of Digital Image Correlation (DIC) Method for Road Material Testing. Materials 2019, 12, 2349. [Google Scholar] [CrossRef] [PubMed]
  21. Pan, B.; Qian, K.; Xie, H.; Asundi, A. Two-dimensional digital image correlation for in-plane displacement and strain measurement: A review. Meas. Sci. Technol. 2009, 20, 062001. [Google Scholar] [CrossRef]
  22. Janeliukstis, R.; Chen, X. Review of digital image correlation application to large-scale composite structure testing. Compos. Struct. 2021, 271, 114143. [Google Scholar] [CrossRef]
  23. Buschow, K.H.J.; Cahn, R.W.; Flemings, M.C.; Ilschner, B.; Kramer, E.J.; Mahajan, S.; Veyssière, P. (Eds.) Encyclopedia of Materials: Science and Technology; Elsevier: Amsterdam, The Netherlands, 2001. [Google Scholar]
  24. De Sousa Araujo, J.V.; Milagre, M.X.; Ferreira, R.O.; de Souza Carvalho Machado, C.; de Abreau, C.P.; Costa, I. Microstructural Characterizatics of the Al Alloys: The Dissimilarities Among the 2XXX Alloys Series used in Aircraft Structures. Metallogr. Microstruct. Anal. 2020, 9, 744–758. [Google Scholar] [CrossRef]
  25. Khatami, R.; Fattah-alhosseini, A.; Mazaheri, Y.; Keshavarz, M.K.; Haghshenas, M. Microstructural evolution and mechanical properties of ultrafine grained AA2024 processed by accumulative roll bonding. Int. J. Adv. Manuf. Technol. 2017, 93, 681–689. [Google Scholar] [CrossRef]
  26. Goli, F.; Jamaati, R. Effect of strain path during cold rolling on the microstructure, texture, and mechanical properties of AA2024 aluminum alloy. Mater. Res. Express 2019, 6, 066514. [Google Scholar] [CrossRef]
  27. Chandran, S.; Liu, W.; Lian, J.; Münstermann, S.; Verleysen, P. Dynamic strain aging in DP1000: Effect of temperature and strain rate. Mat. Sci. Eng. A 2022, 832, 142509. [Google Scholar] [CrossRef]
  28. Noh, Y.; Lee, M.S.; Chaudry, U.M.; Jun, T.S. Effect of strain rate on the deformation of 6061-T6 aluminum alloy at cryogenic temperature. Mater. Charact. 2023, 206, 113403. [Google Scholar] [CrossRef]
  29. Hokka, M. (Ed.) Dynamic Behavior of Materials; Elsevier: Amsterdam, The Netherlands, 2023. [Google Scholar]
  30. Alvand, M.; Naseri, M.; Borhani, E.; Abdollah-Pour, H. Nano/ultrafine grained AA2024 alloy processed by accumulative roll bonding: A study of microstructure, deformation texture and mechanical properties. J. Alloys Compd. 2017, 712, 517–525. [Google Scholar] [CrossRef]
Figure 1. Microstructure in the as-received state of the 2024-T3 alloy in the rolling plane.
Metals 14 00098 g001
Figure 2. Specimen geometry (dimensions in mm).
Metals 14 00098 g002
Figure 3. Schematic representation of the SHTB facility.
Metals 14 00098 g003
Figure 4. Incident, reflected, and transmitted stress waves during SHTB shifted in time to the specimen/bar interfaces.
Metals 14 00098 g004
Figure 5. Experimental setup for the tensile test at high strain rates (left), and specimen prior to and after testing (right).
Metals 14 00098 g005
Figure 6. True stress–strain curves for different strain rates and specimen orientations relative to the rolling direction of (a) 0°, (b) 15°, (c) 30°, (d) 45°, (e) 60°, (f) 75°, and (g) 90°.
Metals 14 00098 g006
Figure 7. (a) Yield stress and (b) true stress at 0.05 and 0.1 true strain versus specimen orientation at different strain rates.
Metals 14 00098 g007
Figure 8. (a) Elongation strain at fracture and (b) uniform elongation for the different specimen orientations considered.
Metals 14 00098 g008
Figure 9. (a) Lankford coefficient and (b) hardening exponent versus specimen orientation.
Metals 14 00098 g009
Figure 10. Fracture surfaces of selected specimens after tensile testing: (a) at 0.001 s−1 for the 45° direction, (b) at 0.001 s−1 for the 90° direction, (c) at 1 s−1 for the 45° direction, (d) at 1 s−1 for the 90° direction, (e) at 800 s−1 for the 45° direction, and (f) at 800 s−1 for the 90° direction.
Metals 14 00098 g010aMetals 14 00098 g010b
Table 1. Chemical composition of 2024-T3 aluminium alloy (% of weight).
SiFeCuMnMgCrNiZnTiOther
Elements
Al
max. 0.50max. 0.503.80–4.900.30–0.901.20–1.80max. 0.10-max. 0.25max. 0.150.05 each,
0.15 in total
rest
Table 2. DIC analysis parameters.
Quasi-Static Strain RateIntermediate Strain RateHigh Strain Rate
Resolution2452 × 2056 pixel2256 × 272 pixel2256 × 128 pixel2
Scale1 pixel = 0.0053 mm1 pixel = 0.0564 mm1 pixel = 0.0407 mm
Frame rate1/3 Hz10,000 Hz120,000 Hz
Image filteringGaussianGaussianGaussian
Subset size45 pixel29 pixel27 pixel2
Step size11 pixel1 pixel2 pixel
Shape functionQuadraticQuadraticQuadratic
Matching criterionZero-normalized sum of square differences (ZNSSD)ZNSSDZNSSD
Strain window17 data points15 data points13 data points
Virtual strain gage221 pixel223 pixel231 pixel2
Table 3. Overview of S-values for different specimen orientations.
Specimen OrientationS
Yield Stress
(MPa·s−1)
S
Stress at 0.05 Strain
(MPa·s−1)
S
Stress at 0.1 Strain
(MPa·s−1)
−1.62−2.82−3.32
15°−4.26−1.76−2.46
30°−4.02−2.77−2.66
45°−3.04−2.12−2.07
60°−3.04−2.12−2.07
75°−1.40−1.78−2.12
90°−0.88−1.80−2.69
Disclaimer/Publisher’s Note: The statements, opinions and data contained in all publications are solely those of the individual author(s) and contributor(s) and not of MDPI and/or the editor(s). MDPI and/or the editor(s) disclaim responsibility for any injury to people or property resulting from any ideas, methods, instructions or products referred to in the content.

