Abstract
Super-hot acid leach residue is generated during zinc production in the roasting–leaching–electrowinning route, where both primary and secondary resources are used as feed material. This residue may contain valuable metals, such as lead, zinc, and iron, as well as precious metals, such as gold and silver. Four materials, namely super-hot acid leach residue, a residue formed when super-hot acid leach residue is selectively leached for lead with triethylenetetramine, as well as flotation concentrate, and flotation tailings formed in a selective silver flotation process with super-hot acid leach residue as the feed material were characterized to obtain a deeper understanding of possible further metal extraction. These four materials were characterized for chemical composition, mineralogy, and mineral distribution via chemical analyses, X-ray diffraction, and energy-dispersive scanning electron microscopy, respectively. The scanning electron microscope images showed that the materials have large variations in particle size distribution and composition. The results showed that the main lead phase in super-hot acid leach residue is lead sulfate, whereas it is mostly converted to lead sulfide during the selective lead leaching of the super-hot acid leach residue. The remaining lead sulfate is found in a solid solution with barium sulfate. Extracting lead from super-hot acid leach residue via triethylenetetramine leaching resulted in increased concentrations of gold and silver by 41% and 42%, respectively. The identified silver phases in super-hot acid leach residue may correspond to silver sulfide, silver chloride, and elementary silver, where silver sulfide was the most commonly occurring silver phase. After leaching this selectively for lead with triethylenetetramine, similar silver phases were identified, but silver sulfide and silver chloride occurred to a similar extent. Additionally, silver copper sulfide was detected. The presence of different silver phases might pose a challenge to reaching high silver recovery during leaching as the optimum leaching conditions differ somewhat. Furthermore, elemental sulfur, with a tendency to coat gold and silver particle surfaces, which is indicated to be present in all materials except the silver flotation tailings, may hinder metal extraction.
1. Introduction
Zinc (Zn) has a wide variety of uses and is known to be one of the most important metals in the world. Nearly 60% of the Zn produced worldwide is used in the steel industry for galvanizing, and the rest for different purposes, such as metal alloying, cosmetics, electronics, and healthcare [1,2].
Most of the Zn is produced from primary Zn sulfide (ZnS) concentrates, but some secondary sources, such as electric arc furnace dust (EAFD), leaching residues, Zn ash, etc., are also used [3,4]. More than 90% of Zn metal refining is based on hydrometallurgical processes. The most common process route is the roasting–leaching–electrowinning (RLE) process, where both primary and secondary resources are treated [1]. A general flowsheet of the RLE route is shown in Figure 1.
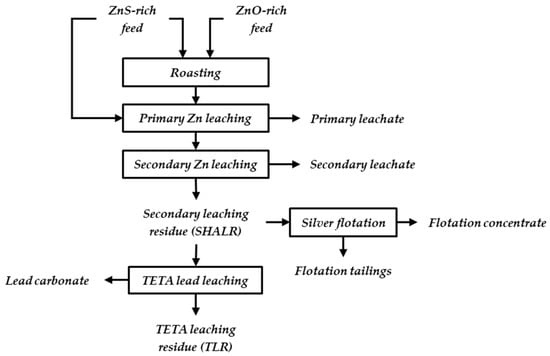
Figure 1.
General flowsheet of Zn production via roasting, leaching, and electrowinning, with two possible treatment methods of the generated leaching residue, SHALR.
ZnS concentrates are converted to Zn oxide (ZnO) via roasting at approximately 900 °C. Primary and secondary ZnO materials with high contents of impurities, such as halides and volatile elements, also benefit from roasting since it will prevent the accumulation of said impurities in the later processing steps, e.g., electrolysis [5]. ZnS concentrates with low contents of these specific impurities can be subjected to direct leaching, thus bypassing the roasting process.
The Zn leaching processes usually consist of two or more steps. The first neutral leaching step is conducted at approximately pH 4 and at 60 °C, which targets dissolving ZnO and avoiding iron (Fe) in the leaching solution. It may be combined with a weak acid leaching step to improve the extraction of Zn from ZnO and also leach Zn-silicates. The secondary leach may start with hot acid leaching (HAL) that can dissolve Zn ferrites, and finally, the material is subjected to a super-hot acid leaching (SHAL) at approximately pH 1 and at 90 °C [5] that hinders jarosite formation, which is important if a lead (Pb)- and silver (Ag)-containing residue is recovered. Even with the added leaching steps, all the Zn cannot be dissolved efficiently, and the remaining super-hot acid leach residue (SHALR) can still contain significant amounts of potentially valuable metals such as Pb, Fe, silicon (Si), calcium (Ca), sulfur (S), Zn, and aluminum (Al) [2,4,6,7], as well as precious metals, such as Ag and gold (Au) [8,9]. Owing to the high industrial focus on sustainability, increasingly strict environmental protection regulations, and the constant increase in the demand for metals, the possibility of recycling residues is constantly being evaluated.
SHALR originates from the treatment of both primary concentrates and secondary resources such as waelz oxide, Zn fuming dust, and EAFD [10] and is therefore inhomogeneous with a large range in particle size and mineralogy. As the generated residue is wet and carries Pb as a stable PbSO4, the cost of dewatering to the transportable moisture limit of 15% is relatively high compared to the value of the by-product and thus the residue is often stockpiled [8,11]. With a nearby Pb smelter, dewatering may not be necessary. The by-product value is influenced by the larger efforts needed in Pb production when using PbSO4, compared to, e.g., Pb oxide (PbO) [8,11].
The valorization of the relatively high Pb contents present as PbSO4 via selective leaching may simultaneously lead to concentration of the Ag. Pb is often one of the major elements in this type of residue [4,12,13,14], and some previous studies have reported the possibility of extracting Pb via alkaline leaching [12]. brine leaching [14,15]. One study on the recovery of Pb by triethylenetetramine (TETA) leaching of high PbSO4-bearing residue formed in the copper (Cu) production [16] showed that TETA leaching can be used as a selective Pb extraction method. Despite enrichment in Ag, different and unknown properties of TETA leach residue (TLR) in comparison to the SHALR may influence the leachability of Ag. Ag can also be enriched in a concentration by applying a selective flotation process on SHALR targeting the Ag phases [11,17,18], as shown in Figure 1.
The present study aims to evaluate the possibility of further processing generated leaching residues from the common RLE route. By applying a novel TETA leaching method to selectively dissolve PbSO4 and recover Pb from SHALR, other elements, including Ag, are being enriched in the TLR, which may possibly improve the economy of the Ag extraction. However, it is indicated that the constitution in TLR may be different than in SHALR due to the alteration of present phases during TETA leaching. To understand if the potential for Ag extraction is higher from SHALR or TLR, these materials, as well as Ag flotation concentrate and Ag flotation tailings, were characterized, i.e., the four different materials: “SHALR”, which is the leaching residue from the super-hot acid leaching step seen in Figure 1; “TLR”, which is the residue from selectively Pb-leached SHALR via TETA leaching; and “flotation concentrate” and “flotation tailings”, which are product and residue from a selective Ag flotation process with SHALR as the feed material.
2. Materials and Methods
2.1. Sample Preparation
The SHALR, flotation concentrate, and flotation tailings used in this work were obtained from a Zn production plant using the RLE route. The TLR was produced by leaching SHALR with TETA, which was carried out on a pilot scale by IMN in Gliwice, Poland. All collected test materials were first split into samples of approximately 800 g via coning and quartering and stored in sealed plastic bags. The samples for characterization were dried, pulverized with a steel rolling pin, and split into samples of approximately 5 g using a riffle splitter.
2.2. Characterization Methods
For the chemical composition, samples microwave digested in aqua regia were analyzed by ICP–OES. The mineralogical composition of the samples was studied by X-ray diffraction (XRD), which was performed using a Malvern Panalytical Empyrean diffractometer applying Cu Kα radiation at 45 kV and 40 mA mounted with a Malvern Panalytical PIXcel3D detector. The XRD was conducted in the 2θ range of 10–90°, with a 0.0260° step size and 421 s scan step time.
Scanning electron microscopy (SEM) with an energy-dispersive X-ray (EDS) detector was used to study mineralogy in detail. Manual and automated scans were performed on polished and carbon-coated epoxy samples. A Gemini Zeiss Merlin microscope (FE-SEM, Carl Zeiss AG, Oberkochen, Germany) with an Oxford EDS- Xmax 80 mm2 detector was used for manual scans. The accelerator voltage was set to 20 keV with a 1 nA emission current. A back-scatter electron (BSE) detector was used for producing SEM images. Automatic scans for quantitative target mineralogy (QanTmin) were conducted on particles in random areas on the entire sample surface within a predefined BSE grayscale using an SEM, Zeiss Sigma 300 VP (Zeiss, Oberkochen, Germany). One EDS analysis was performed in the center of each identified particle, and all point analyses were saved in a separate datasheet for each material. The compositions were analyzed using two Bruker Instrument EDS detectors (Bruker, Billerica, MA, USA) and Zeiss Mineralogic software Ver. 3.0 (Zeiss, Oberkochen, Germany).
3. Results
3.1. Chemical Composition
The chemical analysis was performed on three representative samples of SHALR and TLR; the results are shown in Table 1. The major elements were Pb, Fe, and Zn. The respective Pb, Fe, and Zn contents were 21.9%, 4.4%, and 6.9% in SHALR and 6.8%, 6.6%, and 6.2% in TLR. The chemical analysis showed that extracting Pb from SHALR via TETA leaching resulted in increased concentrations of Au and Ag by 41% and 42%, respectively.

Table 1.
Average concentrations of the major elements in three samples of each SHALR and TLR are given in weight percent.
3.2. X-ray Diffraction
The X-ray diffraction patterns for the SHALR, TLR, flotation tailings, and flotation concentrate are compared in Figure 2. The figure shows the diffraction patterns in the 2θ range of 10–65°, with relative intensities normalized to the respective highest peaks.
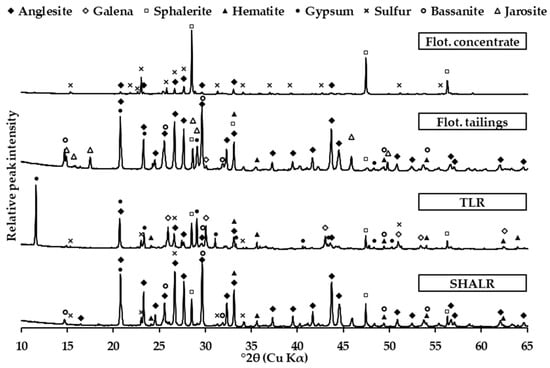
Figure 2.
X-ray diffraction pattern for SHALR, TLR, flotation tailings, and the flotation concentrate. The diffractograms are plotted with relative peak intensities vs. 2θ.
The diffraction pattern of the SHALR sample indicated that the dominant phases are anglesite (PbSO4), sphalerite ([Zn, Fe]S), hematite (Fe2O3), bassanite (CaSO4∙½H2O), and elemental sulfur (S0). PbSO4 had the highest relative peak intensity, and S0 had the lowest.
The crystallography in the TLR sample showed some differences compared to SHALR. The dominant phases were galena (PbS), gypsum (CaSO4∙2H2O), [Zn, Fe]S, Fe2O3, and S0. CaSO4∙2H2O had the highest relative peak intensity, and S0 had the lowest. Some PbSO4 was also present in TLR.
The major difference between SHALR and TLR was the dominant Pb phase, and what phase CaSO4 exists in. The dominant Pb phase in SHALR was PbSO4, whereas in TLR, it was PbS, and CaSO4 was less hydrated in SHALR (CaSO4∙½H2O) compared to in TLR (CaSO4∙2H2O). Both materials had a diffraction pattern matching S0, with clear peaks, which indicates its presence in both materials.
The diffractogram of the flotation concentrate shows clear peaks corresponding to three dominant mineralogical phases: [Zn, Fe]S, S0, and PbS. The matched peaks for S0 were clearly distinguished. The dominant phases in the flotation tailings were PbSO4, CaSO4∙½H2O, jarosite (NaxX1−xFe3(SO4)2(OH)6), and [Zn, Fe]S. Peaks corresponding to S0 could not be matched to the diffractogram.
3.3. Scanning Electron Microscopy
A BSE detector was used to produce the images seen in Figure 3, Figure 4, Figure 5 and Figure 6, where brighter areas represent phases with higher atomic numbers. Particles of different brightness were selected and analyzed in each sample to determine how the different phases are distributed throughout the materials. The point analyses are summarized in Table 2, and each typical composition of elements (in atomic %) was assigned to a possible mineral. The possible minerals that were identified in the manual SEM-EDS analyses and stated in Table 2 are marked in Figure 3, Figure 4, Figure 5 and Figure 6.
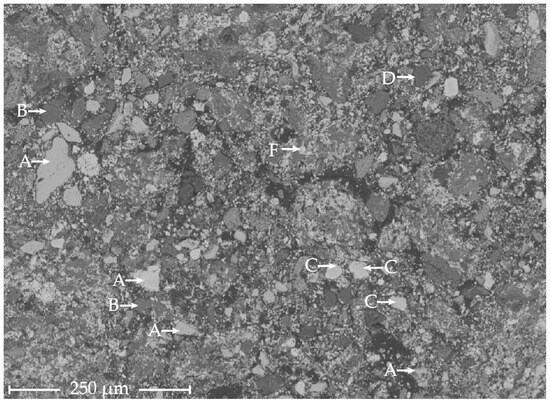
Figure 3.
SHALR sample analyzed by SEM-EDS with five identified phases: A, ZnS/[Zn, Fe]S; B, CaSO4; C, BaSO4; D, SiO2; and F, PbSO4.
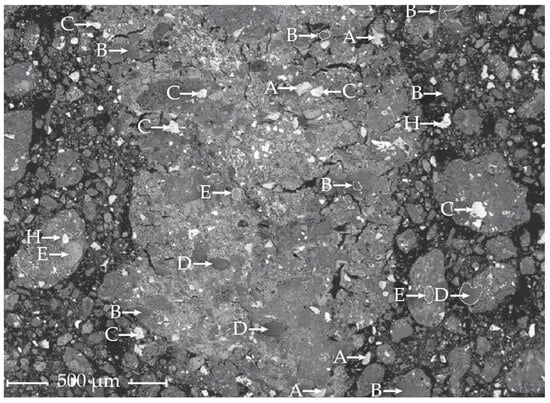
Figure 4.
TLR sample analyzed by SEM-EDS with a few identified phases marked: A, ZnS/(Zn, Fe)S; B, CaSO4; C, BaSO4; D, SiO2; E, FeOX; and H, (Pb, Ba) SO4 solid solution.
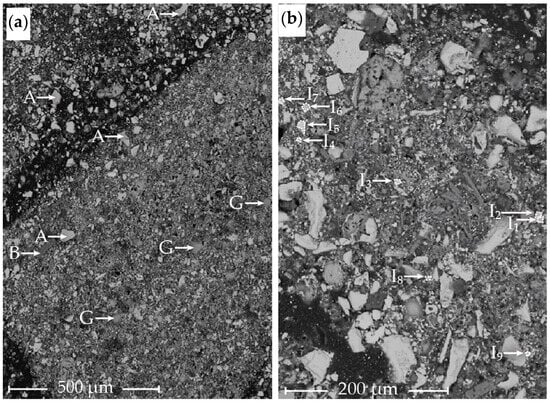
Figure 5.
Flotation concentrate sample analyzed by SEM-EDS. Image (a) shows the general mineralogy of the sample. Image (b) shows a few Ag-rich particles, all with varying compositions. A, ZnS/(Zn, Fe)S; B, CaSO4; G, S0; and I, Ag- and S-rich particles as defined in Table 3.
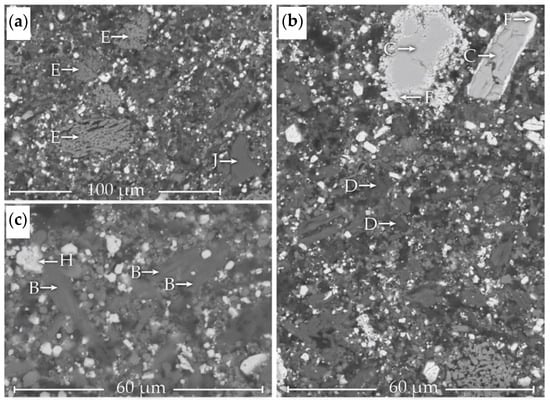
Figure 6.
Three sites of the flotation tailings sample analyzed by SEM-EDS with a few identified phases marked: Image (a) shows the phases E, FeOX and J, KAlSi3O8, image (b) the phases C, BaSO4; D, SiO2 and F, PbSO4; and image (c) the phases B, CaSO4 and H, (Pb, Ba)SO4 solid solution.
Table 2.
The major elements of the possible mineralogical phases marked in the SEM images presented in Section 3. All analyses are given in atomic %.
For the automated mineral scan, all particles within a predefined grayscale at random sites across the entire surface of each sample were analyzed. The particle size area and EDS analysis in atomic % were saved for each analyzed point. The materials were dried before analysis. Therefore, particle size distribution and specific particle size of different phases may not be fully representative of the original moisture materials.
3.3.1. SHALR
Particles of different brightness in the SHALR sample analyzed by point analysis with EDS are marked in Figure 3. The material contained mostly small grains < 10 µm surrounding larger grains ranging from to 10 µm to >100 µm. Five different phases found in the SHALR material could represent the following minerals: A, ZnS/(Zn, Fe)S; B, CaSO4; C, BaSO4; D, SiO2; and F, PbSO4.
An automated scan was set up with the Zeiss Mineralogic software, where 29,194 random particles were analyzed throughout the sample. Apart from the same phases found in the manual SEM-analysis, the automated scan identified molybdenum (Mo), molybdenum dioxide (MoO2), Pb, PbO, barium (Ba), and barium sulfide (BaS). Out of the analyzed points, 17 Ag-rich particles were identified, about 0.058% recurrence. The identified Ag phases could represent Ag sulfide (Ag2S), Ag chloride (AgCl), and metallic Ag (Ag0), where Ag2S was most commonly occurring. S0 was analyzed in 15 points throughout the SHALR sample, which represents a 0.05% recurrence.
3.3.2. TLR
The TLR samples were analyzed similarly to the SHALR samples to gain an understanding of how the composition and mineralogy change during the Pb leaching. Six different phases were identified in the material containing fine particles of various sizes. The different phases marked in Figure 4 possibly represent the following minerals: A, ZnS/(Zn, Fe)S; B, CaSO4; C, BaSO4; D, SiO2; E, FeOX; and H, [Pb, Ba]-sulfate solid solution. The same type of automated scan as for SHALR was conducted on TLR, where 3094 random particles were analyzed. Apart from the manually identified phases, the automated scan found Mo, MoO2, Ba, BaS, Pb, and PbS. Out of the 3094 analyzed points, 29 Ag-rich particles were found, with about a 0.93% recurrence, which was significantly more often than for SHALR. The identified phases were Ag2S, AgCl, Ag0, and Ag/copper sulfide ([Ag, Cu]S), where the most common Ag2S and AgCl occurred about as often. S0 was analyzed in 8 points throughout the TLR sample, which represents a 0.26% recurrence, which was also significantly higher than in SHALR.
3.3.3. Flotation Concentrate
Due to the difficulty in finding Ag phases in SHALR and TLR, a manual SEM scan was performed on a sample of the flotation concentrate to gather information about in which phases Ag may be present in SHALR. Particles marked I1–I9 correspond to different Ag-rich areas with varying composition. In general, the main components in these areas were Ag (19–50 atomic %), S (2–46 atomic %), and Cl (9–26 atomic %), with varying contents of trace elements such as Ba, Pb, bromine (Br), Zn, Fe, and Si. The Ag-to-S ratio in these particles varied significantly from 0.5 to >10. The different phases marked in Figure 5a could represent the following minerals/compounds: A, ZnS/(Zn, Fe)S; B, CaSO4; G, S0. Phases I1–I9 in Figure 5b correspond to a few of the Ag-rich particles with different compositions.
The point analyses of Ag particles found in the flotation concentrate were marked and are presented in Table 3. To be able to categorize the Ag phases, the analyzed particles were assigned to a group (α, β, γ, and δ) depending on the general composition given by the EDS analyses. Phases with significantly different compositions were assigned to different groups, whereas variations in a limited composition range were allowed within the groups, as the chemical composition was based on EDS analyses. The results suggest the presence of at least four different Ag phases, with the β phase being the most common. The chemical composition range of each Ag phase was as follows:
| α | (I1) approximate Ag/S-ratio 1/2, | high S (≈50%), low Cl (<10%) |
| β | (I2–I5, I7, I9) approximate Ag/S-ratio 15/1, | high Cl (>20%), low S (<5%) |
| γ | (I6) approximate Ag/S-ratio 2/1, | high Cl (≈20%), high S (≈20%) |
| δ | (I8) approximate Ag/S-ratio 1/1, | high Zn (≈20%), high S (≈20%) |
Table 3.
The composition of the different Ag phases, which are marked in Figure 5b, based on SEM-EDS point analyses. All analyses are given in atomic %.
3.3.4. Flotation Tailings
The identified phases in the flotation tailings, marked in Figure 6, possibly represent the following minerals/compounds: B, CaSO4; C, BaSO4; D, SiO2; E, FeOX; F, PbSO4; H, Pb-Ba solid solution; and J, KAlSi3O8. BaSO4 and PbSO4 were mostly found together, as seen in Figure 6b. PbSO4 surrounds BaSO4 in Figure 6b, whereas in Figure 6c, there is no visible border between them (H). The FeOX phase has what looks like a “porous” structure, as seen in Figure 6a.
4. Discussion
SHALR and TLR, as two potential sources for Ag extraction, have some major differences in their characteristics. The dominant Pb phase in SHALR is PbSO4, whereas the dominant phase in TLR is PbS. TETA selectively leaches the PbSO4, and Pb2+ is solvated by electron pairs on nitrogen atoms, forming an ionic couple with SO42− [16]. TETA can function as a reductant. This may suggest that the S present as SO42 undergoes a reduction from oxidation state +VI to −II. Since S progresses from a positive to a negative oxidation state, it is not improbable that some S0 are formed. This was also indicated by the automated SEM analysis on SHALR and TLR. S0 was analyzed in 0.26% of the analyzed points in TLR, whereas only 0.05% of the analyzed points in SHALR corresponded to S0.
Since the Pb content in TLR is significantly lowered compared to in SHALR, a concentration of the other metals is expected to become higher if these are not forming complexes with TETA. Zn has, e.g., a greater stability constant than Pb when it comes to complex formation with TETA [19]. Therefore, Zn is co-leached with Pb, which explains why Zn does not follow a similar trend as other elements. If present, similar could be expected for Cu and Ni since these metals also have a greater stability constant for TETA complex formation than Pb.
The BaSO4 phase was identified in both SHALR and TLR via SEM-EDS. However, the XRD results did not indicate that any Ba phase would be present in these materials. The Ba phases that were identified via SEM were sulfates, which could explain the absence of Ba phases in the XRD results. BaSO4 and PbSO4 have quite similar diffraction patterns [20], and they may form a complete solid solution [21]. In the SEM analysis of the flotation tailings, Ba and Pb sulfates were identified in the same particles throughout the sample, with a visible gradient of PbSO4 surrounding a BaSO4 core. This suggests that the Ba sulfate exists as a solid solution with Pb. The automated mineralogical scan also suggested that Ba and Pb also exist in their elemental states. It could be possible that these two elements exist as stable fluorides. Fluorine is too light to be detected in the analysis by the EDS used in the present study, and since the secondary feed materials for Zn production possibly contain fluorine [22,23], the existence of PbF2 and BaF2 is probable. The presence of (Pb, Ba)SO4 in TLR also hints that some of the Pb in SHALR might not be accessible for TETA leaching due to being locked in the solid solution structure with Ba.
Most of the smaller particles were difficult to analyze individually by SEM since the size of the electron beam and the interaction volume would result in an analysis point larger than the particle itself. The interaction volume of the electron beam might have affected the analyses of these particles, resulting in an analysis that is not fully representative of the targeted particle.
During flotation, the hydrophobic phases such as sulfides, elemental sulfur, and all Ag phases are floated and enriched in the concentrate, whereas the sulfates and oxides are directed to the tailings; however, CaSO4 is found in both fractions. The XRD results indicated that there are significant amounts of S0 present in all materials except the flotation tailings. Higher recurrence of S0 in TLR compared to in SHALR, as shown in the automated SEM analyses, indicates that there would be more elemental sulfur present in the TLR. This could be considered a potential problem for further noble metal extraction due to the tendency of elemental sulfur to coat Au and Ag particle surfaces, especially in oxidative leaching [24,25,26,27,28].
Due to the low Ag content in the SHALR and TLR, the results from the manual SEM scan yielded limited information about present Ag phases. The study of the Ag concentrate showed which potential Ag phases could be expected in SHALR and TLR. At least four different Ag phases were identified: Ag2S, AgCl, [Ag, Cu]S, and Ag. Similar phases were identified in SHALR and TLR, with one exception: the [Ag, Cu]S was not detected in SHALR. It is reported in the literature that depending on which Ag phase is dominating, the selected method of Ag extraction can vary. In the case of an AgCl-dominated material, the use of acidic thiourea leaching in a non-oxidizing atmosphere or thiosulfate leaching under mild oxidant and elevated temperatures has proven relatively successful [29]. However, if the system is dominated by Ag2S, thiosulfate leaching with Cu and ammonia as additives [30], as well as oxidative thiourea leaching, has been proven successful [31]. This indicates that the high leachability of Ag might be difficult to achieve if Ag exists in different stable phases, such as Ag2S and AgCl.
5. Conclusions
The presented work outlines the characterization of high Pb and Ag containing Zn leach residue to enable further metal extraction. The characterization study mainly focused on the differences and benefits of treating SHALR via selective Pb leaching before further metal extraction or extracting metals from SHALR.
The characterization study showed that the main phases in SHALR were PbSO4, [Zn, Fe]S, CaSO4, BaSO4, and SiO2. The main phases in TLR were similar to those for SHALR except for the Pb that mostly was found as PbS in the selectively Pb-leached SHALR. The remaining PbSO4 is found in a solid solution with BaSO4.
The Ag phases identified in SHALR were Ag2S, AgCl, and Ag0. The Ag content in TLR was enriched by 42% after Pb leaching, and the identified Ag phases were Ag2S, AgCl, [Ag, Cu]S, and Ag0.
Based on the results, Ag is a suitable target for further extraction from SHALR or TLR. The upgrading of the Ag content by removing the Pb could improve the extraction efficiency, but the indicated larger content of S0 in TLR may have a negative impact on the leaching of Ag. Furthermore, the presence of different Ag phases in both SHALR and TLR might pose a challenge in Ag extraction, as the optimum leaching conditions differ.
Author Contributions
Conceptualization, L.S.Ö. and F.E.; methodology, S.H, L.S.Ö. and F.E.; software, S.H.; validation, S.H., L.S.Ö. and F.E.; formal analysis, S.H.; investigation, S.H.; writing—original draft preparation, S.H.; writing—review and editing, S.H., L.S.Ö. and F.E.; visualization, S.H.; supervision, L.S.Ö. and F.E. All authors have read and agreed to the published version of the manuscript.
Funding
This research received financial support from Boliden through Bolidenpaketet and EIT Raw Materials co-funded by European Union, proposal number 19164.
Data Availability Statement
The original contributions presented in the study are included in the article, further inquiries can be directed to the corresponding author.
Acknowledgments
The authors of this paper are thankful for the financial support from Boliden Mineral AB and the EIT Raw Materials TETALEAD project. Furthermore, the support from the partners in the TETALEAD project is highly appreciated.
Conflicts of Interest
The authors declare no conflicts of interest.
References
- International Zinc Association. Zinc Environmental Profile, Life Cycle Assessment; Meridian Parkway: Durham, NC, USA, 2015. [Google Scholar]
- Sethurajan, M.; Huguenot, D.; Jain, R.; Lens, P.N.L.; Horn, H.A.; Figueiredo, L.H.A.; van Hullebusch, E.D. Leaching and selective zinc recovery from acidic leachates of zinc metallurgical leach residues. J. Hazard. Mater. 2017, 324, 71–82. [Google Scholar] [CrossRef]
- Jha, M.K.; Kumar, V.; Singh, R.J. Review of hydrometallurgical recovery of zinc from industrial wastes. Resour. Conserv. Recycl. 2001, 33, 1. [Google Scholar] [CrossRef]
- Turan, M.D.; Altundoğan, H.S.; Tümen, F. Recovery of zinc and lead from zinc plant residue. Hydrometallurgy 2004, 75, 169–176. [Google Scholar] [CrossRef]
- Sinclair, R. Extractive Metallurgy of Zinc. Min. Eng. 2005, 57. Available online: https://app.knovel.com/kn/resources/kpEMZ00001/toc (accessed on 17 December 2023).
- Jiang, G.; Peng, B.; Liang, Y.; Chai, L.; Wang, Q.; Li, Q.; Hu, M. Recovery of valuable metals from zinc leaching residue by sulfate roasting and water leaching. Trans. Nonferrous Met. Soc. China 2017, 27, 1180. [Google Scholar] [CrossRef]
- Yan, H.; Chai, L.; Peng, B.; Li, M.; Peng, N.; Hou, D. A novel method to recover zinc and iron from zinc leaching residue. Miner. Eng. 2013, 55, 103–110. [Google Scholar] [CrossRef]
- Yu, X.; Guo, X.; Zhang, Y.; Zhang, L. Recovery of zinc, lead and silver from zinc leaching residue. In Proceedings of the 2011 International Conference on Materials for Renewable Energy & Environment, Shanghai, China, 20–22 May 2011; pp. 1104–1108. [Google Scholar]
- Ju, S.; Zhang, Y.; Zhang, Y.; Xue, P.; Wang, Y. Clean hydrometallurgical route to recover zinc, silver, lead, copper, cadmium and iron from hazardous jarosite residues produced during zinc hydrometallurgy. J. Hazard. Mater. 2011, 192, 554–558. [Google Scholar] [CrossRef] [PubMed]
- Oustadakis, P.; Tsakiridis, P.E.; Katsiapi, A.; Agatzini-Leonardou, S. Hydrometallurgical process for zinc recovery from electric arc furnace dust (EAFD). J. Hazard. Mater. 2010, 179, 1–7. [Google Scholar] [CrossRef]
- Zheng, Y.; Lv, J.; Liu, W.; Qin, W.; Wen, S. An innovative technology for recovery of zinc, lead and silver from zinc leaching residue. Physicochem. Probl. Miner. Process 2016, 52, 943–954. [Google Scholar] [CrossRef]
- Şahin, M.; Erdem, M. Cleaning of high lead-bearing zinc leaching residue by recovery of lead with alkaline leaching. Hydrometallurgy 2015, 153, 170–178. [Google Scholar] [CrossRef]
- Çoruh, S.; Ergun, O.N. Use of fly ash, phosphogypsum and red mud as a liner material for the disposal of hazardous zinc leach residue waste. J. Hazard. Mater. 2010, 173, 468–473. [Google Scholar] [CrossRef] [PubMed]
- Ruşen, A.; Sunkar, A.S.; Topkaya, Y.A. Zinc and lead extraction from Çinkur leach residues by using hydrometallurgical method. Hydrometallurgy 2008, 93, 45–50. [Google Scholar] [CrossRef]
- Raghavan, R.; Mohanan, P.K.; Patnaik, S.C. Innovative processing technique to produce zinc concentrate from zinc leach residue with simultaneous recovery of lead and silver. Hydrometallurgy 1998, 48, 225–237. [Google Scholar] [CrossRef]
- Ciszewski, M.; Chmielarz, A.; Szołomicki, Z.; Drzazga, M.; Leszczyńska-Sejda, K. Lead Recovery from Solid Residues of Copper Industry Using Triethylenetetramine Solution. Minerals 2021, 11, 546. [Google Scholar] [CrossRef]
- Han, H.; Sun, W.; Hu, Y.; Jia, B.; Tang, H. Anglesite and silver recovery from jarosite residues through roasting and sulfidization-flotation in zinc hydrometallurgy. J. Hazard. Mater. 2014, 278, 49–54. [Google Scholar] [CrossRef] [PubMed]
- Chen, T.T.; Dutrizac, J.E. Mineralogical characterization of silver flotation concentrates made from zinc neutral leach residues. Metall. Trans. B 1988, 19, 803–817. [Google Scholar] [CrossRef]
- Graulis, S.; Daškevi, A.; Merkys, A.; Chateigner, D.; Lutterotti, L.; Quirós, M.; Serebryanaya, N.R.; Moeck, P.; Downs, R.T.; Le Bail, A. Crystallography Open Database (COD): An open-access collection of crystal structures and platform for world-wide collaboration. Nucleic Acids Res. 2012, 40, D420–D427. [Google Scholar] [CrossRef]
- Lee, J.; Wang, H.; Iizuka, Y.; Yu, S. Crystal structure and Raman spectral studies of BaSO4—PbSO4 solid solution. Z. Für Krist. 2005, 220, 1–9. [Google Scholar] [CrossRef]
- Antuñano, N.; Cambra, J.F.; Arias, P.L. Fluoride removal from Double Leached Waelz Oxide leach solutions as alternative feeds to Zinc Calcine leaching liquors in the electrolytic zinc production process. Hydrometallurgy 2016, 161, 65–70. [Google Scholar] [CrossRef]
- Sar, S.; Sundqvist Ökvist, L.; Sparrman, T.; Engström, F.; Samuelsson, C. Characterization of Double Leached Waelz Oxide for Identification of Fluoride Mineral. Metals 2019, 9, 361. [Google Scholar] [CrossRef]
- Li, J.; Miller, J.D. A review of gold leaching in acid thiourea solutions. Miner. Process. Extr. Metall. Rev. 2006, 27, 177–214. [Google Scholar] [CrossRef]
- Feng, D.; van Deventer, J.S.J. Thiosulphate leaching of gold in the presence of ethylenediaminetetraacetic acid (EDTA). Miner. Eng. 2010, 23, 143–150. [Google Scholar] [CrossRef]
- Schulze, R.G. New aspects in thiourea leaching of precious metals. JOM 1984, 36, 62–65. [Google Scholar] [CrossRef]
- Tong, L.; Dreisinger, D. The adsorption of sulfur dispersing agents on sulfur and nickel sulfide concentrate surfaces. Miner. Eng. 2009, 22, 445–450. [Google Scholar] [CrossRef]
- Celik, H. Extraction of gold and silver from a Turkish gold ore through thiourea leaching. Miner. Metall. Process. 2004, 21, 144–148. [Google Scholar] [CrossRef]
- Cheng, K.L. EDTA as Masking Agent in Selective Spectrophotometric Determination of Copper with Triethylenetetramine. An Interpretation of Masking. Anal. Chem. 1962, 34, 1392–1396. [Google Scholar] [CrossRef]
- Murthy, D.S.R.; Prasad, P.M. Leaching of gold and silver from Miller Process dross through non-cyanide leachants. Hydrometallurgy 1996, 42, 27–33. [Google Scholar] [CrossRef]
- Deutsch, J.L.; Dreisinger, D.B. Silver sulfide leaching with thiosulfate in the presence of additives Part I: Copper–ammonia leaching. Hydrometallurgy 2013, 137, 156–164. [Google Scholar] [CrossRef]
- Bruckard, W.J.; Sparrow, G.J.; Woodcock, J.T. Gold and silver extraction from Hellyer lead-zinc flotation middlings using pressure oxidation and thiourea leaching. Hydrometallurgy 1993, 33, 17–41. [Google Scholar] [CrossRef]
Disclaimer/Publisher’s Note: The statements, opinions and data contained in all publications are solely those of the individual author(s) and contributor(s) and not of MDPI and/or the editor(s). MDPI and/or the editor(s) disclaim responsibility for any injury to people or property resulting from any ideas, methods, instructions or products referred to in the content. |
© 2024 by the authors. Licensee MDPI, Basel, Switzerland. This article is an open access article distributed under the terms and conditions of the Creative Commons Attribution (CC BY) license (https://creativecommons.org/licenses/by/4.0/).