Abstract
The development of high-entropy alloys has been hampered by the challenge of effectively and verifiably predicting phases using predictive methods for functional design. This study validates remarkable phase prediction capability in complex multicomponent alloys by microstructurally predicting two novel high-entropy alloys in the FCC + BCC and FCC + BCC + IM systems using a novel analytical method based on valence electron concentration (VEC). The results are compared with machine learning, CALPHAD, and experimental data. The key findings highlight the high predictive accuracy of the analytical method and its strong correlation with more intricate prediction methods such as random forest machine learning and CALPHAD. Furthermore, the experimental results validate the predictions with a range of techniques, including SEM-BSE, EDS, elemental mapping, XRD, microhardness, and nanohardness measurements. This study reveals that the addition of Nb enhances the formation of the sigma (σ) intermetallic phase, resulting in increased alloy strength, as demonstrated by microhardness and nanohardness measurements. Lastly, the overlapping VEC ranges in high-entropy alloys are identified as potential indicators of phase transitions at elevated temperatures.
1. Introduction
The microstructural investigation of high-entropy alloys and complex concentrated alloys is a recent and evolving research topic due to the fascinating formation of microstructures, unusual phase formations, and the great complexity of predicting the type of solid solution structure formation (FCC, BCC, or FCC + BCC). Since these solid solutions are responsible for macroscopic strength, ductility, corrosion resistance, creep resistance, cryogenic, and high-temperature properties, it is necessary to accurately control and predict their formation to achieve a functionally designed alloy. In conventional alloys [1,2,3,4,5,6,7,8], efficient design has been performed using energy minimization systems such as Thermo-Calc based on the CALPHAD method [9,10,11,12]. However, for designing functional alloys, the prediction of microstructures remains a challenge, particularly in high-entropy alloys and complex concentrated alloys [13,14,15,16].
Some of the efforts to address this significant challenge in high-entropy alloys include the evaluation of empirical parameters [17,18,19,20,21], the development of prediction software [22], the generation of databases in CALPHAD prediction software [23,24,25,26,27,28,29], and the implementation of artificial intelligence models [16,30,31,32,33,34,35,36] to assess phase stability. In the latter category, Oñate et al. [18,31] approached the multicategorical prediction of high-entropy alloys using empirical parameters and supervised learning, identifying that the most relevant factors in phase prediction for high-entropy or complex concentrated alloys are the valence electron concentration (VEC) and atomic packing factor. However, intermetallic phases resulting from category overlaps indicate that further validation of the VEC stability ranges presented in [18] is required.
However, models predicting solid solution phases in HEAs are often imprecise on the presence of intermetallics (IM). Indeed, Tsai et al. [37] indicate that most parametric models predicting simple solid solutions (SSSs) are based on two fundamental concepts: a near-zero mixing enthalpy and a small atomic size difference. However, inaccuracies with these models often arise because HEAs that are predicted as SSSs contain IM phases. The reason for such misprediction is that some IM, such as the σ and μ phases, can simultaneously have near-zero enthalpy of mixing and small atomic size differences. Therefore, specific models focusing on IM formation have been developed.
In this respect, parametric approaches have been proposed, such as that of X J Wang and coworkers, which use three criteria based on the difference in atomic radius, the valence electron concentration (VEC), and the paired sigma-forming element (PSFE) to predict sigma phase formation in HEAs [38]. Regarding lave phase formation, Yurchenko et al. [39] predicted its occurrence based on the atomic size mismatch, δr, and the Allen electronegativity difference, ΔχAllen, parameters. However, Ren et al. [40] found that alloying elements with large atom radius differences and negative enthalpy of mixing with other constituents will promote IM phase formation. In addition, a relatively simple electronic structure-based approach was set by Christofidou et al. [41], which provided much more accurate predictions of the observed σ phase formation within HEA. Nevertheless, such a phase composition approach is more suitable for predicting the sigma phase occurrence within FCC alloys.
Machine learning (ML) algorithms have also been considered to predict IM formation. Huang et al. [32] developed trained artificial neuronal network (ANN) models to achieve accurate predictions within the phases of new HEAs. Zhang et al. [42] developed a ML model based on support vector machine (SVM) combined with kernel principal component analysis (KPCA) to better distinguish different phases in HEA, including IM. In the study [43], six ML algorithms were studied, and the phase prediction was verified by designing a new set of eutectic medium-entropy alloys. ANN appeared to be the best ML algorithm to predict phases within the new alloys similar to Thermo-Calc® calculations. Nevertheless, the later study confirmed that new parameters need to be considered for better prediction using any model. Therefore, the combination of microstructural characterization techniques with predictive approaches remains an interesting way of confirming the presence of phases, particularly when developing new alloys. Characterization techniques such as X-ray diffraction, scanning electron microscopy, and transmission electron microscopy are commonly used to confirm the typically present phases. Nevertheless, these techniques can be augmented with micromechanical and nanomechanical analyses to deduce and interpret information pertaining to deformation processes, stiffness, yielding, strength, plastic energy, dislocation interaction within the phase, and strengthening due to precipitation and solid solutions [8,18,44,45,46]. Rojas et al. [46] demonstrated that nanoindentation-induced loads identify anisotropic elasticity and nonlinear plasticity of the alpha phase and alpha-beta interface, allowing accurate calibration of deformation models for macroscopic non-uniform mechanical response simulations. However, phase stability and characterization of the studied Ti64 alloy were missing.
Precipitation strengthening also contributes to enhancing mechanical response in alloys. Nevertheless, intermetallic phases such as the sigma phase are commonly considered undesired in alloys due to their potential to embrittle the material and induce corrosion susceptibility through the formation of galvanic cells [47]. However, it has been demonstrated that this sensitization can be mitigated in duplex alloys containing the sigma phase by controlling the balance of austenite and ferrite, thereby significantly improving mechanical strength with minimal loss in ductility [48]. Similarly, it has been observed in high-entropy alloys that the sigma phase does not impair elongation and efficiently reinforces the alloy, presenting an intriguing avenue for research in novel high-entropy compositional systems [18,49].
In this research, the main objective is to examine the microstructure and phase stability of two novel high-entropy alloys designed using strategies proposed in previous studies [18,31]. Regarding niobium addition, Nb is an element with both a large atomic radius and a negative mixing enthalpy that promotes the formation of IM phases at the expense of solid solution (SS) phases [40,50,51]. Moreover, at the same time, such an addition can promote the strengthening of the interface between FCC and BCC. Therefore, Nb content can serve as a tool for alloying design within HEA. To achieve this objective, we use CALPHAD for phase diagram computation and phase stability validation from the proposed methods. Furthermore, we conduct experimental validation using scanning electron microscopy (SEM), energy-dispersive X-ray spectroscopy (EDS), X-ray diffraction (XRD) corroborated with Rietveld refinement, and microscale and submicroscale mechanical tests involving microindentation and nanoindentation.
2. Methodology
Two high-entropy alloys were designed with the main objective of analyzing the predictive capability of the proposed parametric analytical model in [18] by adjusting the composition to control the VEC and atomic packing factor, resulting in a mixed solid solution of FCC + BCC and an FCC + BCC + IM structure. This approach aims to design an alloy with the potential for balanced strength and ductility by incorporating austenite and ferrite phases in the matrix. A random forest model, trained with 2434 data points, was used. The data were categorized as follows: FCC (496), BCC (617), BCC + FCC (197), FCC + IM (277), BCC + IM (205), FCC + BCC + IM (76), IM (368), and AM (198). The model was configured with 2000 trees, randomly selecting 1 to 3 variables for each tree. The minimum node size varied from 5 to 50 with an increment of 5, allowing for capturing the complexity of relationships in the dataset and reducing biases, following the methodology presented in [31]. The descriptors ΔHmix, Δχ, and VEC were utilized, as described in the study. Additionally, CALPHAD simulations using the TCFE8 database were used to generate phase diagrams, identifying the stability of the phases present under atmospheric pressure through free energy minimization. The alloy design was conducted in atomic percent (at.%); however, for improved result reproducibility, the chemical composition resulting from this study is reported in weight percent (wt.%). Based on this, the composition used for the parametric design, utilizing the VEC and packing factor-based prediction method proposed in [18], is presented in Table 1.

Table 1.
Chemical composition (wt.%) of the design for the investigated high-entropy alloys.
The specimens were manufactured using powder metallurgy with high-purity (99.9%) Fe, Cr, Mn, Cu, Ni, and Nb, with a particle size in the range of 3 to 20 μm. For each composition, the powder mixtures were loaded into stainless steel vials and milled for 2 h in an Across International PQ-N04 high-energy planetary ball mill under an atmosphere of ultra-pure argon. The rotation speed was set at 200 rpm, with a 15-minute on/off cycle during milling to prevent system overheating. A ball-to-powder weight ratio of 10:1 was used for this process, with 1% by weight of stearic acid acting as a process control agent.
To produce the sintered samples, the milled powders were compacted at 350 MPa at room temperature using a hardened steel die with an inner diameter of 13 mm. Subsequently, they were placed in a Carbolite FHA 13/50/200 furnace and sintered at 900 °C for 2 h under an atmosphere of ultra-pure argon. During the sintering process, a heating rate of 5 °C/min was applied. Finally, the samples were cooled to room temperature.
For sample preparation, manual grinding was performed using silicon carbide sandpapers with mesh sizes ranging from 240 to 1200, followed by polishing with a 0.05 µm alumina suspension. The samples were immersed in Keller’s reagent for 6 s to chemically etch their microstructure.
Microstructural characterization was performed using TESCAN VEGA 3 EASYPROBE SBU and JEOL JXA 8600 M scanning electron microscopes (SEMs). SEM images were analyzed using secondary electrons and backscattered electrons with an acceleration voltage of 20 kV and a working distance ranging from 10 to 12 mm. Postprocessing of microscopy images was carried out using ImageJ software with image calibration. Elemental analysis used energy-dispersive X-ray spectroscopy (EDS) to identify chemically present phases and precipitates. Additionally, X-ray diffraction (XRD) was utilized for phase identification using a copper filter, an acceleration voltage of 40 kV, and a working current of 20 mA. The measurement range was set between 30° and 90° with an interval of 0.02° and a scanning speed of 1.2°/min. The XRD results were processed using HighScore Plus software and further analyzed using MAUD software with Rietveld refinement. Reliability parameters for refinement included a global intensity scale factor (<5%) and weighted R-factor (<10%). The lattice parameter was obtained using Equation (1).
Microhardness tests were conducted using a Leco instrument with a 300 g load and a Vickers indenter, with a dwell time of 10 s between the indenter and the sample. Four indentations were performed per zone. The results were reported as the average of the indentations in each analysis zone. Nanoindentation tests were conducted using a trapezoidal load function under load control with a maximum load of 5000 µN, 30 s dwell and unload times, and a data acquisition rate of 1000 points/s.
3. Results and Discussion
3.1. Computational Simulation
The results of the modeling with empirical parameters using the VEC analytical method previously presented in [18] and obtained for the HEA1 and HEA2 alloys described in Table 1 compositionally can be visualized in Table 2. It can be observed that the VEC stability range indicates a stable FCC + BCC structure in the alloy, and the atomic packing factor γp does not indicate the presence of intermetallics. Doping the alloy with 2% by weight of Nb, a slight reduction in VEC is observed, being within the compositional range of the FCC + BCC, FCC + BCC + IM, and FCC + IM structures. Oñate et al. [18] discussed that the evaluated VEC concentration zone is not straightforward due to the overlapping stability ranges. Therefore, the efficient way to evaluate the forming phases is through the atomic packing factor. In this case, the atomic packing factor is greater than 1.175, indicating the presence of an intermetallic phase. This suggests that the structure predicted using the analytical method could be FCC + BCC + IM or FCC + IM. However, being within the overlapping range limit, it is likely that both phases are stable within a temperature range. For this reason, Guo et al. [52] expanded the stability range of FCC structures to VEC > 8. In this particular case, the analysis of the VEC results can be translated as FCC + BCC stability for the HEA1 alloy and a high-temperature structural stability of FCC + BCC + IM for the HEA2 alloy. However, it is highly probable that, within a higher temperature range, a phase transformation from FCC + BCC + IM to FCC + IM will occur.
Table 2.
Phase prediction based on analytical an method with empirical Hume–Rothery parameters adjusted to high-entropy alloys.
The results obtained using the analytical method in Table 2 are corroborated with supervised learning using the random forest model. The machine learning results indicate that for the HEA1 alloy, the stable structure is a dual FCC + BCC solid solution, which aligns with the analytical model. In HEA2, the random forest model indicates that there are two structures with a similar probability of formation, which are a dual FCC + BCC solid solution and an FCC solid solution plus an intermetallic compound, disregarding the presence of FCC + BCC + IM within the overlapping range. This confirms and validates the necessity of the atomic packing factor as a key descriptor in machine learning methods to effectively predict phase stability in overlapping ranges, as presented and discussed in [18] and validated in [31]. Furthermore, when comparing the prediction method using machine learning with the analytical method based on VEC, a good correlation between the two methods is observed (Figure 1).
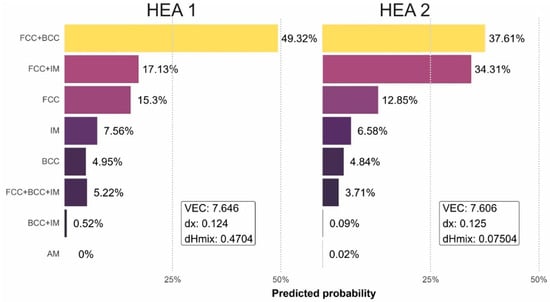
Figure 1.
Supervised learning results using the random forest model on the investigated high-entropy alloys.
The results of the analytical method and machine learning were contrasted with CALPHAD simulation, allowing for the visualization of phase stability for each alloy (Figure 2). When observing the diagram in the undoped Nb zone, a wide stable range of FCC + BCC + FCC2 can be observed, indicating the presence of primarily austenite and ferrite. Additionally, a segregated austenitic phase rich in copper is observed, which segregates due to the enthalpy difference with the rest of the alloying elements, achieving stability in the form of copper-rich precipitates or islands of copper. Furthermore, a wider range of intermetallic phase stability is found for the alloy HEA2, including the γ″ phase (Ni3Nb), Laves C14 phase (Ni2Nb), and σ phase (FeCr). This results in a greater driving force for intermetallic formation over a wide temperature range when increasing the Nb content in the alloy, consistent with the findings obtained using the machine learning method and the analytical method based on VEC with the atomic packing factor. Furthermore, it is possible to observe that for the HEA2 alloy, an FCC + BCC + IM stable structure exists above 800 °C, while below 800 °C, an FCC + IM structure is obtained, supporting the previous discussion and validating the VEC analytical method and machine learning results. However, although all three simulation methods agree and have coherent results, microstructural validation presented in Section 3 is required to effectively describe phase stability in these compositionally complex alloys.
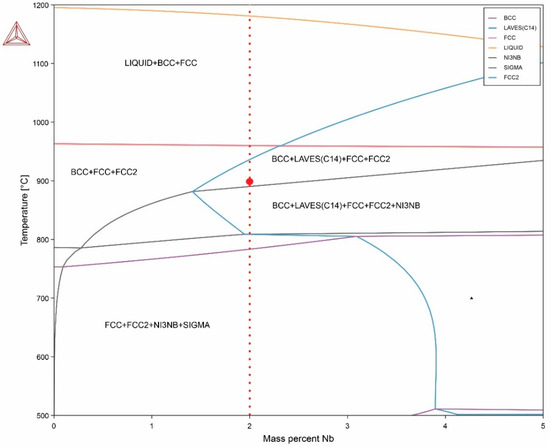
Figure 2.
Quasi-binary phase diagram with variable Nb element and Fe balance of investigated high-entropy alloys.
3.2. Microstructural Characterization
Figure 3 shows the results obtained using SEM in the HEA1 alloy. Figure 3a demonstrates the presence of a predominantly austenitic matrix with ferrite grains. The volumetric fraction of phases obtained using ImageJ indicates that the proportion is approximately 56% austenite and 41% ferrite, considering the difference as phases rich in copper and porosities.
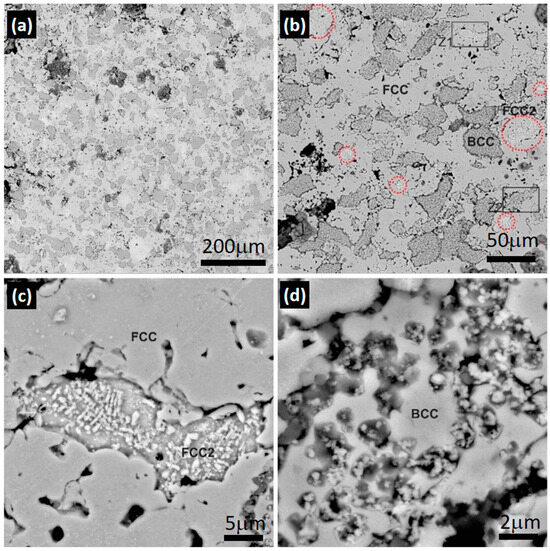
Figure 3.
Scanning electron spectroscopy images of the HEA1 alloy: (a) 300×, (b) 1000×, (c) 8000× zone 1 (Z1) in (b), and (d) x zone 2 (Z2) in (b).
In Figure 3b, the copper-rich austenitic phase (FCC2) can be observed, appearing as islands highlighted with a red circle for better visualization. The detail of the FCC2 phase is visible in Figure 3c, which distinctly represents the characteristic segregation of the FCC2 phase. Additionally, precipitates of Cu are present on the FCC2 phase, which are easily identifiable with the backscattered electron analysis and the higher atomic weight of Cu compared with the other elements in the compositional system being analyzed for the HEA1 alloy. This also indicates that the FCC2 phase entered into a solid solution with another chemical element, reducing the overall atomic weight of the phase accordingly. Figure 3d represents the BCC phase, where the apparent presence of Cu in the form of particles, similar to the FCC2 phase, and the presence of Cr particles can be observed.
The SEM results were complemented with EDS analysis. The findings indicated that the BCC phase is rich in CrFeMn with the presence of Cu (Figure 4b), corroborating the particles observed in Figure 3d. The results obtained in Figure 4c indicated that the matrix consists of a solid solution of all elements with a low concentration of Cr, forming an austenitic structure. Figure 4d shows the results for the FCC2 austenitic phase, revealing it to be primarily a solid solution of CuMn. The details obtained using EDS analysis in the HEA1 alloy can be observed in Table 3.
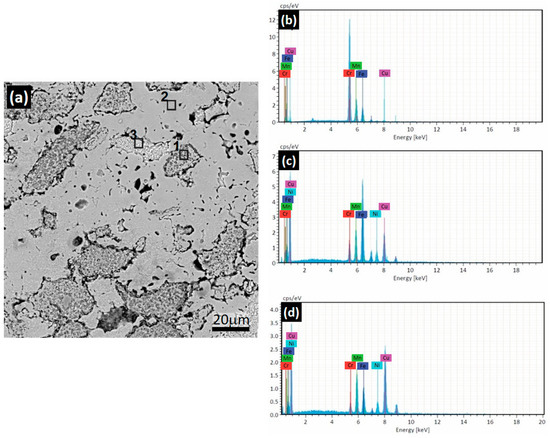
Figure 4.
SEM-EDS results for the HEA1 alloy. (a) SEM at 2000×. EDS spectra for (b) zone 1, (c) zone 2, and (d) zone 3 highlighted on Figure 4a.
Table 3.
Summary of SEM-EDS results for alloy HEA1 (wt.%).
No presence of the σ phase was found in the sample, which is expected to be present at the edges or interior of the BCC phase due to the preferential diffusion of FeCr. This is consistent with the analytical results since the atomic packing factor is below the critical value of 1.175, indicating the possible stability of intermetallics, and the valence electron concentration is above the upper limit for intermetallic stabilization in a biphasic alloy, as reported in [18].
Figure 5 presents the results of the HEA2 alloy. The use of SEM-BSE in this case allowed for easy identification of Nb due to its higher atomic weight compared with the other elements in the alloy. In Figure 5a, it can be observed that the alloy is primarily composed of an austenitic matrix with ferrite grains, which appear darker in color due to the high concentration of Cr observed in Figure 4b. Figure 5b shows that the ferritic phase contains particles of Cr and Cu within it, similar to the HEA1 alloy. The Nb-rich phase is highlighted with a segmented black circle for better detail and will be referred to as Nb-RP (Nb-rich phase) in the EDS results. In Figure 5c, the CuMn-rich FCC2 phase is clearly visible, along with small cellular-shaped precipitates inside it and at the grain boundary of the ferrite. For better identification and clarity, a magnification of Zone 1 (Z1) in Figure 5c was performed. The results obtained from the magnification of this zone can be seen in Figure 5d, revealing the characteristic morphology of the σ phase. This phase forms as a decomposition and transformation process within the ferritic phase, which is why it is located inside the ferrite and at its grain boundary [53,54].
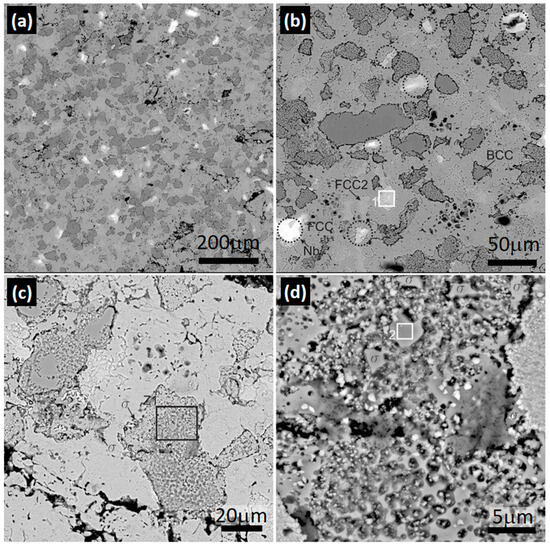
Figure 5.
Scanning electron spectroscopy images on HEA2 alloy. Magnification of (a) 300×, (b) 1000×, and (c) 2000× of zones highlighted on (b); (d) 8000× of zone 1 (Z1) marked in (c).
The results obtained using SEM-EDS in the Nb-rich phase and the σ phase observed in Zone 1 of Figure 5b and Zone 2 of Figure 5d, respectively, can be visualized in Table 4.
Table 4.
Summary of SEM-EDS results to HEA2 alloy (wt.%).
Figure 6 presents the SEM-EDS elemental mapping results of the HEA1 alloy. In Figure 6a, the observed phases include the austenitic matrix, the FCC2 austenitic phase, and the ferritic phase. Figure 6b highlights the presence of Cr in the HEA1 alloy, primarily concentrated in the BCC phase, forming a solid solution primarily with Mn (Figure 6f). Similarly, in Figure 6c, the Cu-rich FCC2 phase is observed in the form of islands, resulting from segregation driven by enthalpy differences with the other elements in the alloy system. Additionally, CuMn precipitates are observed in both the austenitic matrix and the ferritic phase (Figure 6c,f). Conversely, the austenitic matrix is primarily constituted by a solid solution of Fe and Ni (Figure 6d,e). Based on the previous analysis, it is expected that for the formation of the σ phase observed in Figure 5d in the HEA2 alloy, Fe diffuses from the FCC phase to the BCC phase, leading to nucleation and growth at the grain boundary as the primary diffusion pathway, favored by interfacial energy.
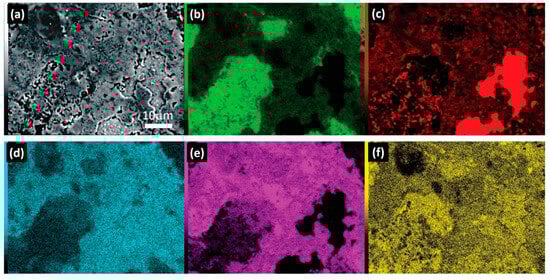
Figure 6.
SEM-EDS elemental mapping HEA1: (a) Scanning electron microscopy image, and elemental mapping of (b) Cr, (c) Cu, (d) Ni, (e) Fe, and (f) Mn.
In Figure 7, the results obtained from SEM-EDS elemental mapping for the HEA2 alloy are presented. In Figure 7a, the main presence of the ferritic phase within the austenitic matrix can be observed. Additionally, at the ferrite–austenite interface, the σ phase, an intermetallic compound identified morphologically and semiquantitatively in Figure 5c and Table 4, is predominantly observed.
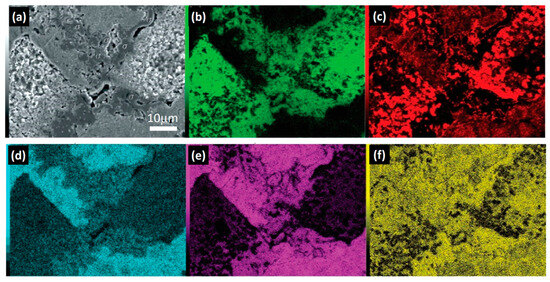
Figure 7.
SEM-EDS elemental mapping HEA2: (a) scanning electron microscopy image of HEA2 with the presence of the σ phase; elemental mapping of (b) Cr, (c) Cu, (d) Ni, (e) Fe, and (f) Mn.
As discussed previously in Figure 6, the ferritic phase is characterized by high Cr content and low Fe, Ni, and Cu content, resulting in a significant solid solution only with Mn. However, the σ phase is typically formed in the present compositional system through Cr and Fe in an AB-type polymorph [55,56,57,58]. Therefore, for its formation, diffusion of Fe from the austenitic phase and Cr from the ferritic phase to low interfacial energy zones such as the grain boundary is required, favoring its formation and growth. This is supported by the findings in Figure 7b,e, which demonstrate that the regions containing the cellular structure phase have a similar Fe and Cr content, and as it approaches the austenitic interface, the Cr concentration decreases significantly, as does the Fe concentration near the ferritic interface.
When comparing the previously obtained results, a strong correlation is found with the results presented with the three prediction methods. The VEC analytical method and CALPHAD were able to predict the stability of the phases present in the HEA1 and HEA2 alloys with great accuracy. The random forest method disregarded the presence of FCC + BCC + IM for the HEA2 alloy based on the overlapping range, considering the FCC + IM phase as the most probable weighted result. This is not an actual prediction error since, as shown in Figure 2, the HEA2 alloy has its primary stability range below 800 °C, consisting of an FCC + FCC2 + IM structure.
Furthermore, when comparing the microstructural results in similar composition systems such as FeCrNiMnCu, it is found that these alloys are biphasic, stabilizing both austenite and ferrite. This has been demonstrated by several studies [59,60,61,62].
In Figure 8, the X-ray diffraction patterns for both alloys are shown. In Figure 8a, the characteristic peaks of austenite and ferrite can be observed, which are present in both alloys, with a higher proportion of austenite due to the registered intensity. Additionally, a characteristic peak of Cu is observed in both samples, corresponding to the segregated FCC2 phase that was represented in the phase diagram and observed in the SEM images. The Cr particles observed in the ferritic zone in SEM can also be seen in the X-ray diffraction results for both alloys. As observed in Figure 5, Nb segregates without forming a solid solution with Ni to generate the Laves phase. For this reason, no characteristic peaks related to the hexagonal close-packed structure phase are observed. The primary reason could be associated with kinetic mechanisms that facilitate optimal diffusion between Ni and Nb to form the characteristic polymorphic AB2 or A2B phase of the Laves structure. This issue could be addressed by conducting an extended heat treatment at the Laves phase stabilization temperature to ensure stability. Consequently, two hours of sintering at 900 °C was insufficient to enable the formation of the γ″ (Ni3Nb) and Laves phases.
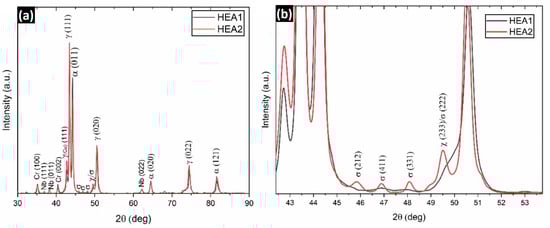
Figure 8.
X-ray diffraction patterns of the (a) HEA1 and HEA2 alloys. (b) Magnification of the pattern at the characteristic diffraction angles of the phase σ.
On the other hand, it is possible to observe that only the HEA2 alloy exhibits the σ phase (Figure 8b), indicating that the driving force for this phase is sufficiently high to form during the cooling process, as its thermodynamic stability lies below 800 °C. The presence of the χ phase (CrFeMn) was also found, which is reported to be rare in high-entropy alloys due to its metastable or transitional nature [63]. This phase represents a transition during the transformation to the σ phase, suggesting that complete stability of the phase has not yet been achieved. This is reasonable considering the transformation occurred during a cooling process rather than at a constant temperature. The σ phase primarily forms from the ferritic phase, as observed by the decrease in the ferrite peak intensity in the (011) plane for the HEA2 alloy. This explains the transition to FCC + IM at 750 °C in the CALPHAD simulation (Figure 2) and the predictions provided with the VEC-based analytical method and machine learning using random forest used in this study. Thus, this research extensively and rigorously validates the efficiency of the VEC-based analytical method for designing high-entropy alloys or complex concentrated alloys, with a focus on phase prediction for functional applications in areas such as structural, aerospace, or energy fields. A summary of the X-ray diffraction results can be seen in Table 5.
Table 5.
Summary of results obtained using X-ray diffraction and the Rietveld method.
3.3. Micro/Nano-Mechanical Response
3.3.1. Microhardness
Microhardness tests were conducted at the center of each phase to minimize interaction with surrounding phases. Additionally, due to the challenge of identifying Nb-rich phases using optical microscopy, it was not included in the test results and falls within the potential deviation ranges of each phase tested.
The microhardness results depicted in Figure 9 showed that the HEA2 alloy exhibits higher hardness, primarily in the ferritic and austenitic zones. However, the error in both phases also increased. This can be explained by an increase in solid solution strengthening in the austenitic matrix. However, as observed with SEM-BSE in Figure 5, this strengthening occurred in certain areas of the austenitic matrix and sometimes adjacent to the ferritic zones, resulting in increased hardness measurements and greater deviation in the results. This result is also in good agreement with the work carried out on sintered CoCrFeNiAlxTiy HEA by Erdogan et al. [51], who ascribed high standard deviations in the average Vickers hardness to the different hardness of the phases within their alloys.
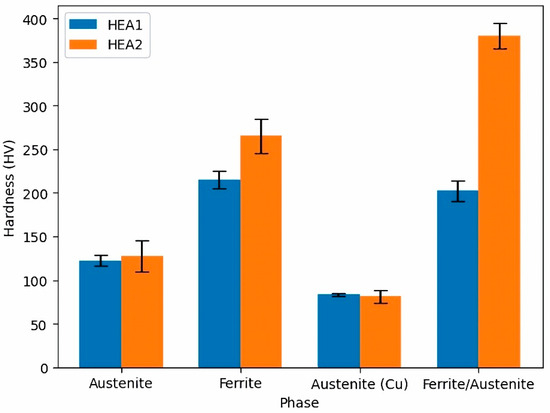
Figure 9.
Summary of microhardness results on the investigated high-entropy alloys.
On the other hand, the hardness in the Cu-rich austenitic phase remained relatively constant. It should be noted that although the measurement identified each phase independently, there was also a high interaction with the surrounding phases. The increase in hardness at the ferrite/austenite interface was observed only in the HEA2 alloy and can be attributed to the σ phase. These results are consistent with those observed by Ribeiro et al. [64]. This finding validates what was observed with SEM-BSE and XRD and the results obtained from the simulations. The registered hardness value is a weighted value considering the σ phase, ferrite, and austenite, as all three phases interact under the indenter.
The obtained results are compared to high-entropy alloys reported with slightly different compositional systems. For instance, Abolkassem et al. [65] developed high-entropy alloys with an FCC structure using the FeNiCoCrCu and FeNiCoCrMn compositional systems, resulting in Vickers hardness values of 156 HV and 146 HV, respectively, at a sintering temperature of 1150 °C. Tian et al. [66] obtained similar results in a CoCrFeMnxNi2-x compositional system, with hardness values in the austenitic matrix ranging from 143 to 153 HV. However, the hardness increased to 295 HV when the σ phase coexisted in the austenitic matrix. Furthermore, Li et al. [67] achieved a hardness of 296 HV in an FeNiCrCuMn compositional system with an FCC + BCC structure. The obtained results are consistent with those presented for the compositional system of the investigated high-entropy alloys in this study. The hardness of the austenitic zone in the HEA2 alloy is equivalent to 1256 MPa, while the ferritic zone reached a value of 2601 MPa. When comparing these values with those reported by Fan et al. [68], consistency is found with similar compositional systems for FCC and BCC structures. Dmytro et al. [61] obtained hardness values in FeCrMnNiCu compositional systems ranging from 174 to 360 HV, with compressive strengths exceeding 1800 MPa and deformations ranging from 28% to 46%. These results demonstrate that the alloy investigated in this study, belonging to the same compositional system, has a high potential for applications in high-temperature, wear, and structural conditions. The registered hardness at the γ/α interface is 2115 MPa for the HEA1 alloy and 3220 MPa at the γ/α interface, which may result from the possible interaction with the σ phase. Nevertheless, it might be assumed, based on the work by Erdogan et al. [51], that subsequent annealing conducted at high temperatures should increase both the homogeneity and the hardness of the as-sintered HEA. Such an improvement in the mechanical properties is due to the increase in lattice parameters of the phases and the hardness of IM.
3.3.2. Nanohardness
The results obtained for nanohardness can be observed in Figure 10. The p-h curves of alloy HEA1 (without Nb) are represented as solid lines, while the p-h curves of alloy HEA2 (with Nb) are represented as dashed lines. The first significant finding observed is that the γCu phase showed no significant variation in nanohardness, remaining in the average range of 2.75 GPa and 2.46 GPa in samples without Nb doping and with Nb doping, respectively. This is a key indicator of the possible absence of the Laves phase since it typically has Cu as a preferred nucleation site [69].
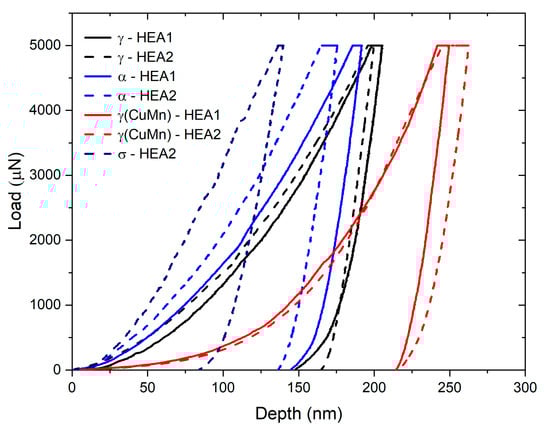
Figure 10.
p-h curves obtained for the investigated high-entropy alloys.
The nanomechanical response of the primary austenitic γ phase shows a slight change in its stiffness and hardness when examining the unloading slopes. The obtained hardness values indicate that incorporating Nb under the processing conditions did not significantly harden the solid solution matrix. The obtained values for the austenitic phase ranged from 5.55 GPa to 5.97 GPa on average for alloys HEA1 and HEA2, respectively. This result is reasonable, as observed in the images from backscattered scanning electron microscopy, where Nb was found to be segregated within the matrix (Figure 5), and it is extremely challenging to identify enriched regions using nanoindentation microscopy techniques. Furthermore, the scanning range used to identify the nanoindentation areas is 15 × 15 µm, further complicating the identification of Nb-enriched solid solution zones within the austenitic matrix.
The nanomechanical response for the ferritic phase exhibited significant variations. The nanohardness for ferrite in alloy HEA1 had a value of 6.40 GPa. However, alloy HEA2, which contains Nb doping, yielded a nanohardness of 7.32 GPa. This result may be related to the interaction of the sigma phase in ferrite, as it preferentially precipitates within the ferrite and along grain boundaries (Figure 5 and Figure 7). Furthermore, only in alloy HEA2 was the presence of the sigma phase found, and the average nanohardness value was 9.71 GPa. Therefore, it can be assumed that due to its broader nanohardness spectrum, which is significantly broader than that of HEA1, Nb-dopped HEA2 should lead to improved mechanical properties, combining the ductility of softer phases with the strength of hard phases [70]. Furthermore, Nb additions into HEA have shown promising results not only for wear resistance, including hot wear, but also for corrosion resistance [50,71]. Further developments in HEA2 are therefore worth pursuing in the future.
3.4. Development Prospects for the New HEA Dopped with Nb
Ultimately, this study is centered on the development of a new high-entropy alloy (HEA) that already exhibits improved phases and properties under sintering conditions. However, the new alloy still needs to undergo subsequent processing following established routes, such as optimized sintering followed by high-temperature annealing, in order to achieve greater material densification, stabilize the most intriguing phases, and simultaneously enhance chemical homogenization and phase distribution. This approach aims to optimize thermomechanical processing parameters to yield enhanced properties and is part of a forward-looking study extending beyond the scope of the current research. Enhanced properties may encompass wear resistance, including high-temperature wear and corrosion resistance, which will be addressed in future work.
The primary objective of this work focused on the formation of the sigma intermetallic phase with the addition of Nb and the ability to predict intermetallic phases using an analytical approach based on the atomic packing factor (APF) and machine learning with a random forest model applied to high-entropy alloys and complex compositions. Furthermore, we aimed to demonstrate the presence of the observed phases with a computational CALPHAD approach, along with microstructural and mechanical characterization at small scales, both at the micrometric and submicrometric levels. It was also demonstrated that the analytical APF-based prediction method provides a superior description of intermetallic phases. Thus, it is recommended that the random forest model utilize the packing factor as a phase descriptor in future work to further enhance its performance and predictive capabilities.
4. Conclusions
The predictive capability of complex multicomponent alloys using the new VEC-based analytical method, machine learning with the random forest model utilizing a robust database, and CALPHAD were corroborated in two newly developed high-entropy alloys using powder metallurgy. According to the results of this study, the following conclusions can be drawn:
Phase prediction using analytical methods, machine learning, and CALPHAD computational simulation were consistent for the HEA1 and HEA2 alloys. These results were further substantiated with microscopy and microscale/submicroscale characterization.
At the microscale, a clear solid solution strengthening effect was observed in austenite. However, at the submicroscale, this phenomenon was not evident due to Nb segregation in the austenitic matrix, as revealed with backscattered electron scanning electron microscopy. Similarly, a co-deformation state was observed in the ferrite of the HEA2 alloy, attributed to the presence of the sigma phase at grain boundaries, as detected with nanoindentation.
Nb in the FeCrMnNiCu composition system increases the driving force for sigma phase formation over Laves phase formation when Nb is present in low proportions.
The predictive accuracy of the VEC method is comparable with high-precision machine learning models equipped with extensive databases and advanced conventional techniques such as CALPHAD.
Author Contributions
Conceptualization, A.O., D.R. and M.M.; methodology, J.P.S.; validation, A.O. and D.R.; formal analysis, A.O. and J.P.S.; investigation, D.W. and G.D.; data curation, C.M. and S.S.; writing—original draft preparation, A.O.; writing—review and editing, J.P.S., M.V., A.M., A.H.S., J.T.T., M.M. and V.T.; visualization, C.S.; funding acquisition, D.R. and V.T. All authors have read and agreed to the published version of this manuscript.
Funding
This work was funded by Universidad de La Frontera under project DI22-0067.
Data Availability Statement
The original contributions presented in the study are included in the article, further inquiries can be directed to the corresponding author.
Acknowledgments
The authors would like to express their gratitude for the availability of the laboratory facilities at the University of Concepción and Universidad del Bío-Bío, which enabled the rigorous development of this research work. Similarly, Angelo Oñate would like to extend his appreciation to the team for their commitment demonstrated at every stage of the project.
Conflicts of Interest
The authors declare that they have no known competing financial interests or personal relationships that could have appeared to influence the work reported in this paper.
References
- Rojas, D.; Garcia, J.; Prat, O.; Carrasco, C.; Sauthoff, G.; Kaysser-Pyzalla, A.R. Design and characterization of microstructure evolution during creep of 12% Cr heat resistant steels. Mater. Sci. Eng. A. 2010, 527, 3864–3876. [Google Scholar] [CrossRef]
- Ramírez, J.; Berrio, E.; Alvarado-Avila, M.I.; Field, D.; Oñate, A.; Sanhueza, J.P.; Montoya, L.F.; Meléndrez, M.F.; Rojas, D. Effect of solution annealing temperature on the localised corrosion behaviour of a modified super austenitic steel produced in an open-air atmosphere. Mater. Chem. Phys. 2023, 299, 127498. [Google Scholar] [CrossRef]
- Song, Y.; Zhang, Z.; Ma, H.; Nakatani, M.; Kawabata, M.O.; Ameyama, K. Ratcheting-Fatigue Behavior of Harmonic-Structure-Designed SUS316L Stainless Steel. Metals 2021, 11, 477. [Google Scholar] [CrossRef]
- Guennec, B.; Ishiguri, T.; Kawabata, M.O.; Kikuchi, S.; Ueno, A.; Ameyama, K. Investigation on the Durability of Ti-6Al-4V Alloy Designed in a Harmonic Structure via Powder Metallurgy: Fatigue Behavior and Specimen Size Parameter Issue. Metals 2020, 10, 636. [Google Scholar] [CrossRef]
- Salvo, C.; Mangalaraja, R.V.; Udayabashkar, R.; Lopez, M.; Aguilar, C. Enhanced mechanical and electrical properties of novel graphene reinforced copper matrix composites. J. Alloys Compd. 2019, 777, 309–316. [Google Scholar] [CrossRef]
- Salvo, C.; Chicardi, E.; Hernández-Saz, J.; Aguilar, C.; Gnanaprakasam, P.; Mangalaraja, R.V. Microstructure, electrical and mechanical properties of Ti2AlN MAX phase reinforced copper matrix composites processed by hot pressing. Mater. Charact. 2021, 171, 110812. [Google Scholar] [CrossRef]
- Mani, S.; Tabil, L.G.; Sokhansanj, S. Effects of compressive force, particle size and moisture content on mechanical properties of biomass pellets from grasses. Biomass Bioenergy 2006, 30, 648–654. [Google Scholar] [CrossRef]
- Oñate, A.; Alvarado-Avila, M.I.; Medina, C.; Villegas, C.; Ramírez, J.; Sanhueza, J.P.; Meléndrez, M.; Rojas, D. Characterization of Nb-Si-doped low-carbon steel treated by quenching and partitioning: Thermic treatment in two stages supported by computational thermodynamical simulation and controlled sample dimensions. Mater. Today Commun. 2023, 34, 105335. [Google Scholar] [CrossRef]
- Kaufman, L.; Ågren, J. CALPHAD, first and second generation—Birth of the materials genoma. Scr. Mater. 2014, 70, 3–6. [Google Scholar] [CrossRef]
- Spencer, P.J. A brief history of CALPHAD. Calphad 2008, 32, 1–8. [Google Scholar] [CrossRef]
- Ohtani, H. The CALPHAD Method. In Springer Handbook of Materials Measurement Methods; Springer: Berlin/Heidelberg, Germany, 2006; pp. 1001–1030. [Google Scholar] [CrossRef]
- Kattner, U.R. The Calphad Method and Its Role in Material and Process Development. Tecnol. Metal. Mater. Mineração 2016, 13, 3. [Google Scholar] [CrossRef] [PubMed]
- Klenam, D.E.P.; Asumadu, T.K.; Vandadi, M.; Rahbar, N.; McBagonluri, F.; Soboyejo, W.O. Data science and material informatics in physical metallurgy and material science: An overview of milestones and limitations. Results Mater. 2023, 19, 100455. [Google Scholar] [CrossRef]
- Wu, Y.; Shang, Z.; Lu, T.; Zhou, W.; Li, M.; Lu, W. Target-Directed Discovery for Low Melting Point Alloys via Inverse Design Strategy. J. Alloys Compd. 2023, 971, 172664. [Google Scholar] [CrossRef]
- Lee, K.; Ayyasamy, M.V.; Ji, Y.; Balachandran, P.V. A comparison of explainable artificial intelligence methods in the phase classification of multi-principal element alloys. Sci. Rep. 2022, 12, 11591. [Google Scholar] [CrossRef] [PubMed]
- Machaka, R. Machine learning-based prediction of phases in high-entropy alloys. Comput. Mater. Sci. 2021, 188, 110244. [Google Scholar] [CrossRef]
- Ye, Y.F.; Wang, Q.; Lu, J.; Liu, C.T.; Yang, Y. Design of high entropy alloys: A single-parameter thermodynamic rule. Scr. Mater. 2015, 104, 53–55. [Google Scholar] [CrossRef]
- Oñate, A.; Sanhueza, J.P.; Ramirez, J.; Medina, C.; Melendrez, M.F.; Rojas, D. Design of Fe36.29Cr28.9Ni26.15Cu4.17Ti1.67V2.48C0.46 HEA using a new criterion based on VEC: Microstructural study and multiscale mechanical response. Mater. Today Commun. 2023, 35, 105681. [Google Scholar] [CrossRef]
- Zhang, B.Y.; Zhou, Y.J.; Lin, J.P.; Chen, G.L.; Liaw, P.K.; Zhang, Y.; Zhou, Y.J.; Lin, J.P.; Chen, G.L.; Liaw, P.K. Solid-Solution Phase Formation Rules for Multi-component Alloys. Adv. Eng. Mater. 2008, 10, 534–538. [Google Scholar] [CrossRef]
- Guo, S.; Liu, C.T. Phase stability in high entropy alloys: Formation of solid-solution phase or amorphous pase. Prog. Nat. Sci. Mater. Int. 2011, 21, 433–446. [Google Scholar] [CrossRef]
- Pouraliakbar, H.; Shim, S.H.; Kim, Y.K.; Rizi, M.S.; Noh, H.; Hong, S.I. Microstructure evolution and mechanical properties of (CoCrNi)90(AlTiZr)5(CuFeMo)5 multicomponent alloy: A pathway through multicomponent alloys toward new superalloys. J. Alloys Compd. 2021, 860, 158412. [Google Scholar] [CrossRef]
- Martin, P.; Madrid-Cortes, C.E.; Cáceres, C.; Araya, N.; Aguilar, C.; Cabrera, J.M. HEAPS: A user-friendly tool for the design and exploration of high-entropy alloys based on semi-empirical parameters. Comput. Phys. Commun. 2022, 278, 108398. [Google Scholar] [CrossRef]
- Mao, H.; Chen, H.L.; Chen, Q. TCHEA1: A Thermodynamic Database Not Limited for “High Entropy” Alloys. J. Phase Equilibria Diffus. 2017, 38, 353–368. [Google Scholar] [CrossRef]
- Gorsse, S.; Tancret, F. Current and emerging practices of CALPHAD toward the development of high entropy alloys and complex concentrated alloys. J. Mater. Res. 2018, 33, 2899–2923. [Google Scholar] [CrossRef]
- Li, R.; Xie, L.; Wang, W.Y.; Liaw, P.K.; Zhang, Y. High-Throughput Calculations for High-Entropy Alloys: A Brief Review. Front. Mater. 2020, 7, 290. [Google Scholar] [CrossRef]
- Zhang, C.; Gao, M.C. CALPHAD Modeling of High-Entropy Alloys. In High-Entropy Alloys; Fundamentals and Applications; Springer International Publishing: Cham, Switzerland, 2016; pp. 399–444. [Google Scholar] [CrossRef]
- Saunders, N.; Miodownik, A.P. Calphad (Calculation of Phase Diagrams): A Comprehensive Guide; Pergamon Materials Series; Elsevier Science Ltd.: Oxford, UK, 1998; Volume 1. [Google Scholar]
- Shaikh, S.M.; Hariharan, V.S.; Yadav, S.K.; Murty, B.S. CALPHAD and rule-of-mixtures: A comparative study for refractory high entropy alloys. Intermetallics 2020, 127, 106926. [Google Scholar] [CrossRef]
- Kroupa, A. Modelling of phase diagrams and thermodynamic properties using Calphad method—Development of thermodynamic databases. Comput. Mater. Sci. 2013, 66, 3–13. [Google Scholar] [CrossRef]
- Sing, S.; Kurmar Katiyar, N.; Goel, S.; Joshi, S.N. Phase prediction and experimental realisation of a new high entropy alloy using machine learning. Sci. Rep. 2023, 13, 4811. [Google Scholar] [CrossRef] [PubMed]
- Oñate, A.; Sanhueza, J.P.; Zegpi, D.; Tuninetti, V.; Ramirez, J.; Medina, C.; Melendrez, M.; Rojas, D. Supervised machine learning-based multi-class phase prediction in high-entropy alloys using robust databases. J. Alloys Compd. 2023, 962, 171224. [Google Scholar] [CrossRef]
- Huang, W.; Martin, P.; Zhuang, H.L. Machine-learning phase prediction of high-entropy alloys. Acta Mater. 2019, 169, 225–236. [Google Scholar] [CrossRef]
- Pei, Z.; Yin, J.; Hawk, J.A.; Alman, D.E.; Gao, M.C. Machine-learning informed prediction of high-entropy solid solution formation: Beyond the Hume-Rothery rules. NPJ Comput. Mater. 2020, 6, 50. [Google Scholar] [CrossRef]
- Rickman, J.M.; Balasubramanian, G.; Marvel, C.J.; Chan, H.M.; Burton, M.-T. Machine learning strategies for high-entropy alloys. J. Appl. Phys. 2020, 128, 221101. [Google Scholar] [CrossRef]
- Kaufmann, K.; Vecchio, K.S. Searching for high entropy alloys: A machine learning approach. Acta Mater. 2020, 198, 178–222. [Google Scholar] [CrossRef]
- Qu, N.; Liu, Y.; Zhang, Y.; Yang, D.; Han, T.; Liao, M.; Lai, Z.; Zhu, J.; Zhang, L. Machine learning guided phase formation prediction of high entropy alloys. Mater. Today Commun. 2022, 32, 104146. [Google Scholar] [CrossRef]
- Tsai, M.H.; Li, J.H.; Fan, A.C.; Tsai, P.H. Incorrect predictions of simple solid solution high entropy alloys: Cause and possible solution. Scr. Mater. 2017, 127, 6–9. [Google Scholar] [CrossRef]
- Wang, X.J.; Xu, M.; Liu, N.; Liu, L.X. The formation of sigma phase in the CoCrFeNi high-entropy alloys. Mater. Res. Express 2021, 8, 076514. [Google Scholar] [CrossRef]
- Yurchenko, N.; Stepanov, N.; Salishchev, G. Laves-phase formation criterion for high-entropy alloys. Mater. Sci. Technol. 2017, 33, 17–22. [Google Scholar] [CrossRef]
- Ren, H.; Chen, R.R.; Gao, X.F.; Liu, T.; Qin, G.; Wu, S.P.; Guo, J.J. Phase formation and mechanical features in (AlCoCrFeNi)100−xHfx high-entropy alloys: The role of Hf. Mater. Sci. Eng. A 2022, 858, 144156. [Google Scholar] [CrossRef]
- Christofidou, K.A.; McAuliffe, T.P.; Mignanelli, P.M.; Stone, H.J.; Jones, N.G. On the prediction and the formation of the sigma phase in CrMnCoFeNix high entropy alloys. J. Alloys Compd. 2019, 770, 285–293. [Google Scholar] [CrossRef]
- Zhang, L.; Chen, H.; Tao, X.; Cai, H.; Liu, J.; Ouyang, Y.; Peng, Q.; Du, Y. Machine learning reveals the importance of the formation enthalpy and atom-size difference in forming phases of high entropy alloys. Mater. Des. 2020, 193, 108835. [Google Scholar] [CrossRef]
- Krishna, Y.V.; Jaiswal, U.K.; Rahul, R.M. Machine learning approach to predict new multiphase high entropy alloys. Scr. Mater. 2021, 197, 113804. [Google Scholar] [CrossRef]
- Tuninetti, V.; Jaramillo, A.F.; Riu, G.; Rojas-Ulloa, C.; Znaidi, A.; Medina, C.; Mateo, A.M.; Roa, J.J. Experimental Correlation of Mechanical Properties of the Ti-6Al-4V Alloy at Different Length Scales. Metals 2021, 11, 104. [Google Scholar] [CrossRef]
- Wang, J.; Yang, C.; Liu, Y.; Li, Y.; Xiong, Y. Using Nanoindentation to Characterize the Mechanical and Creep Properties of Shale: Load and Loading Strain Rate Effects. ACS Omega 2022, 7, 14317–14331. [Google Scholar] [CrossRef] [PubMed]
- Rojas-Ulloa, C.; Bouffioux, C.; Jaramillo, A.F.; García-Herrera, C.M.; Hussain, T.; Duchêne, L.; Riu, G.; Roa, J.J.; Flores, P.; Habraken, A.M.; et al. Nanomechanical Characterization of the Deformation Response of Orthotropic Ti–6Al–4V. Adv. Eng. Mater. 2021, 23, 2001341. [Google Scholar] [CrossRef]
- Oñate, A.; Toledo, E.; Ramirez, J.; Alvarado, M.I.; Jaramillo, A.; Sanhueza, J.P.; Medina, C.; Melendrez, M.F.; Rojas, D. Production of Nb-doped super duplex stainless steel based on recycled material: A study of the microstructural characterization, corrosion, and mechanical behavior. Mater. Chem. Phys. 2023, 308, 128294. [Google Scholar] [CrossRef]
- Oñate, Á.; Torres, E.; Olave, D.; Ramírez, J.; Medina, C.; Sanhueza, J.P.; Melendrez, M.; Tuninetti, V.; Rojas, D. Exploring the Impact of Cooling Rate on Microstructural Features, Mechanical Properties, and Corrosion Resistance of a Novel Nb-Stabilized Super Duplex Stainless Steel in Shielded Metal Arc Welding. Crystals 2023, 13, 1192. [Google Scholar] [CrossRef]
- Zhang, L.; Huo, X.; Wang, A.; Du, X.; Zhang, L.; Li, W.; Zou, N.; Wan, G.; Duan, G.; Wu, B. A ductile high entropy alloy strengthened by nano sigma pase. Intermetallics 2020, 122, 106813. [Google Scholar] [CrossRef]
- Cheng, J.B.; Liang, X.B.; Xu, B.S. Effect of Nb addition on the structure and mechanical behaviors of CoCrCuFeNi high-entropy alloy coatings. Surf. Coat. Technol. 2014, 240, 184–190. [Google Scholar] [CrossRef]
- Erdogan, A.; Yener, T.; Zeytin, S. Fast production of high entropy alloys (CoCrFeNiAlxTiy) by electric current activated sintering system. Vacuum 2018, 155, 64–72. [Google Scholar] [CrossRef]
- Guo, S.; Ng, C.; Lu, J.; Liu, C.T. Effect of valence electron concentration on stability of fcc or bcc phase in high entropy alloys. J. Appl. Phys. 2011, 109, 103505. [Google Scholar] [CrossRef]
- Hou, J.; Li, J.; Lu, W. Twin boundary-assisted precipitation of sigma phase in a high-entropy alloy. Mater. Lett. 2021, 300, 130198. [Google Scholar] [CrossRef]
- Laplanche, G. Growth kinetics of σ-phase precipitates and underlying diffusion processes in CrMnFeCoNi high-entropy alloys. Acta Mater. 2020, 199, 193–208. [Google Scholar] [CrossRef]
- Kawazoe, Y.; Berne, C.; Sluiter, M.; Hansen, T.; Pasturel, A. Site occupancy in the Re-W sigma phase. Phys. Rev. B 2001, 64, 144103. [Google Scholar] [CrossRef]
- Hsieh, C.-C.; Wu, W. Overview of Intermetallic Sigma (σ) Phase Precipitation in Stainless Steels. ISRN Metall. 2012, 2012, 732471. [Google Scholar] [CrossRef]
- Tsai, M.H.; Tsai, K.Y.; Tsai, C.W.; Lee, C.; Juan, C.C.; Yeh, J.W. Criterion for Sigma Phase Formation in Cr- and V-Containing High-Entropy Alloys. Mater. Res. Lett. 2013, 1, 207–212. [Google Scholar] [CrossRef]
- Jacob, A.; Povoden-Karadeniz, E.; Kozeschnik, E. Revised thermodynamic description of the Fe-Cr system based on an improved sublattice model of the σ phase. Calphad 2018, 60, 16–28. [Google Scholar] [CrossRef]
- Oh, S.M.; Hong, S.I. Microstructural stability and mechanical properties of equiatomic CoCrCuFeNi, CrCuFeMnNi, CoCrCuFeMn alloys. Mater. Chem. Phys. 2018, 210, 120–125. [Google Scholar] [CrossRef]
- Shabani, A.; Toroghinejad, M.R.; Shafyei, A.; Logé, R.E. Microstructure and Mechanical Properties of a Multiphase FeCrCuMnNi High-Entropy Alloy. J. Mater. Eng. Perform. 2019, 28, 2388–2398. [Google Scholar] [CrossRef]
- Ostroushko, D.; Saksl, K.; Balga, D.; Zabo, J.S.; Durisin, M.; Milkovic, O.; Zubko, P. Microstructures and Base Mechanical Properties of Cr1−xCuxMnFeNi high entropy alloys. In Proceedings of the 24th International Conference on Metallurgy and Materials, Brno, Czech Republic, 3–5 June 2015. [Google Scholar]
- Shabani, A.; Toroghinejad, M.R. Investigation of microstructure, texture, and mechanical properties of FeCrCuMnNi multiphase high entropy alloy during recrystallization. Mater. Charact. 2019, 154, 253–263. [Google Scholar] [CrossRef]
- Tsai, M.H.; Tsai, R.C.; Chang, T.; Huang, W.F. Intermetallic Phases in High-Entropy Alloys: Statistical Analysis of their Prevalence and Structural Inheritance. Metals 2019, 9, 247. [Google Scholar] [CrossRef]
- Ribeiro, J.J.K.; Turin, A.R.; de la Rosa, Y.E.N.; Quadros, P.V.C.A.; Calabokis, O.P.; Lepienski, C.M.; Brunatto, S.F.; Borges, P.C. Mechanical Characterization at Nanoscale of Austenite, Ferrite, and Sigma Phases via Hardness Measurement and Fretting Wear Behavior of a Duplex Stainless Steel. Metals 2023, 13, 864. [Google Scholar] [CrossRef]
- Abolkassem, S.A.; Mohamed, L.Z.; Gaber, G.A.; Elkady, O.A. Microstructure and corrosion behavior of FeNiCoCrCu and FeNiCoCrMn high entropy alloys manufactured by powder metallurgy in different acid media. J. Mater. Res. Technol. 2021, 10, 1122–1142. [Google Scholar] [CrossRef]
- Tian, M.; Wu, C.; Liu, Y.; Peng, H.; Wang, J.; Su, X. Phase stability and microhardness of CoCrFeMnxNi2-x high entropy alloys. J. Alloys Compd. 2019, 811, 152025. [Google Scholar] [CrossRef]
- Li, C.; Li, J.C.; Zhao, M.; Jiang, Q. Effect of alloying elements on microstructure and properties of multiprincipal elements high-entropy alloys. J. Alloys Compd. 2009, 475, 752–757. [Google Scholar] [CrossRef]
- Fan, X.; Qu, R.; Zhang, Z. Relation Between Strength and Hardness of High-Entropy Alloys. Acta Metall. Sin. (Engl. Lett.) 2021, 34, 1461–1482. [Google Scholar] [CrossRef]
- Qin, G.; Wang, S.; Chen, R.; Gong, X.; Wang, L.; Su, Y.; Guo, J.; Fu, H. Microstructures and mechanical properties of Nb-alloyed CoCrCuFeNi high-entropy alloys. J. Mater. Sci. Technol. 2018, 34, 365–369. [Google Scholar] [CrossRef]
- Bhattacharjee, T.; Wani, I.S.; Sheikh, S.; Clark, I.T.; Okawa, T.; Guo, S.; Bhattacharjee, P.P.; Tsuji, N. Simultaneous Strength-Ductility Enhancement of a Nano-Lamellar AlCoCrFeNi2.1 Eutectic High Entropy Alloy by Cryo-Rolling and Annealing. Sci. Rep. 2018, 8, 3276. [Google Scholar] [CrossRef]
- Hamdi, H.; Abedi, H.R.; Zhang, Y. A Study on Outstanding High-Temperature Wear Resistance of High-Entropy Alloys. Adv. Eng. Mater. 2023, 25, 2201915. [Google Scholar] [CrossRef]
Disclaimer/Publisher’s Note: The statements, opinions and data contained in all publications are solely those of the individual author(s) and contributor(s) and not of MDPI and/or the editor(s). MDPI and/or the editor(s) disclaim responsibility for any injury to people or property resulting from any ideas, methods, instructions or products referred to in the content. |
© 2024 by the authors. Licensee MDPI, Basel, Switzerland. This article is an open access article distributed under the terms and conditions of the Creative Commons Attribution (CC BY) license (https://creativecommons.org/licenses/by/4.0/).