Article

Microstructure and Mechanical Properties of Copper/Graphene Composites Fabricated via Accumulative Roll Bonding and Heat Treatment without a Controlled Atmosphere

by
Ricardo Aparecido da Cruz
1,2,*,
Anibal de Andrade Mendes Filho
3,
Silvano Leal dos Santos
4,
Vinícius Torres dos Santos
5,
Márcio Rodrigues da Silva
5,
Flávia Gonçalves Lobo
5,
Givanildo Alves dos Santos
2 and
Antonio Augusto Couto
1
1
School of Engineering, Mackenzie Presbyterian University (UPM), São Paulo 01302-907, SP, Brazil
2
Department of Mechanics, Federal Institute of Education, Science and Technology of São Paulo, São Paulo 01109-010, SP, Brazil
3
Center for Engineering, Modeling and Applied Social Sciences, Federal University of ABC, Santo André 09210-580, SP, Brazil
4
Characterization and Processing Laboratory (LPCM), Faculty of Technology of São Paulo, Bom Retiro, São Paulo 01124-060, SP, Brazil
5
Department of Research and Development, Termomecanica São Paulo S.A., São Bernardo do Campo 09612-000, SP, Brazil
*
Author to whom correspondence should be addressed.
Metals 2024, 14(1), 4; https://doi.org/10.3390/met14010004
Submission received: 26 October 2023 / Revised: 10 December 2023 / Accepted: 15 December 2023 / Published: 19 December 2023
(This article belongs to the Special Issue Metal Matrix Composites Reinforced with Carbon Nanomaterials)

Abstract

:
Copper and its alloys are structural materials used in industries and engineering applications due to their excellent thermal and electrical conductivity and chemical stability. Integrating graphene, known for its exceptional electrical conductivity, into the copper matrix is a promising strategy to enhance mechanical properties without sacrificing electrical conductivity. The Accumulative Roll Bonding (ARB) process can effectively and homogeneously introduce graphene into the metal matrix and is adaptable to an industrial scale. This study investigates the impact of varying graphene concentrations and two heat treatment protocols (without a controlled atmosphere) on the mechanical and electrical properties of ARBed copper/graphene composites. Optical microscopy revealed minimal voids and graphene clumps, and the energy dispersive spectroscopy analysis revealed the absence of copper oxide in some samples. The conductivity test showed little influence of the graphene content and stress relief heat treatment temperature on electrical conductivity (~86% of the International Annealed Copper Standard) within a limited number of ARB cycles. The tensile tests did not reveal a significant influence of the graphene content and stress relief heat treatment temperature on the ultimate tensile strength (220–420 MPa) and elongation (~2%).

1. Introduction

Copper and its alloys are structural materials widely used in industry and engineering due to their excellent thermal and electrical conductivity and chemical stability. However, their mechanical properties often fall short of ideal standards, prompting the need for improvements to broaden their applications [1]. The presence of reinforcement agents in the metallic matrix can enhance the properties of these materials. While oxides and carbides can increase mechanical strength and wear resistance, they tend to reduce thermal and electrical conductivity [1]. Achieving materials with improved mechanical strength and maintained electrical conductivity is crucial for energy efficiency, resource conservation, and sustainable manufacturing.
Graphene, known for its excellent conductivity, is a promising choice as a reinforcement material for copper and its alloys. One effective method of incorporating graphene into the metal matrix is the Accumulative Roll Bonding (ARB) process. ARB involves deforming and bonding stacked material sheets through repeated rolling (without lubricants), cutting, and stacking. The bonding between the layers occurs during the severe rolling pass thanks to micro-welding, which is established when cracks occur in the surface oxide film of each layer, and the virgin metal of one layer passes through these cracks (microextrusion) and comes into contact with the virgin metal of the adjacent layer [2,3,4,5]. The ARB process is cost effective and can be used in small-scale laboratory settings with rolling machines and large-scale industrial production of workpieces [6,7].
One must guarantee an even distribution between the metal sheets undergoing the ARB process to incorporate graphene successfully and achieve the desired mechanical and electrical properties. One challenge with graphene and similar nanomaterials is their tendency to clump together, which usually requires complex chemical treatments to achieve a good dispersion [8]. However, besides reducing chemical use, the ARB process can achieve good graphene dispersion within the metallic matrix as the number of process cycles increases [8,9]. Liu et al. reported achieving a good graphene dispersion in eight ARB cycles (reduction in thickness—Rt = 50%) using oxygen-free copper sheets measuring 1 mm in thickness and graphene nanosheets measuring 15 μm in diameter and 10 nm in thickness [9] This improvement in dispersion throughout the cycles is caused by the spreading that lamination causes as result of the increase in the length of the strip as its thickness decreases. The successive cuts and stacking that occur throughout the process guarantee homogenization along the thickness and length of the strips. ARB also offers advantages such as directly producing sheet-like workpieces, refining grain structures, and enhancing graphene properties by exfoliating its layers during the rolling process [10].
Using heat treatments like annealing and stress relief has been shown to improve the ductility [11,12] and electrical conductivity of metals subjected to ARB [13]. Liu and coworkers reported that final annealing (300 °C, one hour) improved the ductility of ARBed pure copper strips (initial thickness 1 mm, six cycles, Rt = 50%) by a factor of 3.7 with a decrease of 35% in the yield strength [12]. A final annealing treatment can significantly improve ductility with some decrease in mechanical strength. Intermediate annealing in ARBed composites would provide a softer matrix before rolling. This softer matrix could better conform to the particle incorporated in the ARB process and thus provide better adhesion to the particle. Better adhesion could guarantee a small decrease in mechanical strength and electrical conductivity compared to what just a final annealing would do.
It is essential to note that precautions should be taken to prevent blistering (formation of bubbles on the metal surface) during copper annealing in uncontrolled atmospheres, as blistering can compromise mechanical strength.
There are few studies about ARB with associated heat treatments applied to copper [12] and copper/graphene composites [13,14]. These studies typically focus on single graphene concentrations or single-temperature heat treatment methods. This article addresses this knowledge gap by investigating the microstructure, mechanical properties, and electrical conductivity of copper/graphene composites manufactured via accumulative roll bonding associated with thermal treatments.

2. Materials and Methods

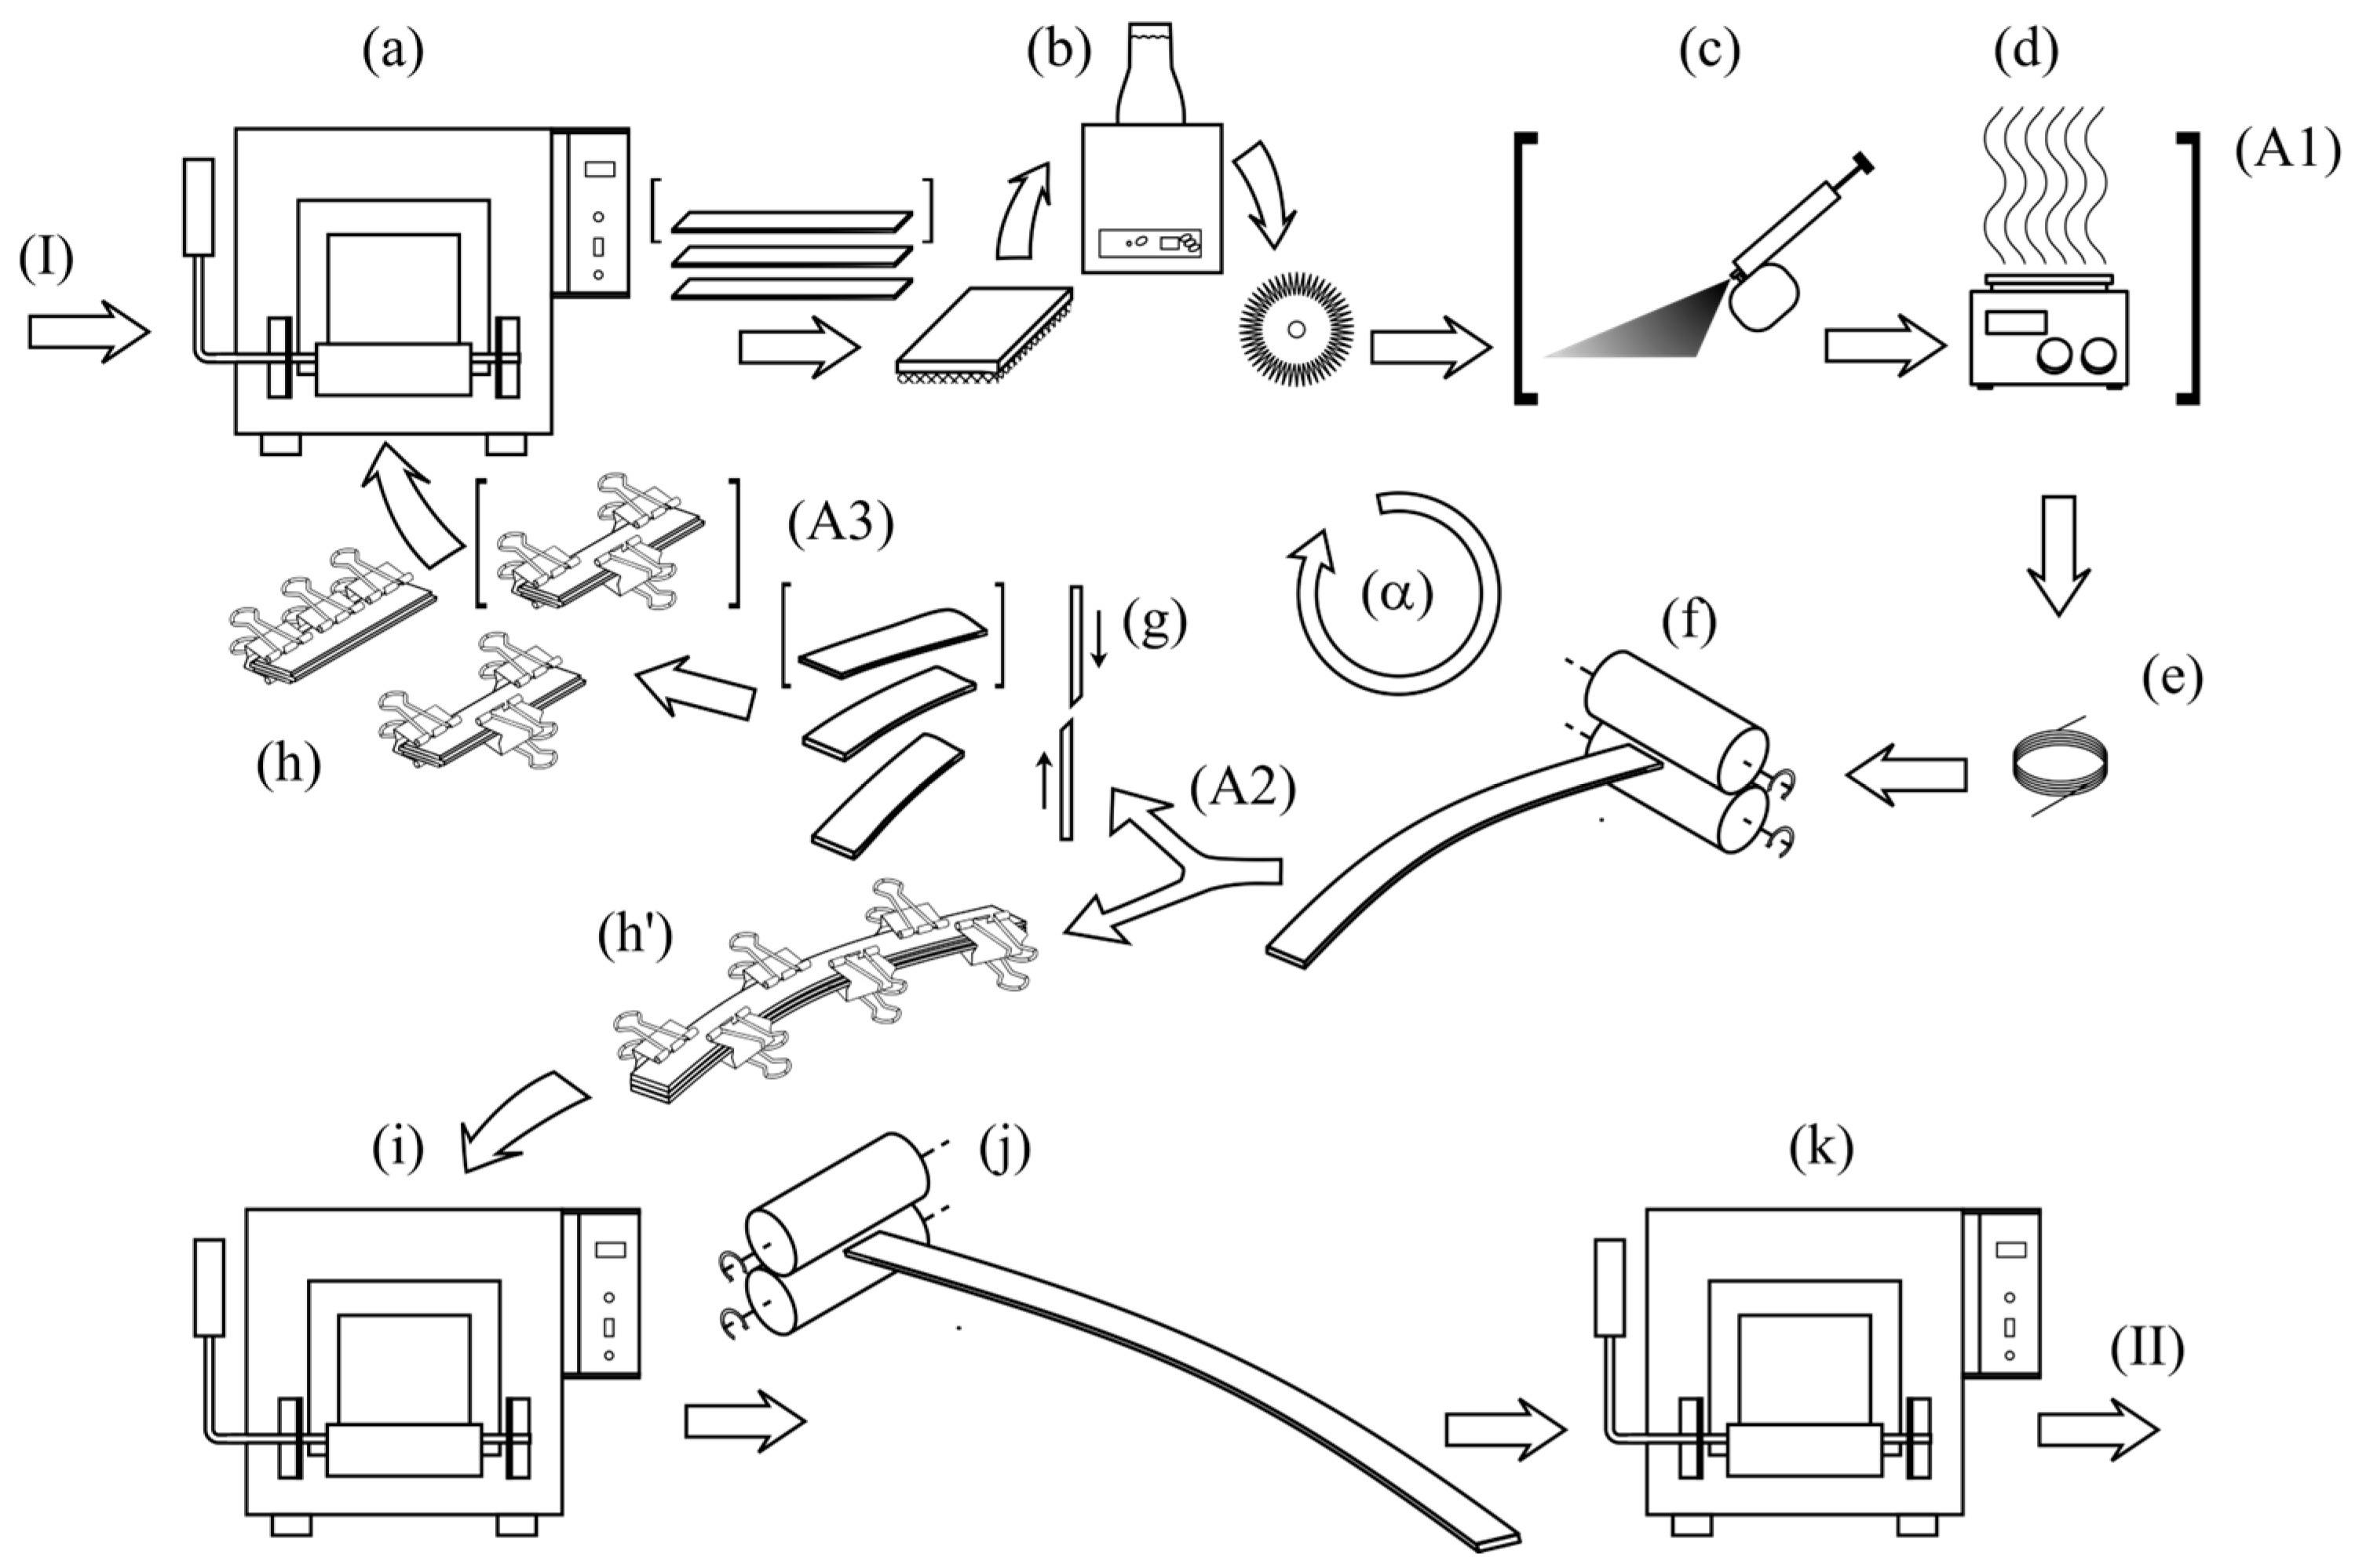
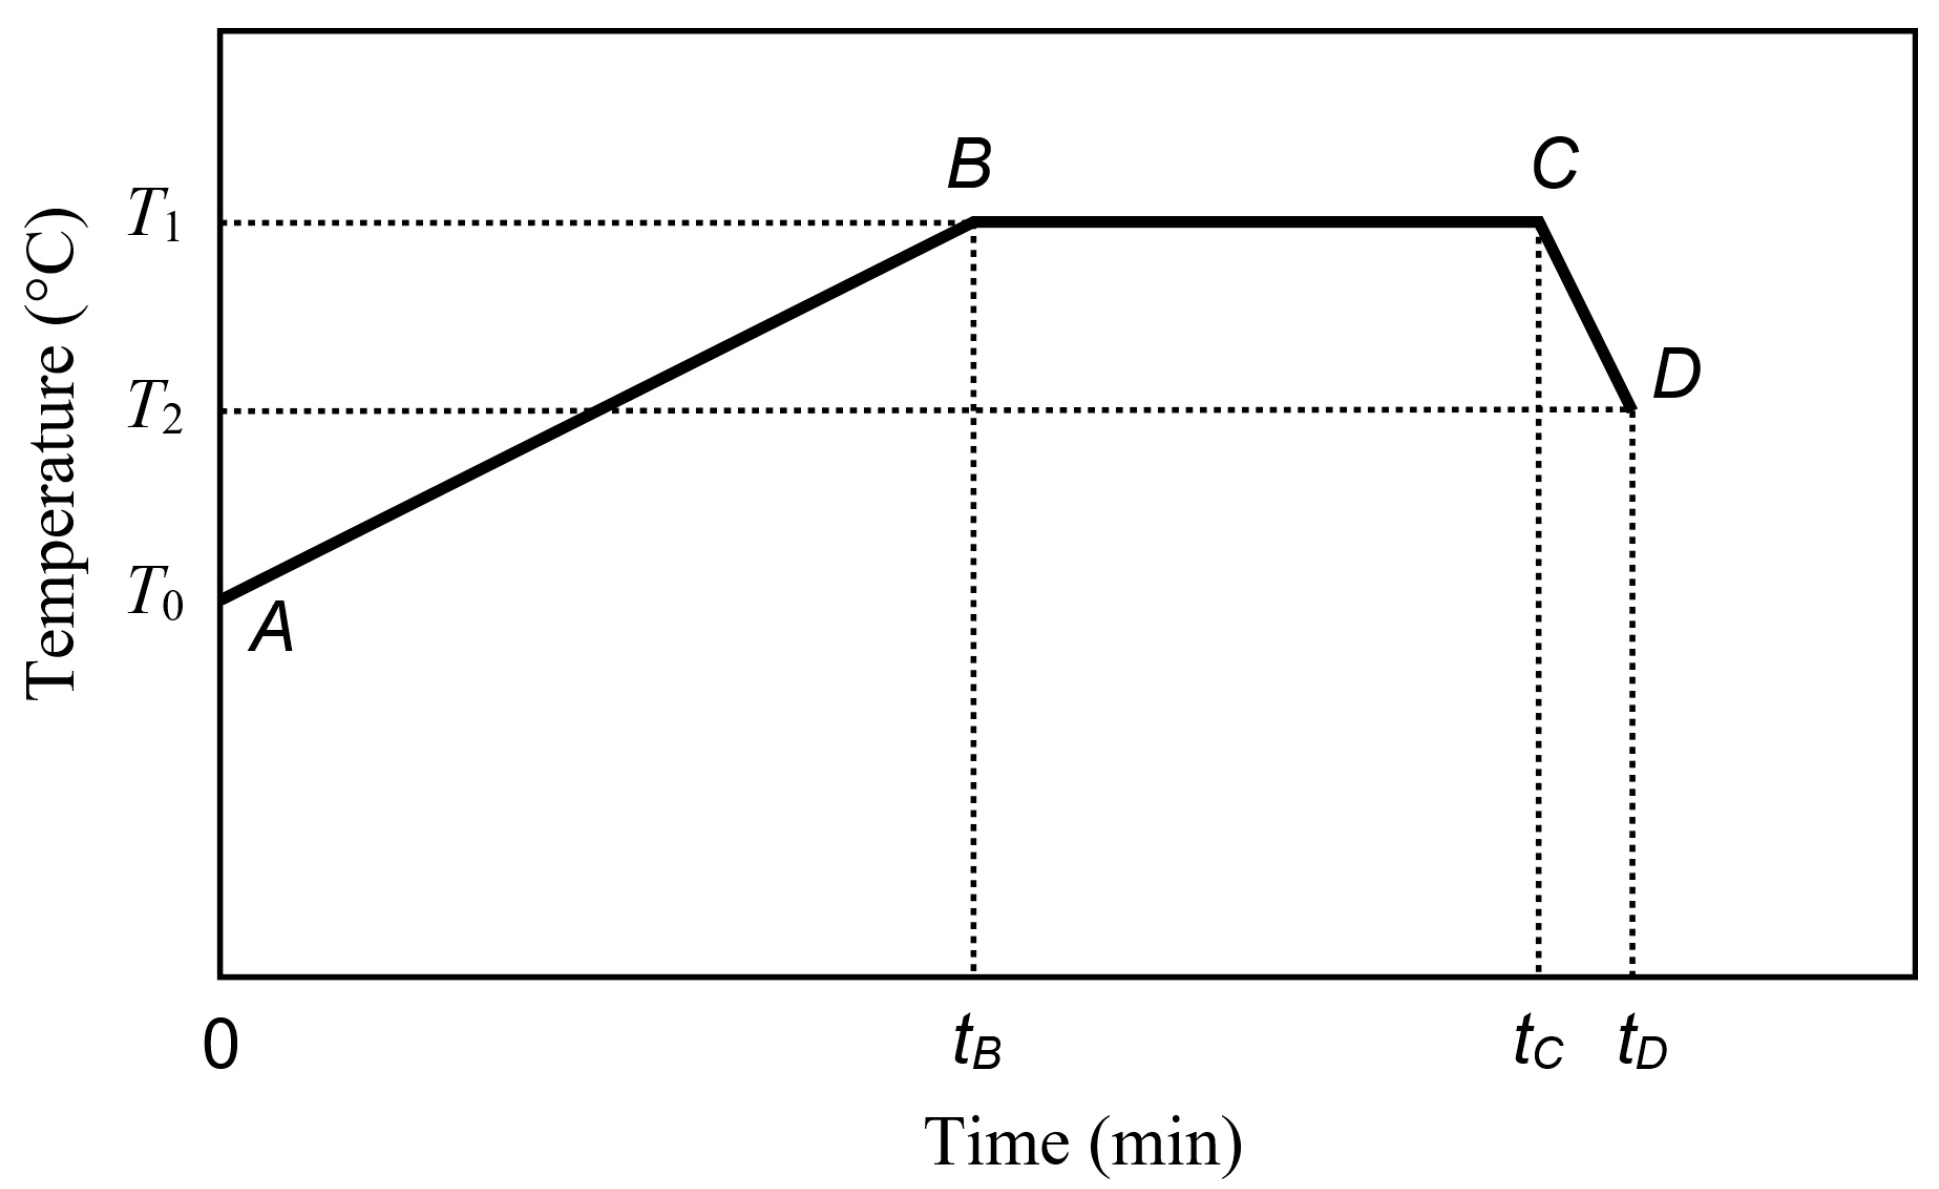
2.1. Fabrication of Cu/GNP Composite

We fabricated a composite material with electrolytic pitch copper (UNS C11000—99.90% min) sheets measuring 0.81 mm in thickness, donated by Termomecanica São Paulo S.A. (São Paulo, Brazil), and with graphene nanoplatelets (GNP) in powder form bought from Sigma-Aldrich Company (St. Louis, MO, USA). XGSciences, the supplier of the GNP powder, informs that the GNP particle size is inferior to 2 μm, its thickness is of a few nm, and its surface area is 750 m2/g. The true particle density is 2.1 g/cm3. Figure 1 shows, in general terms, the process followed to produce the composite material strips.
The letters or numbers appearing in parentheses along the text of this Section 2.1 refer to steps or items shown in Figure 1.
Initially, copper strips were cut (220 × 17 × 0.8 mm3) on a sheet metal guillotine (I). After cutting, they were annealed in a muffle furnace at 550 °C for two hours in air (a). Since the furnace did not have a controlled atmosphere, the copper surface suffered oxidation; however, we introduced steel wool in the furnace during the annealing to act as an oxygen trap to minimize the oxidation.
Before each rolling pass in the ARB cycles, the oxide layer was removed from the surface of the strips by rubbing a Scotch Brite sponge. After that, the strips were degreased with an acetone and ethanol solution (1:1) using an ultrasonic cleaning tank for 10 min (b). After this cleaning step, the strips were wire brushed until the surfaces had a uniform finish (b).
A graphene suspension in acetone and ethanol (9000 mg GNP + 80 mL acetone + alcohol in q.s. to 100 mL of suspension) was homogenized for 10 min before the spraying coating. Two strips were sprayed simultaneously with the graphene suspension to obtain the desired amount of graphene (c). After the graphene coating, the strips were heated up to 80 °C for 1 min to evaporate all the alcohol/acetone solution and only leave the graphene powder on the surface of the strips (d). A stack of three strips was mounted so that the graphene was in between the strips. Finally, the stack was tied with copper wires at both ends to fasten the strips (e).The strips received graphene only in the 1st ARB cycle (A1). The graphene powder spread over a 6 mm wide and 220 mm long central band area in the bottom and middle strips. Then, the stack of strips was subjected to severe rolling (Rt ≥ 50%) (f). A rolling mill with a roll diameter of 70 mm, a single-phase motor of 1.5 HP at 220 V, a rolling speed of approximately 7 m/min, and a roll rotation speed of 32 rpm was used for ARB processing.
After rolling, the composite strip was eventually cut to fit in the muffle furnace and annealed (g,h). The first two cycles of ARB (α) were performed with a stack of three strips each cycle, while the last two cycles of ARB were with a stack of two strips. Before each rolling cycle, the annealing process consisted of a heating ramp, time spent at a specific temperature, and a short cooling ramp, as depicted in Figure 2.
The time–temperature cycles applied for these annealing procedures were defined after some preliminary experiments to reduce the effect of blistering formation; in addition, the upper and bottom surfaces of the rolled Cu/GN composite strips were protected with copper strips to minimize blistering and oxidation. Metal binder clips were used to fasten the copper strips to the composite strips (Figure 1h,h′), and steel wool was put inside the furnace during the annealing to act as an oxygen trap.
Four cycles of annealing and ARB (Figure 1, α) were performed. After that, we executed an extra annealing (Figure 1i) (see Figure 2), a subsequent severe rolling (Figure 1j), and a final stress relief heat treatment (Figure 1k) in each sample.
We fabricated four pairs of samples in four compositions (0%, 0.15%, 0.22%, and 0.46 vol% of GNP) and subjected each pair to two different stress relief heat treatments (180 °C and 220 °C) for an hour. Table 1 shows the processing route and identification of each strip.
Two of the three layers that made up each initial stack of strips A46-180 and A46-220 were slightly machined along their lengths (220 mm × 6 mm) with a small grinding wheel before the initial cleaning step (b) to accumulate more graphene and minimize delamination.
Finally, samples of each strip were taken from the rolling direction–normal direction (RD-ND) plane and the transverse direction–normal direction (TD-ND) plane and were cold embedded in resin for microstructural characterization. Test specimens for tensile and electrical conductivity tests were cut from the strips.

2.2. Microstructural Characterization

The microstructural observations were made in the TD-ND and RD-ND planes. The samples surfaces were prepared by grinding, polishing, and etching with an ammonium hydroxide solution (40 mL of NH4OH, 40 mL of distilled H2O, 20 mL of 3% H2O2) to observe the dispersion of GNP, grains morphology and microstructure of the composite in an optical microscope (Zeiss Axiovert A1, Carl Zeiss MicroImaging GmbH, Göttingen, Germany). A Scanning Electron Microscope (SEM), brand JEOL, model JSM-6010LA (Jeol Ltd., Tokyo, Japan), with energy dispersive spectroscopy (EDS) was used to verify the presence of GNP in the specimens.
X-ray diffraction (XRD) patterns of the annealed copper and of graphene powder were recorded on a Rigaku model Miniflex II Desktop X-ray Diffractometer (Rigaku Corporation, Tokyo, Japan) using Cu Kα radiation.
Raman measurements were performed using a Raman triple grating spectrometer system (T64000—Horiba Jovin-Yvon, Horiba Ltd., Kyoto, Japan) coupled with a Horiba confocal microscope. The excitation wavelength of the source was 532 nm, and its maximum power was 5 W.
A Jeol JSM-6701F (Jeol Ltd., Tokyo, Japan) scanning electron microscope was used to analyze the fracture surfaces.

2.3. Mechanical Properties

A waterjet cutting machine cut dog-bone-shaped tensile test specimens from the composite strips. The specimens had a gauge length, width, and thickness of 20, 4, and 0.6 mm, respectively.
The tensile test was performed in a universal electromechanical testing machine (Instron—model 3369, Instron, Norwood, MA, USA) controlled via the sofware Bluehill version 2. The deformation speed of the tests was 0.5 mm/min, corresponding to a strain rate of 4.17 × 10⁻⁴ s−1. Data analysis allowed us to calculate the elongation, the yield strength, and the ultimate tensile strength (UTS) of the samples.

2.4. Electrical Conductivity

A digital micro-ohmmeter was used to measure the electrical resistance twice in the tensile test specimens, just in their narrowest straight part (the second time, we reversed the polarity in the micro-ohmmeter). The arithmetic mean was chosen as the most probable value of the resistance, and half of the difference between the values obtained in the two measurements was used as uncertainty. One can determine the electrical conductivity using the following formula:
σ = L R w t   ,
where L is the gauge length, w is the width, t is the thickness, and R is the resistance of the narrowest and straight part of the specimen.

3. Results

3.1. Constituents of the Composite

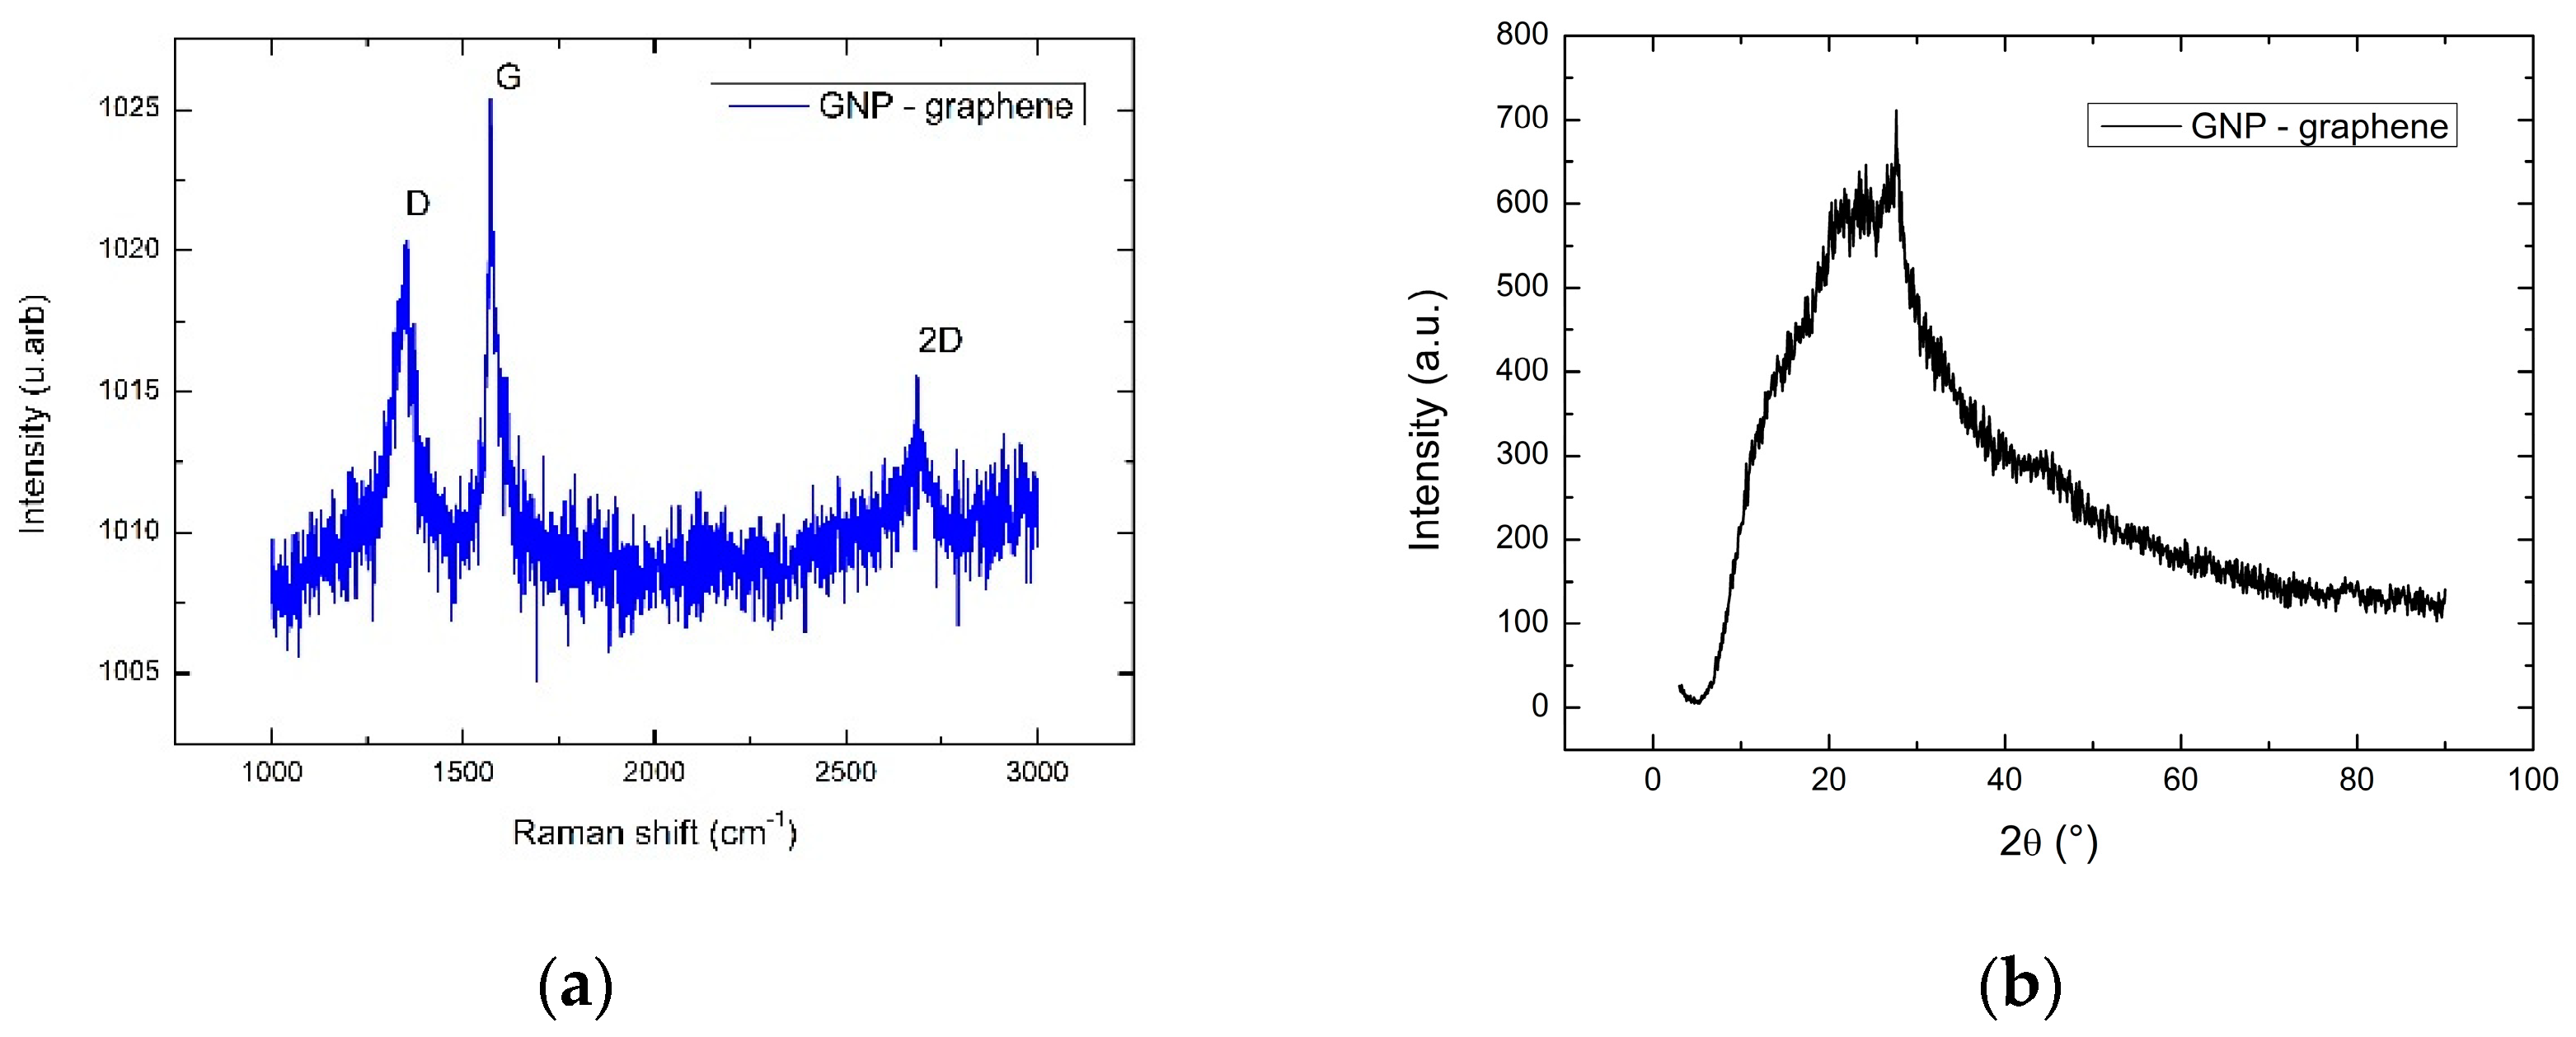
3.1.1. GNP—Graphene Powder

Figure 3 shows the results of two analytical techniques applied to the GNP powder: (a) the Raman spectrography and (b) the X-ray diffraction analysis.
The peak in XRD occurs at approximately 27°, which differs from the XRD graphite typical peak by 1.1% since the distance between the graphene layers is almost the same in graphite. The Raman spectrum reveals shift values for the D, G, and 2D bands near the typical values of graphene bands found in the literature. An intense D band in the spectrum indicates many defects in the graphene structure.

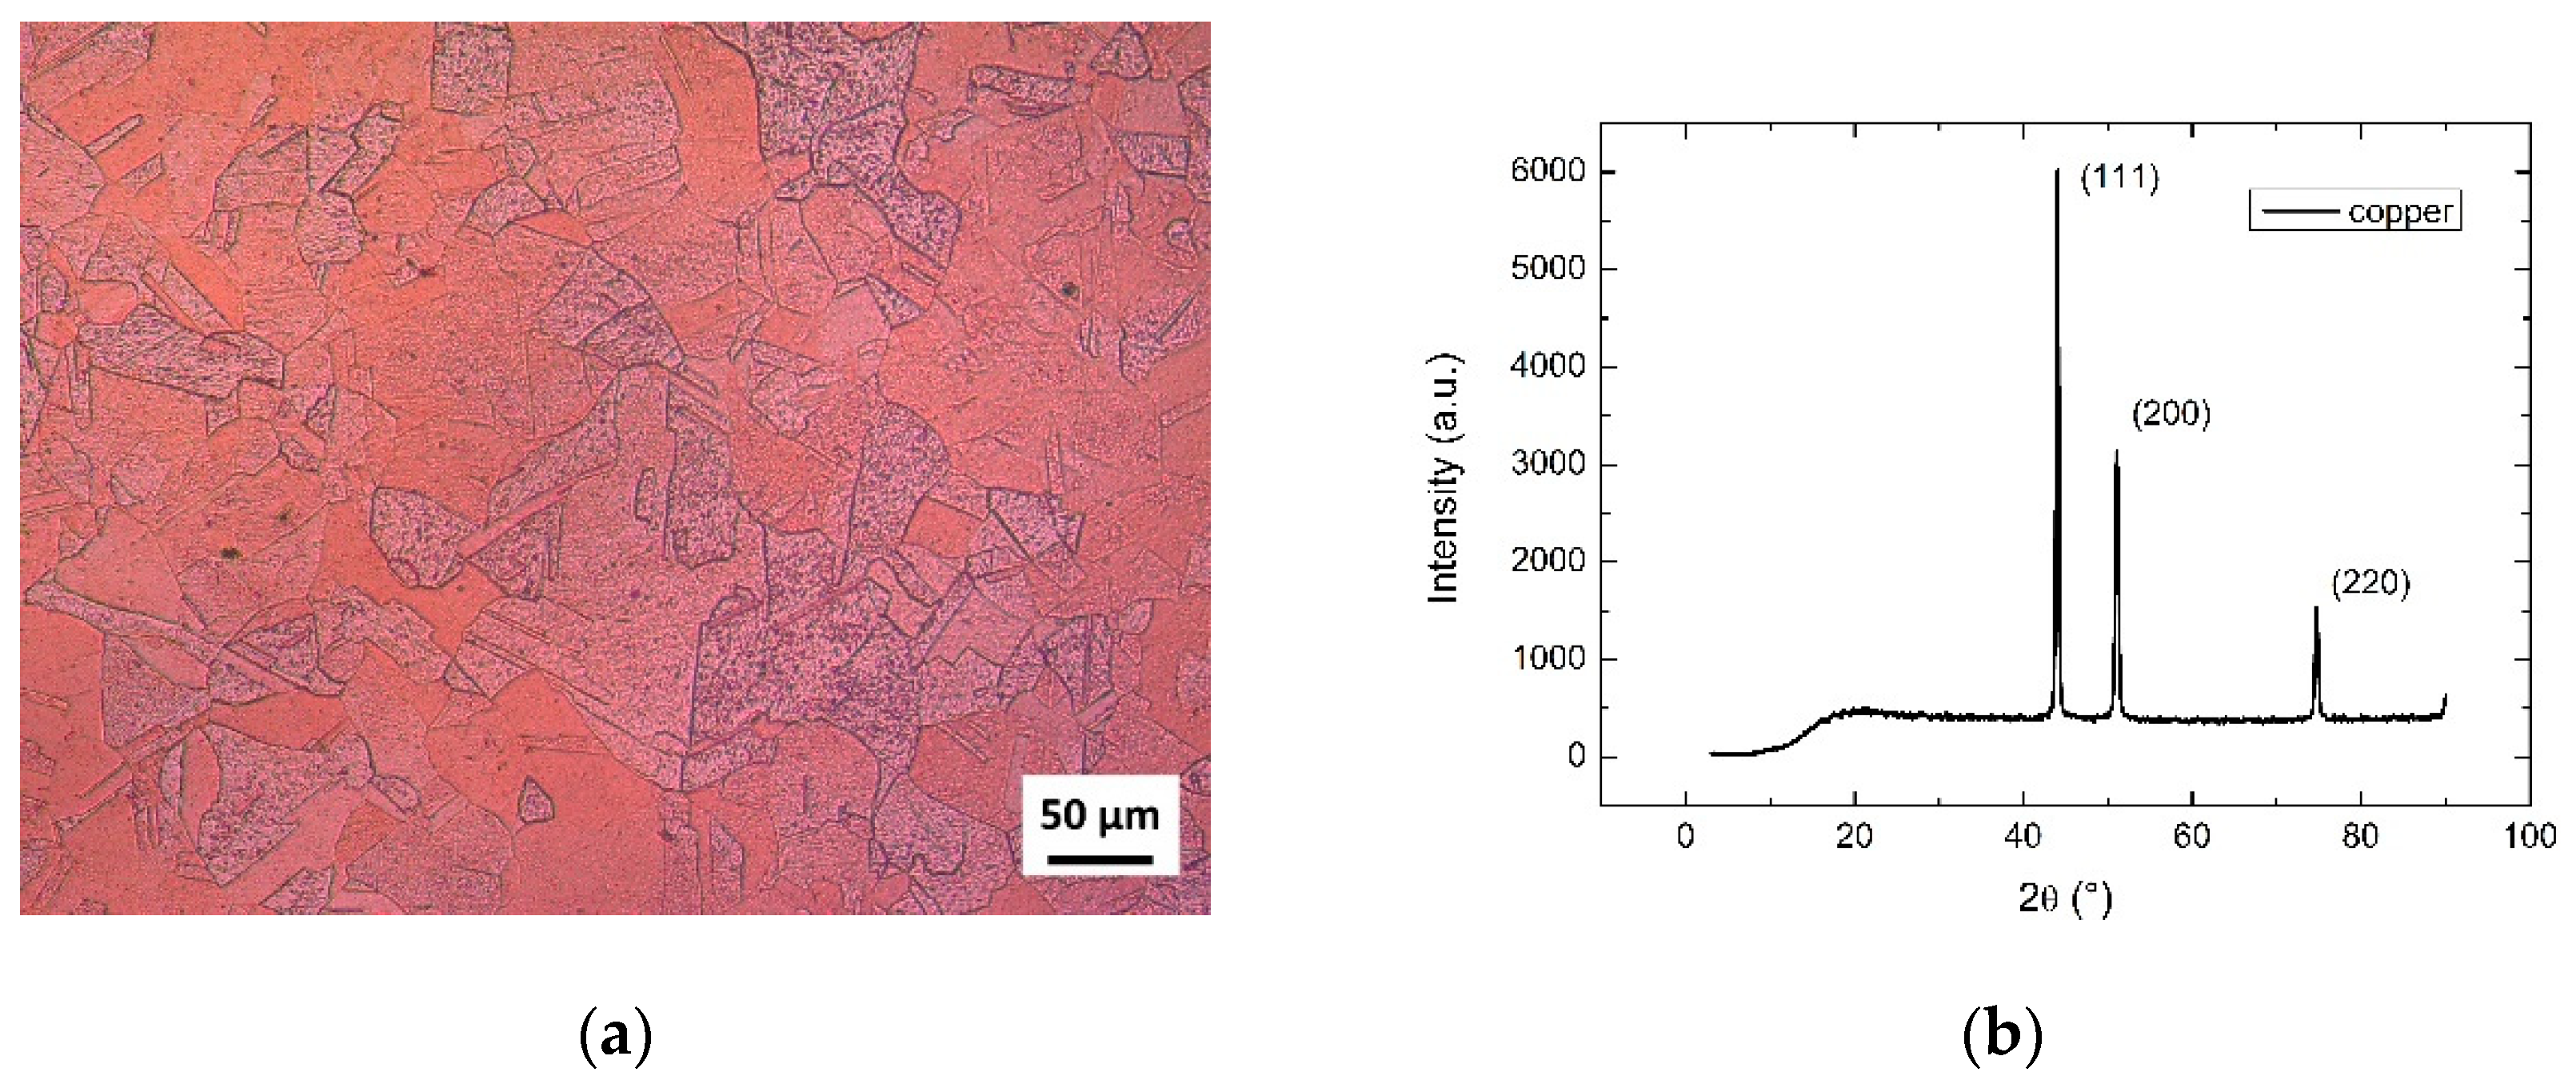
3.1.2. Copper Sheets

After the initial annealing of the electrolytic tough-pitch copper sheets, its microstructure became uniform, as shown in Figure 4a. Figure 4b shows the XRD spectrum of the annealed copper. The principal peaks of the spectrum correspond to those reported in the literature for the copper, the (111), (200), and (220) crystallographic planes.

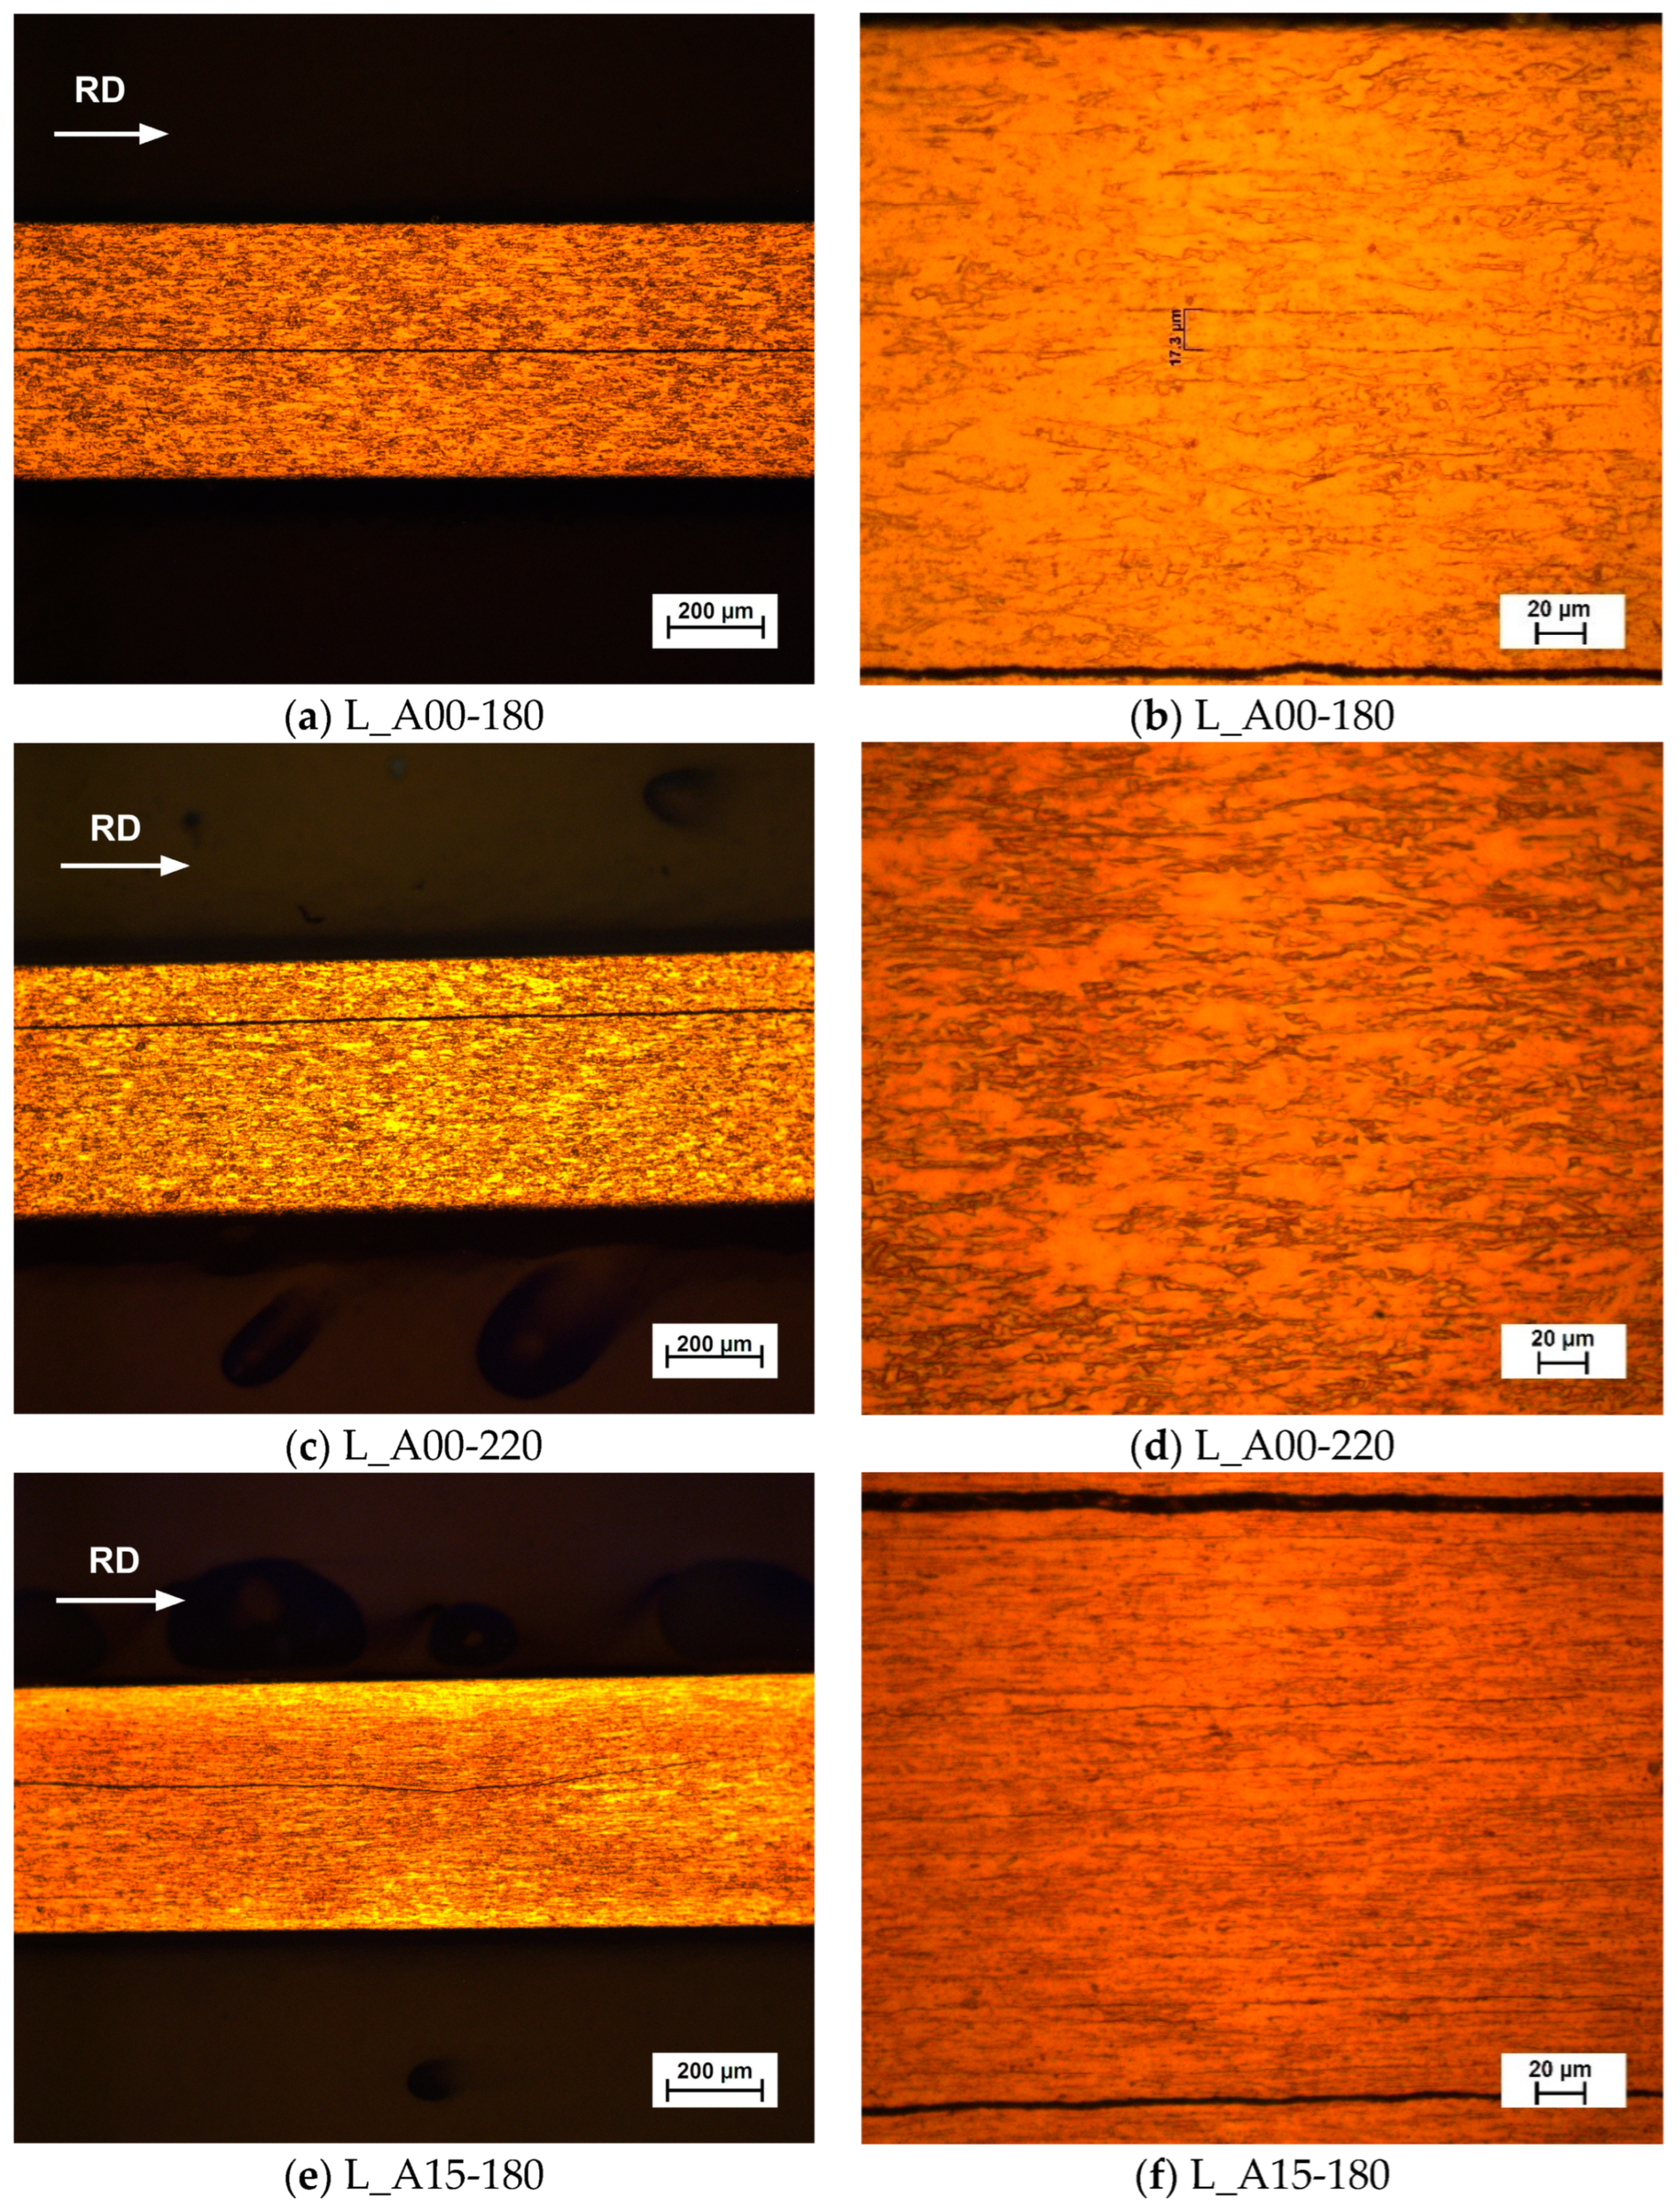
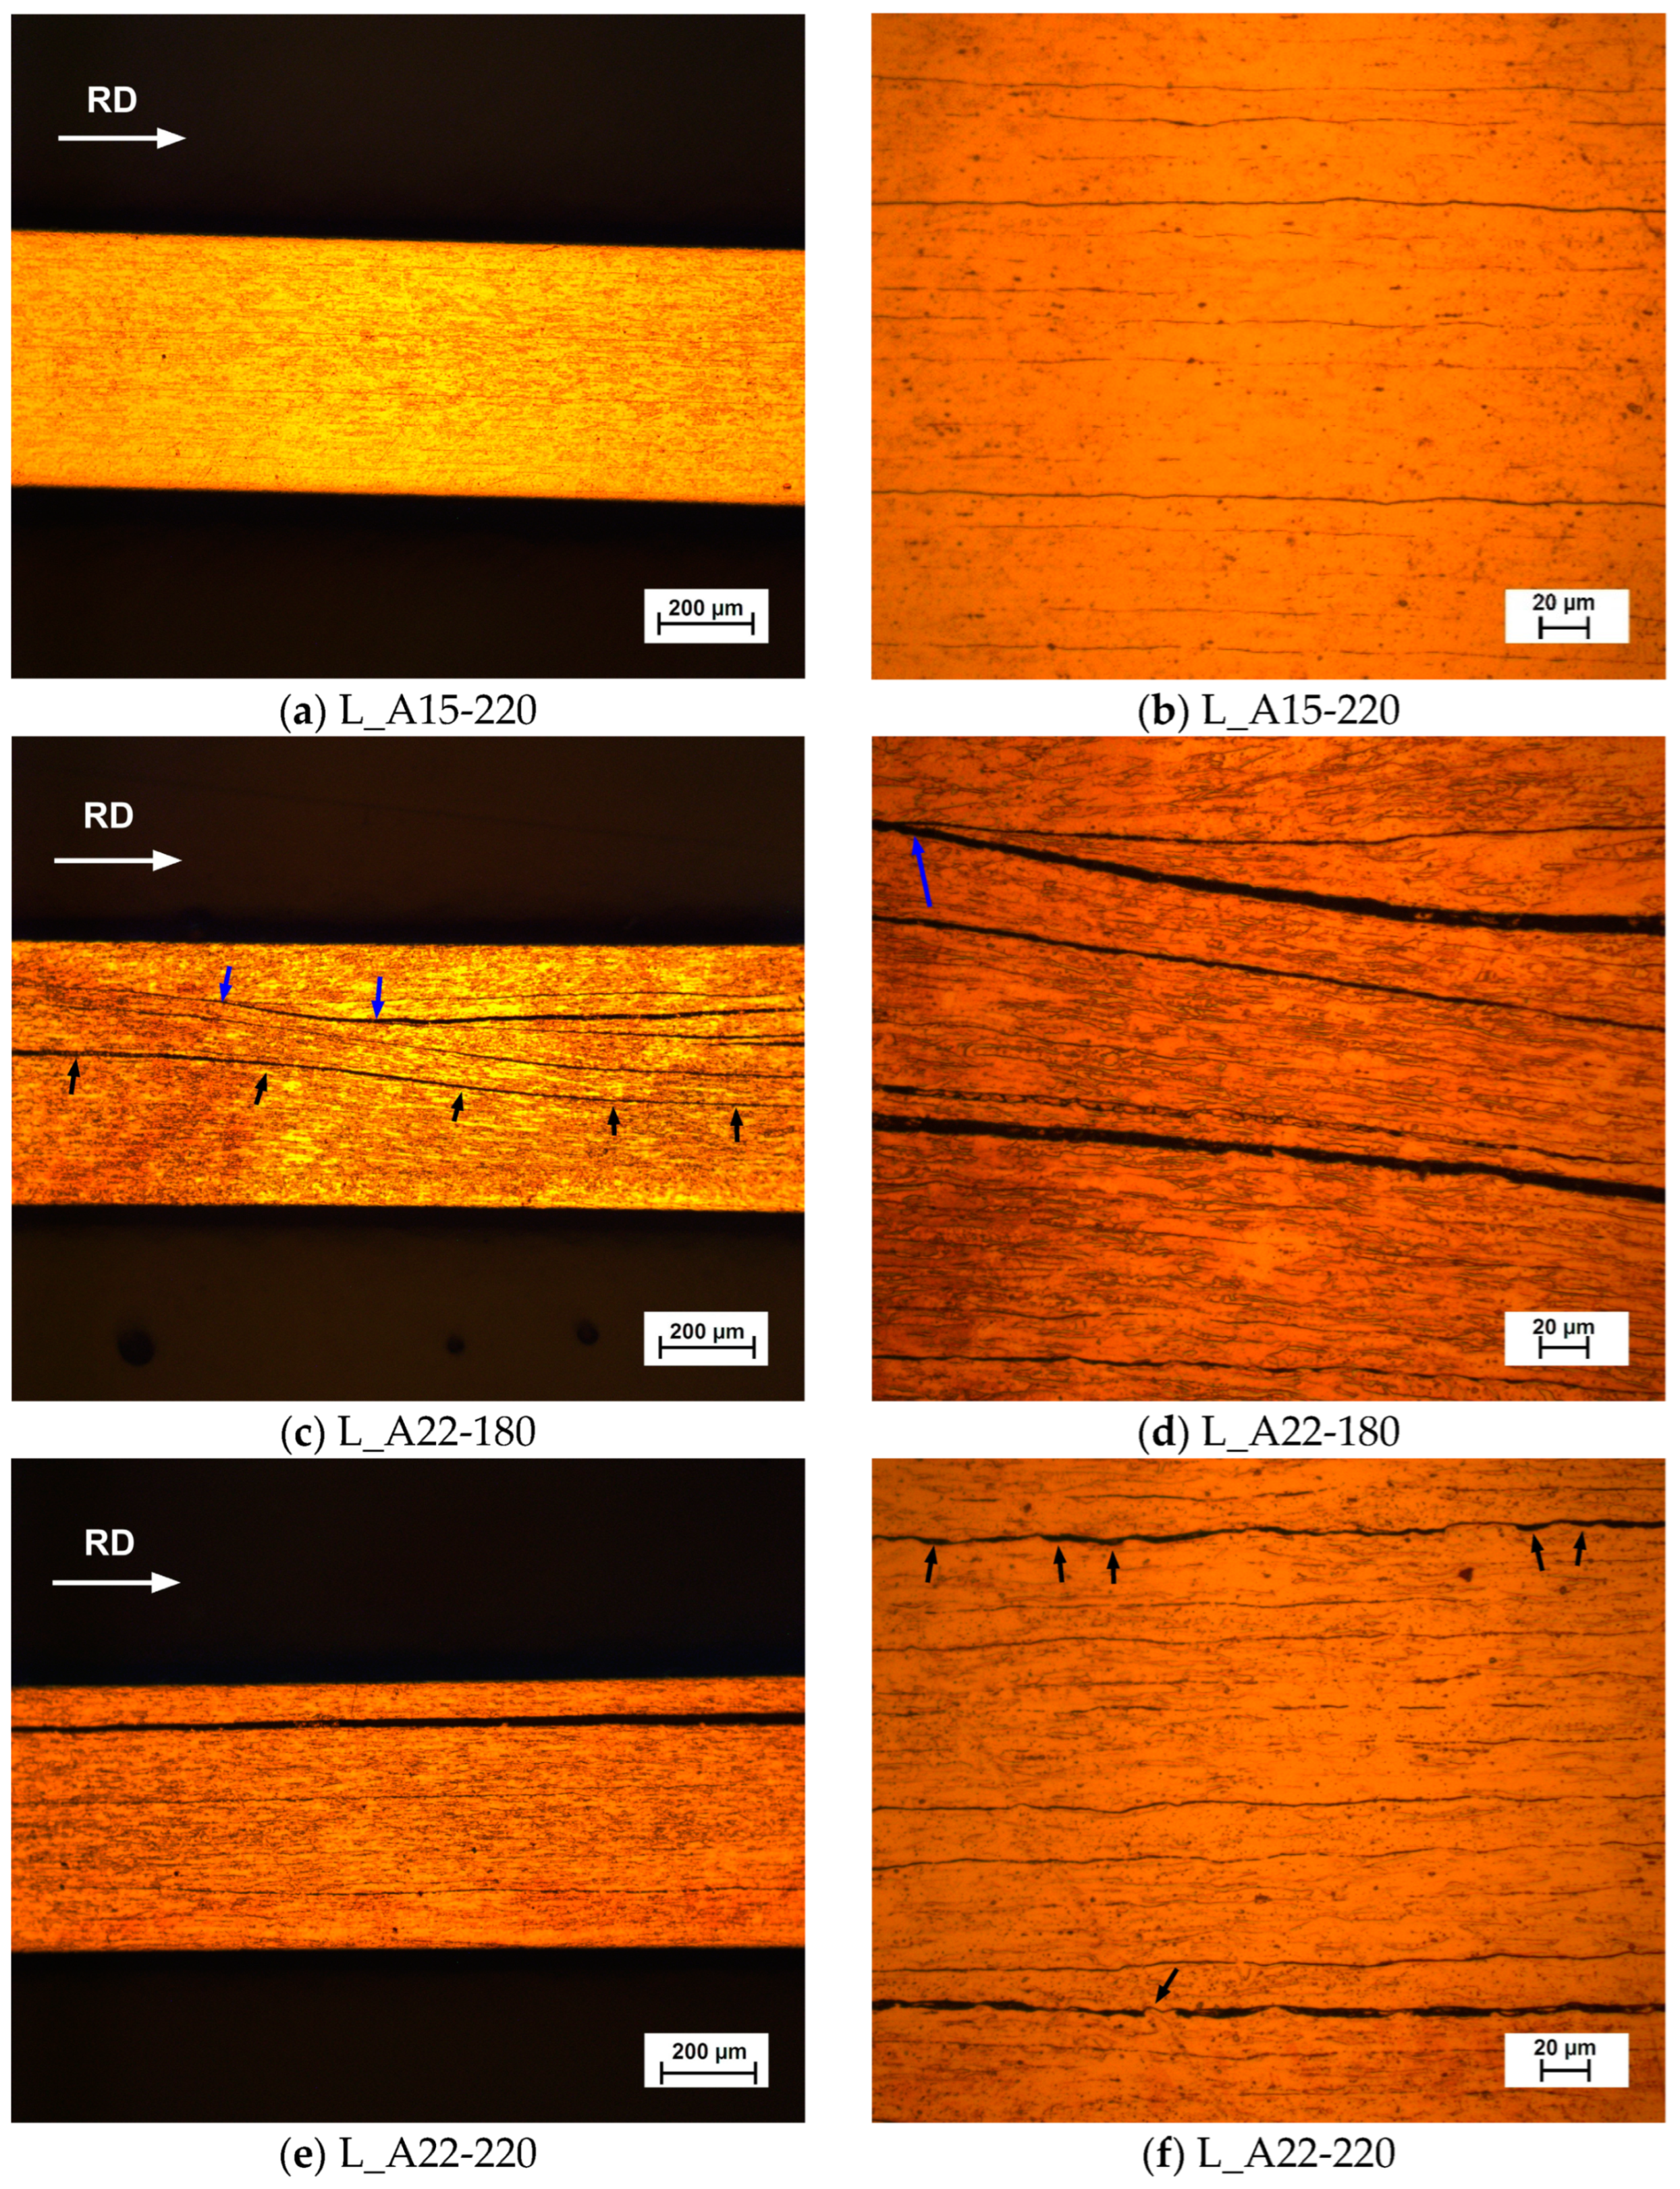
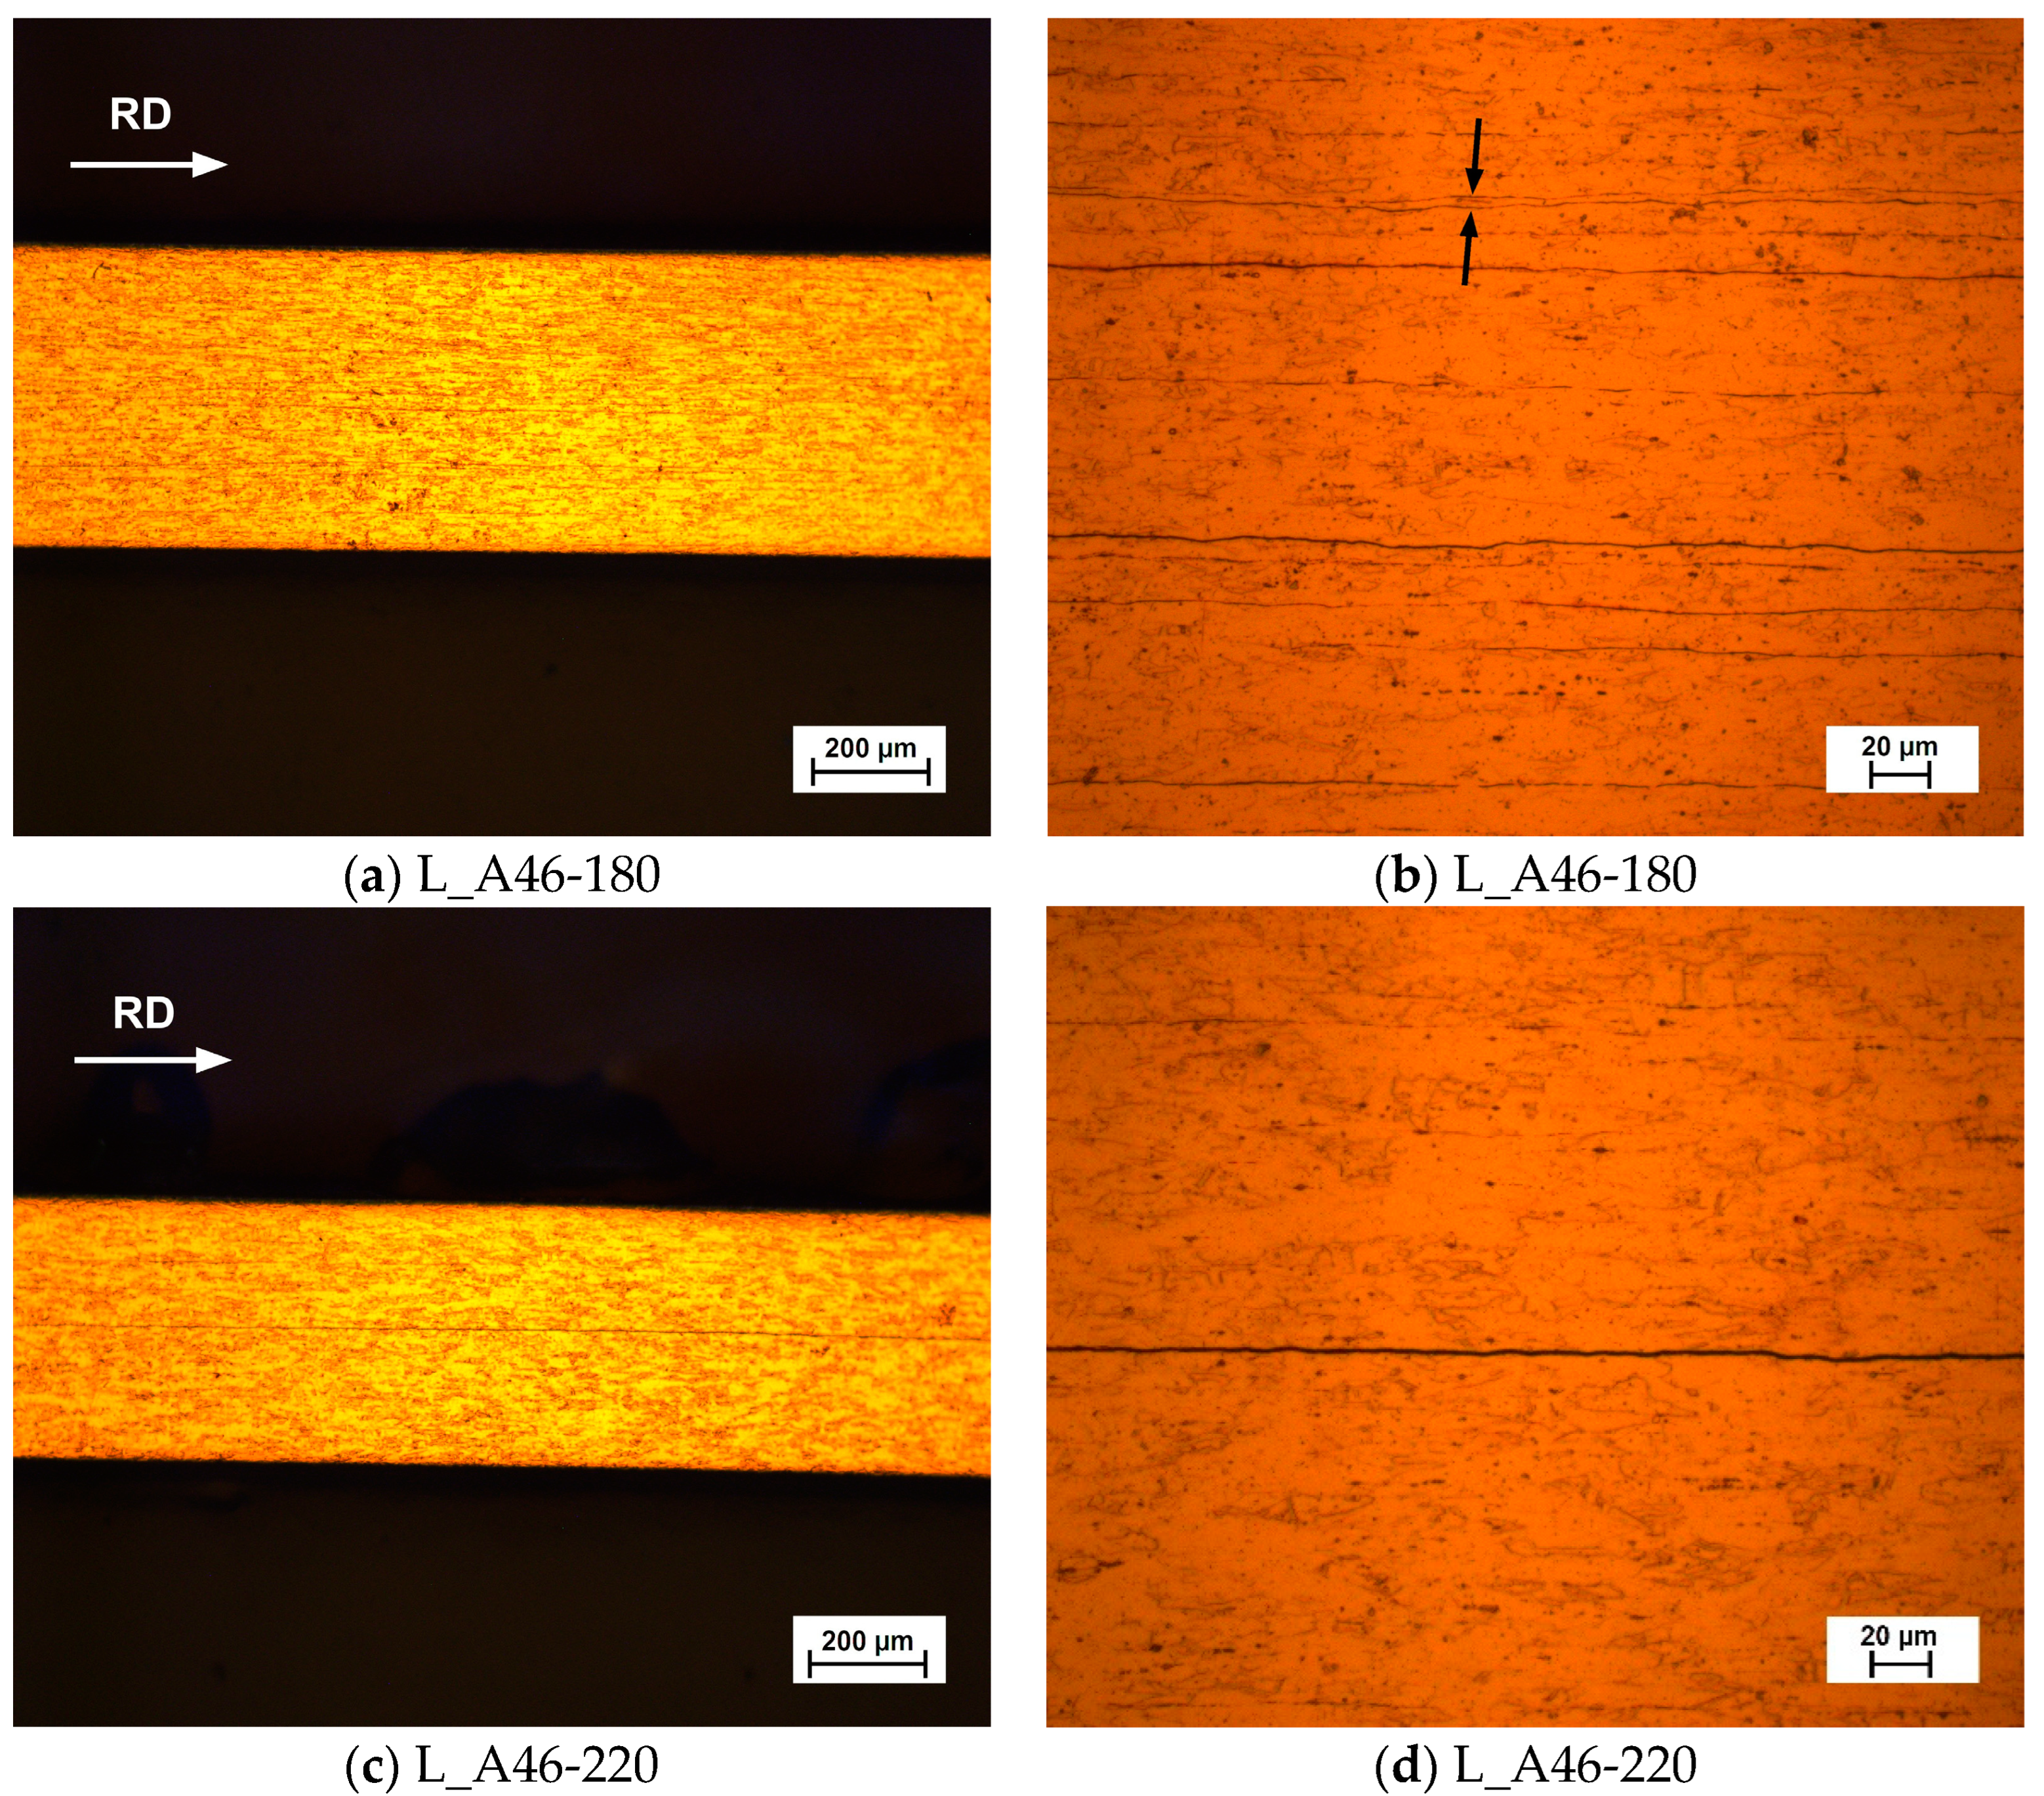
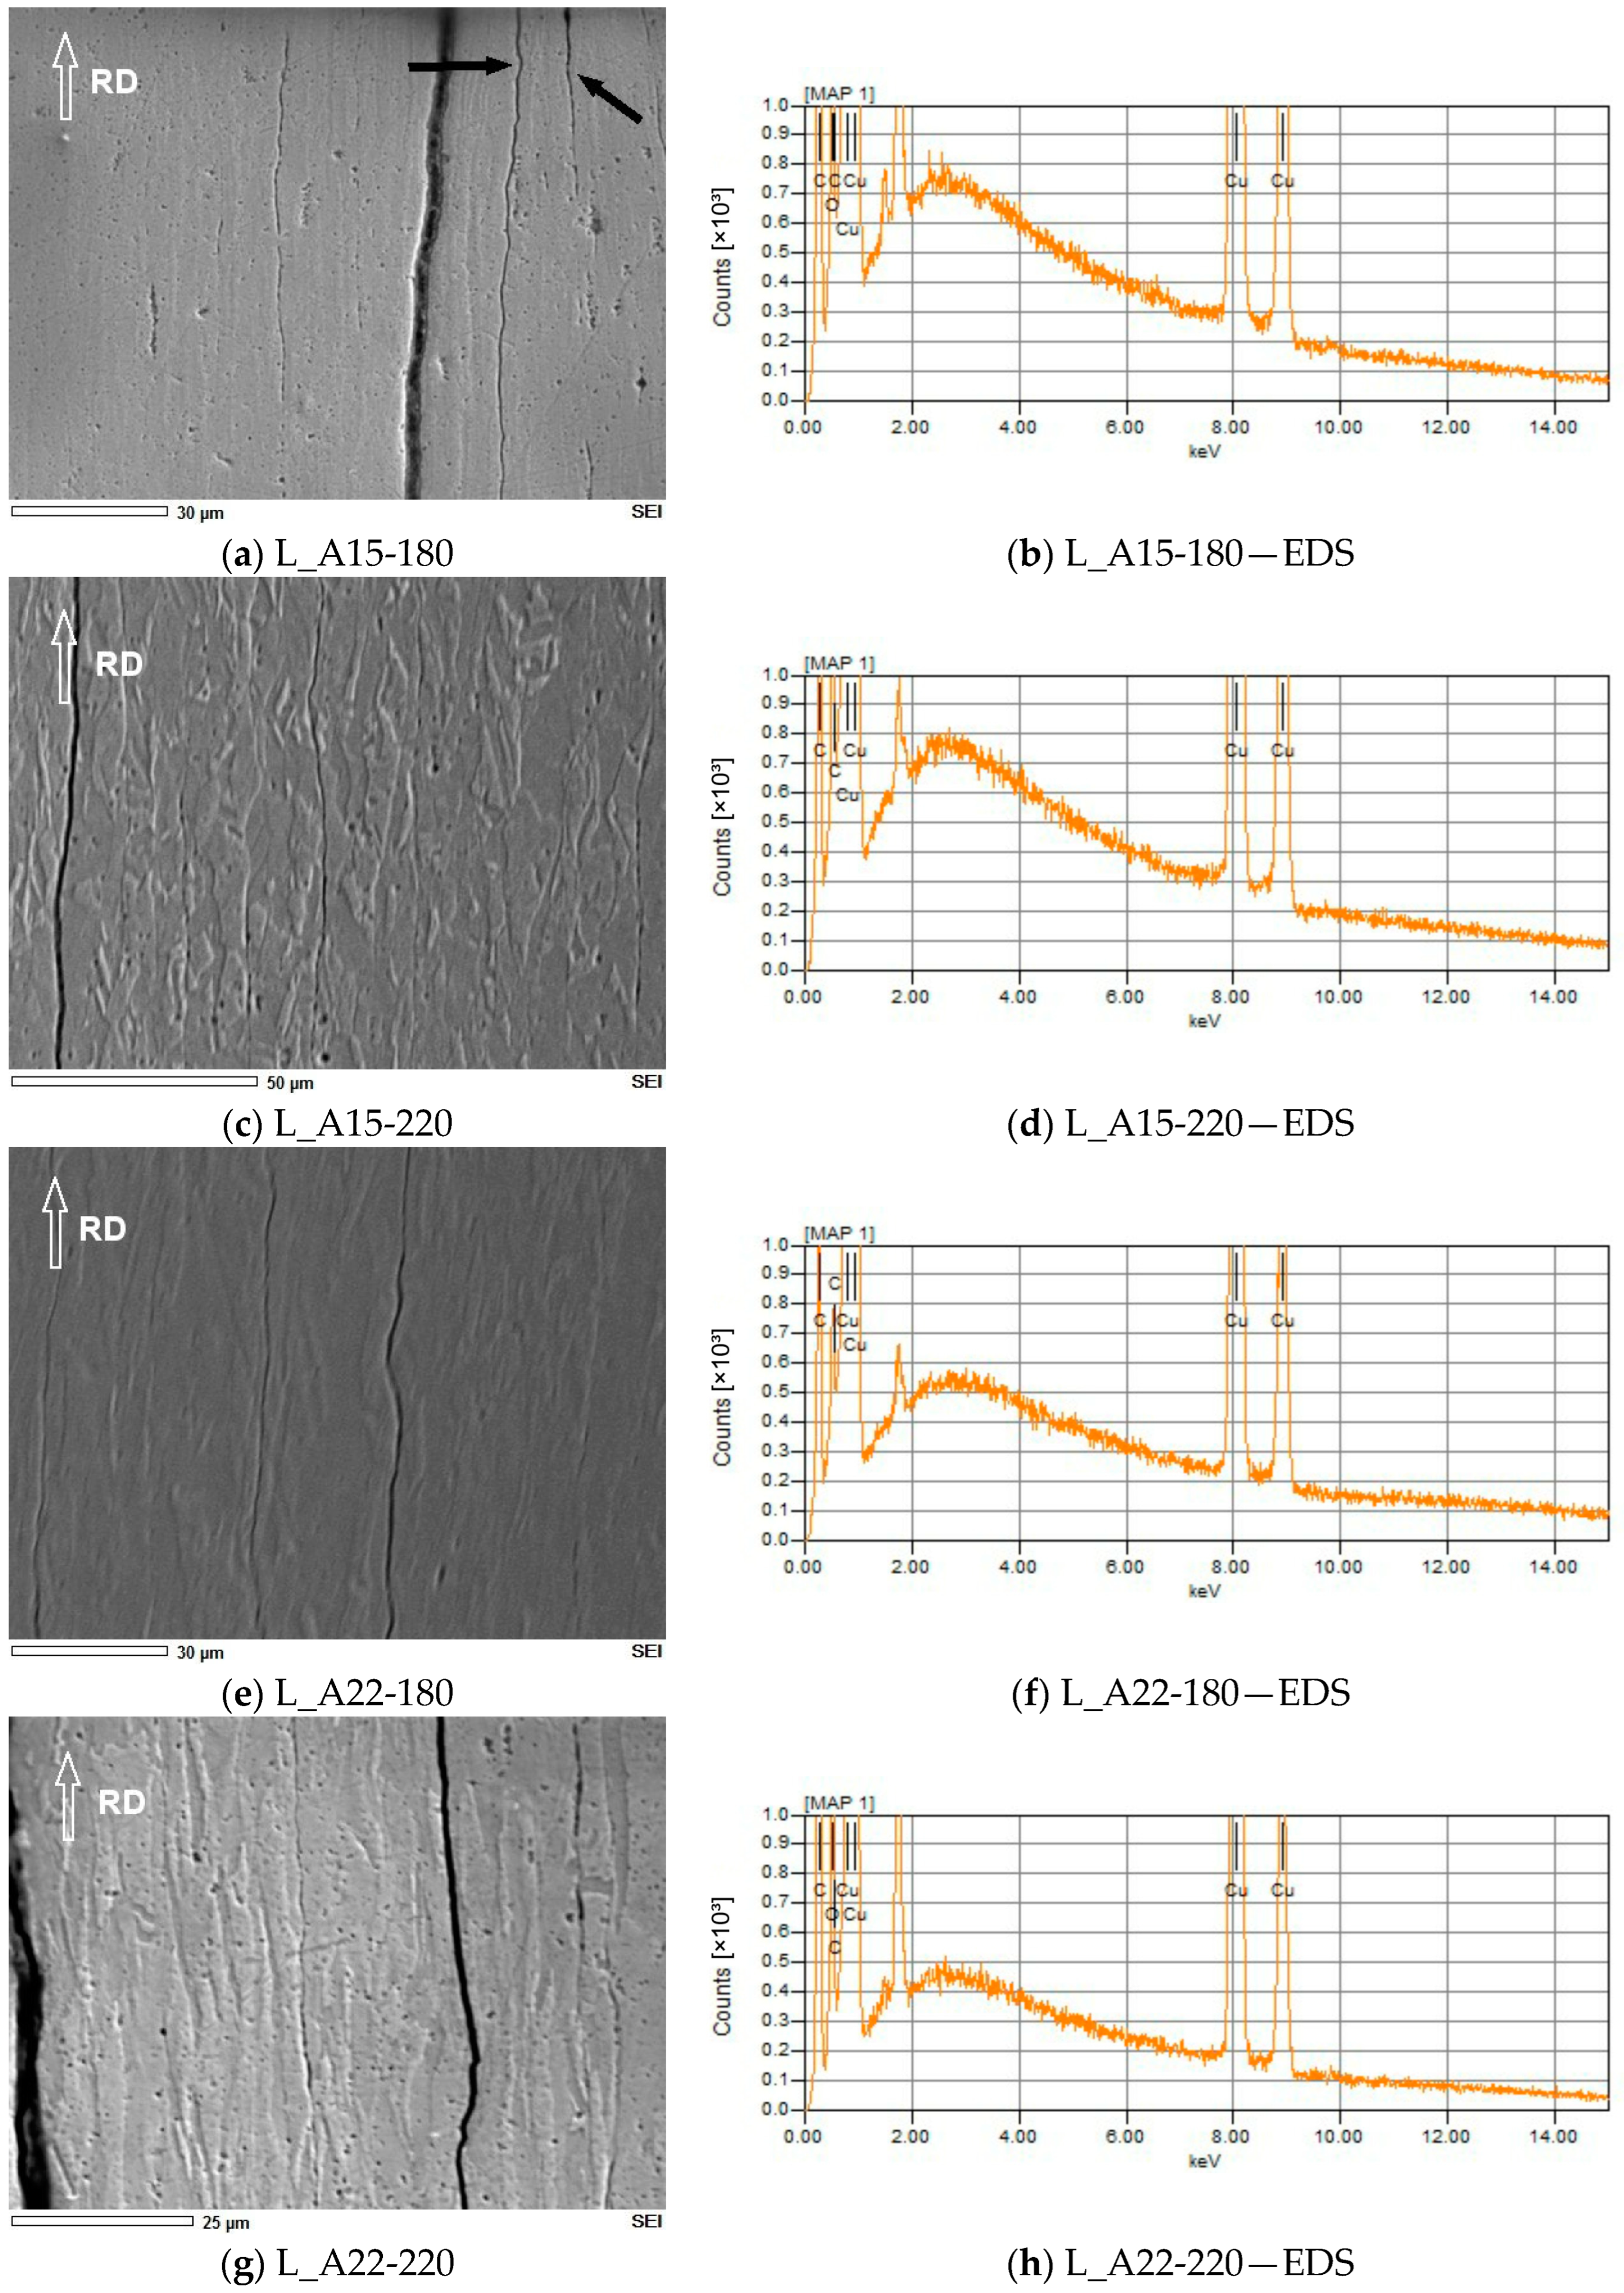
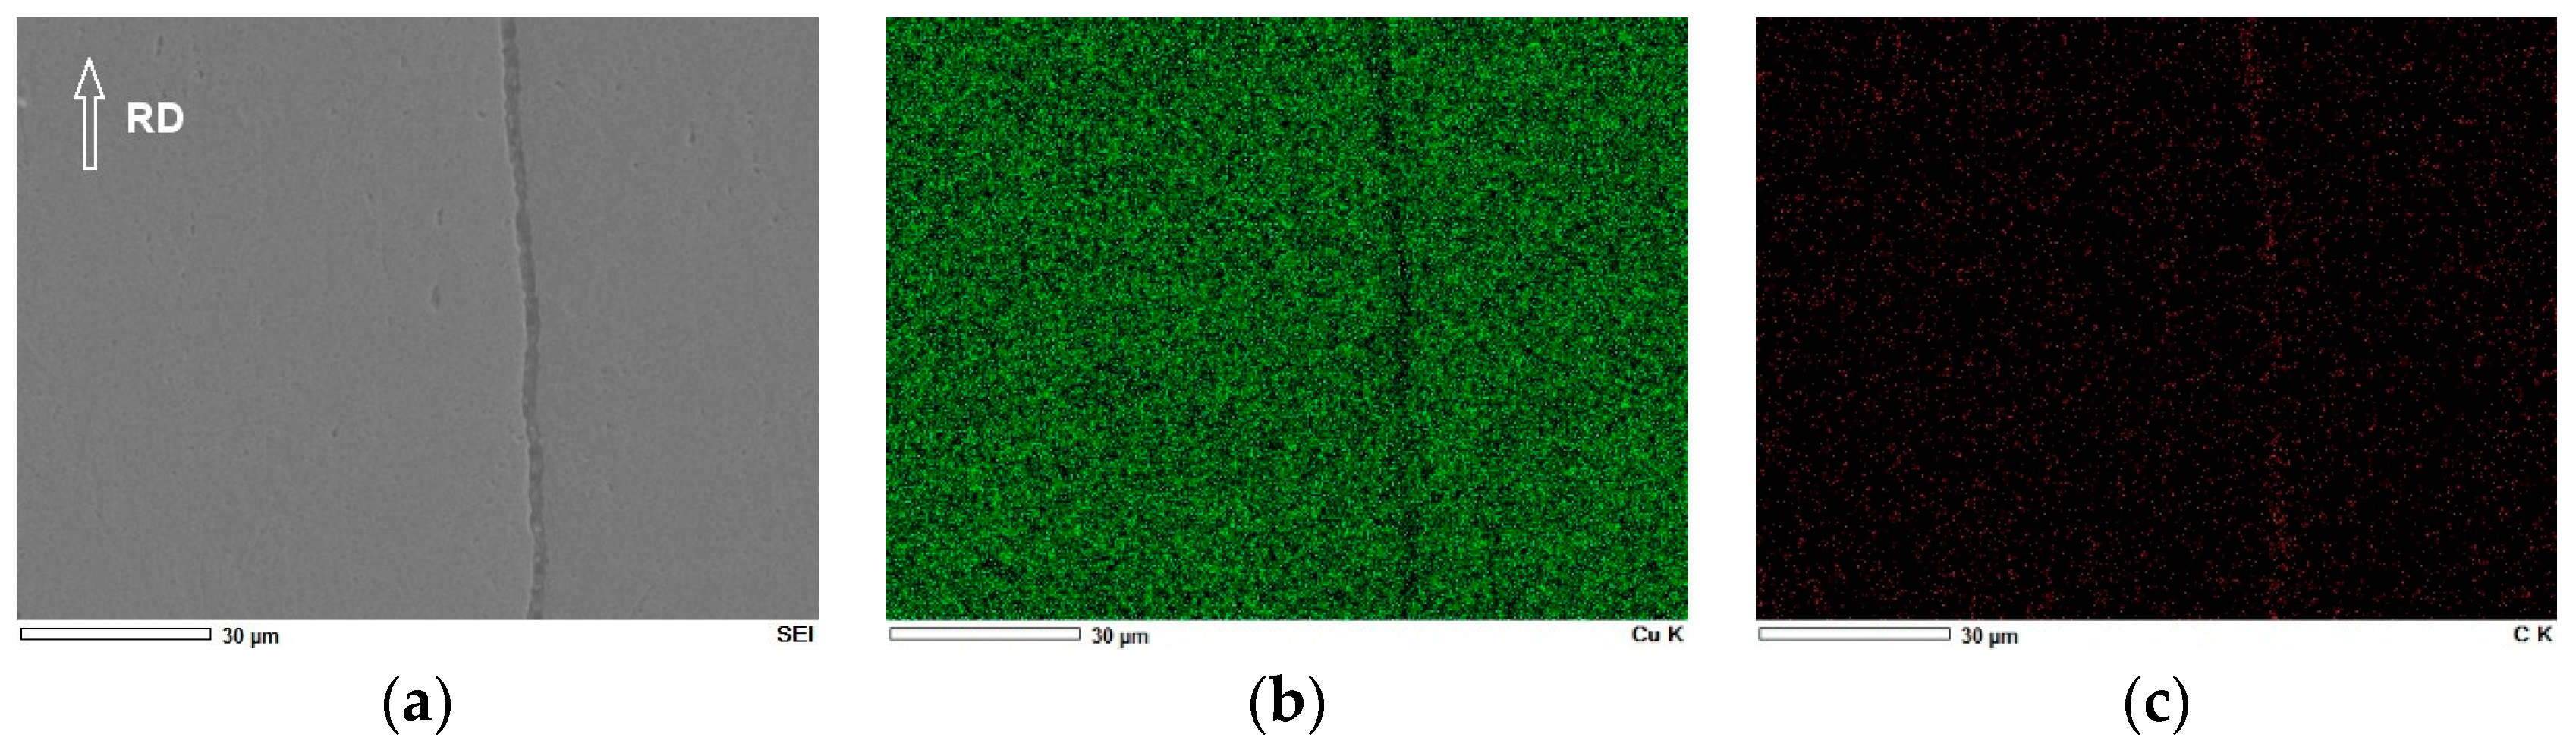
3.2. Micrographs of the Composite Cu/GNP

The optical microscopy images in Figure 5, Figure 6 and Figure 7 illustrate the microstructures at the RD-ND plane of nano-composites fabricated using up to five passes of rolling (four ARB cycles + final rolling) and five heat treatments (annealing + final stress relief). The final strips have 36 layers, 35 interfaces between layers, 24 with graphene, and 11 without the nanomaterial. The mean thickness of the layers is approximately 16.7 μm. The delamination shown in Figure 5, Figure 6 and Figure 7 generally occurs in the 18th or the (3n − 1)th or (3n − 2)th interlayer (where n is a whole number and 1 ≤ n ≤ 12).
The 18th interlayer is the last one to be bounded; therefore, it is the interlayer with fewer microextrusions. The (3n − 1)th or (3n − 2)th are interlayers with graphene, which can reduce the bonding force since there is less area for microextrusions from one layer to the other. We can observe in Figure 6c that there is some undulation in the form of some layers. One can also see some layer fragmentation in the specimen at some point along their length (Figure 6c,d). This fragmentation leads to poor mechanical properties, such as ultimate strength, and total elongation.
Poorly adhered wavy layers full of indentations (Figure 6f and Figure 8a) present stress concentration points, which can lead to premature fracture of the material, giving the material a more brittle behavior when faced with mechanical stress.
In the micrograph of specimen nine, Figure 7b, we can observe that the layer thickness of two layers is less than half of the mean layer thickness. This dissimilarity may result from differences in strength and work hardening caused by non-homogeneous rolling or non-homogenous heat treatment in a particular cycle. One can find a similar formation of layer instabilities in ARB-processed bi-metal multilayered composites [15,16,17,18]. Strain incompatibility due to differences in strength and work-hardening ability between constituent layers causes this phenomenon. The softer layers are stretched more during rolling than the harder ones, resulting in shear stress at the harder/softer interfaces. This stress leads the more rigid layers to behave as they would in tensile tests, causing necking and layer instabilities when shear stress surpasses the layer’s yield strength [15].
Some layer cracks may have arisen due to the blistering phenomenon. The arising of these bubbles probably results from the action of some gas (Hydrogen from the atmosphere’s water vapor or encapsulated air) on the surface of the strip during annealing [19,20]. The superficial blisters that eventually appear during annealing can burst when they are brushed (cleaning operation) or rolled, causing a partial rupture of the layer at a specific position on the strip. This localized rupture could worsen or lead to a complete layer rupture during subsequent rolling cycles.
The corresponding EDS spectrum of the SEM micrographs depicted in Figure 8 shows the presence of carbon, copper, and eventually oxygen in the samples.
Some researchers state that the minimum amount of chemical element detectable via EDS in a sample is 0.1 wt% [21]. The minimum amount of graphene we put in the samples was 0.15 vol%, corresponding to approximately 0.04 wt%; however, even in the samples with this amount, the EDS detected the presence of carbon. This detection may be due to the metallographic process that has spread some graphene confined between the layers across the entire sample surface, as shown in Figure 9c.
We can observe that the concentration of carbon is more visible in the space between layers, which did not perfectly adhere to one another.

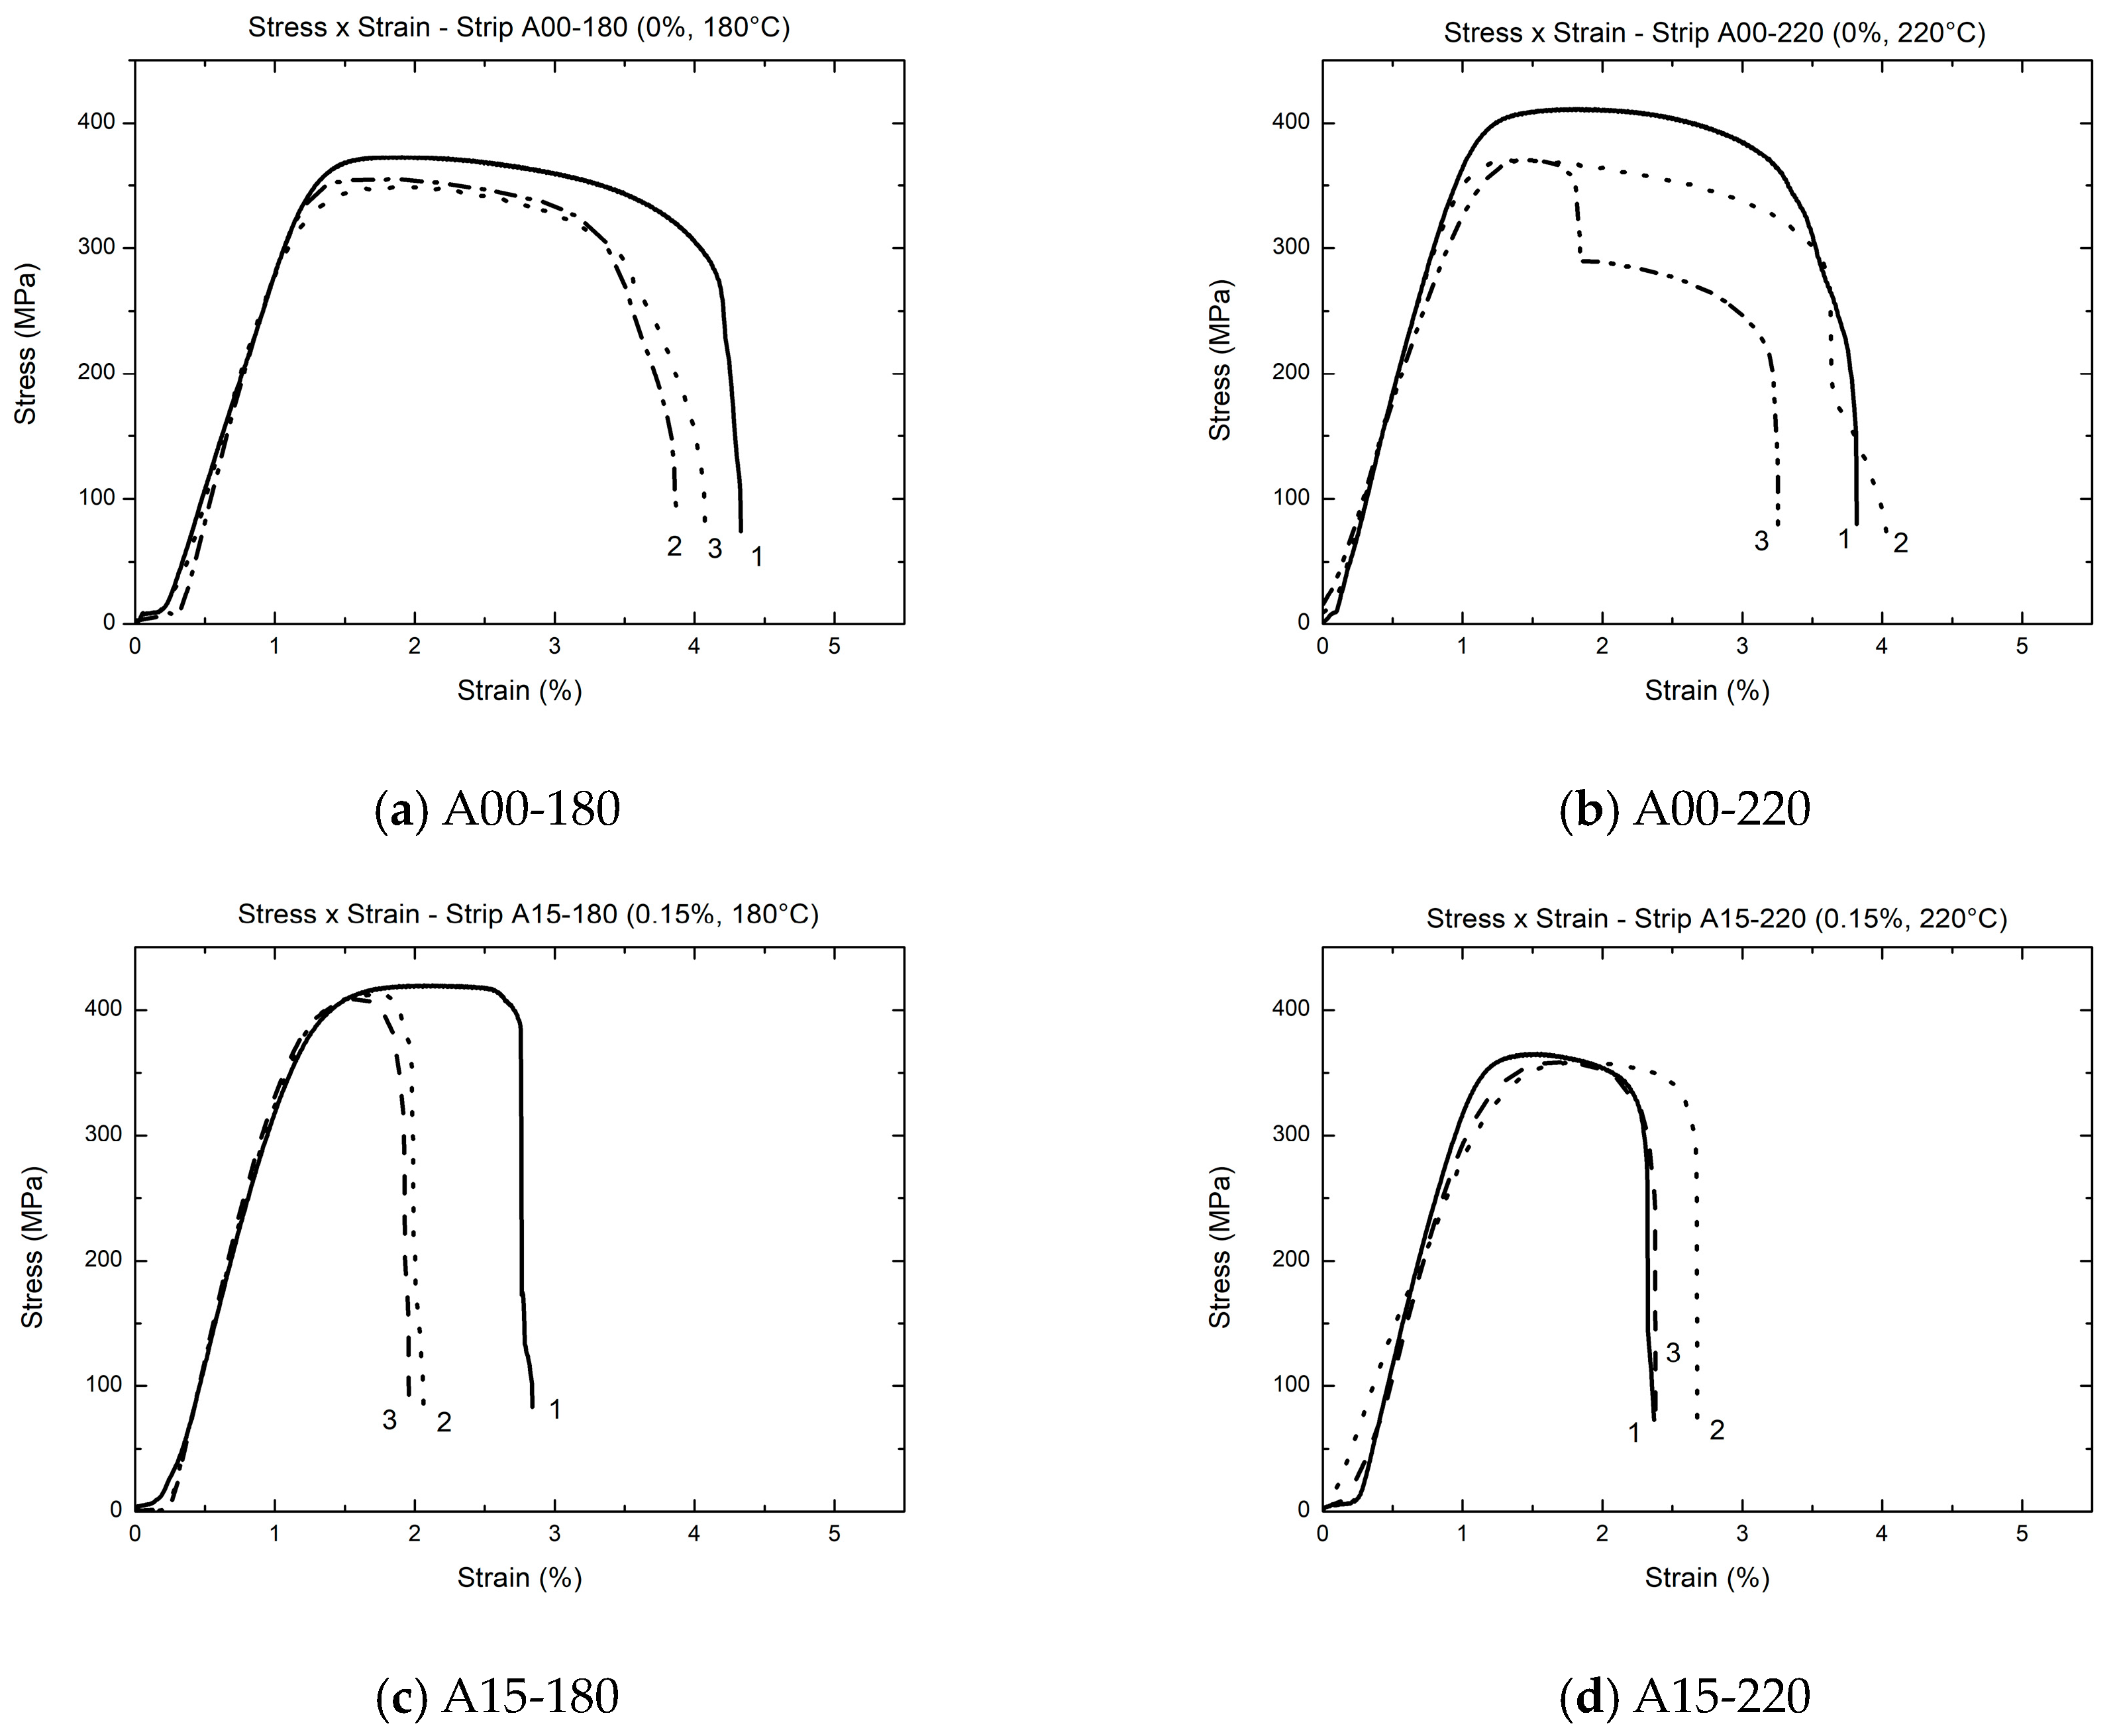
3.3. Mechanical Properties
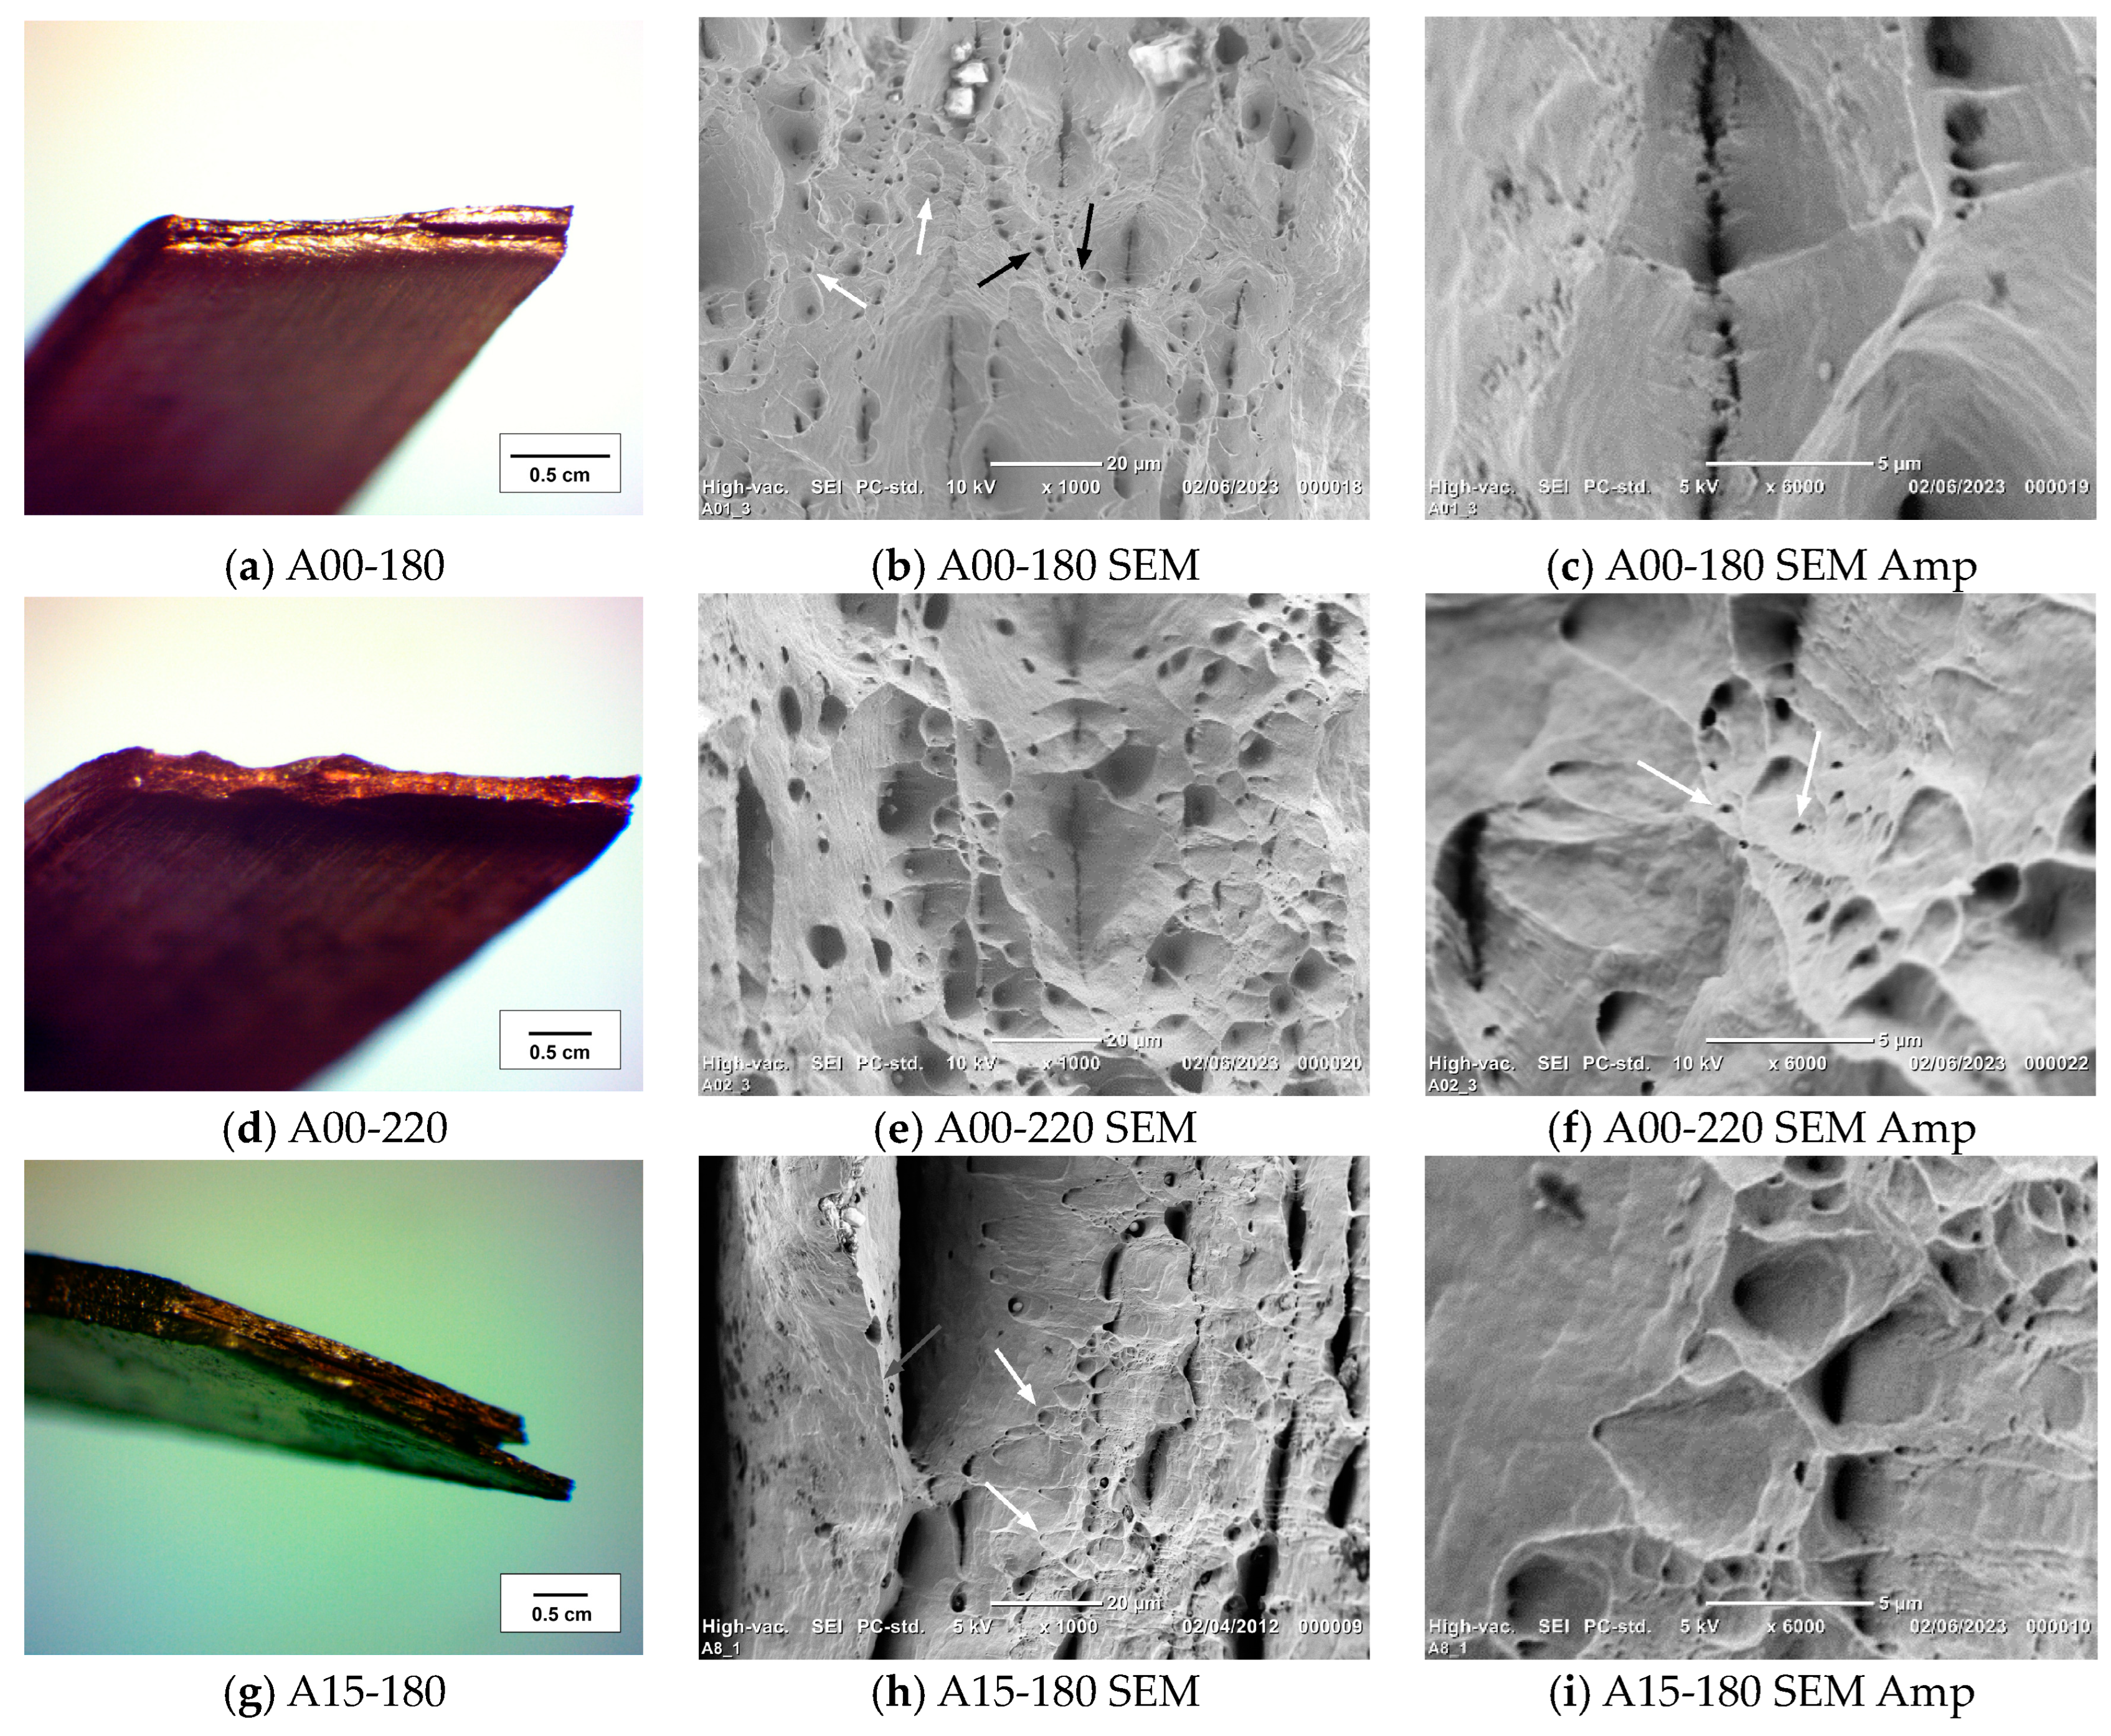
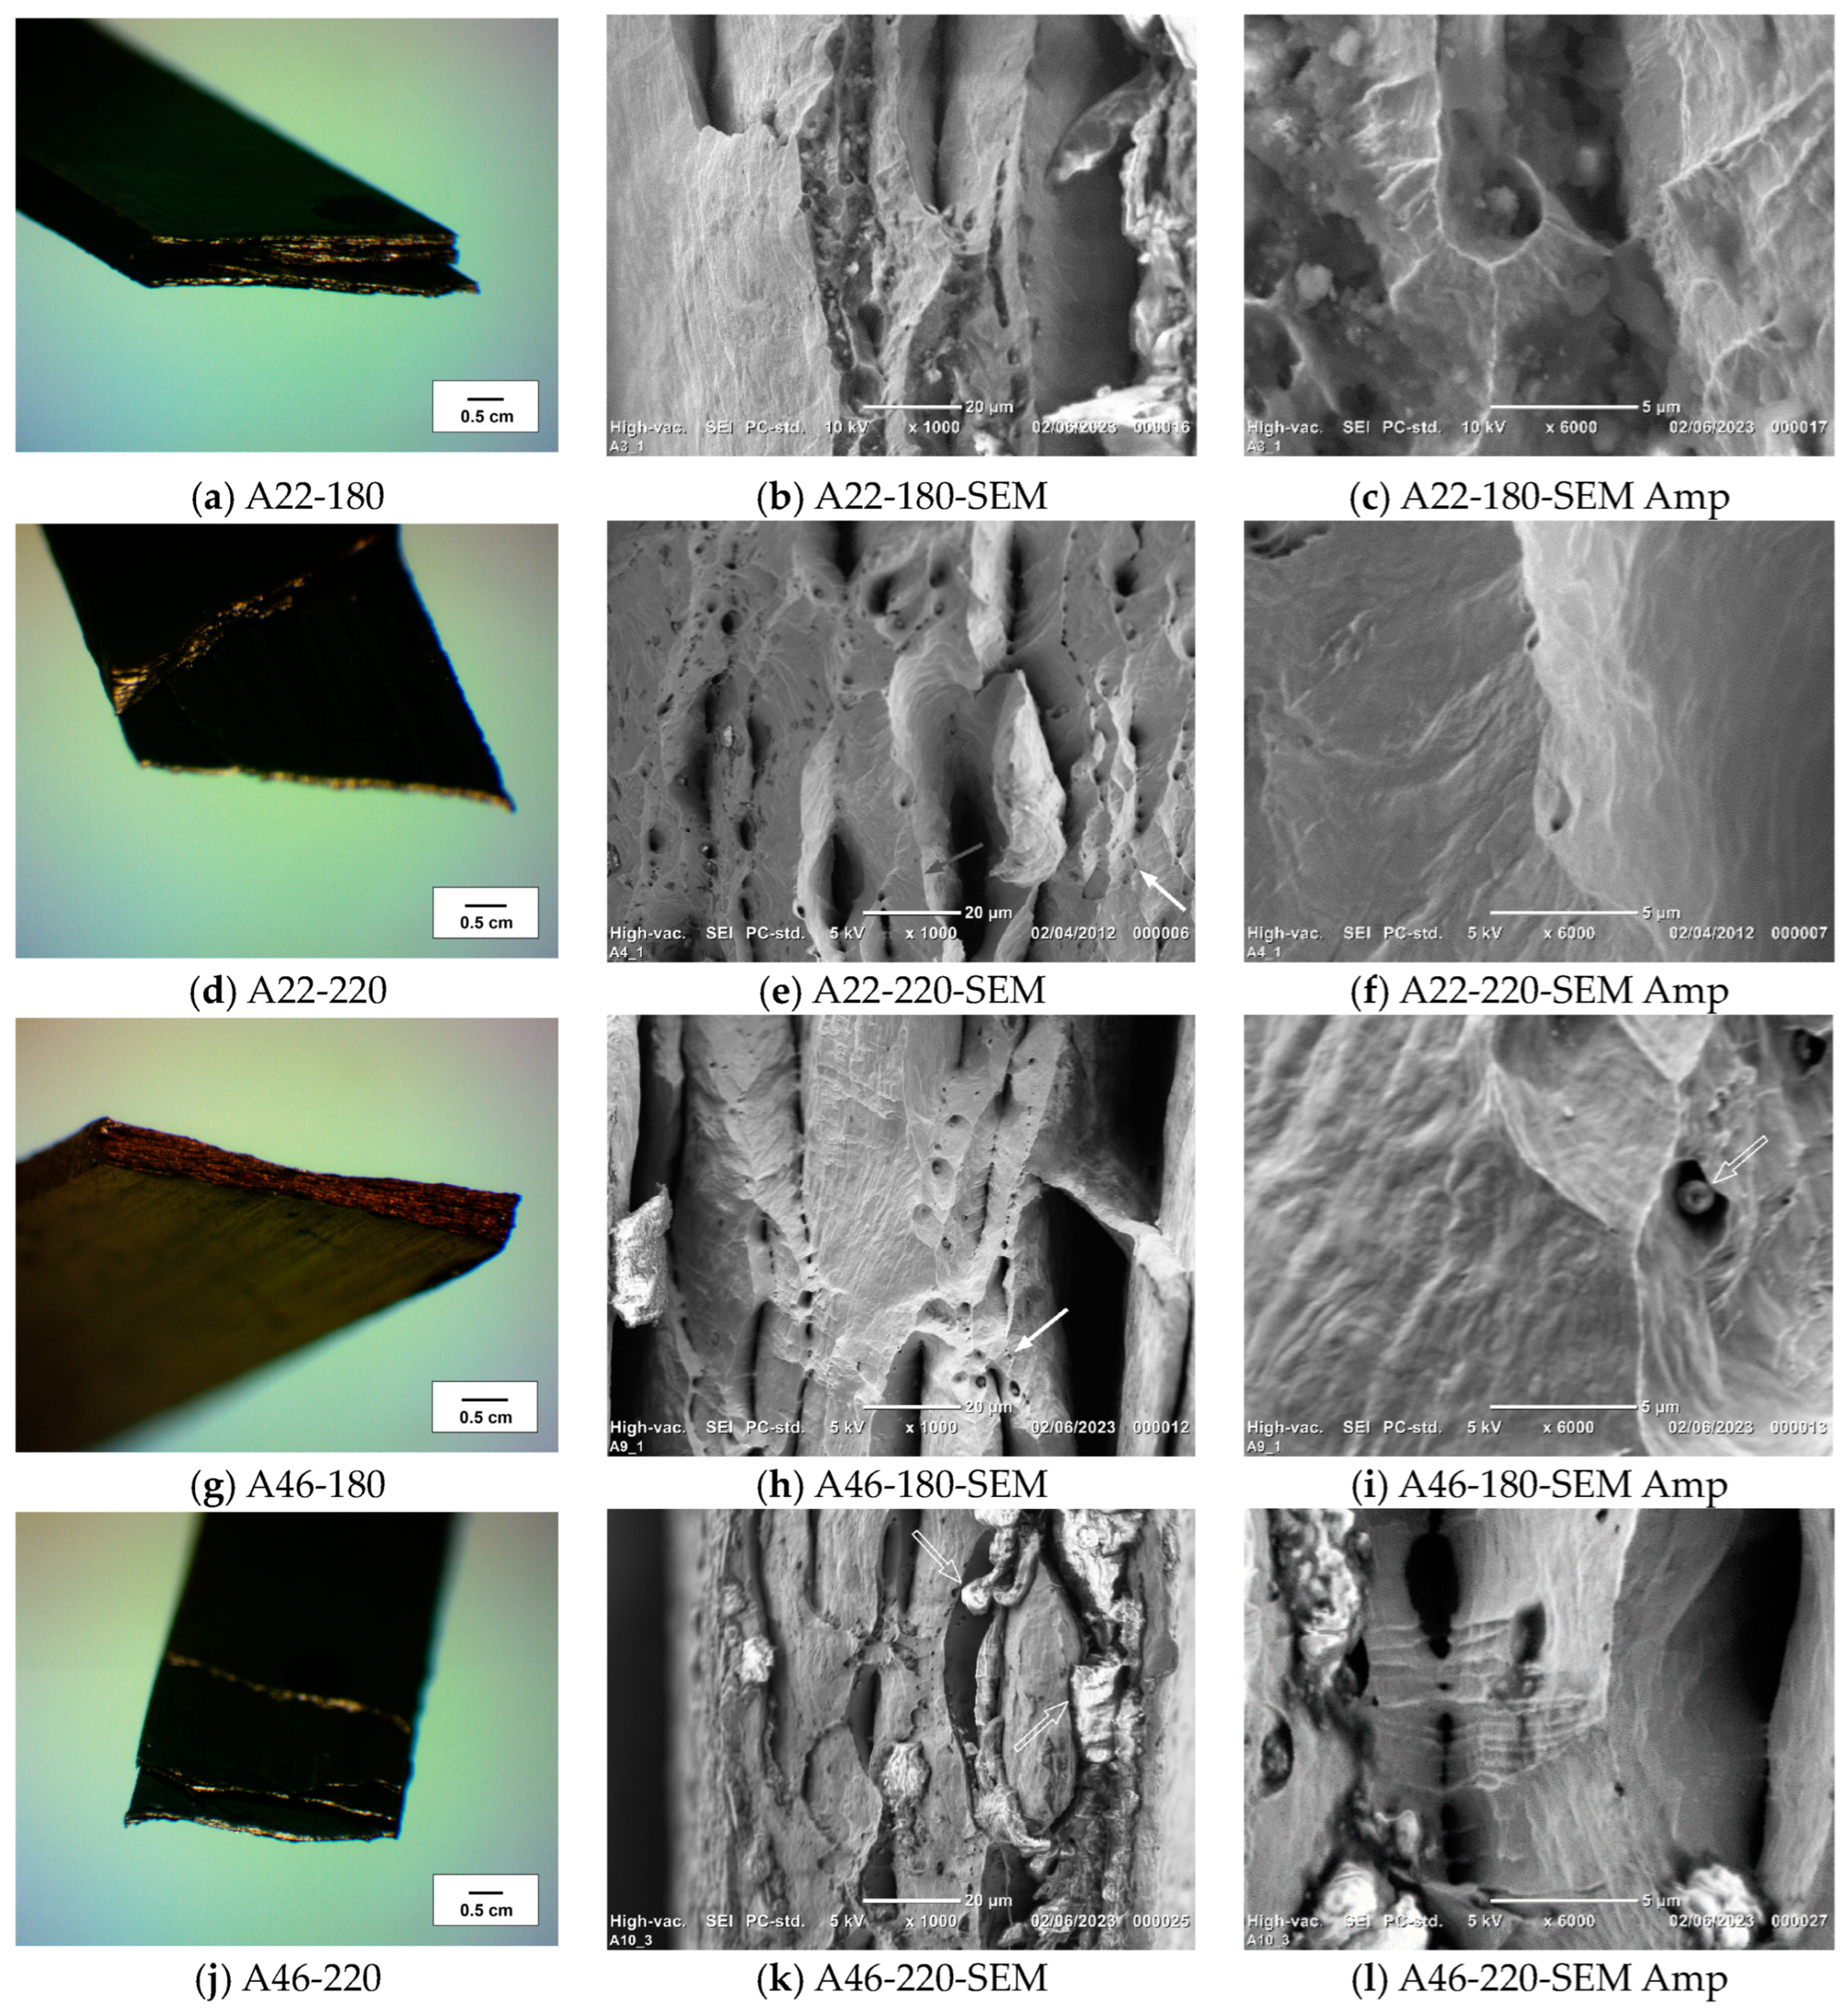
The yield strength of the initial annealed copper sheets was approximately 35 MPa, its ultimate tensile strength was 227 ± 9 MPa, and its total elongation was 73 ± 3%.
The engineering stress × engineering strain curves in Figure 10 are from the test specimens taken from the composite material strips produced. Each strip has a certain graphene content and has undergone a final stress-relieving treatment at a specific temperature. Each curve has an identification number to make the citation easier.
The initial non-linear snippets of the stress–strain graphs in Figure 10 can be caused by small bends or twists in flat specimens, slight asymmetry in the reduced sections of flat specimens, poor alignment of test specimens with the load frame, or minor misalignment of the load frame.
Table 2 shows the mechanical properties of the Cu/GNP composite obtained in different compositions and subjected to two different heat treatment temperatures to relieve stress. The stress relief treatment carried out at a higher temperature caused no improvement in the elongation or the mechanical resistance.

3.4. Fractography

Figure 11a–f shows the fracture surface of the composites after the tensile tests. The layers remain better adhered to each other in the specimens without graphene. The weak adhesion in graphene samples is due to the smaller micro-welded area and the low number of severe rolling cycles performed. Some studies with copper composites and aluminum composites reported such delamination caused by the tensile test [10,12,13,22,23,24].
We can observe from Figure 11 and Figure 12 that the typical necking of tensile ruptured ductile materials takes place in each layer [9,12,13]. The fracture in samples without graphene presents more tensile and shear dimples than those with graphene, which means that the pure copper specimens are more ductile than those with the nanoparticles.
Some specimens showed delamination with rupture of groups of layers at different strains and positions. The macroscopic aspect of the surface of these failures is that of a brittle one, although microscopically, they present ductile fracture characteristics.
Figure 12k,l shows more graphene in certain cavities of sample A46-220 than in sample A46-180 (Figure 12h,i) despite the two strips having been prepared similarly (just the temperatures of the final stress relief heat treatments were different). Graphene appears slightly brighter in the SEM micrograph of Figure 12k,l.

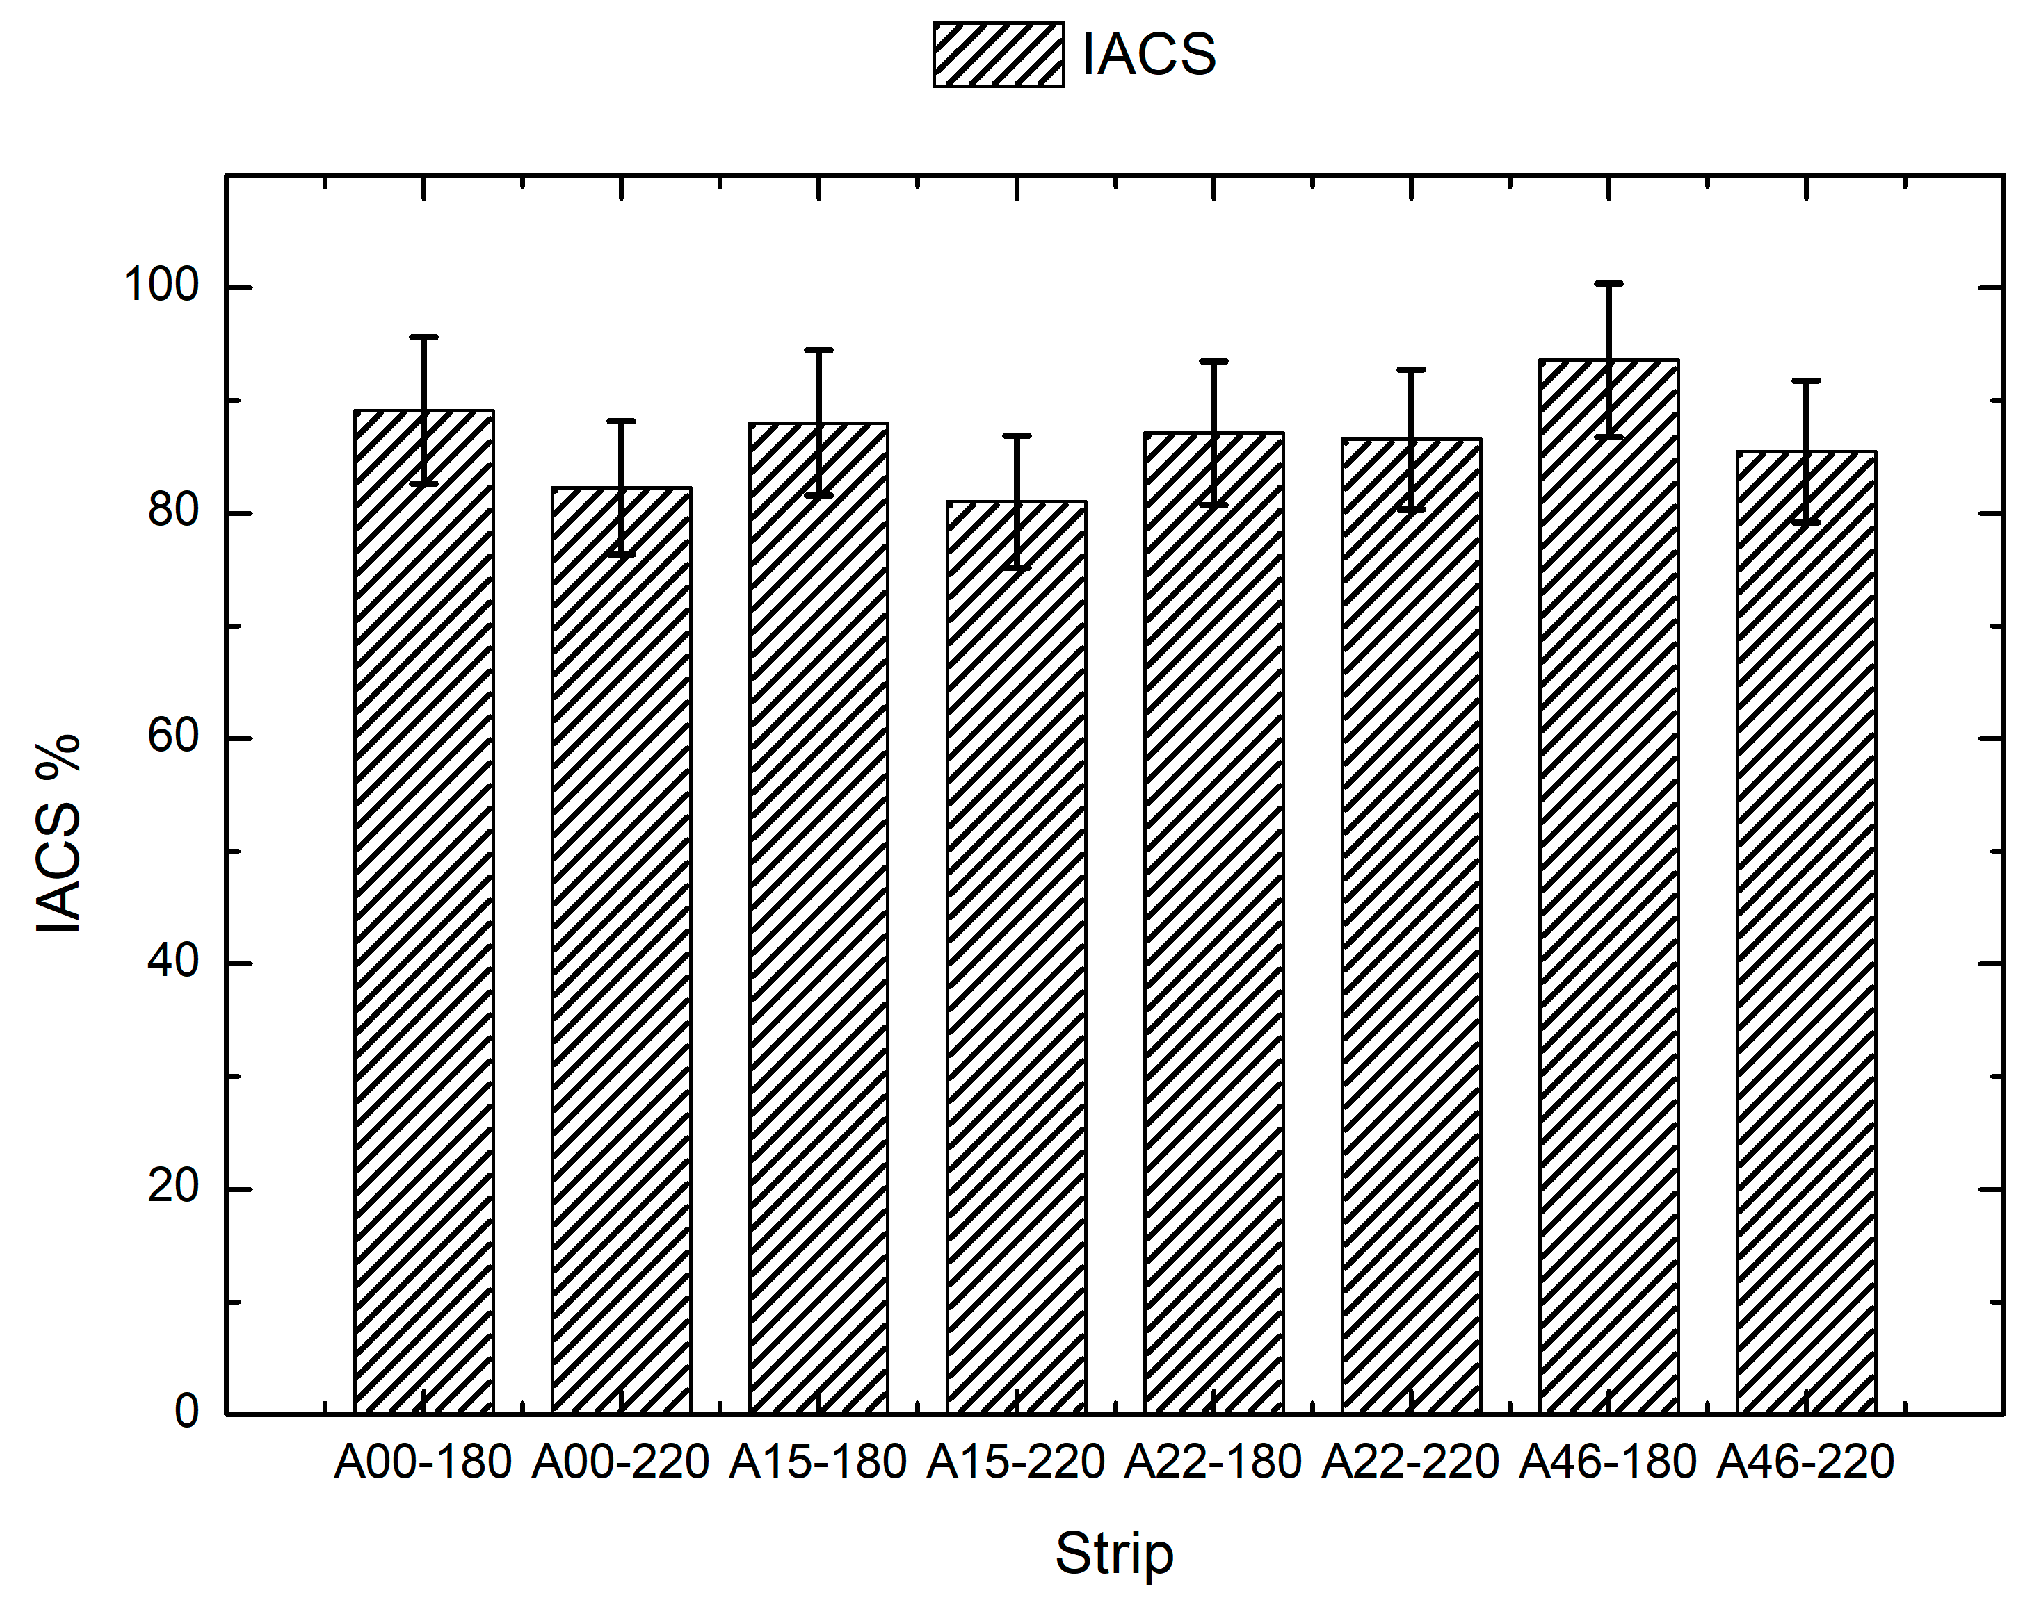
3.5. Electrical Conductivity
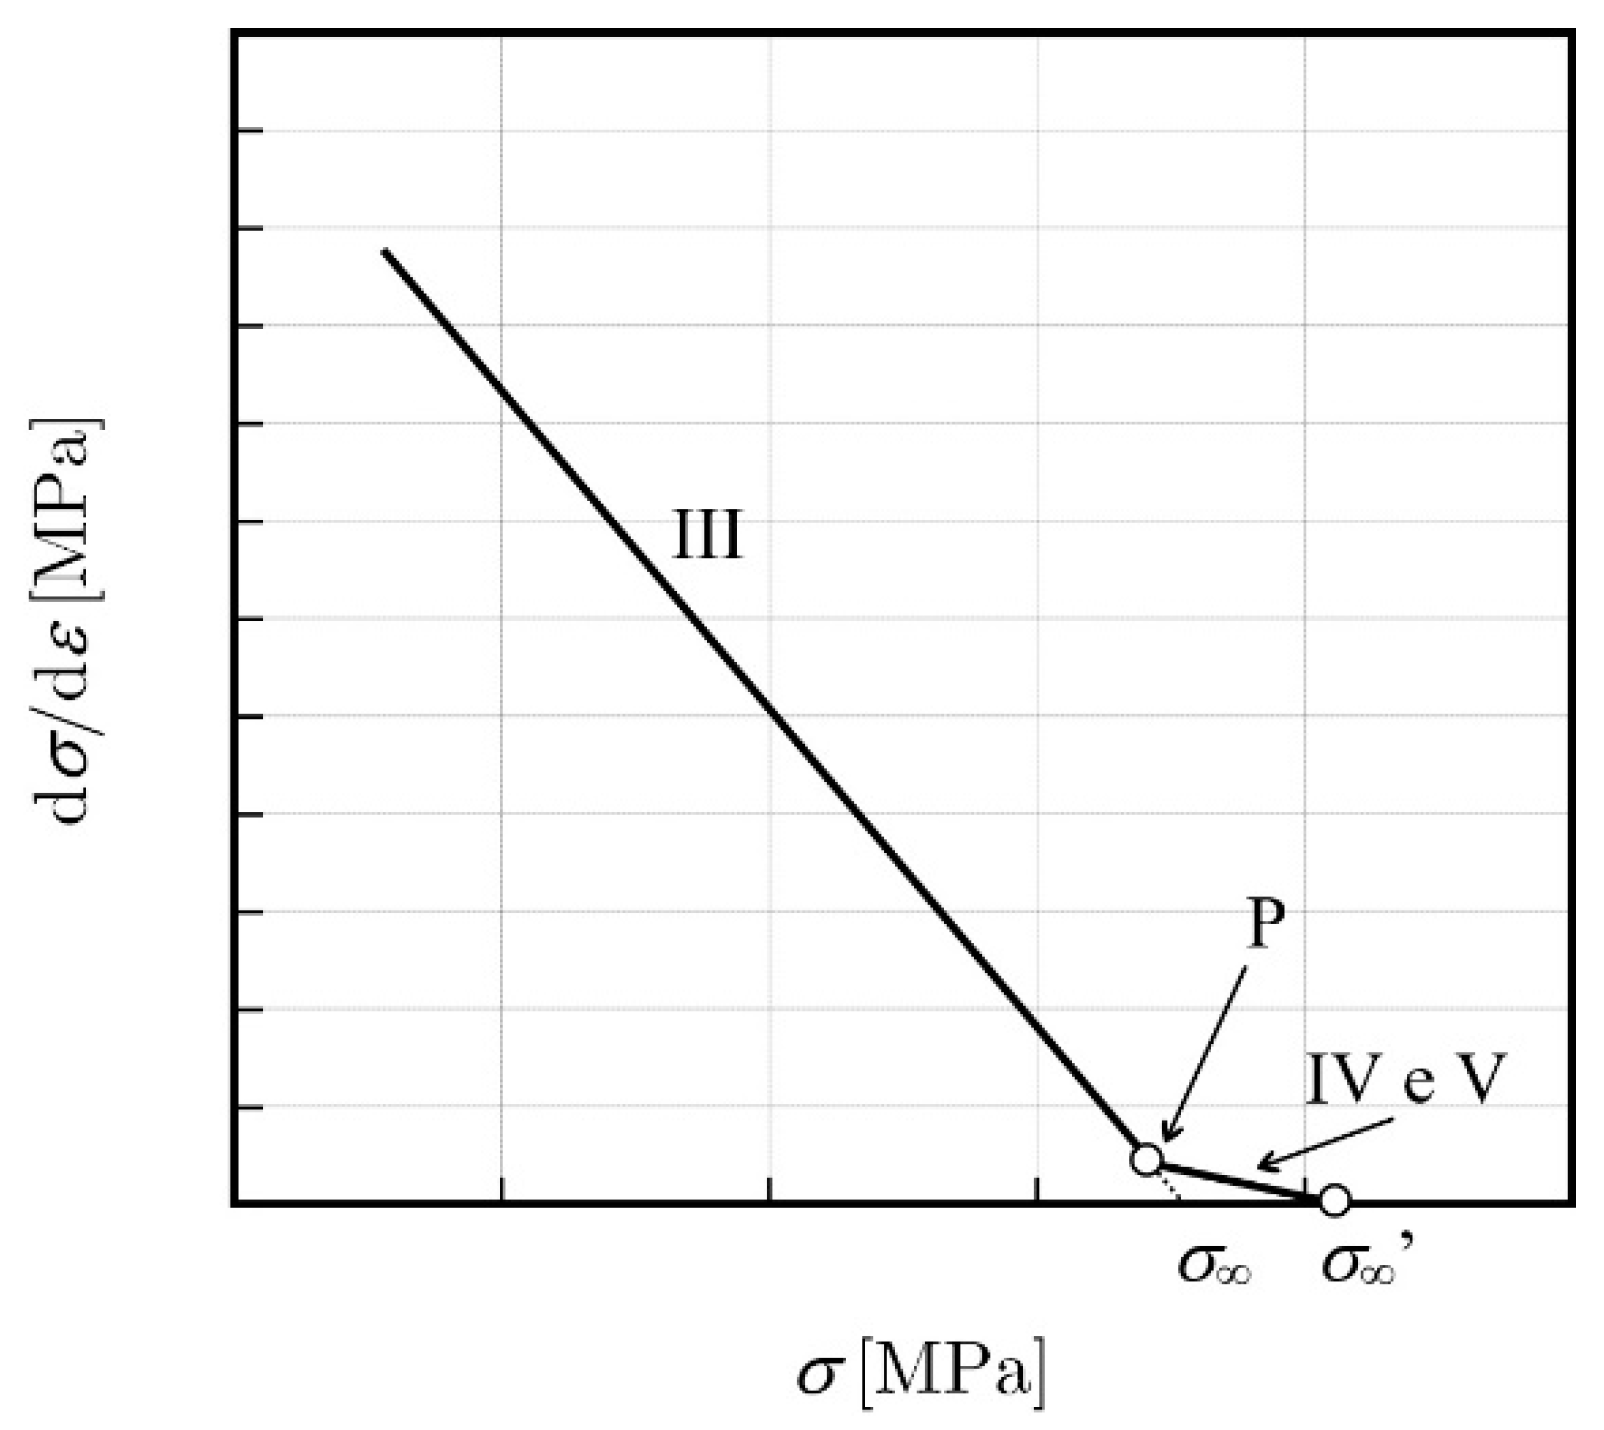
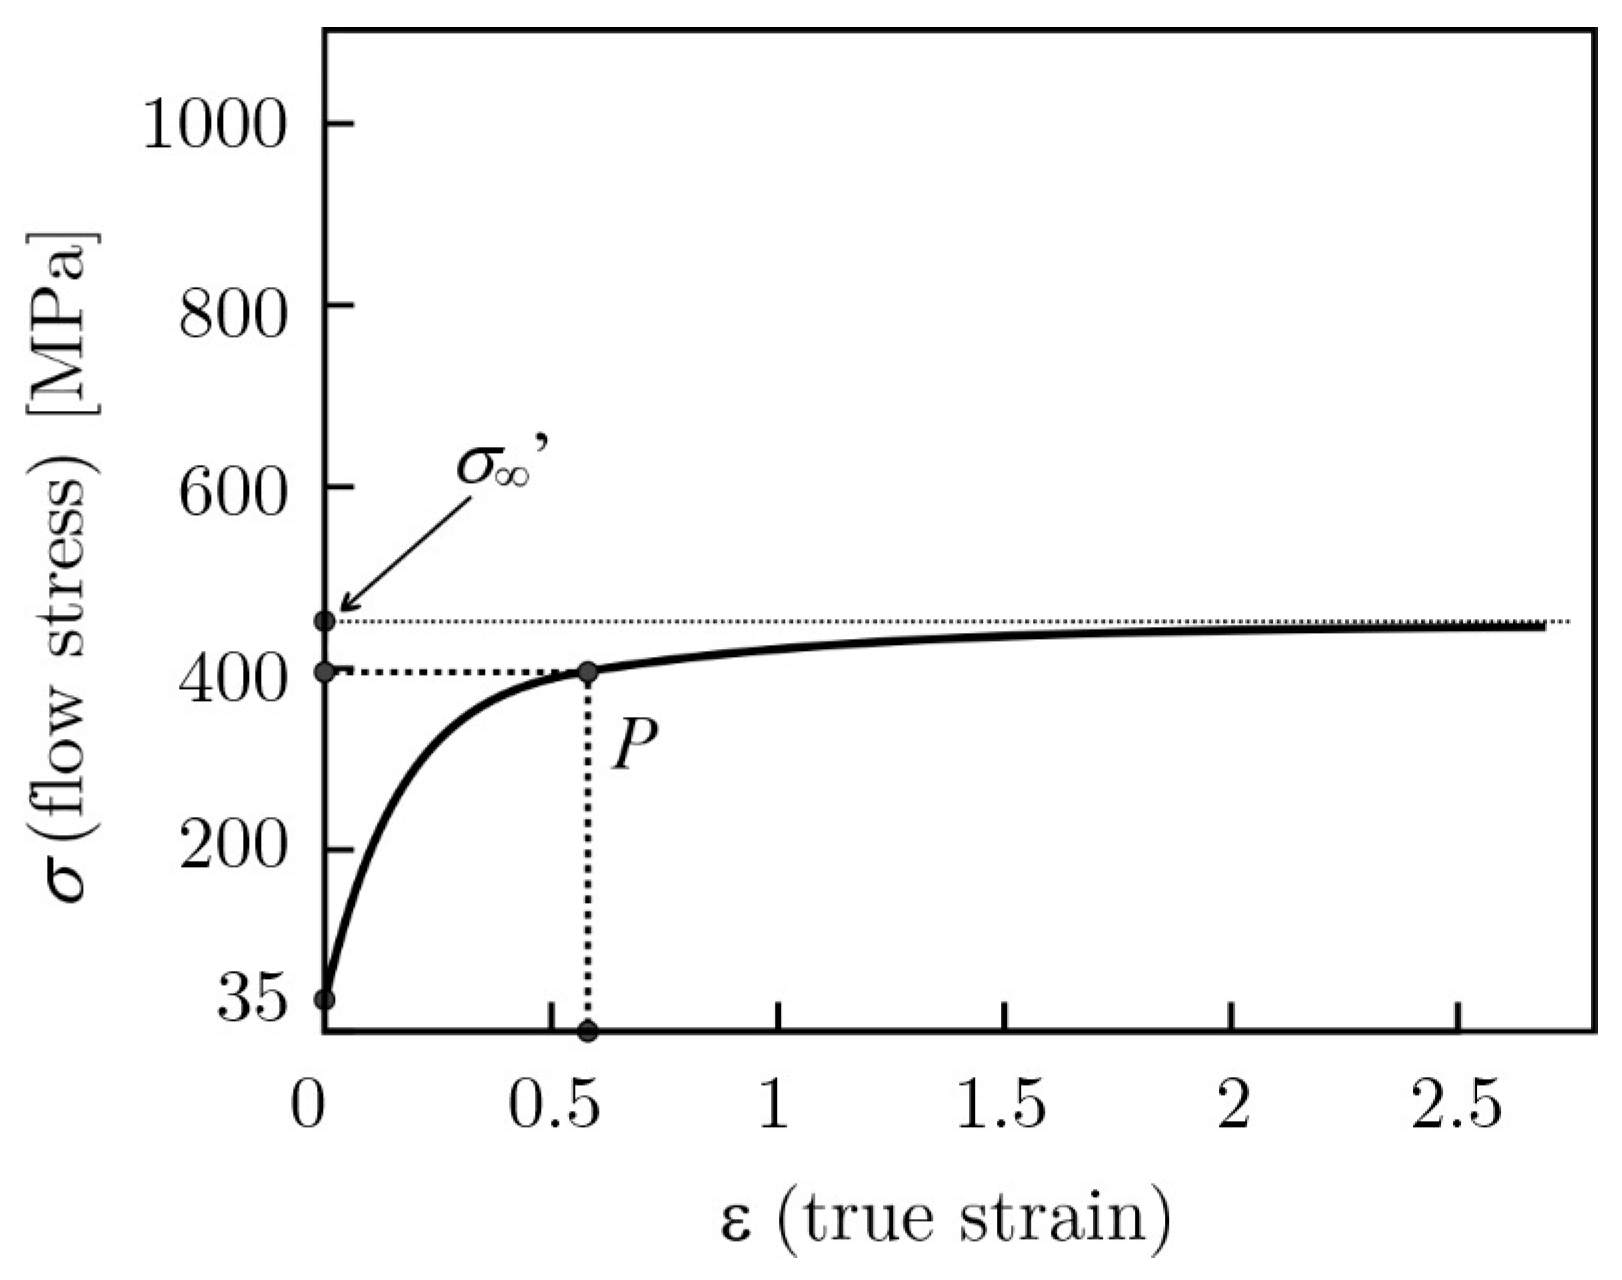
The graph in Figure 13 shows the electrical conductivity values of the strips compared to the International Annealed Copper Standard (IACS). The conductivity values slightly decrease with the temperature of the final stress relief heat treatment and practically do not change with the amount of graphene for a low fixed number of rolling passes imposed on the strips (four ARB cycles + final rolling pass).

4. Discussion

The copper layers in the Cu/GNP composite strips of this work are very similar to those that other researchers have obtained via ARB [9,13] or Accumulative Roll Compositing [25]. The micrographs of our study show a low number of voids and graphene clumps, except the A46-220 strip (see Figure 12k,l), where one can observe some clumps of graphene. These clumps are probably due to a failure in homogenizing the suspension since the A46-180 strip had the same amount of graphene and did not show the same phenomenon. Spreading the graphene through spraying and annealing the strips before the next rolling pass was probably the cause of this low density of voids and graphene clumps in five of the six samples.
A geometric criterion adopted by a particular group of researchers for a homogeneous dispersion and better interaction between the matrix and the reinforcement material is that the distance between particles of reinforcement must be approximately equal to the thickness of one layer [26]. This group developed a formula based on this criterion to determine the critical reduction. Supposing a stack of two layers per cycle, the equation assumes the following form [26]:
R c = 1 2 π 3 1 f f 1 / 4 r t 0 3 / 4 ,
where f is the volume fraction of reinforcement material, r is the mean radius of the particle, t0 is the initial thickness of each layer, and Rc is the critical reduction.
Equation (2) can handle some results reported in the literature but presents a value well below what is necessary for the situation presented in Liu and coworkers’ study [27]. If we adopt the geometric criterion that the mean diameter of particles of reinforcement must be approximately equal to the double of the thickness of one layer, we will obtain the number of times that the initial thickness needs to reduce via the following formula:
N = 2 t 0 d ,
where t0 is the initial thickness of each layer, d is the mean diameter of the particle, and N is the number of times that the initial thickness needs to reduce.
Using the parameters utilized by Liu and coworkers, d = 0.6 μm, t0 = 0.5 mm, and f = 0.05, we obtain via Equation (2) a number of seven cycles and via Equation (3) a number of 11 cycles. Liu needed 14 cycles to achieve a microstructure with less variance in the mean distance between reinforcement particles [27]. In this case, Equation (3) gave a better estimative than Equation (2).
The number of rolling cycles used in the present study was lower than necessary for the graphene to improve the mechanical properties of the composite. The minimum number that we should use according to Equation (3) is nine cycles (d = 2 μm, t0 = 0.8 mm). Unfortunately, it was impossible to achieve this quantity due to the bending that the strips suffered after each rolling pass (caused by some misalignment of the work rolls) and the loss of material required to leave the two (or three) strip layers with the same shape and to remove the deformed ends with marks of the copper wire used for fastening. The reduction in thickness we obtained was equivalent to 5.58 cycles of ARB with 50% of reduction per cycle. However, even with fewer cycles, the metallurgical union between layers was achieved at several points, as evidenced by the fractography displayed in Figure 11 and Figure 12.
The EDS analysis (Figure 8) confirms the presence of a carbon compound even after the four annealing treatments and the final stress relief heat treatment. This compound can correspond to graphene since we adopted an annealing temperature lower than the combustion temperature (~350 °C) [28]. The oxygen in some samples is probably in the copper oxide, but there are samples in which there is not even the presence of oxygen (Figure 8d,f).
According to the graph shown in Figure 13, the amount of graphene did not influence the conductivity of the material. This small influence is not due to the small number of ARB cycles imposed on the material. A study involving ARB (30 cycles), copper, and graphite powder (0.1 vol%) showed that the conductivity of pure copper strips and composite strips was practically the same, with a final value close to 90% IACS [8]. Another study involving ARB (100–300 cycles), copper, and graphene powder (0.5–3.0 vol%) produced Cu/GNP strips with electrical conductivity in the 75–85% IACS range [25]. The electrical conductivity values of the composite material produced in our study are in the 80–93% IACS range.
The mechanical properties of a metal or matrix metal composite are related to its dislocation density. It is possible to deduce hardening curves for the ARB process for pure copper from some information collected from the literature.
Consider that the dislocation multiplication coefficient within a tangle of dislocations is κf. Further, consider that the primary recovery mechanism (for temperatures below 0.4 Tm) is the annihilation of dislocations with opposite signs, and the dislocation annihilation coefficient is κa. According to Malygin [29], the rate of change in dislocation density ( ρ ) concerning true shear strain ( γ ) depends on the dislocation density according to the following equation [29]:
d ρ d γ = κ f ρ 1 / 2 κ a ρ .
There is a proportionality between a part of the flow stress (due to dislocation/dislocation interaction) and the square root of the dislocation density, expressed mathematically as follows [30]:
τ = α G b ρ ,
where α is the effective dislocation interaction constant, G is the shear modulus, and b is the Burgers vector [30].
If we introduce the term τC in Equation (5), representing the critical shear stress due to other microstructural obstacles besides dislocations, the equation will take the following new form:
τ = τ C + α G b ρ .
Solving Equation (6) for ρ and substituting into (4), we obtain:
τ τ C d τ d γ = 1 2 ( α G b ) 2 d ρ d γ .
Substituting Equation (4) into (7) and simplifying, we obtain:
d τ d γ = 1 2 ( α G b ) κ f 1 2 κ a τ τ C .
Let us consider the strain hardening rate θ (/) versus the flow stress τ curve for copper (99.95%) when subjected to flat rolling (strain rates varying from 1 to 10 s−1 and T = 293 K) in the work of Zehetbauer and Seumer [31]. The stretch of the curve corresponding to stage III of work hardening is approximately a straight-line segment. Using the data on the θ × τ curve (for straight rolling) from Zehetabauer and Saumers’s article [31], we can derive the following relationship:
θ = d τ d γ = 240.5 1.85 τ ,
where θ and τ are in MPa.
Recalling that for the graph cited before, τC is zero, b = 0.256 nm, G = 42.1 GPa (utilized by Zehetbauer and Seumer) [31], and adopting α = 0.5, we can compare Equations (8) and (9) to obtain the values of κf and κa:
κ f = 89.3 × 10 6   m 1
and
κ a = 3.70 .
According to Malygin [29] the value of f should be on the order of magnitude of 10−2, which is in accord with the value obtained, f = 2.3 × 10⁻². The value of κa is also within our expectations because, using the data from other researchers, Malygin expressed the relationship between κa and the T/Tm ratio graphically for copper as follows [29]:
κ a = 18.2 T T m ,
where Tm is the melting temperature of copper, and T is the deformation process temperature, both in Kelvin. If we substitute T = 298 K and Tm = 1358 K, we obtain κa = 3.99, close to the value obtained in Equation (11).
In addition to temperature, the annihilation coefficient (κa) depends, among other quantities, on the stacking fault energy, the strain rate, and the concentration of impurity atoms present in the solid solution.
Integrating the differential Equation (4), we obtain:
ρ = κ f κ a 2 1 A 0 e κ a γ 2 2 ,
where A 0 = 1 ( κ a / κ f ) ρ 0 and e is the base of natural logarithms.
Recalling that γ = and using ρ 0 = 1 × 10¹³ m−2 (assumed initial dislocation density), M = 3.06 (Taylor factor) [32,33], and the values obtained for κa and κf, Equation (13) takes the following form:
ρ = 5.83 × 10 14 1 0.869 e 5.7 ε 2 ,
where ρ is measured in m−2, and ε is the true strain.
The assumed initial dislocation density is a rounding of values reported by Li et al. and Miyajima et al. [34,35].
Once we have the dislocation density as a function of strain, we can deduce the hardening curve for stage III. Multiplying Equation (6) by M (Taylor factor) and recalling that σ = , we obtain the following equation:
σ = σ 0 + M α G b ρ .
where σ is the normal flow stress and σ0 is the strength contribution due to other microstructural obstacles than dislocations.
If we substitute Equation (13) into Equation (15) and remember that γ = and that σ = σy when ε = 0, we obtain:
σ = σ y + M α G b A 0 κ f κ a 1 e M κ a ε 2 .
Assuming σy = 35 MPa, G = 46 GPa (rounded mean of more recent works) [36,37,38,39], and substituting the calculated values, we have:
σ = 35 + 378 1 e 5.7 ε ,
where σ is the flow stress measured in MPa, and ε is the true strain.
When ε approaches infinity in Equation (17), the saturation strain is σ = 413 MPa.
Equation (17) is only valid until stage IV begins. For various metals and deformation modes, stage IV has a constant strain hardening rate [40], such that:
θ I V = d τ d γ I V c τ V ,
where c is a constant value between 0.05 and 0.1 and τ V is the saturation flow stress (Voce flow stress). If we consider the curve data corresponding to rolling of copper presented in the work of Zehetbauer and Seumer [31], stages IV and V can be approximated by a straight-line segment, as shown in Figure 14. The diagram in Figure 14 is proposed based on Zehetbauer and Seumer’s diagram data [31].
Point P, where stage IV begins, can be determined using Equation (18).
Recalling that σσyV and γ = , it follows from Equation (18) that:
d σ d ε i n . I V M c ( σ σ y ) .
If we substitute the values into Equation (19): σ = 413 MPa, M = 3.06, σy = 35 MPa, and c = 0.07, we obtain the strain hardening rate value at the beginning of stage IV, |/|(in. IV) = 81 MPa. The derivative assumes this value when σ(in. IV) = 398.8 MPa and ε(in. IV) = 0.576. Thus, the coordinates of point P are P = (398.8; 81) [MPa] in the σ-θ plane.
The straight line that determines the direction of the segment corresponding to stages IV and V is determined as follows:
d σ d ε = 703.1 1.56 σ .
If we integrate Equation (20) using the initial condition of point P, we obtain:
σ = 450.7 51.9 e 1.56 ( ε 0.576 ) .
The complete strain hardening curve is the combination of Equations (17) and (21) in their respective validity intervals:
σ = 35 + 378 1 e 5.7 ε ,   ε < 0.576 450.7 51.9 e 1.56 ε 0.576 ,   ε 0.576 .
The limiting value of this function as ε approaches infinity is σ = 450.7 MPa.
The graph shown in Figure 15 represents the function derived from Equation (22). Note that point P separates stage III from stages IV and V.
The ARB process is intrinsically a rolling in staggered passes. Each pass adds a specific true strain to the material. Let us suppose a representative elementary volume of material at the middle thickness of the strip is subjected to a reduction in thickness by 50% for each rolling pass. If we assume the von Mises yield criterion with a plane strain condition (no lateral spreading) after n passes, the true equivalent plastic strain ε is expressed as follows: ε = 2 3 ln 1 2 × n [41]. Substituting n = 1, we obtain ε = 0.8 , which means the true strain increases by 0.8 each pass. The flow stress of pure copper worked via an ARB process will approximately follow the curve shown in Figure 15.
The function expressed in Equation (22) gives a saturation value of 450.7 MPa, which is compatible with the results of previous research involving ARB and copper. Some researchers obtained UTS values (in engineering stress) in the range of [400; 482] MPa [9,12,13,23,42]. The highest UTS value was 482 MPa, and a corresponding value of 460 MPa for the yield strength obtained by Liu, Zhuang, and Zhao [12]. The lower yield strength and ultimate tensile strength values obtained in the present study are partly due to intermediate annealing that reduces the density of dislocations between one rolling pass and the next. However, work hardening caused an increase of 963% in yield strength and 69.2% in ultimate tensile strength when we compare the A00-220 sample to the annealed copper utilized in the manufacturing of the composites.
The higher values of yield strength and ultimate tensile strength and the lower values of elongation of the ARBed composites compared to the annealed copper’s properties (see Table 2) are mainly due to cold work hardening and grain refinement. As the material is repeatedly deformed, the density of dislocations in the material increases (although there is some dislocation annihilation) and the dislocations become more entangled, hindering their movement through the material. The hindrance of movement of dislocations increases the material’s mechanical strength and diminishes its elongation. The dislocations reorganize their position and induce an ultra-fine grain (UFG) structure formation in the material. Specifically, creating a UFG structure also leads to a pronounced increase in the yield and the ultimate tensile strength. However, this additional increase in mechanical strength comes at the cost of a significant decrease in elongation due to more barriers, the grain boundaries themselves, and the entanglement of dislocations at these grain boundaries.
Some already known strengthening mechanisms, such as thermal mismatch, load transfer, and Orowan looping system, can act on copper/GNP composites. However, these three mechanisms can only start to manifest their strengthening effects in the ARB process if we impose a minimum number of necessary cycles on the composite, which becomes homogenized during the ARB process.
The thermal mismatch between copper (coefficient of linear thermal expansion—CTE = 24 × 10−6 °C−1) and graphene (CTE = −6 × 10⁻⁶ °C−1) can develop more dislocations after the cold rolling when the temperature decreases until reaching the ambient temperature [43,44,45]. During this cooling, dislocations can arise since graphene dilates and copper shrinks. The annealing between rolling passes does not contribute to the thermal mismatch strengthening mechanism since, during the heating, the graphene tends to become smaller, and the copper tends to dilate (graphene has a negative coefficient of dilatation). During the cooling, they will return to their original size.
The effect of generating dislocations due to the discrepancy between the thermal expansion coefficients of the matrix and the reinforcing particle can be expressed as a ratio in decimal notation (ωTM) as follows:
ω T M = β G b σ m y 12 T α V f b d f ( 1 V f ) ,
where β = 1.25 [32,43], ΔT is the difference between the highest and lowest temperature of the process, Δα is the difference between the expansion coefficient of the matrix and reinforcing particle, df is the average diameter of the reinforcing particle, G is the shear modulus, b is the burgers vector, σ m y is the matrix yield strength, and Vf is the volumetric fraction of particle reinforcement [46].
Inserting ΔT = 100 °C, b = 0.259 nm, G = 46 GPa, Vf = 0.46%, df = 2 μm, and σ m y = 400 MPa, in Equation (23), we obtain ω T M = 0.021 . Thus, the thermal mismatch can increase the yield strength (400 MPa) of an ARBed copper strip by 2.1%, supposing a temperature difference of 100 °C and a volume fraction of 0.46% of GNP.
The grain refinement in our experiment was not measured. However, the severe plastic deformation and annealing cycles probably homogenized the grain size of all samples, with or without GNP. We suppose no grain refinement was generated by the mere presence of GNP (compared to ARBed pure copper strips) due to a low number of ARB cycles imposed on the strips and to the graphene staying at the grain boundaries.
The maximum load transfer strengthening ratio in decimal notation ( ω L T ) can be calculated as follows:
ω L T = V f s 4 ,
where s (s = df/tf) is the graphene aspect ratio, which can be calculated using the ratio between the diameter, df, and the thickness, tf, of the GNP [47]. Inserting Vf = 0.46%, df = 2 μm, and tf = 4 nm, in Equation (24), we obtain ω L T = 0.58 . Thus, a perfect load transfer can improve the yield strength by 58% (compared to ARBed pure copper strips).
The maximum Orowan looping mechanism strengthening ratio in decimal notation ( ω O r o w a n ) can be calculated as follows:
ω O r o w a n = M G b 2 π λ σ m y 1 ν 1 2 ln π d t 4 b ,
where ν is Poisson’s ratio (0.355), and λ is the effective planar spacing between particles. The effective planar spacing between particles can be estimated using the following equation [45]:
λ = 0.912 d t t t V f π d t 8 0.919 t t .
Inserting Vf = 0.46%, dt = 2 μm, and tt = 4 nm, in Equation (26), we obtain λ = 4.4 × 10 7 m. Substituting λ and the other already used parameters in Equation (25), we obtain ω O r o w a n = 0.38 . In this way, a perfect Orowan looping mechanism strengthening can improve the yield strength by 38% (compared to ARBed pure copper strips).
There was practically no increase in the yield strength or ultimate tensile strength of the specimens with GNP compared to the pure copper specimens in our study. A larger number of cycles would guarantee a better distribution of graphene in each part of the strip, a good anchoring of the GNP particles in the copper, and a better adhesion between the layers. These improvements would give conditions for the mentioned strengthening mechanisms to act. The poor adhesion between layers diminishes the yield strength and the ultimate tensile strength due to indentations on the layers, which are points of stress concentration and crack generation.
The curves in Figure 10 show the behavior of a layered laminated material when there occurs delamination and fracture of its layers. The sudden drops in tension denote that fractures occur in different groups of layers at different elongation values. See, for example, Figure 10b (curve 3) and Figure 10f (curve 3). The strip that showed the best uniformity in yield stress and ultimate tensile strength values was A15-220 (0.15 vol%, 220 °C), and the one that showed the highest values of these strengths was A15-180 (0.15 vol%, 180 °C). See Table 2. The A15-180 strength values are slightly higher than those on the A00-220 (0 vol%, 220 °C) strip, but they are not so different, as the overlapping of the confidence intervals between the values indicates. However, an increase in the ultimate tensile strength (15.3%) and yield strength (11.8%) occurred when comparing the A15-180 to the A00-180 sample. This slight increase may indicate an incipient engagement of the previously mentioned hardening mechanisms despite the low number of ARB cycles used. The presence of agglomerated GNP in the A46-220 (0.46 vol%, 220 °C) strip (Figure 12k,l) is probably one of the causes of its low strength and elongation values since the GNP clump makes the layer thinner, causing stress concentrations that can initiate cracks when the strip is mechanically stressed.
At each step, the strips had a wavier part, the first to pass through the work rolls. This wavy part must have caused a decrease in the mechanical properties of the specimens cut from the final strip, resulting in a broader dispersion of strength and elongation values, as one can see in the graphs of Figure 10. The initial sinuosity was probably due to the higher initial tensions required to set the strip in motion and the oscillation of the torque needed to keep the motor rotating.
The elongation mean value (~2%) of the specimens (Table 2) is lower than those already achieved by other researchers [9,25,48]. These low values may be due to the delamination that occurred in the tensile test of the specimens produced, or to the presence of cracks and points of stress concentration caused by indentations on the layer surfaces [49]. The copper oxidation in some specimens (see EDS spectra in Figure 8) also contributes to a more brittle behavior in fracture. Despite the macroscopic brittle character, the fracture surfaces exhibit microscopic ductile fracture elements, such as tensile and shear dimples and necking of individual layers. See Figure 11 and Figure 12.
Some researchers reported the pull out of graphene from the copper matrix during tensile testing [25]. This phenomenon occurs as a result of the fracture strain of graphene and its fracture stress. These properties have greater values than the corresponding ones of the ARBed copper. Through molecular dynamics simulation, researchers determined that seven-layer graphene has a theoretical fracture strain of 0.134 and a corresponding theoretical fracture stress of 115 GPa [50]. Increasing the number of layers may decrease these values, but they will still be superior to the corresponding ones of the ARBed copper [50].
The design chosen for the thermal treatments used in the processing route guaranteed the presence of graphene or at least oxide graphene at the end of the process. We subjected the composite to temperatures lower than graphene combustion (350 °C) [28], in order to maintain its integrity as much as possible. We used an oxygen trap to minimize the oxidation of graphene and copper. The precautions seem to have had the intended effect, as the EDS spectra detected the presence of copper and carbon in all copper/graphene samples and eventually oxygen in some samples (Figure 8). The EDS map of sample A46-220 indicated the presence of carbon (the only type of atom in graphene) between the two most separated layers (Figure 9c—vertical red line). The location of the carbon content in Figure 9c is marked with red dots. (We increased the contrast of this image to facilitate the visualization of these points). The figure shows that there is little carbon on the surface of the sample, as expected since the carbon is in between layers. The region with the widest space between layers has more red dots, almost forming a vertical line, indicating a more significant concentration of carbon there. SEM photos of the fracture surface of the same sample (Figure 12k,l) show clumps of a shiny substance that is, therefore, less conductive than copper. Now, we know that the electrical conductivity of graphene (2 × 10⁶ S/m) is lower than that of copper (58 × 106 S/m), so it is likely that the shiny substance between the layers is graphene or at least graphene oxide. As far as we know, no copper/carbon intermetallic is produced at temperatures lower than 350 °C. We chose strain relief treatment parameters according to those commonly used for flat, wrought products made of electrolytic tough-pitch copper (180 °C, 1 h) [51]. We chose a second pair of parameters (220 °C, 1 h) for comparison, obviously with a temperature below 350 °C (graphene combustion temperature) [28].
Although some copper layers did not adhere perfectly to each other, this does not invalidate the comparative analysis of the results obtained in the tensile tests of the samples. As we can see in Figure 5, Figure 6 and Figure 7, not all samples and not all layers of each sample showed a lack of adhesion. Samples A15-220, A46-180, and A46-220 have an interlayer bonding success rate of 35/35. Samples A00-180, A00-220, and A22-220 have an interlayer bonding success rate of 34/35. Sample A15-180 has an interlayer bonding success rate of 33/35, and Sample A22-180 has an interlayer bonding success rate of 30/35. The tensile test of these samples can comparatively characterize the samples since the minimum bonding success rate is 85.7% (35 is the number of interlayer regions in each sample). Even though an outstanding combination of mechanical and electrical properties was not achieved here, the authors believe that an important contribution to understanding the effects of accumulative roll bonding associated with thermal treatments on the properties of copper/graphene composites is made in this study.

5. Conclusions

This study examined the mechanical properties and electrical conductivity of copper/graphene composite strips manufactured using a process consisting of Accumulative Roll Bonding (ARB), intermediate annealing, and a final stress relief heat treatment. The copper layers in these composites exhibited similarities with those obtained in previous ARB and Accumulative Roll Compositing studies. The main conclusions are:
  • The ARBed composite strips exhibit a low occurrence of voids and graphene clumps due to the dispersion technique involving spraying and annealing before rolling.
  • The final strips have the presence of a carbon compound, likely graphene.
  • Some strips have no copper oxide, even after multiple annealing treatments without a controlled atmosphere (confirmed via the Energy-dispersive X-ray spectroscopy analysis).
  • There was no influence of graphene content on electrical conductivity for the relatively small number of ARB cycles applied. In our study, the electrical conductivity of the composite material ranged from 80% to 93% IACS.
  • This process can improve the yield strength (963%) and the ultimate tensile strength (69.2%) via work hardening (compare, for example, the A00-220 sample to annealed bulk pure copper). Strengthening mechanisms such as thermal mismatch, grain refinement, load transfer, and Orowan looping system can improve the copper/graphene composite’s strength but necessitate a minimum number of cycles to fully engage.
  • The ARBed composite exhibits a low total elongation (2%) compared to bulk pure copper (73%) despite several intermediate annealing treatments, which are supposed to increase the ductility of the material.
Finally, this study provides valuable information about the mechanical properties and electrical conductivity of copper/graphene composites and the difficulties in producing them via ARB without controlled atmosphere annealing. Although the results indicate some limitations in obtaining ideal properties, they highlight the importance of the number of ARB cycles, graphene distribution, and adhesion between layers.

Author Contributions

Conceptualization and methodology, R.A.d.C.; investigation, R.A.d.C., S.L.d.S., V.T.d.S., M.R.d.S. and F.G.L.; resources, R.A.d.C., V.T.d.S. and M.R.d.S.; data curation, R.A.d.C.; formal analysis, R.A.d.C., A.d.A.M.F., V.T.d.S., M.R.d.S. and F.G.L.; data interpretation, R.A.d.C., A.d.A.M.F., V.T.d.S., M.R.d.S., F.G.L., G.A.d.S. and A.A.C.; writing—original draft preparation, R.A.d.C.; writing—review and editing, R.A.d.C., G.A.d.S., A.d.A.M.F., F.G.L., S.L.d.S., V.T.d.S., M.R.d.S. and A.A.C.; visualization, A.A.C.; supervision, A.A.C.; project administration, A.A.C. All authors have read and agreed to the published version of the manuscript.

Funding

This research received no external funding.

Data Availability Statement

Data is contained within the article.

Acknowledgments

The authors are grateful to Termomecanica São Paulo S.A. for donating materials, to Mackenzie Presbyterian University for the scholarship, and to the Federal Institute of São Paulo (IFSP), FATEC-SP, and UFABC for facilitating the use of its dependencies and research equipment. Finally, the authors thank the financial support provided by The Brazilian National Council for Scientific and Technological Development (CNPq) and Coordination for the Improvement of Higher Education Personnel (CAPES).

Conflicts of Interest

Authors Vinícius Torres dos Santos, Márcio Rodrigues da Silva and Flávia Gonçalves Lobo are employees of the company Termomecanica São Paulo S.A. The remaining authors declare that the research was conducted in the absence of any commercial or financial relationships that could be construed as a potential conflict of interest.

References

  1. Hidalgo-Manrique, P.; Lei, X.; Xu, R.; Zhou, M.; Kinloch, I.A.; Young, R.J. Copper/graphene composites: A review. J. Mater. Sci. 2019, 54, 12236–12289. [Google Scholar] [CrossRef]
  2. Khan, H.A.; Asim, K.; Akram, F.; Hameed, A.; Khan, A.; Mansoor, B. Roll bonding processes: State-of-the-art and future perspectives. Metals 2021, 11, 1344. [Google Scholar] [CrossRef]
  3. Ghalehbandi, S.M.; Malaki, M.; Gupta, M. Accumulative Roll Bonding—A Review. Appl. Sci. 2019, 9, 3627. [Google Scholar] [CrossRef]
  4. Jamaati, R.; Toroghinejad, M.R. Investigation of the parameters of the cold roll bonding (CRB) process. Mater. Sci. Eng. A 2010, 527, 2320–2326. [Google Scholar] [CrossRef]
  5. Mahabunphachai, S.; Koç, M.; Ni, J. Pressure welding of thin sheet metals: Experimental investigations and analytical modeling. J. Manuf. Sci. Eng. 2009, 131, 0410031–0410039. [Google Scholar] [CrossRef]
  6. Ding, C.; Xu, J.; Li, X.; Shan, D.; Guo, B.; Langdon, T.G. Microstructural Evolution and Mechanical Behavior of Cu/Nb Multilayer Composites Processed by Accumulative Roll Bonding. Adv. Eng. Mater. 2020, 22, 1900702. [Google Scholar] [CrossRef]
  7. Jang, Y.; Kim, S.; Han, S.; Lim, C.; Goto, M. Tensile behavior of commercially pure copper sheet fabricated by 2- and 3-layered accumulative roll bonding (ARB) process. Met. Mater. Int. 2008, 14, 171–175. [Google Scholar] [CrossRef]
  8. Yao, G.C.; Mei, Q.S.; Li, J.Y.; Li, C.L.; Ma, Y.; Chen, F.; Liu, M. Cu/C composites with a good combination of hardness and electrical conductivity fabricated from Cu and graphite by accumulative roll-bonding. Mater. Des. 2016, 110, 124–129. [Google Scholar] [CrossRef]
  9. Liu, X.; Wei, D.; Zhuang, L.; Cai, C.; Zhao, Y. Fabrication of high-strength graphene nanosheets/Cu composites by accumulative roll bonding. Mater. Sci. Eng. A 2015, 642, 1–6. [Google Scholar] [CrossRef]
  10. Tiwari, J.K.; Mandal, A.; Rudra, A.; Mukherjee, D.; Sathish, N. Evaluation of mechanical and thermal properties of bilayer graphene reinforced aluminum matrix composite produced by hot accumulative roll bonding. J. Alloys Compd. 2019, 801, 49–59. [Google Scholar] [CrossRef]
  11. Kwan, C.; Wang, Z.; Kang, S.B. Mechanical behavior and microstructural evolution upon annealing of the accumulative roll-bonding (ARB) processed Al alloy 1100. Mater. Sci. Eng. A 2008, 480, 148–159. [Google Scholar] [CrossRef]
  12. Liu, X.; Zhuang, L.; Zhao, Y. Microstructure and mechanical properties of ultrafine-grained copper by accumulative roll bonding and subsequent annealing. Materials 2020, 13, 5171. [Google Scholar] [CrossRef] [PubMed]
  13. Eivani, A.R.; Shojaei, A.; Park, N.; Jafarian, H.R. Fabrication of Cu-CuG nanocomposites with enhanced mechanical strength and reduced electrical resistivity. J. Mater. Res. Technol. 2021, 11, 650–666. [Google Scholar] [CrossRef]
  14. Eivani, A.R.; Shojaei, A.; Salehi, M.T.; Jafarian, H.R.; Park, N. On the evolution of microstructure and fracture behavior of multilayered copper sheet fabricated by accumulative roll bonding. J. Mater. Res. Technol. 2021, 10, 291–305. [Google Scholar] [CrossRef]
  15. You, C.; Xie, W.; Miao, S.; Liang, T.; Zeng, L.; Zhang, X.; Wang, H. High strength, high electrical conductivity and thermally stable bulk Cu/Ag nanolayered composites prepared by cross accumulative roll bonding. Mater. Des. 2021, 200, 109455. [Google Scholar] [CrossRef]
  16. Alizadeh, M.; Dashtestaninejad, M.K. Development of Cu-matrix, Al/Mn-reinforced, multilayered composites by accumulative roll bonding (ARB). J. Alloys Compd. 2018, 732, 674–682. [Google Scholar] [CrossRef]
  17. Mehr, V.Y.; Toroghinejad, M.R.; Rezaeian, A. Mechanical properties and microstructure evolutions of multilayered Al-Cu composites produced by accumulative roll bonding process and subsequent annealing. Mater. Sci. Eng. A 2014, 601, 40–47. [Google Scholar] [CrossRef]
  18. Shabani, A.; Toroghinejad, M.R.; Shafyei, A. Fabrication of Al/Ni/Cu composite by accumulative roll bonding and electroplating processes and investigation of its microstructure and mechanical properties. Mater. Sci. Eng. A 2012, 558, 386–393. [Google Scholar] [CrossRef]
  19. Guo, T.; He, J.; Pang, X.; Volinsky, A.A.; Su, Y.; Qiao, L. High temperature brittle film adhesion measured from annealing-induced circular blisters. Acta Mater. 2017, 138, 1–9. [Google Scholar] [CrossRef]
  20. Lee, J.A.; Woods, S. Hydrogen Embrittlement NASA/TM-2016-218602 (JSC-CN-36009); National Aeronautics and Space Administration: Huntsville, AL, USA, 2016.
  21. Goldstein, J.I.; Newbury, D.; Echlin, P.; Joy, D.C.; Lyman, C.; Lifshin, E.; Sawyer, L.; Michael, J.R. Scanning Electron Microscopy and X-ray Microanalysis, 3rd ed.; Springer: New York, NY, USA, 2003; ISBN 978-1-4613-4969-3. [Google Scholar]
  22. Ferreira, F.; Ferreira, I.; Camacho, E.; Lopes, F.; Marques, A.C.; Velhinho, A. Graphene oxide-reinforced aluminium-matrix nanostructured composites fabricated by accumulative roll bonding. Compos. Part B Eng. 2019, 164, 265–271. [Google Scholar] [CrossRef]
  23. Mansourzadeh, S.; Hosseini, M.; Salahinejad, E.; Yaghtin, A.H. Cu-(B4C)p metal matrix composites processed by accumulative roll-bonding. Prog. Nat. Sci. Mater. Int. 2016, 26, 613–620. [Google Scholar] [CrossRef]
  24. Luo, J.; Khattinejad, R.; Assari, A.; Tayyebi, M.; Hamawandi, B. Microstructure, Mechanical and Thermal Properties of Al/Cu/SiC Laminated Composites, Fabricated by the ARB and CARB Processes. Crystals 2023, 13, 354. [Google Scholar] [CrossRef]
  25. Chen, F.; Mei, Q.S.; Li, J.Y.; Li, C.L.; Wan, L.; Zhang, G.D.; Mei, X.M.; Chen, Z.H.; Xu, T.; Wang, Y.C. Fabrication of graphene/copper nanocomposites via in-situ delamination of graphite in copper by accumulative roll-compositing. Compos. Part B Eng. 2021, 216, 108850. [Google Scholar] [CrossRef]
  26. Reihanian, M.; Bagherpour, E.; Paydar, M.H. Particle distribution in metal matrix composites fabricated by accumulative roll bonding. Mater. Sci. Technol. 2012, 28, 103–108. [Google Scholar] [CrossRef]
  27. Liu, W.; Ke, Y.; Sugio, K.; Qiu, Z.; Li, W.; Guo, Y.; Liu, X.; Sasaki, G. Effects of repeated accumulative roll bonding cycles on microstructural characteristics and tensile behaviors of Al2O3 particle reinforced aluminum-matrix composites. Mater. Lett. 2022, 320, 132386. [Google Scholar] [CrossRef]
  28. Eftekhari, A.; Jafarkhani, P. Curly graphene with specious interlayers displaying superior capacity for hydrogen storage. J. Phys. Chem. C 2013, 117, 25845–25851. [Google Scholar] [CrossRef]
  29. Malygin, G.A. Dislocation Density Evolution Equation and Strain Hardening of f.c.c. Crystals. Phys. Status Solidi 1990, 119, 423–436. [Google Scholar] [CrossRef]
  30. Mecking, H.; Kocks, U.F. Kinetics of flow and strain-hardening. Acta Metall. 1981, 29, 1865–1875. [Google Scholar] [CrossRef]
  31. Zehetbauer, M.; Seumer, V. Cold Work Hardening in Stages IV and V of F.C.C. Metals-I. Experiments and Interpretation. Acta Metall. Mater. 1993, 41, 577–588. [Google Scholar] [CrossRef]
  32. Wang, C.; Gan, X.; Tao, J.; Xie, M.; Yi, J.; Liu, Y. Simultaneous achievement of high strength and high ductility in copper matrix composites with carbon nanotubes/Cu composite foams as reinforcing skeletons. Nanotechnology 2020, 31, 045701. [Google Scholar] [CrossRef]
  33. Sandström, R.; Hallgren, J.; Burman, G. Stress Strain Flow Curves for Cu-OFP; Swedish Nuclear Fuel and Waste Management Co., Ltd.: Stockholm, Sweden, 2009; Volume 18. [Google Scholar]
  34. Li, Y.Z.; Huang, M.X. A dislocation-based flow rule with succinct power-law form suitable for crystal plasticity finite element simulations. Int. J. Plast. 2021, 138, 102921. [Google Scholar] [CrossRef]
  35. Miyajima, Y.; Okubo, S.; Abe, H.; Okumura, H.; Fujii, T.; Onaka, S.; Kato, M. Dislocation density of pure copper processed by accumulative roll bonding and equal-channel angular pressing. Mater. Charact. 2015, 104, 101–106. [Google Scholar] [CrossRef]
  36. Dong, L.L.; Fu, Y.Q.; Liu, Y.; Lu, J.W.; Zhang, W.; Huo, W.T.; Jin, L.H.; Zhang, Y.S. Interface engineering of graphene/copper matrix composites decorated with tungsten carbide for enhanced physico-mechanical properties. Carbon 2021, 173, 41–53. [Google Scholar] [CrossRef]
  37. An, Z.; Li, J.; Kikuchi, A.; Wang, Z.; Jiang, Y.; Ono, T. Mechanically strengthened graphene-Cu composite with reduced thermal expansion towards interconnect applications. Microsyst. Nanoeng. 2019, 5, 20. [Google Scholar] [CrossRef]
  38. Mazloum, A.; Kováčik, J.; Zagrai, A.; Sevostianov, I. Copper-graphite composite: Shear modulus, electrical resistivity, and cross-property connections. Int. J. Eng. Sci. 2020, 149, 103232. [Google Scholar] [CrossRef]
  39. Long, X.; Bai, Y.; Algarni, M.; Choi, Y.; Chen, Q. Study on the strengthening mechanisms of Cu/CNT nano-composites. Mater. Sci. Eng. A 2015, 645, 347–356. [Google Scholar] [CrossRef]
  40. Kuhlmann-Wilsdorf, D.; Hansen, N. Theory of work-hardening applied to stages III and IV. Metall. Trans. A 1989, 20, 2393–2397. [Google Scholar] [CrossRef]
  41. Saito, Y.; Utsunomiya, H.; Tsuji, N.; Sakai, T. Novel Ultra-High Straining Process for Bulk Materials—Development of the Accumulative Roll-Bonding (ARB) Process. Acta Mater. 1999, 47, 579–583. [Google Scholar] [CrossRef]
  42. Fattah-alhosseini, A.; Imantalab, O.; Mazaheri, Y.; Keshavarz, M.K. Microstructural evolution, mechanical properties, and strain hardening behavior of ultrafine grained commercial pure copper during the accumulative roll bonding process. Mater. Sci. Eng. A 2016, 650, 8–14. [Google Scholar] [CrossRef]
  43. Li, X.; Yan, S.; Chen, X.; Hong, Q.; Wang, N. Microstructure and mechanical properties of graphene-reinforced copper matrix composites prepared by in-situ CVD, ball-milling, and spark plasma sintering. J. Alloys Compd. 2020, 834, 155182. [Google Scholar] [CrossRef]
  44. Zhang, D.; Zhan, Z. Strengthening effect of graphene derivatives in copper matrix composites. J. Alloys Compd. 2016, 654, 226–233. [Google Scholar] [CrossRef]
  45. Kim, W.J.; Lee, T.J.; Han, S.H. Multi-layer graphene/copper composites: Preparation using high-ratio differential speed rolling, microstructure and mechanical properties. Carbon 2014, 69, 55–65. [Google Scholar] [CrossRef]
  46. Fadavi Boostani, A.; Yazdani, S.; Taherzadeh Mousavian, R.; Tahamtan, S.; Azari Khosroshahi, R.; Wei, D.; Brabazon, D.; Xu, J.Z.; Zhang, X.M.; Jiang, Z.Y. Strengthening mechanisms of graphene sheets in aluminium matrix nanocomposites. Mater. Des. 2015, 88, 983–989. [Google Scholar] [CrossRef]
  47. Nardone, V.C.; Prewo, K.M. On the strength of discontinuous silicon carbide reinforced aluminum composites. Scr. Metall. 1986, 20, 43–48. [Google Scholar] [CrossRef]
  48. Shaarbaf, M.; Toroghinejad, M.R. Nano-grained copper strip produced by accumulative roll bonding process. Mater. Sci. Eng. A 2008, 473, 28–33. [Google Scholar] [CrossRef]
  49. Dehghan, M.; Qods, F.; Gerdooei, M.; Mohammadian-Semnani, H. Effect of inter-cycle heat treatment in accumulative roll-bonding (ARB) process on planar isotropy of mechanical properties of AA1050 sheets. Trans. Nonferrous Met. Soc. China 2020, 30, 2381–2393. [Google Scholar] [CrossRef]
  50. Zhang, Y.Y.; Gu, Y.T. Mechanical Properties of Graphene: Effects of Layer Number, Temperature and Isotope. Comput. Mater. Sci. 2013, 71, 197–200. [Google Scholar] [CrossRef]
  51. ASM International Handbook Committee. Heat Treating of Copper Alloys. In ASM Handbook, Heat Treating, 10th ed.; ASM International: Detroit, MI, USA, 1991; Volume 4, pp. 1970–1973. [Google Scholar]
Figure 1. Diagram of the steps followed in the production of composite material strips. (a) Annealing, (b) cleaning and brushing, (c) spraying, (d) drying, (e) fastening, (f) rolling, (g) cutting, (h,h′) covering with copper strips, (i) annealing, (j) final rolling, (k) stress relief heat treatment. Some steps or elements that do not occur or appear in all cycles (α) are inside brackets, e.g., (A1) and (A3). After completing four ARB cycles (α), the strip is redirected from the bifurcation (A2) to (h′). (I) Copper sheet cuts to obtain strips using a guillotine. (II) Strip cuts in a waterjet machine for making test specimens.
Metals 14 00004 g001
Figure 2. Time–temperature curves for intermediate and extra annealing (T0 ≈ 180 °C, T1 = 345 °C, T2 ≈ 300 °C, tB ≈ 60 min, tC = 120 min, tD = 125 min). AB—heating ramp, BC—soaking, and CD—cooling ramp.
Metals 14 00004 g002
Figure 3. Results of two analytical techniques: (a) Raman Spectrum; and (b) XRD of the initial GNP powder.
Metals 14 00004 g003
Figure 4. (a) Initial annealed copper micrograph (550 °C, 2 h); and (b) XRD of the initial annealed copper.
Metals 14 00004 g004
Figure 5. Micrographs of A00-180, A00-220, and A15-180 strips in the RD-ND plane. Meaning of the labels, e.g., (L_A00-180)—Longitudinal section of the A00-180 strip with 0 vol% of GNP, with final stress relief heat treatment at 180 °C. See Table 1 for more details.
Metals 14 00004 g005
Figure 6. Micrographs of A15-220, A22-180, and A22-220 strips in the RD-ND plane. Blue arrows in (c,d) indicate fragmentation. Black arrows in (c) indicate undulation, and in (f) indicate indentations. Meaning of the labels, e.g., L_A22-220—Longitudinal section of the A22-220 strip with 0.22 vol% of GNP, with final stress relief heat treatment at 220 °C. See Table 1 for more details.
Metals 14 00004 g006
Figure 7. Micrographs of A46-180, and A46-220 strips in the RD-ND plane. Black arrows in (b) indicate a thinner layer compared to the mean layer thickness (16.7 μm). Meaning of the labels, e.g., L_A46-220—Longitudinal section of the A46-220 strip with 0.46 vol% of GNP, with final stress relief heat treatment at 220 °C. See Table 1 for more details.
Metals 14 00004 g007
Figure 8. SEM Micrographs and EDS spectra of A15-180, A15-220, A22-180 and A22-220 strips in the RD × ND plane. Black arrows in (a) indicate indentations. Meaning of the labels, e.g., L_A22-220—Longitudinal section of the A22-220 strip with 0.22 vol% of GNP, with final stress relief heat treatment at 220 °C.
Metals 14 00004 g008
Figure 9. (a) SEM micrograph of the longitudinal section of the A46-220 strip with 0.46 vol% of GNP, with final stress relief heat treatment at 220 °C (RD-ND plane), (b) EDS elemental mapping of copper (in green), and (c) EDS elemental mapping of carbon (in red) of the same SEM micrograph (a).
Metals 14 00004 g009
Figure 10. Stress × strain curves of the specimens taken from the strips of Cu/GNP composite.
Metals 14 00004 g010aMetals 14 00004 g010b
Figure 11. (a,d,g): Photos of the fracture surface of a test specimens. (b,e,h): SEM micrographs of the fracture surface of a test specimen. (c,f,i): Amplified SEM micrographs of the fracture surface. White arrows indicate shear dimples. Black arrows indicate tensile dimples. Gray arrow indicates necking.
Metals 14 00004 g011
Figure 12. (a,d,g,j): Photos of the fracture surface of a test specimen. (b,e,h,k): SEM micrographs of the fracture surface of a test specimen. (c,f,i,l): Amplified SEM micrographs of the fracture surface. White arrows indicate shear dimples. Black arrows indicate tensile dimples. Gray arrow indicates necking. White outline arrow indicates GNP.
Metals 14 00004 g012
Figure 13. Results of the electrical conductivity of the strips (compared to the IACS).
Metals 14 00004 g013
Figure 14. Diagram of hardening rate plotted against flow stress for rolling of pure copper. Stages III, IV and V. Based on the data of Zehetbauer and Seumer’s diagram [31].
Metals 14 00004 g014
Figure 15. Diagram of true flow stress plotted against true strain for rolling of pure copper. Stages III, IV and V.
Metals 14 00004 g015
Table 1. Processing route each strip went through.
Strip ID%vol. of GNPProcessing
Route
Stress Relief
Heat Treatment
T (°C)
A00-1800The material goes through four ARB cycles with annealing 1 before each cold rolling, Rt = (63%, 67%, 50%, 50%). After this, the material undergoes extra annealing 1 and cold rolling (Rt = 40%). Finally, the material is subjected to a stress relief heat treatment for one hour (see temperature in the next column).180
A00-2200220
A15-1800.15180
A15-2200.15220
A22-1800.22180
A22-2200.22220
A46-1800.46180
A46-2200.46220
1 Annealing: 1st = (550 °C, 2 h); 2nd = 3rd = 4th = 5th = as depicted in Figure 2.
Table 2. Mechanical properties of the strips of copper/GNP composites.
Strip ID%vol. of GNPFinal Stress Relief Temp.
(°C)
Yield Strength
(MPa)
Ultimate Strength
(MPa)
Elongation
(%)
A00-1800180347 ± 21359 ± 123.8 ± 0.3
A00-2200220372 ± 28384 ± 243.7 ± 0.4
A15-1800.15180388 ± 3414 ± 62.0 ± 0.5
A15-2200.15220341 ± 13361 ± 42.3 ± 0.3
A22-1800.22180310 ± 29 (1)312 ± 331.3 ± 0.1
A22-2200.22220345 ± 9356 ± 72.1 ± 0.3
A46-1800.46180341 ± 42 (2)350 ± 491.4 ± 0.3
A46-2200.46220- (3)227 ± 210.9 ± 0.1
(1) Two specimens reached the maximum stress value before reaching a plastic strain of 0.2% (the highest stress in these was used to calculate the average value). (2) One specimen reached the maximum stress value before reaching a plastic strain of 0.2%. (the highest stress in these was used to calculate the average value). (3) All specimens reached the maximum stress value before reaching a plastic strain of 0.2%.
Disclaimer/Publisher’s Note: The statements, opinions and data contained in all publications are solely those of the individual author(s) and contributor(s) and not of MDPI and/or the editor(s). MDPI and/or the editor(s) disclaim responsibility for any injury to people or property resulting from any ideas, methods, instructions or products referred to in the content.

