Article

In Situ Uniaxial Compression of Textured Magnesium AZ31B †

1
Department of Chemistry and Physics of Materials, University of Salzburg, 5020 Salzburg, Austria
2
Competence Centre for Lightweight Design (LLK), University of Applied Sciences Landshut, Am Lurzenhof 1, 84036 Landshut, Germany
*
Author to whom correspondence should be addressed.
Presented at LightMat23, Trondheim, June 2023.
Metals 2024, 14(1), 20; https://doi.org/10.3390/met14010020
Submission received: 27 October 2023 / Revised: 8 December 2023 / Accepted: 15 December 2023 / Published: 22 December 2023

Abstract

:
Strain-controlled uniaxial compression tests on textured magnesium AZ31B sheet samples were carried out using a 5 kN Kammrath & Weiss tension–compression in situ stage using a scanning electron microscope in combination with real-time electron backscatter diffraction lattice orientation mapping. The distribution of deformation twins in the samples was studied and correlated with the results of finite element simulation of the elastic strain to show that bands of twinned grains formed in areas where the principal compressive stress (σ3) was a maximum, and they formed normal to the trajectory of the principal direction of σ3. This was correlated with maps of lattice disorientation within the grains, which showed the inclination for twins to grow in alignment with local and larger-scale distributions of elastic strain. Mappings of the same area at different values of strain were made to examine the formation and growth of individual twins within the macroscopic bands of twinned grains. All the twins observed were consistent with the extension-type twin, with 86.3° disorientation with respect to the parent grain. Mappings of the grain internal disorientation were related to the elastic strain, and it was found that twin formation and growth followed the contours of the highest elastic strain within and across grains. The maximum angular disorientation found within the grains was approximately 10°, suggesting that this might correspond to a threshold of elastic strain required to initiate twinning.

1. Introduction

Magnesium and its alloys present favorable lightweight engineering materials [1,2,3,4], particularly applicable to the automotive and aerospace industries, but are complicated due to a hexagonal crystal system [5,6] that can introduce anisotropy into the mechanical properties of components. Figure 1a shows the unit cell of magnesium with interatomic spacing in the basal plane of a = 0.32 nm and bi-planar spacing normal to the basal plane of c = 0.52 nm, giving a ratio of c/a = 1.62. In the Miller–Bravais four-index notation [7], the basis vectors are written as a1 = [2-1-10], a2 = [-12-10], a3 = [-1-120] and c = [0001].
Plastic deformation in these alloys at room temperature mainly takes place through basal slip and extension twinning [8,9,10], both with a critical resolved shear stress (CRSS) of approx. 0.5 MPa. Figure 1b shows the major slip planes: basal for slip in the basal plane, prismatic for slip normal to the basal plane and pyramidal for slip inclined to the basal plane. Figure 1c shows the extension and compression twinning planes across which the lattice becomes reoriented during twinning. Prismatic slip, pyramidal slip and contraction twinning, with greater CRSS values of approx. 40, 60 and 200 MPa, respectively, tend to become activated only at higher temperatures [11].
In practice, the actual mode activated to accommodate plastic strain depends largely upon the orientation of the applied force relative to the lattice [12,13]. Extension twinning takes place according to the reorientation of the lattice across the {10–12}, plane extending the lattice in the [0001] direction parallel to the hexagonal c-axis normal to the basal plane [14,15]. However, twin-roll-cast Mg sheets are polycrystalline, and the manufacturing process yields a distinct basal texture. Consequently, the tensile stress in the sheet plane mainly activates prismatic and basal <a> slip [16]. In contrast, the compressive stress in the sheet plane mainly activates {10–12} twinning [16]. The basal texture, along with the two different load-direction-dependent plastic deformation mechanisms, results in anisotropic and asymmetric yield stresses [17,18].
As the mechanical properties of materials are derived from the microstructure, studies of the granular, inter-granular and sub-granular deformation mechanisms form the basis for understanding the material behavior and for predicting properties such as strength, brittleness and ductility [19,20,21,22]. In the case of magnesium alloys, extensive study has been made of the deformation mechanisms under an applied stress [23], most recently using digital image correlation (DIC) to observe macroscopic changes in strain during testing [24,25,26]. The technique of electron backscatter diffraction (EBSD) has been particularly valuable, as it has revealed the nature of deformation within individual grains while also allowing multi-grain studies and statistical interpretation of changes in grain orientation and shape [27,28].
Electron backscatter diffraction (EBSD) is a method of materials analysis developed in the early 1970s [29,30] that is carried out inside a scanning electron microscope (SEM). It can be used to reveal information about the phase, grain orientation, lattice strain and defects in crystalline and polycrystalline materials [31,32,33,34,35]. With the sample inclined to the electron beam, the electrons that penetrate the surface are backscattered and diffracted by the near-surface layer approx. 100 nm deep. These electrons form a diffraction pattern [36] on a digital sensor and software interprets the lattice phase and orientation of the scattering site [37,38]. With processing times of a few milliseconds per site, an EBSD map of an area can be collected within an hour or a few hours, with several million data points [39,40].
In the present study, the initiation, evolution and growth of deformation twins in the wrought magnesium alloy AZ31B, as a result of uniaxial compression, are studied in situ in a SEM using a commercial in situ tension–compression stage, in combination with real-time EBSD mapping of the lattice orientation. To constrain the sample during compression to prevent it from buckling, a novel close-fitting anti-buckling guide (ABG) was developed. The ABG fitted closely to the sample without interfering with the mechanical test [41,42], while at the same time allowing for an extensometer to contact the sample and allowing space for the incident and scattered electron beams. So that the same area of the sample could be mapped multiple times without signal degradation due to sample preparation-induced corrosion [43,44] and hydroxide formation [45], a new method of preparing the magnesium samples was developed, which produced a high-quality surface without hydroxide [46].
In situ mechanical testing for SEM was initially developed in the late 1960s [47] and has since undergone continual development due to its high value for investigating material characteristics under controlled conditions inside an electron microscope with real-time imaging at the micron and sub-micron scales. In situ testing in a transmission electron microscope (TEM) is also possible, having been developed since the 1950s [48,49,50]. However, although the resolution is higher, the scale of the experiment is significantly smaller, with a sample size of little more than 1 mm. This means that extrapolation of observation to macroscopic properties is more questionable than in a SEM, where components up to as much as 200 mm in size can be investigated.
Magnesium alloys have been the subject of in situ mechanical testing [51,52] with the aim of clarifying the different roles that dislocation slip and deformation twinning play in accommodating plastic strain. However, these studies have mostly concentrated on in situ tensile testing as compression testing requires an anti-buckling guide, which can be difficult to integrate into a microscope, and in the case of textured magnesium sheets, is complicated by the unpredictable sample behavior above the yield stress.
Earlier studies on magnesium AZ31B observed the formation of bands of twinned grains (BTGs) when samples were subjected to uniaxial compressive stress [53]. The bands were found to form normal to the trajectory of the maximal principal compressive stress σ3, while individual twins inside the BTGs were aligned approximately normal to the σ3 principal direction. These studies were not made in situ and direct observation of the twin initiation and growth was not possible. It was suggested that the local stress distributions around grains combined with the grain orientation were responsible for the activation and growth trajectory of individual twins. The present study therefore examines twin formation in greater detail with specific interest in the initiation and growth of individual twins when the sample is subjected to an incrementally increasing uniaxial compressive stress.

2. Materials and Method

Twin-roll-cast magnesium AZ31B sheets from Magnesium Flachprodukte GmbH in Freiberg [54] were milled into standard flat-dumbbell-shaped samples with dimensions of 60 × 10 × 3 mm3 and with a centered gauge zone 22 mm long and 5 mm wide. Compressed air was used to cool both the sample and the Garant Productions (Hoffmann Group, Munich, Germany) 202515-2 carbide cutter during the milling process. AZ31B is an alloy of magnesium with the following composition in nominal wt.%: Al (3.0%), Zn (1.0%), Mn (0.2%), Si (0.1%), Cu (0.05%), Ca (0.04%), Fe (0.005%) and Ni (0.005%). The difference in the tensile and compressive yield stress in the rolling direction (RD) has been previously analysed [26,55].
Figure 2a shows the dimensions and surface roughness of the uniaxial sample; the length was 60 mm, width 10 mm and thickness 3 mm. The transition between the gauge zone and the clamping areas was designed using “the method of tensile triangles” after Mattheck [56], which aims at minimizing the stress concentration factor Kt in these areas. For this purpose, a spline with 5 points was defined, as described in Table 1 and shown in the detailed view A of Figure 2a. The tangent of the spline curve had an angle of 45° at point 5 with respect to the x1-axis. At point 1, the tangent was parallel to the x1-axis. Within this work, the x1-axis is used throughout as the RD, the x2-axis as the transverse direction (TD) and the x3-axis as the normal direction (ND). Figure 2b is a CAD drawing showing the sample and hardened steel clamping plates of the in situ tester and indicating the direction of the applied load (F1) parallel to x1.
Figure 3 shows the results of a finite element method (FEM) simulation that was used to support the optimisation of the sample geometry [55]. A linear elastic material model with a Young’s modulus of E = 42,866.5 MPa and a Poisson’s ratio of 0.32 was used. Due to the three-axis symmetry of the sample, only one eighth of the sample was modeled. Hexahedral isoparametric elements with quadratic shape functions were used for the discretisation and approximation. A compressive force F1 = −1800 N was applied as a homogeneously distributed force in the clamping area. Figure 3a shows the color plot of the normal stress σ11(x1, x2, x3) from the FEM simulation. Within the gauge area, the normal stress σ11 represents the maximal principal compression stress σ3, and therefore x1 is the corresponding principal direction of σ3. The simulation proves that a homogenous and uniaxial stress is achieved in the gauge area. Furthermore, the plot of the normal stress σ11 along the contour coordinate s1 from Figure 3b shows that a small stress concentration factor of Kt = 1.083 is achieved using “the method of tensile triangles”. This design ensures that plastification starts in the gauge zone. The surface roughness of the milled edges was nominally Ra = 0.6 µm, fine enough to prevent roughness-induced strain nucleation.
Both the upper and lower flat surfaces of the sample were initially ground using 2500 and 4000 grit silicon carbide papers. One surface was then prepared for EBSD analysis by polishing it using a 0.04 µm silica suspension on a neoprene cloth, followed by vibrational polishing using a 0.03 µm alumina suspension in a Buehler VibroMet. An earlier study has shown that when deionised water or absolute ethanol was used rather than regular tap water or low-grade ethanol, especially during the final polishing and cleaning stages, the surface hydroxide layer which would otherwise form on the magnesium could be minimised and even prevented from forming [46]. The presence of such a corrosion layer, which can form very rapidly on magnesium when exposed to water, water-containing solutions or humidity in the air, due to electrochemical activity, would diminish the EBSD signal from the underlying magnesium lattice, as it is derived from the upper 100 nm or so of the surface [43,57].
The in situ experiments were carried out in a ZEISS Merlin SEM with an accelerating voltage of 20 kV. A 5 kN Kammrath & Weiss (Schwerte, Germany) in situ tension–compression stage (referred to herein as the in situ stage) was used to incrementally increase the strain in the gauge area, which was measured using a Sandner EXA10-1 tactile extensometer with 10 mm contact width. The in situ stage was attached to the microscope stage using an electrically conductive aluminium adapter plate, provided by Kammrath & Weiss. The EBSD lattice orientation maps were recorded first in the unloaded state and then at different values of strain using an Oxford Instruments Nordlys detector controlled with the AZtecHKL software (version 3.3 SP1, Oxford Instruments, Abingdon, UK), while the EBSD data were processed using the ATEX software (version 4.05) [58].
Figure 4 shows the ABG made to prevent the buckling of the sample during compression. The ABG was constructed from low-magnetic chrome/nickel steel (AISI 303) to prevent the magnetic disturbance of the electron beam. The cutaway channels in the ABG allowed space for the incident electron beam to reach the sample and for the cone of backscattered diffracted electrons to reach the detector. Four M3 steel screws were used to fix the ABG, four rubber O-rings were used to secure the extensometer in place and a 0.3 mm thick PTFE sheet placed between the ABG and the sample prevented contact friction during compression.
The compression tests were carried out and controlled using the Kammrath & Weiss software (version MDS 4.1.9.0) and electronic feedback from the extensometer. As observed in earlier study [26,28], under uniaxial compression, AZ31B sheet samples deform plastically via the formation and growth of the bands of twinned grains. These bands form rapidly once the critical stress for twin formation is reached. The strain-controlled feedback loop controlled the strain rate so that the experiment could be paused at different values of strain to study the growth of twins in the gauge zone.
Figure 5 shows the details of the in situ experimental setup. Figure 5a illustrates the EBSD data acquisition and analysis system with the sample tilted to 70° and the backscattered diffracted cone of electrons collected on the Nordlys CCD sensor and processed using a PC into lattice orientation maps. Figure 5b shows the in situ stage mounted on a steel adapter plate onto the stage of the SEM. The adapter tilted the in situ stage to 50° and the sample grips inside the in situ stage tilted the sample a further 20° to achieve the required 70° tilt for EBSD measurements. When inserting the in situ stage into the chamber, it was necessary to precisely set the position of the unit in order to avoid contacting the objective pole piece or detectors.
Figure 5c shows a typical loading curve where the stress was calculated as F/A, where the force (F) was measured from the integrated load cell and A was the cross-section of the sample gauge area. Without strain control, twinning within the gauge zone would take place rapidly once the critical stress (approx. 100–120 MPa) had been reached, so that the entire gauge zone twinned within a few milliseconds, as apparent from the relatively flat section of the stress–strain curve after elastic deformation. The load was increased by driving the DC motor at a rate of 2 µm per second to specific pre-set breakpoints in the extensometer strain. At each breakpoint, the power to the motor was held constant while the SEM images and EBSD maps were collected.
The EBSD lattice orientation maps covered a typical area of 100 × 80 µm2, with a measurement spacing of 0.2 or 0.3 µm, giving approx. 1000–2000 data points per grain for a grain size of 10 µm. This measurement spacing was used to optimise the map resolution and the collection time: a smaller spacing would have given a better resolution with smoother outlines to grains, but it would have taken a longer time to collect the map. The clean surface produced a strong clear EBSD signal and allowed for rapid processing times so that each map required around 1 h to collect and multiple mappings could be made of the same area. During the collection times, creep of approx. 5 µm per hour increased the compressive strain with a corresponding reduction in load; consequently, these measurement periods appeared in the loading curve as sharp drops in stress and small increases in strain. Due to the symmetric loading method of the in situ stage, this creep did not cause sample drift and did not affect the mapping even after an hour of data collection. Figure 5d shows a typical magnesium AZ31B sample after uniaxial compression where a BTG approx. 300 µm wide has formed slightly off-center in the gauge zone, extending across the sample as well as through the sample to the reverse side.

3. Results and Discussion

The following results show the formation and growth of deformation twins in the magnesium AZ31B sample subjected to incrementally increasing magnitudes of uniaxial compressive stress.
Figure 6 shows SEM images of a BTG that has grown from left to right (in the x1 direction) in the image with increasing compressive extensometer strain. The rectangular areas are due to hydrocarbon contamination in the SEM chamber being electrostatically attracted to the electron beam and deposited on the sample surface [59]; the analysed and mapped area was the centremost of these. Once an area was chosen for study, a reference mapping was made at zero load. The DC motor was driven and stopped as soon as a BTG appeared in view so that the BTG could be studied as it grew. The BTG grew from left to right in the images, and in Figure 6d had entered the analysed area. As the extensometer strain increased, other areas of the gauge zone underwent deformation so that the progress of the BTG in view was not necessarily linear with an increasing load. When a BTG had entered the analytical area, the motor was paused and an EBSD map made, which could be directly compared with the reference map to reveal the changes in the microstructure.
Figure 7a shows a lattice orientation map of the magnesium AZ31B sample before compression. The average grain size based on 328 grains is 5.6 µm and the average aspect ratio is 1.35 ± 0.38. No twins are visible and the dominant red colour indicates a high degree of basal texture (c-axis or [0001] axis of the magnesium hexagonal unit cell normal to the sheet), which can be determined using the inset colour-orientation key, which is the same for all EBSD maps presented here. The Kearns texture factor [60], a statistical representation of the grain lattice alignment, normal to the sheet is 0.8 (where 1.0 would be all grains aligned with the c-axis perfectly normal to the sheet). Figure 7b shows an orientation map from the same area after compression to an extensometer strain of −1.8%. The uniaxial compressive force F1 is left–right as in the all other images and EBSD maps shown here. At this stage, the first twins—appearing in the map as elongated green or blue lenticular-shaped structures—have formed in the analysed area. By undergoing twinning, individual grains change their aspect ratio to accommodate the plastic strain. In Figure 7b, the large grain in the upper right, for example, has changed in its aspect ratio from 1.04 to 0.98, a change of 6% by the formation of a long lenticular-shaped twin [61].
Figure 7c shows the band contrast (BC) for the same area at slightly higher magnification. The image shows no indication of preparation-induced damage such as scratches even though the band contrast is very sensitive to lattice distortion. Figure 7d shows an orientation line scan across the twin in the upper-right corner (along the indicated line A to B). Analysis of the twins reveals a disorientation angle with respect to the parent grains of approx. 86.3°, which is consistent with extension-type twinning where the magnesium lattice has effectively become rotated so that the c-axis is no longer normal to the sheet but closer to being in-plane [62,63]. Individual twins are observed to form approximately normal to the maximal compression stress σ3, while macroscopic BTGs form more precisely normal to it (compare with Figure 3 and Figure 5).
Figure 7e shows the pole figure for the unstrained sample, where the Kearns texture factors are 0.1 (RD), 0.1 (TD) and 0.8 (ND). This shows that the majority of grains are aligned with the c-axis normal to the sheet. The slight offset is typical of warm-rolled AZ31B, where the pressure moves the grains into a forward tilt in the RD. Figure 7f shows details of the lower-left area of the analysed rectangle at −1.8% strain where further twin growth is apparent approximately normal to the applied stress. Individual twins are observed to form approximately normal to the maximal compression stress σ3, while macroscopic BTGs form more precisely normal to it. Figure 7f shows the pole figure for the strained sample, where the Kearns texture factors are 0.12 (RD), 0.11 (TD) and 0.77 (ND). In this case, a small fraction of lattice sites has rotated away from the sheet normal in the x1 direction and appears as pale grey areas close to the perimeter in the pole figure.
Figure 7g shows the lattice disorientation within the grains for the unloaded sample and for the area marked by the rectangle in Figure 7a. As expected in the unloaded state, the lattice within the grains shows very little disorientation (<1°), indicating no elastic strain inside of grains. Only in the lower-left grain is there some strain at the edge with the neighbouring grain. Figure 7h is the lattice disorientation for the sample at a −1.8% extensometer strain corresponding to same rectangular area in Figure 7b. In this case, a substantial number of grains show a disorientation of around 2° (pale grey to white), and this disorientation extends across grains in TD, which is the perpendicular direction to the σ3 direction of the FEM result. In a few of these grains, the internal disorientation is higher (blue), reaching a maximum of 6.1°. The twins are clearly aligned with these contours of internal disorientation, indicating that twins form along the contours of the highest internal elastic strain once a critical threshold of strain has been reached.
Figure 8 shows lattice orientation maps of the magnesium AZ31B sample for an area of 50 × 30 µm2 containing 20 grains and corresponding to a −2.5%, −2.7% and −3.4% extensometer strain, respectively. Several grains contain twins that increase in size with increasing strain. The disorientation angle between the twinned and the parent lattice of the grains is consistently 86.3°, indicating that these are extension twins. It can be seen how twinned volumes grow to fill out grains until the grains have become reoriented and the aspect ratio changes to accommodate the plastic strain, and that there is a continuity of twin growth across grain boundaries. Some twinned volumes appear also to de-twin with an increasing strain (the blue and green twins towards the top left of the image), perhaps as the deformation in the adjacent grains alters the local stress acting upon them. Figure 8e and Figure 8f show the pole figures for Figure 8a and Figure 8c, respectively, where the increasing fraction of the twinned sites is clear as the two peaks top and bottom show the c-axis alignment with the x1 direction.
Figure 9 shows lattice orientation maps of the magnesium AZ31B sample at a −3.5% and −3.9% extensometer strain where twins can be observed forming and growing. Of particular interest is the grain marked with an arrow in Figure 9a. In the band contrast image of Figure 9c, this grain appears to be twinned, but the orientation map of Figure 9b shows only faint discoloration of the corresponding area, and the line scan along the line A–B across this grain in Figure 9d shows that the lattice is distorted by only up to 4°. This suggests that the twin is only just beginning to form and yet has a width of around 4 µm. This suggests that BC can be used to identify the early stages of twinning but does not reveal the actual rotational degree of twinning. Figure 9c shows other areas of lattice disruption that resemble the early stages of twinning and that do not appear in the orientation map. The growth of twins from one grain into another is also apparent in several locations.
Figure 10 shows dense distributions of twins within a BTG at a −4.5% extensometer strain. The contrast in the SEM secondary electron image is due to the inclination of the twinned surfaces. Figure 10b shows an EBSD lattice orientation map of an adjacent area and Figure 10c the corresponding band contrast map. At this relatively high strain, the majority of grains have either partially or completely twinned, as shown by the large number of grains and areas divergent from the red associated with basal texture. Figure 10c shows the internal grain disorientation map. The mean disorientation within grains is 1.2°. However, a large fraction of grains contain disorientation of typically 4°, while a few have up to a maximum of 10°. Extensive grain elastic deformation is therefore present in addition to twinning. The maximum disorientation within grains of 10° would suggest this to be a threshold for twinning. Two grains, marked A and B, with disorientation around 10° would likely be the next to twin when the global strain is increased. Grain A has maximum strain at the edge of the grain while grain B has maximum towards the top, indicating that A would likely twin at the edge and B twinning would extend the already present three small twins to the top edge of the grain. Figure 10d shows the pole figure for the [0001] or c-axis and it is clear that lattice orientations have shifted away from the basal texture and that two new peaks due to twinning have formed, rotated away from the sheet normal in the x1 direction. This indicates that the twins are extension-type. The Kearns texture factors are 0.35 (RD), 0.25 (TD) and 0.40 (ND), indicating a substantial fraction of twinning. An estimate of the percentage of the twinned area within the BTG based on these values would then be 60%. As the experiment was strain-controlled, increasing stress would then expand the width of the BTG rather than increase the percentage of twins within the BTG. Only once the BGTs merged to fill out the gauge zone would the strain within the existing BTGs be expected to increase and the percentage of twins also increase. A previous study showed this relationship in greater detail [53].
It was found in a previous study [64] that in AZ31B, zinc migrated to the grain boundaries, while aluminium and manganese precipitated as the Al8Mn5 phase. Precipitate hardening works via precipitates blocking the progress of slip, and they will also interfere with the twinning process. The degree by which they might do that is still an open question, but the previously mentioned study showed that twins can form around a precipitate enclosing the precipitate and an untwinned volume. The presence of zinc at the grain boundaries might be expected to form a barrier between grains that would reduce the tendency for twins to extend from one grain into a neighbour.

4. Summary and Conclusions

Magnesium AZ31B textured sheet samples were subjected to uniaxial compressive force in situ in an SEM. In order to analyse the initiation and evolution of twinning under homogeneous uniaxial compressive stress states, in situ tests combined with real-time EBSD mapping were performed. Additionally, a novel anti-buckling guide was developed to prevent the sample from buckling. By pausing the strain at specific intervals, detailed investigation and EBSD lattice orientation maps were made.
Analysis shows the growth of BTGs as well as the growth of individual twins within these macroscopic bands. It was found that all twins were of extension type with 86.3° disorientation relative to the parent grain. It was also found that the macroscopic BTGs formed normal to the principal direction of the maximum compressive stress σ3, which was simulated using an elastic FEM model, and that individual twins formed approximately normal to the σ3 direction, most likely according to the local distribution of stress that individual grains were subjected to on a microscopic scale.
Twins are found to grow across grains and then to widen from a lenticular shape until the whole grain is twinned. Often, multiple twins form in single grains, merging as they grow under the applied stress. The band contrast images were found to show details of lattice deformation ahead of twin growth that the grain orientation maps did not always reveal. This suggests that twin growth is subsequent to an early stage of elastic deformation of the lattice. Internal grain lattice disorientation maps illustrate the distribution of elastic strain within grains and can be used to predict the growth direction of twins. A maximum value of 10° observed in the highest strain sample suggests that this magnitude of elastic strain might be a threshold value above which twin formation occurs.

Author Contributions

Conceptualisation, L.W., H.S. and O.H.; methodology, O.H., L.W., H.S. and A.N.; software, L.W. and A.N.; validation, L.W., A.N., O.H. and H.S.; formal analysis, L.W., O.H. and A.N.; investigation, L.W. and A.N.; resources, H.S. and L.W.; data curation, L.W.; writing—original draft preparation, L.W.; writing—review and editing, L.W. and O.H.; visualisation, L.W. and O.H.; supervision, L.W. and H.S.; project administration, L.W.; funding acquisition, L.W. and O.H. All authors have read and agreed to the published version of the manuscript.

Funding

This research was funded by the Austrian Science Fund (FWF) under grant number I-4782-N and the Deutsche Forschungsgemeinschaft (DFG) under project number 438040004. Open Access Funding by the Austrian Science Fund (FWF).

Institutional Review Board Statement

Not applicable.

Informed Consent Statement

Not applicable.

Data Availability Statement

All data are available upon request from the corresponding author. The data is publicly available.

Acknowledgments

The authors are grateful to the Department of Chemistry and Physics of Materials at PLUS for providing office and lab space.

Conflicts of Interest

The authors declare no conflicts of interest.

References

  1. Polmear, I.J. Magnesium alloys and applications. J. Mater. Sci. Technol. 1994, 10, 1–16. [Google Scholar] [CrossRef]
  2. Tan, J.; Ramakrishna, S. Applications of Magnesium and Its Alloys: A Review. Appl. Sci. 2021, 11, 6861. [Google Scholar] [CrossRef]
  3. Prasad, S.V.S.; Prasad, S.B.; Verma, K.; Mishra, R.K.; Kumar, V.; Singh, S. The role and significance of Magnesium in modern day research-A review. J. Magnes. Alloys 2021, 10, 1–61. [Google Scholar] [CrossRef]
  4. Luo, A.A. Magnesium: The Lightest Structural Metal; International Magnesium Association: Saint Paul, MN, USA, 2018; pp. 1–47. [Google Scholar]
  5. Serra, A.; Bacon, D.J.; Osetsky, Y.N. Strengthening and microstructure modification associated with moving twin boundaries in hcp metals. Philos. Mag. Lett. 2007, 87, 451–459. [Google Scholar] [CrossRef]
  6. Barnett, M.R. Twinning and the ductility of magnesium alloys. Mater. Sci. Eng. A 2007, 464, 1–7. [Google Scholar] [CrossRef]
  7. Hosford, W.F. Miller–Bravais Indices for Hexagonal Crystals. In Materials Science; Cambridge University Press: Cambridge, UK, 2006; Chapter 3; pp. 21–25. [Google Scholar] [CrossRef]
  8. Agnew, S.R. Deformation mechanisms of magnesium alloys. In Advances in Wrought Magnesium Alloys; Woodhead Publishing Series in Metals and Surface Engineering; Woodhead Publishing: Sawston, UK, 2012; pp. 63–104. [Google Scholar] [CrossRef]
  9. Jayasathyakawin, S.; Ravichandran, M.; Baskar, N.; Anand Chairman, C.; Balasundaram, R. Mechanical properties and applications of Magnesium alloy. Mater. Today Proc. 2020, 27, 909–913. [Google Scholar] [CrossRef]
  10. Christian, J.W.; Mahajan, S. Deformation twinning. Prog. Mater. Sci. 1995, 39, 1–157. [Google Scholar] [CrossRef]
  11. Nie, J.F.; Shin, K.S.; Zeng, Z.R. Microstructure, deformation, and property of wrought magnesium alloys. Metall. Mater. Trans. A 2020, 51, 6045–6109. [Google Scholar] [CrossRef]
  12. Graff, S.; Brocks, W.; Steglich, D. Yielding of magnesium: From single crystal to polycrystalline aggregates. Int. J. Plast. 2007, 23, 1957–1978. [Google Scholar] [CrossRef]
  13. Agnew, S.R.; Duygulu, Ö. Plastic anisotropy and the role of non-basal slip in magnesium alloy AZ31B. Int. J. Plast. 2005, 21, 1161–1193. [Google Scholar] [CrossRef]
  14. Beyerlein, I.J.; Arul Kumar, M. The Stochastic Nature of Deformation Twinning: Application to HCP Materials. In Handbook of Materials Modeling; Andreoni, W., Yip, S., Eds.; Springer: Cham, Switzerland, 2018. [Google Scholar] [CrossRef]
  15. Partridge, P.G. The crystallography and deformation modes of hexagonal close-packed metals. Metall. Rev. 1967, 12, 169–194. [Google Scholar] [CrossRef]
  16. Yu, H.; Li, C.; Xin, Y.; Chapuis, A.; Huang, X.; Liu, Q. The mechanism for the high dependence of the Hall-Petch slope for twinning/slip on texture in Mg alloys. Acta Mater. 2017, 128, 313–326. [Google Scholar] [CrossRef]
  17. Luo, A.A.; Shi, R.; Miao, J.; Avey, T. Review: Magnesium Sheet Alloy Development for Room Temperature Forming. JOM 2021, 73, 1403–1418. [Google Scholar] [CrossRef]
  18. Lou, X.; Li, M.; Boger, R.; Agnew, S.; Wagoner, R. Hardening evolution of AZ31B Mg sheet. Int. J. Plast. 2007, 23, 44–86. [Google Scholar] [CrossRef]
  19. Seipp, S.; Wagner, M.F.-X.; Hockauf, K.; Schneider, I.; Meyer, L.W.; Hockauf, M. Microstructure, crystallographic texture and mechanical properties of the magnesium alloy AZ31B after different routes of thermo-mechanical processing. Int. J. Plast. 2012, 35, 155–166. [Google Scholar] [CrossRef]
  20. Zum Gahr, K.-H. (Ed.) Chapter 2 Microstructure and Mechanical Properties of Materials. Tribol. Ser. 1987, 10, 8–47. [Google Scholar] [CrossRef]
  21. Shackelford, J.F. Introduction to Materials Science for Engineers, 8th ed.; Pearson: London, UK, 2014. [Google Scholar]
  22. Hosford, W.F. Mechanical Behavior of Materials; Cambridge University Press: New York, NY, USA, 2005. [Google Scholar]
  23. Rakshith, M.; Seenuvasaperumal, P. Review on the effect of different processing techniques on the microstructure and mechanical behaviour of AZ31 Magnesium alloy. JMA 2021, 9, 1692–1714. [Google Scholar] [CrossRef]
  24. Hazeli, K.; Cuadra, J.; Vanniamparambil, P.A.; Kontsos, A. In situ identification of twin-related bands near yielding in a magnesium alloy. Scr. Mater. 2013, 68, 83–86. [Google Scholar] [CrossRef]
  25. Lagattu, F.; Brillaud, J.; Lafarie-Frenot, M.C. High strain gradient measurements by using digital image correlation technique. Mater. Charact. 2004, 53, 17–28. [Google Scholar] [CrossRef]
  26. Denk, J.; Nischler, A.; Whitmore, L.; Huber, O.; Saage, H. Discontinuous and inhomogeneous strain distributions under monotonic and cyclic loading in textured wrought magnesium alloys. Mat. Sci. Eng. A 2019, 764, 138182. [Google Scholar] [CrossRef]
  27. Denk, J. Model for the Fatigue Behavior of Wrought Magnesium Structures Based on Mechanical and Microstructural Characterization; LC Verlag: Landshut, Germany, 2019; ISBN 978-3-9818439-3-4. URN: urn:nbn:de:bvb:860-opus4-185. [Google Scholar]
  28. Whitmore, L.; Denk, J.; Zickler, G.A.; Bourret, G.R.; Huber, O.; Huesing, N.; Diwald, O. Macro to nano: A microscopy study of a wrought magnesium alloy after deformation. Eur. J. Phys. 2019, 40, 045501. [Google Scholar] [CrossRef]
  29. Dingley, D.J.; Meaden, G.; Dingley, D.J.; Day, A.P. A review of EBSD: From rudimentary on line orientation measurements to high resolution elastic strain measurements over the past 30 years. IOP Conf. Ser. Mater. Sci. Eng. 2018, 375, 012003. [Google Scholar] [CrossRef]
  30. Schwartz, A.J.; Kumar, M.; Adams, B.L.; Field, D.P. (Eds.) Electron Backscatter Diffraction in Materials Science, 2nd ed.; Springer: New York, NY, USA, 2009. [Google Scholar]
  31. Wert, J.A.; Huang, X.; Winther, G.; Pantleon, W.; Poulsen, H.F. Revealing deformation microstructures. Mater. Today 2007, 10, 24–32. [Google Scholar] [CrossRef]
  32. Zaefferer, S. A critical review of orientation microscopy in SEM and TEM. Cryst. Res. Technol. 2011, 46, 607–628. [Google Scholar] [CrossRef]
  33. Humphreys, F.J. Grain and sub-grain characterisation by electron backscatter diffraction. J. Mater. Sci. 2001, 36, 3833–3854. [Google Scholar] [CrossRef]
  34. Carneiro, I.; Simões, S. Recent advances in EBSD characterization of metals. Metals 2020, 10, 1097. [Google Scholar] [CrossRef]
  35. Humphreys, F.J. Characterisation of fine-scale microstructures by electron backscatter diffraction (EBSD). Scr. Mater. 2004, 51, 771–776. [Google Scholar] [CrossRef]
  36. Kainuma, Y. The theory of Kikuchi patterns. Acta Crystallogr. 1955, 8, 247–257. [Google Scholar] [CrossRef]
  37. Michael, J.R.; Goehner, R.P. Advances in backscattered electron Kikuchi patterns for crystallographic phase identification. In Proceedings of the 52nd Annual Meeting of MSA, New Orleans, LA, USA, 31 July–5 August 1994; pp. 596–597. [Google Scholar]
  38. Sneddon, G.C.; Trimby, P.W.; Cairney, J.M. Transmission Kikuchi diffraction in a scanning electron microscope: A review. Mater. Sci. Eng. 2016, 110, 1–12. [Google Scholar] [CrossRef]
  39. Shi, Q.; Jiao, L.; Loisnard, D.; Dan, C.; Chen, Z.; Wang, H.; Roux, S. Improved EBSD indexation accuracy by considering energy distribution of diffraction patterns. Mater. Charact. 2022, 188, 111909. [Google Scholar] [CrossRef]
  40. Chen, D.; Kuo, J.-C.; Wu, W.-T. Effect of microscopic parameters on EBSD spatial resolution. Ultramicroscopy 2011, 111, 1488–1494. [Google Scholar] [CrossRef] [PubMed]
  41. Kopec, M. Compression and fatigue testing of high-strength thin metal sheets by using an anti-buckling device. Exp. Mech. 2023, 63, 1003–1013. [Google Scholar] [CrossRef]
  42. Stoudt, M.R.; Levine, L.E.; Ma, L. Designing a uniaxial tension/compression test for springback analysis in high-strength steel sheets. Exp. Mech. 2017, 57, 155–163. [Google Scholar] [CrossRef] [PubMed]
  43. Nowell, M.M.; Witt, R.A.; True, B. EBSD sample preparation: Techniques, tips, and tricks. Microsc. Today 2005, 13, 44–49. [Google Scholar] [CrossRef]
  44. Voort, G.V.; van Geertruyden, W.; Dillon, S.; Manilova, E. Metallographic preparation for electron backscattered diffraction. Microsc. Microanal. 2006, 12, 1610–1611. [Google Scholar] [CrossRef]
  45. Taheri, M.; Phillips, R.C.; Kish, J.R.; Botton, G.A. Analysis of the surface film formed on Mg by exposure to water using a FIB cross-section and STEM–EDS. Corros. Sci. 2012, 59, 222–228. [Google Scholar] [CrossRef]
  46. Whitmore, L.; Nischler, A.; Huber, O. Preparation of magnesium AZ31B for electron backscatter diffraction (EBSD) analysis. In [Hrsg.]: 11. Landshuter Leichtbau-Colloquium; Huber, O., Bicker, M., Patzelt, P., Eds.; LC-Verlag: Landshut, Germany, 2023; ISBN 978-3-9818439-7-2. [Google Scholar]
  47. Dingley, D.J. A simple straining stage for the scanning electron microscope. Micron 1969, 1, 206–210. [Google Scholar] [CrossRef]
  48. Li, K.; Bu, Y.; Wang, H. Advances on in situ TEM mechanical testing techniques: A retrospective and perspective view. Front. Mater. 2023, 10, 1207024. [Google Scholar] [CrossRef]
  49. Wilsdorf, H.G.F. Apparatus for the deformation of foils in an electron microscope. Rev. Sci. Instrum. 1958, 29, 323–324. [Google Scholar] [CrossRef]
  50. Kahla, S.; LinPeng, R.; Calmunger, M.; Olsson, B.; Johansson, S. In situ EBSD during tensile test of aluminum AA3003 sheet. Micron 2014, 58, 15–24. [Google Scholar] [CrossRef]
  51. Dittrich, J.; Farkas, G.; Drozdenko, D.; Knapek, M.; Máthis, K.; Minárik, P. Advanced in-situ experimental techniques for characterization of deformation mechanisms in magnesium alloys. J. Alloys Compd. 2023, 937, 168388. [Google Scholar] [CrossRef]
  52. Gong, W.; Zheng, R.; Harjo, S.; Kawasaki, T.; Aizawa, K.; Tsuji, N. In-situ observation of twinning and detwinning in AZ31 alloy. J. Magnes. Alloys 2022, 10, 3418–3432. [Google Scholar] [CrossRef]
  53. Denk, J.; Whitmore, L.; Huber, O.; Diwald, O.; Saage, H. Concept of the highly strained volume for fatigue modeling of wrought magnesium alloys. Int. J. Fatigue 2018, 117, 283–291. [Google Scholar] [CrossRef]
  54. Kawalla, R.; Oswald, M.; Schmidt, C. New technology for the production of magnesium strips and sheets. J. Metall. 2008, 47, 195–198. [Google Scholar]
  55. Nischler, A.; Huber, O. Entwicklung eines Materialmodells zur Simulation des inhomogenen 3D-Dehnungsfelds von texturierten Magnesium-Knetlegierungen mittels der FEM. In 11. Landshuter Leichtbau-Colloquium; Huber, O., Bicker, M., Patzelt, P., Eds.; LC-Verlag: Landshut, Germany, 2023; ISBN 978-3-9818439-7-2. [Google Scholar]
  56. Mattheck, C.; Kappel, R.; Sauer, A. Shape optimization the easy way: The ‘method of tensile triangles’. Int. J. Des. Nat. 2007, 2, 301–309. [Google Scholar] [CrossRef]
  57. Tripathi, A.; Zaefferer, S. On the resolution of EBSD across atomic density and accelerating voltage with a particular focus on the light metal magnesium. Ultramicroscopy 2019, 207, 112828. [Google Scholar] [CrossRef] [PubMed]
  58. Beausir, B.; Fundenberger, J.J. Analysis Tools for Electron and X-ray Diffraction; ATEX-software; Université de Lorraine: Metz, France, 2017; Available online: www.atex-software.eu (accessed on 14 December 2023).
  59. Randolph, S.J.; Fowlkes, J.D.; Rack, P.D. Focused, nanoscale electron-beam-induced deposition and etching. Crit. Rev. Solid State Mater. Sci. 2006, 31, 55–89. [Google Scholar] [CrossRef]
  60. Gruber, J.A.; Brown, S.A.; Lucadamo, G.A. Generalized Kearns texture factors and orientation texture measurement. J. Nucl. Mater. 2011, 408, 176–182. [Google Scholar] [CrossRef]
  61. Liu, Y.; Tang, P.Z.; Gong, M.Y.; McCabe, R.J.; Wang, J.; Tomé, C.N. Three-dimensional character of the deformation twin in magnesium. Nat. Commun. 2019, 10, 3308. [Google Scholar] [CrossRef]
  62. Wu, L.; Agnew, S.R.; Brown, D.W.; Stoica, G.M.; Clausen, B.; Jain, A.; Fielden, D.E.; Liaw, P.K. Internal stress relaxation and load redistribution during the twinning–detwinning-dominated cyclic deformation of a wrought magnesium alloy, ZK60A. Acta Mater. 2008, 56, 3699–3707. [Google Scholar] [CrossRef]
  63. Liu, T.; Yang, Q.; Guo, N.; Lu, Y.; Song, B. Stability of twins in Mg alloys—A short review. J. Magnes. Alloys 2020, 8, 66–77. [Google Scholar] [CrossRef]
  64. Whitmore, L.C.; Denk, J.; Zickler, G.A.; Bourret, G.R.; Huber, O.; Saage, H.; Huesing, N.; Diwald, O. Microstructural investigation of twin-roll cast magnesium AZ31B subjected to a single monotonic compressive stress. J. Alloys Compd. 2019, 789, 1022–1034. [Google Scholar] [CrossRef]
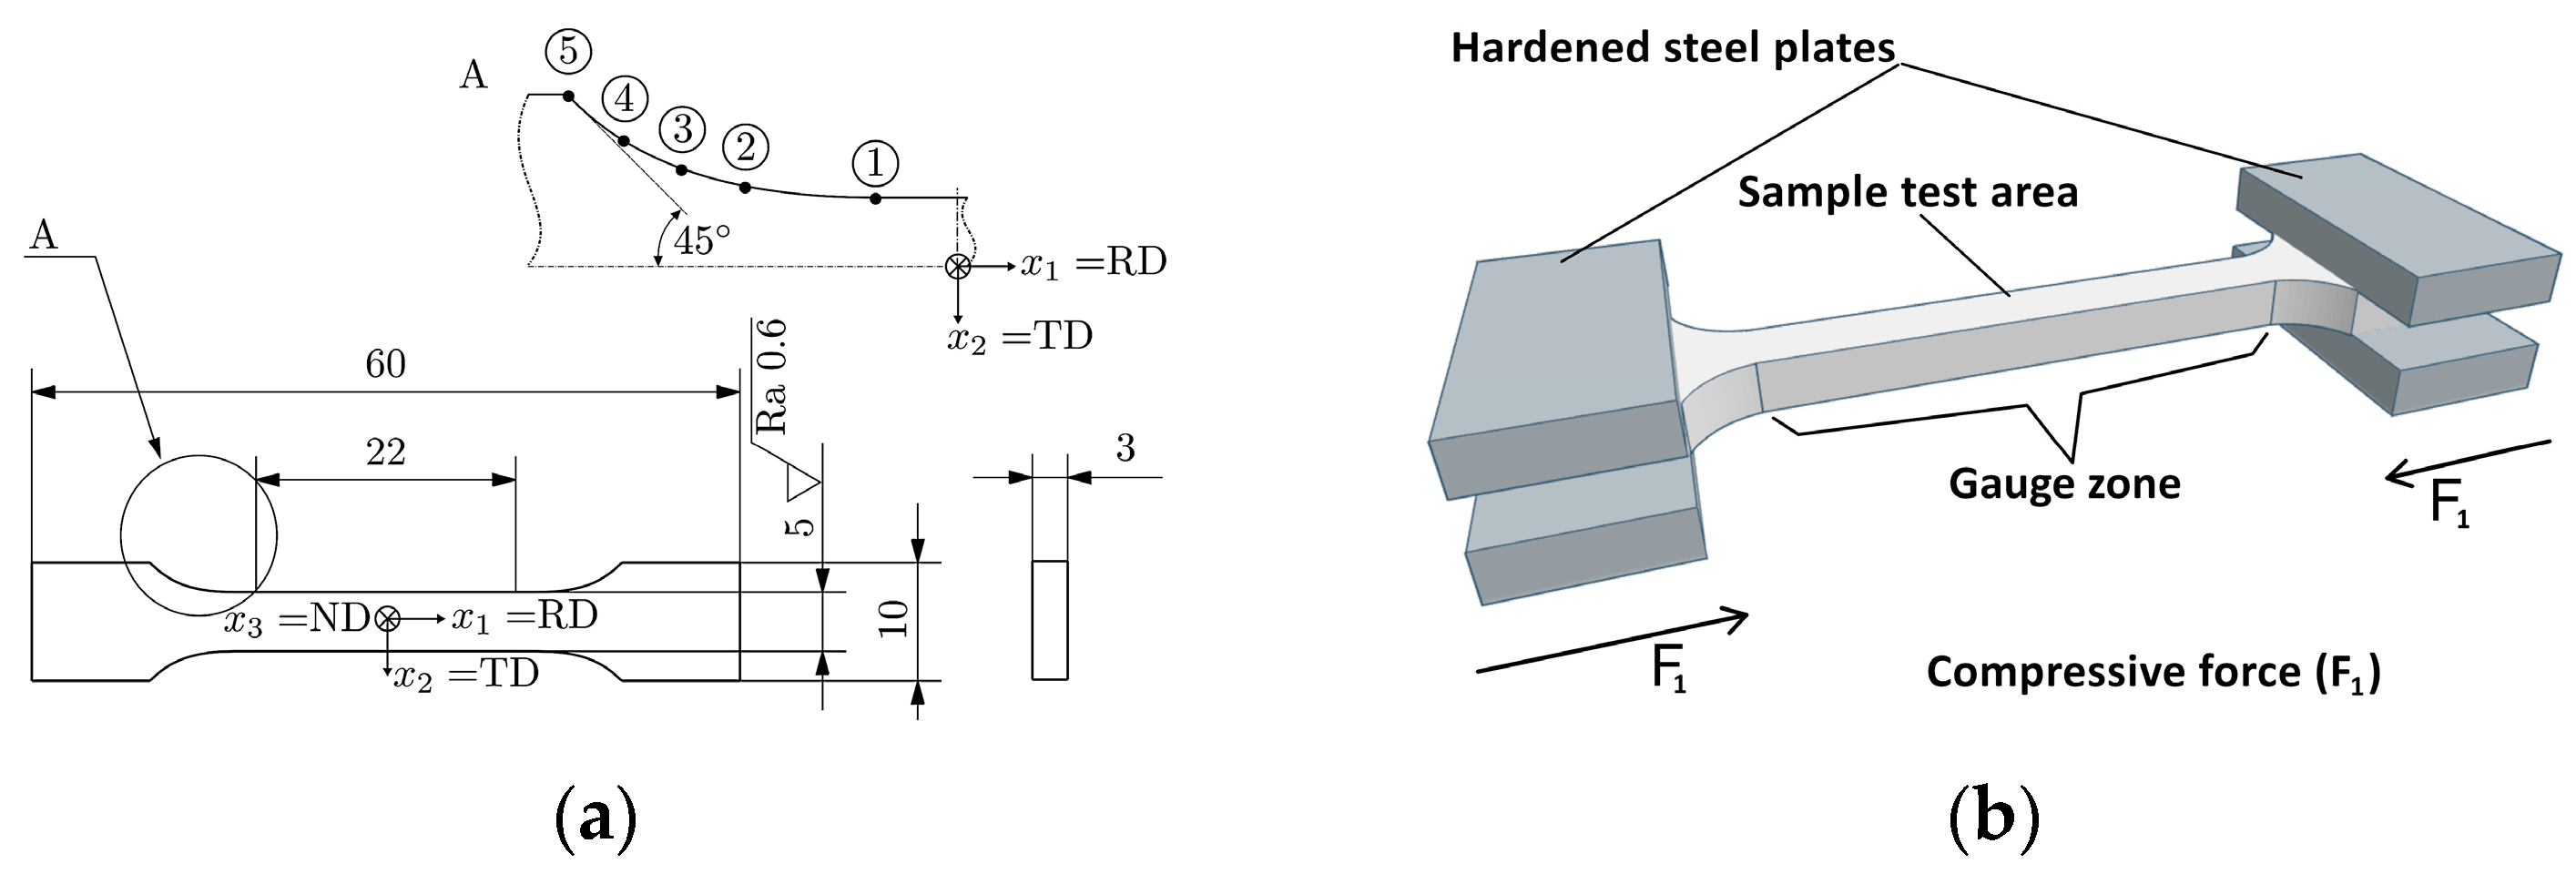
Figure 1. The hexagonal unit cell of magnesium (a) with atom sites, axes and dimensions indicated, (b) showing the slip planes for basal, prismatic and pyramidal slip and (c) showing the twinning planes for extension and contraction twinning.
Metals 14 00020 g001
Figure 2. Details of the uniaxial compression sample showing (a) the geometrical form with dimensions in mm and (b) the hardened steel gripping plates of the in situ tester and the applied force (F1).
Metals 14 00020 g002
Figure 3. Results of the FEM simulation of the uniaxial sample under compressive loading: (a) normal stress σ11(x1, x2, x3); (b) plot of the normal stress σ11(x1, x2, x3 = 0) along the lateral boundary contour coordinate s1.
Metals 14 00020 g003
Figure 4. Details of the anti-buckling guide showing (a) the steel construction fitted onto the sample and (b) the knife edge extensometer making contact with the sample through ports in the anti-buckling guide.
Metals 14 00020 g004
Figure 5. Experimental setup showing (a) a schematic of the EBSD experimental data acquisition and analysis system, (b) the Kammrath & Weiss in situ tension–compression stage mounted in the SEM, (c) a typical experimental loading curve with breakpoints to pause the test for EBSD mapping and (d) a typical sample after uniaxial compression to −1.6% extensometer strain showing a single band of twinned grains.
Metals 14 00020 g005
Figure 6. Images of the magnesium AZ31B sample made in situ at values of stress and compressive extensometer strain of (a) 100 MPa and −1.8%, (b) 105 MPa and −1.95%, (c) 115 MPa and −3.0% and (d) 120 MPa and −3.5% showing the growth of the band of twinned grains into the analysed area (the centremost rectangular area).
Metals 14 00020 g006
Figure 7. Lattice orientation maps of the magnesium sample (with orientation colour code inset) (a) before loading and (b) the same area under compression to −1.8% extensometer strain showing the presence of deformation twins; (c) band contrast map of the same area and strain as (b); (d) a lattice disorientation line scan along the indicated line in (b) showing the characteristic 86.3° disorientation of extension twins; (e) the pole figure for the unloaded state and (f) the pole figure for the loaded state at −1.8% extensometer strain, and a comparison for the rectangular area marked in (a) of the internal grain disorientation (g) before loading and (h) at −1.8% extensometer strain.
Metals 14 00020 g007
Figure 8. Lattice orientation maps of the magnesium sample at (a) −2.5%, (b) −2.7% and (c) −3.4% extensometer strain showing the initiation and growth of twins in various grains, (d) disorientation angle along the path across the mid-lower grain indicated by the line A–B and showing the 86.3° angle of extension twins, (e) pole figure of (a) and (f) pole figure of (c).
Metals 14 00020 g008
Figure 9. Lattice orientation maps of the magnesium sample at (a) −3.5% and (b) −3.9% extensometer strain showing the initiation and growth of twins, (c) band contrast of the same area at −3.9% extensometer strain and (d) disorientation line scan across the line A–B indicated in (b).
Metals 14 00020 g009
Figure 10. Twinned grains within a BTG at −4.5% extensometer strain: (a) EBSD lattice orientation map showing elongated twins as well as grains that have fully twinned, (b) band contrast map showing more details of lattice distortion, (c) internal grain disorientation map with disorientation up to 10° and (d) pole figure showing a high fraction of sites with c-axis rotated into the plane of the sheet parallel to x1 characteristic of extension twinning.
Metals 14 00020 g010
Table 1. Coordinate points of the spline defined as the transition between the clamping and gauge area.
CoordinatesPoint 1Point 2Point 3Point 4Point 5
x 1 (mm)−11.0−15.0−16.8−19.0−20.0
x 2 (mm)−2.50−2.62−3.00−4.13−5.00
Disclaimer/Publisher’s Note: The statements, opinions and data contained in all publications are solely those of the individual author(s) and contributor(s) and not of MDPI and/or the editor(s). MDPI and/or the editor(s) disclaim responsibility for any injury to people or property resulting from any ideas, methods, instructions or products referred to in the content.

