Article

Hydrothermal Leaching Kinetics of Vanadium from an Iron Vanadate Mineral Using Oxalic Acid

1
State Key Laboratory for Comprehensive Utilization of Vanadium and Titanium Resources, Pangang Group Research Institute Co., Ltd., Panzhihua 617000, China
2
School of Metallurgical and Ecological Engineering, University of Science and Technology Beijing, Beijing 100083, China
*
Author to whom correspondence should be addressed.
Current address: Xiamen Zijin Technology of Mining & Metallurgy Ltd., Xiamen 361115, China.
Metals 2023, 13(9), 1629; https://doi.org/10.3390/met13091629
Submission received: 16 August 2023 / Revised: 10 September 2023 / Accepted: 13 September 2023 / Published: 20 September 2023
(This article belongs to the Section Extractive Metallurgy)

Abstract

:
Hydrothermal leaching vanadium using oxalic acid is a novel method reported recently to overcome the serious environmental problems caused by traditional extracting processes. In view of its promising application potential, the hydrothermal leaching kinetics of vanadium from a concentrate mainly composed of Fe3−xVxO4 mineral via oxalic acid were investigated in this study. Firstly, the effects of the temperature and concentration of oxalic acid on the leaching behavior of vanadium were studied by measuring the leaching efficiency of vanadium at various times. Then, by fitting the measured leaching efficiency data to the proposed kinetic model, the leaching mechanism was analyzed and the rate-controlling step of the leaching process, the apparent activation energy, and the order of the chemical reactions were determined. Finally, a kinetic model was proposed to describe the present investigated leaching process. Detailed results are as follows: (1) an interfacial chemical reaction was the rate-controlling step of the present hydrothermal leaching process within temperatures ranging from 363 to 403 K, and the leaching efficiency was less than 85%; (2) the apparent activation energy of the interfacial chemical reaction was 45.6 kJ/mol; (3) the order of the interfacial chemical reaction to the concentration of oxalic acid was around 1.66.

1. Introduction

Vanadium is a transition element listed in the fourth row and within group VB in the periodic table. With the average amount of the element being about 160 g/t in the Earth’s crust, it ranks 22nd in the element abundance queue [1,2,3], which is higher than most base metals such as Cu, Zn, and Ni. However, vanadium is widely spread and distributed in the Earth’s crust, and it rarely forms deposits in its own right [4,5,6], which causes the process for vanadium extraction to be complex and environmentally unfriendly. Therefore, from the view point of extractive metallurgy, new processes and technology for vanadium extraction are needed urgently.
Currently, two types of primary deposits dominate the production of vanadium. The largest and most important is the orthomagmatic deposit, vanadium–titanium magnetite ore [7]. The vanadium–titanium magnetite is generally used as the raw material for iron-making. In this process, the liquid metal of iron containing vanadium is firstly obtained through the smelting of the vanadium–titanium magnetite ore in a blast furnace [7,8]. Then, the liquid metal is blown by oxygen in a converter to oxidize the dissolved vanadium and enrich it in the formed slag [7,8]. This obtained slag, called vanadium slag, is then used as the feedstock for vanadium extraction. To further extract the vanadium from the obtained vanadium slag, the traditional process is sodium roasting followed by water leaching [9]. In the sodium roasting step, the trivalent vanadium (V3+) occurring in the vanadium slag is oxidized to pentavalent (V5+) and reacts with the added sodium salts (NaCl, Na2SO4, Na2CO3, etc.) to form water-soluble vanadate. Then, the formed sodium vanadate is leached by water, and the leachate is further treated to produce vanadium oxide. However, the traditional sodium roasting–water leaching process is challenged due to the harmful gas emitted in the roasting step and the ammonia–nitrogen wastewater generated in the step of treating leachate [10]. To solve these problems of the sodium roasting–water leaching process, a calcification roasting–acid leaching process was developed, in which calcium salt such as CaCO3 is used as an additive to replace the sodium salts, and sulfuric acid is used as the leaching agent [10]. This is the general procedure of vanadium production from vanadium–titanium magnetite. It can be seen clearly that the vanadium occurring in vanadium–titanium magnetite ore is obtained as a by-product of the iron-making industry.
The subordinate source for vanadium production is the sedimentary deposit, vanadium-bearing shales. It is a type of shallow marine sediment formed by the lower organisms in seawater and colloidal silica or clay under a reducing environment after a long time of metamorphism and digenesis [3,4,5]. Generally, vanadium-bearing shales mainly consist of quartz and vanadium-bearing phyllosilicates minerals such as roscoelite and illite, as well as a small amount of pyrite and carbonaceous materials, etc., and the vanadium occurs predominantly as V (III) (trivalent vanadium) by replacing the Al (III) as an isomorphism in phyllosilicates [11]. The earliest technology adopted to extract vanadium from vanadium-bearing shales is the sodium roasting–water leaching process, as stated in the past paragraph [3]. Afterwards, due to the defects of this process, several new technologies such as calcification roasting–acid leaching, blank roasting–acid leaching, and direct acid leaching, etc., were developed [11,12]. However, all these technologies were confronted with serious deficiencies in two aspects. The first is that the recovery rate of vanadium is low [5,13]. For example, vanadium recovery by direct sulfuric acid leaching makes up about 65–71% of the work at the Shaanxi Wuzhou Mining Co., Ltd. In Shangluo, China [13]. Although the intrinsic reasons for the low recovery are not yet completely clarified [4,5], the carbonaceous matter existing in the ore is an essential reason for the low vanadium recovery rate because the carbonaceous matter protects the trivalent vanadium (V3+) from being oxidized to tetravalent vanadium (V4+) or pentavalent vanadium (V5+) and forming soluble vanadate. The second is the very low vanadium grade in the ore, generally ranging from 0.3 to 1.2 mass% of V2O5, which causes a huge quantity of feedstock, excessive acid to be consumed by redundant minerals, as well as the huge amount of resulting effluent because the grade of vanadium cannot be upgraded by the common beneficiation methods due to the similar physical and chemical properties between the vanadium-bearing phyllosilicates minerals and the gangue. As a result, the utilization of the vanadium-bearing shales was limited due to economic and ecological reasons.
To find a way out of the dilemma faced by the vanadium-bearing shales, a novel method of beneficiating the vanadium-bearing shales was developed in our previous publication [14]. The basic idea of this method is to use the environmentally friendly Fe2O3 as a capturer or attractor to react with the vanadium dispersed in the vanadium-bearing shales ore as well as the carbonaceous materials and form a stable magnetic Fe3−xVxO4 spinel mineral. Then, the formed magnetic Fe3−xVxO4 mineral is separated from the gangue miners using the magnetic method, and a high-grade vanadium concentrate can be obtained. We applied this approach to the vanadium-bearing shales located at Yixing City in Hubei province of China; the grade of vanadium improved from 0.7 to around 14 mass%, and the recovery rate of vanadium can reach 92%.
With regard to the obtained high-grade vanadium concentrate, it was mainly composed of Fe3−xVxO4 mineral, as well as a small amount of Fe and pyroxene. To further extract the vanadium from this concentrate, we attempted to leach the trivalent vanadium (V3+) contained in Fe3−xVxO4 mineral using oxalic acid solution. It was found that the trivalent vanadium (V3+) can be leached out hydrothermally through forming a stable V(C2O4)33− complex ion [15]. Compared with the other technologies reported previously, this method has two distinct features. Firstly, without oxidizing the trivalent vanadium (V3+) to a higher valency, it is the trivalent vanadium (V3+) that was leached out directly; this is favorable to the recovery of vanadium because the vanadium in the dominant deposits occurs mainly in the form of trivalent vanadium (V3+). Secondly, oxalic acid is more environmentally friendly than the commonly used inorganic acid because it can be degraded naturally, which is beneficial to the treatment of the leaching residue.
In view of the distinct features of the method of oxalic acid hydrothermal leaching trivalent vanadium (V3+) and its prospective application, it is necessary to carry out some enlarged scale experiments to confirm its adaptability. To conduct the enlarged scale experiments, the leaching kinetic information, such as the kinetic mechanism, the rate-determining step, and the kinetic parameters, are indispensable. Therefore, in the present study, the macro-kinetics of the hydrothermal leaching of vanadium using oxalic acid from a concentrate composed of Fe3−xVxO4 mineral were investigated.

2. Experimental Section
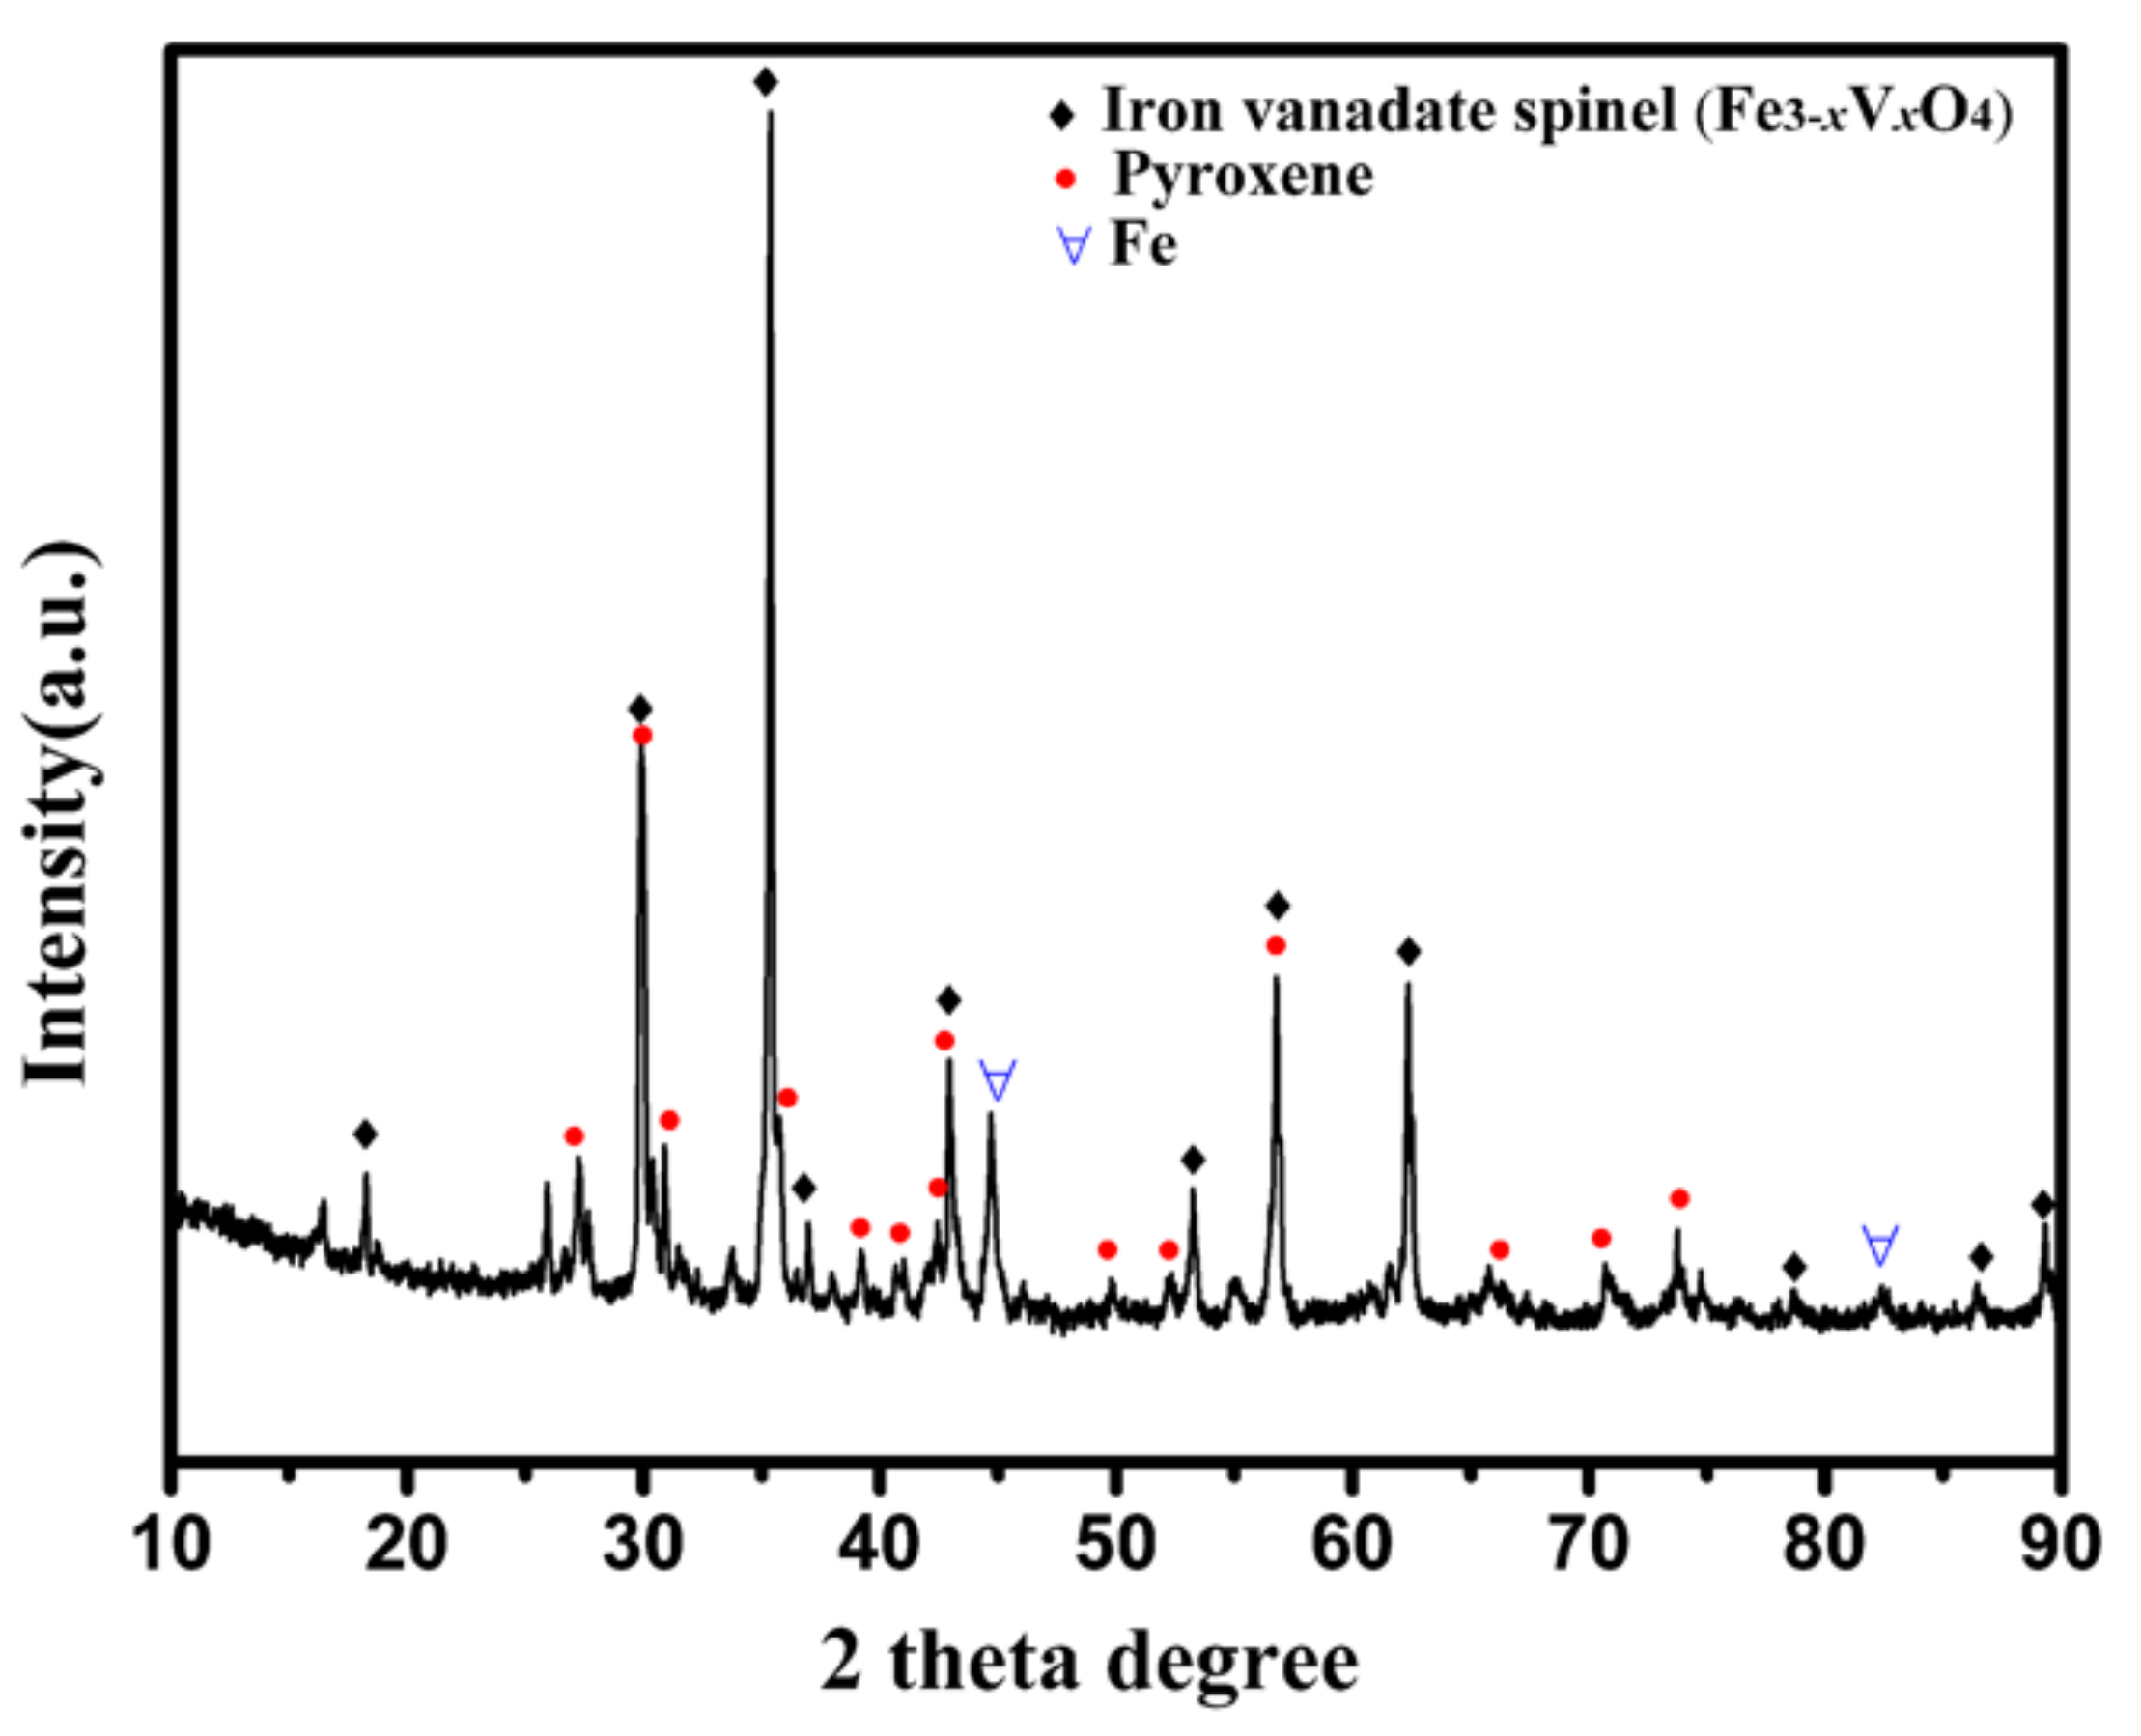
2.1. Raw Materials

Before performing the leaching experiments, the concentrate mainly containing Fe3−xVxO4 mineral was prepared first. The detailed procedure of preparing the concentrate using beneficiating vanadium-bearing shales was reported in our previous publication [14,15]. For the sake of brevity, only the salient steps are given here. The vanadium-bearing shales from Yichang City in Hubei province of China were used; they were ground and mixed with 10 mass% Fe2O3 and 0.75 mass% carbon. The homogeneous mixture was pelleted and roasted at 1473 K under an Ar atmosphere for 3 h. Then, the roasted pellets were ground, sieved to pass through a standard sieve with a pore size of 0.074 mm, and dressed by magnetic separation. Finally, the magnetic part was collected as the concentrate. The component minerals of the concentrate were identified through XRD measurements (Bruker D8 Advance, Billerica, MA, USA), and the measured pattern are shown in Figure 1. It is apparent that the concentrate was mainly composed of Fe3−xVxO4, pyroxene, as well as a small amount of Fe.
The composition of the concentrate was measured using X-ray Fluorescence (XRF-1800, Shimadzu Co., Ltd., Tokyo, Japan), and the results are shown in Table 1. To obtain more accurate contents of V and Fe in the concentrate, they were further measured using an Inductive Coupled Plasma-Optical Emission Spectrometer (ICP-OES, OPTIMA 7000DV, Waltham, MA, USA), and the measured values for V and Fe were 11.6 mass% and 34.5 mass%, respectively. Analytical-grade oxalic acid from Sinopharm Chemical Reagent Co. Ltd., Shanghai, China, was used as the leaching agent.

2.2. Hydrothermal Leaching and Analytical

The leaching kinetics of V3+ from the concentrate were performed in a 50 mL Teflon-sealed autoclave equipped with an automatic heating unit and a magnetically driven stirring system. The following primary experimental conditions were adopted. The leaching temperatures ranged from 363 K to 403 K, with 10 K intervals being investigated individually, the weight ratio of liquid to solid was fixed at 90 mL/g, the stirring speed of 500 rpm was adopted, and the concentrations of oxalic acid ranged from 15% to 30%, with 5% intervals being investigated, respectively.
The procedure of every run was as follows: the concentrate and the oxalic acid with a pre-designed amount were placed in the autoclave, and the required amount of distilled water was added. Then, the lid of the autoclave was closed carefully, and the system was heated up. When the temperature of the heating system reached the set value, the leaching time was counted. When the leaching time amounted to the pre-designed time, the autoclave was taken out of the heating system and cooled rapidly by putting it into cold water. After the autoclave was cooled to room temperature, it was opened, and the reacted slurry was filtered to separate the leachate from the residue. With the leaching out of V, a large amount of FeC2O4·2H2O was formed and remained in the residue. Details of the detailed characterization of the residue can be found in our previous publication [15].
Next, the filtrate was analyzed using ICP-OES to measure the concentration of vanadium in the filtrate, and the leaching efficiency of vanadium was calculated using Equation (1).
η v = V 0 · C v m 0 · ω v × 100 %
where C v is the concentration of vanadium in the filtrate, mg/L; V 0   is the volume of filtrate, L; m 0 is the quantity of the concentrate used in leaching experiments, mg; and ω v is the mass percentage of vanadium in the concentrate. In the present adopted concentrate, the Fe3−xVxO4 was the only vanadium-bearing mineral, so the leaching efficiency of vanadium determined by Equation (1) can be considered approximately to be the extraction efficiency of vanadium from Fe3−xVxO4 mineral.

3. Results and Discussion

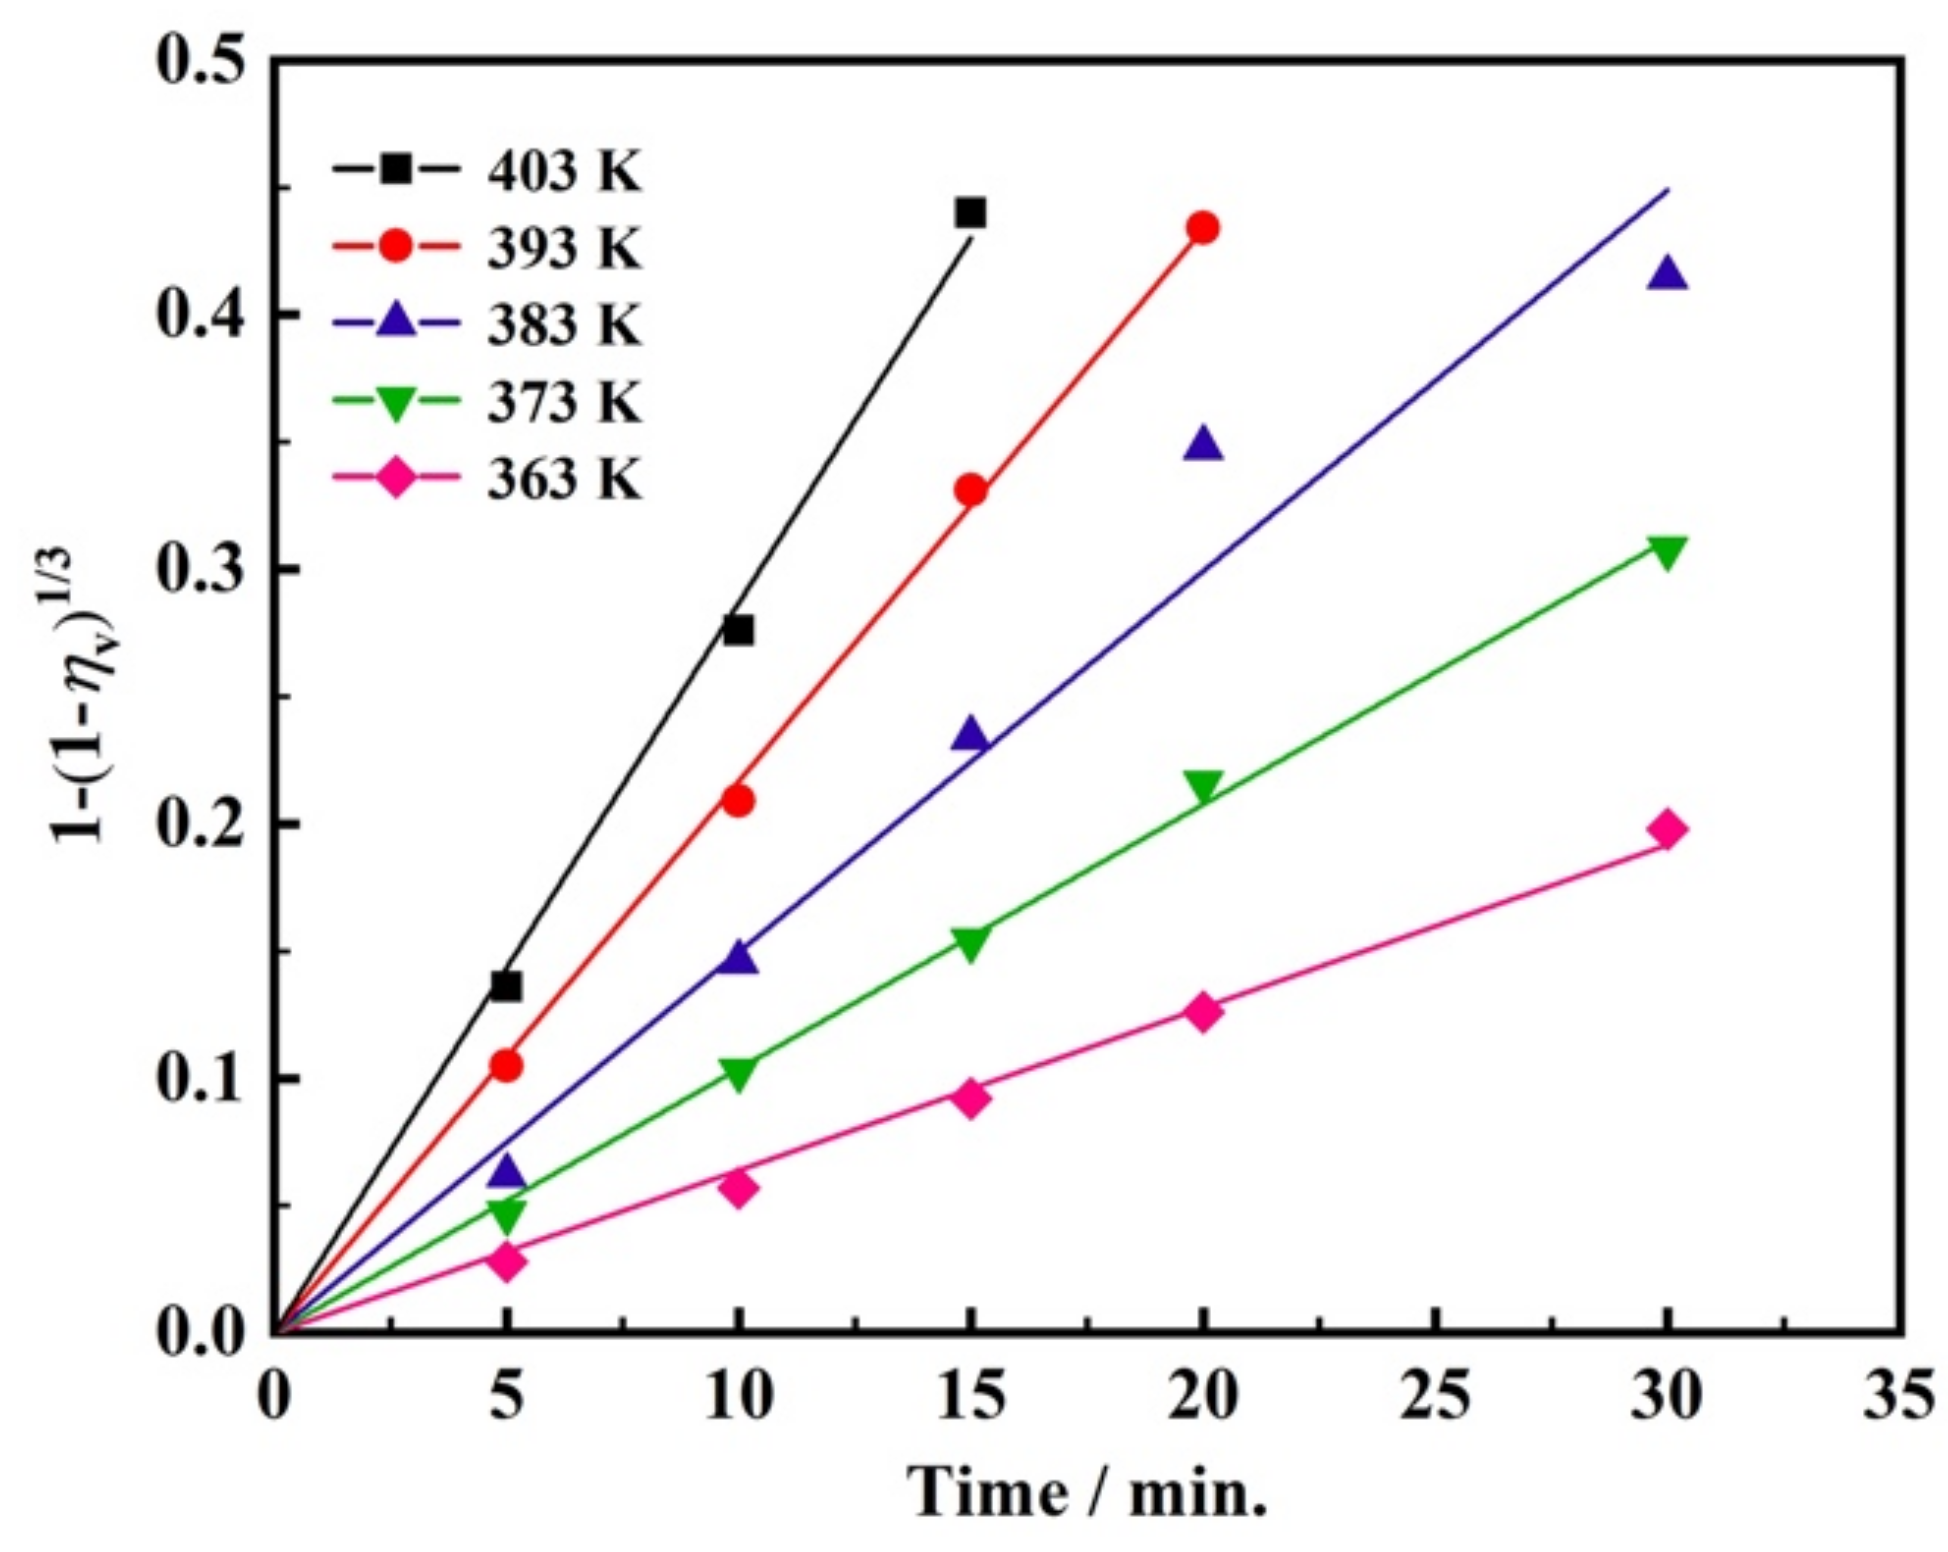
3.1. Effect of Temperature on the Leaching Kinetics

As the primary step of the kinetic study, the leaching behavior of the concentrate at different temperatures was investigated when the other parameters were fixed. Here, the adopted concentration of the leaching agent oxalic acid was 30% relative to the quantity of distilled water, the stirring speed was 500 rpm, and the ratio of liquid to solid was 90 mL/g.
Under the above-stated conditions, the leaching efficiency of vanadium from the concentrate was determined using Equation (1) and the measured concentration of vanadium in filtrate. The determined values are summarized in Table 2.
To demonstrate the changing trend of the leaching efficiency visually, the data listed in Table 2 are presented in Figure 2 by plotting the leaching efficiency against the leaching time. From Figure 2, the increasing trends of the leaching efficiency with the increase in the leaching temperature and the prolongation of leaching time can be seen obviously. However, the increasing rate of the leaching efficiency exhibited different patterns with the proceeding of the reaction. At the initial stage of the reaction, for example, within the range of leaching efficiency less than 30%, the leaching efficiency increased almost linearly; then, at the following intermediate stage, the increasing rate decreased slightly, whereas at the end stage when the leaching efficiency was larger than 85%, the increasing rate dropped rapidly. This sharp drop in the increasing rate at the end stage implies a different leaching mechanism from the previous stage.
In the present study, the leaching of vanadium from the concentrate is a typical heterogeneous solid/liquid reaction, and the size of the solid particle will decrease gradually with the proceeding of the reaction. Therefore, the leaching process is suitable to be analyzed using the unreacted shrinking core model [16]. The whole process can be considered to consist of the following five serial steps: (1) the mass transfer of reactant in liquid across the fluid film adherent to the solid particle; this step is the so-called outer diffusion, (2) the continual mass transfer of reactant across the solid product layer; this is the inner diffusion step, (3) the chemical reaction on the surface of the unreacted solid reactant; this step is called interfacial chemical reaction, (4) the mass transfer of dissolvable reaction product outwards across the solid product layer (inner diffusion step), and (5) the continual mass transfer of dissolvable reaction product outwards across the fluid film (outer diffusion step). The above-stated constituent steps are serialized so that the rate of the whole process is controlled by the slowest step, and this is the rate-controlling step of this process. Determining the rate-controlling step is favorable to the understanding of the reaction mechanism and optimization of the process.
To ascertain the rate-controlling step of a process, the general method is to insert the experimental data into the corresponding kinetic model of each step and compare the fitting effect of the experimental data with the kinetic model. In the present study, a high solid/liquid ratio of 90 mL/g and a high stirring speed of 500 rpm were adopted, so the resistance of the mass transfer of the fluid film adherent to the solid particle should be very small and can be ignored rationally. That is to say that the outer diffusion step should not be the rate-controlling step of the present leaching reaction, and the possible step controlling the present leaching reaction is the interfacial chemical reaction step or inner diffusion step.
For the case of a spherical solid-particle reactant, the kinetic model for the process controlled by an interfacial chemical reaction was deduced as Equation (2) [17,18,19,20,21,22,23].
1 1 x 1 / 3 = k c t
If the process is controlled by the inner diffusion step, the corresponding kinetic model can be expressed as Equation (3) [17,18,19,20,21,22,23].
1 2 α / 3 1 x 2 / 3 = k d t
where k c is the overall rate constant of the chemical reaction controlling process, k d is the overall rate constant of the inner diffusion controlling process; and x is the fraction of reaction at time t, which will be replaced by the leaching efficiency η v in the present study. Then, the data listed in Table 2 were inserted into Equations (2) and (3), respectively, and linear regression analysis was performed. Considering the different changing trend of the leaching rate at the end stage, which may be caused by a change in the leaching mechanism, leaching efficiency data larger than 85% were not adopted for regression analysis. The fitting results are exhibited graphically in Figure 3 and Figure 4, respectively, and the determined rate constants, as well as the confidence level of fitting, are shown in Table 3.
From the fitting results shown above, it can be seen that apparent discrepancies exist between the fitting results of the inner diffusion controlling model and experimental data, whereas the interfacial chemical reaction controlling model shows excellent agreement with the experimental data. This indicates that, within the leaching efficiency range less than 85%, the leaching process is probably controlled by the chemical reaction on the surface of the unreacted solid reactant, viz. the interfacial chemical reaction step. To further check this inference, the temperature dependence of the obtained overall rate constants was verified using the Arrhenius formula, expressed as Equation (4).
l n k c = E a R T + l n A
where E a is the apparent activation energy, R is the gas constant, T is the temperature, and A is the preexponential factor.
The fitting result between the l n k c and 1 / T is shown in Figure 5. From Figure 5, it can be seen clearly that the obtained overall rate constants match well with the Arrhenius formula. From the slope of the fitting line, the apparent activation energy E a was determined to be 45.6 kJ/mol. This value is reasonable for the process controlled by the interfacial chemical reaction. For instance, Nayl et al. [18] reported that the leaching of titanium from a KOH-treated ilmenite using oxalic acid in the temperature range from 273 to 448 K was controlled by an interfacial chemical reaction, and the apparent activation energy was 22.6 ± 1.5 kJ/mol. Zafar et al. [19] investigated the leaching kinetics of calcareous phosphate rock in succinic acid from 313 to 353 K; the leaching process was found to be controlled by a chemical reaction, and the apparent activation energy of the leaching process was 64.92 kJ/mol. For the case controlled by an inner diffusion step, the apparent activation energy is generally smaller than that controlled by a chemical reaction. For example, Xiong et al. [16] reported that the leaching process of vanadium from vanadium slag by sulfuric acid from 303 to 363 K was controlled by the inner diffusion step with an apparent activation energy of 17.63 kJ/mol. Li et al. [20] leached the vanadium from red mud using oxalic acid; it was found that the leaching process of vanadium from 298 to 373 K was controlled by an inner diffusion step with an apparent activation energy of 8.21 kJ/mol.

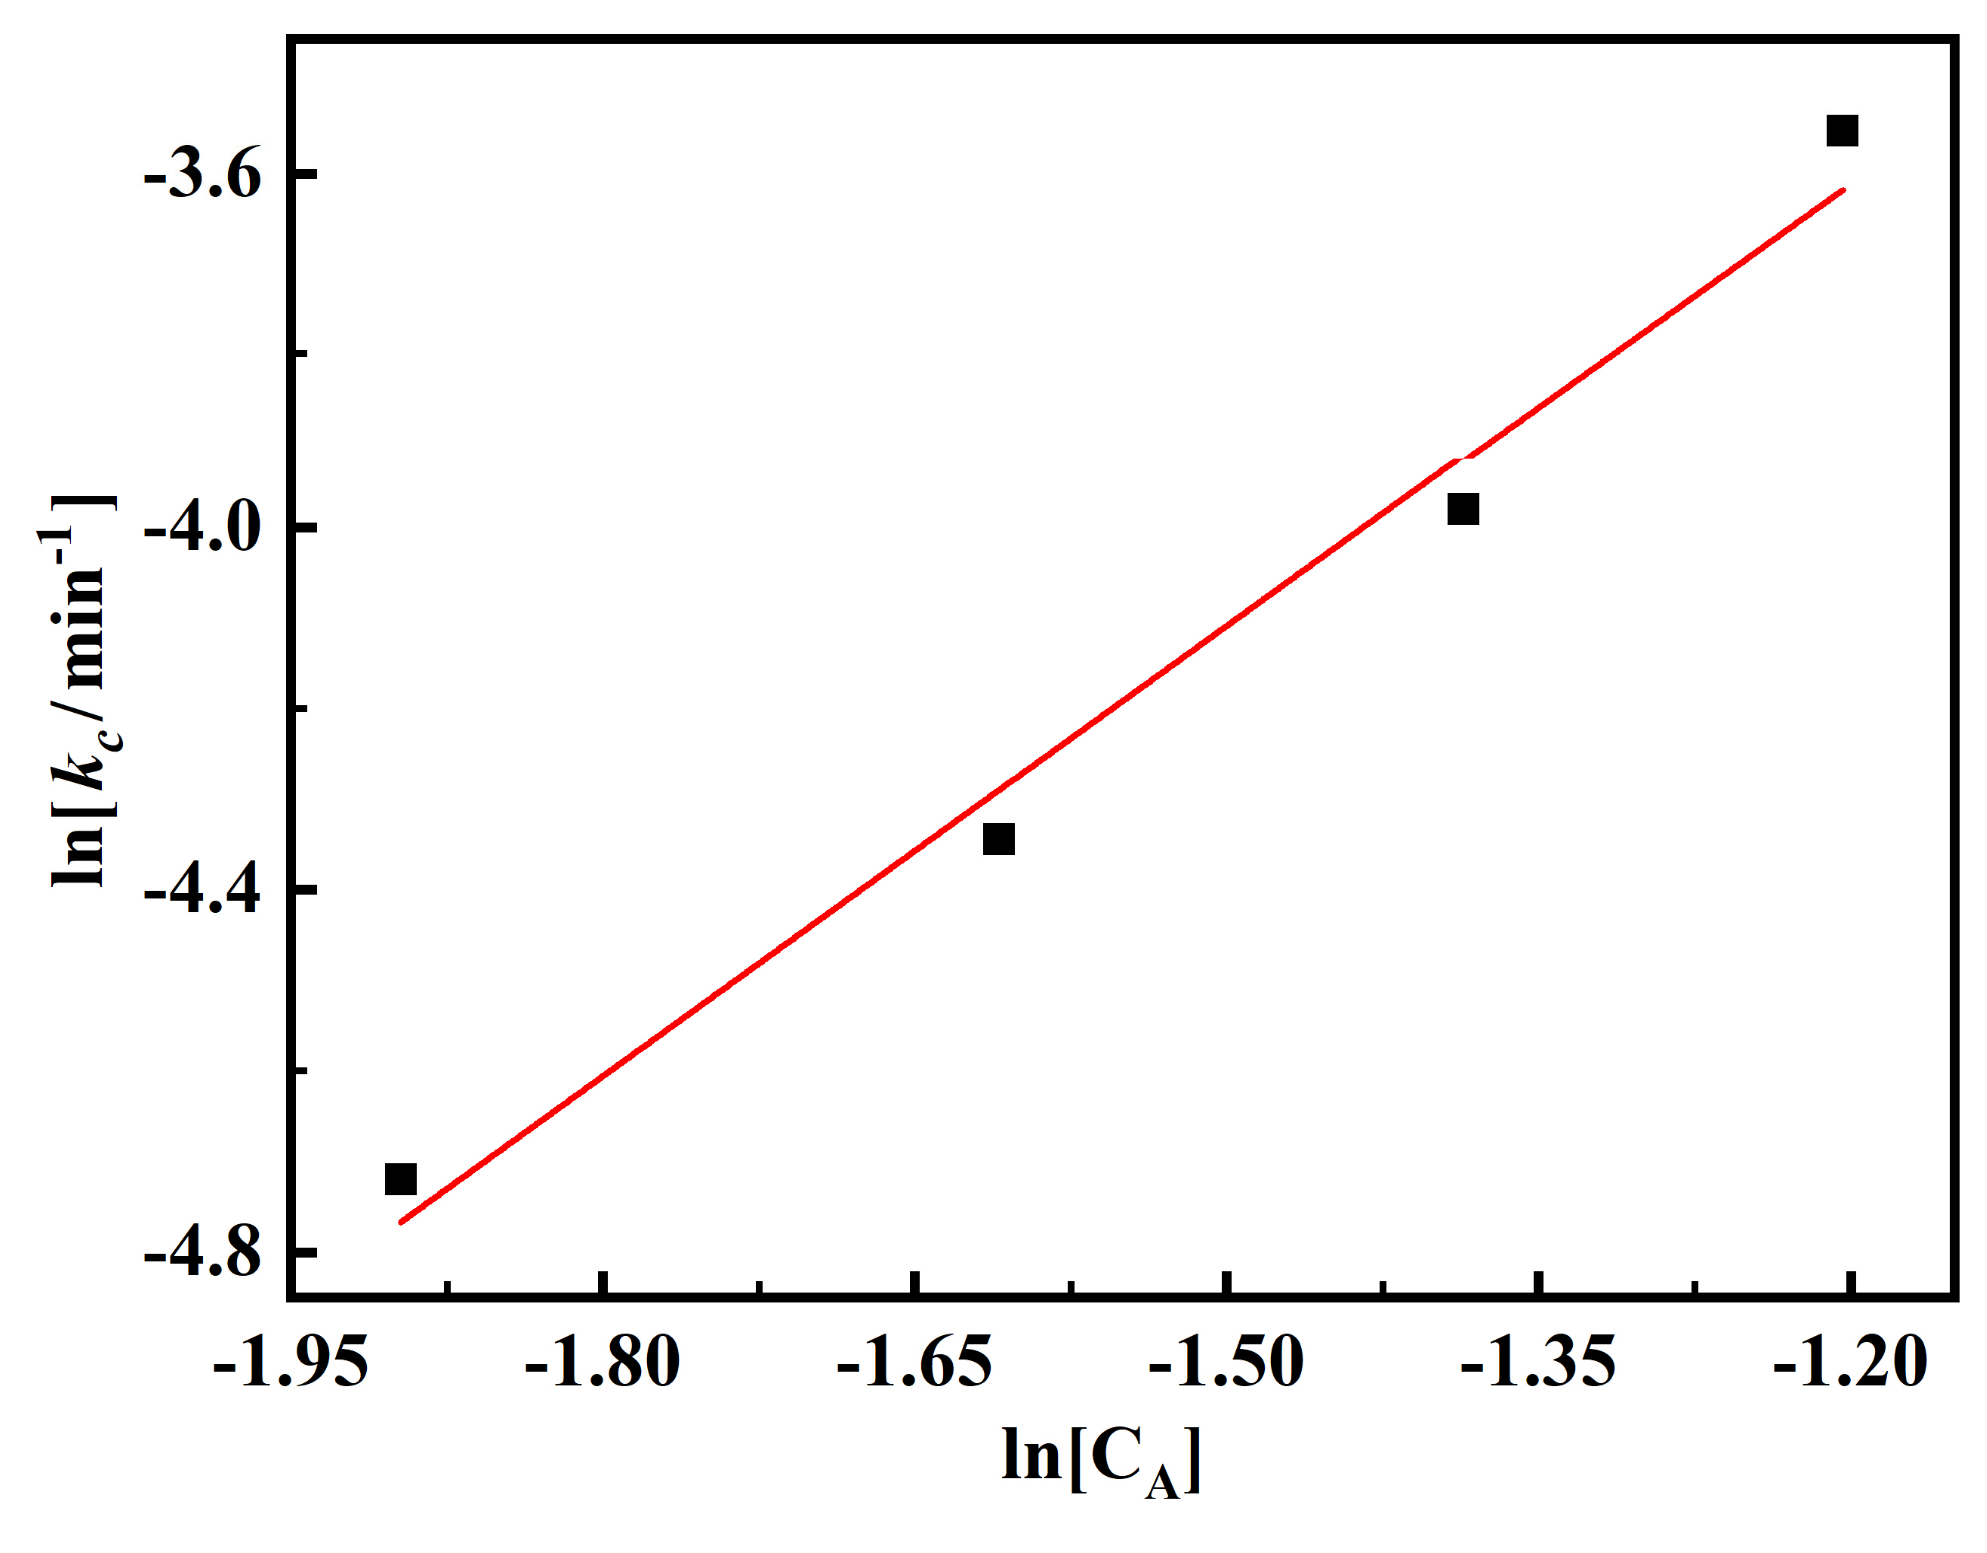
3.2. Effect of the Concentration of Leaching Agent on the Leaching Kinetics

For the leaching process controlled by the interfacial chemical reaction step, apart from the leaching temperature, the concentration of the leaching agent is another significant factor that can influence the leaching behavior. So, the effect of the oxalic acid concentration on the leaching efficiency was investigated by fixing the remaining parameters. The oxalic acid concentration varied from 15% to 30% with a 5% interval; the leaching temperature was fixed at 403 K, the stirring speed was 500 rpm, and the ratio of liquid to solid was 90 mL/g.
Under the above-stated conditions, the leaching efficiency of vanadium from the concentrate was determined according to Equation (1), and the obtained results are summarized in Table 4.
Then, the same analysis procedure as detailed in the previous section was adopted to deal with the data listed in Table 4. It was found that the model of interfacial chemical reaction controlling still match with the data much better than the inner diffusion controlling model. Here, for the sake of brevity, only the fitting results of the interfacial chemical reaction controlling model are shown in Figure 6.
From Figure 6, in addition to the good agreement between the interfacial chemical reaction controlling model and experimental data, it can be found that the reaction rate of the process increases remarkably with the increase in the oxalic acid concentrations. From the slopes of the fitting lines, the overall rate constants corresponding to the oxalic acid concentrations of 15%, 20%, 25%, and 30% were determined to be 0.00892 min−1, 0.01298 min−1, 0.01868 min−1, and 0.02869 min−1, respectively.
Considering the significant effect of the oxalic acid concentration on the reaction rate, an attempt to assume the relation shown as Equation (5) was performed to explore the quantitative relation between them [19].
l n k c = α l n C A + c
where k c is the overall rate constant of the chemical reaction controlling process, C A is the concentration of oxalic acid, and α and c are the constant parameters needed to be determined. As shown in Figure 7, it can be found that a good linear relationship existed between l n k c and l n C A . From the slope of the fitting line, the value of α was determined to be 1.66, i.e., the overall rate constant of the leaching process was proportional to the concentration of oxalic acid with exponent 1.66. This implies that the interfacial chemical reaction investigated in the present study was with an order of around 1.66 to the concentration of oxalic acid.

3.3. Establishment of the Kinetic Model of the Hydrothermal Leaching Process

In the previous two sections, the effects of temperature and concentration of the leaching agent on the leaching rate were investigated individually, and the apparent activation energy and order of the reaction were determined, respectively. Then, it is possible to establish a complete kinetic model for the leaching process, in which both the temperature and the concentration of the leaching agent were included simultaneously.
By combing Equations (2), (4) and (5), a complete kinetic model expressed as Equation (6) was derived and proposed to describe the present leaching reaction.
1 1 η v 1 3 = k 0 · C A α · exp E a R T · t
where η v is the leaching efficiency; C A is the concentration of oxalic acid, expressed by its mass fraction relative to water; α   is the order of the reaction; E a   is the apparent activation energy, J/mol; R   is the gas constant, J/(mol·K); T   is temperature, K; t is the reaction time, expressed in min; and k 0 is a model parameter, min−1.
By inserting the experimental data listed in Table 2 and Table 4 into the left side of Equation (6) and replacing the E a and α in the right side by 45,590 J/mol and 1.66, respectively, the constant model parameter k 0 was obtained through linear regression to be 1.69 × 10⁵ min−1. Then, a comparison between the experimental data and the calculated results was performed, and the comparison results are shown in Figure 8. From Figure 8, it can be seen that a relatively good estimation of the experimental results was obtained. Therefore, the model shown as Equation (6) was proposed to describe the present leaching process within the range of leaching efficiency less than 85%.

4. Conclusions

With the increasing industrial demand for vanadium products, the environmentally friendly methods of vanadium extraction are desirable. Among the reported methods, oxalic acid hydrothermal leaching is promising due to the small impact oxalic acid has on the environment. Therefore, the hydrothermal leaching kinetics of vanadium using oxalic acid from a concentrate mainly composed of Fe3−xVxO4 was studied systematically. The obtained results are as follows:
  • An interfacial chemical reaction was the rate-controlling step of the hydrothermal leaching process within the temperature ranging from 363 to 403 K and the leaching efficiency less than 85%;
  • The apparent activation energy of the interfacial chemical reaction was 45.6 kJ/mol;
  • The order of the interfacial chemical reaction to the concentration of oxalis acid was around 1.66;
  • The hydrothermal leaching behavior of vanadium by oxalic acid can be described well by the following model, where C A denotes the concentration of oxalic acid, expressed by its mass fraction relative to water, and t represents the leaching time, expressed by min.
1 1 η v 1 3 = 1.69 · 10 5 · C A 1.66 · exp 45,590 R T · t

Author Contributions

Conceptualization, B.Y.; methodology, B.S. and X.C.; experimental B.S. and X.C.; writing—original draft preparation, B.S. and X.C.; writing—review and editing, B.Y.; funding acquisition, project administration, B.Y. All authors have read and agreed to the published version of the manuscript.

Funding

This research was funded by the State Key Laboratory of Vanadium and Titanium Resources Comprehensive Utilization grant number 2021P4FZG01A and the National Natural Science Foundation of China grant number 52174274.

Data Availability Statement

Not applicable.

Conflicts of Interest

The authors declare no conflict of interest.

References

  1. Imtiaz, M.; Rizwan, M.S.; Xiong, S.; Li, H.; Ashraf, M.; Shahzad, S.M.; Shahzad, M.; Tu, S. Vanadium, recent advancements and research prospects: A review. Environ. Int. 2015, 80, 79–88. [Google Scholar] [CrossRef] [PubMed]
  2. Moskalyk, R.R.; Alfantazi, A.M. Processing of vanadium: A review. Miner. Eng. 2003, 16, 793–805. [Google Scholar] [CrossRef]
  3. Zhang, Y.-M.; Bao, S.-X.; Liu, T.; Chen, T.-J.; Huang, J. The technology of extracting vanadium from stone coal in China: History, current status and future prospects. Hydrometallurgy 2011, 109, 116–124. [Google Scholar] [CrossRef]
  4. Radwany, M.R.; Barton, I.F. The process mineralogy of leaching sandstone-hosted uranium-vanadium ores. Miner. Eng. 2022, 187, 107811. [Google Scholar] [CrossRef]
  5. Drexler, M.; Barton, I.; Zanetta, P.M. Vanadium in phyllosilicate ores: Occurrence, crystal chemistry, and leaching behavior. Miner. Eng. 2023, 201, 108205. [Google Scholar] [CrossRef]
  6. Kerr, A.; Walsh, J.A.; Sparkes, G.W.; Hinchey, J.G. Vanadium potential in Newfoundland and Labrador: A review and assessment. In Current Research Newfoundland and Labrador Department of Natural Resources Geological Survey; Geological Survey: Reston, VA, USA, 2013; pp. 137–165. [Google Scholar]
  7. Lee, J.-C.; Kurniawan; Kim, E.-Y.; Chung, K.W.; Kim, R.; Jeon, H.-S. A review on the metallurgical recycling of vanadium from slags: Towards a sustainable vanadium production. J. Mater. Res. Technol. 2021, 12, 343–364. [Google Scholar] [CrossRef]
  8. An, Y.; Ma, B.; Li, X.; Chen, Y.; Wang, C.; Wang, B.; Gao, M.; Feng, G. A review on the roasting-assisted leaching and recovery of V from vanadium slag. Process Saf. Environ. Prot. 2023, 173, 263–276. [Google Scholar] [CrossRef]
  9. Liu, L.; Kauppinen, T.; Tynjälä, P.; Liu, T. Water leaching of roasted vanadium slag: Desiliconization and precipitation of ammonium vanadate from vanadium solution. Hydrometallurgy 2023, 215, 105989. [Google Scholar] [CrossRef]
  10. Dong, Z.H.; Zhang, J.; Yan, B.J. Co-extraction of vanadium titanium and chromium from vanadium slag by oxalic acid hydrothermal leaching with synergy of Fe powder. Metall. Mater. Trans. B 2021, 52, 3961–3969. [Google Scholar] [CrossRef]
  11. Hu, Y.-J.; Zhang, Y.-M.; Bao, S.-X.; Liu, T. Effects of the mineral phase and valence of vanadium on vanadium extraction from stone coal. Int. J. Miner. Metall. Mater. 2012, 19, 893–898. [Google Scholar] [CrossRef]
  12. Zhu, X.; Zhou, Z.; Jin, J.; Li, Y.; Han, Y. Vanadium extraction from V-bearing shale using oxidation roasting and acid leaching. Miner. Eng. 2023, 192, 107985. [Google Scholar] [CrossRef]
  13. Gao, F.; Olayiwola, A.U.; Liu, B.; Wang, S.; Du, H.; Li, J.; Wang, X.; Chen, D.; Zhang, Y. Review of vanadium production part I: Primary resources. Miner. Process. Extr. Metall. Rev. 2021, 43, 466–488. [Google Scholar] [CrossRef]
  14. Yan, B.; Wang, D.; Wu, L.; Dong, Y. A novel approach for pre-concentrating vanadium from stone coal ore. Miner. Eng. 2018, 125, 231–238. [Google Scholar] [CrossRef]
  15. Chen, X.; Yan, B. A novel method to extract V3+ from iron vanadate spinel minerals by one leaching step. Hydrometallurgy 2020, 198, 105517. [Google Scholar] [CrossRef]
  16. Xiong, Y.; Wang, L.; Wang, L.; Li, S.; Yang, G.; Cao, C.; Liu, S.; Nie, Y.; Jia, L. Optimization and kinetic analysis of direct acid leaching of vanadium from converter vanadium slag under atmospheric pressure. Miner. Eng. 2023, 198, 108091. [Google Scholar] [CrossRef]
  17. Hui, X.; Zhang, J.; Liang, Y.; Chang, Y.; Zhang, W.; Zhang, G. Comparison and evaluation of vanadium extraction from the calcification roasted vanadium slag with carbonation leaching and sulfuric acid leaching. Sep. Purif. Technol. 2022, 297, 121466. [Google Scholar] [CrossRef]
  18. Nayl, A.A.; Awwad, N.S.; Aly, H.F. Kinetics of acid leaching of ilmenite decomposed by KOH Part 2. Leaching by H2SO4 and C2H2O4. J. Hazard. Mater. 2009, 168, 793–799. [Google Scholar] [CrossRef] [PubMed]
  19. Zafar, Z.I.; Ashraf, M. Selective leaching kinetics of calcareous phosphate rock in lactic acid. Chem. Eng. J. 2007, 131, 41–48. [Google Scholar] [CrossRef]
  20. Li, W.; Yan, X.; Niu, Z.; Zhu, X. Selective recovery of vanadium from red mud by leaching with using oxalic acid and sodium sulfite. J. Environ. Chem. Eng. 2021, 9, 105669. [Google Scholar] [CrossRef]
  21. Chen, Z.; Ye, G.; Xiang, P.; Tao, Y.; Tang, Y.; Hu, Y. Effect of activator on kinetics of direct acid leaching of vanadium from clay vanadium ore. Sep. Purif. Technol. 2022, 281, 119937. [Google Scholar] [CrossRef]
  22. Wang, Z.; Peng, Z.; Li, Y.; Zhu, Y.; Xie, K. Selective sulfuric acid cyclic leaching of vanadium from the calcification roasting pellets of vanadium titanomagnetite. J. Mater. Res. Technol. 2023, 23, 778–790. [Google Scholar] [CrossRef]
  23. Ashraf, M.; Zafar, Z.I.; Ansari, T.M. Selective leaching kinetics and upgrading of low-grade calcareous phosphate rock in succinic acid. Hydrometallurgy 2005, 80, 286–292. [Google Scholar] [CrossRef]
Figure 1. XRD pattern of the prepared concentrate.
Metals 13 01629 g001
Figure 2. Plots of the leaching efficiency against leaching time under different temperatures.
Metals 13 01629 g002
Figure 3. Plots of the linear fitting results of 1 1 η v 1 / 3 against leaching time t .
Metals 13 01629 g003
Figure 4. Plots of the linear fitting results of 1 2 η v / 3 1 η v 2 / 3 against leaching time t .
Metals 13 01629 g004
Figure 5. Temperature dependence of the rate constant k c .
Metals 13 01629 g005
Figure 6. The linear fitting results of 1 1 η v 1 / 3 against leaching time t .
Metals 13 01629 g006
Figure 7. The relationship between the overall rate constants and the concentration of oxalic acid.
Metals 13 01629 g007
Figure 8. Comparison between the experimental results and model estimated results.
Metals 13 01629 g008
Table 1. Composition of the V-bearing concentrate measured by XRF.
ElementsContents (Mass%)ElementsContents (Mass%)
Fe23.2V9.7
Si11.9Ca4.7
Mg3.8Al3.3
S1.2K1.9
Ba0.2Ti0.1
P0.1Na0.1
Cr0.1O39.7
Table 2. Time dependence of leaching efficiency of vanadium at different temperatures.
Temp. (K)5 min10 min15 min20 min30 min
3638.1%16.1%25.1%33.3%48.4%
37313.5%27.9%39.5%51.9%66.9%
38317.5%37.8%55.1%72.3%80.0%
39328.4%50.5%70.1%81.9%85.1%
40335.6%62.0%82.4%85.6%87.1%
Table 3. The determined rate constants and the correlation coefficient of linear regression.
Temp. (K) 1 1 η v 1 / 3 1 2 η v / 3 1 η v 2 / 3
k c /min−1 R 2 k d /min−1 R 2
3630.006390.9980.000890.906
3730.010380.9990.002110.942
3830.014960.9890.003950.959
3930.021680.9990.005870.959
4030.028690.9990.007890.950
Table 4. Time dependence of leaching efficiency of vanadium at various agent concentrations.
Concentration of
Oxalic Acid (wt %)
5 min10 min15 min20 min30 min
1512.9%24.6%34.8%44.0%61.0%
2021.7%35.3%49.8%60.6%75.6%
2528.4%46.6%62.3%74.8%85.1%
3035.6%62.0%82.4%85.6%87.1%
Disclaimer/Publisher’s Note: The statements, opinions and data contained in all publications are solely those of the individual author(s) and contributor(s) and not of MDPI and/or the editor(s). MDPI and/or the editor(s) disclaim responsibility for any injury to people or property resulting from any ideas, methods, instructions or products referred to in the content.

