
Study on Residual Stresses of 2219 Aluminum Alloy with TIG Welding and Its Reduction by Shot Peening


Abstract
:1. Introduction
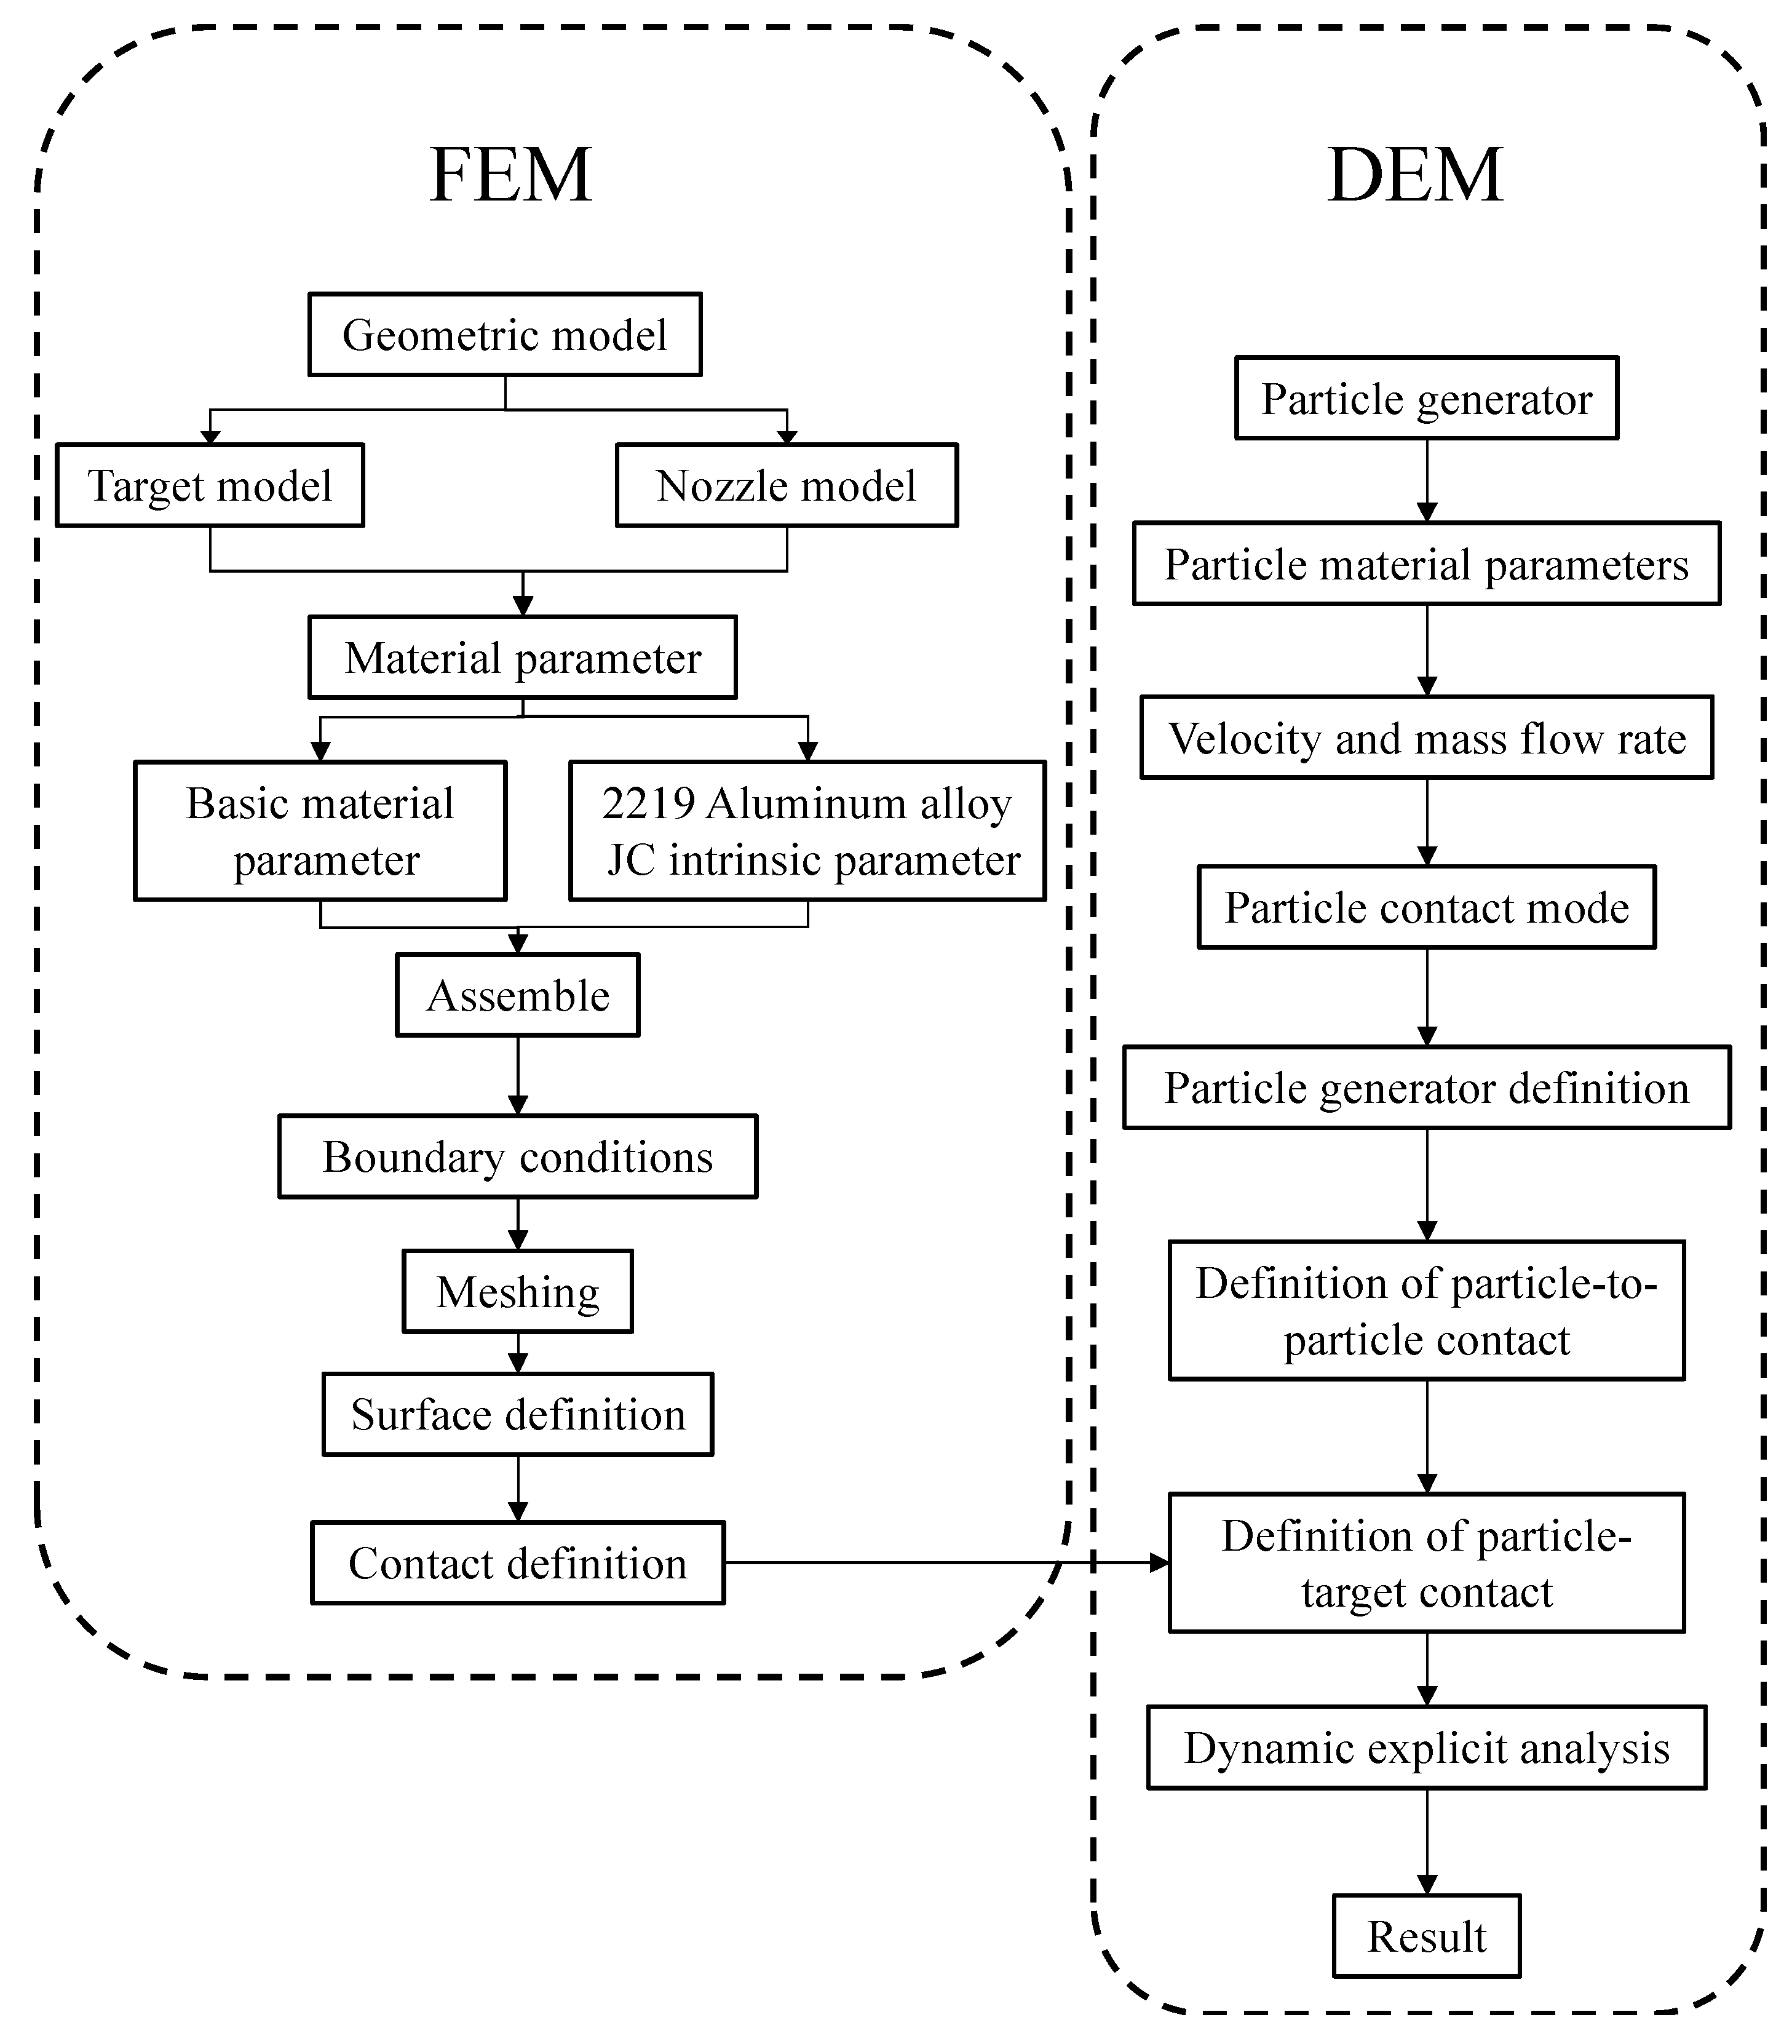
2. Numerical Models
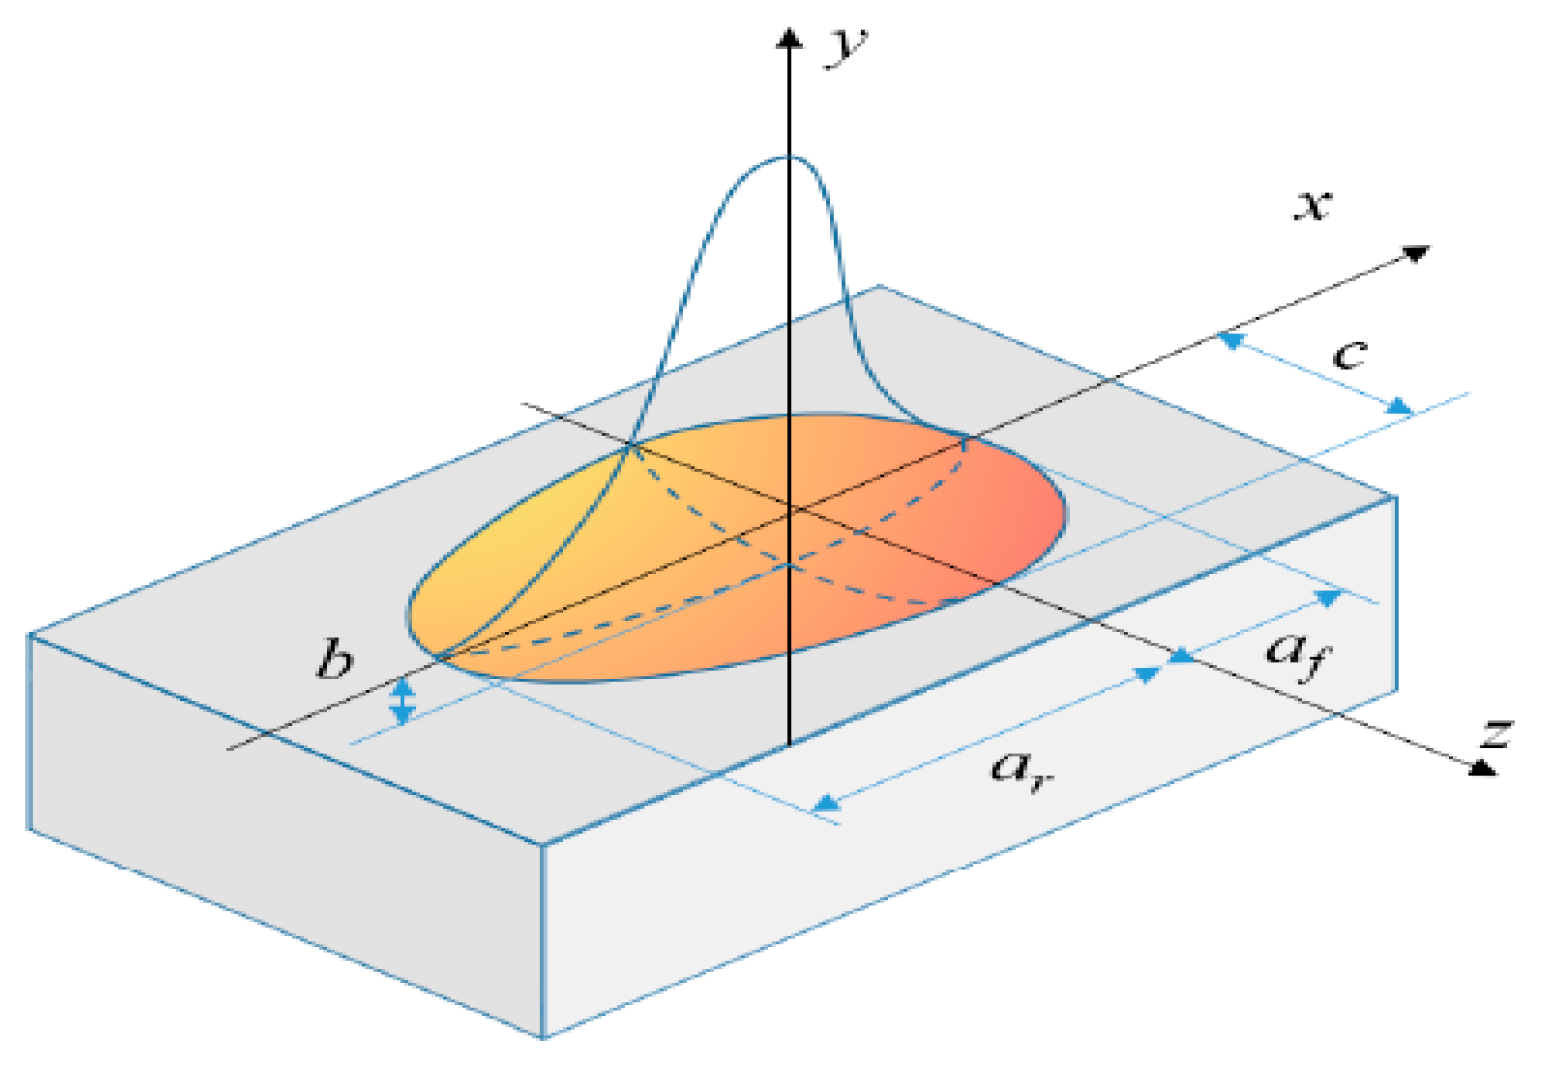
2.1. The TIG Welding Model
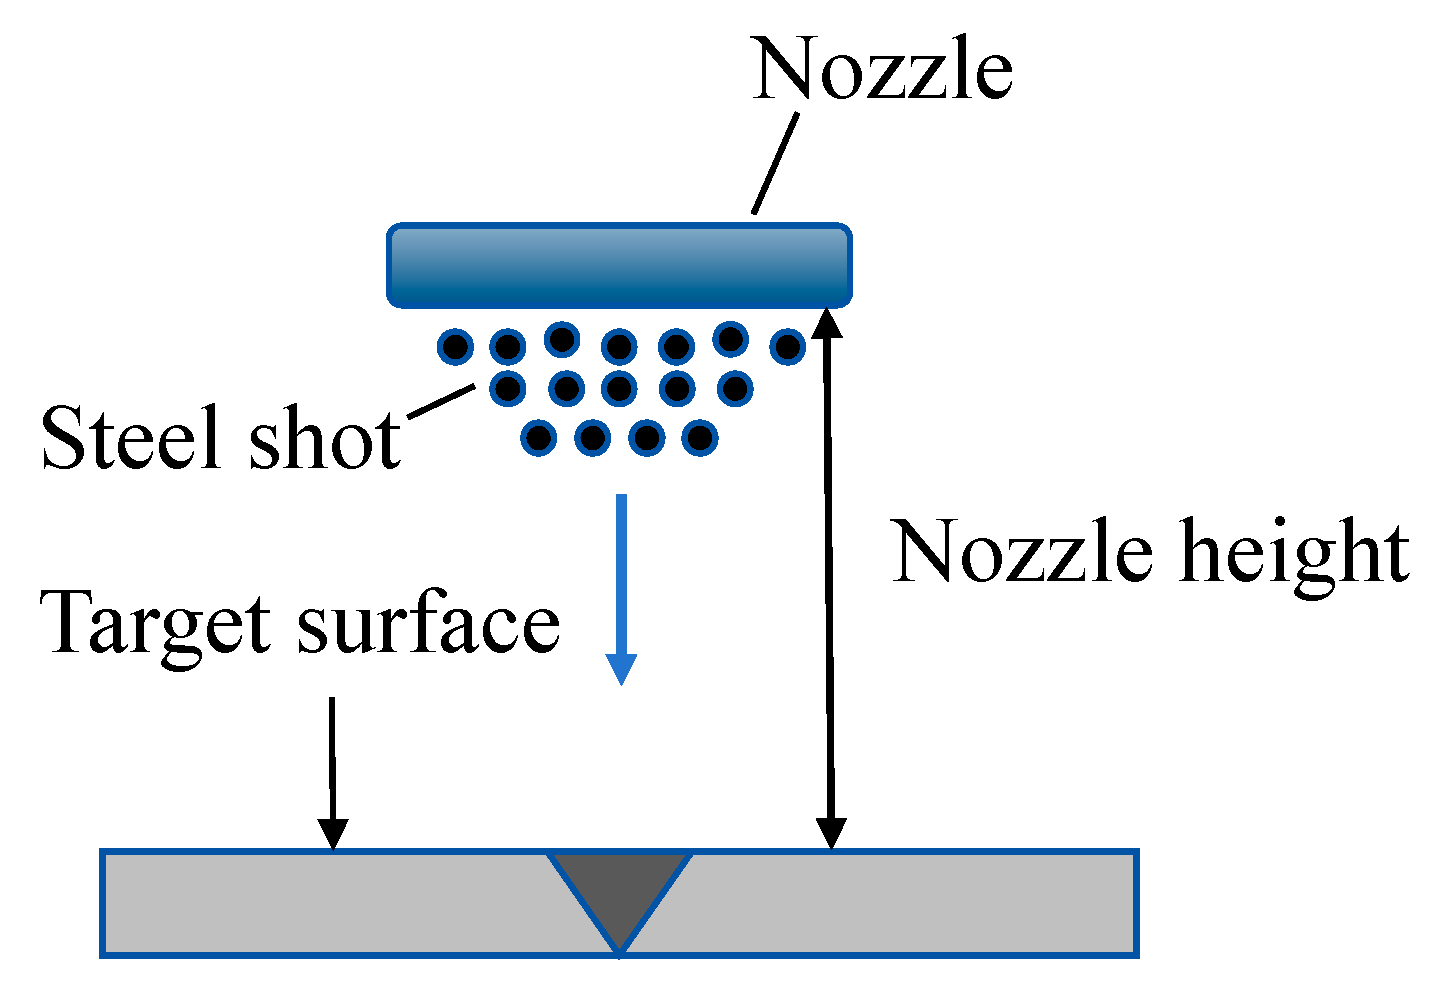
2.2. The Shot Peening Model
3. Experiment and Methods
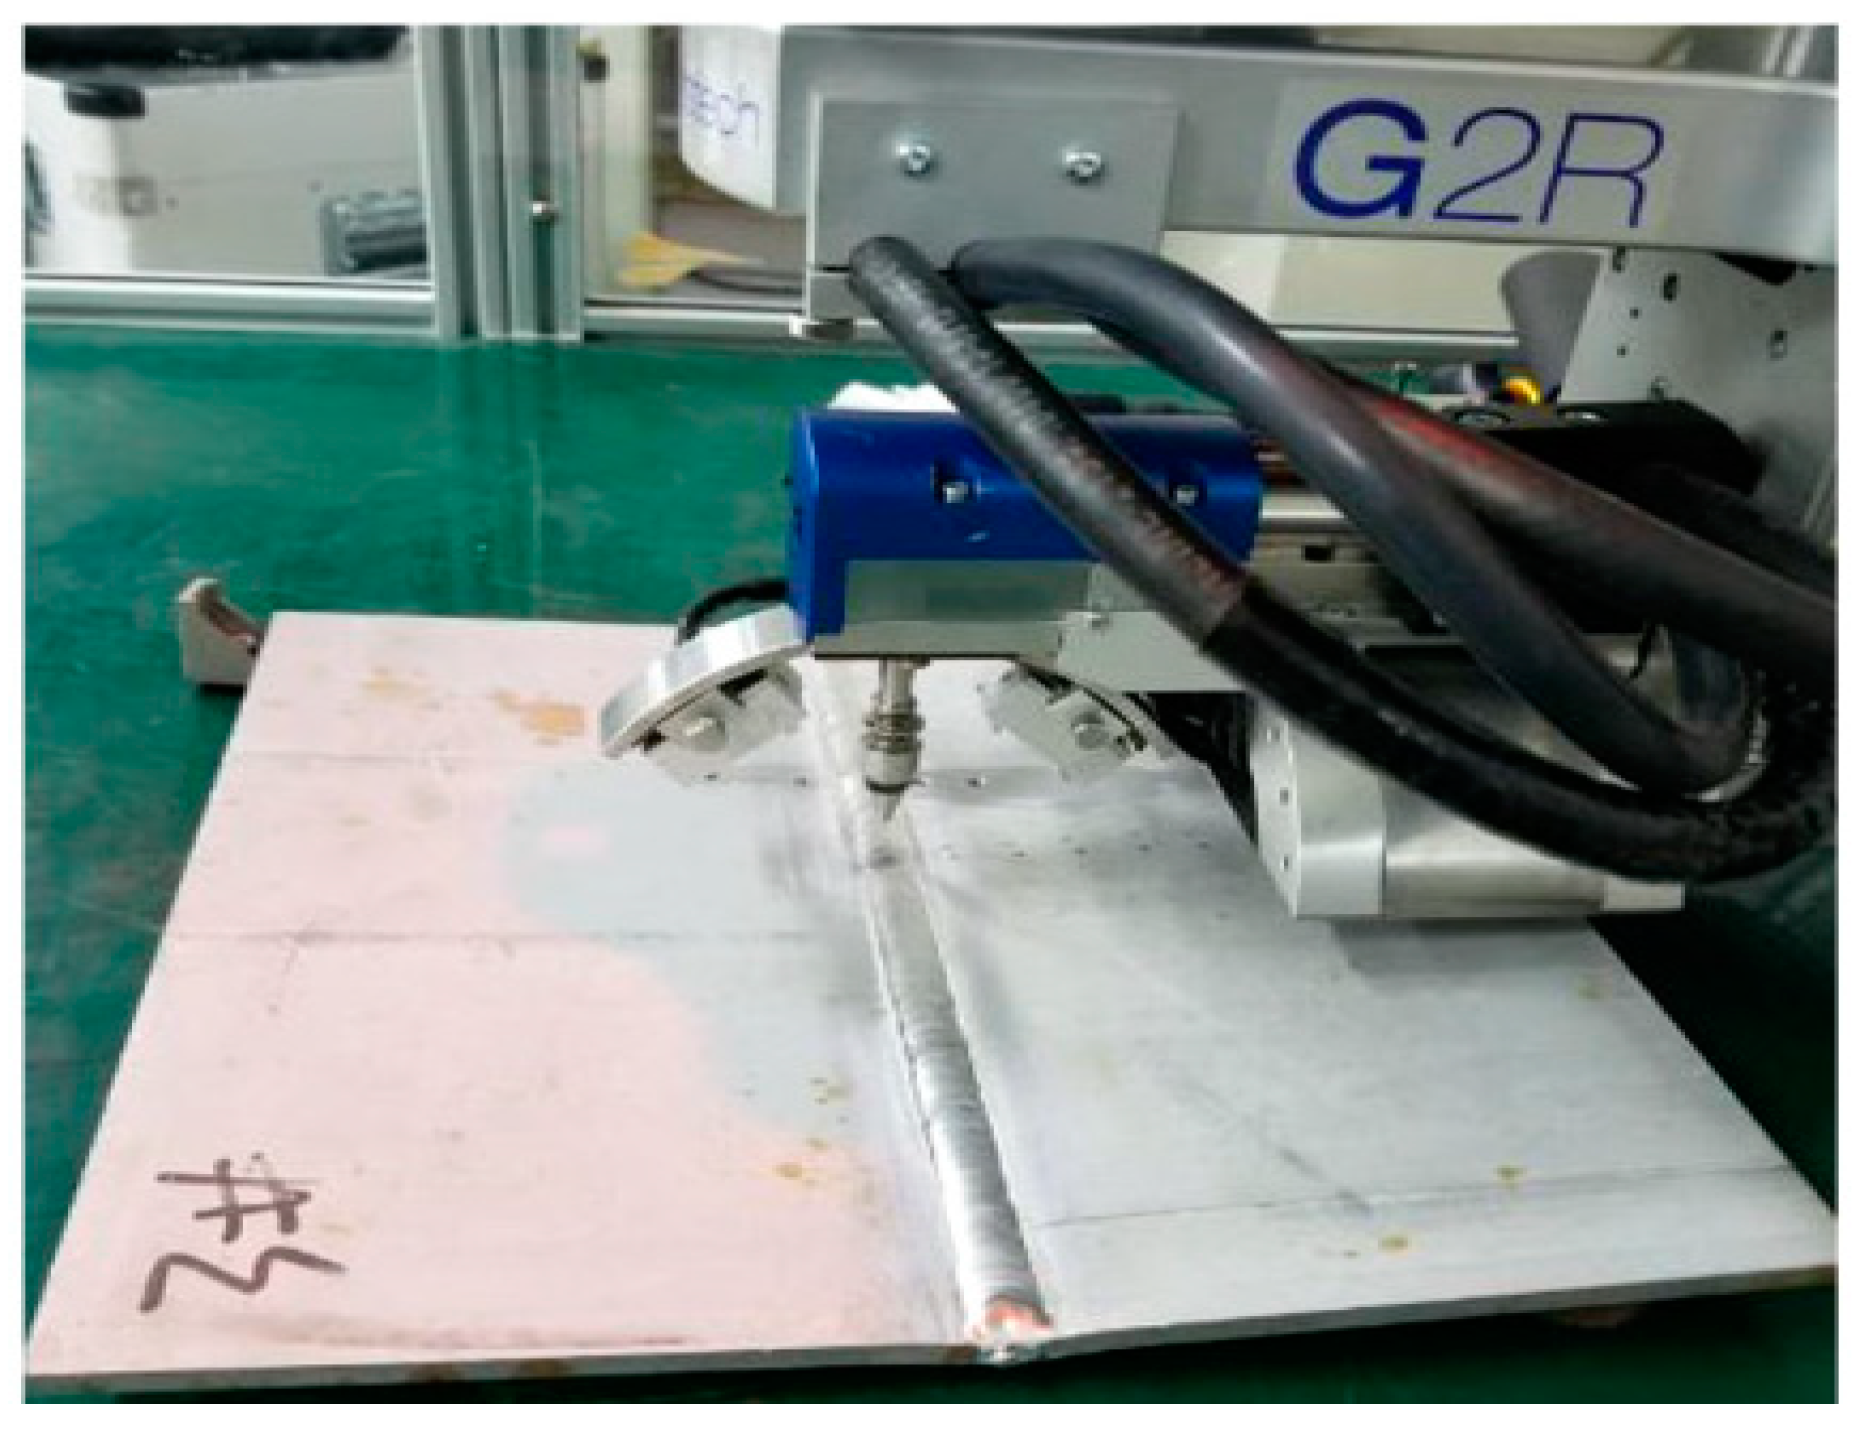
3.1. Tig Welding
3.2. Shot Peening
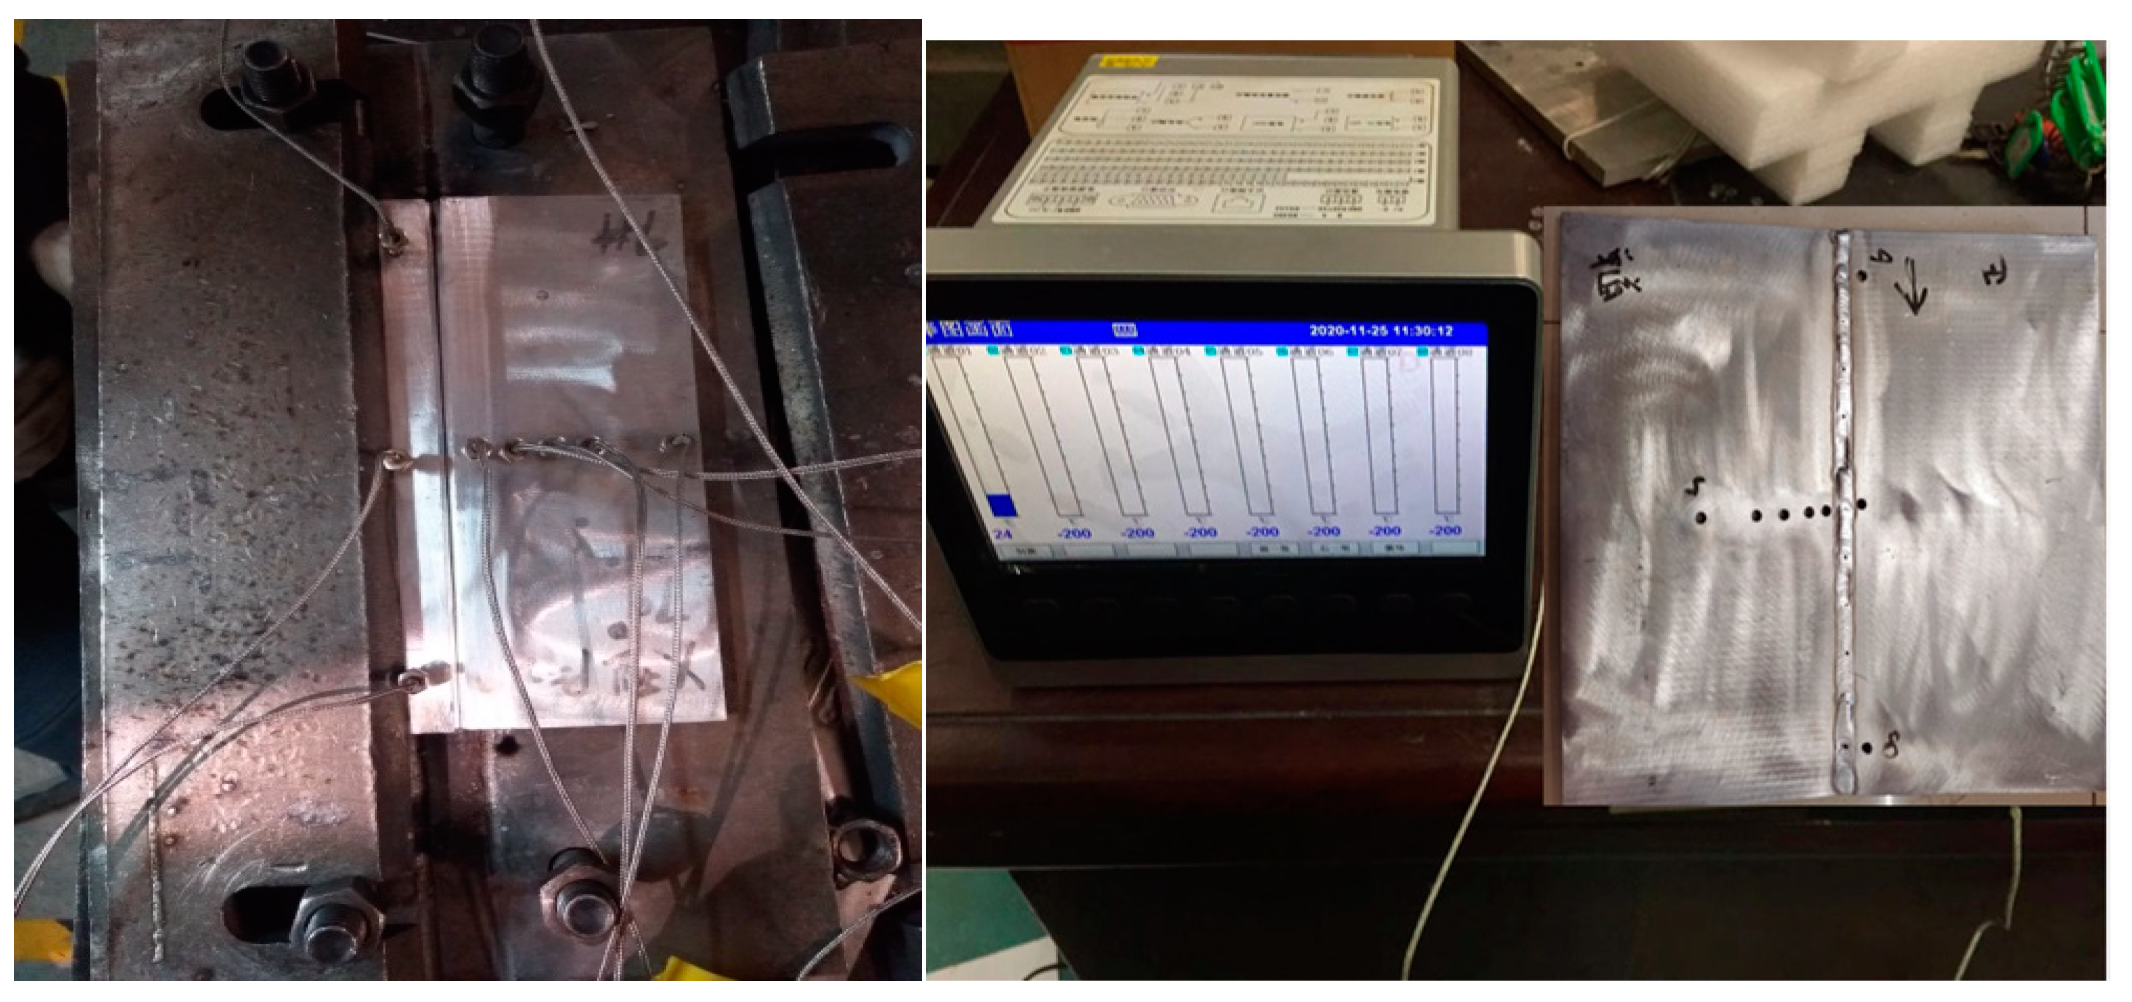
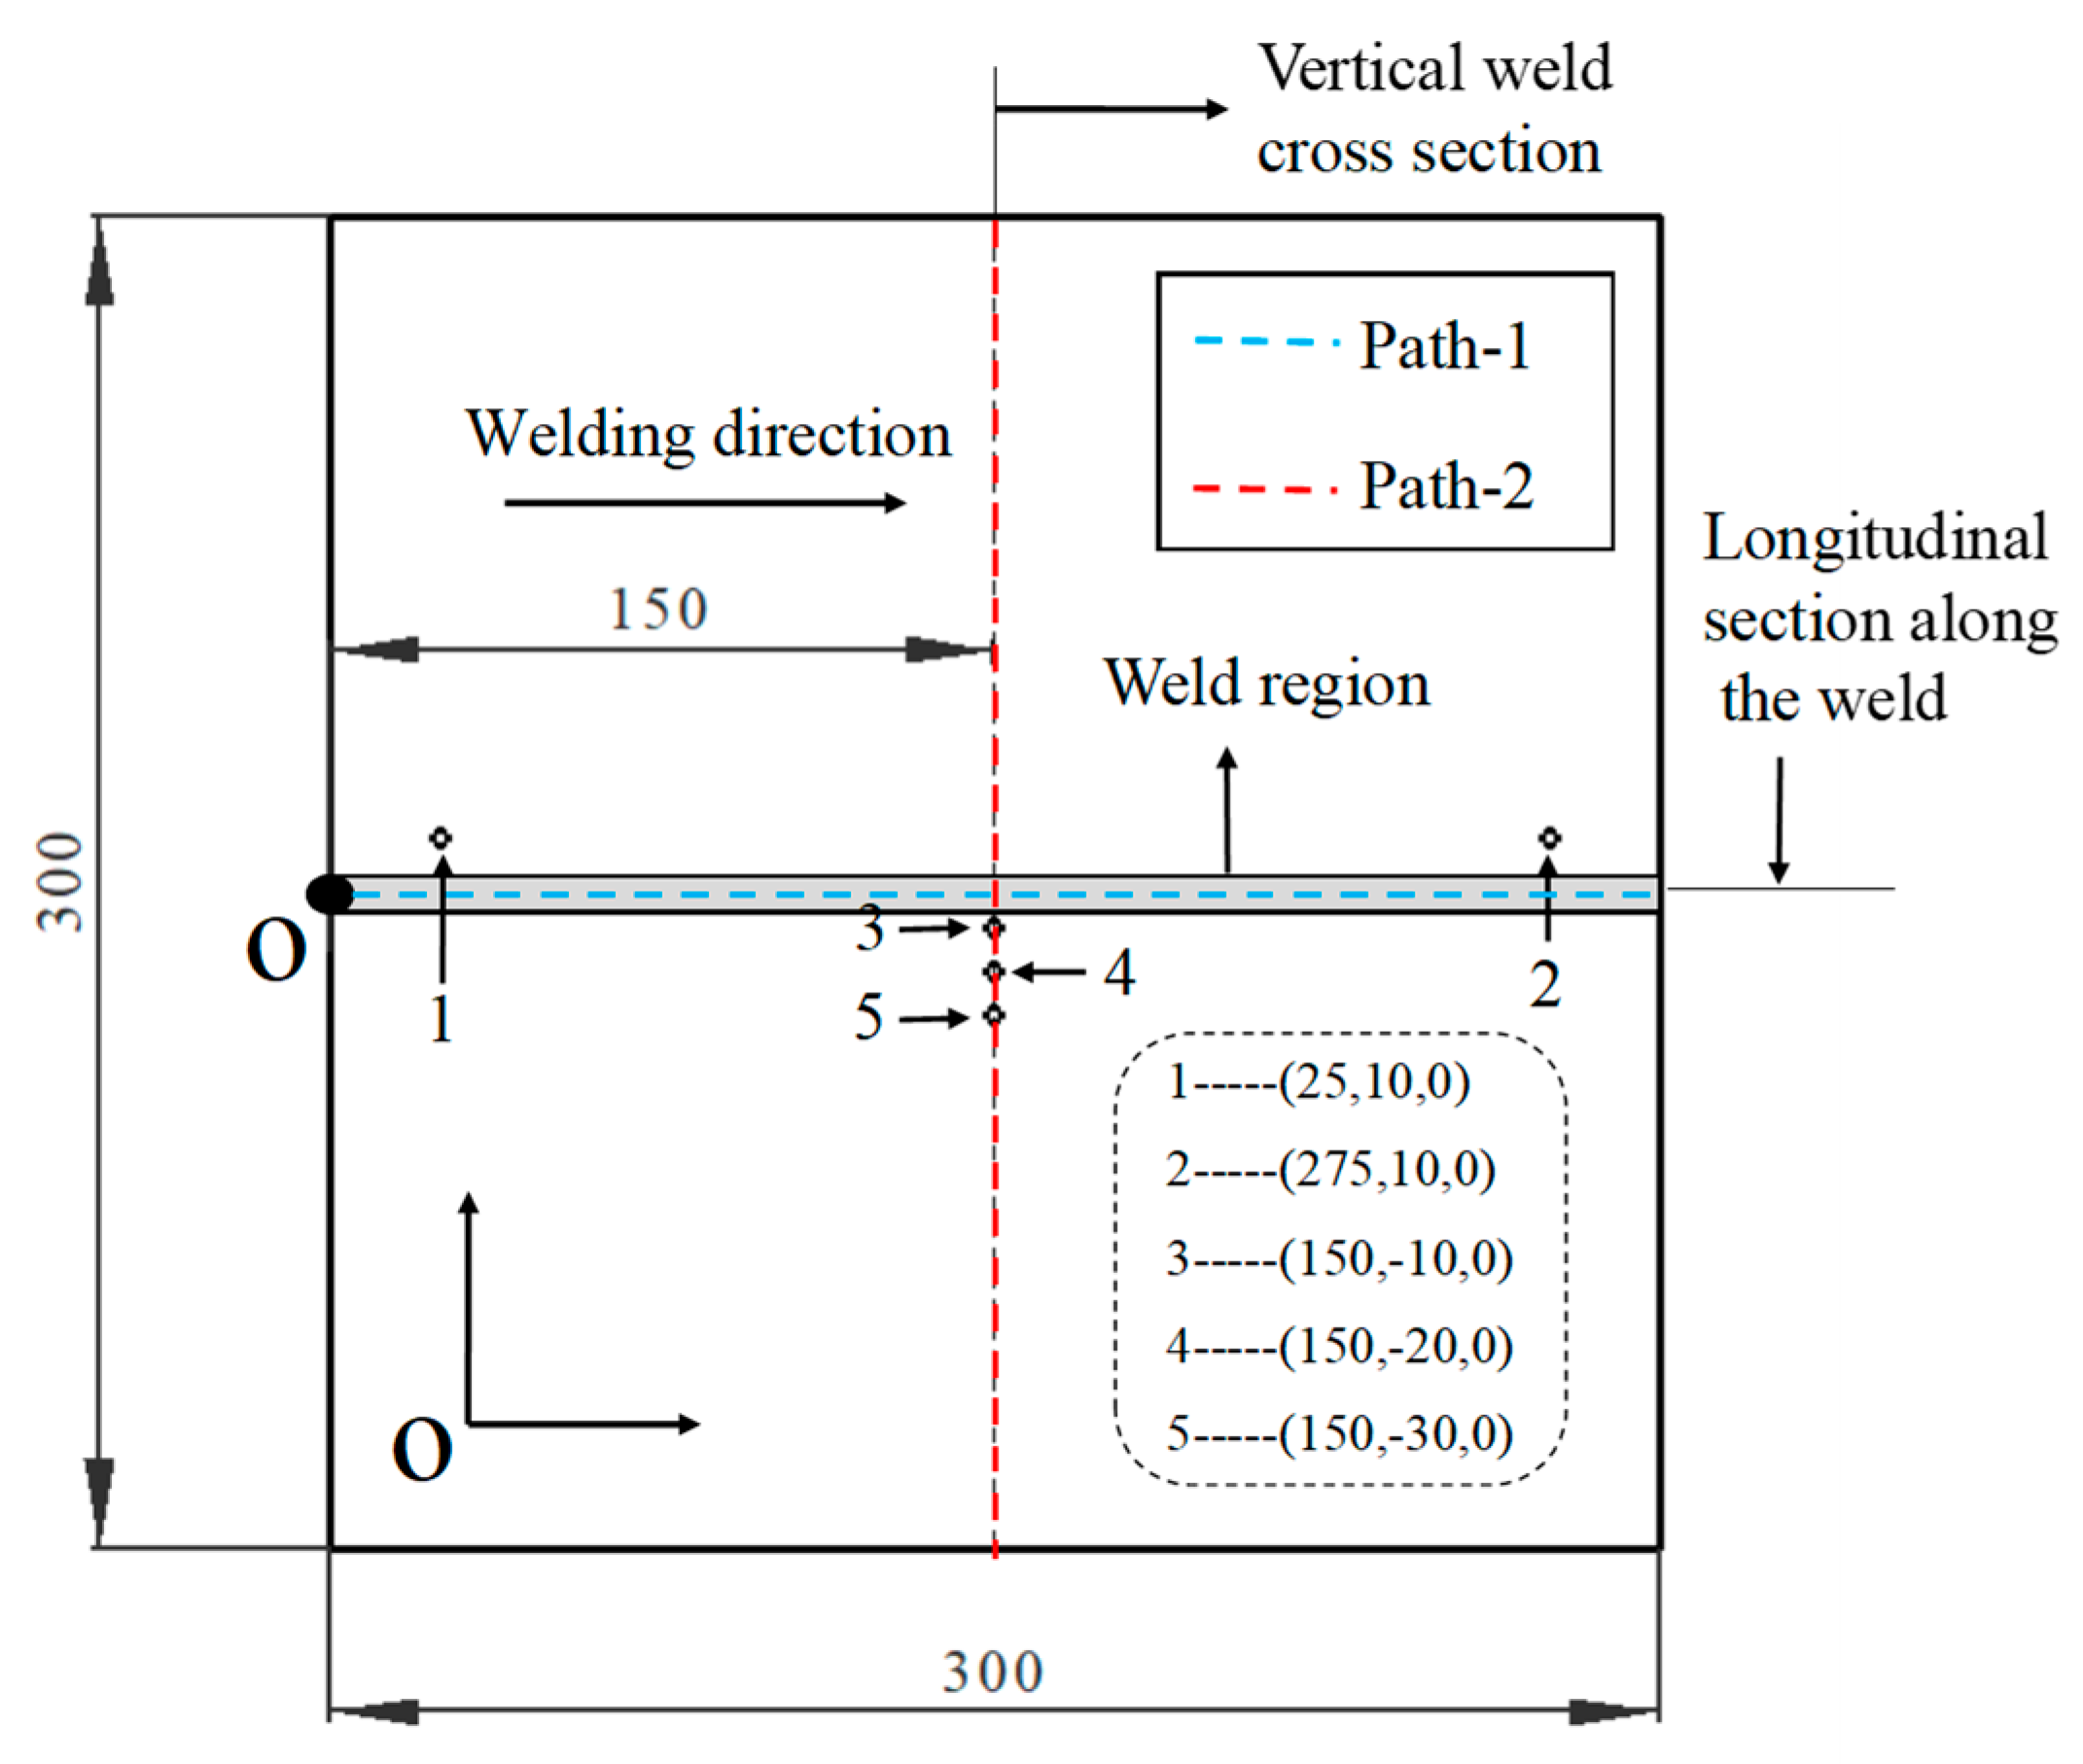
3.3. Temperature Detection
3.4. Residual Stress Detection
4. Results and Discussion
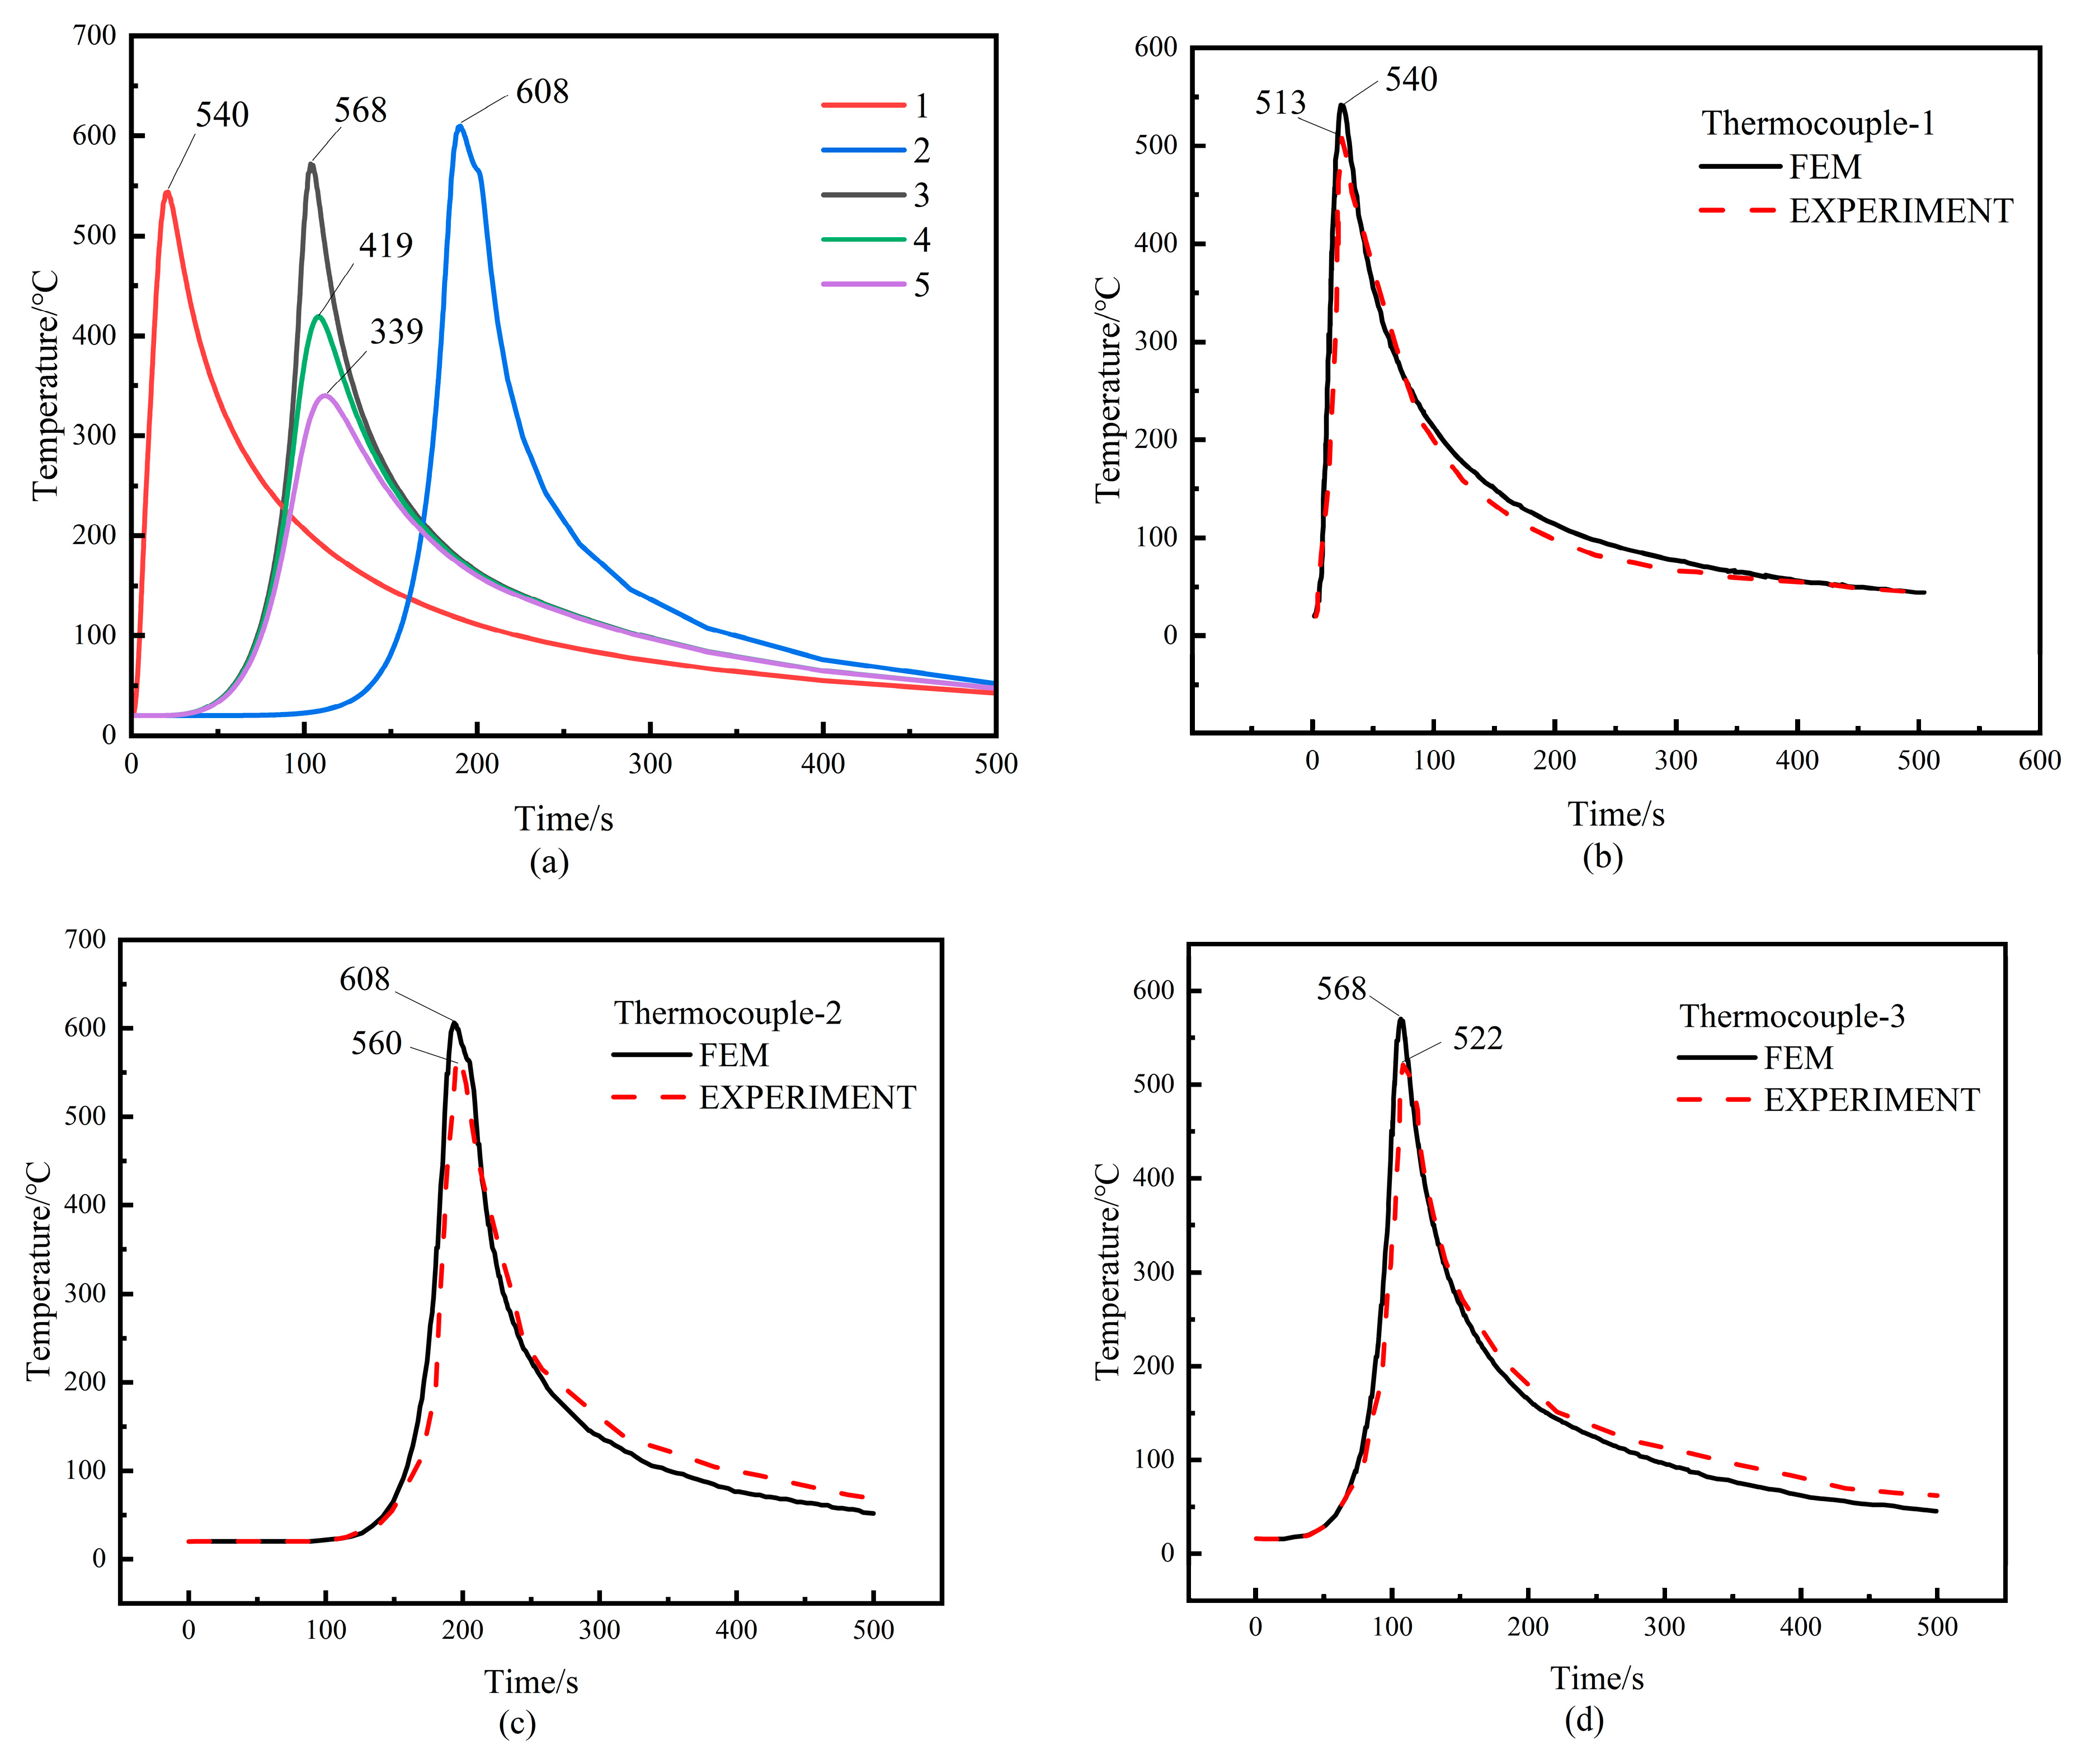
4.1. Temperature Variation in TIG Welding
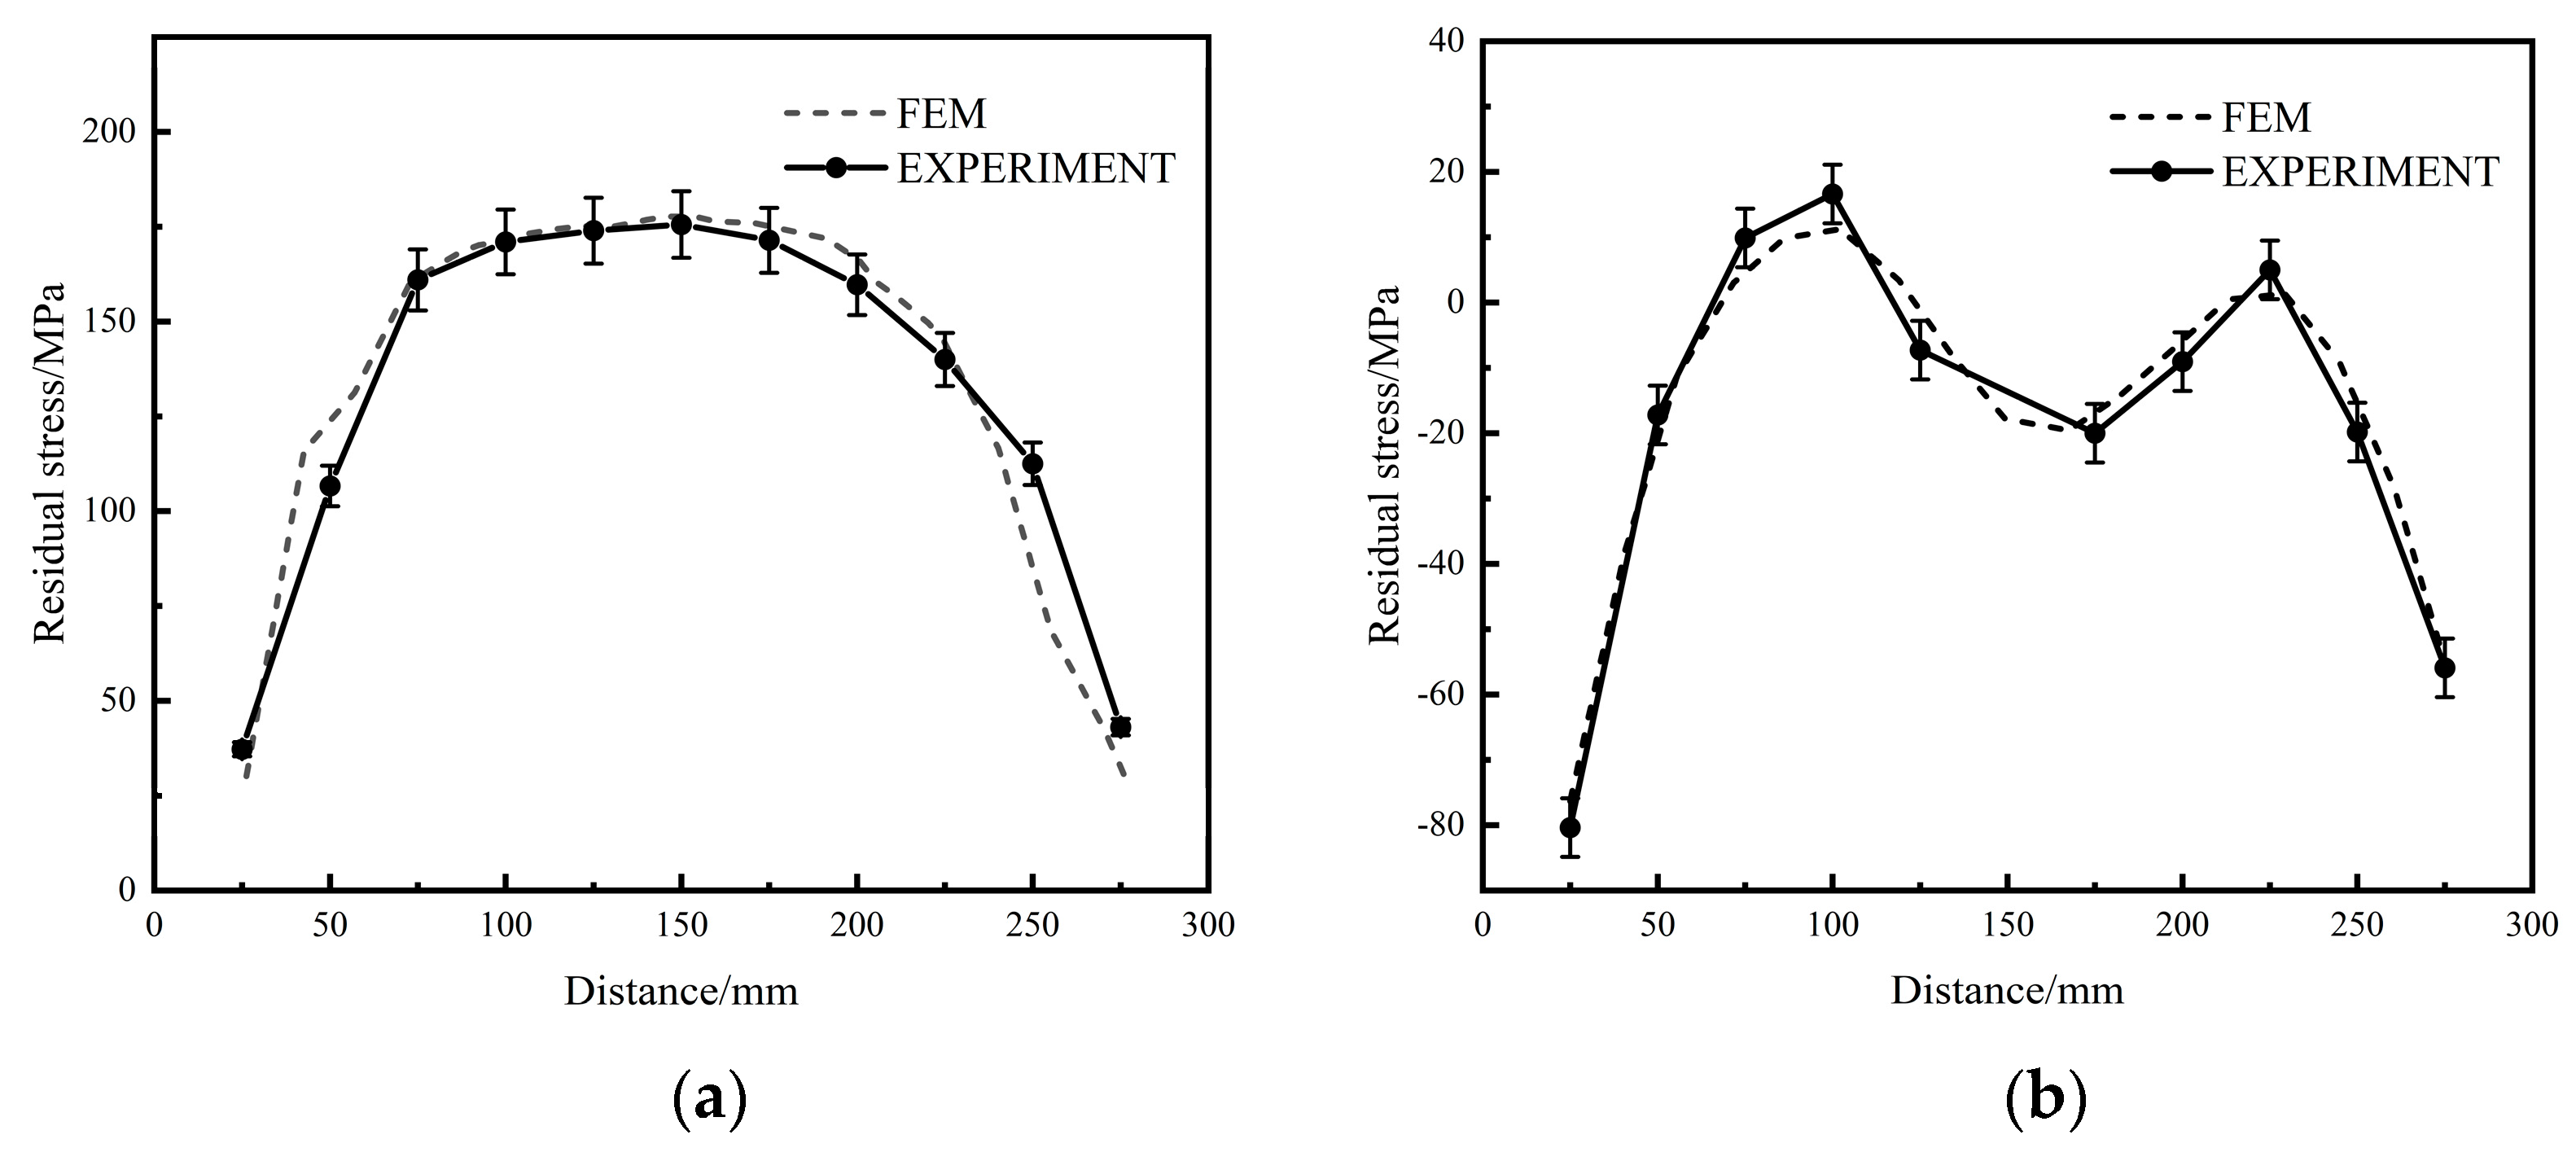
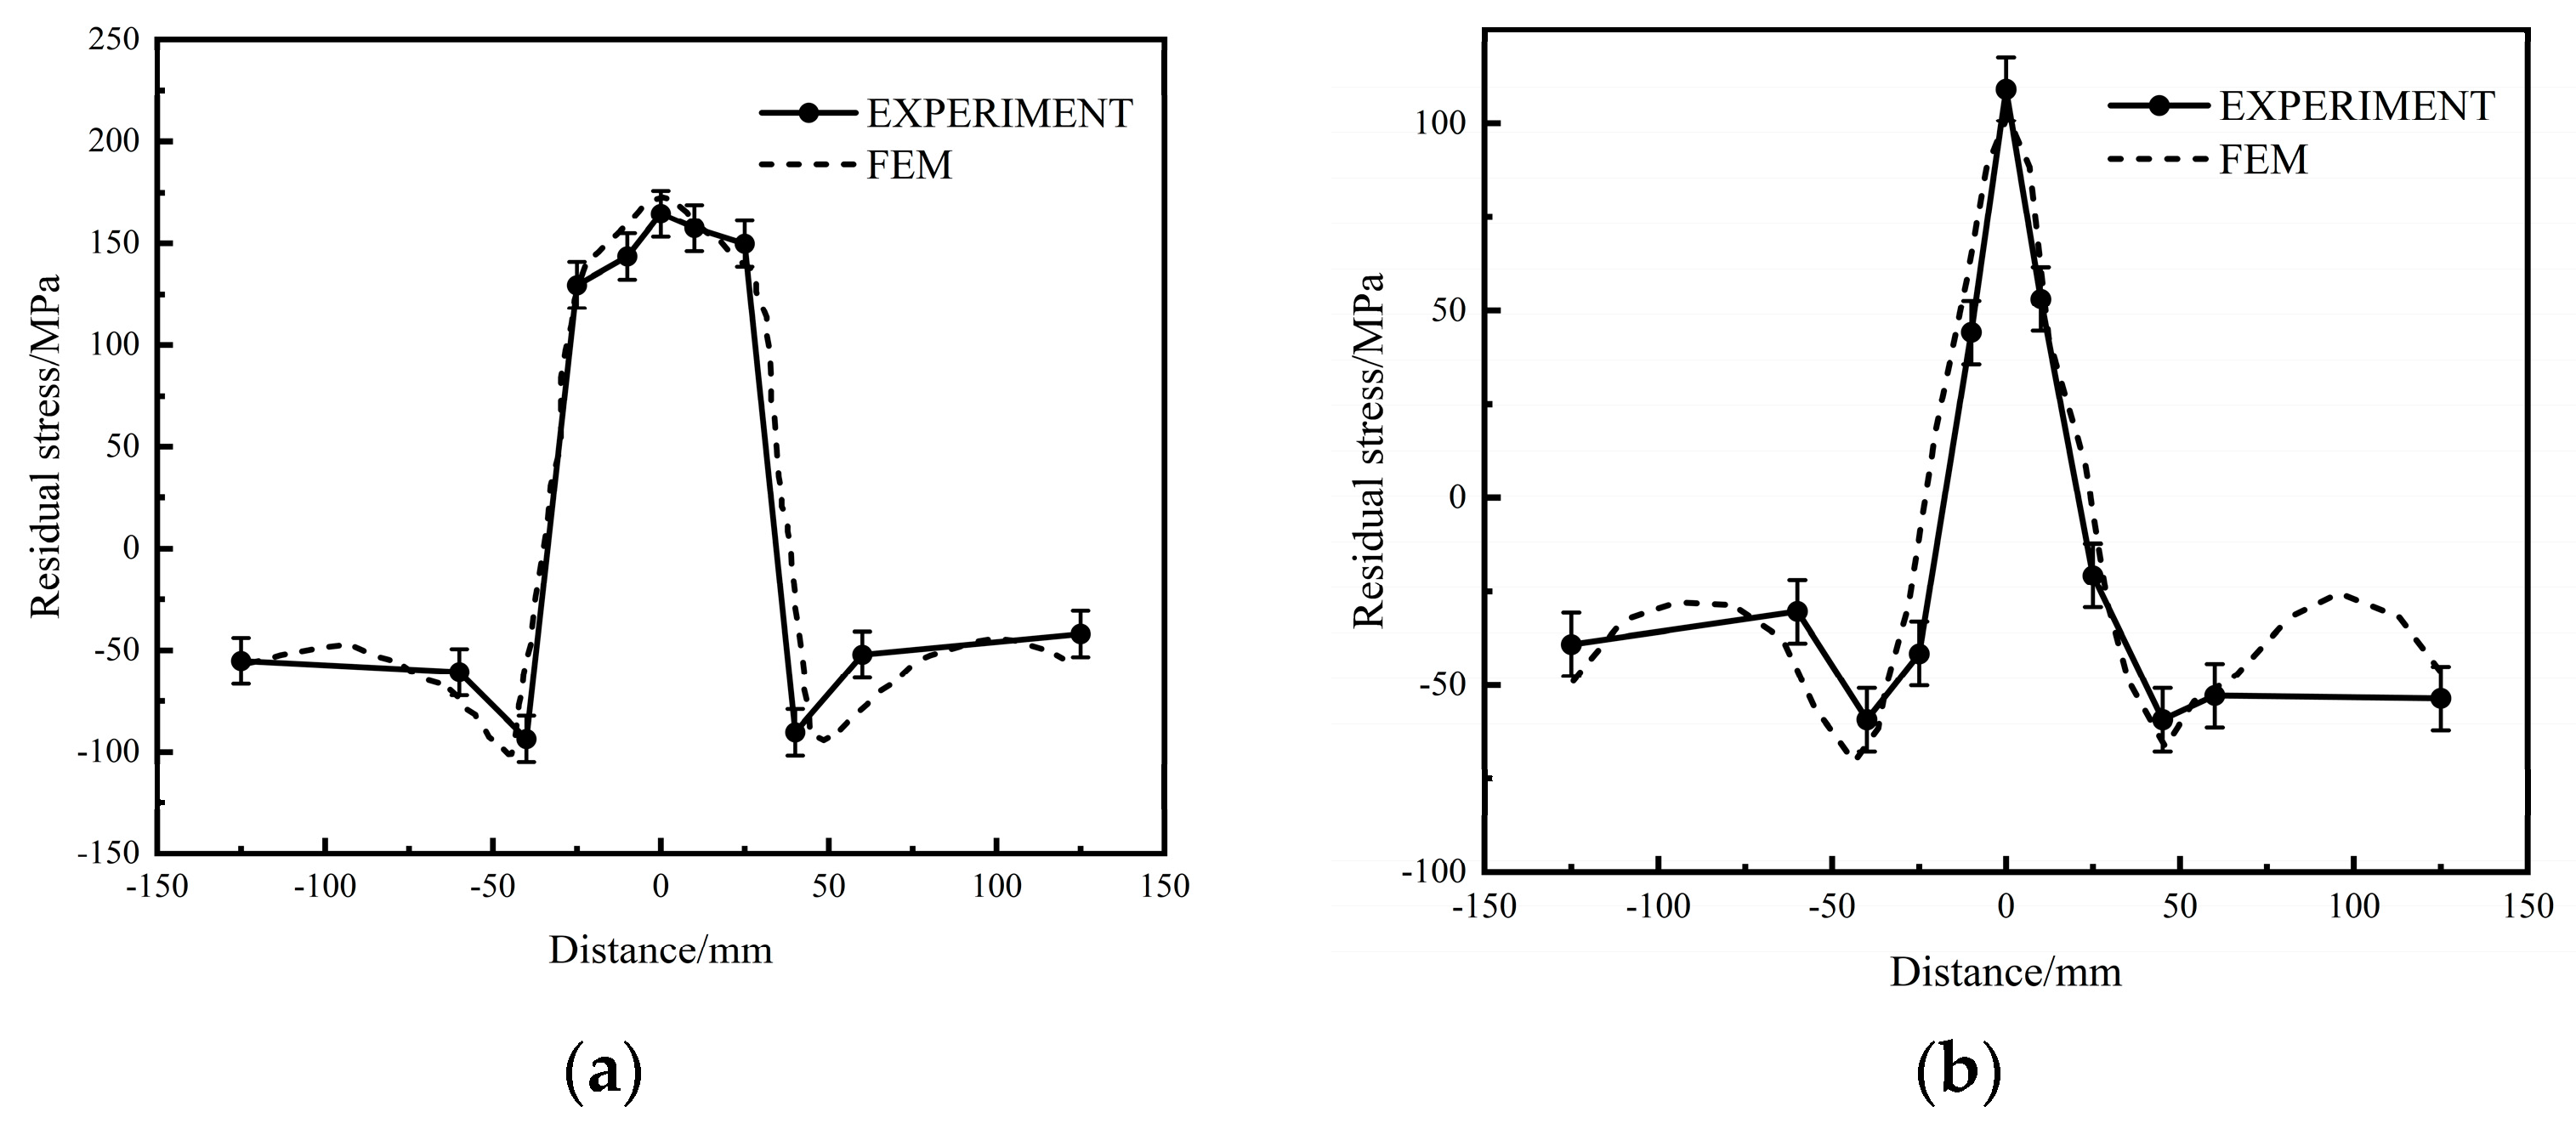
4.2. Residual Stress Variation in TIG Welding
4.3. Residual Stress Variation in Shot Peening
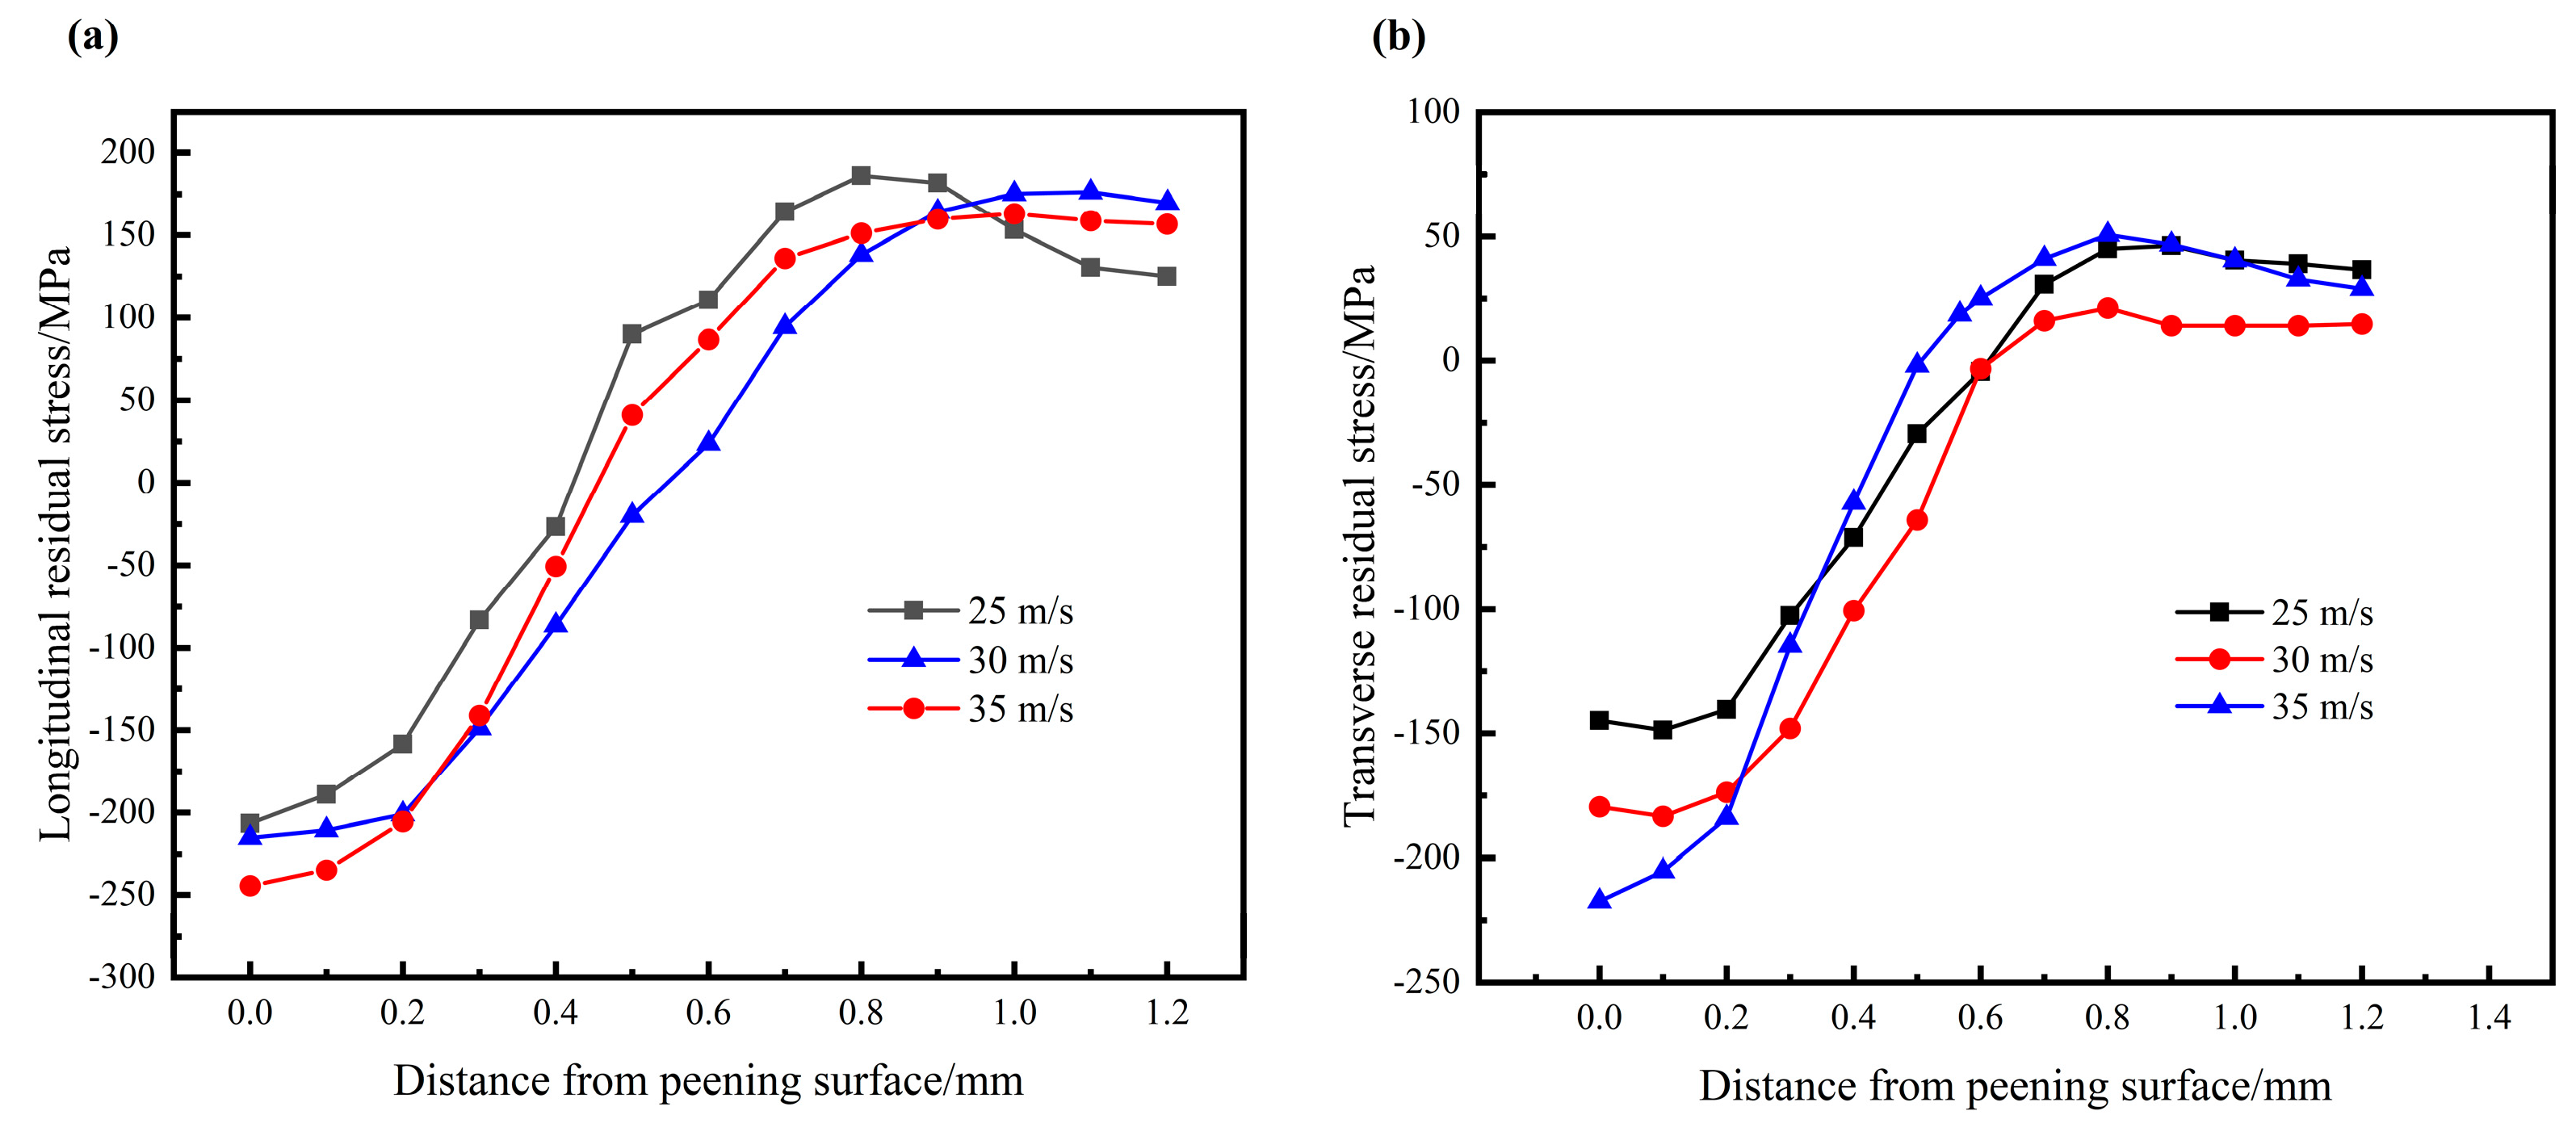
4.3.1. Effect of Shot Peening Speed
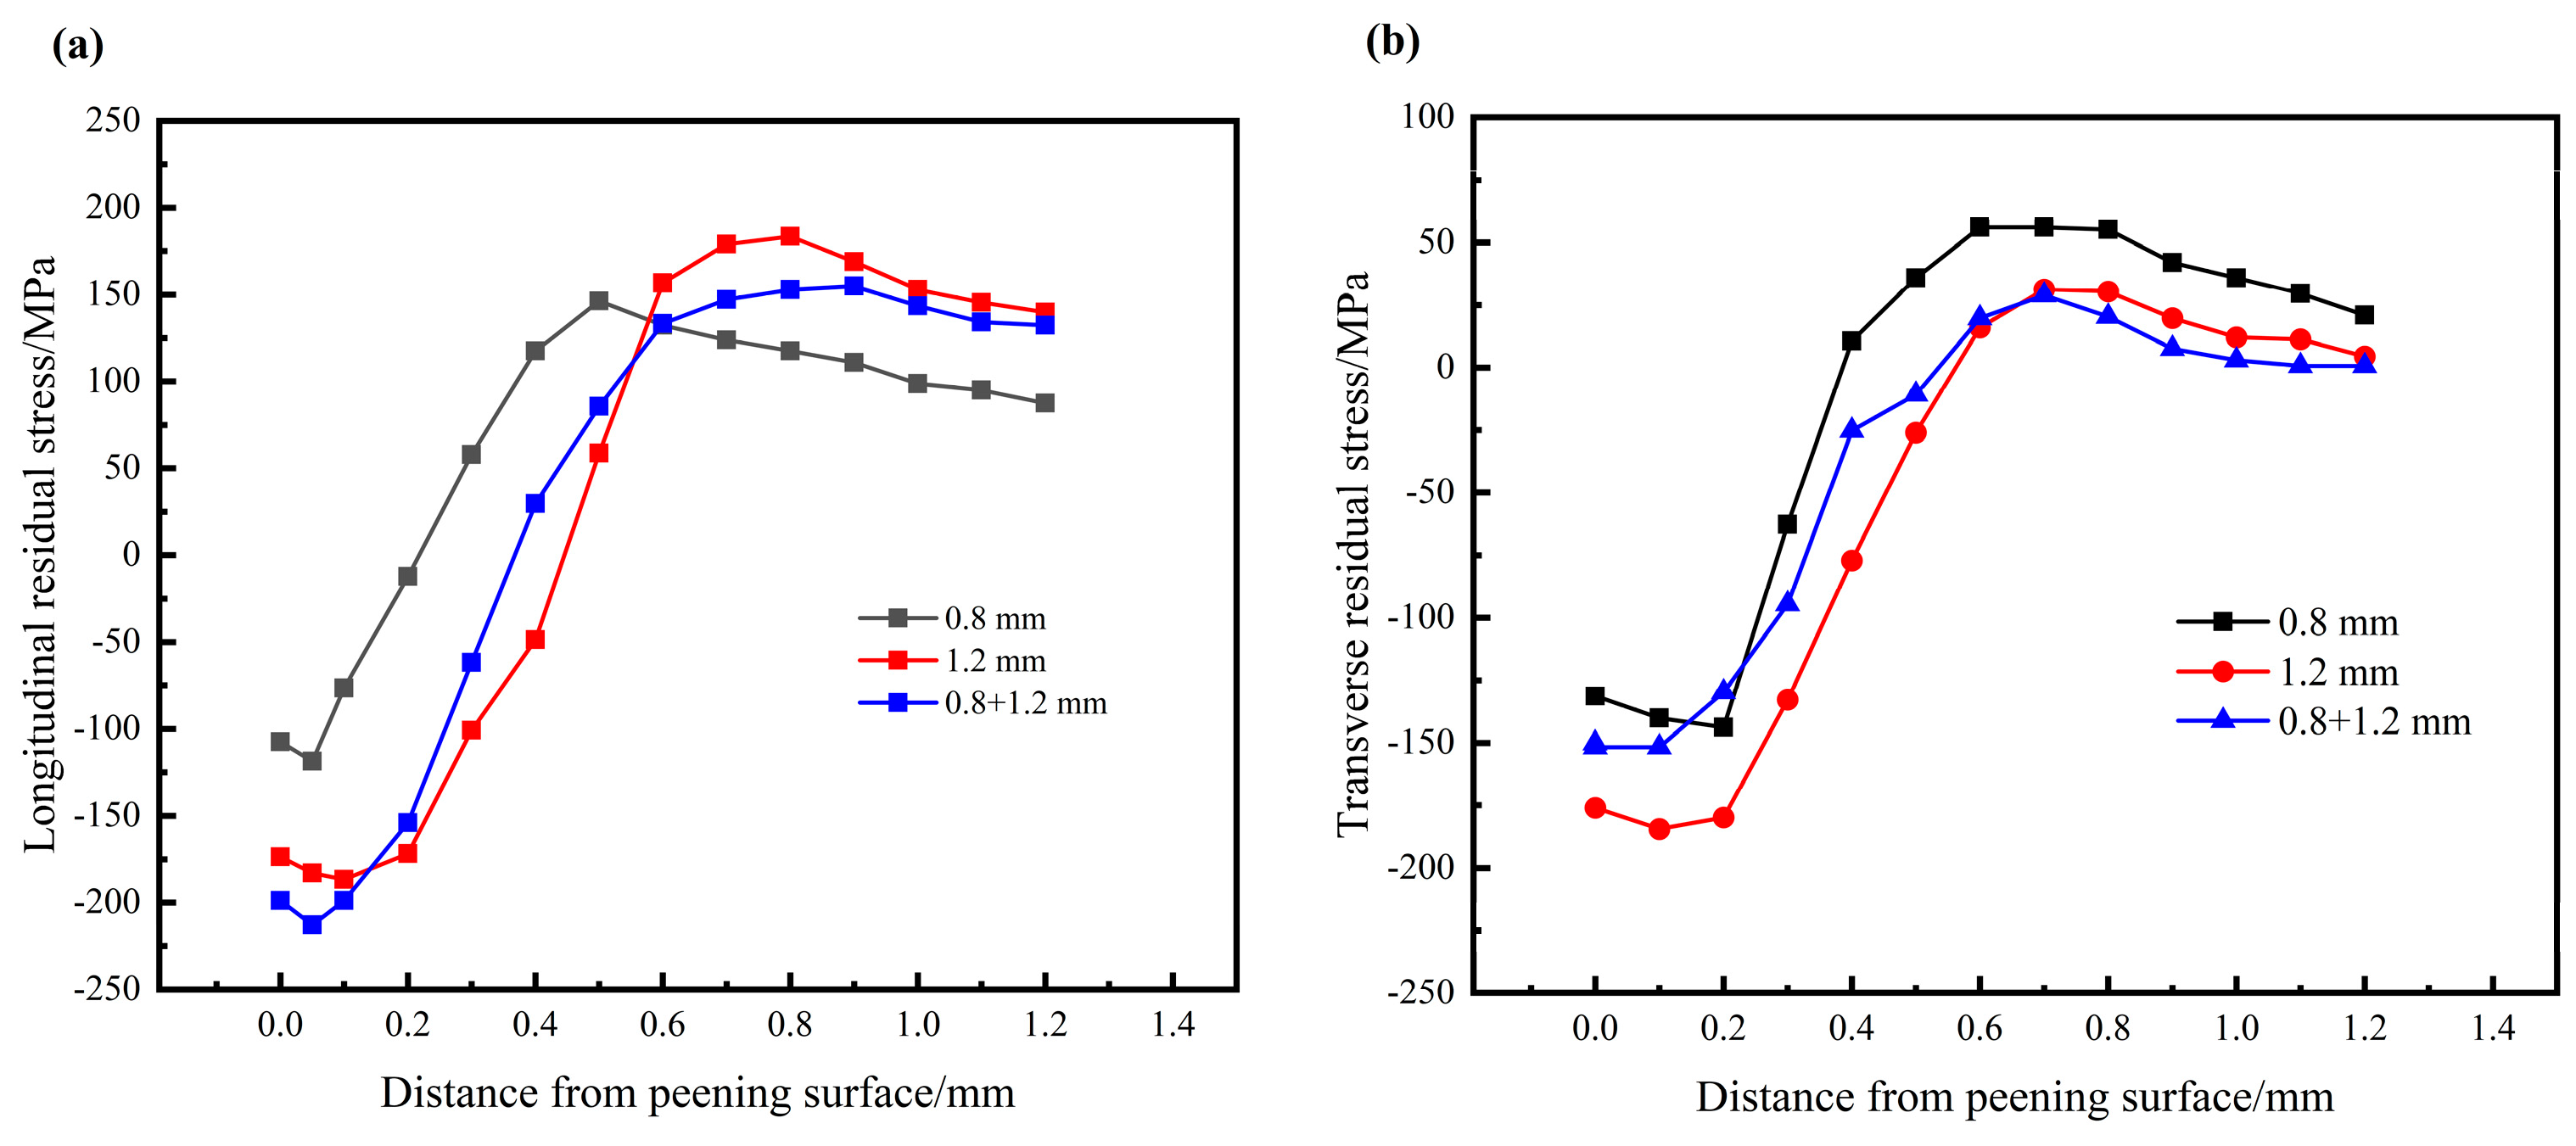
4.3.2. Effect of the Shots Diameter
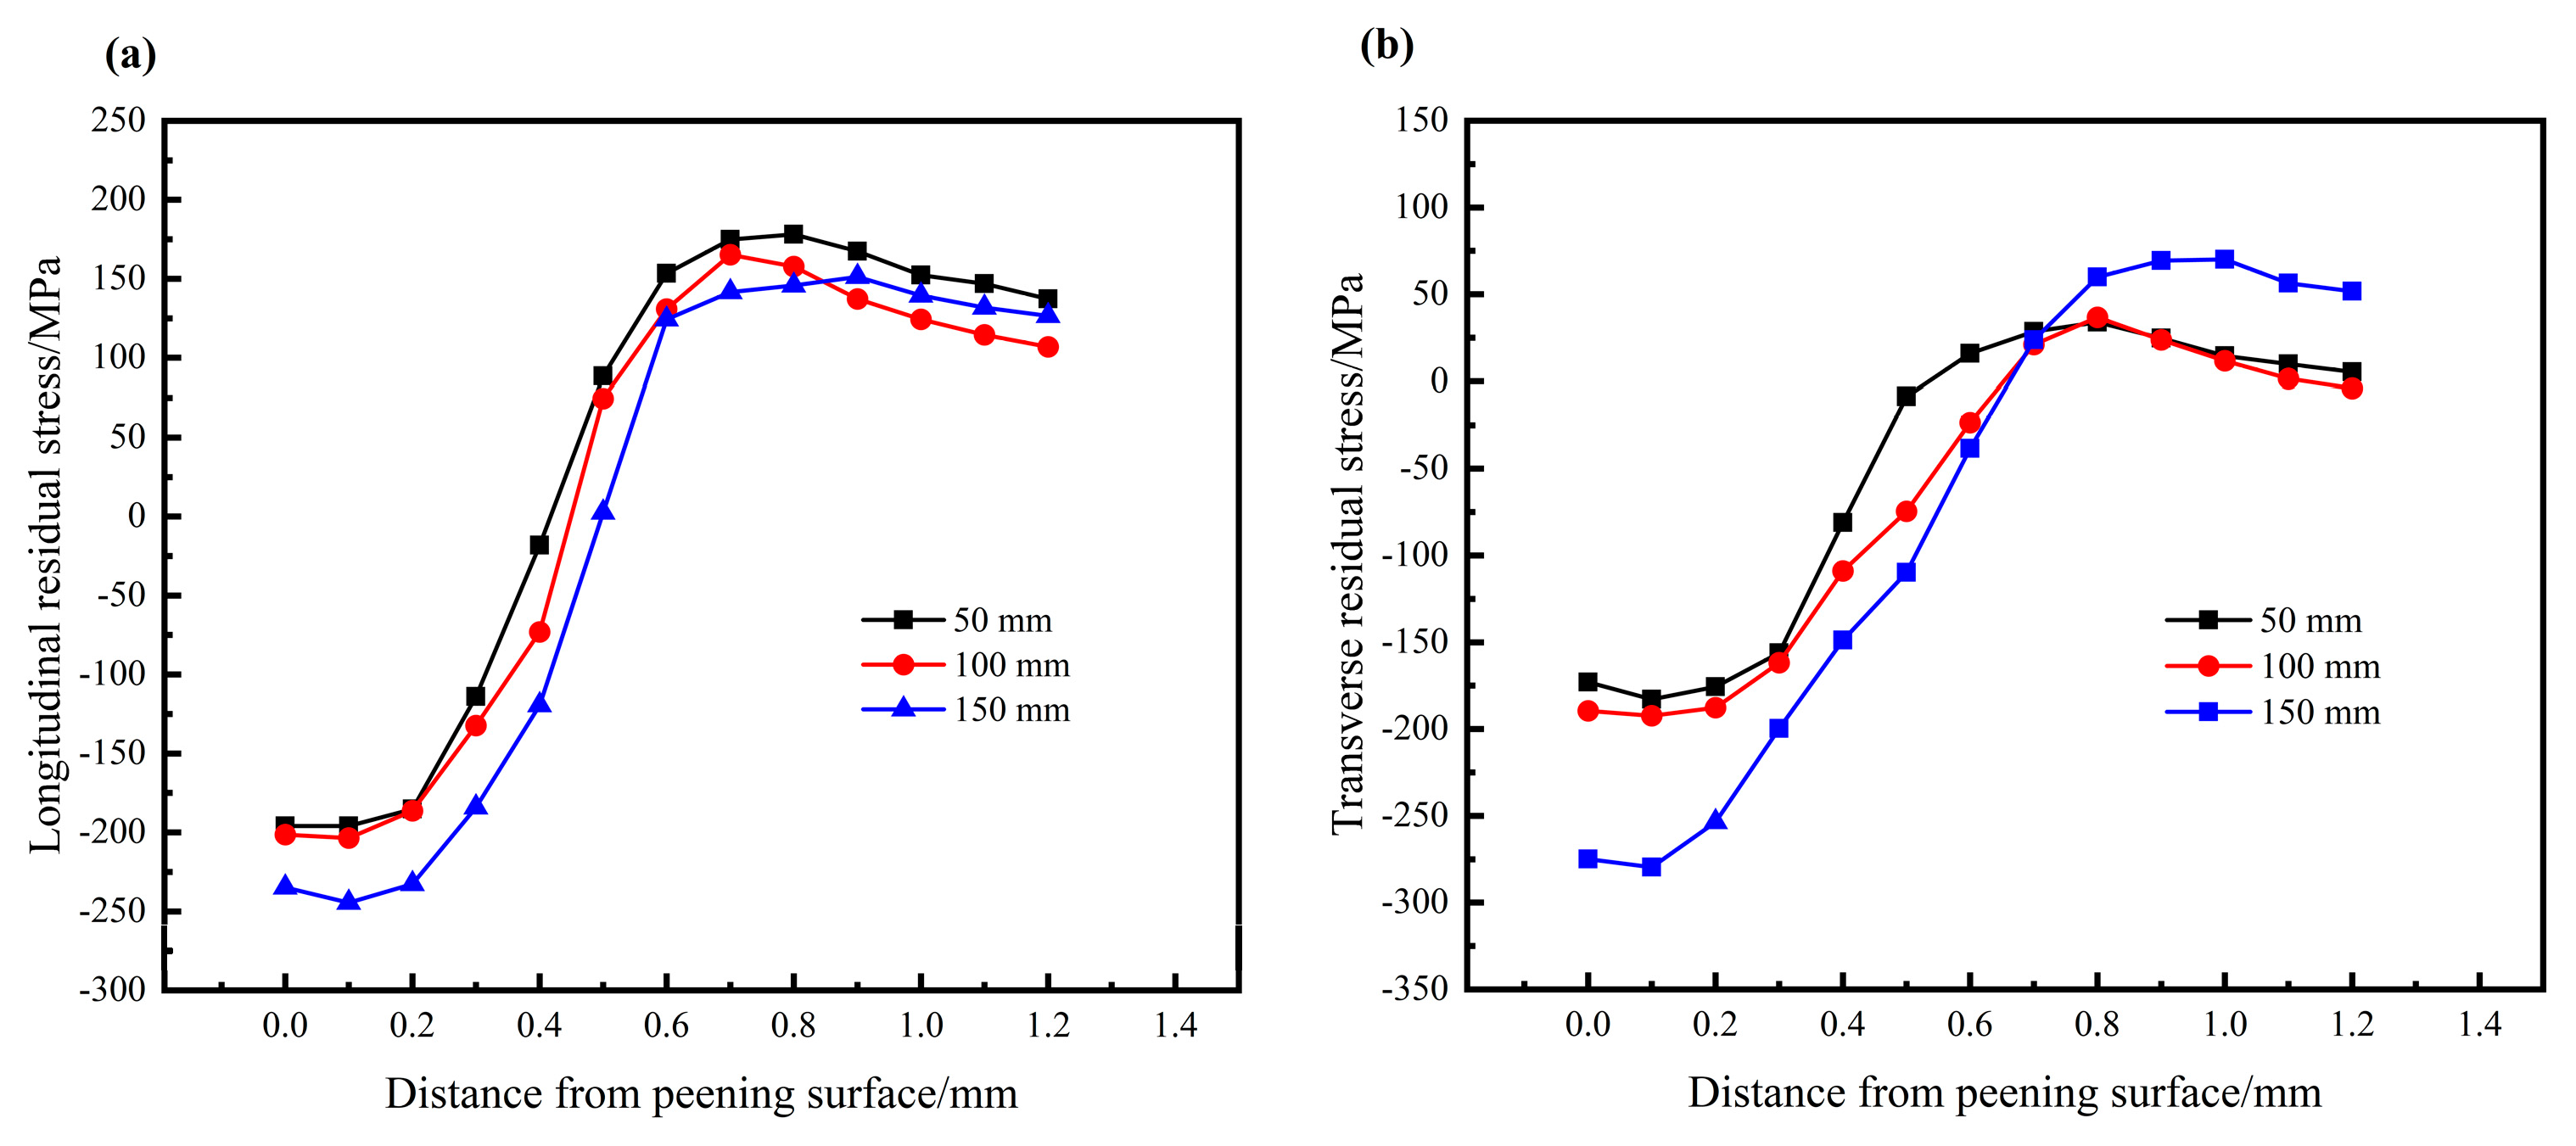
4.3.3. Effect of Nozzle Height
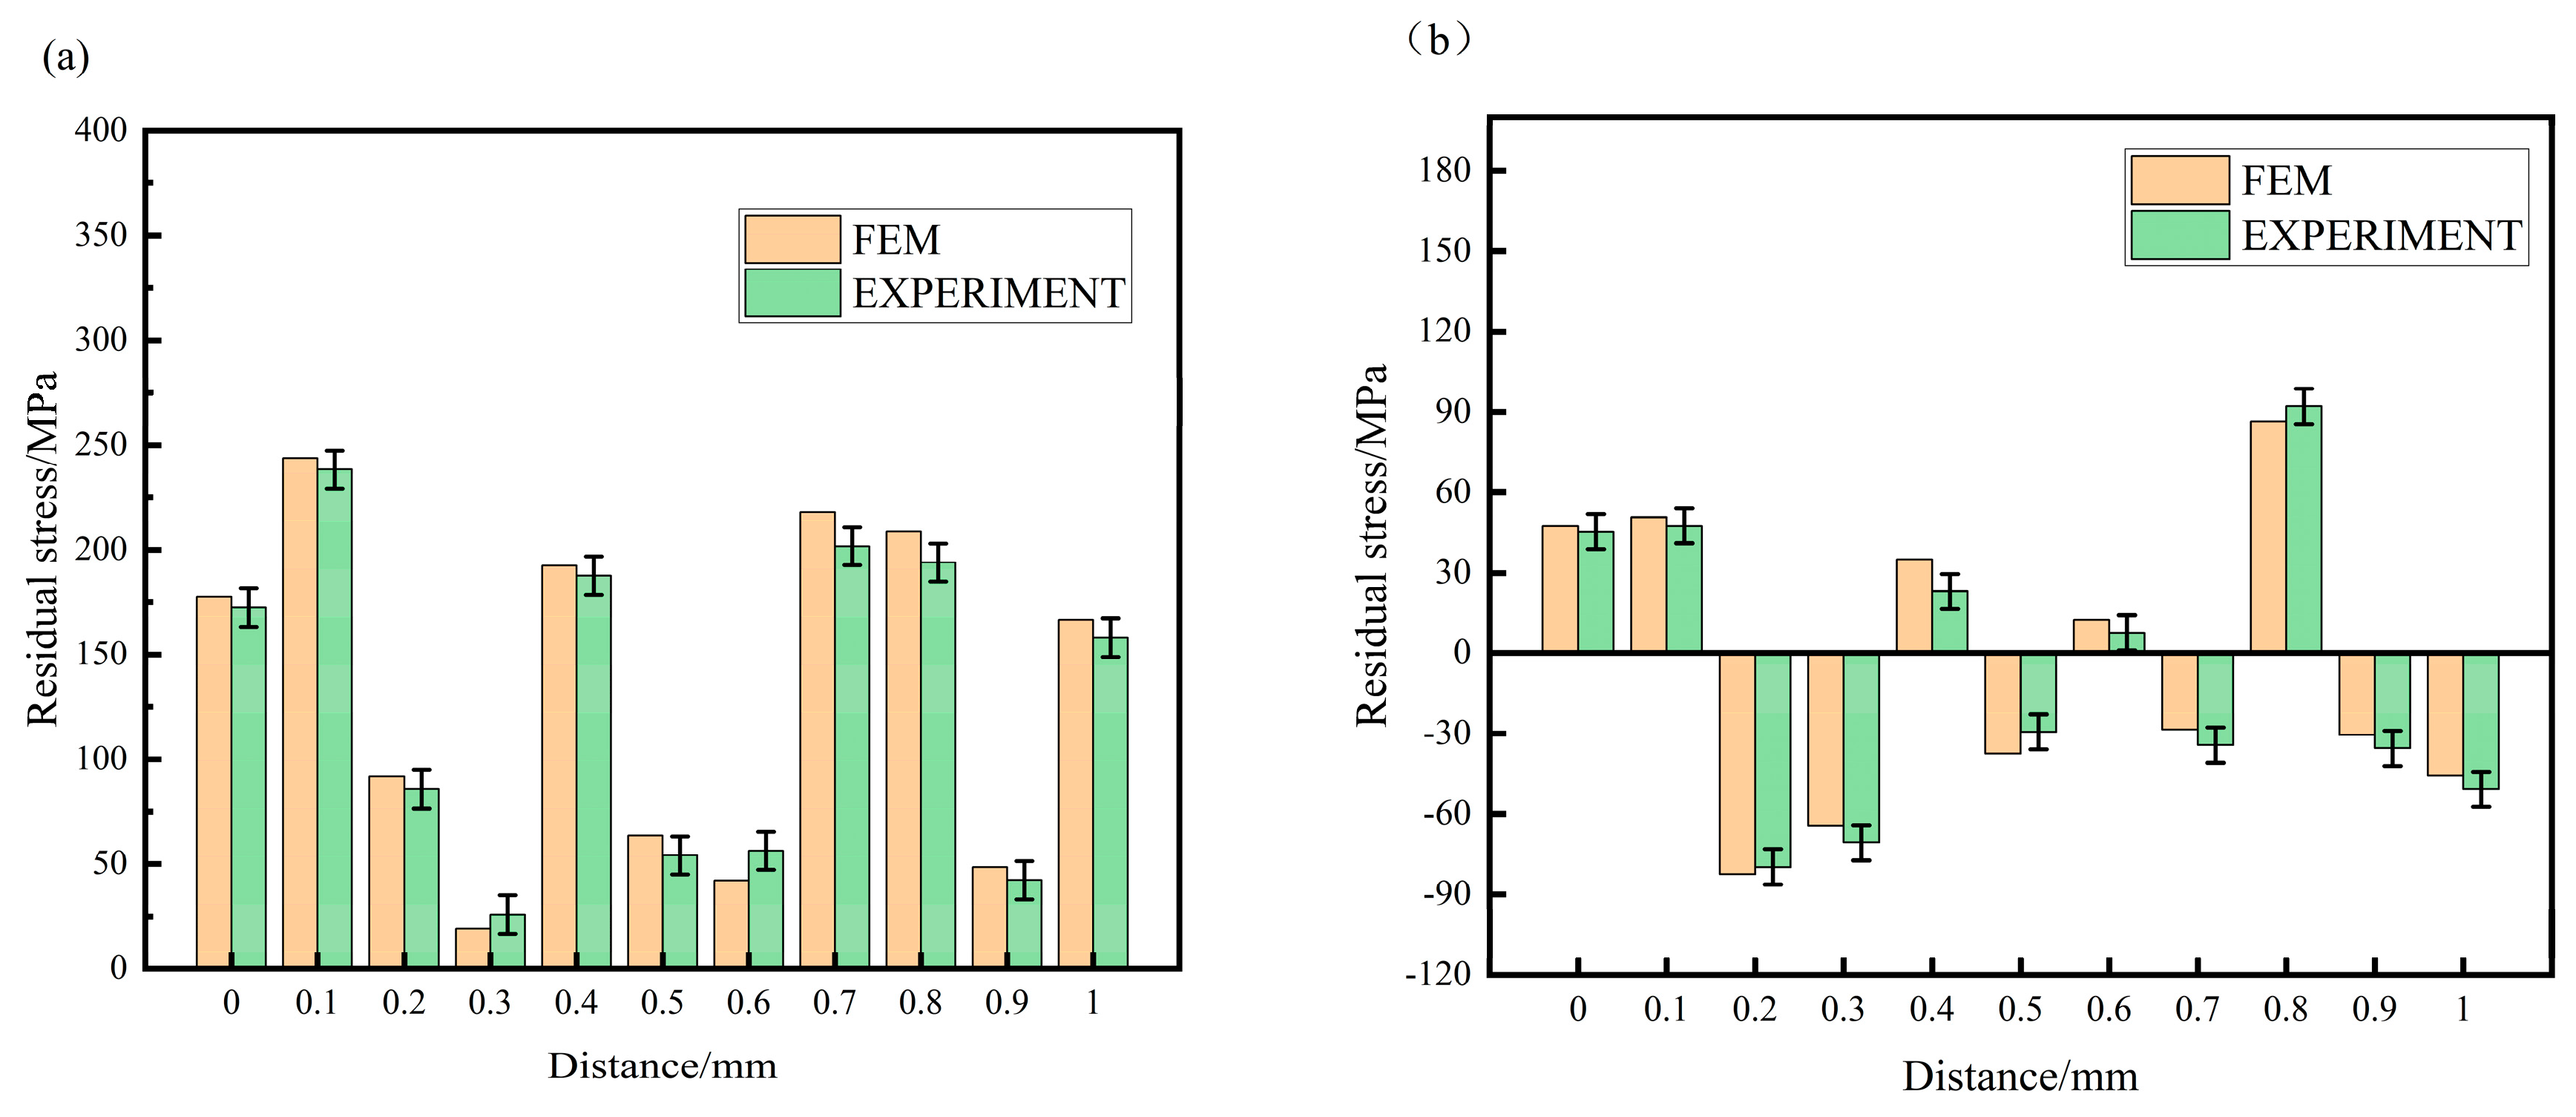
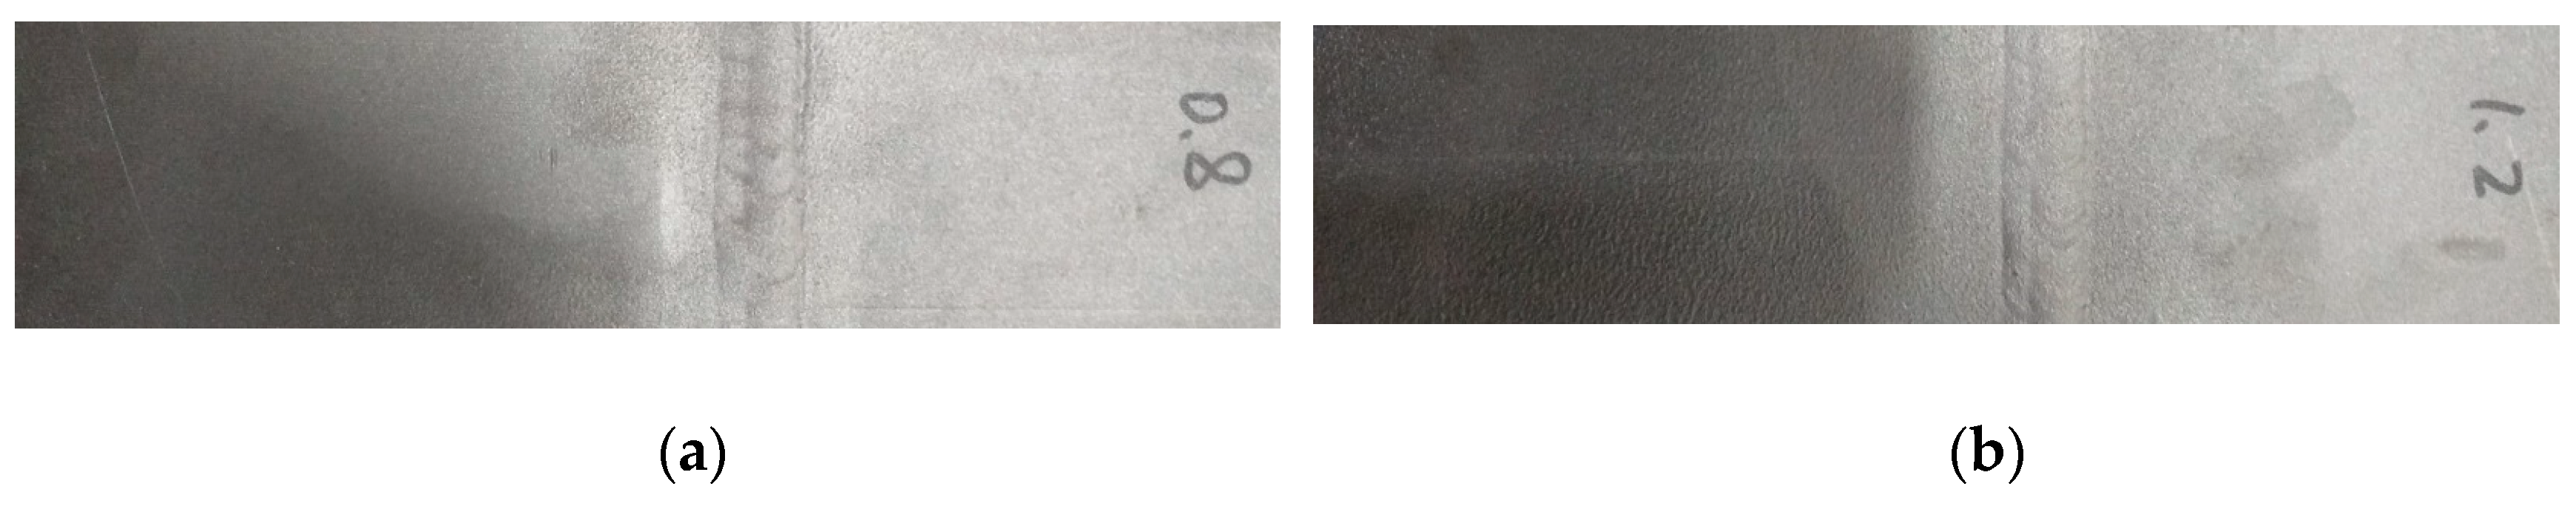
4.3.4. Experimental Verification
5. Conclusions
- TIG welding induces tensile residual stresses in the longitudinal direction with the maximum value at a depth of 0.1 mm. The longitudinal residual stress is larger than that in the transverse direction after TIG welding.
- Shot peening effectively transforms the tensile residual stress after TIG welding into compressive stress with a certain depth.
- Increased shot peening speed leads to larger values of the maximum compressive residual stress (σmax) in both directions. However, the shot peening speed shows limited effect on the increase in the peened depth with compressive residual stress.
- The value of σmax in the longitudinal and transverse directions and its peened depth Dc both increase with the increased shots diameter. Mixed shots of 0.8 + 1.2 mm induce a larger value of σmax in the longitudinal direction compared to that with shots diameter of 1.2 mm.
- The value of σmax and the peened depth Dc in two directions both increase with the increased nozzle height.
Author Contributions
Funding
Data Availability Statement
Conflicts of Interest
References
- Leggatt, R.H. Residual stresses in welded structures. Int. J. Press. Vessel. Piping 2008, 85, 144–151. [Google Scholar] [CrossRef]
- Aoki, S.; Nishimura, T.; Hiroi, T. Reduction method for residual stress of welded joint using random vibration. Nucl. Eng. Des. 2005, 235, 1441–1445. [Google Scholar] [CrossRef]
- Lobanov, L.M.; Pashchin, N.A.; Mikhodui, O.L.; Khokhlova, J.A. Investigation of residual stresses in welded joints of heat-resistant magnesium alloy ML10 after electrodynamic treatment. J. Magnes. Alloys 2016, 4, 77–82. [Google Scholar] [CrossRef]
- Salih, O.S.; Ou, H.; Sun, W. Heat generation, plastic deformation and residual stresses in friction stir welding of aluminium alloy. Int. J. Mech. Sci. 2023, 238, 107827. [Google Scholar] [CrossRef]
- Dai, P.; Kyaw, P.M.; Osawa, N.; Rashed, S.; Ma, D.; Okada, J.; Honnami, M. Numerical study on local residual stresses induced by high frequency mechanical impact post-weld treatment using the optimized displacement-controlled simulation method. J. Manuf. Process. 2023, 92, 262–271. [Google Scholar] [CrossRef]
- Lin, Q.; Liu, H.; Zhu, C.; Chen, D.; Zhou, S. Effects of different shot peening parameters on residual stress, surface roughness and cell size. Surf. Coat. Technol. 2020, 398, 126054. [Google Scholar] [CrossRef]
- Ongtrakulkij, G.; Khantachawana, A.; Kondoh, K. Effects of media parameters on enhance ability of hardness and residual stress of Ti6Al4V by fine shot peening. Surf. Interfaces 2020, 18, 100424. [Google Scholar] [CrossRef]
- Wu, J.; Liu, H.; Wei, P.; Lin, Q.; Zhou, S. Effect of shot peening coverage on residual stress and surface roughness of 18CrNiMo7-6 steel. Int. J. Mech. Sci. 2020, 183, 105785. [Google Scholar] [CrossRef]
- Maleki, E.; Unal, O. Roles of surface coverage increase and repeening on properties of AISI 1045 carbon steel in conventional and severe shot peening processes. Surf. Interfaces 2020, 11, 82–90. [Google Scholar] [CrossRef]
- Ahmad, A.S.; Wu, Y.; Gong, H. Coupled finite and discrete element shot peening simulation based on Johnson–Cook material model. Proc. Inst. Mech. Eng. Part L 2020, 234, 974–987. [Google Scholar] [CrossRef]
- SAE J2277; Shot Peening Coverage Determination. American Society of Motor Vehicle Engineers: Warrendale, PA, USA, 2013.
- Miao, H.Y.; Larose, S.; Perron, C.; Lévesque, M. An analytical approach to relate shot peening parameters to Almen intensity. Surf. Coat. Technol. 2010, 205, 2055–2066. [Google Scholar] [CrossRef]
- Maleki, E.; Unal, O.; Amanov, A. Novel experimental methods for the determination of the boundaries between conventional, severe and over shot peening processes. Surf. Interfaces 2018, 13, 233–254. [Google Scholar] [CrossRef]
- AL-Mokhtar, O.; Mohamed; Zoheir, F.; Andrew, W.; Gillis, J. Effect of a moving automated shot peening and peening parameters on surface integrity of Low carbon steel. J. Mater. Process. Technol. 2020, 227, 116399. [Google Scholar]
- Wu, J.; Liu, H.; Wei, P.; Zhu, C.; Lin, Q. Effect of shot peening coverage on hardness, residual stress and surface morphology of carburized rollers. Surf. Coat. Technol. 2020, 384, 125273. [Google Scholar] [CrossRef]
- Maleki, E.; Unal, O. Optimization of shot peening effective parameters on surface hardness improvement. Met. Mater. Int. 2020, 27, 3173–3185. [Google Scholar] [CrossRef]
- Gariépy, A.; Miao, H.Y.; Lévesque, M. Simulation of the shot peening process with variable shot diameters and impacting velocities. Adv. Eng. Softw. 2017, 114, 121–133. [Google Scholar] [CrossRef]
- Bagherifard, S.; Ghelichi, R.; Guagliano, M. Numerical and experimental analysis of surface roughness generated by shot peening. Appl. Surf. Sci. 2012, 258, 6831–6840. [Google Scholar] [CrossRef]
- Maleki, E.; Farrahi, G.H.; Kashyzadeh, K.R.; Unal, O.; Gugaliano, M.; Bagherifard, S. Effects of conventional and severe shot peening on residual stress and fatigue strength of steel AISI 1060 and residual stress relaxation due to fatigue loading: Experimental and numerical simulation. Met. Mater. Int. 2020, 27, 2575–2591. [Google Scholar] [CrossRef]
- Zhang, Y.; Lai, F.; Qu, S.; Ji, V.; Liu, H.; Li, X. Effect of shot peening on residual stress distribution and tribological behaviors of 17Cr2Ni2MoVNb steel. Surf. Coat. Technol. 2020, 386, 125497. [Google Scholar] [CrossRef]
- Sherafatnia, K.; Farrahi, G.H.; Mahmoudi, A.H. Effect of initial surface treatment on shot peening residual stress field: Analytical approach with experimental verification. Int. J. Mech. Sci. 2018, 137, 171–181. [Google Scholar] [CrossRef]
- Zhao, C.; Shi, C.; Wang, Q.; Gao, Y.; Yang, Q. Residual stress field of high-strength steel after shot peening by numerical simulation. J. Mater. Eng. Perform. 2020, 29, 358–364. [Google Scholar] [CrossRef]
- Hong, T.; Ooi, S.B. A numerical simulation to relate the shot peening parameters to the induced residual stresses. Eng. Fail. Anal. 2008, 15, 1097–1110. [Google Scholar] [CrossRef]
- Jebahi, M.; Gakwaya, A.; Lévesque, J.; Mechri, O.; Ba, K. Robust methodology to simulate real shot peening process using discrete continuum coupling method. Int. J. Mech. Sci. 2016, 107, 21–33. [Google Scholar] [CrossRef]
- Tu, F.; Delbergue, D.; Klotz, T.; Bag, A.; Miao, H.; Bianchetti, C.; Brochu, M.; Bocher, P.; Levesque, M. Discrete element-periodic cell coupling model and investigations on shot stream expansion, Almen intensities and target materials. Int. J. Mech. Sci. 2018, 145, 353–366. [Google Scholar] [CrossRef]
- Zhang, J.; Lu, S.; Wu, T.; Zhou, Z.; Zhang, W. An evaluation on SP surface property by means of combined FEM-DEM shot dynamics simulation. Adv. Eng. Softw. 2018, 115, 283–296. [Google Scholar] [CrossRef]
- Marini, M.; Piona, F.; Fontanari, V.; Bandini, M.; Benedetti, M. A new challenge in the DEM/FEM simulation of the shot peening process: The residual stress field at a sharp edge. Int. J. Mech. Sci. 2020, 169, 105327. [Google Scholar] [CrossRef]
- Li, K.; Wang, C.; Hu, X.; Zhou, Y.; Lai, Y.; Wang, C. DEM-FEM coupling simulation of residual stresses and surface roughness induced by shot peening of TC4 titanium alloy. Int. J. Adv. Manuf. Technol. 2021, 118, 1469–1483. [Google Scholar] [CrossRef]
- Ding, J.; Colegrove, P.; Mehnen, J.; Ganguly, S.; Sequeira, A.P.M.; Wang, F.; Williams, S. Thermo-mechanical analysis of Wire and Arc Additive Layer Manufacturing process on large multi-layer parts. Comput. Mater. Sci. 2011, 50, 3315–3322. [Google Scholar] [CrossRef]
- Mirza, F.A.; Daolun, C.; Dejiang, L.I.; Zeng, X. A modified Johnson-Cook constitutive relationship for a rare-earth containing magnesium alloy. J. Rare Earths 2013, 31, 1202–1207. [Google Scholar] [CrossRef]
- Zhang, Z.; Jiang, Z.; Wei, Q. Dynamic mechanical properties and constitutive equations of 2219 aluminum alloy. J. Mater. Eng. 2017, 45, 47–51. [Google Scholar]
- Kim, D.; Badarinarayan, H.; Kim, J.H.; Kim, C.; Okamoto, K.; Wagoner, R.H.; Chung, K. Numerical simulation of friction stir butt welding process for AA5083-H18 sheets. J. Mech. Theor. Appl. 2010, 29, 204–215. [Google Scholar] [CrossRef]
- Ahmad, A.S.; Wu, Y.; Gong, H.; Alhassan, Y. Numerical simulation of post-weld shot peening using combined discrete and finite element methods (DEM-FEM). Proc. Inst. Mech. Eng. Part B 2023, 237, 261–275. [Google Scholar] [CrossRef]


| Voltage U/V | Current I/A | Heat Source Efficiency η | Front Axle Length af/mm | Rear Axle Length ar/mm | Width c/mm | Depth b/mm | Front Scale Factor ff | Back-End Scaling Factor fr |
|---|---|---|---|---|---|---|---|---|
| 22.6 | 110 | 0.6 | 5 | 10 | 5 | 3 | 0.67 | 1.33 |
| Parameters | A | B | C | m | n |
|---|---|---|---|---|---|
| Value | 170 | 228 | 0.028 | 2.75 | 0.31 |
| Region | Radiant Heat Transfer Coefficient ε | Convective Heat Transfer Coefficient ha/(W/m2·°C) | Contact Heat Transfer Coefficient k/(W/m·°C) | |
|---|---|---|---|---|
| Substrate | Top and side | 0.2 | 20 | — |
| Bottom | — | — | 500 |
| Materials | Density (kg·m3) | Elasticity Modulus (GPa) | Poisson’s Ratio |
|---|---|---|---|
| Steel | 7750 | 206 | 0.3 |
| Shot Parameters | Shot Peening Speed V (m/s) | Shots Diameter D (mm) | Nozzle Height H (mm) |
|---|---|---|---|
| Value | 25 | 0.8 | 50 |
| 30 | 1.2 | 100 | |
| 35 | 0.8/1.2 | 150 |
| Element | Cu | Mg | Mn | Ti | Zr | V | Zn | Si | Fe |
|---|---|---|---|---|---|---|---|---|---|
| wt% | 5.8–6.8 | ≤0.02 | 0.2–0.4 | 0.1–0.2 | 0.1–0.25 | 0.05–0.15 | ≤0.1 | ≤0.2 | ≤0.3 |
| Parameters | Voltage (V) | Current (A) | Welding Speed (mm/s) | Wire Feed Speed (m/min) | Contact Tip-to-Work Distance (mm) |
|---|---|---|---|---|---|
| Value | 22.6 | 110 | 1.5 | 7 | 14 |
| Parameters | Settings |
|---|---|
| materials | Aluminum (Cr) |
| X-ray | Cr |
| Time of exposure | 10 s |
| Number of exposures | 10 times/position |
| Target swing angle | 3.00 [deg.] |
| Specification of collimated tubes | 1 × 2 mm |
| Method of peak fixing | Gauss 80% |
| ψ0(°) | 0°, ±20.7°, ±30°, ±37.8°, ±45° |
| Longitudinal Stress | Transverse Stress | |||||
|---|---|---|---|---|---|---|
| Shot peening speed V(m/s) | 25 | 30 | 35 | 25 | 30 | 35 |
| Maximum value of compressive stress σmax (MPa) | −195 | −215 | −229 | −145 | −182 | −211 |
| Peened depth with compressive stress Dc (mm) | 0.42 | 0.518 | 0.43 | 0.57 | 0.63 | 0.49 |
| Longitudinal Stress | Transverse Stress | |||||
|---|---|---|---|---|---|---|
| Shots diameter D (mm) | 0.8 | 0.8 + 1.2 | 1.2 | 0.8 | 0.8 + 1.2 | 1.2 |
| Maximum value of compressive stress σmax (MPa) | −116 | −218 | −195 | −147 | −148 | −182 |
| Peened depth with compressive stress Dc (mm) | 0.19 | 0.35 | 0.42 | 0.389 | 0.48 | 0.57 |
| Longitudinal Stress | Transverse Stress | |||||
|---|---|---|---|---|---|---|
| Nozzle height H(mm) | 50 | 100 | 150 | 50 | 100 | 150 |
| Maximum value of compressive stress σmax (MPa) | −195 | −199 | −235 | −147 | −186 | −289 |
| Peened depth with compressive stress Dc (mm) | 0.42 | 0.44 | 0.47 | 0.57 | 0.619 | 0.68 |
| Simulated | Experiment | Error | |
|---|---|---|---|
| Surface stress σ0 (MPa) | −194.3 | −187.7 | 3.4% |
| Maximum value of compressive stress σmax (MPa) | −215.4 | −203.1 | 5.7% |
| Peened depth with compressive stress Dc (mm) | 0.518 | 0.507 | 2.1% |
Disclaimer/Publisher’s Note: The statements, opinions and data contained in all publications are solely those of the individual author(s) and contributor(s) and not of MDPI and/or the editor(s). MDPI and/or the editor(s) disclaim responsibility for any injury to people or property resulting from any ideas, methods, instructions or products referred to in the content. |
© 2023 by the authors. Licensee MDPI, Basel, Switzerland. This article is an open access article distributed under the terms and conditions of the Creative Commons Attribution (CC BY) license (https://creativecommons.org/licenses/by/4.0/).
Share and Cite
Zhang, T.; Chen, J.; Gong, H.; Li, H. Study on Residual Stresses of 2219 Aluminum Alloy with TIG Welding and Its Reduction by Shot Peening. Metals 2023, 13, 1581. https://doi.org/10.3390/met13091581
Zhang T, Chen J, Gong H, Li H. Study on Residual Stresses of 2219 Aluminum Alloy with TIG Welding and Its Reduction by Shot Peening. Metals. 2023; 13(9):1581. https://doi.org/10.3390/met13091581
Chicago/Turabian StyleZhang, Tao, Junwen Chen, Hai Gong, and Huigui Li. 2023. "Study on Residual Stresses of 2219 Aluminum Alloy with TIG Welding and Its Reduction by Shot Peening" Metals 13, no. 9: 1581. https://doi.org/10.3390/met13091581
APA StyleZhang, T., Chen, J., Gong, H., & Li, H. (2023). Study on Residual Stresses of 2219 Aluminum Alloy with TIG Welding and Its Reduction by Shot Peening. Metals, 13(9), 1581. https://doi.org/10.3390/met13091581