Article

The Effect of Defect Characteristics on Prediction of Fatigue Life of TC4 Titanium Alloy Welded Joints

1
School of Materials Science and Engineering, Inner Mongolia University of Technology, Hohhot 010051, China
2
School of Mechanical Engineering, Inner Mongolia University of Technology, Hohhot 010051, China
3
School of Mechanical Engineering, Beijing Institute of Technology, Beijing 100081, China
*
Author to whom correspondence should be addressed.
Metals 2023, 13(9), 1540; https://doi.org/10.3390/met13091540
Submission received: 31 July 2023 / Revised: 26 August 2023 / Accepted: 27 August 2023 / Published: 31 August 2023
(This article belongs to the Special Issue Fatigue, Damage and Fracture of Metallic Materials)

Abstract

:
The size and depth of defects significantly affect fatigue performance; the main purpose of this article is to clarify the effect of stress correction factors caused by defects on the fatigue life of α + β Type titanium alloy welded joints. In order to investigate the fatigue characteristics of α + β Type titanium alloy welded joints, axial constant amplitude loading fatigue tests were performed with a stress ratio of −1. The test results show that the fatigue life continues to increase as the stress amplitude decreases, and the failure modes can be classified into two types: interior failure and surface failure. A fatigue parameter (λ) determined by both defect depth and size was proposed which allowed for a good generalization of the data point distribution in short and long-life regions. The stress correction factor (W) related to the S–N characteristics was constructed by combining the λ and average defect size, and it effectively improved the dispersion of the test data. Continuing, the fatigue life prediction model was established under the condition that the defect type and size can be estimated or detected on the basis of the dislocation energy method. The results indicated that the evaluated values of the new life model associated with W are in good agreement with the test results.

1. Introduction

With the trend of high-performance and large-scale modern industrial equipment, the demand for the thick plate welding of titanium alloy is increasing [1]. For large and complex structural components, gas tungsten arc welding (TIG) has advantages such as process economy and efficiency [2]. However, common defects such as porosity, lack of fusion, and macroscopic cracks on the surface or inside of welded joints greatly restrict the overall mechanical performance and service life of the components [3]. Therefore, it is urgent to investigate the impact of defect characteristics on the fatigue behavior and fatigue life prediction methods of titanium alloy welded joints under very-high-cycle fatigue (VHCF) in order to lay the foundation for the development of equipment with high reliability and long life.
Compared with the decreasing trend of the S–N curves of welded joints in high-cycle fatigue [4,5,6], the S–N curves of welded joints in VHCF exhibit a “bilinear” or “stepped” distribution [7,8]. This is due to the different fatigue fracture mechanisms from the surface to the interior of the specimen, which are closely related to the uneven distribution of defect sizes and differences in crystallographic characteristics [9,10,11]. Meanwhile, the loading frequency does not affect the fatigue performance of the joint [9,10,11]. In addition, a rough characteristic region concentrated around the defect is always found on fatigue fracture surfaces [12,13,14,15,16,17]. This article uses “FGA” to represent the feature area. Typically, the FGA as the crack initiation region can consume over 90% of the VHCF lifetime [18,19]. Therefore, when determining the very-high-cycle fatigue life of welded joints, the influence of the FGA’s characteristic size should be taken into account.
As is well known, initiation cracks are often closely related to defects, as there is often strong stress concentration around defects. Earlier, Murakami [20] found that the defect size tends to negatively affect fatigue performance and proposed a well-known parametric model that takes into account both hardness and defect size, which can be used to evaluate fatigue life at different stress levels. Wang et al. [21] proposed a probabilistic framework for the fatigue life assessment of notched components under size effects in which the Smith–Watson–Topper damage parameter is utilized to characterize the multiaxial stress state at the notch tip. Sun et al. [22] incorporated the defect size and FGA size as key parameters into the construction and solution process of the life assessment model based on the theory related to cumulative damage and the plastic zone of the crack tip. In addition, Zhu et al. [23] proposed a strength-altering factor to characterize the effect of defects on the fatigue scatter and size effect. Given the instability of defect size as a single variable, Zhu et al. [24,25] noticed the common effect of defect size and depth on the fatigue behavior of a material and proposed a new fatigue life prediction model by improving the Basquin equation, where the defect depth was considered as an important parameter for local stress correction to reduce the dispersion between the defect feature size and fatigue life. A probabilistic fatigue life prediction model under the size effect was proposed based on the calibrated weakest-link theory (WLT) considering the defect location and size sensitivity [26]. Lan et al. [27] used a three-parameter Weibull reliability model to establish the S–N characteristic error parameters, and a linear fatigue life estimation model that can be applied to arbitrary stress conditions was proposed by deeply incorporating the relationship between the relative size and the relative depth of the initial defects. In addition, considering the failure mechanism, the life model for solving fatigue crack initiation associated with intracrystalline slip bands was proposed by Tanaka and Mura, who concluded that irreversible intergranular dislocation slip under low-strain cyclic loading is the root cause of crack initiation in most polycrystalline metallic materials [28]. The Tanaka–Mura model considers both intuitive defect size and FGA size but does not delve into the coupling relationship between the defect size and depth or the average size effect of defects [29]. Therefore, it is urgent to establish a life prediction model that takes into account the coupling effects of defect size and depth, FGA size, and average defect size.
In this study, the preparation process, microstructure, and mechanical properties of fatigue specimens for titanium alloy welded joints were investigated. The QBG-100 high-frequency fatigue testing machine with a frequency of 100 Hz was used to conduct axial loading fatigue tests under a stress ratio of −1. The characteristics of failure fracture were observed and measured. A fatigue parameter determined by the depth and size of the defect was proposed. A stress correction coefficient related to the S–N characteristics was established by combining fatigue parameters, defect size, and average defect size. Based on this, a fatigue life prediction model considering the dislocation slip failure mechanism was constructed.

2. Materials and Methods

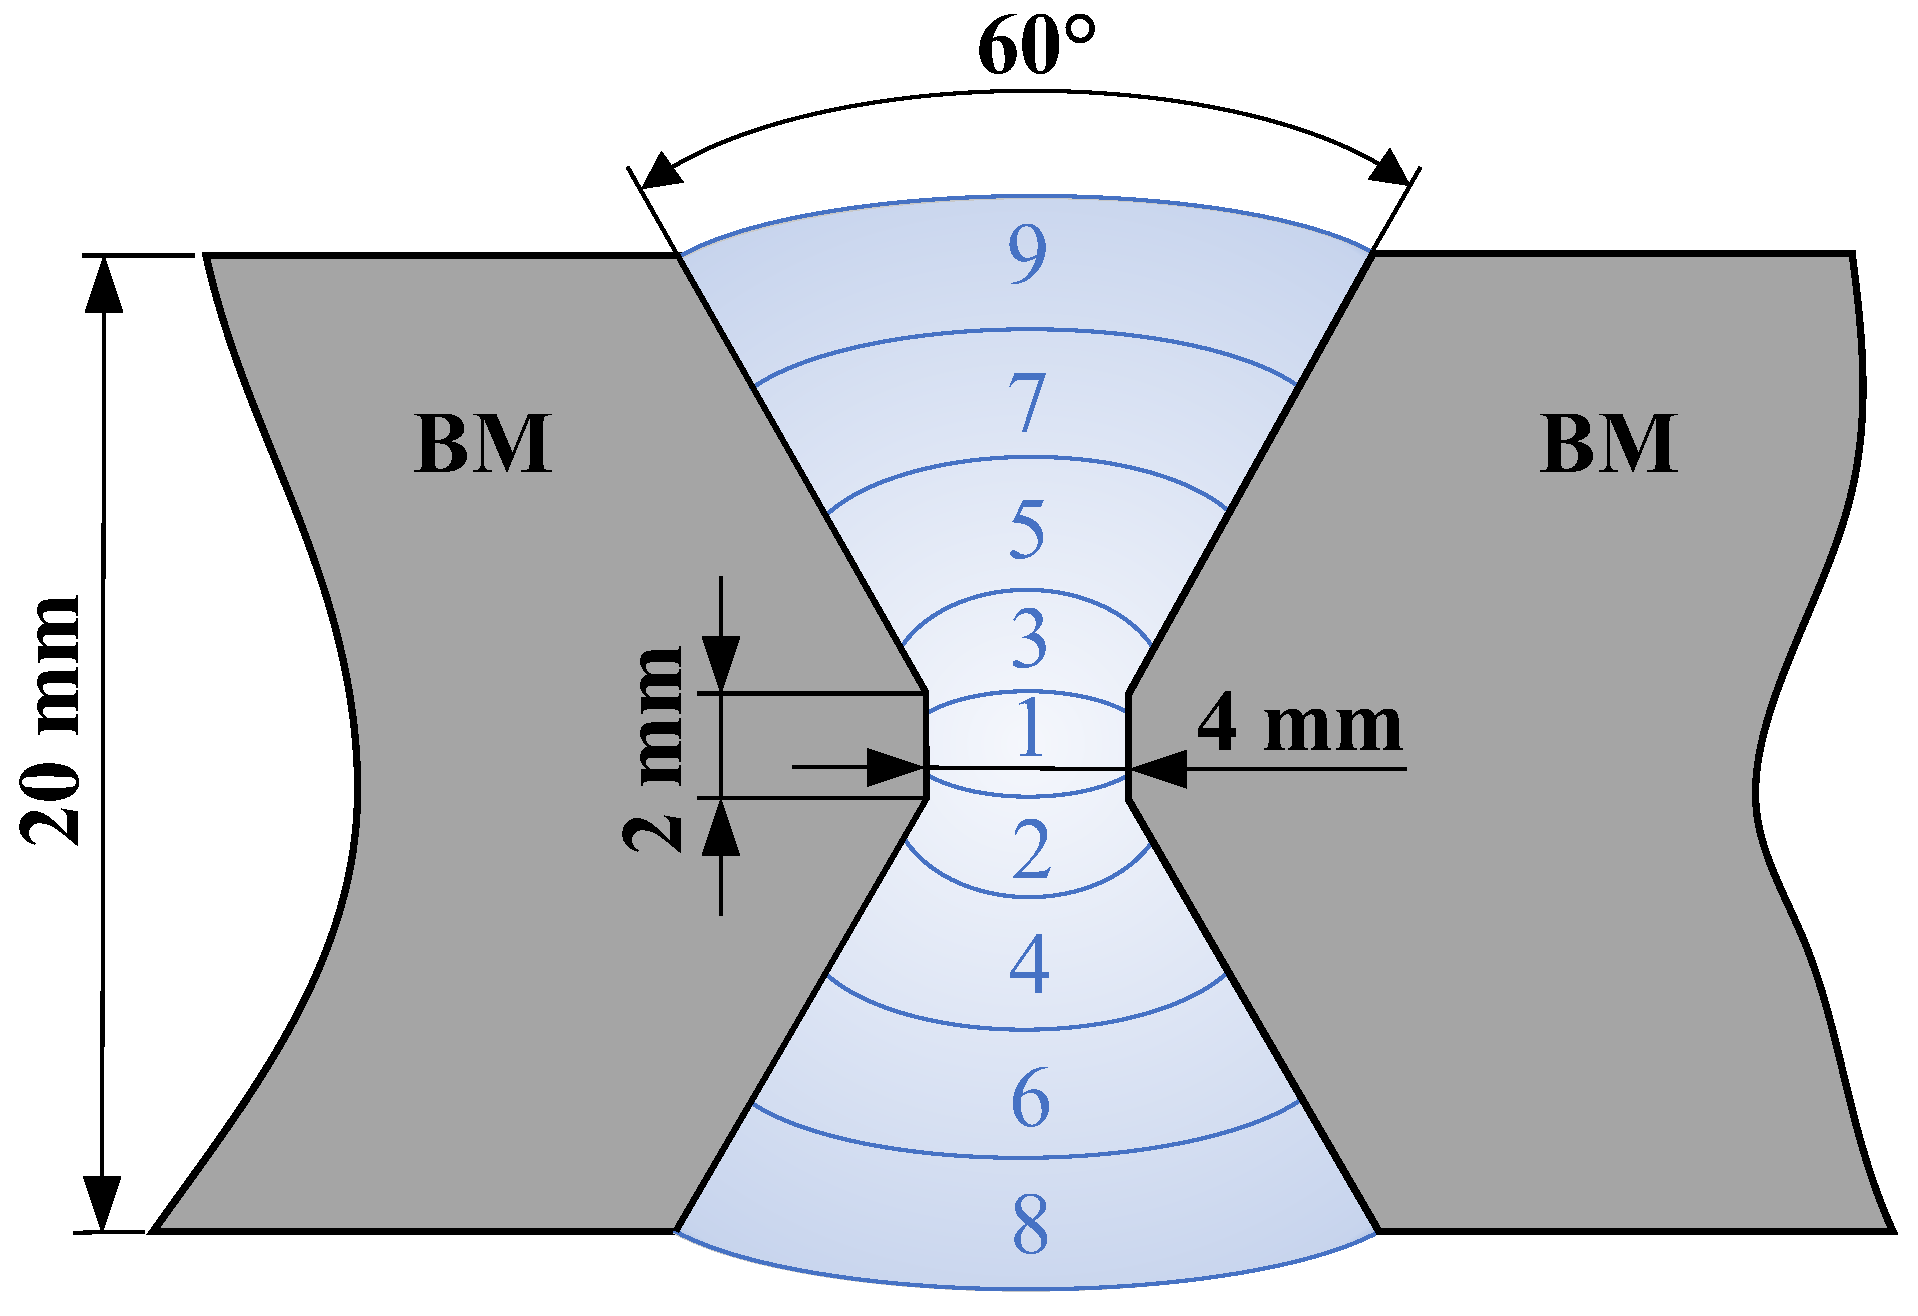
2.1. Welding and Specimen Preparation

Multi-layer manual tungsten argon arc welding was used as the welding method in this study. The base material (BM) and solid wire used for welding were both TC4 titanium alloys whose main chemical compositions are shown in Table 1 and Table 2, respectively. The butt weld seam was in a symmetrical X-shape, with groove parameters and a schematic of weld passes as shown in Figure 1. Based on GB/T13149-2009, the welding parameters were determined based on the material, thickness, and joint form of the welded specimen. That is to say, the specific welding parameters including current, voltage, and welding speed were 135 A, 20 V, and 2.2–3.5 mm/s, respectively. Welding quality can generally be judged by color, with silver white and buff being the best. In addition, based on NB/T 47013.2-2015, X-ray testing was conducted to check for macroscopic defects such as pores, strip defects, lack of fusion defects, incomplete penetration, and cracks. If none are present, the welding quality is acceptable.
Figure 2 provides a schematic illustration of the fatigue specimen sampling locations from TC4 plates after welding. In order to effectively avoid the effect of the surface roughness of the specimen, the transition arc area of the specimen was sequentially sanded and polished axially by using 360–2000 grit sandpaper until the transverse lines perpendicular to the axial direction were beyond what is visible to the naked eye. Based on the size requirements for fatigue specimens in the standard GB/T3075-2008 [30], the final geometry and dimensional parameters of the fatigue specimen are shown in Figure 2, where the black part represents the weld zone.

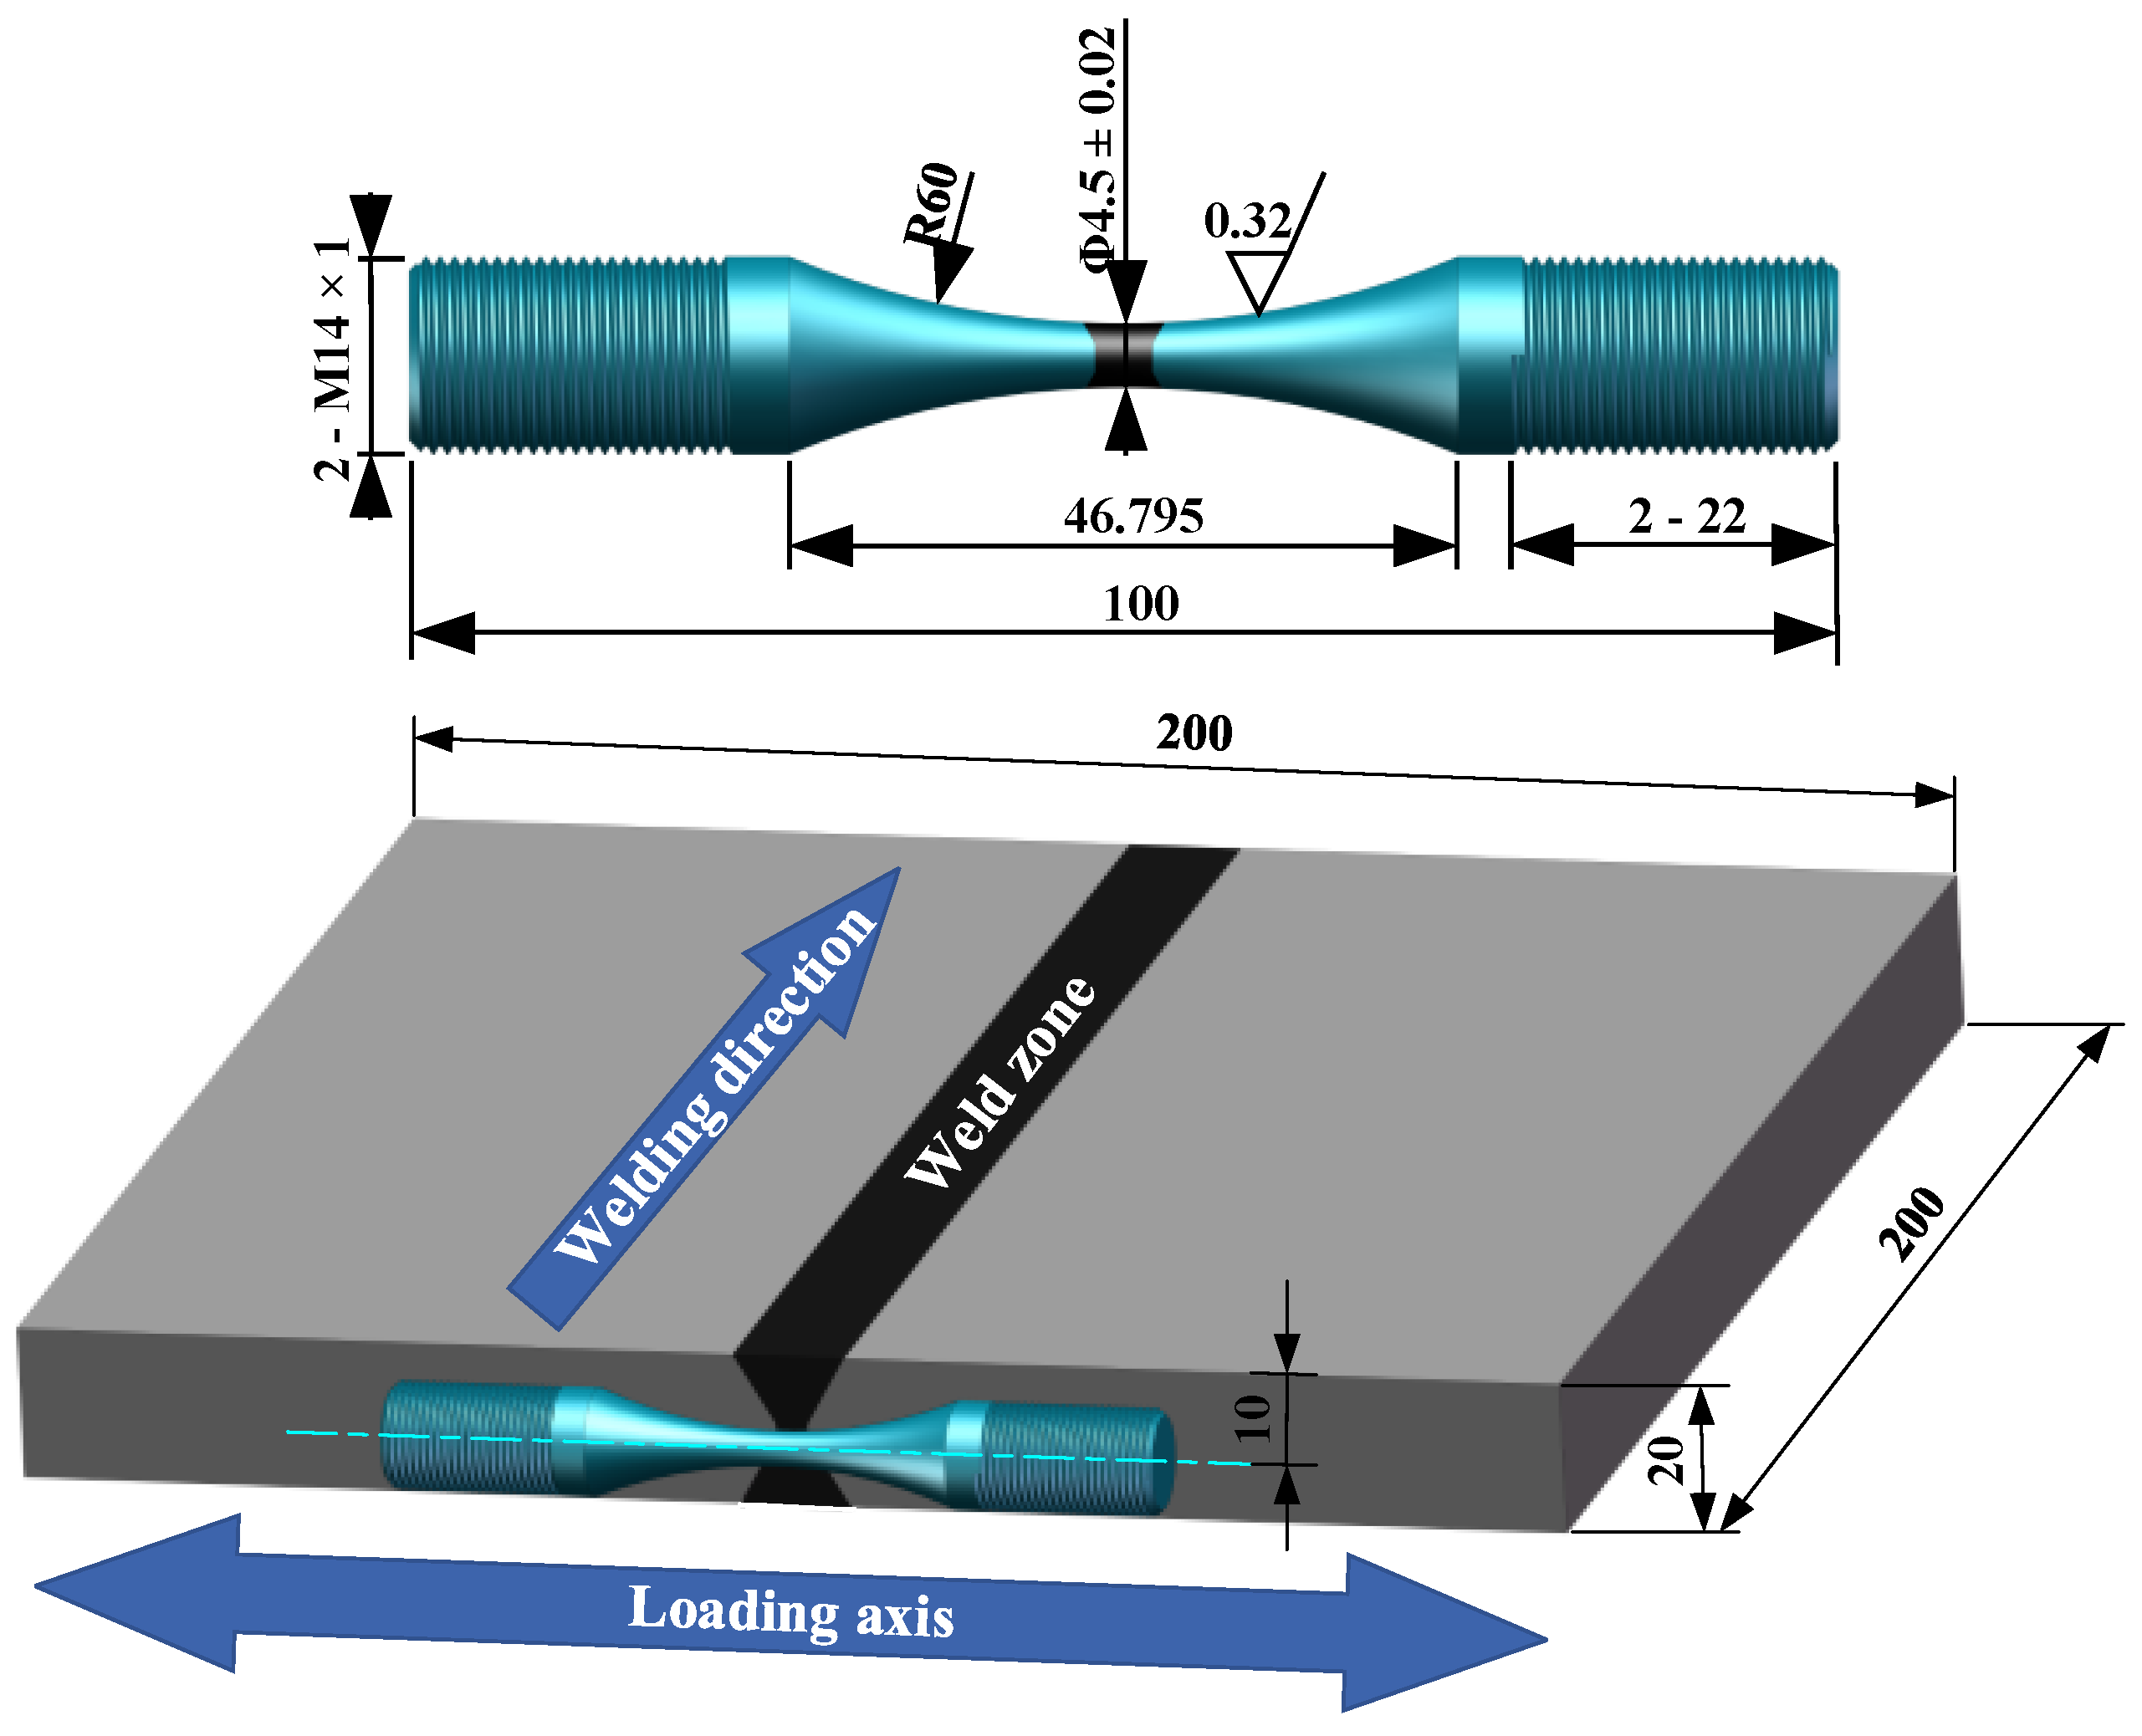
2.2. Specimen Preparation

Perpendicular to the welding direction, the metallographic specimens of the fatigue specimens were intercepted by using wire-cutting equipment (Taizhou Tengfeng CNC Equipment Co., Ltd., Taizhou, China). The surface of the metallographic sample was ground and polished with 360-2000# abrasive papers in sequence, and then the small scratches on the surface and the residual stresses generated during machining were eliminated by thePI100 electrolytic polishing apparatus (Leibo Scientific Instrument Co., Ltd., Jiangyin City, China). Finally, the metallographic specimen was etched with Kroll solution and the microstructure composition of the welded joints was observed through an Axio Vert. A1 metallographic microscope.

2.3. Fatigue Testing Method

Under constant amplitude loading conditions, the specimens were subjected to axial fatigue loading tests by using a high-frequency fatigue testing machine (QGB-100, Changchun Qianbang Testing Equipment Co., Ltd., Changchun, China) with a stress ratio (R) of −1. The loading frequency of the fatigue test was maintained at 100 ± 2 Hz with a stress amplitude range of 400–450 MPa. All fatigue tests were conducted in a well-ventilated room at ambient temperature to avoid interference with the test results from external factors. Furthermore, the tests were maintained without interruption until the specimen failed completely or the number of loading cycles reached 108.

3. Results and Discussion

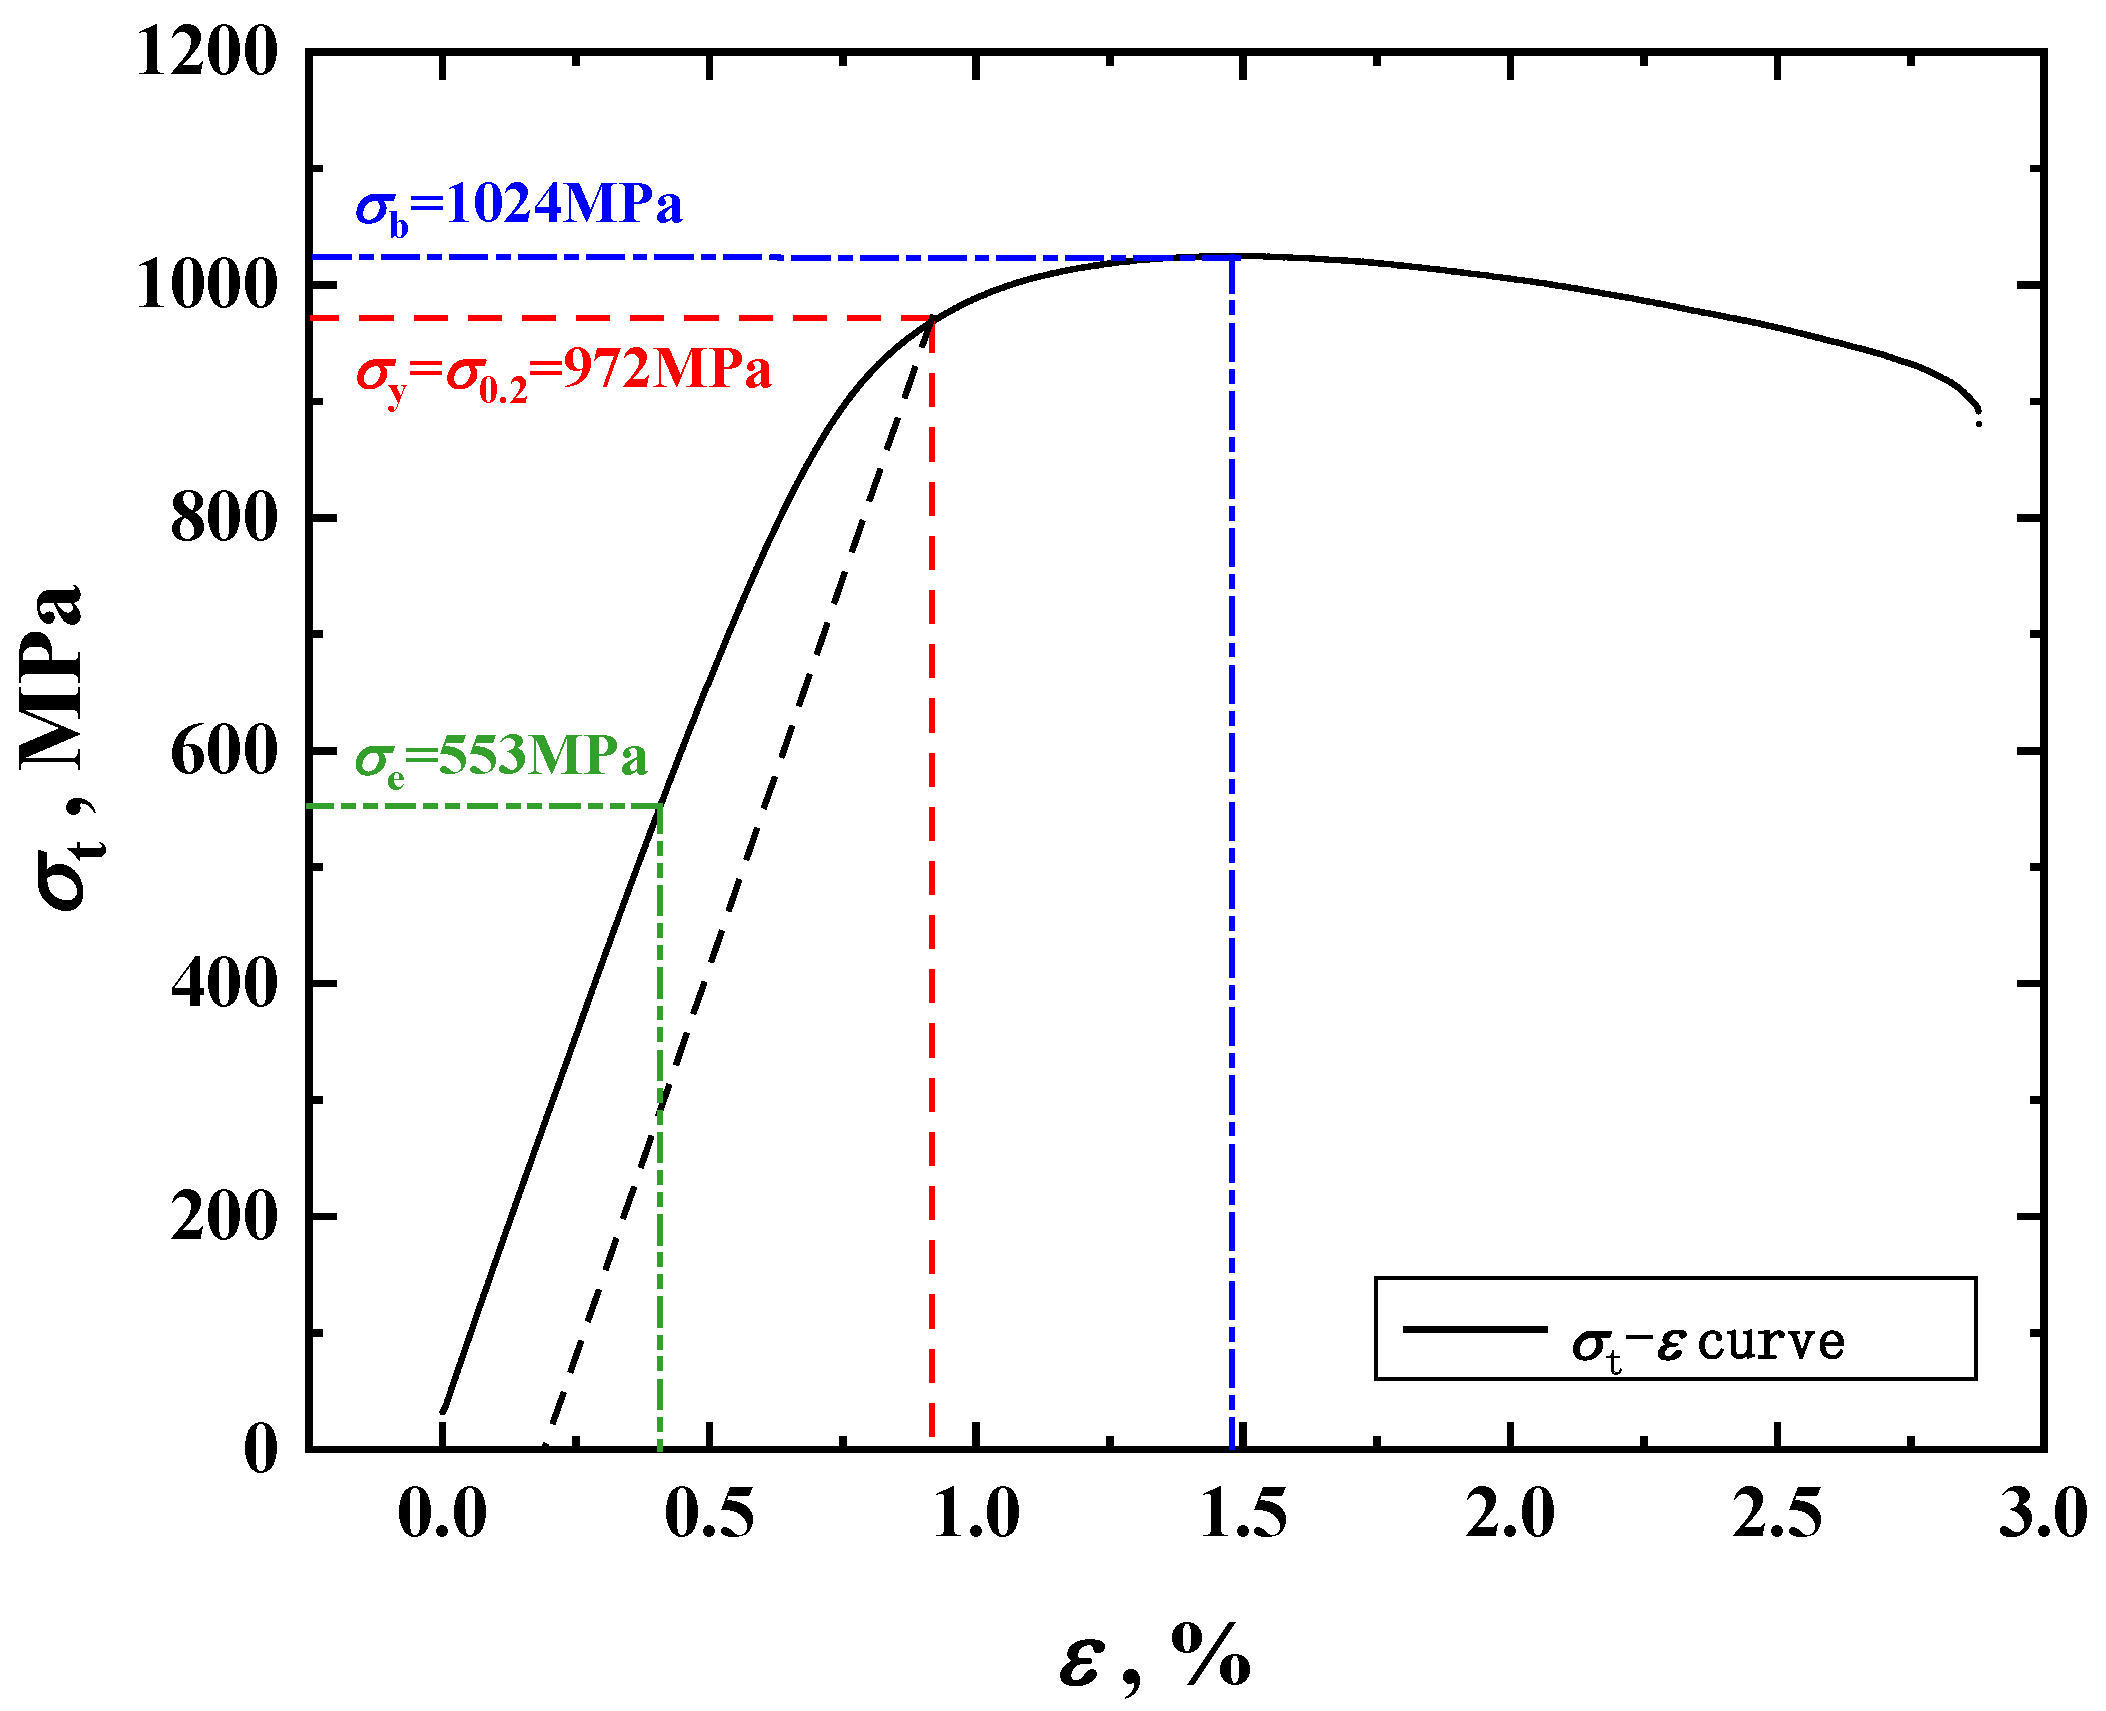
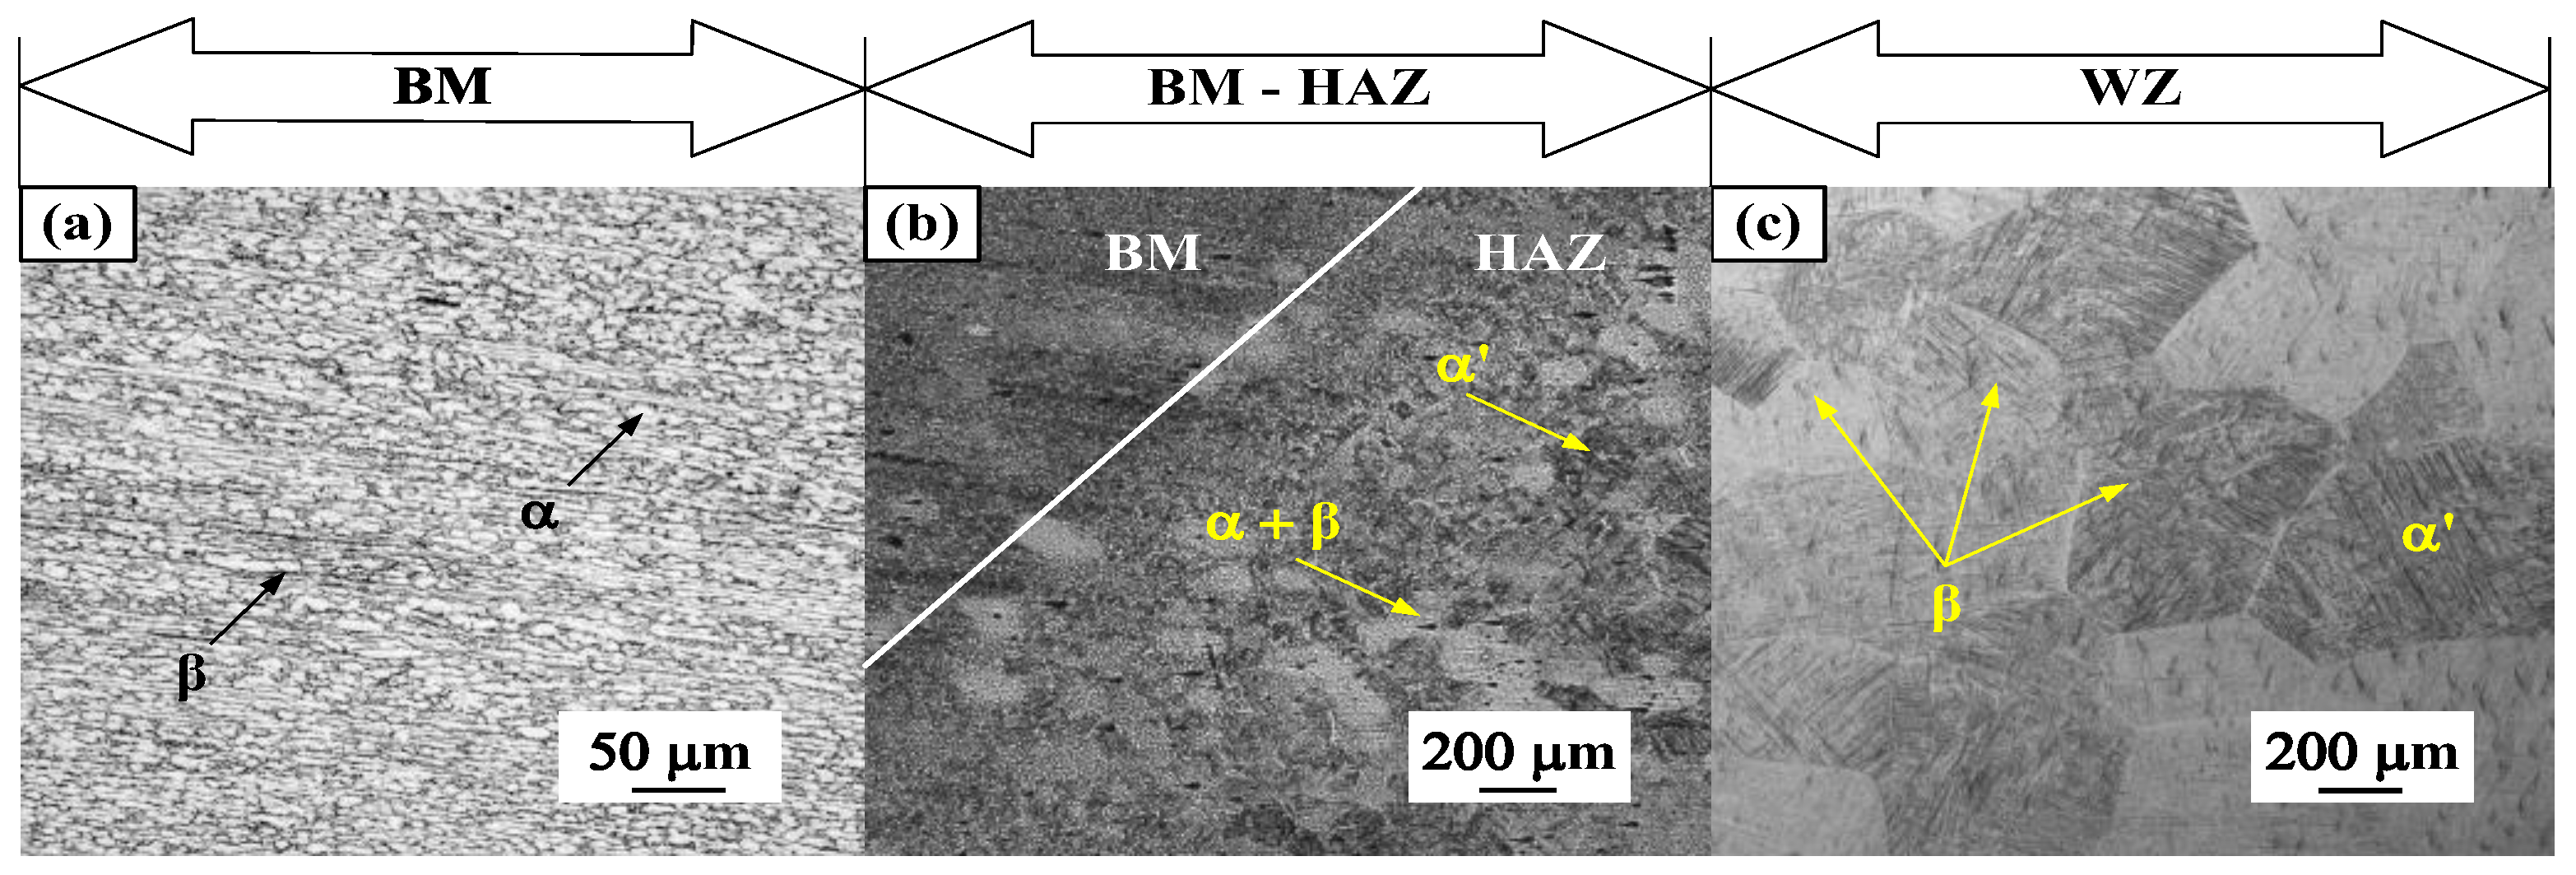
3.1. Microstructure and Mechanical Properties

In relation to the different distances to the center of the melt pool, uneven heat input and the cooling rate result in significant discrepancies in the microstructure and grain size of the weld zone (WZ), heat-affected zone (HAZ), and BM. In detail, the BM is composed entirely of staggered primary α phase and primary β phase, which exhibit the typical microstructure morphology of a dual-phase titanium alloy with minimal grain size, as shown in Figure 3a. As can be seen in Figure 3c, the formation condition of the β phase was satisfying in all parts of the melt pool during extremely high temperatures, which led to the complete transformation of the primary α phase inside the WZ into β phase. During the subsequent rapid condensation process, the gross β grains in the melt pool gradually took shape, accompanied by a large number of needle-like α’ martensite arranged in a selective orientation inside the individual β grains, which can be seen in Figure 3c, as well as a clear β grain boundary and a net basket-like α’ layer, and the grain size in this region was significantly larger compared to Figure 3a,b. In the HAZ between the BM and WZ, only part of the α phase underwent transformation into the β phase. In addition to the α’ formed inside the β grain during the cooling phase, a large number of primary α phases with staggered distribution can be seen that have not undergone phase transformation, as shown in Figure 3b.
Static tensile tests were carried out at room temperature and atmospheric pressure by using a WDW-100 electronic universal testing machine with a tensile rate of 5 mm/min; the results are shown in Figure 4. The yield strength σy, tensile strength σb, and elastic limit σe obtained are approximately 972 MPa, 1024 MPa, and 553 MPa, respectively. The elastic modulus E obtained from the stress–strain relationship in the elastic stage is 128 GPa.

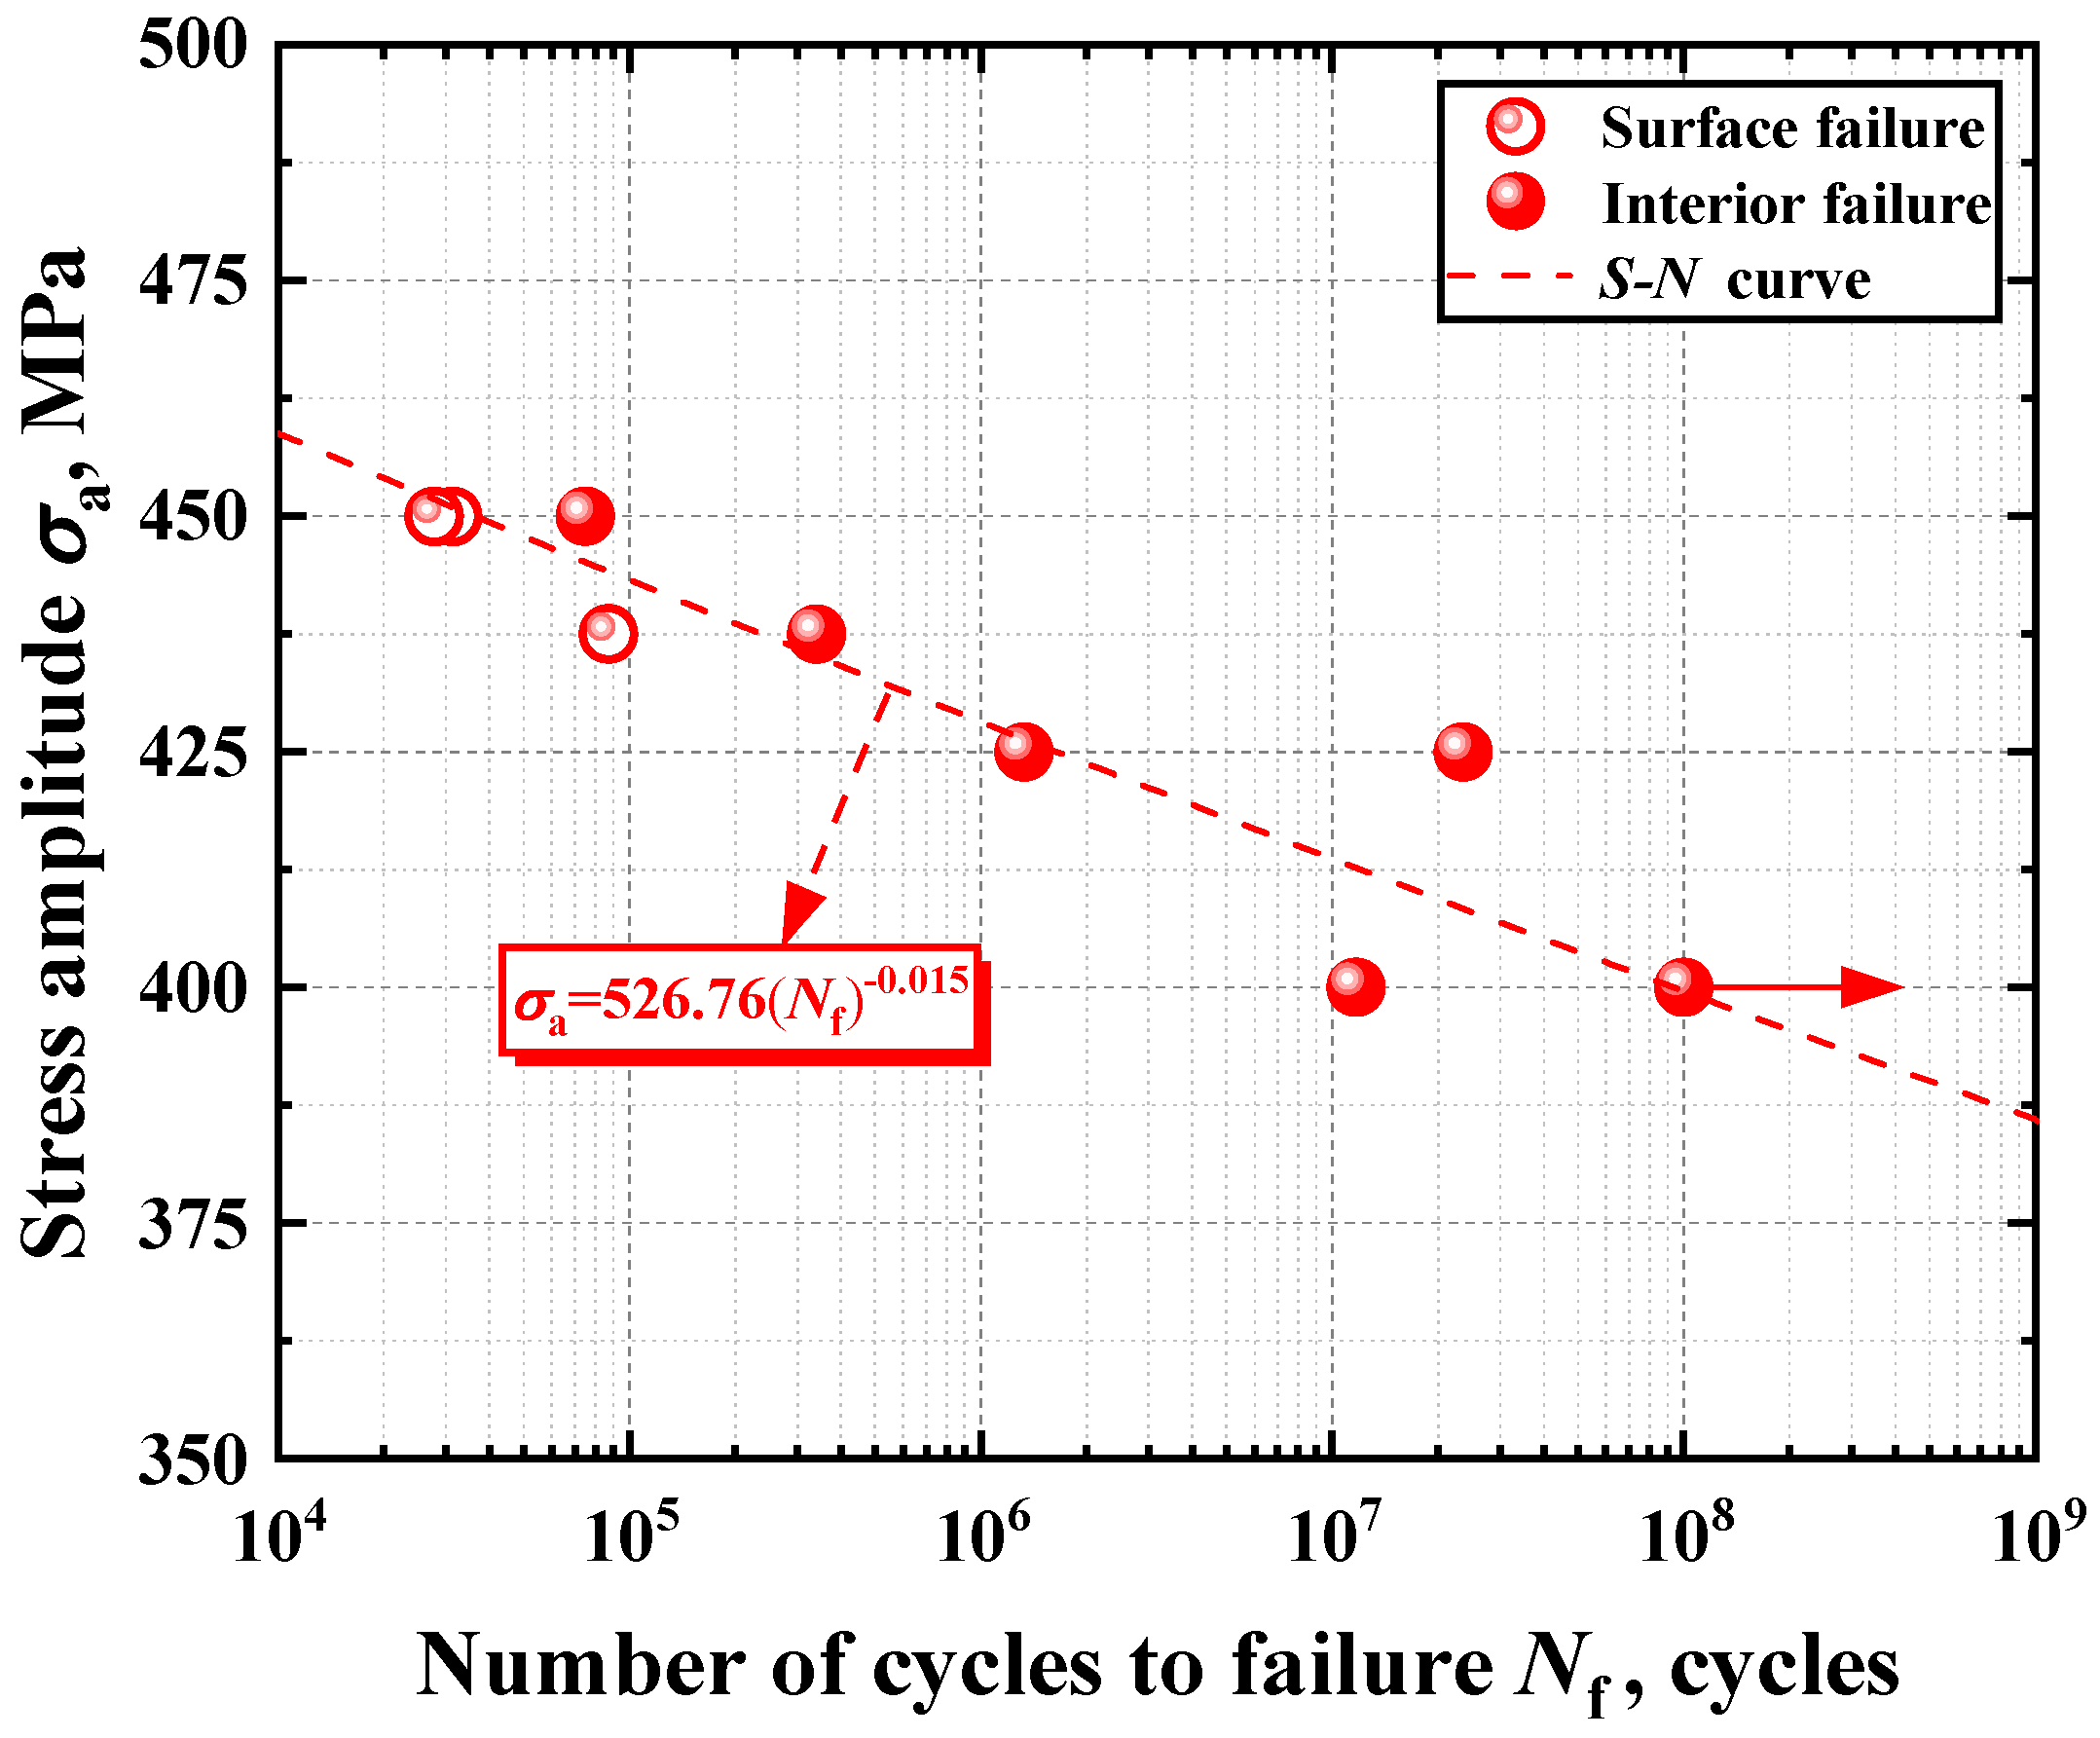
3.2. S–N Characteristics

Figure 5 shows the relationship between the stress amplitude and fatigue life of the titanium alloy welded joints in the case of R = −1. Obviously, the fatigue life of all specimens was between 104 and 108 cycles in the applied stress range and limited by time and cost; the test points where fatigue life reached 108 but no failure occurred are marked with arrows in the figure. According to the S–N curve, it can be clearly seen that the fatigue life continued to increase as the applied load level decreased, and the cycles of 107 cannot serve as a critical value to terminate the failure phenomenon, indicating that there is no conventional fatigue limit here for titanium alloy welded joints. In the high-stress region, the distribution of data points of titanium alloy welded joints was relatively concentrated. In the low-stress region, the distribution of the data was relatively scattered. This may be due to the uneven size distribution of the internal defects inside the specimen under low stress. This phenomenon will continue to be discussed.
Based on the observation results of crack initiation location using a scanning electron microscope (SEM), the failure modes can be classified into two types: interior failure and surface failure. Specifically, in the high-stress region with a fatigue life of fewer than 105 cycles, fatigue failure caused by surface crack sources dominated; while in the low-stress region where the fatigue life exceeded 105 cycles, the fatigue crack sources were all located inside the specimen and surrounded by FGA, due to the limitation of the surface crack propagation threshold. Therefore, 450 MPa can be considered as a transitional stress from surface failure to interior failure. Based on the Basquin empirical equation, the relationship between the applied stress and fatigue life can be determined by σa = ANb, where A is 526.76 and b is −0.015, as shown by the red dashed line in Figure 5. In addition, this study defines the stress amplitude corresponding to the S–N curve at 108 cycles as the fatigue limit of titanium alloy welded joints, thus the fatigue limit σw is 399.6 MPa for R = −1.

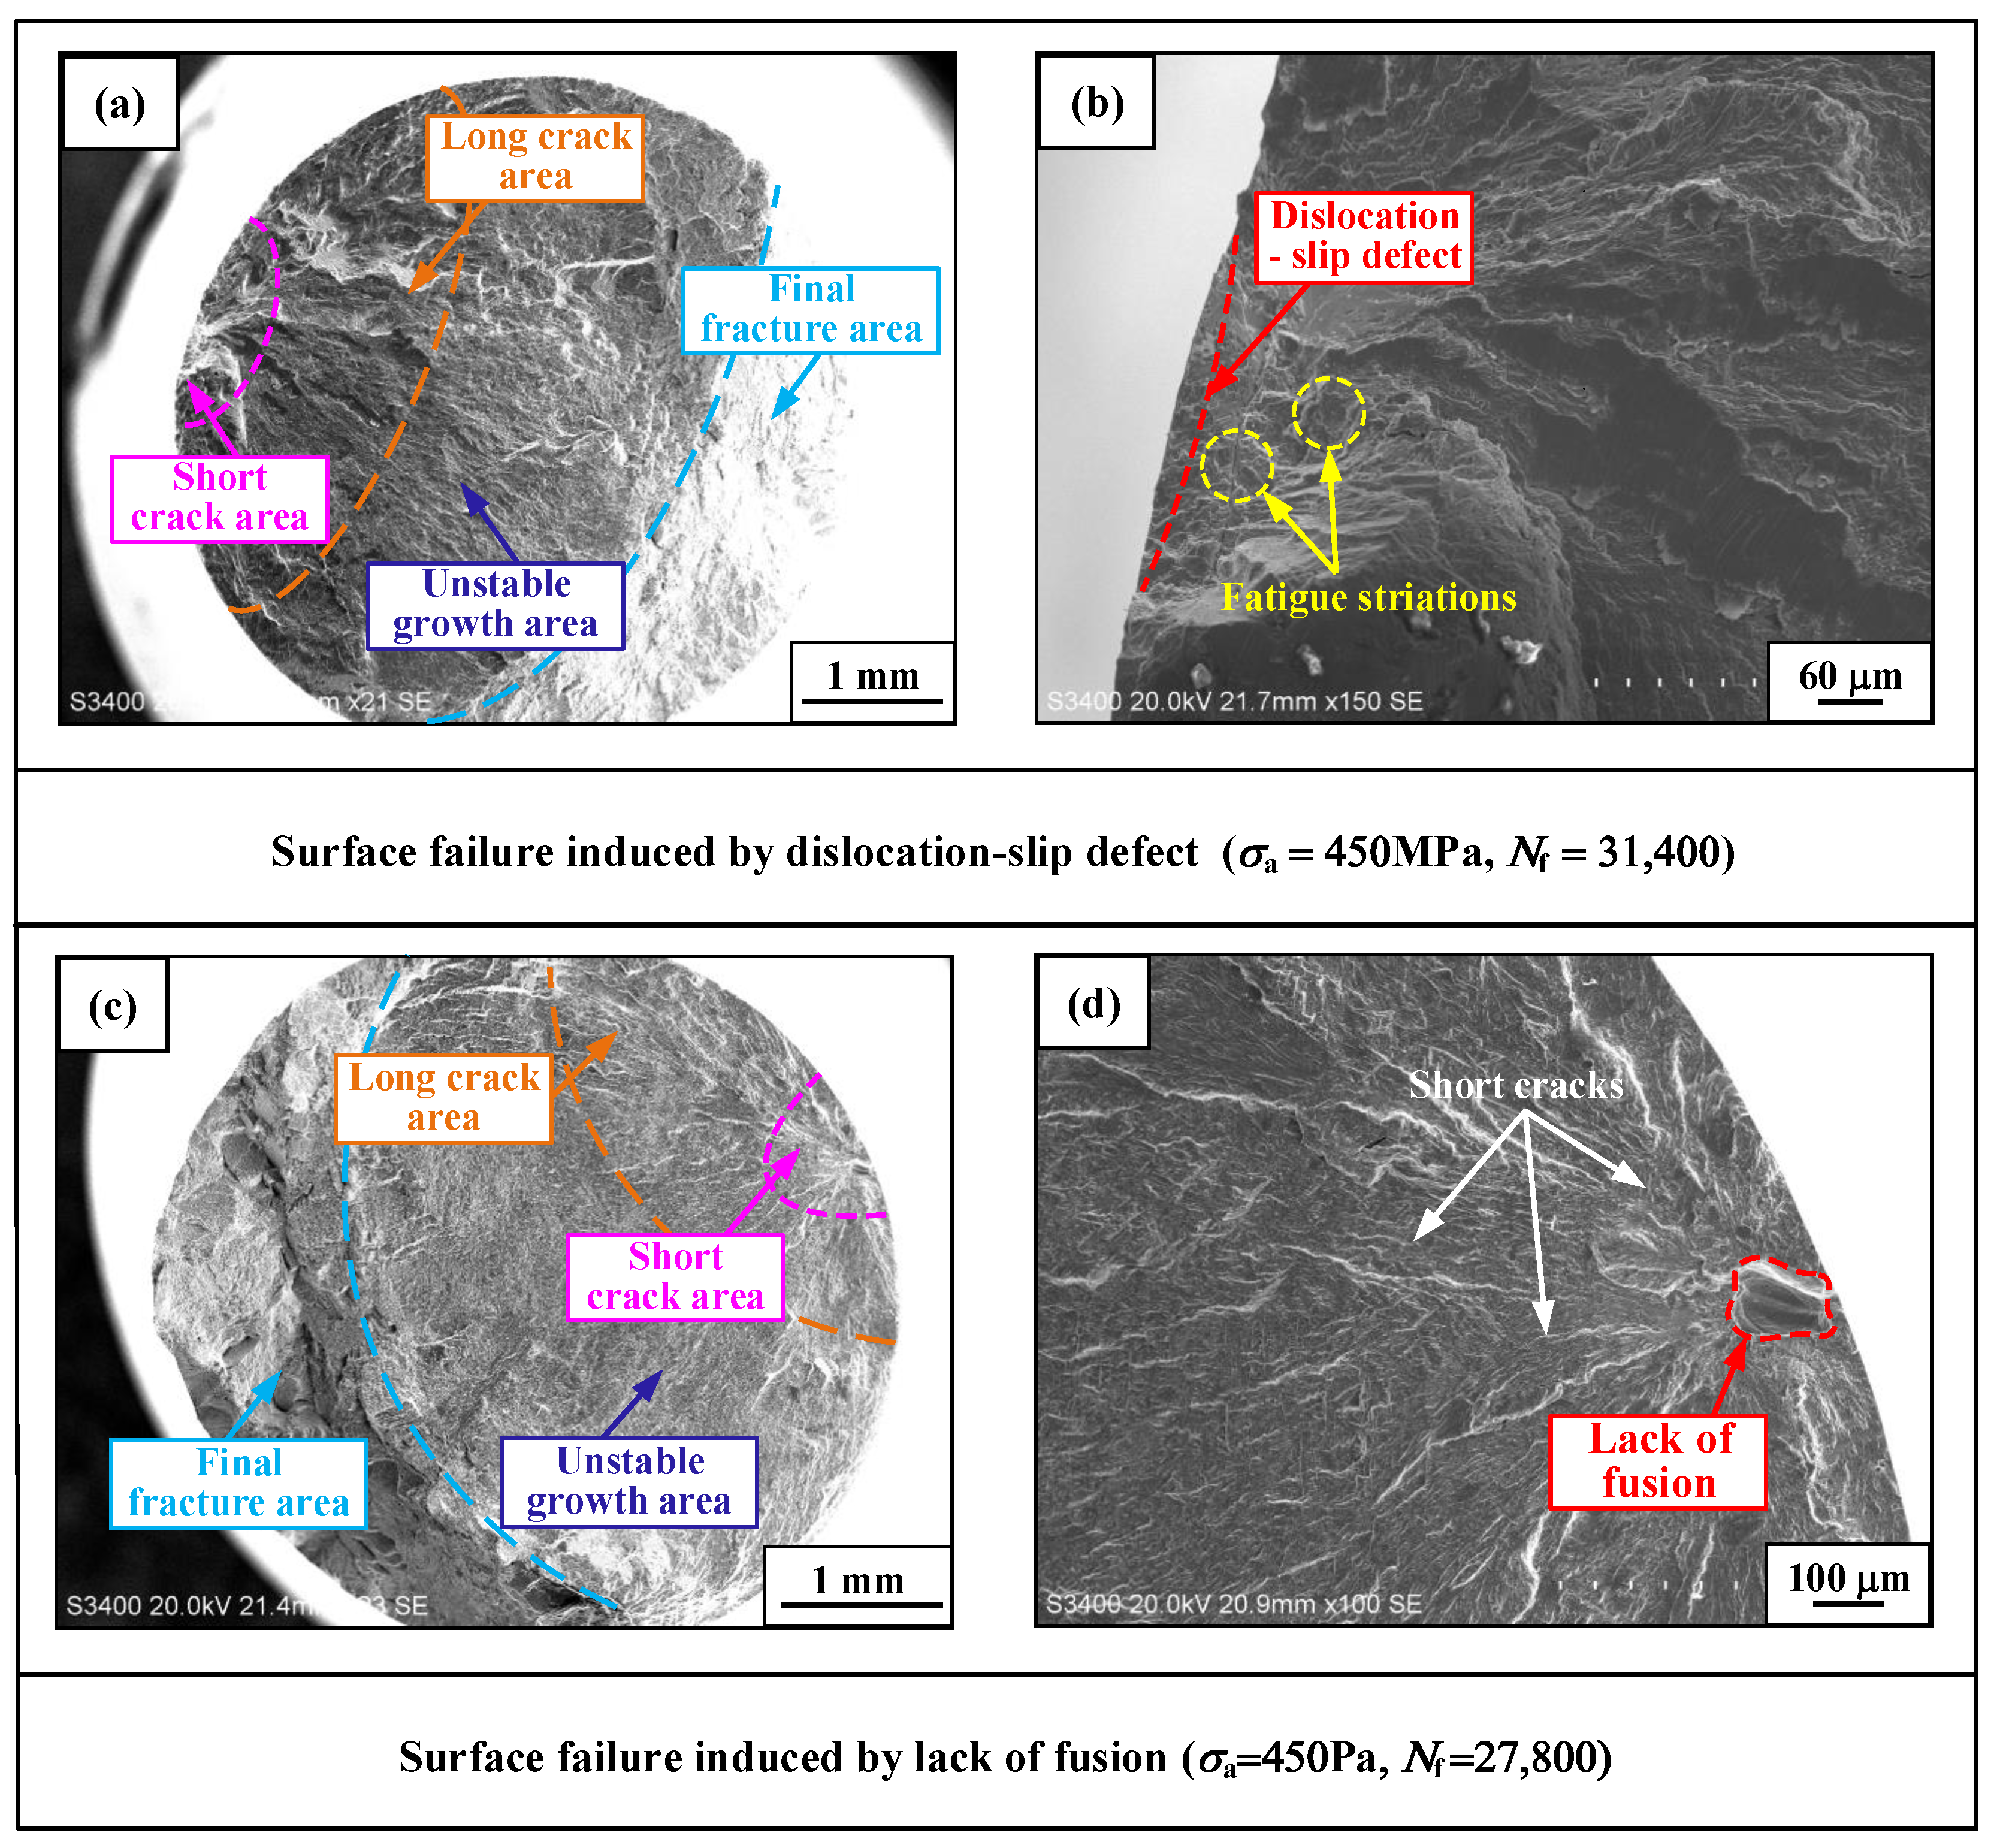
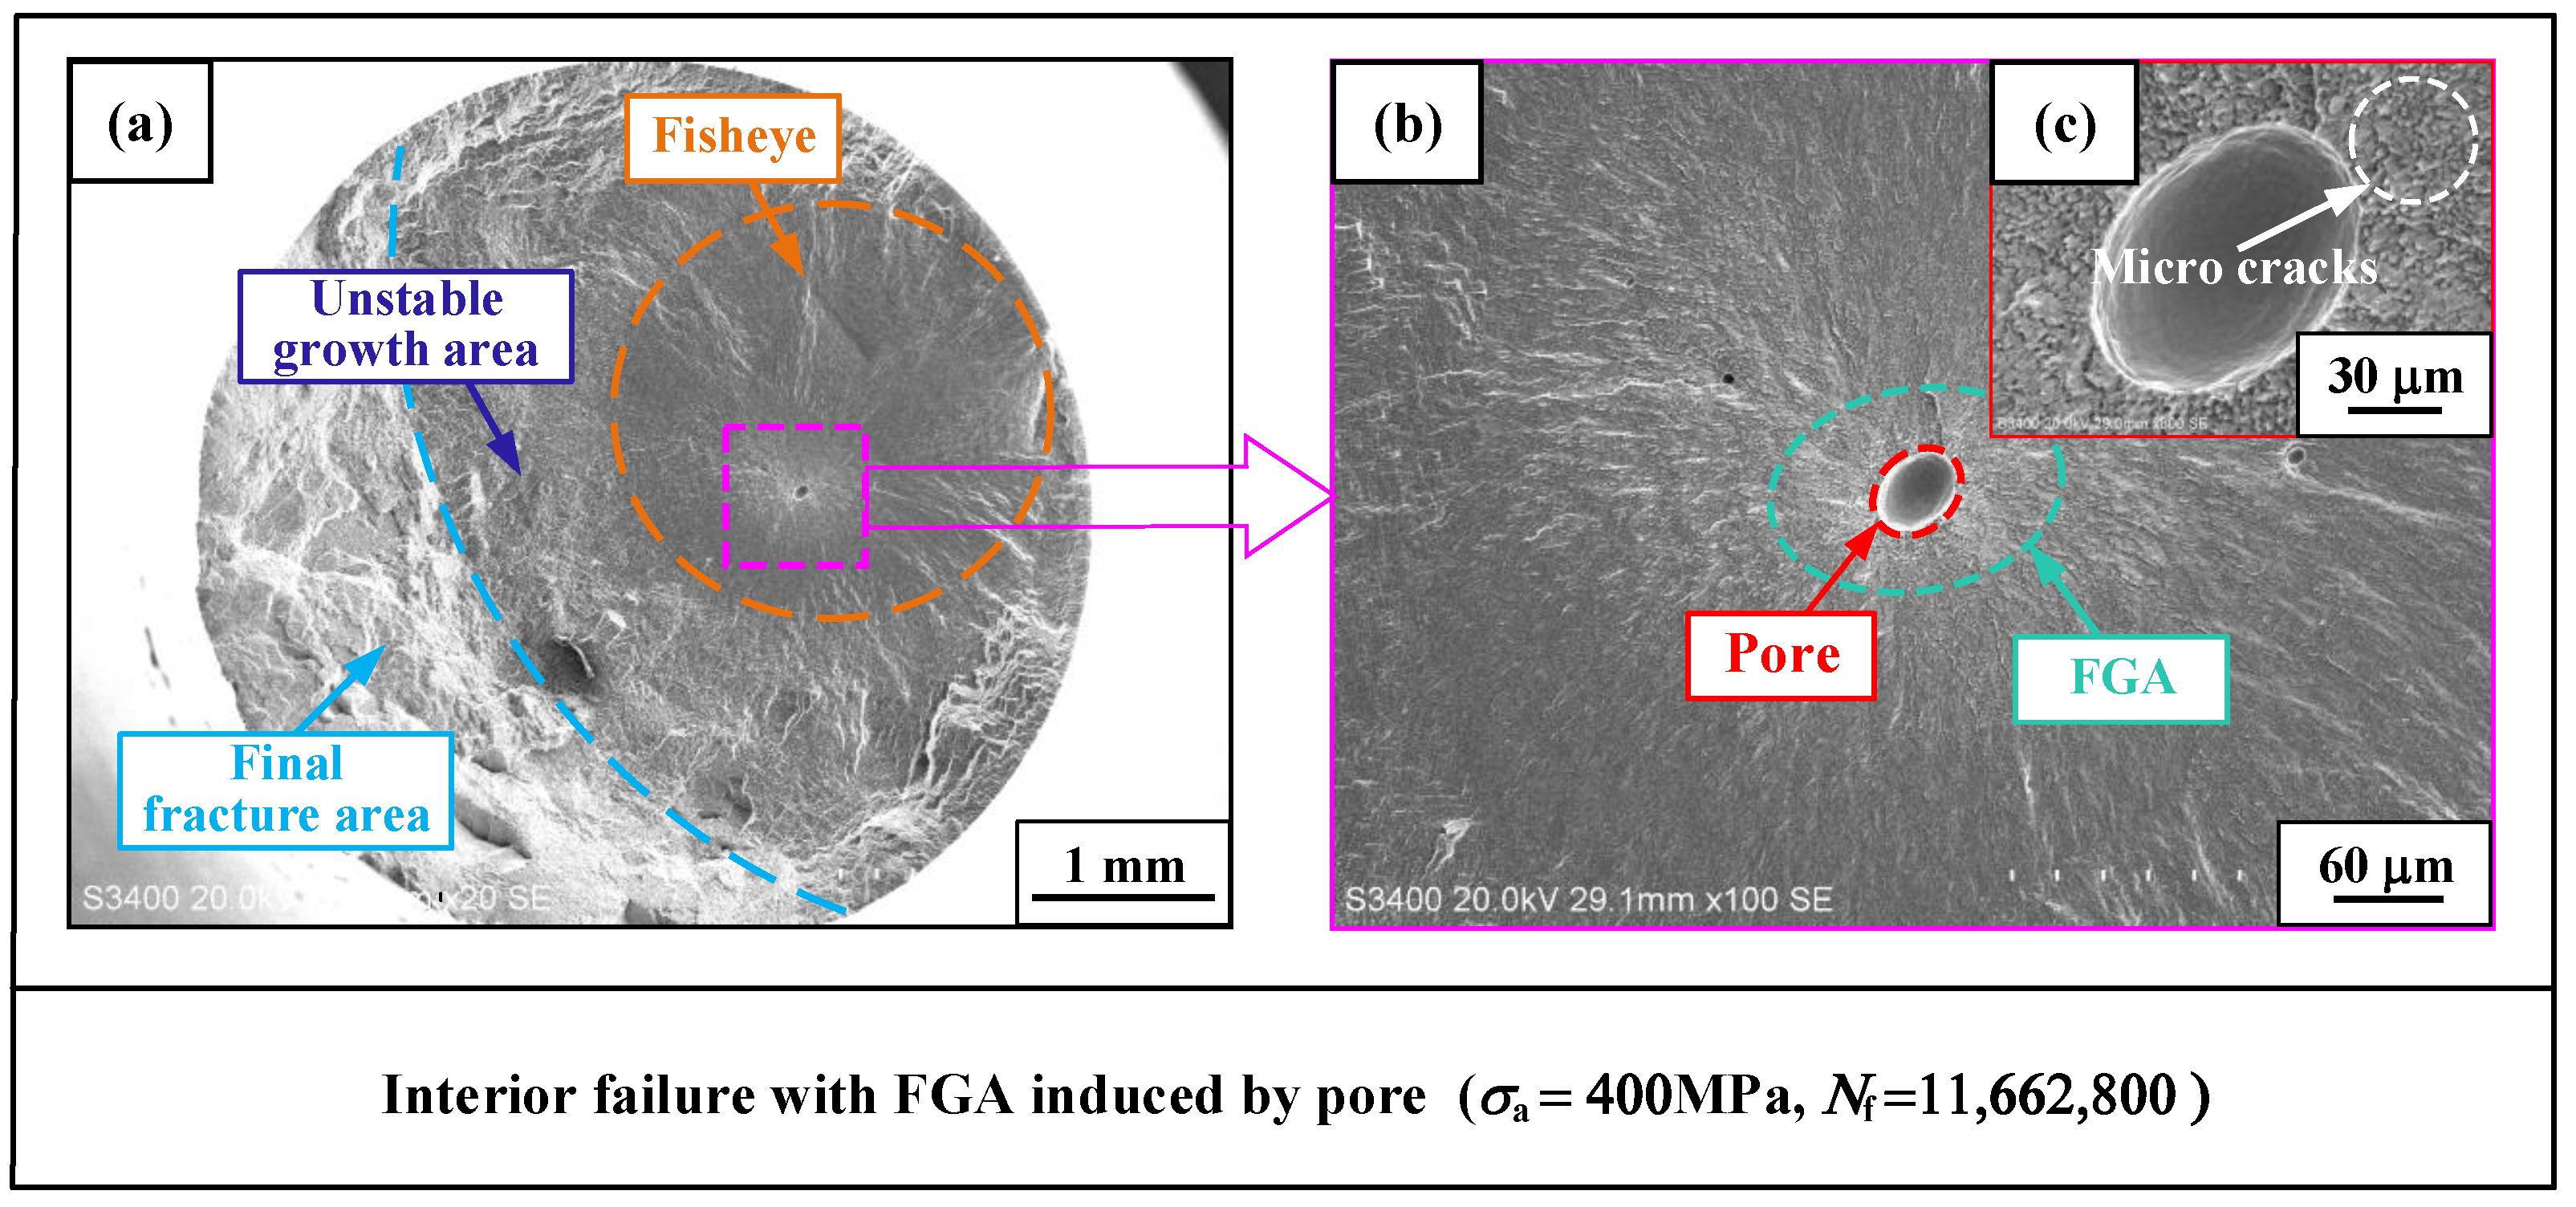
3.3. Typical Fracture Observation

Combined with the SEM observations, it was found that all crack sources causing fatigue failure can be divided into three types, including dislocation–slip defects, pores, and irregular lack of fusion, which can be collectively referred to as fatal defects. It is worth noting that the nucleation phenomenon of cracks induced by pores is only found in interior failure, while surface failure corresponds to the other two types of fatal defects. Figure 6 and Figure 7 show the overall and local fracture characteristics in detail for the two failure modes mentioned above.
In surface failures, higher cyclic loads tend to cause dislocation and slip at locations on the surface of materials, followed by crack initiation and extension at the resulting individual extrusion peaks or intrusion grooves. Meanwhile, compared to dislocation–slip defects, the severe stress concentration caused by lack of fusion on the surface may lead to a lower threshold for crack propagation around it, thus, surface fatigue failure may also be caused by lack of fusion. Taking the surface fatal defect as the center, the four typical areas are as follows: short crack area, long crack area, unstable growth area, and final fracture area, as shown in Figure 6a,c. In Figure 6b, obtained by further enlarging the crack source region in Figure 6a, some obvious fatigue striations can be found near the dislocation slip defect which are closely related to the failure process mechanism associated with the slip. In Figure 6c, the surface failure induced by lack of fusion does not show the obvious traces left by dislocation and slip, but a large number of short crack features centered on the defect and radiating to the interior of the specimen can be observed in the vicinity of the fatal defect.
Compared to the surface, it is noteworthy that the fatal lack of fusion, determined by the manufacturing process, does not appear in interior failure. By focusing on the local magnification features near the fatal defect, the white rough area attached around the defect, i.e., the FGA, can be seen in Figure 7b. The typical characteristic regions formed around fatal defects can be divided into four parts: the FGA, fisheye, unstable growth area, and final fracture area, as shown in Figure 7a. Further enhancing the SEM magnification, a large number of micro-cracks inside the FGA can be observed in Figure 7c, which are directly related to the cyclic local stress around the fatal defect. In addition, dense step morphology can be seen in Figure 7c, so it can be assumed that the cracks are heavily affected by the microstructure with a high degree of deflection, which directly leads to the formation of the rough morphology inside the FGA. In fact, the unique micro-crack initiation mechanism within the FGA can determine a higher upper limit of fatigue life.

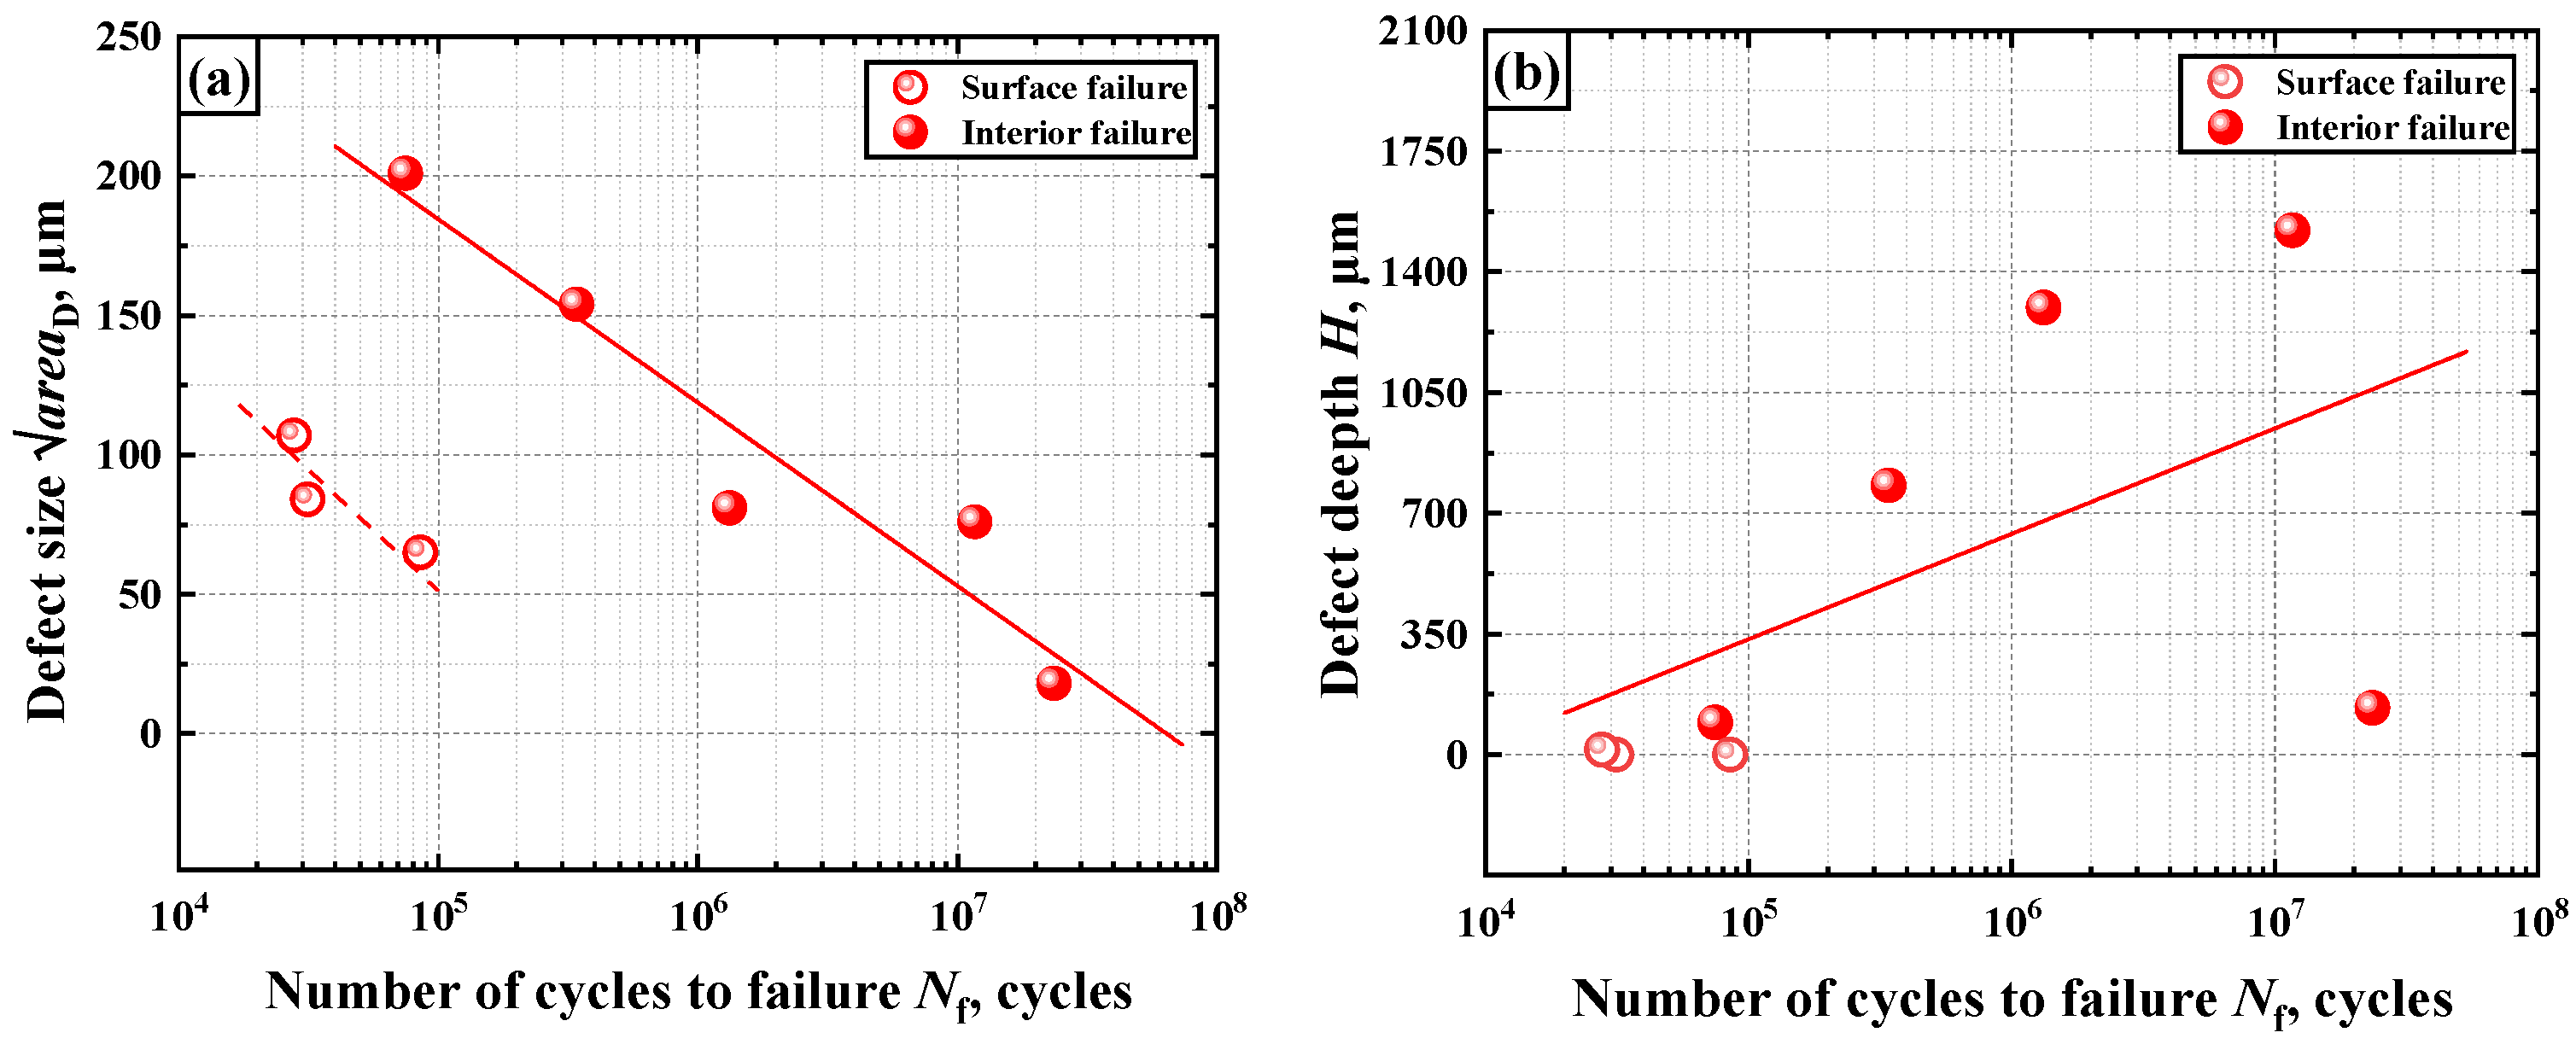
3.4. Crack Characteristic Size

In view of the fact that fatigue failure is always caused by fatal defects, it is necessary to study the impact of major characteristic parameters including the size and depth of fatal defects on fatigue life. The size of the fatal defect can be expressed using the Murakami parameter, √areaD, which is defined as the square root of the projected area of the fatal defect in the plane perpendicular to the principal stress axis. Moreover, the shortest distance between the critical defect boundary and the free surface of the specimen is defined as the critical defect depth, which is expressed by H. The specific schematic diagram of defect size √areaD and defect depth H is shown in Figure 8.
The relationship between the defect size and depth with fatigue life obtained through Image-Pro Plus measurement software is shown in Figure 9a,b, respectively. As can be seen from Figure 9a, the defect size widely ranges from 18 to 201 μm, which is related to the inherent properties of welding manufacturing processes. Special attention should be paid to the fact that the peak of the interior defect size distribution is higher relative to that of the surface defect. For surface failure induced by a lack of fusion, the existence of potentially larger defect sizes cannot be ruled out due to the limited number of specimens tested. In the study by Zhu et al. [24], it was found that fatigue life tends to show an extended trend as the size of fatal defects decreases. This finding is in good agreement with the present study, regardless of surface or interior failure, despite differences in materials and test conditions. However, the good negative correlation between the fatigue life and fatal defect size in this study makes it difficult to achieve integration without distinguishing between the two failure modes, as fitting data points for interior and surface failure in parallel leads to obviously poor goodness, so further investigation of the influence law of the failure mode on fatigue life is necessary.
Generally, the definition of surface and interior failure is directly associated with the depth of fatal defects. In Figure 9b, the distribution of fatal defect depths covers the range of 0–1520 μm and has a large span of values. Meanwhile, although the data points exhibit singularity in the long-life region, they do not affect the overall trend of increasing fatigue life with increasing fatal defect depth. In addition, the dispersion of fatal defect depths is much greater in the long-life region above 105 cycles than in the short-life region, suggesting crack initiation at more random locations within the specimen; nevertheless, the probability of fatal defects being far from the surface is still relatively greater in the interval of long fatigue life.
λ = H a r e a D
The relationship between the λ and fatigue life is shown in Figure 10. Three test points are in the short-life region below 105 cycles, where all values of λ are less than 1. Relatively, within the long-life region, all test points are located above the control line of λ = 1. In addition, the area of λ < 1 covers all test points of surface failure, while 80% of the interior failure test points have λ values that are greater than 1. Overall, the control line of λ = 1 shows good generalization for both short and long-life regions as well as for the distribution of data points under different failure modes. In addition, the linear relationship between the fatigue parameter λ, which is jointly determined by the depth and size of the fatal defect, and the fatigue life is significantly tighter, and the linear trend of increasing values of λ with increasing fatigue life becomes more intuitive.

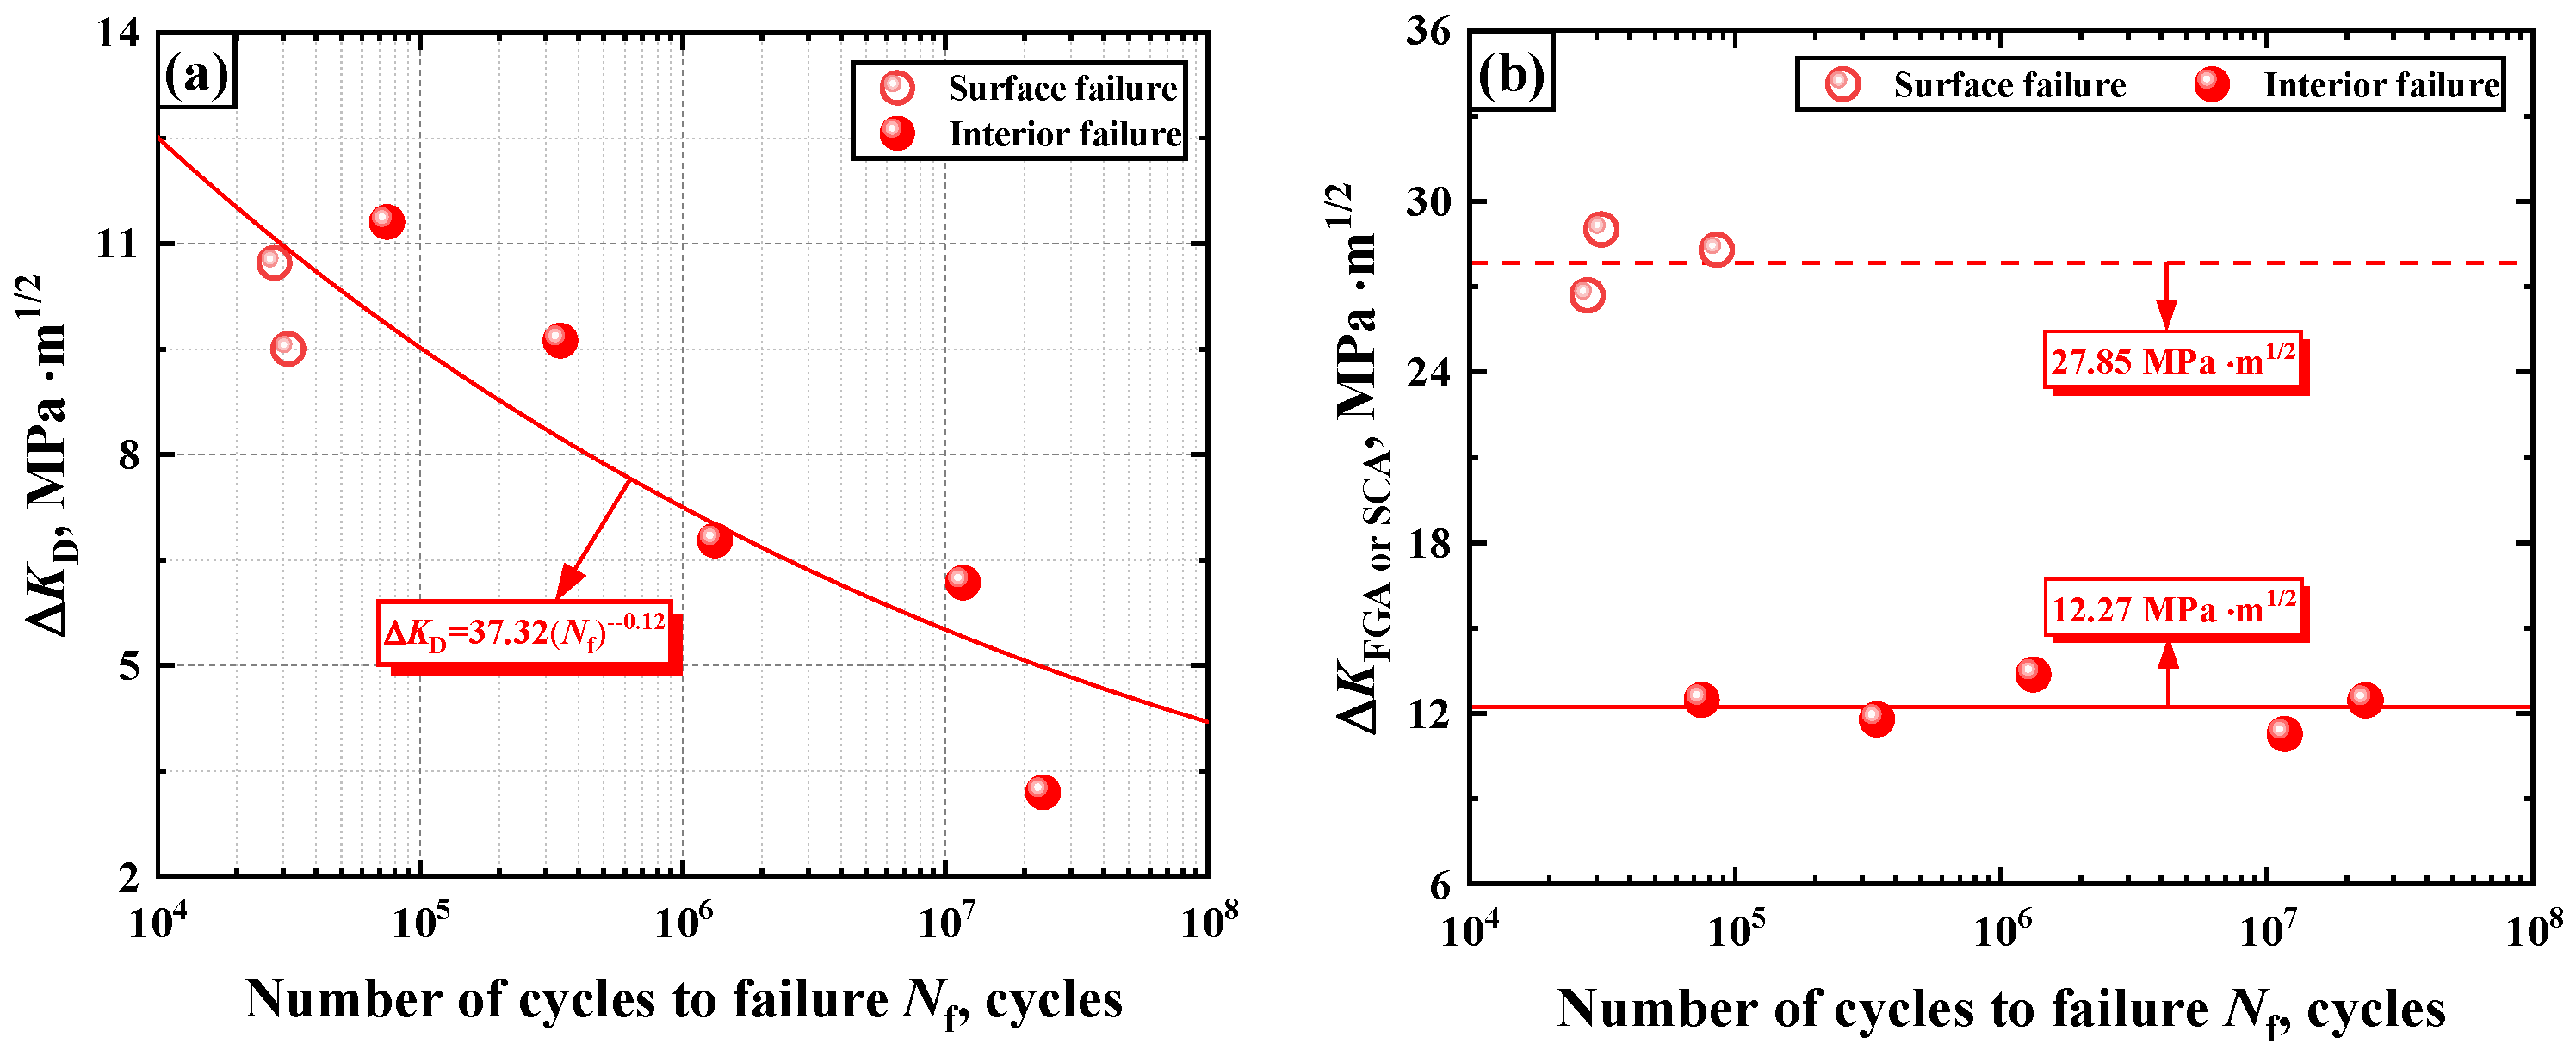
3.5. Evaluation of Stress-Intensity-Factor Range

In accordance with the relevant theory of fracture mechanics, the stress-intensity-factor range for fatal defects, the FGA, or short crack area can be expressed using the Murakami equation as follows [20]:
Δ K D ,   FGA   or   SCA = Y Δ σ π a r e a D ,   FGA   or   SCA
where Δσ denotes the applied stress range and Y is a dimensionless parameter; the values for Y are taken as 0.5 and 0.65 for interior failure and surface failure, respectively. Referring to Equation (2), the relationship between the range of stress intensity factors and fatigue life is shown in Figure 11.
As can be seen in Figure 11a, the ΔKD for fatigue failure induced by an interior defect is distributed in the range of 3.20–11.31 MPa∙m1/2, while the corresponding ΔKD for surface failure is distributed in the range of 9.50–10.73 MPa∙m1/2. It is clear that the values of ΔKD exhibit a decreasing characteristic with the increase of fatigue life, which is not limited by the failure modes. In Figure 11b, ΔKFGA and ΔKSCA are dispersed within a quite limited range, therefore they can be considered as fixed constants independent of fatigue life where the mean values of ΔKFGA as well as ΔKSCA are 12.27 MPa∙m1/2 and 27.85 MPa∙m1/2, respectively.

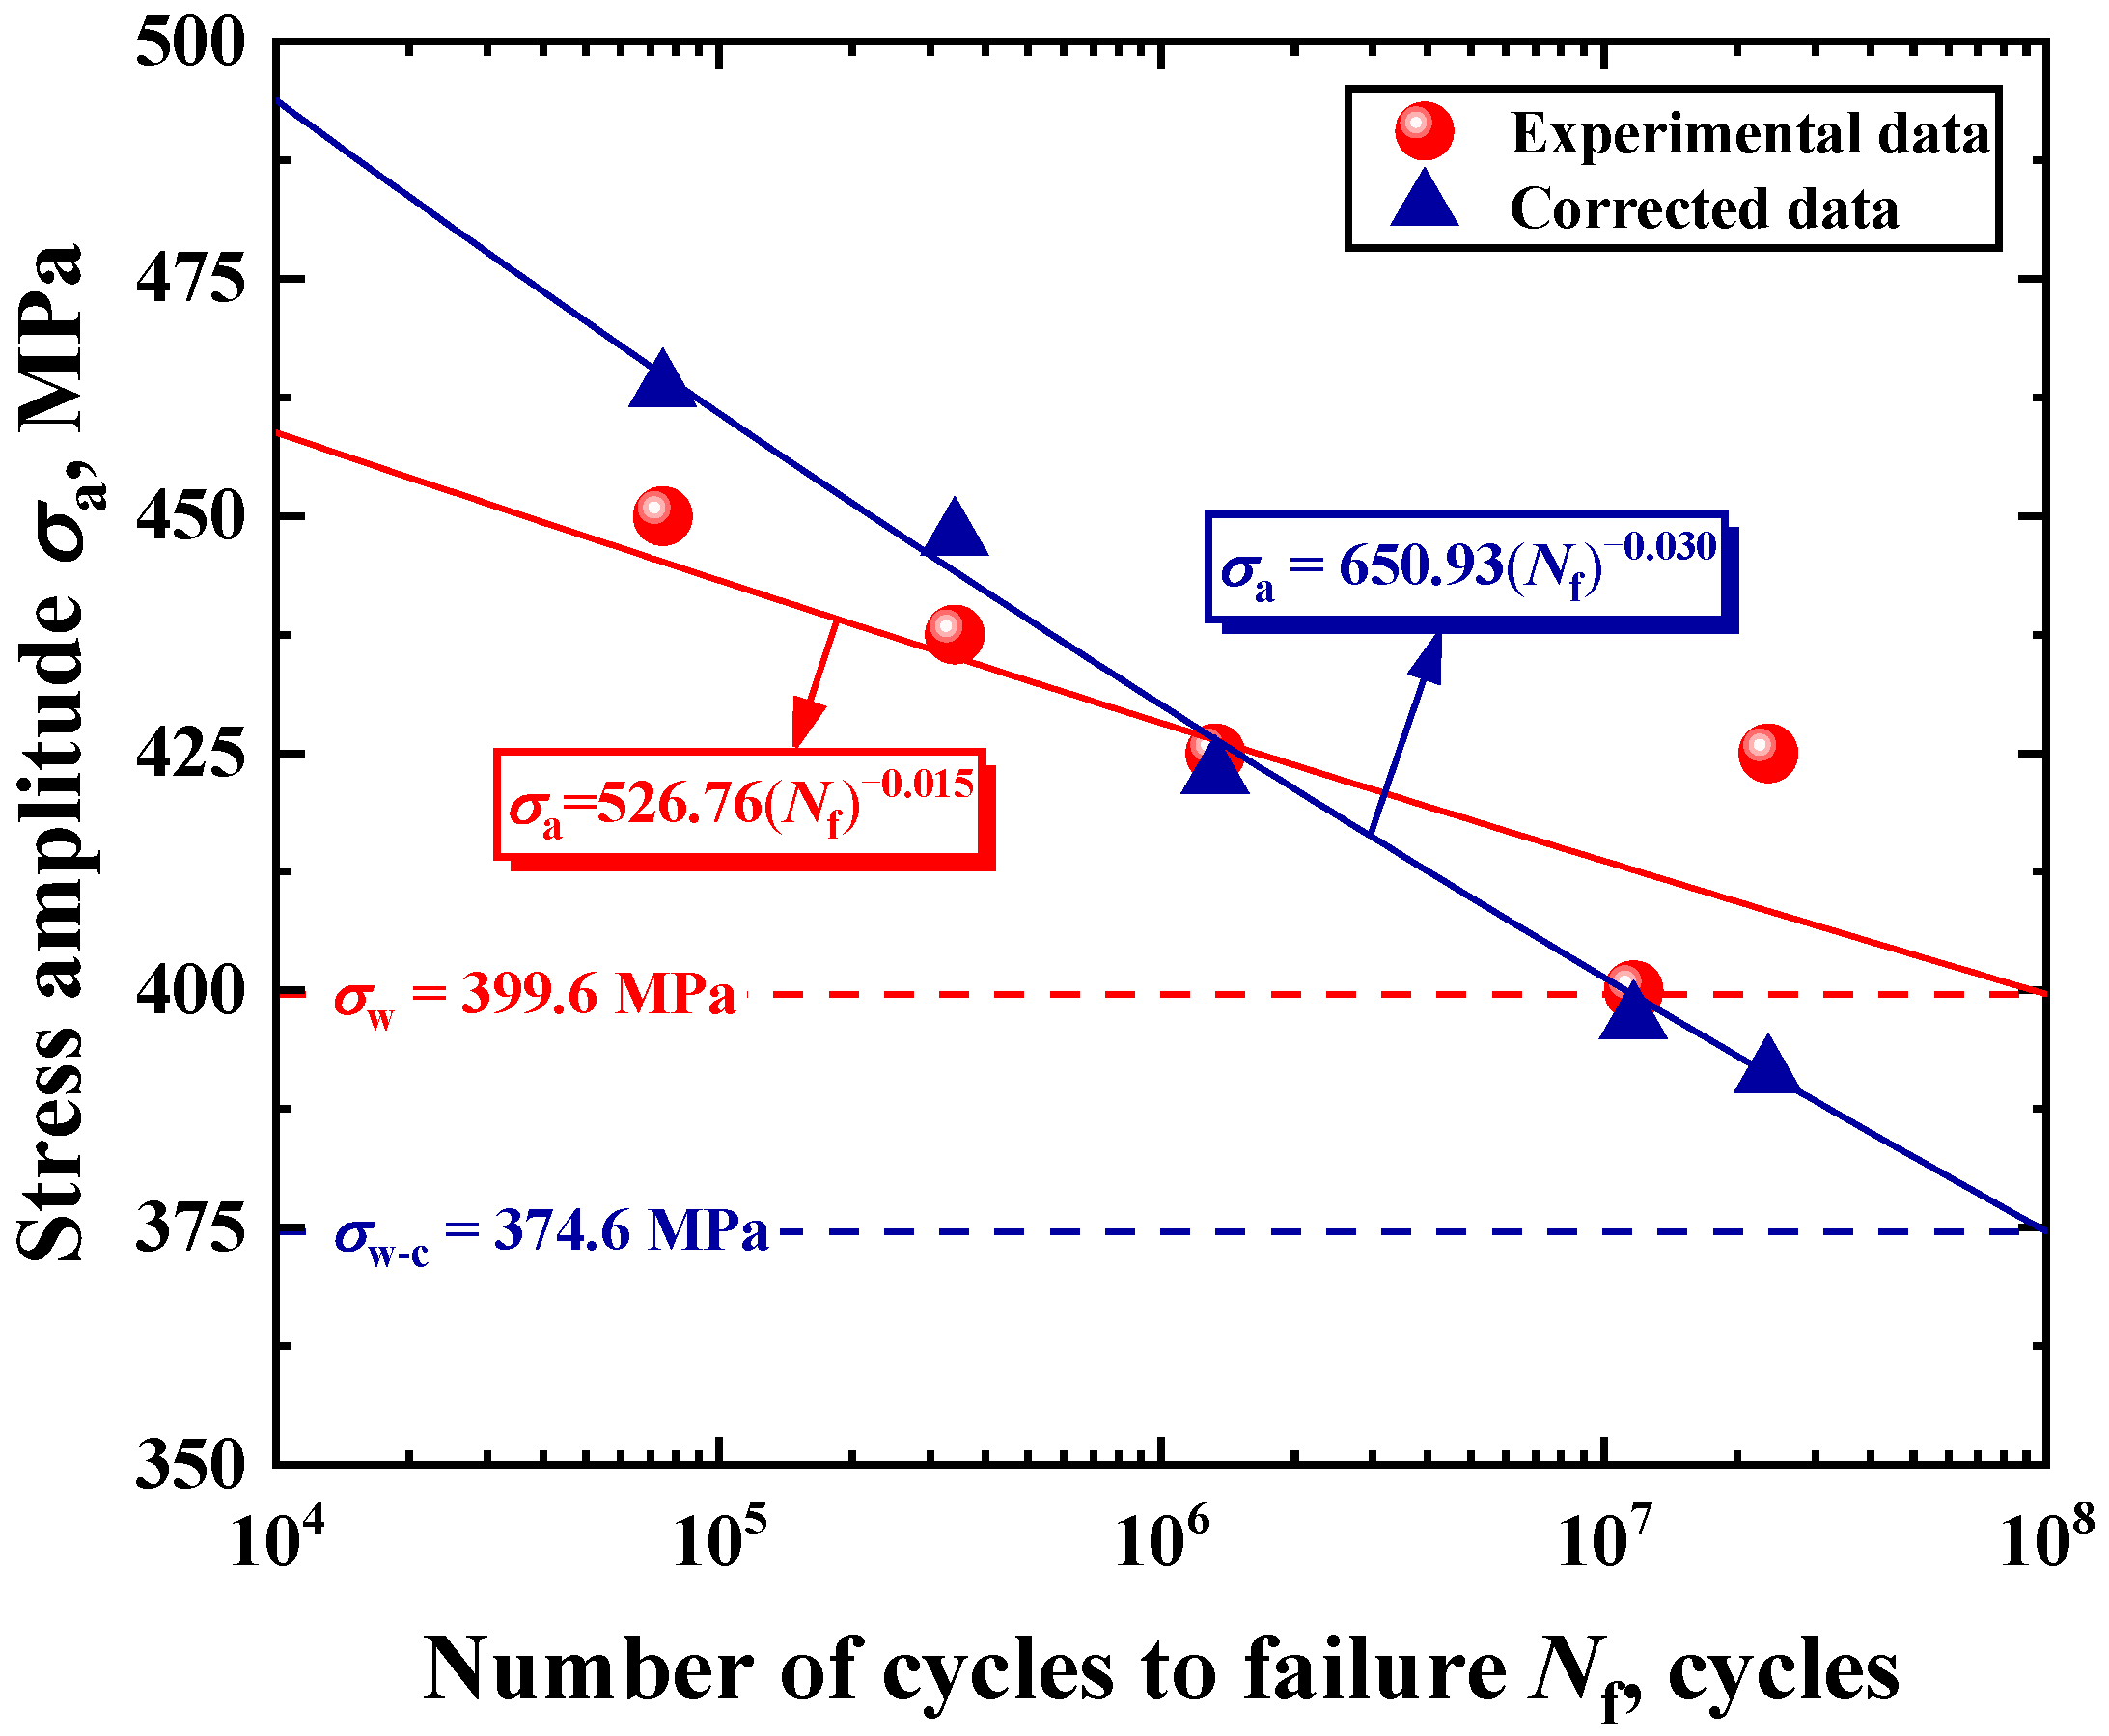
3.6. Correction for S–N Relationships

Le et al. [27] plotted modified S–N characteristics based on the concept of average defect size, resulting in a closer correspondence between stress and life, and confirmed the rationality of subsequent fatigue failure analysis through corrected stress, which provides some insights for this section. The formula for corrected stress proposed by Le et al. is expressed as:
σ c = σ a r e a D a r e a D ,   average S
where S′ is the parameter obtained by fitting, σ and σc denote the applied stress before and after correction, and√areaD,average is the average of the fatal defect size. Furthermore, the positional parameter considering the defect depth was described as L = 1 − 2H/Φ, where Φ is the fracture diameter of the specimen [24,25]. Nevertheless, it was found that the fatigue parameter λ, which is jointly determined by defect size and defect depth, can be better used to describe the relationship between the defect characteristic size and fatigue life according to Section 3.3. Therefore, based on Equation (3), the stress correction factor (W) related to the stress amplitude is reconstructed and expressed as follows:
W = λ t a r e a D a r e a D ,   average S
where both S and t are material-related correction factors whose values can be obtained based on the Basquin equation and test data. The formula used for the solution is expressed as follows:
σ a - c = W σ a = A N f b
In Equation (5), both A and b are the constants related to the corrected S–N curve, and consistently determined by both fatigue test and defect characteristic size. The fitted values of A, b, S, and t were 650.93, −0.03, 0.05, and 0.06, respectively. It should be specifically mentioned that all stress correction sessions do not address surface failure, given that interior failures with the FGA are more prominent in terms of the joint action mechanism of defect depth and size, and can well reflect the VHCF characteristics. Combining Equations (4) and (5), the S–N relationship can be corrected to take into account the important role played by the defect characteristic size effect in the fatigue failure process under the local stress state, and the S–N characteristics before and after correction are shown in Figure 12.
Obviously, the dispersion of the S–N data is somewhat improved after considering the parameters of defect size and depth, showing a better linear trend in general, as can be clearly seen by the comparison results in Figure 12. The results are in agreement with some of the studies mentioned in the literature, demonstrating the important contribution of defects to the dispersion of fatigue performance [31,32,33]. Overall, the constructed stress correction factor allows for the effective optimization of data dispersion and quantification of the degree of influence of defective feature parameters on fatigue performance, which, in fact, provides a new way of thinking about fatigue life assessment and may be more advantageous in the face of extremely dispersed data scenarios. Additionally, the reacquired fatigue limit (σw−c) through corrected stress is somewhat different from the initial value (σw), and the value of σw−c is taken to be about 374.6 MPa, according to the corrected S–N curve.

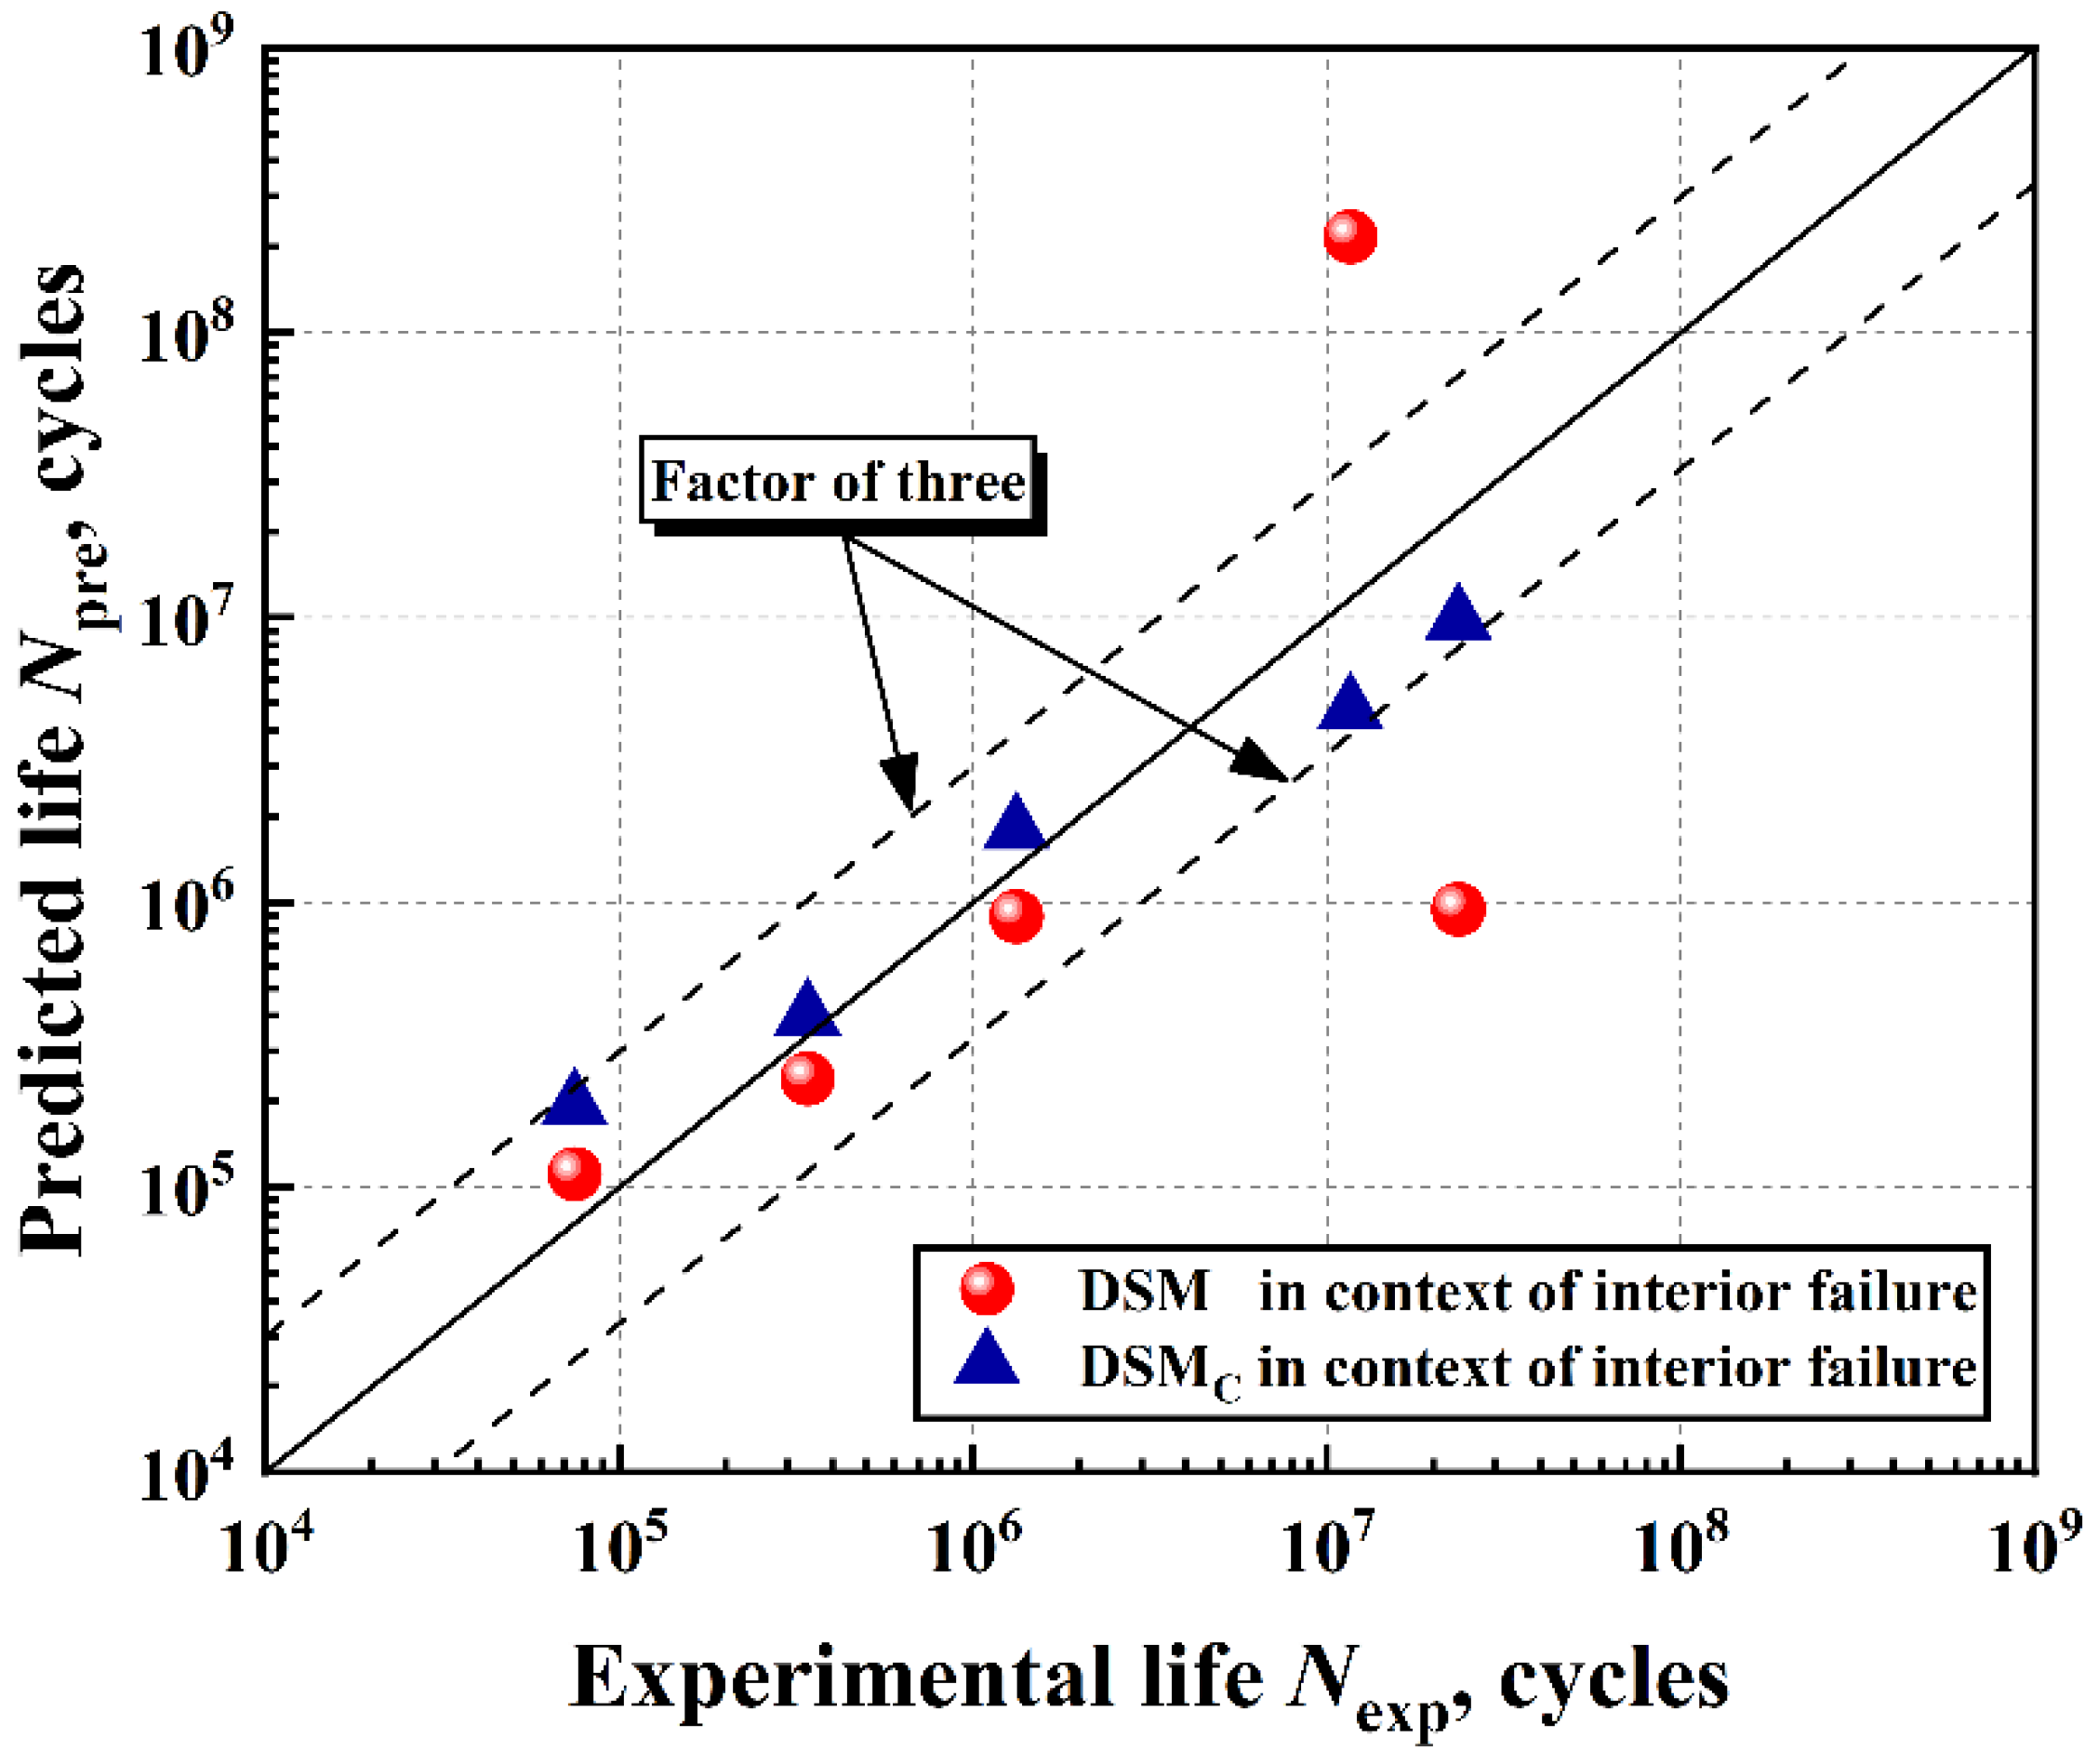
3.7. Fatigue Life Assessment of Interior Failure

As already mentioned, the fatigue life related to interior failure in this paper is absolutely dominated by the FGA, the formation of which is closely related to the processes of dislocation and slip, and in turn, the corresponding fatigue life assessment can be carried out by dislocation motion and irreversible slip theory. Under this theoretical framework, it is generally believed that cyclic loading can cause the plastic flow of grains in the material along the slip band. Unfortunately, this process will be impeded by grain boundaries, which allow dislocations to accumulate within the grains, accompanied by increasing local stress concentrations and energy accumulation effects. It is not until the cumulative dislocation reaches the critical value that micro cracks can initiate at the intragranular slip band. According to Tanaka–Mura, the increment of strain energy for a single slip band under each cyclic load, ΔU, can be expressed as [28,34]:
Δ U = π 1 ν Δ τ 2 k 2 l 2 2 μ
where ν is the Poisson’s ratio; k is the dislocation slip resistance; Δτ is the local average shear stress range; and l is the grain size, which is taken to be approximately 450 μm. The total strain energy, U, stored in the unit area can be expressed as:
U = 4 l W S
In Equation (7), WS denotes the specific fracture energy per unit area of the slip band. Assuming that the total strain energy caused by the process of dislocation accumulation reaches the fracture energy threshold when the number of cycles reaches Ni, the equation related to the crack initiation life can be established as follows:
N i = U Δ U = 8 μ W S 1 ν Δ τ 2 k 2 π l
Actually, not all dislocation slip plays a substantial role in the crack initiation process. It has been found that the effective dislocation slip should be closely related to the crack length, whereby the WS considering the crack length (c) can be given by the following Equation [35]:
W S = c μ 0.005 h l 2
where h represents the width of the slip band, which is usually considered a fitting parameter to effectively improve the matching between the test data and life model to be discussed below, and μ is the shear modulus. Combining Equations (8) and (9), and introducing the fatigue life index (β) related to the accumulated strain energy and irreversible slip degree, the improved model for predicting the crack initiation life can be expressed as:
N i β = 1 Δ τ 2 k 8 μ 2 0.005 1 ν π 1 / 2 h l c l 1 / 2
Once the FGA is completely covered by slip bands, the crack length (c) can be expressed by the difference between √areaFGA and √areaD. In addition, based on the octahedral shear stress yield criterion, Δτ in uniaxial tensile stress can be expressed by the stress amplitude as:
Δ τ = 2 3 Δ σ = 2 2 3 σ a
During the formation of FGA, k can be considered as the critical shear stress and can be expressed through the fatigue limit as:
k = 2 3 σ w
As a result, the fatigue life prediction model (dislocation-energy model, DEM) based on crack initiation can be expressed as:
N i = 3 2 h 4 l σ a σ w 8 μ 2 0.005 1 ν π 1 2 a r e a FGA a r e a D l 1 2 1 / β
By considering the correction stress, Equation (13) can be further reformulated as the following model (DEMC) under the condition that the defect type and size can be estimated or detected:
N i = 3 2 h 4 l σ a - c σ w - c 8 μ 2 0.005 1 ν π 1 2 a r e a FGA a r e a D l 1 2 1 / β
Figure 13 shows the comparison of predicted fatigue life (Npre) based on the DEM and DEMC with experimental fatigue life (Nexp). As can be seen, after indirectly introducing the effect of the average defect size and fatigue parameters (λ) into the DEM by corrected stress, the predicted results of the DEMC have better consistency with the experimental results, and the predicted fatigue life is very accurate within a factor of three. In fact, from the blue triangles in Figure 13, it can be concluded that the model provides non-conservative results for low-life regions and conservative results for long-life regions. Therefore, the proposed method of fatigue life is feasible from the perspective of crack initiation and in combination with the stress correction factor based on the defect characteristic size.

4. Conclusions

This paper focuses on the HCF-VHCF performance of α + β Type titanium alloy welded joints based on the axial constant amplitude loading fatigue test with R = −1 and then establishes a reliable fatigue life prediction model using dislocation–slip theory. The main research results are as follows:
  • The grain size and the amount of acicular martensite from the WZ, HAZ, and BM decreased in order, with a stepwise distribution. All interior failures were induced by pores, and no other types of defect-induced failures were found in surface failures, except for dislocation–slip defects and the lack of fusion as characteristic crack sources.
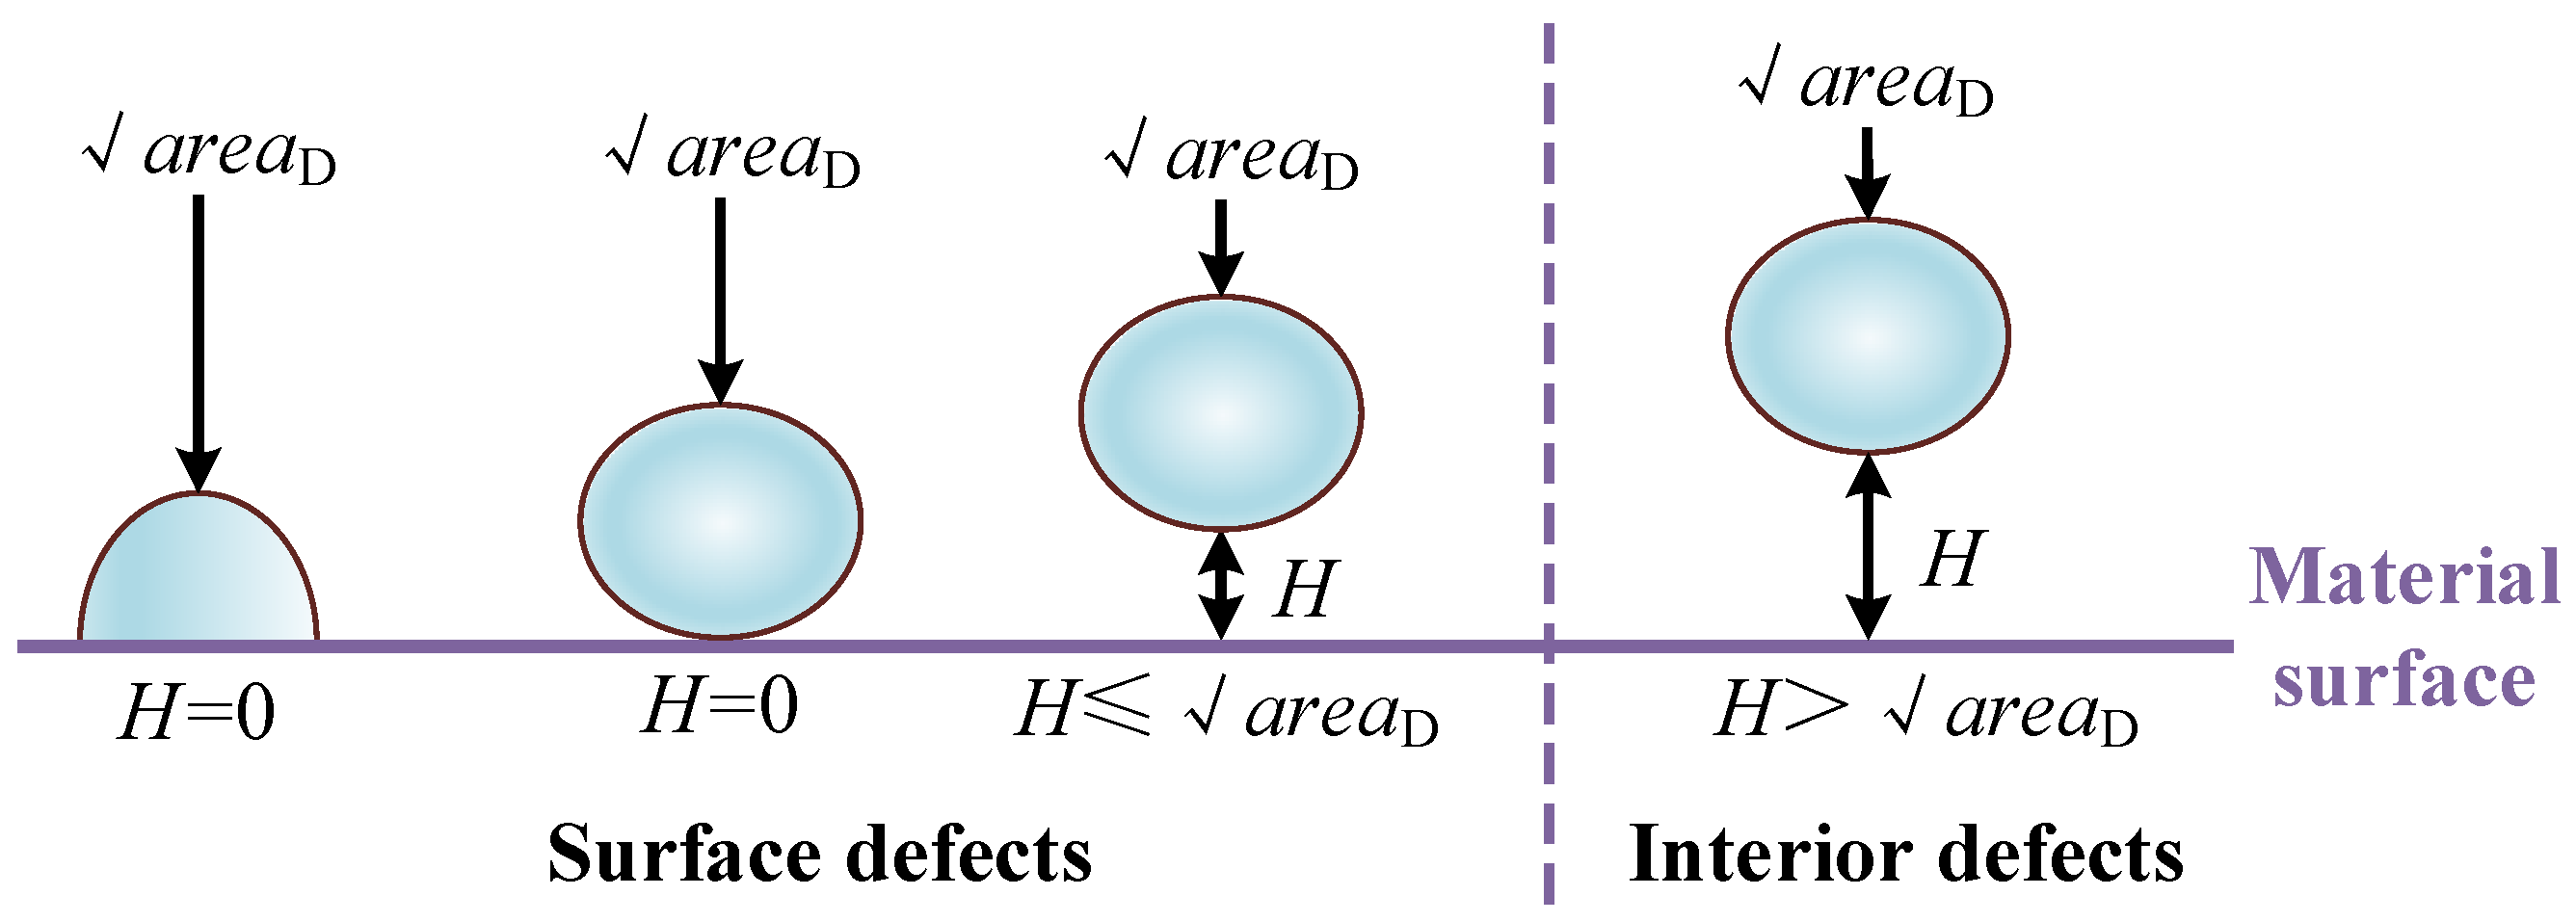
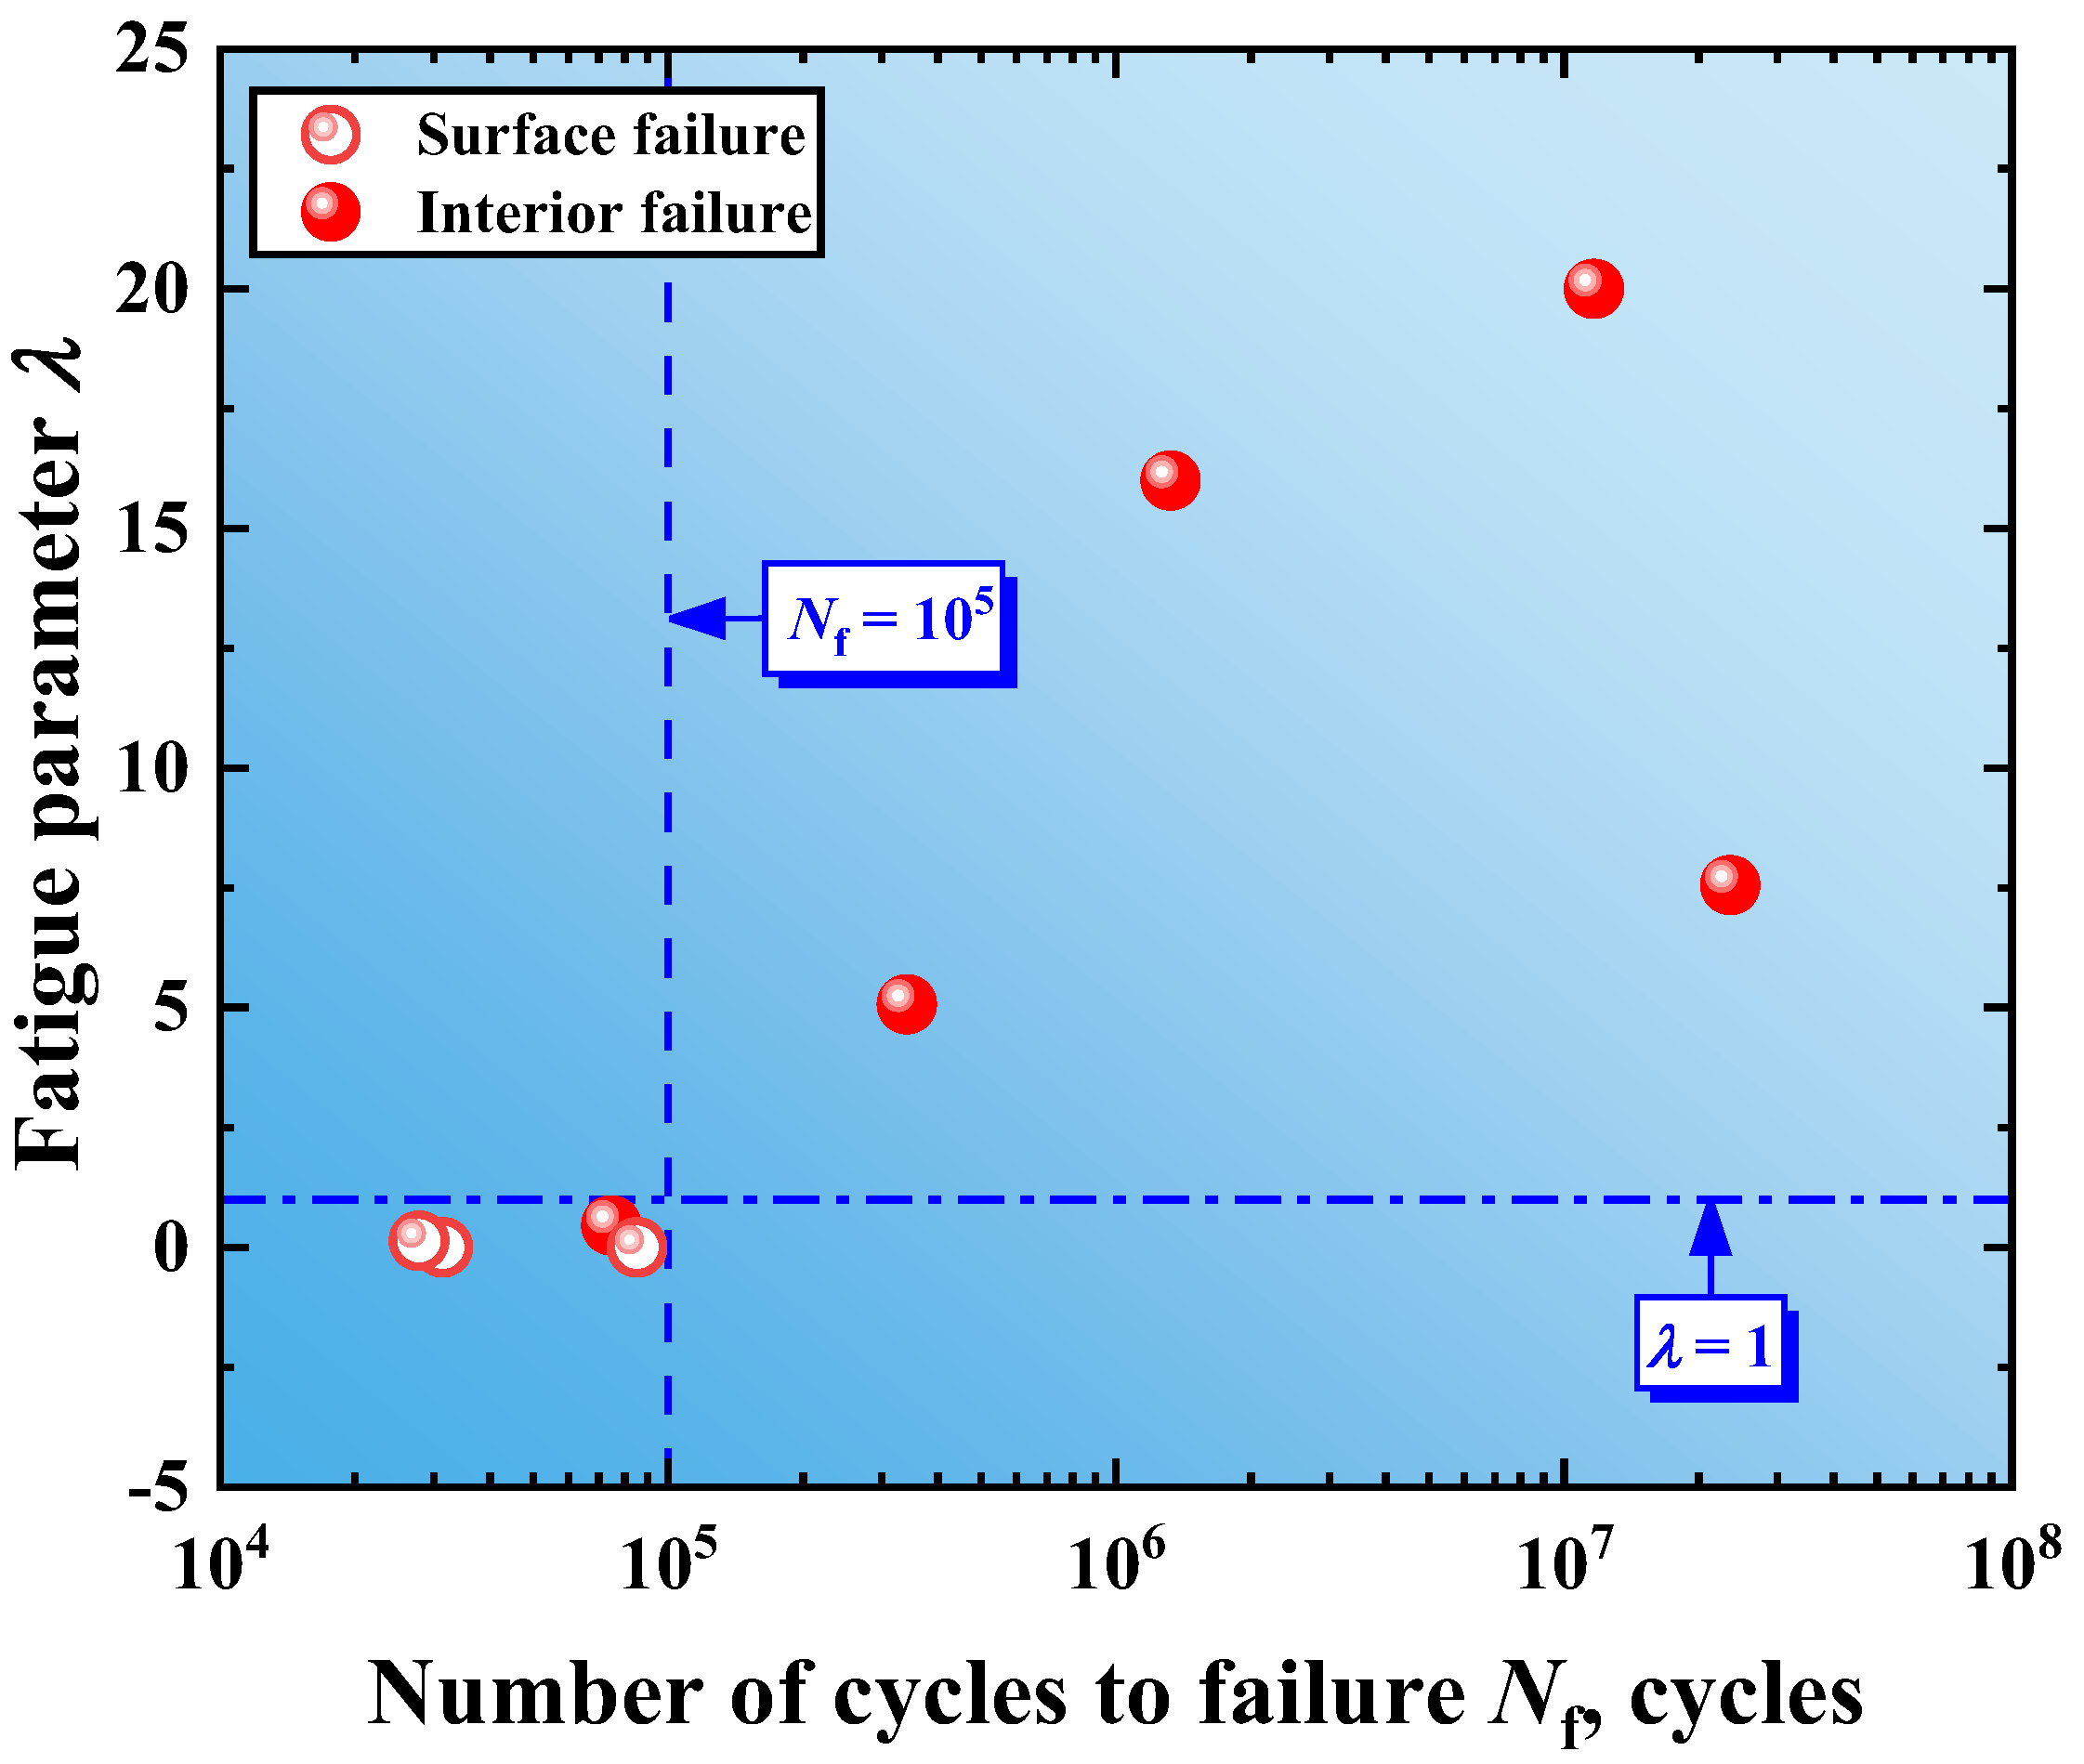
  • The size and depth of defects exhibit negative and positive feedback mechanisms with fatigue life, accompanied by significant dispersion, and a fatigue parameter (λ) constructed based on them can better describe the distribution law of fatigue life.
  • The stress correction factor proposed by introducing the fatigue parameter (λ) and the average defect size while taking into account the size of each defect, was effective in optimizing the dispersion of the S–N characteristics, and the fatigue limit after stress correction was 374.6 MPa, which is slightly reduced compared with the initial 399.6 MPa.
  • Based on dislocation–slip theory as well as correction stress, a reliable method for fatigue life prediction was proposed under the condition that the defect type and size can be estimated or detected. The model provides non-conservative results for the low-life region and conservative results for the long-life region.
Current research on α + β Type titanium alloy welded joints focuses on the S–N relationship as well as the effect of defect characteristic size on fatigue performance, while in the actual welding process, the severe residual stresses caused by uneven heat input and deformation at the microscopic level can also have a large degree of influence on the local stress concentration of the crack. In view of the above facts, it is necessary to further explore the failure mechanism and quantitative analysis methods in this direction in conjunction with engineering practice.

Author Contributions

F.C. and W.L. conceived and designed the experiment; Y.G. and M.L. performed the experiments; H.Y. observed the fracture surfaces; W.L. and H.D. analyzed and processed the data; and Y.G. and H.D. wrote the paper. All authors have read and agreed to the published version of the manuscript.

Funding

The authors gratefully appreciate the financial support granted by the Inner Mongolia Science and technology plan project (No. 2022YFSJ0019), Natural Science Foundation of Inner Mongolia (No. 2021LHMS05009, No. 2020MS05066 and No. 2022MS05014), basic scientific research business expenses of universities directly under the Inner Mongolia Autonomous Region (No. JY20220233), and Higher Education Research Project of Inner Mongolia (No. NJZY21306).

Data Availability Statement

Not applicable.

Acknowledgments

Thanks to Kang Heming and Li Yongping at Inner Mongolia University of Technology for their technical support in this research work.

Conflicts of Interest

The authors declare no conflict of interest.

References

  1. Ou, P.; Cao, Z.; Rong, J.; Yu, X. Molecular Dynamics Study on the Welding Behavior in Dissimilar TC4-TA17 Titanium Alloys. Materials 2022, 15, 5606. [Google Scholar] [CrossRef]
  2. Li, Z.Y.; Xu, L.Y.; Hao, K.D.; Zhao, L.; Jing, H.Y. Microstructure and properties of MAG and oscillating laser arc hybrid welded X80 steel. Trans. China. Weld. Inst. 2022, 43, 36–42. [Google Scholar]
  3. Xu, X.; Xie, L.; Zhou, S.; An, J.; Huang, Y.; Liu, Y.; Jin, L. Effect of Welding Defects on Fatigue Properties of SWA490BW Steel Cruciform Welded Joints. Materials 2023, 16, 4751. [Google Scholar] [CrossRef] [PubMed]
  4. Hwang, J.R.; Huang, C.D.; Lin, W.H.; Huang, J.Y.; Fung, C.P. High Cycle Fatigue Life of Ti-6Al-4V Titanium Alloy Processed by Electron Beam Welding. Chiang. Mai. J. Sci. 2022, 49, 473–486. [Google Scholar] [CrossRef]
  5. Liu, X.G.; Guo, H.D.; Wang, B.Z.; Li, J.W.; Wu, B. Study on high cycle fatigue fractal damage model of TC11 alloy welded joint. J. Aerosp. Power. 2011, 26, 355–361. [Google Scholar]
  6. Balasubramanian, T.S.; Balasubramanian, V.; Muthumanikkam, M.A. Fatigue Performance of Gas Tungsten Arc, Electron Beam, and Laser Beam Welded Ti-6Al-4V Alloy Joints. J. Mater. Eng. Perform. 2011, 24, 1620–1630. [Google Scholar] [CrossRef]
  7. Liu, H.Q.; Song, J.; Wang, H.M.; Yu, C.L.; Du, Y.H.; He, C.; Wang, Q.Y.; Chen, Q. Slip-driven and weld pore assisted fatigue crack nucleation in electron beam welded TC17 titanium alloy joint. Int. J. Fatigue 2022, 154, 106525. [Google Scholar] [CrossRef]
  8. Ma, J.; Zhao, Z.H.; Nie, B.H.; Zheng, Z.T.; Zhang, Z. Research on Very High Cycle Fatigue Behavior of the Electron Beam Weldment for TC21 Titanium Alloy. J. Mech. Eng. 2015, 51, 69–75. [Google Scholar] [CrossRef]
  9. Liu, Z.P.; Zhang, H.; Hou, Z.G.; Yan, Z.F.; Liaw, P.K.; Dong, P. Competitive relationship during fatigue-crack initiation of friction-stir-welded Al alloy. Mat. Sci. Eng. A Struct. 2021, 809, 141006. [Google Scholar] [CrossRef]
  10. Zhang, L.; Li, Q.B.; Dai, Y.; Chen, D.G.; He, Y.F. A study on fatigue damage behavior of single-wire MIG welding joint for TC4 titanium alloy. Iron Steel Vanadium Titan. 2022, 43, 62–67. [Google Scholar]
  11. Liu, F.L.; Zhang, H.; Liu, H.Q.; Chen, Y.; Kashif, K.M.; Wang, Q.Y.; Liu, Y.J. Influence of Welded Pores on Very Long-Life Fatigue Failure of The Electron Beam Welding Joint of TC17 Titanium Alloy. Materials 2019, 12, 1825. [Google Scholar] [CrossRef] [PubMed]
  12. Liu, F.L.; Chen, Y.; He, C.; Wang, C.; Li, L.; Liu, Y.J.; Wang, Q.Y. Very long-life fatigue failure mechanism of electron beam welded joint for titanium alloy at elevated temperature. Int. J. Fatigue 2021, 152, 106446. [Google Scholar] [CrossRef]
  13. Gao, N.; Li, W. Effect of stress ratio on the very high-cycle fatigue failure mechanism of TC4 titanium alloy. Chin. J. Eng. 2019, 41, 254–260. [Google Scholar]
  14. Zhao, A.G.; Xie, J.J.; Sun, C.Q.; Lei, Z.Q.; Hong, Y.S. Prediction of threshold value for FGA formatio. Mater. Sci. Eng. A 2011, 528, 6872–6877. [Google Scholar] [CrossRef]
  15. Murakami, Y.; Yokoyama, N.N.; Nagata, J. Mechanism of fatigue failure in ultralong life regime. Fatigue Fract. Eng. Mater. Struct. 2010, 25, 735–746. [Google Scholar] [CrossRef]
  16. Shiozawa, K.; Moriib, Y.; Nishino, S. Subsurface crack initiation and propagation mechanism in high-strength steel in a very high cycle fatigue regime. Int. J. Fatigue 2006, 28, 1521–1532. [Google Scholar] [CrossRef]
  17. Sakai, T.; Oguma, N.; Morikawa, A. Microscopic and nanoscopic observations of metallurgical structures around inclusions at interior crack initiation site for a bearing steel in very high-cycle fatigue. Fatigue Fract. Eng. Mater. Struct. 2015, 38, 1305–1314. [Google Scholar] [CrossRef]
  18. Liu, Y.J.; Liu, F.L.; He, R.X.; Wang, Q.Y.; Wang, C.; He, C.; Kashif, K.M.; Chen, Y. Mechanical behaviors of electron beam welded titanium alloy up to very high cycle fatigue under different process conditions. Mater. Sci. Eng. A. 2021, 802, 140685. [Google Scholar] [CrossRef]
  19. Fomin, F.; Horstmann, M.; Huber, N.; Kashaev, N. Probabilistic fatigue-life assessment model for laser-welded Ti-6Al-4V butt joints in the high-cycle fatigue regime. Int. J. Fatigue 2018, 116, 22–35. [Google Scholar] [CrossRef]
  20. Murakami, Y. Metal Fatigue: Effects of Small Defects and Nonmetallic Inclusions; Elsevier: Oxford, UK, 2002. [Google Scholar]
  21. Liao, D.; Zhu, S.P.; Keshtegar, B.; Qian, G.A.; Wang, Q.Y. Probabilistic framework for fatigue life assessment of notched components under size effects. Int. J. Fatigue 2020, 181, 105685. [Google Scholar] [CrossRef]
  22. Sun, C.Q.; Liu, X.L.; Hong, Y.S. A Two-Parameter Model to Predict Fatigue Life of High-Strength Steels in a Very High Cycle Fatigue Regime. Acta Mech. Sin. 2015, 31, 383–391. [Google Scholar] [CrossRef]
  23. Niu, X.P.; Zhu, S.P.; He, J.C.; Liao, D.; Correia, J.A.F.O.; Berto, F.; Wang, Q.Y. Defect tolerant fatigue assessment of AM materials: Size effect and probabilistic prospects. Int. J. Fatigue 2022, 160, 106884. [Google Scholar] [CrossRef]
  24. Zhu, M.L.; Xuan, F.Z.; Du, Y.N.; Tu, S.T. Very High Cycle Fatigue Behavior of a Low Strength Welded Joint at Moderate Temperature. Int. J. Fatigue 2012, 40, 74–83. [Google Scholar] [CrossRef]
  25. Zhu, M.L.; Xuan, F.Z.; Chen, J. Influence of Microstructure and Microdefects on Long-Term Fatigue Behavior of a Cr-Mo-V Steel. Mater. Sci. Eng. A 2012, 546, 90–96. [Google Scholar] [CrossRef]
  26. He, J.C.; Zhu, S.P.; Luo, C.Q.; Niu, X.P.; Wang, Q.Y. Size effect in fatigue modelling of defective materials: Application of the calibrated weakest-link theory. Int. J. Fatigue 2022, 165, 107213. [Google Scholar] [CrossRef]
  27. Lan, Y.D.; Zhang, W.F.; Liu, X.P.; Li, N.; Dai, W. Effects of Welded Pores on Fatigue Life of Titanium Alloy Electron-Beam Welded Joints. In Proceedings of the 2018 Prognostics and System Health Management Conference (PHM-Chongqing), Chongqing, China, 26–28 October 2018; pp. 1144–1148. [Google Scholar]
  28. Tanaka, K.; Mura, T. A dislocation model for fatigue crack initiation. J. Appl. Mech. 1981, 48, 97–103. [Google Scholar] [CrossRef]
  29. Le, V.D.; Pessard, E.; Morel, F.; Prigent, S. Fatigue behaviour of Additively Manufactured Ti-6Al-4V alloy: The role of defects on scatter and statistical size effect. Int. J. Fatigue 2020, 140, 105811. [Google Scholar] [CrossRef]
  30. GB/T 3075-2008; Metal Materials—Fatigue Testing: Axial Force Control Methods. Standardization Administration of China: Beijing, China.
  31. Chen, H.; Yang, Y.; Cao, S.; Gao, K.; Xu, S.; Li, Y.; Zhang, R. Fatigue Life Prediction of Aluminum Alloy 6061 Based on Defects Analysis. Int. J. Fatigue 2021, 147, 106189. [Google Scholar] [CrossRef]
  32. Romano, S.; Brückner-Foit, A.; Brandão, A.; Gumpinger, J.; Ghidini, T.; Beretta, S. Fatigue Properties of AlSi10Mg Obtained by Additive Manufacturing: Defect-Based Modelling and Prediction of Fatigue Strength. Eng. Fract. Mech. 2018, 187, 165–189. [Google Scholar] [CrossRef]
  33. Serrano-Munoz, I.; Buffiere, J.Y.; Mokso, R.; Verdu, C.; Nadot, Y. Location, Location & Size: Defects Close to Surfaces Dominate Fatigue Crack Initiation. Sci. Rep. 2017, 7, 45239. [Google Scholar]
  34. Tanaka, K.; Nakai, Y.; Yamashita, M. Fatigue Growth Threshold of Small Cracks. Int. J. Fatigue 1981, 17, 519–533. [Google Scholar] [CrossRef]
  35. Chan, K.S. A Microstructure-Based Fatigue-Crack-Initiation Model. Metall. Mater. Trans. A 2003, 34, 43–58. [Google Scholar] [CrossRef]
Figure 1. Schematic of groove parameters and weld passes.
Metals 13 01540 g001
Figure 2. Schematic illustration of the sampling method and dimension parameters (unit: mm).
Metals 13 01540 g002
Figure 3. Microstructure of the welded joint: (a) BM; (b) BM and HAZ; (c) WZ.
Metals 13 01540 g003
Figure 4. Stress–strain curve.
Metals 13 01540 g004
Figure 5. S–N curve of titanium alloy welded joints.
Metals 13 01540 g005
Figure 6. Surface failure induced by dislocation–slip defect and lack of fusion: (a) surface failure induced by dislocation- slip defect; (b) dislocation- slip defect; (c) surface failure induced by lack of fusion and (d) lack of fusion.
Metals 13 01540 g006
Figure 7. Interior failure induced by a pore: (a) interior failure with FGA induced by pore; (b) pore and FGA.
Metals 13 01540 g007
Figure 8. Schematic diagram of defect size and depth.
Metals 13 01540 g008
Figure 9. Relationships of defect size and defect depth with fatigue life: (a) Relationships between defect size and fatigue life; (b) Relationships between defect depth and fatigue life.In view of the dispersion phenomenon common to Figure 9a, b, a dimensionless fatigue parameter λ is proposed to further investigate the combined action mechanism of depth and fatal defect size in the fatigue failure process of titanium alloy welded joints, defined as:.
Metals 13 01540 g009
Figure 10. Relationship between λ and fatigue life Nf.
Metals 13 01540 g010
Figure 11. Relationship between the stress-intensity-factor range and fatigue life: (a) Relationships between Δ K D ; and fatigue life; (b) Relationships between Δ K FGA   or   SCA and fatigue life.
Metals 13 01540 g011
Figure 12. S–N relationships before and after correction.
Metals 13 01540 g012
Figure 13. Comparison of predicted life and experimental life.
Metals 13 01540 g013
Table 1. Chemical compositions of BM (wt%).
CNHFeOAlVTi
0.0110.0090.00060.0260.0606.194.03Balance
Table 2. Chemical compositions of solid wire (wt%).
CNHFeOAlVTi
0.0070.0080.00070.120.146.353.96Balance
Disclaimer/Publisher’s Note: The statements, opinions and data contained in all publications are solely those of the individual author(s) and contributor(s) and not of MDPI and/or the editor(s). MDPI and/or the editor(s) disclaim responsibility for any injury to people or property resulting from any ideas, methods, instructions or products referred to in the content.

