Abstract
In this manuscript, the effects of Mo content on the microstructure and impact toughness of X80 thick-walled low-temperature pipeline steel were studied. Two test steels with different Mo content (0.25% and 0.40%) were prepared by the thermo-mechanical control process. The impact properties were measured at −45 °C, and the microstructure evolution was observed via an optical microscope (OM), a scanning electron microscope (SEM), electron back-scattered diffraction (EBSD), and a transmission electron microscope (TEM). Each steel showed the formation of a mixed microstructure consisting of polygonal ferrite (PF), granular bainite (GB), and lath bainite (LB). Increasing Mo content resulted in the rise of LB at the expense of PF and GB. At the same time, the morphology of martensite/austenite (M/A) constituents changed from blocky to slender. The dislocation density in the ferrite matrix around the M/A constituents enhanced with an increase in Mo content. This also led to an increase in the microstrains around the M/A constituents. Also, the number fraction of the high angle grain boundary (HAGB) (MTA > 15°) decreased with the addition of more Mo content. Furthermore, with an increase in Mo content from 0.25% to 0.40%, the low-temperature impact toughness decreased from 206 to 57 J. Both an increase in the slender M/A constituents and a decrease in the HAGB number fraction deteriorated the low-temperature impact toughness of the X80 thick-walled low-temperature pipeline steel.
1. Introduction
High strength, toughness, and excellent weldability [1,2,3] have made X80-grade pipeline steel to be considered as the preferred steel for gas and oil transmission pipelines, even in the 21st century. However, higher constraints have been imposed on the wall thickness and low-temperature toughness (≤−45 °C) of X80-grade pipeline steel [1,2,3,4] in order to meet the increasing demands of long-distance transmission in extremely cold regions and high flow rates of natural gas. X80-grade steel is designed with lower carbon content [5,6,7,8,9] in order to achieve excellent weldability. Thus, in order to strengthen the matrix, refine the microstructure, and meet the high-strength requirements, it is necessary to add the elements Mo and Ni. Moreover, the addition of Mo significantly improves the hardenability of the steel [10,11,12] and ensures excellent low-temperature toughness by favoring the attainment of the fine-grained structure in the center of the thick plate. Low carbon bainite is the typical structure of X80-grade pipeline steel. In this kind of microstructure, the phase ratio [7,11,13] and grain size [8,9,14], especially the characteristics of the hard-phase M/A constituents [2,3,12,15,16], have a significant effect on the low-temperature toughness.
In such bainitic steels, the alloy composition greatly affects the refinement of the bainite matrix along with the content, size, and morphology of the hard-phase M/A constituents [6,11,12,17,18,19,20]. Moreover, the above characteristics have a significantly different effect on the low-temperature toughness. Hu et al. [11] found that increasing the Mo content significantly enhanced the strength of the steel by reducing the phase transformation temperature during the continued cooling process, gradually forming refined lower bainite while reducing lath bainite, refining the M/A constituents, and gradually transforming the internal structure predominantly to martensite. However, the impact on low-temperature toughness has not been studied. Kong et al., without analyzing the morphological changes of the M/A constituents in test steels with different Mo contents and their effects on impact toughness [6], simply attributed the deterioration of impact toughness in high-strength pipeline steel to an increase in the M/A constituents’ content.
Linfeng Zhang et al. [12], while investigating the relationship between the CGHAZ (coarse-grained heat-affected zone) microstructure and the performance of weathering bridge steel after welding thermal cycles, observed that block-shaped M/A constituents are transformed to primarily slender-shaped ones due to increasing Mo content. The initiation of microcracks deteriorate low-temperature toughness due to rapid propagation along the long axis of slender-shaped M/A constituents. However, the analysis of strain distribution around the M/A constituents was lacking, and the mechanism for greater tendency of crack initiation in slender-shaped M/A constituents was not deeply revealed. Mingwei Tong et al. [8] also found deteriorating impact toughness of fire-resistant construction steel with increasing Mo content. However, the conclusion reached by Hardy et al. [7,14] was just the opposite. They observed [14] simultaneous improvement of the strength and low-temperature toughness of MoNb-based low-carbon bainitic steel, with an increase in Mo content due to grain refinement. Liming Dong et al. [7] also found that for the weld seam of K65 hot bent pipe, the proportion of high-angle grain boundaries in the microstructure increased by 67.1%, and the toughness at −40 °C also increased to 124 J due to an increase in Mo content by 0.20%. Therefore, the influence of Mo on low-temperature toughness is controversial.
In traditional low-carbon bainitic steels like X80 pipeline steel, the elemental content of added Mo is mostly ≥0.25 wt.% [5,11,13,17]. However, their low-temperature toughness does not meet the requirements for X80-grade pipeline steel with a thick wall under low-temperature environments (≤−45 °C) [2]. However, in addition to increasing the cost, addition of too much Mo content is also not conducive to commercial application [11]. Moreover, for the composition of this kind of steel, the effect of adding higher Mo content on the ferrite matrix structure, especially the hard phase M/A constituents, has not been studied, and the effect on low-temperature toughness has also not been reported. Therefore, further studies are required to understand the effect of adding varying amount of Mo to thick-walled X80-grade pipeline steel for low-temperature environments.
In this study, two different Mo-containing experimental steels, namely low-Mo (0.25%) and high-Mo (0.40%), were prepared employing the same TMCP (thermo-mechanical control process) technique. The low-temperature impact toughness (−45 °C) of the steels was measured, and the microstructural evolution and fracture characteristics of the impact fracture surfaces were observed. Systematic analysis was carried out to understand the influence of the microstructure on low-temperature toughness. The focus was on the evolutionary characteristics of morphology and the internal structure of the hard phase M/A constituents with varying Mo content, as well as the underlying mechanisms governing low-temperature toughness. The aforementioned research provides a theoretical basis for optimizing the Mo content in thick-walled low-temperature X80 pipeline steel.
2. Experimental Procedure
Chemical compositions of the two experimental steel plates with varying Mo contents are listed in Table 1. The thick plates (thickness of 24 mm) of experimental steels were obtained by the thermo-mechanical control process after melting in a 120 kg vacuum melting furnace. The schematic process route is shown in Figure 1. The 140 mm thick ingot was heated to 1180 °C at a rate of 10 °C/s and held for 3 h. Then, the ingots were roughened to 70 mm in five passes at 1030–1050 °C and finished to 24 mm in six passes at 780–800 °C by using a φ450 mm trial rolling mill. Accelerated cooling commenced at 750 °C, with an average cooling rate of 20 °C/s, and was interrupted at 420 °C. The measured TMCP process parameters of the test steels are shown in Table 2.

Table 1.
Chemical compositions of each Mo-containing steel (wt.%).
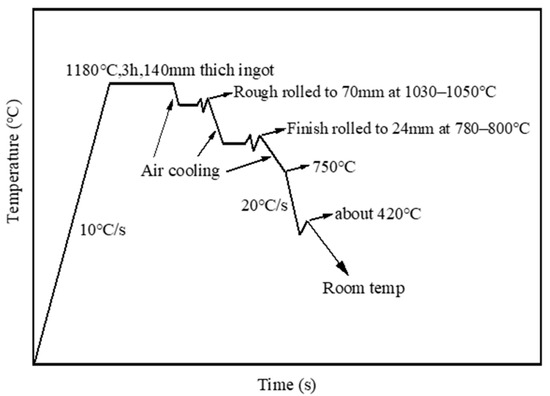
Figure 1.
Schematic diagram for TMCP.
Table 2.
TMCP parameters of test steel.
Specimens with the dimensions of 10 mm × 10 mm × 55 mm were used to carry out the Charpy V-notch impact test according to the international standard ASTM E-23. The sample was taken from half of the thickness direction of the steel plate along the rolling direction. The test temperature was maintained at −45 °C according to the Chinese national standard GB/T 31032-2014. Additionally, the final impact test result is the average of three parallel samples.
Optical microscopy (OM) was used to observe the metallographic samples after etching in 4% nital solution. Moreover, quantitative analysis of the M/A constituents via Image-pro Plus software was carried out after repolishing the samples and etching by LePera reagent. For statistical analysis, no less than 10 microstructural observation figures were obtained for each sample. The samples were observed by EBSD (DigiView EBSD Camera, EDAX, Mahwah, NJ, USA) at a scanning step of 0.25 μm after electrolytic polishing in a solution of 90% CH3COOH and 10% HClO4. The mean equivalent diameter (MED) with different misorientation tolerance angles (MTAs) and the kernel average misorientation (KAM) of the crystallographic data were analyzed using OIM analysis software. At least five EBSD images were used to calculate the average MED and KAM statistics. To be clear, the sample for the microstructure observation was taken from half of the thickness direction of the steel plate.
Transmission electron microscopy (TEM; JEM-2010, JEOL Ltd., Tokyo, Japan) was used to analyze the morphology of the bainitic ferrite matrix, dislocation substructure, and M/A constituents. Thin foils parallel to the metallographic sections were cut and thinned via electropolishing in a twin-jet device with an ethanol solution containing 10% perchloric acid to obtain the samples for TEM analysis.
In order to analyze the influence of Mo contents on the phase transition behavior of the sample, a C-GAUGE thermal dilatometer was used on the Gleeble 3500 thermal simulation test machine (Dynamic Systems Inc., Poestenkill, NY, USA) to test the phase transition behavior under the TMCP process (Figure 1).
Hitachi SU-500 SEM (Tokyo, Japan) with EBSD was used to observe the fracture morphology and secondary cracks for further analysis of the impact fracture behavior of the samples with different Mo contents.
3. Results
3.1. Microstructure
With varying Mo content, distinct microstructural variations were observed as reveled by the optical microscopic (OM) observations depicted in Figure 2a,b. Relative proportions of different microstructural constituents are presented in Figure 2c. A composite multiphase composition comprising polygonal ferrite (PF), granular bainite (GB), and lath bainite (LB) was observed to be constituting the microstructure of the examined samples.
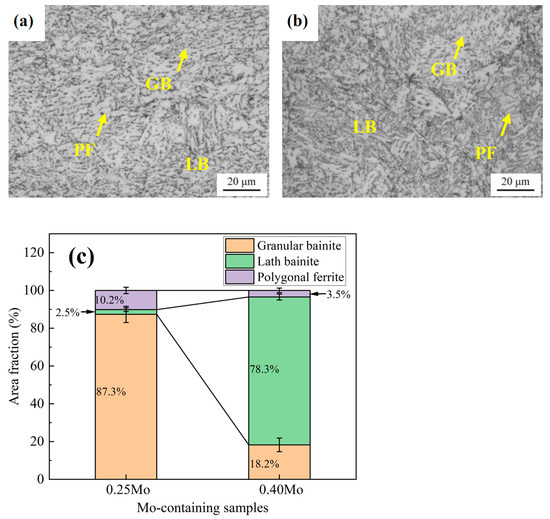
Figure 2.
Metallographic microstructure observations and quantitative statistical results for samples with different Mo contents: (a) 0.25% Mo, (b) 0.40% Mo, (c) Quantitative statistical results.
The microstructure of the sample with a Mo content of 0.25% was primarily characterized by PF and GB, accounting for 10.2% and 87.3% of the total area, respectively, with the LB phase being relatively minor, occupying only 2.5% of it. When the Mo content was increased to 0.40%, the LB phase became the primary constituent of the sample, occupying 78.3% of the microstructural area, thus resulting in a predominant multiphase microstructure composed mainly of LB. The proportions of GB and PF were found to decrease to 3.5% and 18.2%, respectively.
SEM images were used for further evaluation of the morphology and distribution of the M/A constituents, with the results shown in Figure 3a,b. In Table 3, statistical analysis of the average diameter and area fraction are presented. Using the statistical method for the M/A constituent size distribution, as in reference [16], the M/A constituents were classified into four types based on the SEM observations: Island M/A (area < 5 μm2, aspect ratio < 4), Fine Stringer (area < 5 μm2, aspect ratio > 4), Coarse Stringer (area > 5 μm2, aspect ratio > 4), and Massive M/A (area > 5 μm2, aspect ratio < 4). Figure 3c,d shows the statistical results regarding the proportions of different types of M/A constituents.
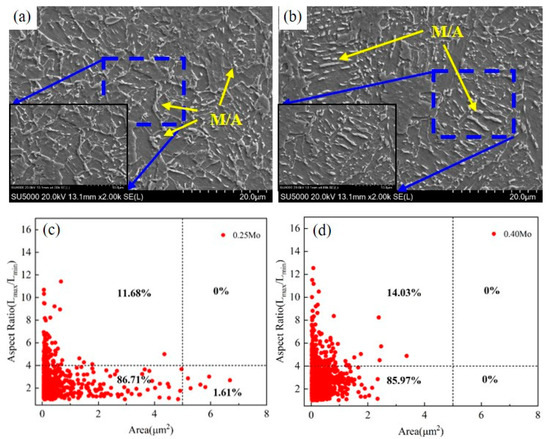
Figure 3.
SEM images of M/A constituents in samples with different Mo contents (a,b) and quantitative results of size distribution (c,d). (a,c) 0.25% Mo, (b,d) 0.40% Mo.
Table 3.
Summary of microstructure observations and quantifications.
The average size of the M/A constituents for the sample containing 0.25% Mo can be seen to be 0.85 μm with an area fraction of 11.9% (Table 3). Island and Massive M/A constituents are found to be the predominant morphologies, with the proportion of Massive M/A constituents being approximately 16.61% (Figure 3c). With increasing Mo content to 0.40%, the average size of the M/A constituents increased to 1.15 μm, with the area fraction being 13.3% (Table 3). The proportion of Massive M/A constituents decreased to 4.21% (Figure 3d), while the proportion of Stringer M/A constituents (including Fine and Coarse Stringers) increased from 5.57% to 17.10%. There was gradual shifting of the morphologies of M/A constituents towards Island and Stringer types.
TEM images of the microstructure in samples with different Mo contents are presented in Figure 4. In the sample with 0.25% Mo, predominantly block morphology was present (Figure 4a), with the M/A constituents being primarily distributed on the coarsened interfaces of polygonal ferrite (PF) and grain boundary ferrite (GBF). The localized magnified observation of the blocky M/A constituents is shown in Figure 4c,d. Figure 4c reveals a low dislocation density around the blocky M/A constituents on the ferrite matrix, with the dislocation lines being mostly evenly distributed. A high-density dislocation structure within the M/A constituents could be observed from the dark-field imaging, as shown in Figure 4d. The presence of both martensite and austenite phases, known as M/A constituents [18] in the blocky structure, was further confirmed by the selected-area diffraction pattern (Figure 4e).
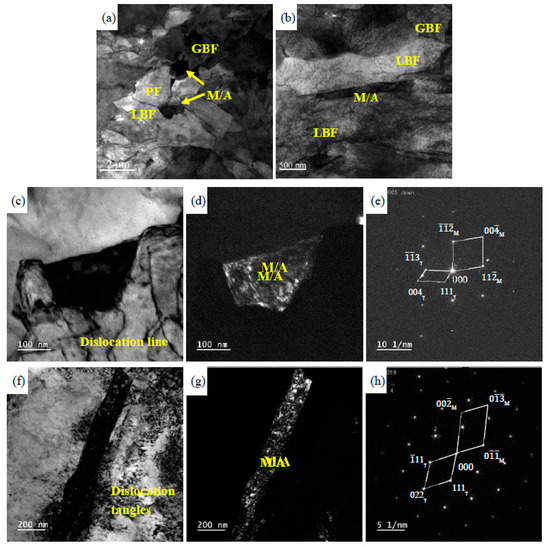
Figure 4.
TEM images of the samples with different Mo contents: (a,c–e) 0.25% Mo, (b,f–h) 0.40% Mo. (c–e) and (f–h) are the bright-field image (c,f), dark-field image (d,g) and selected-area diffraction pattern (e,h) of the blocky M/A constituents in the 0.25% Mo sample and the slender M/A constituents in the 0.40% Mo sample, respectively.
In the sample with 0.40% Mo, significantly refined sizes of GBF and lath bainitic ferrite (LBF) could be observed and influenced by the ferrite matrix organization. The M/A constituents could be seen to be mainly distributed between the refined GBF and LBF laths. The morphology was predominantly slender and stringer-like. The localized magnified observation of the stringer-like M/A constituents is shown in Figure 4f,g. Within the ferrite matrix, a high dislocation density surrounding the stringer-like M/A constituents can be seen in Figure 4f with the formation of numerous dislocation tangles. The stringer-like M/A constituents still exhibited a dislocation structure but with a higher dislocation density, as revealed by dark-field imaging in Figure 4g. Further confirmation that the stringer-like structure consisted of both martensite and austenite phases, representing M/A constituents, could be obtained from the selected-area diffraction pattern (Figure 4h).
EBSD analysis including the inverse pole figure (IPF) and local orientation deviation angle distribution map (KAM) of samples with different Mo content are shown in Figure 5. The results of quantitative statistical analysis can be found in Figure 6 and Table 3. In Figure 5a,c, the low-angle grain boundaries (LAGB, 2 ≤ MTA < 15°) [18,19] and high-angle grain boundaries (HAGB, MTA ≥ 15°) are represented by white lines and black lines, respectively. With increasing Mo content from 0.25% to 0.40%, the average grain size of the microstructure defined by the orientation deviation angle of 2–15° and ≥15° decreased from 3.86 μm and 4.45 μm to 3.34 μm and 3.90 μm, respectively, indicating structural refinement. However, a significant decrease in the proportion of high-angle grain boundaries from 49.5% to 41.3% could be observed. The variation in dislocation density and local microstrain within the alloy material [15,18] could be represented by the KAM mapping. From the KAM mappings of samples having different Mo contents, the average value of the local orientation deviation angle (Ave. KAM) could be seen to significantly increase from 0.8651° to 1.5436° with increasing Mo content, indicating a significant increase in the local microstrain.
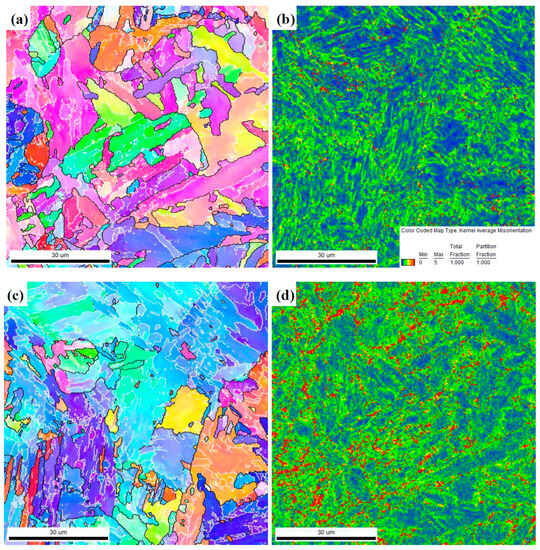
Figure 5.
The inverse pole figure (IPF) maps (a,c) and the kernel average misorientation (KAM) maps (b,d) for each Mo-containing sample: (a,b) 0.25% Mo, (c,d) 0.40% Mo.
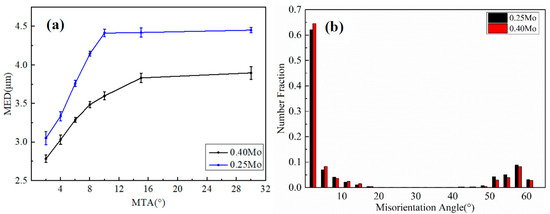
Figure 6.
The mean equivalent diameter (MED) as a function of the misorientation angle (MTA) for samples with different Mo contents (a). (b) shows the distribution of grain boundary misorientation for each Mo-containing sample.
3.2. Impact Performance Test
Figure 7 shows the load-displacement curves obtained from the Charpy impact testing (performed at a temperature of −45 °C) for the samples containing 0.25% Mo and 0.40% Mo. The results of impact energy are presented in Table 4. For the 0.25% Mo-bearing sample, the initiation energy (Ei), propagation energy (Ep), and total impact energy (Et) were determined as 78.5 J, 127.5 J, and 206 J, respectively. Increasing the Mo content to 0.40% resulted in a decrease of initiation energy from 78.5 J to 50 J, while the propagation energy and the total impact energy significantly decreased from 127.5 J to 6.5 J, and 206 J to 57 J, respectively. The Ep/Et ratio represents the amount of energy consumed by crack propagation in relation to the total impact energy [15,19]. A higher value indicated greater energy consumption due to crack propagation. The Ep/Et ratio was found to decrease from 0.62 to 0.12 with increasing Mo content.
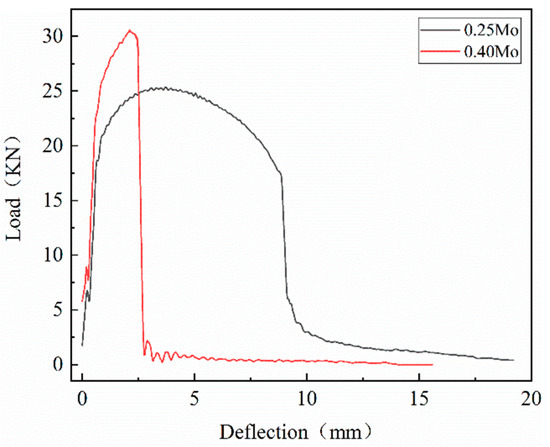
Figure 7.
The typical impact load-deflection curves obtained by the Charpy impact test for each Mo-containing sample.
Table 4.
The impact energy for samples with different Mo contents.
In the case of the 0.25% Mo sample, a relatively wide stable propagation stage was observed after the initiation of microcracks (i.e., reaching the peak load), which was followed by unstable fracture, thus indicating a higher resistance to crack propagation and resulting in higher values of propagation energy and total impact energy. On the other hand, for the sample with 0.40% Mo, almost no stable propagation stage was observed after the initiation of microcracks, and the fracture occurred in an unstable manner, indicating a worse resistance to crack propagation, which resulted in lower values of propagation energy and total impact energy.
Figure 8 presents the SEM images of the impact fracture surfaces for samples with different Mo contents. Figure 8a,b depicts the macroscopic morphology of the fracture surfaces for the samples with 0.25% Mo and 0.40% Mo, respectively, with both exhibiting the features of mixed fracture. Predominantly ductile fracture was indicated from the occupancy of approximately 80% of the total area by the fiber region of the 0.25% Mo sample (denoted as area a1 in Figure 8a). In contrast, only about 10% of the total area was covered by the fiber region for the sample with 0.40% Mo, indicating a pronounced brittle fracture behavior. Highly magnified images for the microscopic observations of the fiber region are shown in Figure 8(a1,b1). In both the cases, the presence of dimples was the dominant feature, which was indicative of ductile behavior. However, in the sample with 0.25% Mo, the dimples were small and deep and exhibited a uniform size, thus indicating a higher toughness level [12,19,20]. Conversely, in the sample with 0.4% Mo, the impact toughness was indicative to be inferior based on inconsistent dimple sizes, with some regions displaying larger and shallower dimples [20,21]. Radiative region observations of the microstructure revealing the prevalence of cleavage planes are depicted in Figure 8(a2,b2). For the sample with 0.25% Mo, superior impact toughness was indicated by the occurrence of numerous toughness-induced tear ridges and high-density micropores along the tear ridges. In contrast, typical characteristics of brittle fracture and inferior toughness were displayed by the sample with 0.40% Mo, exhibiting predominantly coarse cleavage planes.
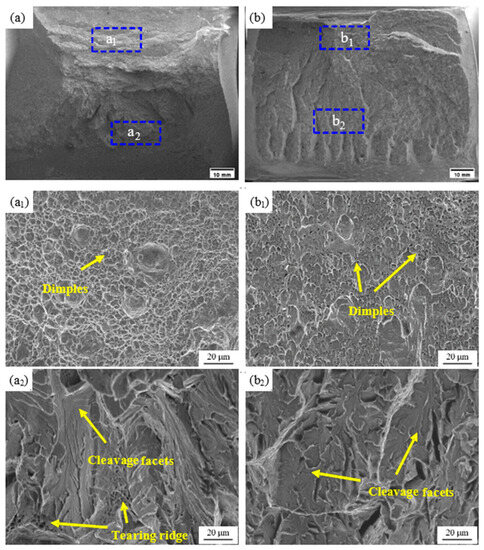
Figure 8.
SEM images of the impact fracture surfaces for samples with different Mo contents: (a,a1,a2) 0.25% Mo and (b,b1,b2) 0.40% Mo.
4. Discussion
4.1. Effect of Mo Content on the Multiphase Microstructure
Figure 2 demonstrates multiphase composite microstructures consisting of polygonal ferrite (PF), granular bainite (GB), and lath bainite (LB) exhibited by the samples with different Mo contents. With increasing Mo content, the amounts of PF and GB decreased at the expense of LB. Thus, the types and share of microstructural components were significantly affected by increased Mo content. For understanding the influence of Mo content on microstructural evolution, the thermal expansion curves were measured for samples with different Mo contents during the controlled rolling and cooling processes. The tangent method was used to determine the phase transition temperatures (Figure 9). It could be observed that increasing the Mo content from 0.25% to 0.40% resulted in a decrease in the starting temperature (Ar3) of the austenite-to-ferrite (γ→α) transformation from 639 °C to 614 °C, while the finishing temperature (Ar1) lowered from 488 °C to 476 °C. This indicated a shift of the bainite transformation to lower temperature ranges due to increased Mo content. Previous studies [22,23] have indicated that the transformation temperature of γ→GB is typically higher than that of γ→LB. Consequently, the transformation from γ to GB occurs prior to the transformation from γ to LB. Therefore, by lowering the Ar3 temperature, an increase in Mo content promoted the γ→LB transformation while inhibiting the γ→GB transformation. This resulted in a decrease in the GB content with a simultaneous increase in the LB content in the microstructure. Additionally, PF formation belongs to high-temperature transformation and requires sufficient carbon atom diffusion in a higher temperature range [18,21,22,24]. However, an increase in Mo content hindered carbon atom diffusion by lowering the Ar3 temperature, which inhibited PF formation, leading to a gradual reduction in the PF content in the microstructure.
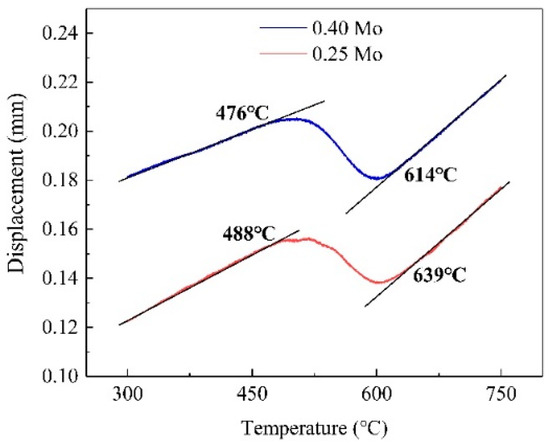
Figure 9.
Expansion curves and Ar3 temperatures for each Mo-containing sample.
The sample with 0.4% Mo exhibited a higher degree of undercooling compared to the sample with 0.25% Mo due to the lower γ→α transformation temperature, resulting in a higher transformation driving force and nucleation rate from what was found in earlier works [18,22,24]. Consequently, the 0.40% Mo sample exhibited a smaller mean equivalent diameter (MED) value (at any MTA) (Figure 5 and Figure 6a). Simultaneously, the formation of refined LB is promoted while suppressing PF and GB formation due to a lower Ar3 temperature. High-angle grain boundaries characterized the boundaries of PF [21], while density of dislocation substructures was higher in LB compared to GB [18]. Both factors contributed to the reduction in the high-angle grain boundary content with an increase in the Mo content (Figure 6b and Table 3).
The continuous cooling transformation process from γ→α (BF+PF) + γ′ (metastable austenite) begins at Ar3 and ends at Ar1. This process is primarily controlled by carbon diffusion. Diffusion of carbon atoms from α-Fe into γ takes place during the γ→α transformation since the solubility of carbon atoms in austenite is greater than in ferrite. Different mechanisms such as lattice diffusion and dislocation pipe diffusion are responsible for this behavior, which results in carbon redistribution within γ, leading to carbon enrichment and the formation of carbon-rich metastable phase γ′. During subsequent cooling, M/A constituents known as a combination of martensite and untransformed γ′ are formed during martensitic transformation of γ′. Therefore, the presence of γ′ determines the content and size of the M/A constituents. With increasing Mo content, the transformation from austenite to ferrite is delayed due to inhibition of carbon diffusion resulting from decreased Ar3 temperature. Additionally, the decrease in Mo content lowered the temperature for martensitic transformation, increased the stability of austenite, and subsequently enhanced the content of γ′. This was the primary reason for extended content of the M/A constituents with increasing Mo content. Moreover, as shown in Figure 3, increasing Mo content also significantly enhanced the content of slender M/A constituents and Island M/A constituents. This is mainly attributed to the promotion of higher LB content caused by the increase in Mo content. The metastable austenite γ′ transformed between refined LB ferrite laths was responsible for the formation of slender M/A constituents while Massive M/A constituents were formed from γ′ located at the boundaries of GBF or PF, as it was earlier found in works [12]. Furthermore, an increase in Mo content lowered the starting temperature of bainite transformation, resulting in the refinement of BF and PF and, consequently, increasing the content of Island M/A constituents in the samples.
4.2. Effect of Mo Content on the Impact Toughness
A large number of studies have shown that grain size [8,14,25], M/A constituents [2,6,12,15,19,20], and microstructure composition [7,11] significantly affect the low-temperature toughness of this kind of low-carbon micro-alloyed steel. In particular, the impact toughness is significantly affected by the size, content, and shape of the hard-phase M/A constituents [2,6,12,15,19,20]. A high content of dislocation tangles is formed due to the compression stress of the ferritic matrix around the M/A constituents caused by volume expansion resulting from the phase transformation [15,18,26]. Dislocation slip is easily blocked at the area of dislocation tangles, and further aggregates, resulting in higher local microstrain concentration and, finally, the initiation of micropores or microcracks [26,27,28]. In addition, the M/A constituents and ferritic matrix have different hardness and elastic modulus. Due to uncoordinated deformation of M/A constituents during the deformation under impact load, formation of micropores or microcracks takes place at the interface of the two components [20,21].
Generally, grain refinement can improve the impact toughness [14,25,29,30]. In this study, MED was found to decrease with increasing Mo content, but rather than enhancement, the impact energy deteriorated. The results (Table 4, Figure 6) showed that grain size was not the main factor determining the impact toughness of test steel. Based on the microstructure observations in Section 2, increasing Mo content significantly changed the size, content, and morphology of the M/A constituents. It showed that the impact fracture behavior was dominated by a change in the M/A constituents. With increasing Mo content, the amount of M/A constituents, especially in the form of slender M/A, increased in the sample. Such M/A constituents were extremely unfavorable to impact toughness. The reasons were as follows: (1) Increasing the supercooling degree of the phase transition results caused by an increase in the Mo content results in a higher content of dislocation tangles in the adjacent ferrite matrix during the formation of slender M/A constituents, which results in large local microstrains and an increased tendency of microcrack initiation. (2) For a large content of M/A in large-size strips, the local microstrain concentration would be further increased due to the superimposition of the stress field generated by adjacent M/A constituents, thereby resulting in the tendency of microcrack initiation to further increase. EBSD analysis results (Figure 10) showed that in the sample with 0.40% Mo, a higher microstrain concentration was manifested in the higher KAM value at the slender M/A constituents, thus confirming the results of earlier works [15,18,19]. The crack initiation and propagation behaviors of samples with different Mo contents were further analyzed (Figure 11). It could be seen that the secondary cracks of the sample with 0.25% Mo mainly initiated micropores at the M/A, which manifested and expanded in the way of micropore coarsening. In the process of micropore formation, significant deformation of the ferritic matrix took place, which reduces the tendency of microstrain concentration by releasing the stress between the M/A manifested and neighboring matrix. The sample obtained a high-crack initiation energy (Figure 7 and Table 4), and the impact fracture was mainly ductile (Figure 8a). However, increasing the Mo content to 0.40% resulted in the beginning of multiple microcracks, which expanded at the M/A strip and showed a larger tendency for the initiation of microcracks. The crack initiation energy of the sample was lower, and the impact fracture was dominated by brittle fracture (Figure 8b).
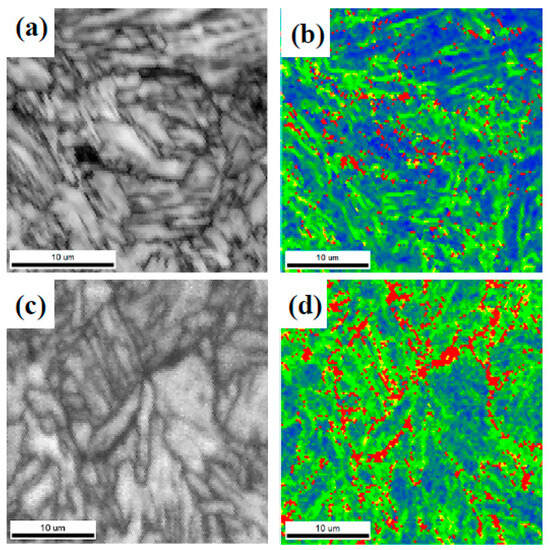
Figure 10.
The IQ (impact quantity) and KAM (kernel average misorientation) maps of samples with different Mo contents: (a,b) 0.25% Mo and (c,d) 0.40% Mo.
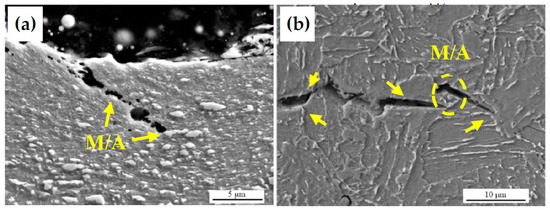
Figure 11.
SEM images of typical secondary cracks in the cross-section of impact fracture samples: (a) 0.25% Mo, (b) 0.40% Mo.
In addition, a large number of studies [19,21] have shown that when encountering high-angle grain boundaries, deflection or bending of microcracks takes place, and thus consumes more crack propagation work. It is beneficial for the improvement of impact toughness [19,20,21]. In this study, with increasing Mo content, although MED decreased and refining of the microstructure took place, higher LB content was formed in the microstructures along with a large number of dislocation tangles and other substructures (belonging to low-angle grain boundaries) [15,18,27] in LB due to the higher phase transition degree of supercooling. The PF content with HAGB also decreased, ultimately resulting in a lower amount of HAGB in the sample (Table 3). Therefore, in this study, increasing the Mo content resulted in a decrease in the HAGB amount and the ability to impede crack propagation. EBSD observation results of secondary crack propagation behavior at the impact fracture in Figure 12a showed that in the 0.25% Mo sample, microvoids initiation and their coarsening were the main form of expansion for the secondary cracks, which was consistent with the results observed by means of SEM (Figure 11a). For the sample with 0.40% Mo content, after initiation, direct extension of the microcrack through the LAGB propagated via a longer path and finally terminated at the HAGB (Figure 11b and Figure 12b). The crack propagation inhibition ability of the structure was poor, and finally, there was lower impact energy due to consumption of less crack propagation energy (Figure 7). This was another reason for a decrease in the impact energy with increasing Mo content.
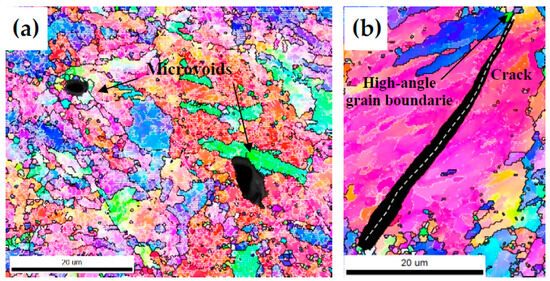
Figure 12.
EBSD inverse pole figures of the secondary cracks underneath the ductile fracture surface for (a) 0.25% Mo sample and the brittle fracture surface for (b) 0.40% Mo sample.
When designing the alloy composition of high-strength steel-grade thick-walled pipeline steel, the addition of an appropriate amount of Mo is usually necessary to improve the strength of the material by increasing the hardening ability. However, this study showed that an increase in the Mo content would deteriorate the low-temperature toughness by forming a high content of strip M/A constituents in the steel. Therefore, the addition of Mo in the design of an alloy composition of high steel grade thick-walled pipeline steel should be appropriate, considering the requirements of strength and toughness. The results of this paper provided a reference composition for the design of this kind of steel.
5. Conclusions
Herein, we have investigated the effect of Mo content on the microstructure and impact toughness of thick-walled X80 pipeline steel under low temperature and revealed that the impact fracture behavior was dominated by the slender M/A constituents. The major conclusions are as follows:
1. Multiphase structure consisting of GB + LB + PF was formed in each Mo-containing steel. Increasing the Mo content from 0.25% to 0.40% resulted in the decrease of Ar3, leading to an increase of LB at the expense of GB and PF. An increase of the area fraction of the M/A constituents also occurred while the morphology gradually changed from blocky to slender M/A constituents.
2. Increasing the Mo content from 0.25% to 0.40% resulted in a decrease in the low-temperature impact energy of the test steel at −45°C from 206 J to 57 J, while changing the impact fracture behavior of test steel from ductile fracture to brittle fracture. The content of added Mo in the X80 thick-walled pipeline steel for low-temperature applications should not exceed 0.25%.
3. Microcracks were most likely caused by the slender M/A constituents compared to the blocky ones. The tendency of microcrack initiation was increased due to the increase in slender M/A constituents, while the decrease in HAGB reduces the ability to inhibit crack growth, thus leading to the deterioration of impact toughness.
Author Contributions
J.J.: Conceptualization, Writing—original draft; Z.Z.: Data curation, Validation; L.Z.: Formal analysis, Visualization; Y.G.: Funding acquisition, Investigation, Resources; L.Y.: Data curation, Validation; Q.W.: Conceptualization, Methodology, Writing—review and editing. All authors have read and agreed to the published version of the manuscript.
Funding
This work was funded by the National Key Research and Development Program of China (Grant No. 2017YFB0304800 and Grant No. 2017YFB0304802 for the second subproject), and Key Research and Development Program between Nanjing Iron & Steel United Co., Ltd. and Yanshan University (Grant No. IGAB19060004).
Data Availability Statement
Not available.
Conflicts of Interest
The authors declare no conflict of interest.
References
- Deng, W.; Gao, X.H.; Qin, X.M.; Zhao, D.W.; Du, L.X.; Wang, G.D. Impact fracture behavior of X80 pipeline steel. Acta Metall. Sin. 2010, 46, 533–540. [Google Scholar] [CrossRef]
- Fu, C.; Li, X.D.; Li, H.C.; Han, T.; Han, B.; Wang, Y. Influence of ICCGHAZ on the Low-Temperature Toughness in HAZ of Heavy-Wall X80 Pipeline Steel. Metals 2022, 12, 907. [Google Scholar] [CrossRef]
- Wang, X.Q.; Yuan, G.; Zhao, J.H.; Wang, G.D. Microstructure and Strengthening/Toughening Mechanisms of Heavy Gauge Pipeline Steel Processed by Ultrafast Cooling. Metals 2020, 10, 1323. [Google Scholar] [CrossRef]
- Zhao, J.; Hu, W.; Wang, X.; Kang, J.; Yuan, G.; Di, H.; Misra, R.D.K. Effect of microstructure on the crack propagation behavior of microalloyed 560 MPa (X80) strip during ultra-fast cooling. Mater. Sci. Eng. A 2016, 666, 214–224. [Google Scholar] [CrossRef]
- Qian, L.H.; Zhou, Q.; Zhang, F.C.; Meng, J.Y.; Zhang, M.; Tian, Y. Microstructure and mechanical properties of a low carbon carbide-free bainitic steel co-alloyed with Al and Si. Mater. Des. 2012, 39, 264–268. [Google Scholar] [CrossRef]
- Kong, J.H.; Zhen, L.; Guo, B.; Li, P.H.; Wang, A.H.; Xie, C.S. Influence of Mo content on microstructure and mechanical properties of high strength pipeline steel. Mater. Des. 2004, 25, 723–728. [Google Scholar] [CrossRef]
- Dong, L.M.; Yang, L.; Dai, J.; Zhang, Y.; Wang, X.L.; Shang, C.J. Effect of Mn, Ni, Mo Contents on Microstructure Transition and Low Temperature Toughness of Weld Metal for K65 Hot Bending Pipe. Acta Metall. Sin. 2017, 53, 657–668. [Google Scholar] [CrossRef]
- Tong, M.W.; Yuan, Z.X.; Zhang, K.G.; Rui, X.L. Influence of Mo Content on Microstructure and Mechanical Properties of Fire-Resistant Construction Steel. J. Iron Steel Res. Int. 2011, 18, 903–907. [Google Scholar]
- Far, A.R.H.; Anijdan, S.H.M.; Abbasi, S.M. The effect of increasing Cu and Ni on a significant enhancement of mechanical properties of high strength low alloy, low carbon steels of HSLA-100 type. Mater. Sci. Eng. A 2019, 746, 384–393. [Google Scholar] [CrossRef]
- Bhole, S.D.; Nemade, J.B.; Collins, L.; Liu, C. Effect of nickel and molybdenum additions on weld metal toughness in a submerged arc welded HSLA line-pipe steel. J. Mater. Process. Technol. 2006, 173, 92–100. [Google Scholar] [CrossRef]
- Hu, H.J.; Xu, G.; Zhou, M.X.; Yuan, Q. Effect of Mo Content on Microstructure and Property of Low-Carbon Bainitic Steels. Metals 2016, 6, 173. [Google Scholar] [CrossRef]
- Zhang, L.F.; Wang, Y.F.; Zhang, L.; Wang, Q.F.; Wang, T.S. Mo Content Effect on Microstructures and Toughness of the Simulated Coarse-Grained Heat-Affected Zone of Weathering Bridge Steels. J. Mater. Eng. Perform. 2022, 31, 5641–5651. [Google Scholar] [CrossRef]
- Soliman, M.; Mostafa, H.; El-Sabbagh, A.S.; Palkowski, H. Low temperature bainite in steel with 0.26 wt% C. Mater. Sci. Eng. A 2010, 527, 7706–7713. [Google Scholar] [CrossRef]
- Mohrbacher, H.; Sun, X.J.; Yong, Q.L.; Dong, H. MoNb-Based Alloying Concepts for Low-Carbon Bainitic Steels. In Proceedings of the 1st International Conference on Advanced Steels (ICAS 2010), Chinese Soc Met, Guilin, China, 9–11 November 2010; pp. 289–301. [Google Scholar]
- Zhao, L.Y.; Wang, Q.M.; Shi, G.H.; Hu, B.; Wang, S.B.; Qiao, M.L.; Wang, Q.F.; Liu, R.P. The impacts of M/A constituents decomposition and complex precipitation on mechanical properties of high-strength weathering steel subjected to tempering treatment. J. Mater. Res. Technol.-JMRT 2023, 23, 2504–2526. [Google Scholar] [CrossRef]
- Xie, C.S.; Liu, Z.D.; He, X.K.; Wang, X.T.; Qiao, S.B. Effect of martensite-austenite constituents on impact toughness of pre-tempered MnNiMo bainitic steel. Mater. Charact. 2020, 161, 14. [Google Scholar] [CrossRef]
- Long, X.Y.; Zhang, F.C.; Kang, J.; Lv, B.; Shi, X.B. Low-temperature bainite in low-carbon steel. Mater. Sci. Eng. A 2014, 594, 344–351. [Google Scholar] [CrossRef]
- Zhao, L.Y.; Wang, Q.F.; Shi, G.H.; Yang, X.Y.; Qiao, M.L.; Wu, J.P.; Zhang, F.C. In-depth understanding of the relationship between dislocation substructure and tensile properties in a low-carbon microalloyed steel. Mater. Sci. Eng. A 2022, 854, 12. [Google Scholar] [CrossRef]
- Shi, G.H.; Zhao, H.L.; Zhang, S.M.; Wang, Q.F.; Zhang, F.C. Microstructural characteristics and impact fracture behaviors of low-carbon vanadium-microalloyed steel with different nitrogen contents. Mater. Sci. Eng. A 2020, 769, 13. [Google Scholar] [CrossRef]
- Zhang, Y.; Shi, G.H.; Sun, R.; Guo, K.; Zhang, C.L.; Wang, Q.F. Effect of Si content on the microstructures and the impact properties in the coarse-grained heat-affected zone (CGHAZ) of typical weathering steel. Mater. Sci. Eng. A 2019, 762, 10. [Google Scholar] [CrossRef]
- Fan, H.B.; Shi, G.H.; Wang, Q.M.; Wang, L.P.; Wang, Q.F.; Zhang, F.C. Improvement of impact toughness by microstructure refinement of simulated CGHAZ through enhancing welding heat input of low carbon Mo-V-Ti-N-B steel. Mater. Res. Express 2022, 9, 11. [Google Scholar] [CrossRef]
- Lan, L.Y.; Qiu, C.L.; Zhao, D.W.; Gao, X.H.; Du, L.X. Microstructural characteristics and toughness of the simulated coarse grained heat affected zone of high strength low carbon bainitic steel. Mater. Sci. Eng. A 2011, 529, 192–200. [Google Scholar] [CrossRef]
- Zhu, D.M.; He, J.L.; Shi, G.H.; Wang, Q.F. Effect of Welding Heat Input on the Microstructure and Impact Toughness of the Simulated CGHAZ in Q500qE Steel. Acta Metall. Sin. 2022, 58, 8. [Google Scholar]
- Wang, L.P.; Fan, H.B.; Shi, G.H.; Wang, Q.M.; Wang, Q.F.; Zhang, F.C. Effect of Ferritic Morphology on Yield Strength of CGHAZ in a Low Carbon Mo-V-N-Ti-B Steel. Metals 2021, 11, 1863. [Google Scholar] [CrossRef]
- Kim, S.; Lee, S.; Lee, B.S. Effects of grain size on fracture toughness in transition temperature region of Mn-Mo-Ni low-alloy steels. Mater. Sci. Eng. A 2003, 359, 198–209. [Google Scholar] [CrossRef]
- Fan, L.; Zhou, D.H.; Wang, T.L.; Li, S.R.; Wang, Q.F. Tensile properties of an acicular ferrite and martensite/austenite constituent steel with varying cooling rates. Mater. Sci. Eng. A 2014, 590, 224–231. [Google Scholar] [CrossRef]
- Huda, N.; Wang, Y.Y.; Li, L.J.; Gerlich, A.P. Effect of martensite-austenite (MA) distribution on mechanical properties of inter-critical Reheated Coarse Grain heat affected zone in X80 linepipe steel. Mater. Sci. Eng. A 2019, 765, 9. [Google Scholar] [CrossRef]
- Taboada, M.C.; Iza-Mendia, A.; Gutierrez, I.; Jorge-Badiola, D. Substructure Development and Damage Initiation in a Carbide-Free Bainitic Steel upon Tensile Test. Metals 2019, 9, 1261. [Google Scholar] [CrossRef]
- Han, J.; da Silva, A.K.; Ponge, D.; Raabe, D.; Lee, S.M.; Lee, Y.K.; Lee, S.I.; Hwang, B. The effects of prior austenite grain boundaries and microstructural morphology on the impact toughness of intercritically annealed medium Mn steel. Acta Mater. 2017, 122, 199–206. [Google Scholar] [CrossRef]
- Li, J.; Hu, B.; Zhao, L.; Li, F.; He, J.; Wang, Q.; Liu, R. Influence of Heat Input on the Microstructure and Impact Toughness in Weld Metal by High-Efficiency Submerged Arc Welding. Metals 2023, 13, 1217. [Google Scholar] [CrossRef]
Disclaimer/Publisher’s Note: The statements, opinions and data contained in all publications are solely those of the individual author(s) and contributor(s) and not of MDPI and/or the editor(s). MDPI and/or the editor(s) disclaim responsibility for any injury to people or property resulting from any ideas, methods, instructions or products referred to in the content. |
© 2023 by the authors. Licensee MDPI, Basel, Switzerland. This article is an open access article distributed under the terms and conditions of the Creative Commons Attribution (CC BY) license (https://creativecommons.org/licenses/by/4.0/).