Article

Analysis on the Key Parameters to Predict Flow Stress during Ausforming in a High-Carbon Bainitic Steel

1
The State Key Laboratory of Refractories and Metallurgy, Wuhan University of Science and Technology, Wuhan 430081, China
2
Baosteel Research Institute, 889 Fujin Rd., Shanghai 201900, China
3
Nanyang Hanye Special Steel Co., Ltd., Nanyang 474500, China
*
Author to whom correspondence should be addressed.
Metals 2023, 13(9), 1526; https://doi.org/10.3390/met13091526
Submission received: 13 July 2023 / Revised: 11 August 2023 / Accepted: 25 August 2023 / Published: 28 August 2023

Abstract

:
Since flow stress is an important parameter in the processing and application of metallic materials, it is necessary to trace the flow stress during austenite deformation. Thermal compression deformation of austenite in a high-strength bainitic steel was conducted using a Gleeble-3500 thermo-mechanical simulator, within the deformation temperature range of 400 °C~900 °C. By analyzing the stress–strain curves and strain-hardening exponent, the effects of strain hardening and dynamic recovery on the dislocation density of the material during the thermal processing were considered in the present work. Based on the general form of the Kocks–Mecking–Estrin (KME) model, the effects of deformation temperature and strain on the key parameters of the model were clarified. Differing from other work which commonly terms m (strain rate sensitivity exponent) and k2 (dimensionless parameters for dynamic recovery) as constants, the current models consider the quantitative relationship between key parameters and deformation temperature and strain. The results show that m is an exponential function related to temperature and strain, which decreases with the increase in strain. Meanwhile, k2 is a temperature-dependent polynomial function that increases as the deformation temperature increases. Finally, a modified constitutive KME model was proposed to predict the austenitic plastic stress with strain. Using established m-ε and k2-T models, the predicted curves are in good agreement with the experimental measurements.

1. Introduction

The research and production of high-strength bainitic steels has been receiving extensive attention from the steel research and business communities due to their high strength and excellent ductility. Austenite ausforming can improve the phase transformation kinetics and microstructure of high-strength bainitic steel [1,2]. Flow stress is one of the most important physical parameters of steels. From the viewpoint of mechanical processing, the applied stress is expected to reach the flow stress in order to cause plastic deformation. Otherwise, structural parts made of steel are not allowed to exhibit plastic deformation during service. Thus, flow stress curves of steels are important raw data for calculating plastic processing force or engineering safety. A reliable and accurate description of flow stress behavior in metal materials processing and engineering is important.
Many previous studies on stress–strain in austenite pointed out that the evolution of dislocation density has an important influence on austenitic flow stress behavior and that the increase or annihilation of dislocations is the main cause of hardening or softening of the material [3,4,5,6]. Strain hardening during deformation occurs due to an increase in dislocation density, which plays an important role in affecting the mechanical properties of metals. Therefore, the development of a flow stress model depending on dislocation density is essential for the processing and application of metallic materials. Taylor et al. [7] made the first attempt to relate the shear strength of a material to its microstructure, showing that the flow stress is proportional to the square root of the dislocation density. Zerilli and Armstrong (Z-A model) [8] explored the effect of dislocation density on the mechanical properties of a material into two parts (body-centered cubic and face-centered cubic) according to the characteristics of the metal crystal structure. In the Z-A model, the thermal activation required to overcome local obstacles to dislocation motion, as well as the dislocations interaction, was analyzed. Nevertheless, this activation is only applicable at large strain rates and relatively high temperatures [8]. Johnson and Cook et al. (J-C model) [9,10] proposed a constitutive model which is applicable under large strains, high strain rates and high temperatures. The J-C model is purely phenomenological and contains a low amount of material parameters. Samantaray et al. [11] showed that the J-C model was insufficient to describe the flow behavior of their experimental steel because it did not take into account the coupling effects of strain and temperature. An appropriate constitutive model should have the ability to describe the mechanical response of materials under load at different deformation temperatures and strains. The Kocks–Mecking–Estrin (KME model) [12,13,14] explored a phenomenological approach to describe the plastic flow behavior of metals under conditions of continuous plastic deformation. The flow stress as a function of dislocation density was investigated in the KME model, which adequately describes the mechanical response of single-phase and coarse-grained materials under unidirectional loading, suggesting that the microstructure of the material is influenced by the evolution of dislocation density. Numerous studies have shown the importance of using the evolution of dislocation density to predict flow stresses and to describe different types of plastic deformation. Estrin et al. [12,15] proposed that the dislocation density is an internal variable with which to characterize the microstructure of materials, and then modeled the viscoplastic behavior of polycrystalline materials according to the evolution of the dislocation density, considering the metallurgical characteristics of metallic materials under different deformation conditions. They also studied the general expression of the KME model. However, the quantitative relationship between key parameters and deformation temperature and strain has not been clearly explained.
The present work aims to investigate the coupled effects of deformation temperature and strain on austenite flow stress via thermal compression deformation tests. The physical significance of the key parameters in the KME model was clarified and their relationship with temperature and strain was analyzed. Finally, the quantitative relationships between the dislocation annihilation coefficient k2 and the deformation temperature, as well as the strain rate sensitivity exponent m of the KME model and strain, were clarified. Expressing the effects of k2 and m on the flow stress as a function can improve the accuracy of the flow stress prediction model and provides guidance for the ausforming process of high-carbon bainitic steels.

2. Experiment

The chemical composition of the tested steel is 0.83C-1.85Si-2.03Mn-1.12Cr-1.10Al-1.68Co (wt.%), which is one of the typical high-strength bainitic steels. The material was refined in a vacuum induction furnace and casted into a 50 kg ingot. The ingot was homogenized at 1280 °C for 5 h, followed by 7 passes of hot rolling into a 14.0 mm slab. After hot rolling with a finishing temperature of 910 °C, the steel plate was air-cooled to the ambient temperature. The specimens were cut into the dimension of 10 mm diameter and 15 mm height. Compressive ausforming tests were conducted on a Gleeble-3500 thermo-mechanical simulator according to the processing schedules shown in Figure 1. The sample surface was carefully polished to reduce friction, and the edges of the dies made using tungsten–molybdenum alloy were kept smooth. In addition, a high-temperature Ni-based lubricant was used on both edges to further reduce friction. The specimens were heated to 1100 °C at a heating rate of 5 °C/s and maintained for 15 min to ensure complete austenitization. Subsequently, all the specimens were cooled to different temperatures (400 °C, 450 °C, 500 °C, 550 °C, 600 °C, 650 °C, 700 °C, 750 °C, 800 °C, 850 °C and 900 °C) at a cooling rate of 5 °C/s and held for 5 s before deformation. The above temperature range was selected according to the common ausforming region of high-carbon bainitic steel. A compressive strain of 0.2 was applied to each sample with a strain rate of 1 s−1. After deformation, all the cases were immediately cooled to room temperature at a rate of 5 °C/s. During the experiment, the change in the radial expansion of the cylinder sample was recorded.

3. Results and Discussions

3.1. Flow Stress during Ausforming

Figure 2 shows the stress–strain curves of the experimental steel at different deformation temperatures. It should be noted that each pre-deformed matrix was austenite because no phase transformation occurred during the cooling process used to reach the deformation temperature. The flow stress in austenite increases with the decrease in deformation temperature. Moreover, the unflagging flow stress–strain curves indicate that only dynamic recovery, but no recrystallization, occurred during the deformation.
The microstructure and properties of metal materials are influenced by the hardening and softening processes that occur during hot working. The strain hardening exponent n reflects the ability of a metallic material to resist uniform plastic deformation and is a performance exponent that characterizes the work-hardening behavior of metal materials. The empirical formula used to calculate the strain hardening exponent is n = d l n σ d l n ε , where σ is the flow stress (MPa), ε is the strain, and the larger the value of n, the more significant the work hardening. It can be seen from the empirical formula that under the same strain, the higher the flow stress, the greater the value of n, and the strain hardening effect of the test steel is significant. Therefore, based on the stress–strain curve of the test steel, it can be seen that the softening effect of the specimen is obvious when the deformation temperature is high. On the contrary, when the deformation temperature is low, the work hardening of the specimen is dominant.

3.2. Modeling of Stress–Strain

Kocks et al. [5,16] attempted to incorporate the microstructure information of materials into the constitutive description, essentially describing the flow stress sustained in materials. The KME constitutive model describes the flow stress as a function of strain, strain rate and temperature, where the appropriate mathematical form for the kinetic equation obeys a power law [17,18].
ε ˙ p = ε ˙ 0 ( σ σ ^ ) m
Equation (1) is an Arrhenius equation rewritten in power law form only for convenience [18], where ε ˙ p is the plastic strain rate, ε ˙ 0 the reference strain rate, generally taken as 0.001 [19], σ the austenite flow stress. The parameter σ ^ is an internal variable indicating the state of the material and m represents the “isostructural” strain rate sensitivity (SRS) exponent. The SRS exponent is critical to the predicting accuracy of flow stress, which was usually given as a constant value in many studies. Estrin et al. [15] set the value of SRS exponent as 5.97 and 15.7 and accurately calculated the flow stress of their experimental steel. Based on the work of Wei et al. [20], m ranges from 0.015 to 0.042 when the deformation temperature is in the range from room temperature to 400 °C. However, setting m as constant is not always adequate to provide a good description of flow behavior in steels [20,21]. Likewise, setting SRS exponent as a constant value was not accurate at predicting the flow stress of the present steel. Actually, the SRS exponent could be a function of stress, strain rate and temperature, which can be expressed as [17]:
m = ( l g σ l g ε ˙ ) T , S t r u c t u r e
where ε ˙ is the strain rate, the subscript (T, structure) denotes that m is affected by both deformation temperature and material structure. Thus, the value of m needs to be cautiously addressed to predict flow stress in materials. The function relationship between the internal variables of steel and dislocation density can be expressed as [22]:
σ ^ = M α G b ρ
where M is the Taylor factor, taken as 3.06 [23], α is the thermal activation constant, expressed as α = s ( ε ˙ , T ) α 0 , where s decreases with increasing deformation temperature and decreasing strain rate, and α0 depends on the geometric arrangement of dislocations [24]. In most cases, α is generally selected as 0.3~0.7 [4,25,26]. G, b, and ρ are the shear modulus, magnitude of the dislocation Burgers vector, and dislocation density, respectively. The classical KME model was used to evaluate the dislocation accumulation and annihilation during the deformation process, where the equation for the evolution of ρ reads [16]:
d ρ d ε = M ( k 1 ρ k 2 ρ )
where k1 and k2 are the dimensionless parameters used to characterize the generation of dislocations and dynamic recovery, respectively [27]. The production term, k 1 ρ , is considered to be related to the athermal hardening stage (stage Ⅱ) of the work hardening process [18]. At this stage, the material continues to deform with the increase in applied stress. When the strain reaches a certain extent, the moving dislocations are hindered, resulting in a pile-up of dislocation and generating forest dislocations. The forest dislocations and moving dislocations interact with each other, which can cause an increase in resistance to slipping dislocation, leading to the accumulation of dislocations again. The second term, k 2 ρ , is associated with the dynamic recovery stage (stage Ⅲ) during the deformation process, which is due to the thermally activated process of recovery involving dislocation cross-slip (low temperature case) or dislocation climb (high temperature case) [18,28]. According to many previous works [15,18], k1 can be calculated as:
k 1 = 2 ( θ G ) ( α b ) 1
where θ is the slope of the stress–strain curve in the second stage, θ = G / 200 [18]. As the deformation temperature was changed in the present work, the shear modulus G should be temperature dependent, which can refer to the Frost and Ashby equation [29]:
G = G 0 ( 1 + T 300 T M T M μ 0 d u d T )
T M μ 0 d u d T = 0.91 ( f o r   γ i r o n )
where G0 is the shear modulus at 300 K of 81 GPa, TM is the melting temperature of 1810 K [29]. For face-centered cubic metals, the magnitude of the dislocation Burgers vector b = a γ / 2 . The austenite lattice parameter [Å] a γ can be calculated as [30]:
a γ = 3.6306 + 0.78 x c [ 1 + ( 24.9 50 x c ) ( T 727 ) × 10 6 ]
where xc is the carbon content (in atom fraction) and T is the deformation temperature (in °C).

3.3. Validation of KME Model Parameters

This section emphasizes the values of three important parameters, α, k2 and m, in the KME model and analyzes the quantitative functions of k2 and m. According to the original KME model, the range of α for this experimental steel is 0.48~0.52. Referring to many studies [27,31,32], α was determined to be 0.5 during the following calculation and the intrinsic relationship between α and T was not explored further. k1 is the parameter representing the dislocation storage term in the athermal state and can be calculated using Equations (5)–(8). As the deformation temperature increases, k1 gradually decreases, denoting the recession of the dislocation superposition. On the contrary, k2 is related to the thermal activation process and is a parameter representing dynamic recovery, which is strongly influenced by the deformation temperature and strain rate, and can be calculated using Equations (1)–(8). The value of k2 in many different cases has been given in previous studies. Estrin et al. showed [18] that the annihilation coefficient k2 ranged from 10 (room temperature) to 100 (high temperature) and increased with the increase in the deformation temperature. Hariharan et al. [12] determined the model parameters via least square fitting of the stress–strain curve and set k2 as constant of 1.22. Although many studies have analyzed the contribution of temperature to the dislocation annihilation coefficient [12,18], few of them have described a quantitative relationship between k2 and deformation temperature. This work attempted to illustrate that.
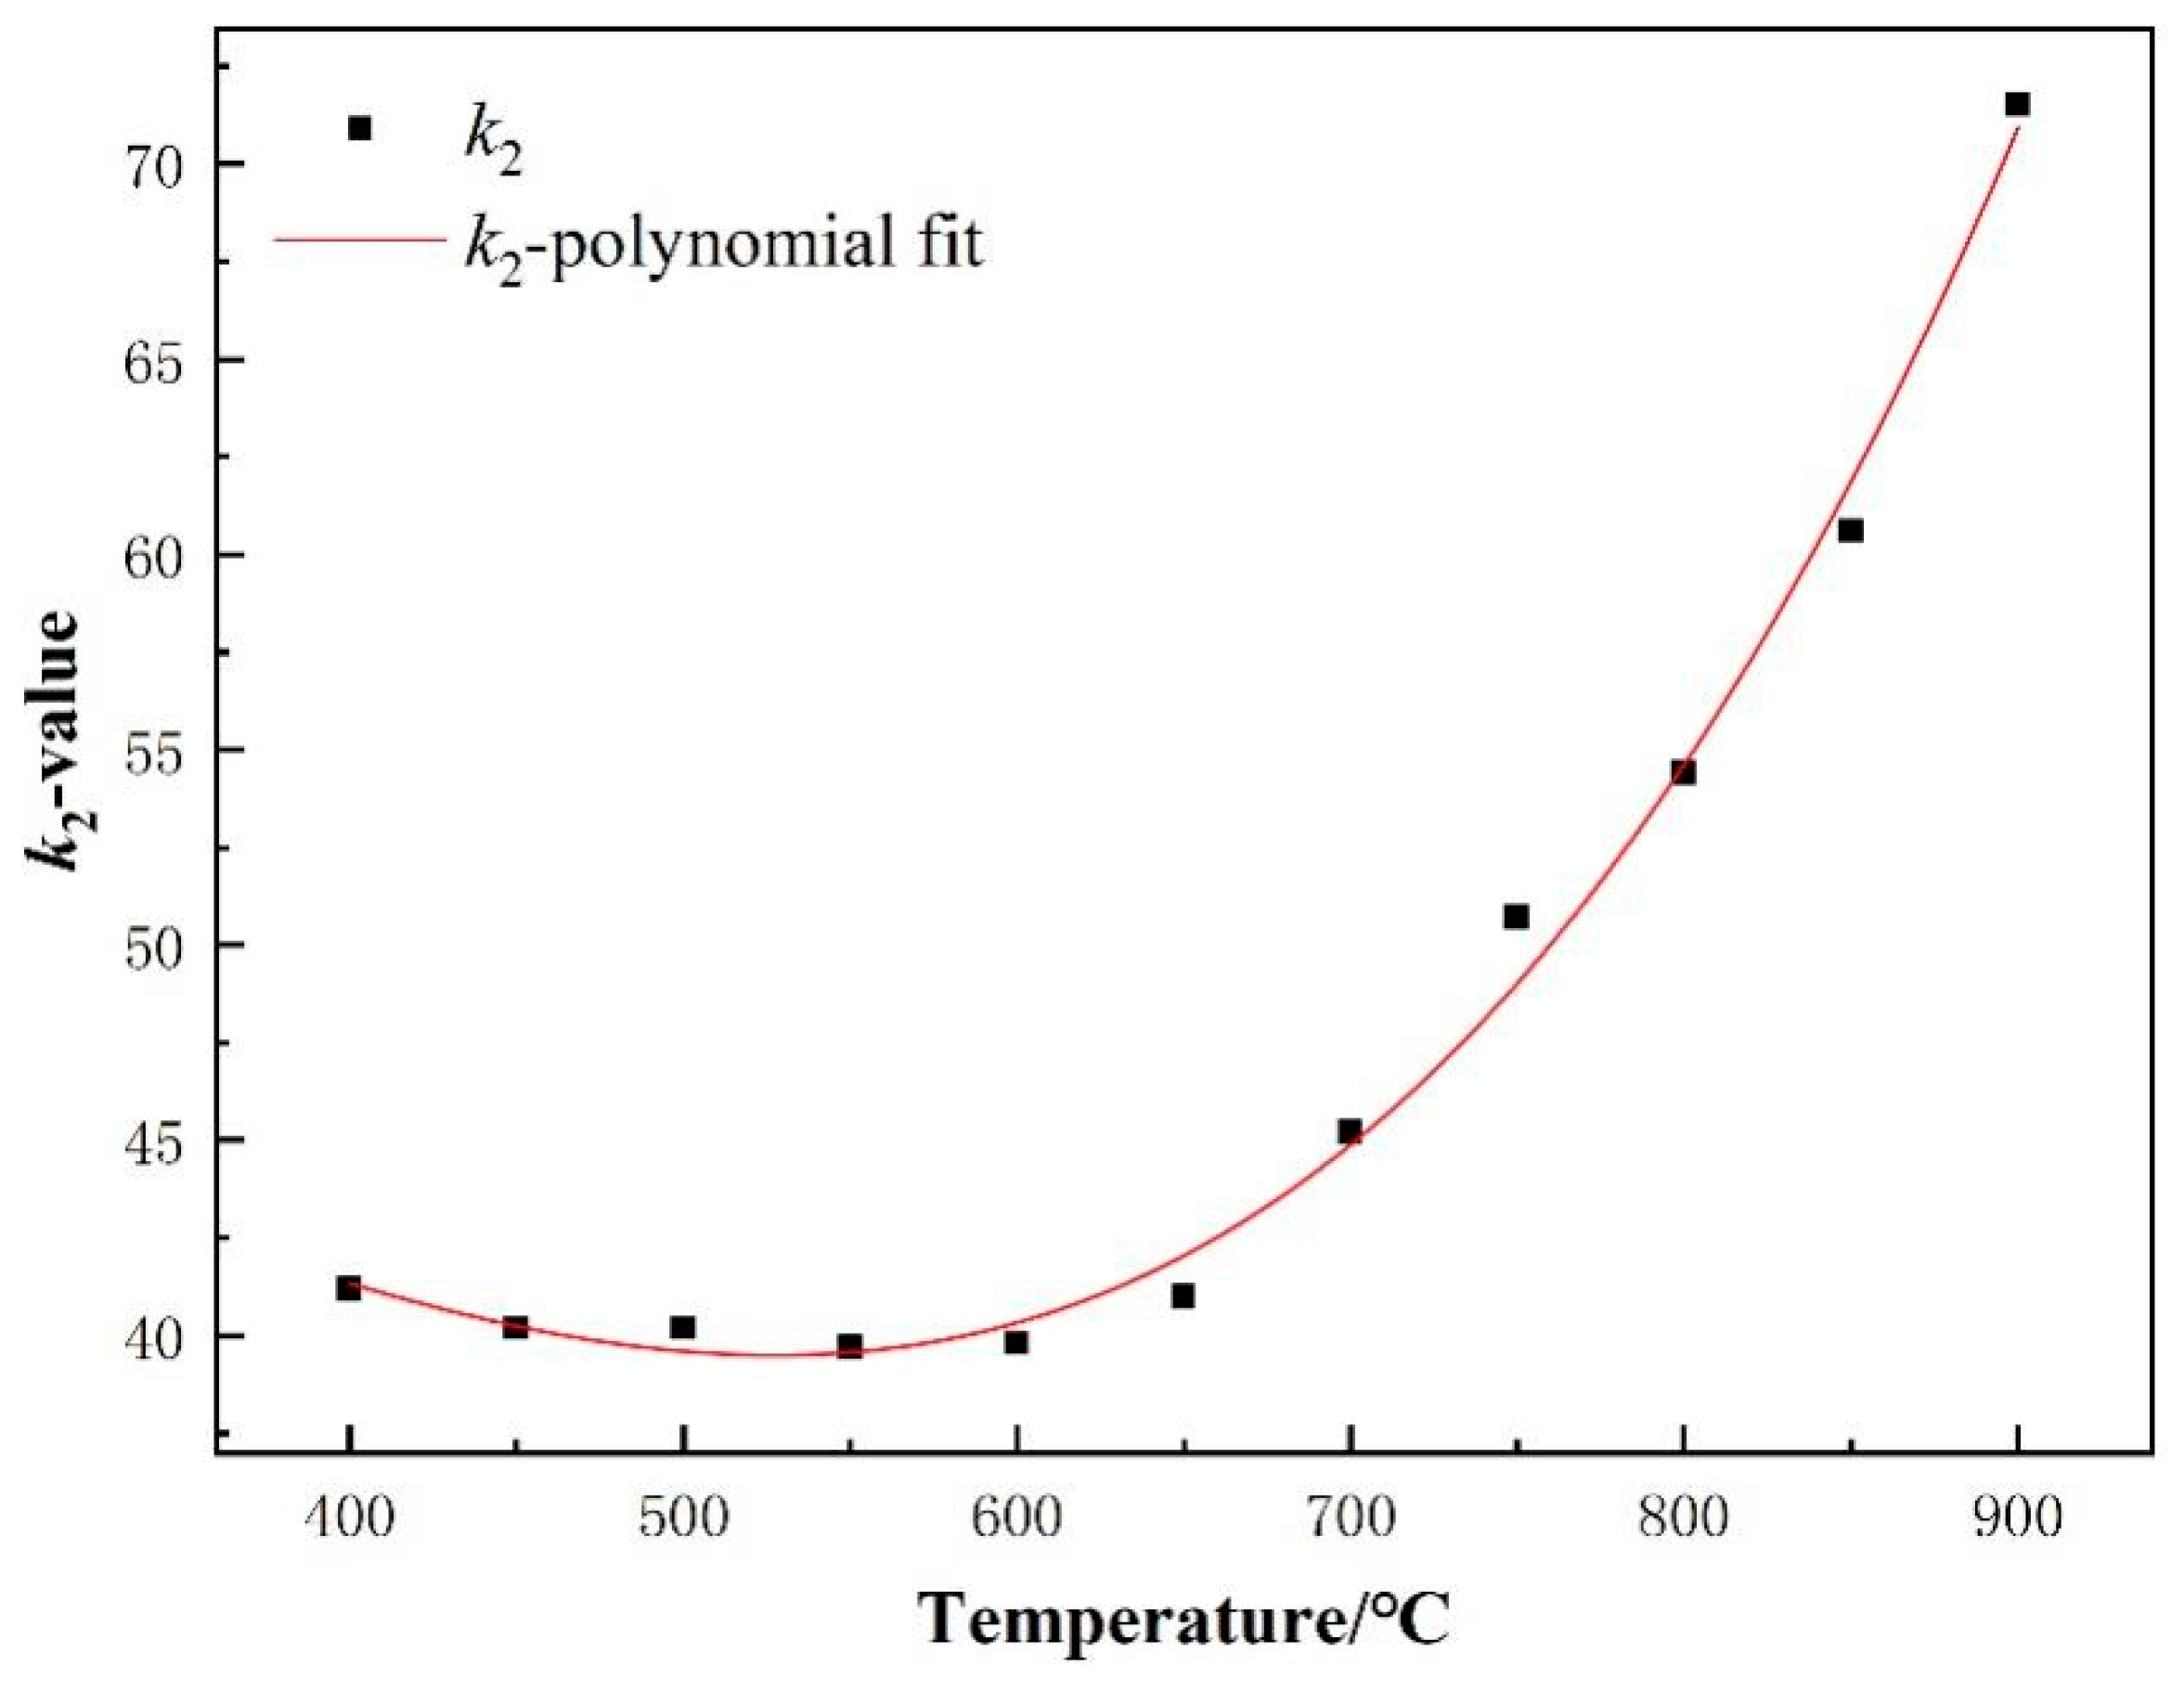
By fitting the stress–strain curves at different deformation temperatures, the variation in k2 with temperature was obtained as shown in Figure 3. The value of k2 increases slightly at a deformation temperature of 400 °C~650 °C, and then increases significantly at a deformation temperature of 700 °C~900 °C. It can be observed that k2 does not increase monotonically with the increase in temperature before 650 °C, due to the decrease in dynamic recovery in the dynamic strain aging temperature range [13]. Previous studies have shown that dynamic strain aging results in an increase in dislocation and a delay in the recovery of dislocation structures due to a decrease in the mobility of the dislocations [33,34,35]. For the sake of simplicity, the dislocation annihilation coefficient k2 can be fitted using a polynomial model k2-T, listed as follows:
k 2 = 45.83077 + 0.03892 × T 2.15897 × 10 4 × T 2 + 2.26263 × 10 7 × T 3
The SRS exponent, m, is a correlation measure of the effect of strain rate on flow stress at constant temperature [21]. Two methods can be used to calculate m: (1) calculate the value of SRS for each strain rate jump test and take an average value of them; (2) obtain the value of m from the slope of stress–strain rate data plotted at logarithmic scale [20]. However most pre-existing works termed m as an alternative constant, but not a variable monitored by strain and temperature. The present work aimed to clarify the quantitative relationship between m and the above important factors. The changing trends of m with strain and temperature were plotted in Figure 4. The value of m decreases with increasing strain, which can be attributed to the strain rate sensitivity of the structure evolution [28]. An exponential function was proposed to fit the general form of the m-ε model, which could indicate the quantitative relationship between m and strain.
m = A exp ε B + C
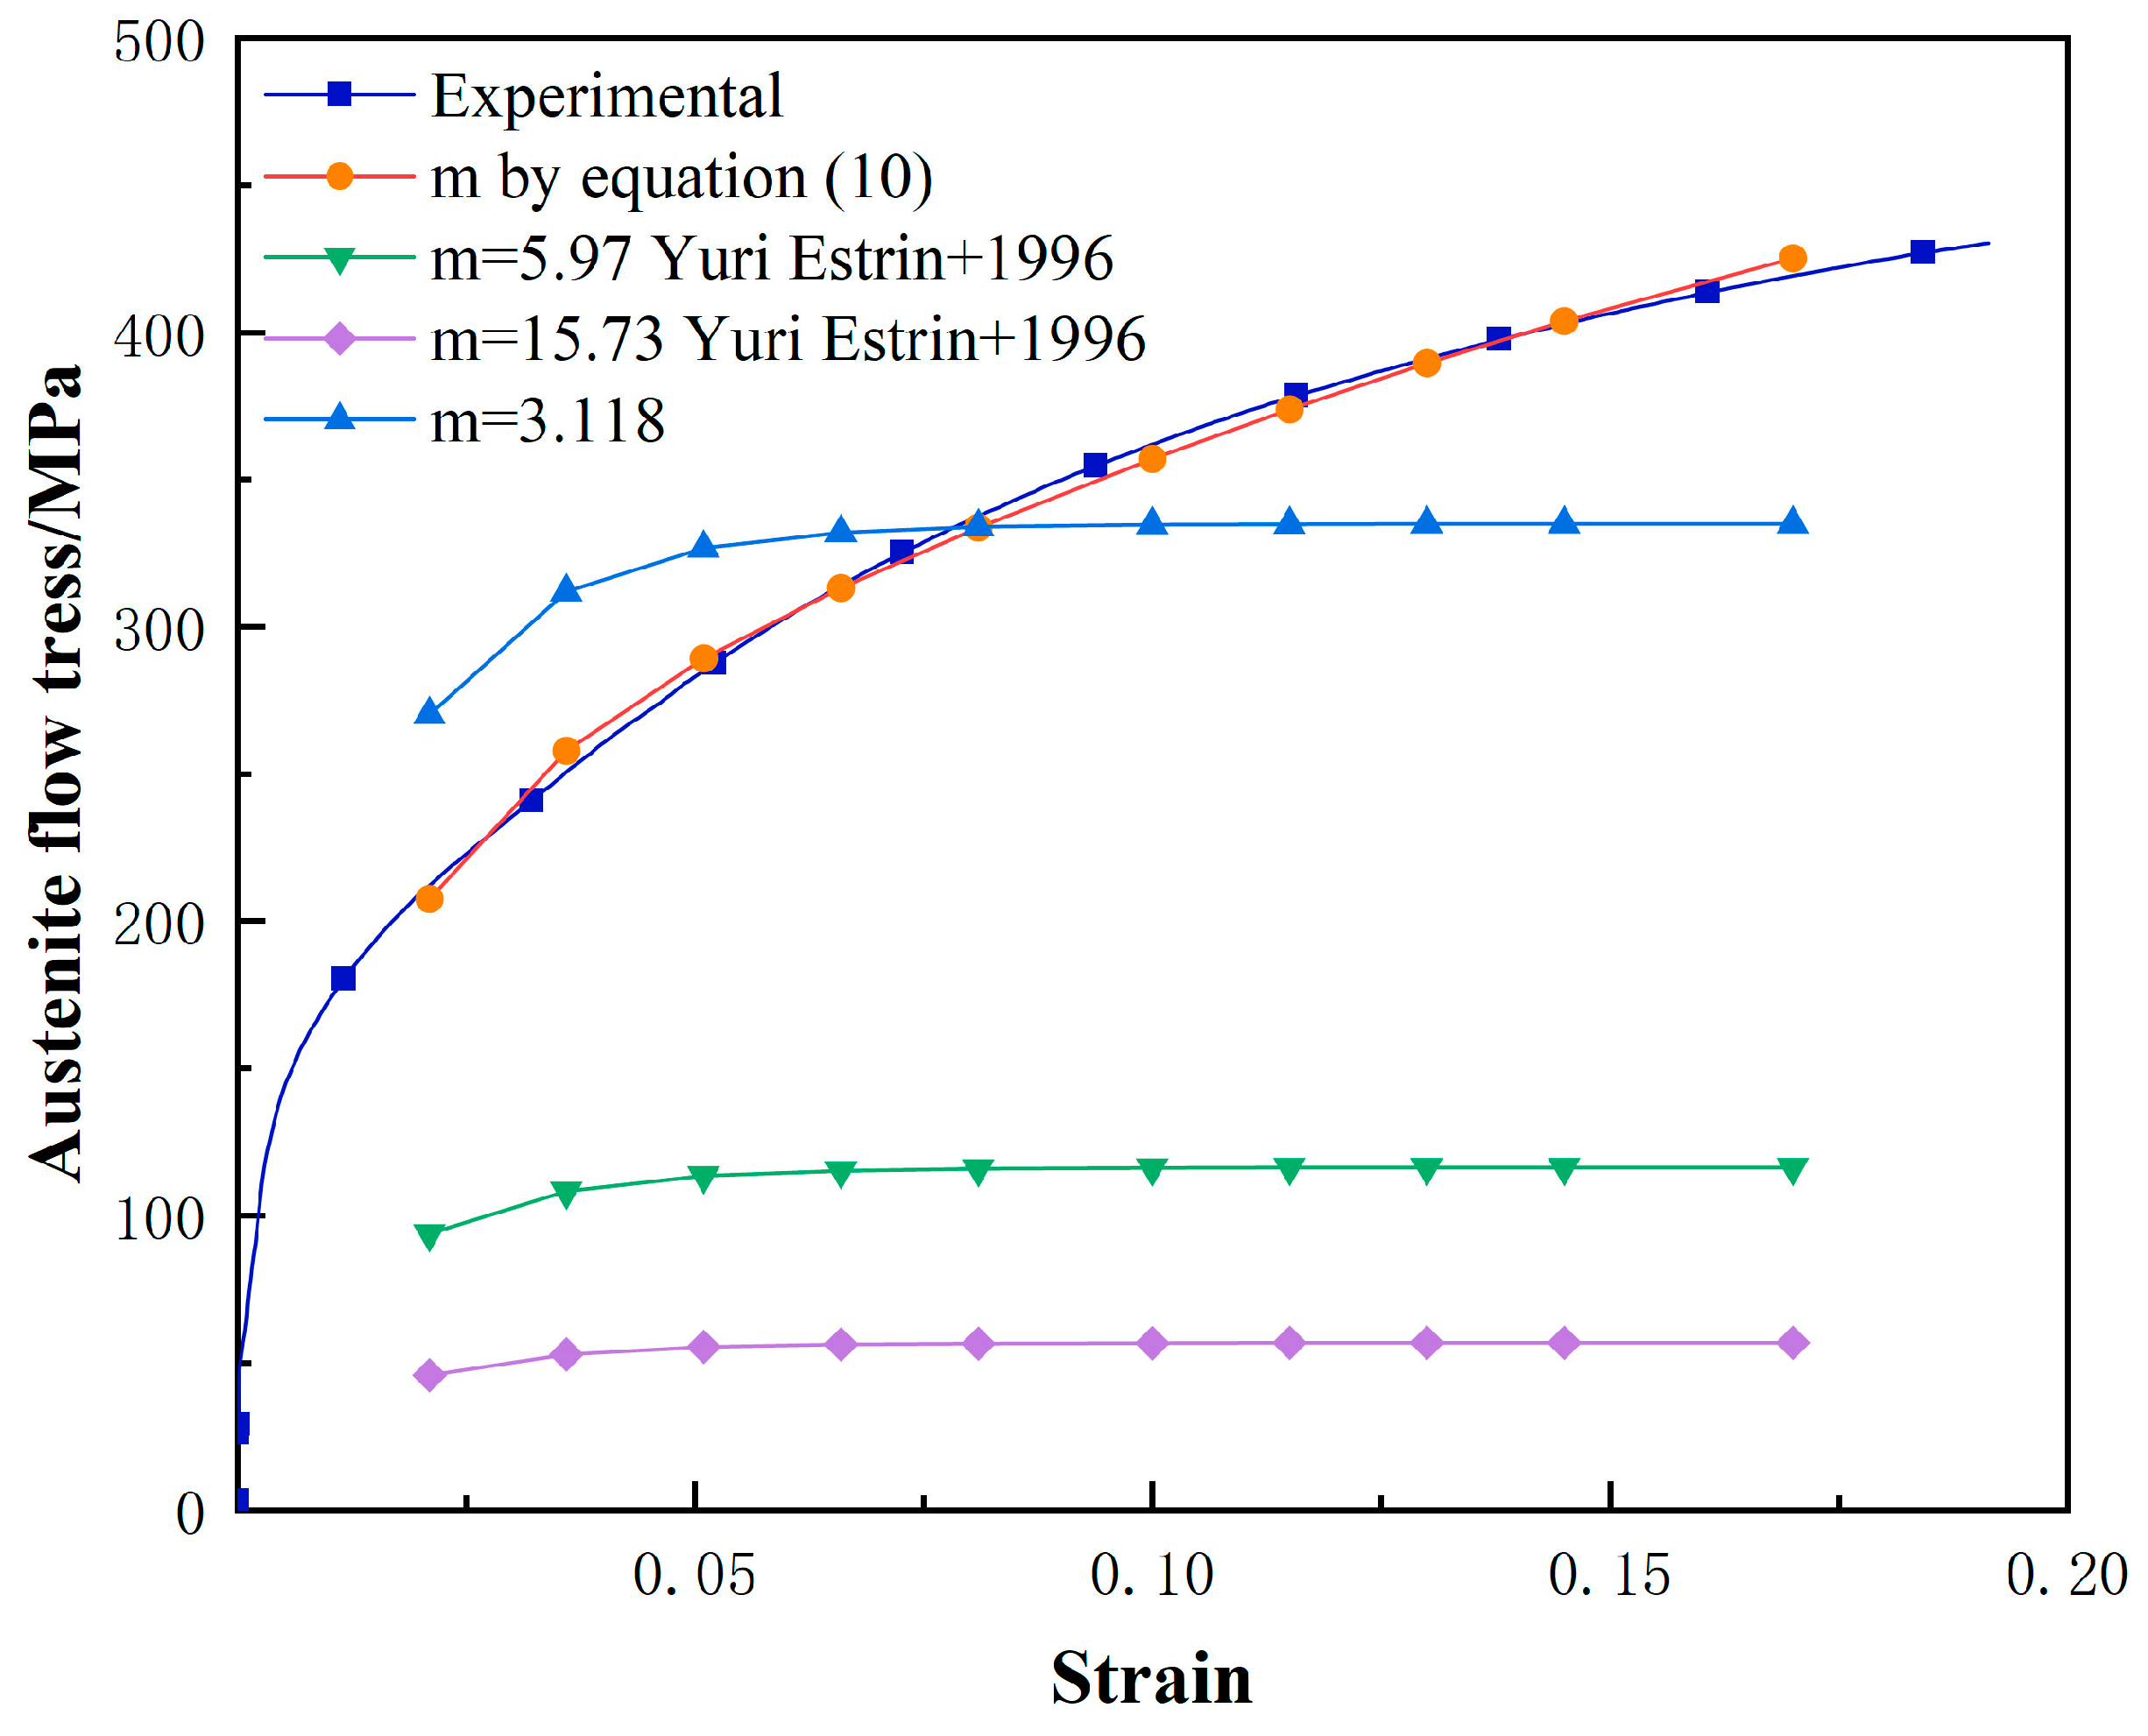
where A, B and C are fitted parameters dependent on the deformation temperature. The regression analysis was carried out using the data in Figure 4. The results are given in Table 1, which shows the changing regulation of A, B and C at each deformation temperature. In order to describe the importance of m more specifically, the effect of m on predicted accuracy was analyzed, as shown in Figure 5. Two types of m were used to predict the flow stresses at a deformation temperature of 700 °C, i.e., one was calculated using Equation (10) and the others are constant values taken from existing studies [15]. Also, an average value of 3.118, obtained from the data (deformation temperature at 700 °C) in Figure 4, was used for comparison. The predicted stress–strain curve overlaps well with the measurements when using the value from Equation (10), while large deviation was generated with referenced values. This indicated that it is not appropriate to set the SRS exponent (m) as constant to predict the flow stress in austenite. The accuracy of m plays a significant role in determining the prediction accuracy of the flow stress model.

3.4. Verification and Discussion

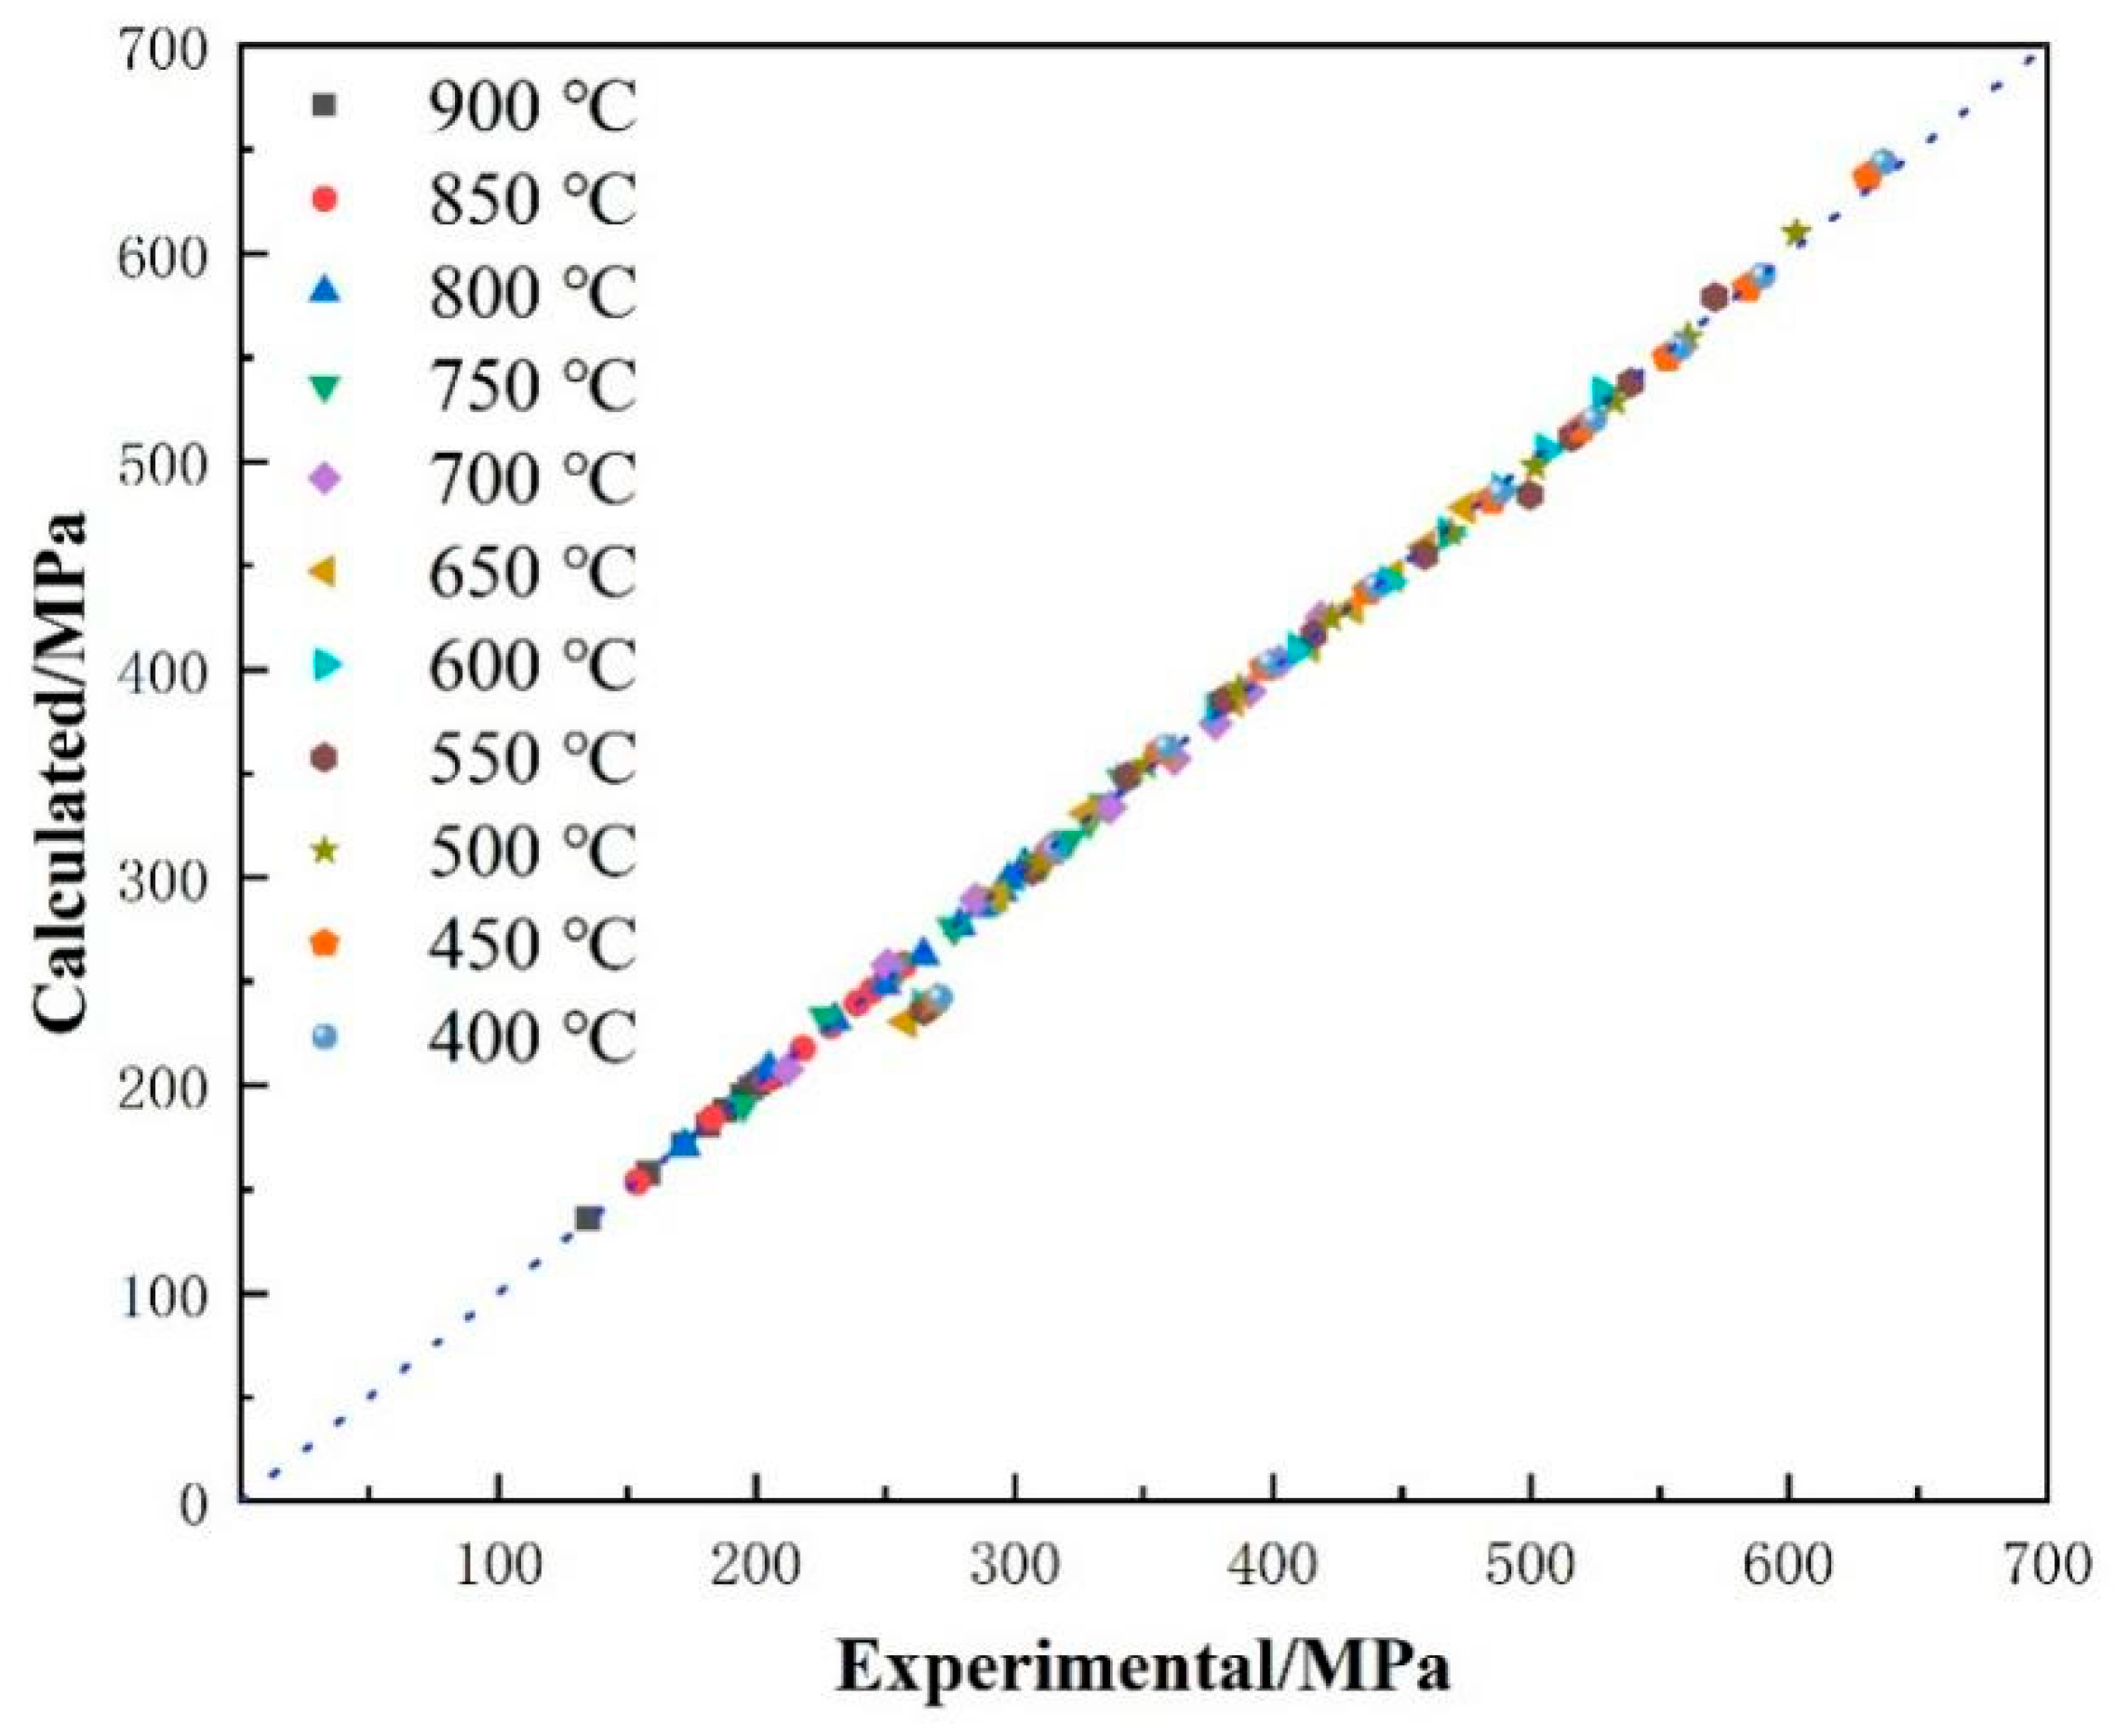
Inversely, the stresses corresponding to different strains at deformation temperatures of 400 °C~900 °C could be calculated using Equations (1)–(10). The modification of the KME model has been tested in the experimental steel. The comparison between the calculation and the experimental measurements is shown in Figure 6 and the average absolute relative error is 1.3%. Obviously, the overlapped test dots demonstrate that the flow stress predicted by the present model shows a satisfactory agreement with the experimental measurements at all deformation temperatures. It should be pointed out that the flow stress of the experiment steel was calculated using revised m and k2 combined with the KME model. As shown in Figure 2, when the deformation temperature is higher than 700 °C, a plateau appears in the stress–strain curve, indicating the dynamic recovery is dominant at a high deformation temperature. In this time, the positive coefficient k1 of dislocation density tends to be small, while the negative coefficient k2 extensively increases (Figure 3). There is no plateau in the stress–strain curve at a relatively low deformation temperature, which is due to the domination of the work hardening, corresponding to larger k1 and smaller k2. Speculatively, it is essential to establish quantitative models of k2 and m correlated to strain and deformation temperature. Other verifications were also performed in steels with different compositions and deformation temperatures.
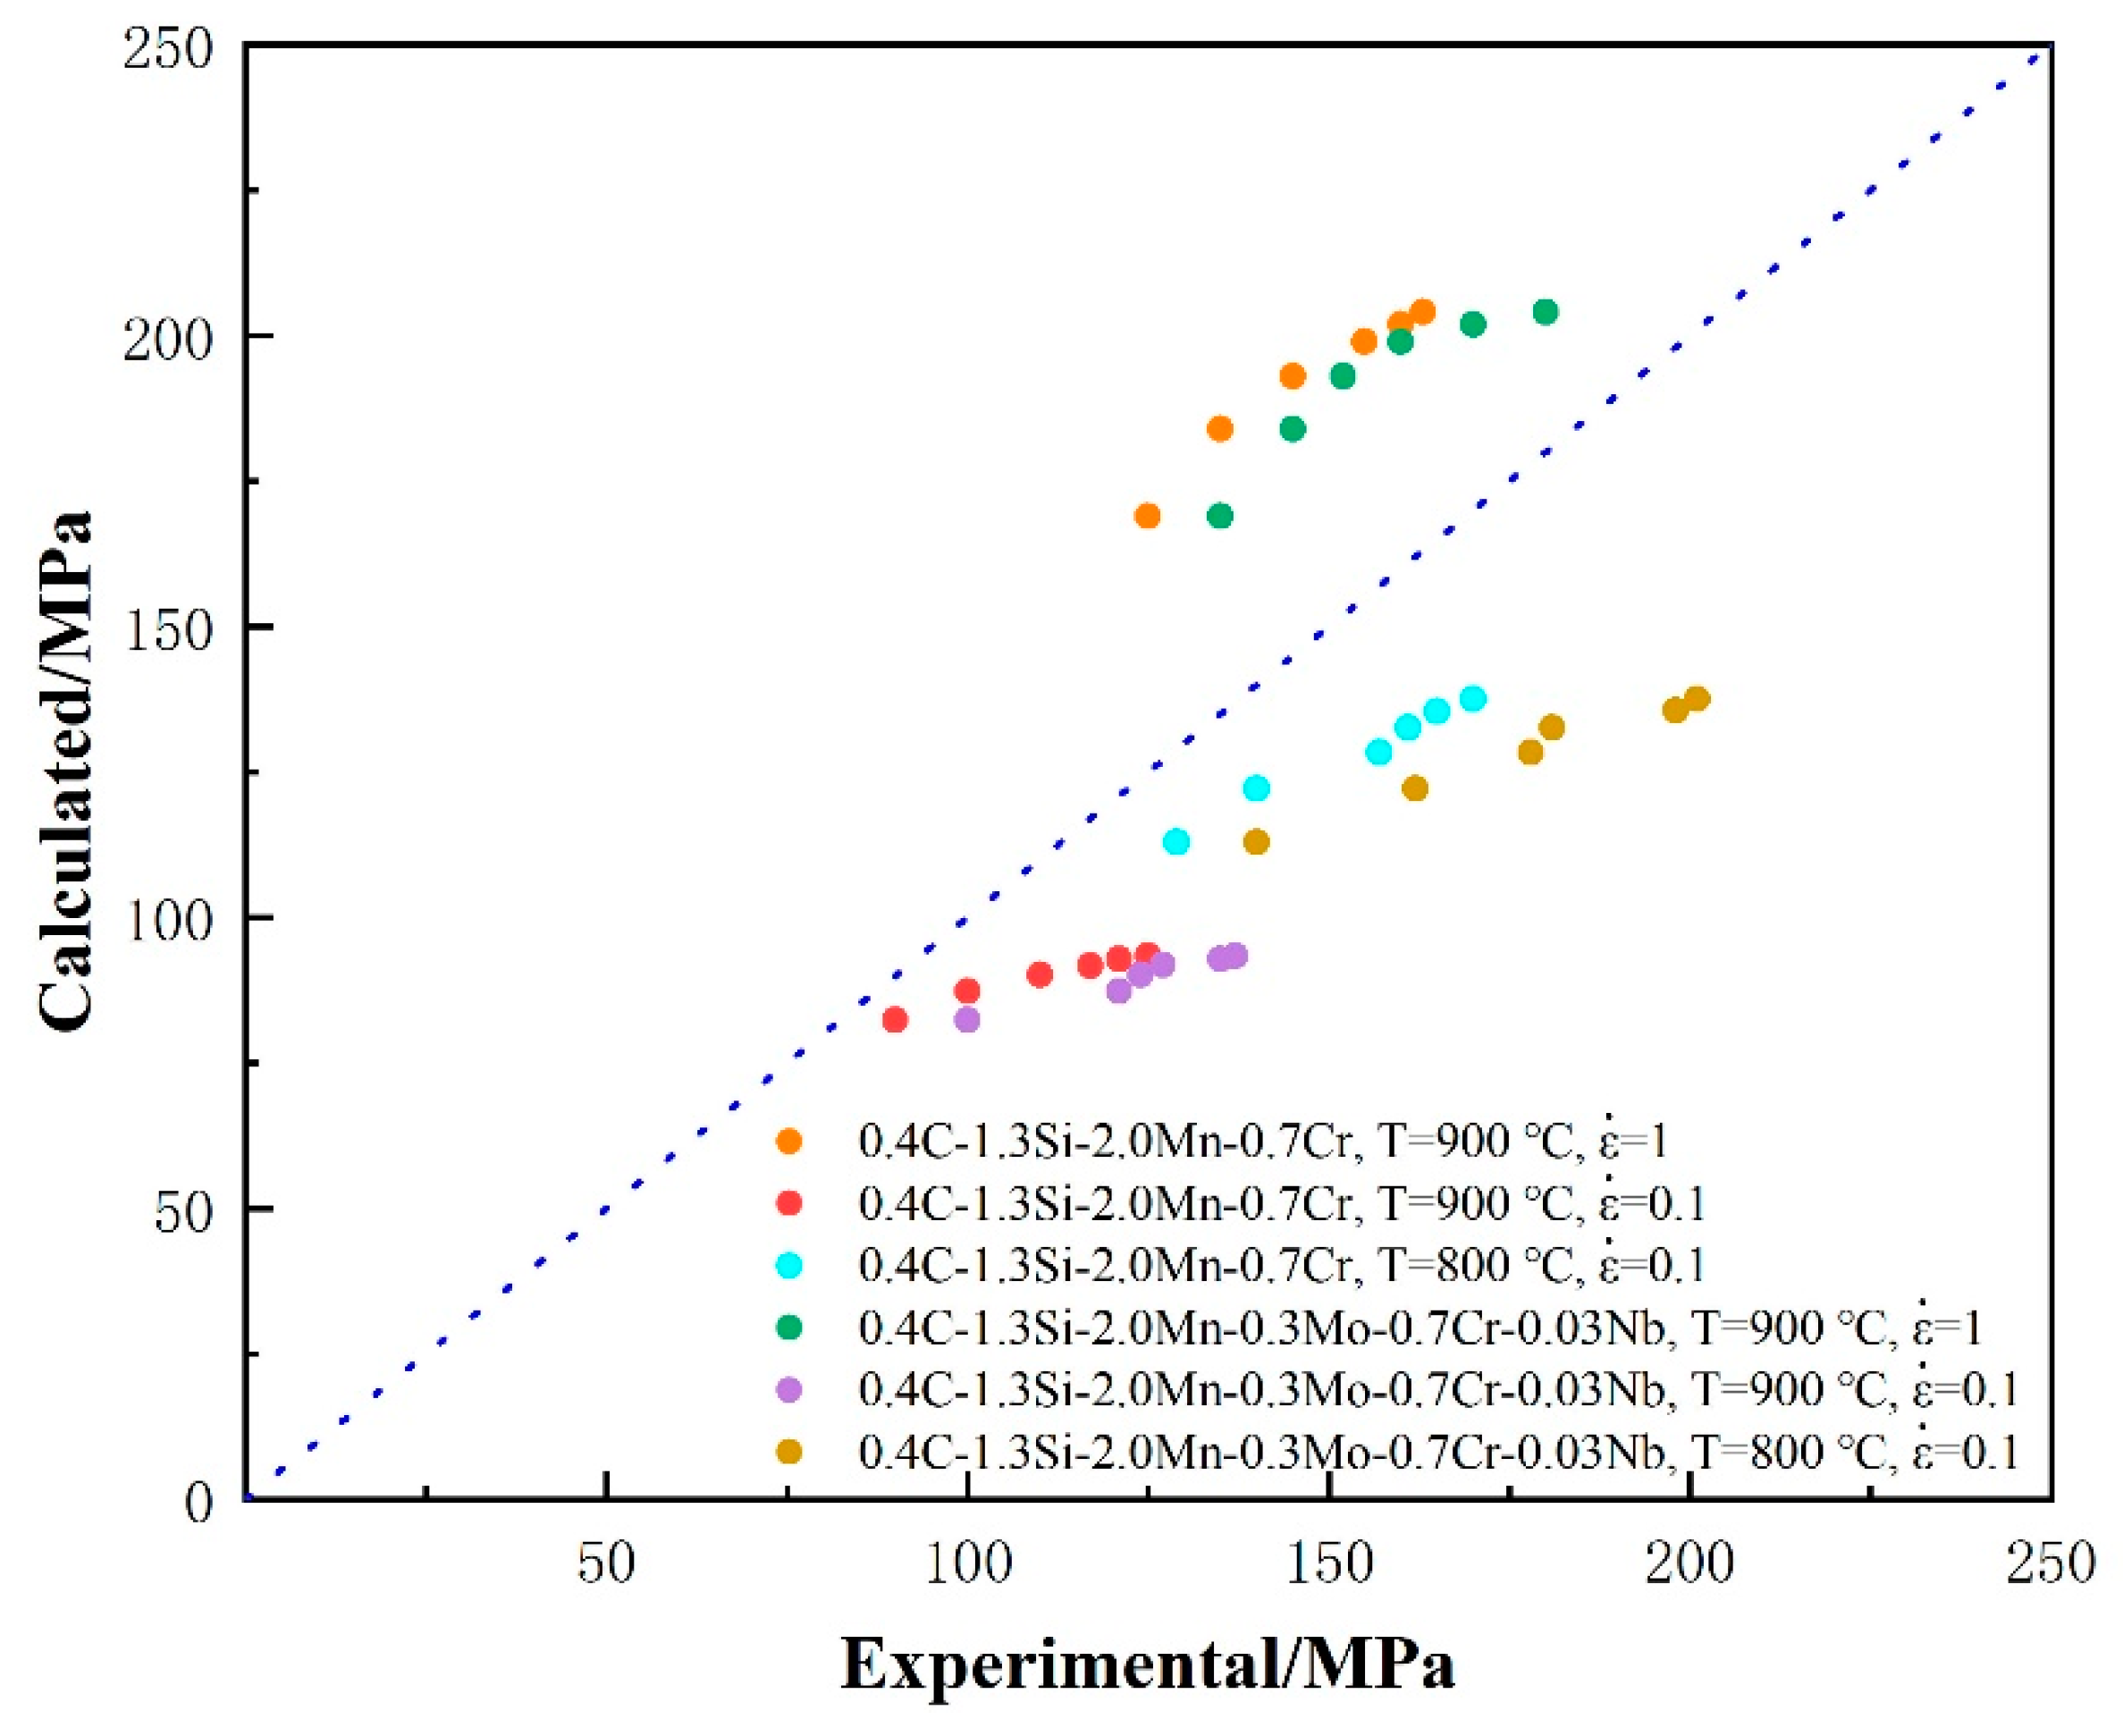
Figure 7 shows the experimental values from references [36] and the predicted results based on the modified model in this study. In order to make the plot clear, the whole flow stress curve is not plotted. It was found that using the initially proposed k2-T and m-ε equations combined with KME model gives a good but insufficient prediction result for bainitic steels with different chemical compositions. It is not easy to develop a constitutive equation which is suitable for both a large deformation temperature range and a large chemical composition range. Most of the existing constitutive models of metallic materials cannot fulfill this requirement. The KME model and the k2-T, m-ε equations established in this work should be applicable to austenite in a relatively wide range of chemical compositions and temperatures. In addition, considering the influence of the SRS exponent on the accuracy of flow stress, the quantitative relationship between m and both strain and temperature deserves further investigation. Since we only use an empirical fitted model to correlate m to strain, there are still some small errors in the prediction results. In a future step, the temperature-dependent parameters A, B, and C in the m-ε model may be replaced by the form of function m (ε, T). Regardless, the revised key parameters of m and k2 in the KME model provide a promising indication with which to predict austenite flow stress in high-strength bainitic steels, especially in similar cases to the one presented here.

4. Conclusions

In this study, austenite flow stress in a high-carbon and alloy steel at different deformation temperatures was studied. The key parameters in the classic Kocks–Mecking–Estrin model were analyzed, and their relationship with temperature and strain was clarified. The conclusions were drawn as follows:
(1)
The SRS exponent, m, plays a significant role in predicting flow stress during ausforming, and its value decreases with the increase in strain. Based on the experimental measurements, an exponential model of m correlated with strain was established, which contains three fitted parameters that are dependent on the deformation temperature.
(2)
The dislocation annihilation coefficient increases with the increase in deformation temperature. A simplified polynomial model could be used to describe the quantitative relationship between k2 and temperature. For the present material, which can be expressed as:
k 2 = 45.83077 + 0.03892 × T 2.15897 × 10 4 × T 2 + 2.26263 × 10 7 × T 3
(3)
The combination of current k2-T, m-ε equations in this work with classical KME model can provide a comparative evaluation for the austenite flow stress in the test material and other steels with different compositions and deformation temperatures.

Author Contributions

Conceptualization, L.W. and H.H.; methodology, H.H.; software, L.W.; validation, H.H., L.W. and W.W.; formal analysis, W.W.; investigation, P.H.; resources, Z.L.; data curation, W.W.; writing—original draft preparation, L.W.; writing—review and editing, L.W.; visualization, P.H.; supervision, G.X.; project administration, H.H.; funding acquisition, H.H. All authors have read and agreed to the published version of the manuscript.

Funding

This research was funded by [National Nature Science Foundation of China] grant number [51704217/51874216]. And The APC was funded by [National Nature Science Foundation of China]. We would like to thank Mr. G.H. Zhang at the Analytical & Testing Center of Wuhan University of Science and Technology for the help with the ausforming analysis.

Data Availability Statement

Both the raw data and the processed data required to reproduce these findings can be offered by the author.

Acknowledgments

H. Hu acknowledges the financial support of the National Nature Science Foundation of China (Grant 51704217/51874216). We would like to thank G.H. Zhang at the Analytical & Testing Center of Wuhan University of Science and Technology for the help with the ausforming analysis.

Conflicts of Interest

The authors declare no conflict of interest.

References

  1. Jiang, F.L.; Takaki, S.; Masumura, T.; Uemori, R. Nonadditive strengthening functions for cold-worked cubic metals: Experiments and constitutive modeling. Int. J. Plast. 2020, 129, 102700. [Google Scholar]
  2. Chen, G.H.; Hu, H.J.; Xu, G.; Tian, J.Y.; Wan, X.L.; Wang, X. Optimizing microstructure and property by ausforming in a medium-carbon bainitic steel. ISIJ Int. 2020, 60, 2007–2014. [Google Scholar] [CrossRef]
  3. Xu, L.; Yao, Z.Q.; Liu, J.P. Constitutive model parameter identification for 6063 aluminum alloy using inverse analysis method for extrusion applications. J. Mater. Eng. Perform. 2021, 30, 7449–7460. [Google Scholar] [CrossRef]
  4. He, S.H.; He, B.B.; Zhu, K.Y. Evolution of dislocation density in bainitic steel: Modeling and experiments. Acta Metall. 2018, 149, 46–56. [Google Scholar]
  5. Mecking, H.; Kocks, U.F. Kinetics of flow and strain-hardening. Acta Metall. 1981, 29, 1865–1875. [Google Scholar]
  6. Sathyanath, A.; Meena, A.K. Dislocation-precipitate interaction-based Kocks-Mecking analysis of heat-treated 17-4 PH stainless steel. JOM 2022, 74, 2817–2825. [Google Scholar]
  7. Taylor, G.I. The mechanism of plastic deformation of crystals. Part I. Theoretical. Proc. Math. Phys. Eng. Sci. 1934, 145, 362–387. [Google Scholar]
  8. Zerilli, F.J.; Armstrong, R.W. Dislocation-mechanics-based constitutive relations for material dynamics calculations. Appl. Phys. Lett. 1987, 61, 1816–1825. [Google Scholar] [CrossRef]
  9. Johnson, G.R.; Cook, W.H. A constitutive model and data for metals subjected to large strains, high strain rates and high temperatures. In Proceedings of the 7th International Symposium on Ballistics, Hue City, Vietnam, 18–20 July 2018. [Google Scholar]
  10. Johnson, G.R.; Cook, W.H. Fracture characteristics of three metals subjected to various strains, strain rates, temperatures and pressures. Eng. Fract. Mech. 1985, 21, 31–48. [Google Scholar] [CrossRef]
  11. Samantaray, D.; Mandal, S.; Borah, U. A thermo-viscoplastic constitutive model to predict elevated-temperature flow behaviour in a titanium-modified austenitic stainless steel. Mater. Sci. Eng. A 2009, 526, 1–6. [Google Scholar] [CrossRef]
  12. Hariharan, K.; Barlat, F. Modified Kocks-Mecking-Estrin model to account nonlinear strain hardening. Metall. Mater. Trans. A 2019, 50, 513–517. [Google Scholar]
  13. Choudhary, B.K.; Christopher, J. Comparative tensile flow and work-hardening behavior of 9 Pct chromium ferritic-martensitic steels in the framework of the Estrin-Mecking internal-variable approach. Mater. Sci. Eng. A 2016, 47, 2642–2655. [Google Scholar]
  14. Choudhary, B.K.; Palaparti, D.P.R.; Samuel, E.I. Analysis of tensile stress-strain and work-hardening behavior in 9Cr-1Mo ferritic steel. Metall. Mater. Trans. A 2013, 44, 212–223. [Google Scholar]
  15. Estrin, Y. Dislocation-density-related constitutive modeling. In Unified Constitutive Laws of Plastic Deformation; Elsevier: Amsterdam, The Netherlands, 1996; pp. 69–106. [Google Scholar]
  16. Changela, K.; Krishnaswamy, H.; Digavalli, R.K. Mechanical behavior and deformation kinetics of aluminum alloys processed through cryorolling and subsequent annealing. Metall. Mater. Trans. A 2020, 51, 648–666. [Google Scholar]
  17. Kocks, U.F. Laws for work-hardening and low-temperature creep. J Eng. Mater. Technol. 1976, 98, 76–85. [Google Scholar]
  18. Estrin, Y.; Mecking, H. A unified phenomenological description of work hardening and creep based on one-parameter models. Acta Metall. 1984, 32, 57–70. [Google Scholar] [CrossRef]
  19. Eres-Castellanos, A.; Toda-Caraballo, I.; Latz, A. An integrated-model for austenite yield strength considering the influence of temperature and strain rate in lean steels. Mater. Des. 2020, 188, 108435. [Google Scholar]
  20. Wei, B.Q.; Wu, W.Q.; Xie, D.Y. Strength, plasticity, thermal stability and strain rate sensitivity of nanograined nickel with amorphous ceramic grain boundaries. Acta Metall. 2021, 212, 116918. [Google Scholar]
  21. Mohanty, G.; Wehrs, J.; Hasegawa, M. Elevated Temperature Microcompression Transient Testing of Nanocrystalline Materials: Creep, Stress Relaxation and Strain Rate Jump Tests. 2015. Available online: https://dc.engconfintl.org/nanomechtest_v/96/ (accessed on 23 February 2023).
  22. Harjo, S.; Kawasaki, T.; Tomota, Y. Work hardening, dislocation structure, and load partitioning in lath martensite determined by in situ neutron diffraction line profile analysis. Metall. Mater. Trans. A 2017, 48, 4080–4092. [Google Scholar]
  23. Kreyca, J.; Kozeschnik, E. State parameter-based constitutive modelling of stress strain curves in Al-Mg solid solutions. Int. J. Plast. 2018, 103, 67–80. [Google Scholar]
  24. Kocks, U.F.; Mecking, H. Physics and phenomenology of strain hardening: The fcc case. Prog. Mater. Sci. 2003, 48, 171–273. [Google Scholar]
  25. Csanádi, T.; Chinh, N.Q.; Gubicza, J. Plastic behavior of fcc metals over a wide range of strain: Macroscopic and microscopic descriptions and their relationship. Acta Metall. 2011, 59, 2385–2391. [Google Scholar]
  26. Cheng, L.M.; Poole, W.J.; Embury, J.D. The influence of precipitation on the work-hardening behavior of the aluminum alloys AA6111 and AA7030. Metall. Mater. Trans. A 2003, 34, 2473–2481. [Google Scholar]
  27. Sendrowicz, A.; Myhre, A.O.; Danyuk, A.V. Dislocation kinetics explains energy partitioning during strain hardening: Model and experimental validation by infrared thermography and acoustic emission. Mater. Sci. Eng. A 2022, 856, 143969. [Google Scholar] [CrossRef]
  28. Follansbee, P.S.; Kocks, U.F. A constitutive description of the deformation of copper based on the use of the mechanical threshold stress as an internal state variable. Acta Metall. 1988, 36, 81–93. [Google Scholar]
  29. Frost, H.J.; Ashby, M.F. Deformation-Mechanism Maps: The Plasticity and Creep of Metals and Ceramics; Pergamon Press: Oxford, UK, 1982. [Google Scholar]
  30. Onink, M.; Tichelaar, F.D.; Brakman, C.M. Quantitative analysis of the dilatation by decomposition of Fe-C austenites calculation of volume change upon transformation. Int. J. Mater. Res. 1996, 87, 24–32. [Google Scholar] [CrossRef]
  31. Vinogradov, A.; Yasnikov, I.S.; Estrin, Y. Evolution of fractal structures in dislocation ensembles during plastic deformation. Phys. Rev. Lett. 2012, 108, 205504. [Google Scholar] [CrossRef] [PubMed]
  32. Austin, R.A.; McDowell, D.L. A dislocation-based constitutive model for viscoplastic deformation of fcc metals at very high strain rates. Int. J. Plast. 2011, 27, 1–24. [Google Scholar]
  33. Karlsen, W.; Ivanchenko, M.; Ehrnst, U. Microstructural manifestation of dynamic strain aging in AISI 316 stainless steel. J. Nucl. Mater. 2009, 395, 156–161. [Google Scholar] [CrossRef]
  34. Fujita, M.; Kaimeko, Y.; Nohara, A.; Saka, H.; Zauter, R.; Mughrabi, H. Temperature dependence of the dissociation width of dislocations in a commercial 304L stainless steel. ISIJ Int. 1994, 34, 697–703. [Google Scholar] [CrossRef]
  35. Roy, A.K.; Hasan, M.H.; Pal, J. Creep deformation of alloys 617 and 276 at 750–950 °C. Mater. Sci. Eng. A 2009, 520, 184–188. [Google Scholar] [CrossRef]
  36. Kaikkonen, P.M.; Somani, M.C.; Miettunen, I.H. Constitutive flow behaviour of austenite at low temperatures and its influence on bainite transformation characteristics of ausformed medium-carbon steel. Mater. Sci. Eng. A 2020, 775, 138980. [Google Scholar]
Figure 1. Ausforming experiment procedures.
Metals 13 01526 g001
Figure 2. Stress–strain curves during ausforming at different temperatures.
Metals 13 01526 g002
Figure 3. Variation in parameter k2 with temperature.
Metals 13 01526 g003
Figure 4. Variation in m with temperature and strain.
Metals 13 01526 g004
Figure 5. Comparison between predicted and experimental values (m=5.97 and m=15.73 are constant values taken from existing studies; adapted from: [15]).
Metals 13 01526 g005
Figure 6. Experimental values vs. predictions by the modified model, where the dotted line represents the standard error of the experiment.
Metals 13 01526 g006
Figure 7. Verification of the current model using experimental values from references [36] vs. predictions by the modified model, where the dotted line represents the standard error of the experiment.
Metals 13 01526 g007
Table 1. Fitted parameters A, B and C at different deformation temperatures.
T/°CABC
9000.83420.043452.92506
8500.964370.048422.85075
8001.001180.058242.83002
7500.95670.081062.79579
7001.158060.100672.60082
6501.073830.078382.66202
6001.222450.090112.55322
5501.474950.110252.39155
5001.632590.124572.28242
4501.703110.119142.28477
4001.761590.118232.30097
Disclaimer/Publisher’s Note: The statements, opinions and data contained in all publications are solely those of the individual author(s) and contributor(s) and not of MDPI and/or the editor(s). MDPI and/or the editor(s) disclaim responsibility for any injury to people or property resulting from any ideas, methods, instructions or products referred to in the content.