Abstract
The 25Cr7Ni stainless steel alloy system is gaining increasing interest in the oil and gas industry because of its combination of high strength and corrosion resistance properties. However, very few studies on the effects of starting powder attributes and chemical composition on the as-printed properties of 25Cr7Ni stainless steel fabricated through laser-powder bed fusion (L-PBF) exist in the literature. This study examined the influence of powder attributes and chemical composition on the samples from gas atomized and water atomized 25Cr7Ni stainless steel powders, fabricated through L-PBF, on their as-printed microstructure and properties. The mechanical properties that were examined included ultimate tensile strength (UTS), elongation (%), and hardness. The corrosion behavior was also studied using linear sweep voltammetry in 3.5 wt.% NaCl solution. The evolved phases were characterized using optical and scanning electron microscopy, as well as through X-ray diffraction. The gas atomized powders, with their spherical and uniform morphology, yielded as-printed parts of higher relative densities when compared to water atomized powders, with irregular morphology due to better powder bed compaction. The higher densification obtained in the L-PBF samples from gas atomized powders translated into the highest UTS, hardness, and yield strength among the L-PBF samples from water atomized powders and wrought–annealed 25Cr7Ni stainless steel. The presence of higher amounts of N and Mn in the chemical composition of the gas atomized powders over water atomized powders promoted the presence of retained austenite in the corresponding L-PBF samples. Higher amounts of Mo, combined with austenite content, yielded a higher corrosion resistance in the L-PBF samples from the gas atomized powder than in the L-PBF samples from the water atomized powders. The latter part of the work is focused on the evaluation of simulation parameters for analyzing the fabrication procedure for the L-PBF process using Simufact software. For a given set of process parameters, Simufact provides the distortion and internal stresses developed in the printed parts as output. The present study sought to evaluate the process simulation by comparing the experimental observations in terms of the part distortion achieved in a stainless steel cube fabricated through L-PBF with Simufact process simulation obtained using the same set of process parameters.
1. Introduction
The 25Cr7Ni stainless steel alloys were developed through careful control of their chemical composition to present a duplex microstructure of approximately 50% ferrite and 50% austenite, combining the strength of 420 steels and the corrosion resistance of 316L steels [1]. These alloys adequately address the demands of high strength and corrosion resistance required by components used in offshore oil and gas industry chemical digestor plants in which they are constantly exposed to a highly corrosive environment [2]. The chemical composition of the 25Cr7Ni stainless steel alloy, containing over 27% alloying elements, is sensitive to the temperature–time profile of any heat treatment/hot forming operation. At the slower cooling rates of conventional hot forming processes, the 25Cr7Ni stainless steel alloy system has been shown to promote the precipitation of detrimental phases, such as σ and χ phases [3,4], which severely impede the mechanical and corrosion resistant properties. Limitations of a slower cooling rate, lack of design integration/complexity, and the inability to adequately recycle raw materials has garnered a high degree of interest in laser-powder bed fusion for processing 25Cr7Ni stainless steel alloy systems [5].
With the primary raw material for the L-PBF process being powder, powder attributes such as morphology and particle size distribution have a significant influence on the L-PBF printability and the printed part porosity [6]. The mode of atomization is directly related to the powder morphology, with water atomization predominantly yielding an irregular morphology and gas atomization yielding a more regular, spherical morphology, while at the same time, being a costlier alternative [7,8]. An irregular morphology of the starting powder has been shown to exhibit a lack of uniform spreading/compaction in the powder bed due to interlocking of the powder particles, which eventually manifests as porosity, a lack of fusion between the powder layers, and even failed prints [6,7]. Conversely, a spherical morphology results in uniform powder spreading and adequate powder bed compaction, leading to greater than 99% relative densities of as-printed L-PBF parts [9,10]. In terms of chemical composition, water atomization due to its inability to provide an inert atmosphere for atomization is limited in the scope of alloying elements such as manganese that can promote oxygen pickup during atomization [11]. Independently, the chemical composition of the starting powder influences the printed part properties by affecting the phase balance. Elements such as Cr and Mo are ferrite stabilizers, and Ni and N are austenite stabilizers, with manganese shown to increase the solubility of N in the stainless steel alloy [1]. The corrosion resistance of the alloy system is heavily governed by the Cr, Mo, and N content [12,13]. Few studies have been conducted to establish the influence of the powder attributes and chemical composition of the starting powder on the mechanical properties and microstructure of L-PBF fabricated 25Cr7Ni stainless steel [14,15,16,17], and there has been no qualification of corrosion properties of the fabricated parts. The present study seeks to address this research gap. The thermomechanical model for AM simulation provides an overview for the Simufact simulation and lays the foundation for the verification with the experimental work.
The thermomechanical solver model predicts the residual stress and distortion, along with the temperature variation, for the printed sample. The temperature distribution over the printed part, fabricated through the LPBF process, is predictable using the continuum heat diffusion equation, as provided upon request by the process simulation software vendor:
where ρ is the material density, Cp is specific heat, k is thermal conductivity, and Ev is energy density.
T (x, y, z, t) is the instantaneous temperature at location (x, y, z) at time t, and the second derivative term (continuous Laplacian) in the heat equation captures the effect of shape on the temperature distribution. Energy density is defined as the amount of energy supplied by the laser to melt a unit volume of powder. The volumetric energy density is a function of laser power (P), laser scanning speed (v), spacing between two consecutive laser tracks (h), and layer thickness (t).
2. Methodology
2.1. Feedstock and L-PBF Process
For the present work, a gas atomized 25Cr7Ni stainless steel powder with a D10 of 20.6 µm, D50 of 32, and D90 of 51.9 µm, provided by Sandvik Additive Manufacturing, USA, was used as the starting powder. The as-printed properties of the fabricated samples were compared with the as-printed properties of an L-PBF fabricated water atomized 25Cr7Ni stainless steel powder with a D10 of 16 µm, D50 of 35 µm, and D90 of 62 µm, provided by North American Hoeganaes, USA, printed at the same process parameters. The pycnometer densities of the water atomized powder were 7.68 ± 0.02 g/cc and of the gas atomized powder, they were 7.66 ± 0 g/cc.
The chemical composition of the gas atomized 25Cr7Ni stainless steel powder, shown in Table 1, met the ASTM standard for 25Cr7Ni stainless steel composition (UNS 32750). In comparison, the water atomized 25Cr7Ni stainless steel powder contained the same amount of Cr and Ni content as the ASTM standard 25Cr7Ni stainless steel, but had lower amounts of Mo and Mn, and no N. In contrast, it had higher amounts of W and Si in comparison to an ASTM standard 25Cr7Ni stainless steel. A Concept Laser mLab cusing machine equipped with a single 100 W Yb laser was used to carry out the L-PBF process to fabricate five ASTM E8 M tensile specimens using the gas atomized and water atomized 25Cr7Ni stainless steel powders at an energy density of 47 J/mm3 (90 W and 20 µm layer thickness, 120 µm hatch spacing, and 800 mm/s scan speed). The samples were fabricated with the tensile axis parallel to the build plate/scan direction (XY). The build direction was (ZX). The samples were fabricated within the build chamber under a constant flow of argon gas, limiting the oxygen content to less than 0.5%.

Table 1.
Composition of starting gas atomized 25Cr7Ni stainless steel powder.
2.2. Physical Property Characterization
The bulk density, tap density, and the pycnometer density of the starting powders were characterized using an AS-100 tap density volumeter and a micrometrics gas pycnometer. The Hausner’s ratio, which was qualitatively used to characterize the flowability of the starting powder during the L-PBF process, and the powder bed packing density similar to that used in the Refs. [10,18], was calculated as the ratio of the tap density to the apparent density. The as-printed samples were cut from the base plate, and their Archimedes density was calculated using a Mettler Toledo XS104 analytical balance based on the ASTM 962-17 standard. The relative density of the as-printed samples was calculated as the ratio of the Archimedes density to the pycnometer density of the respective starting powder.
2.3. Phase Analysis and Metallography
The X-ray diffraction (XRD) of the as-printed samples was captured using a Discovery D8 diffractometer (BRUKER, AXS Inc., Billerica, MA, USA) at Cu-Kα radiation (λ = 1.54 Å), 45 kV, and 40 mA. The microstructure of the as-printed samples was captured along the building direction (ZX), by sectioning the as-printed sample, followed by mechanical grinding with grit sizes of 60, 120, 400, and 800 and polishing with 9 µm and 1 µm diamond solutions. The polished samples were then electrically etched in a DC current at 3 V for 5 s in a 40% KOH solution, immediately followed by the cleaning of the sample with distilled water. This selectively etched the ferrite phase and left the austenite unetched.
2.4. Mechanical Property Characterization
The L-PBF as-printed samples were subjected to tensile testing in an MTS Exceed hydraulic dual-column tensile testing system equipped with a 100 kN load cell, at a strain rate of 0.001 s−1. The elongation of the samples was measured as the increase in gauge length prior to and after the tensile testing.
2.5. Corrosion Property Characterization
The corrosion properties of the as-printed samples were characterized in a 3.5% sodium chloride solution to simulate the salinity of seawater. using linear sweep voltammetry (LSV). A pre-defined area was polished to a mirror-like surface finish along the scan direction (XY) and was exposed to a 3.5% sodium chloride electrolyte. The as-printed sample served as the working electrode, a silver–silver chloride electrode served as the reference electrode, and a platinum wire mesh served as a counter electrode. All the electrodes were immersed in the sodium chloride electrolyte and externally connected through a potentiostat. The voltage was swept across −1 V to 2 V using the potentiostat, and the corrosion current was recorded. The corrosion resistance was calculated using Tafel plots and Tafel equations [18,19] to obtain polarization resistance, breakdown potential, corrosion current, and the corrosion rate.
2.6. Process Simulation
Simulation using Simufact software was carried out to investigate the L-PBF fabrication research work.
Figure 1 demonstrates the overall approach used in this study to evaluate the effectiveness of the Simufact simulation to capture the as-printed properties based on the input parameters of the L-PBF.
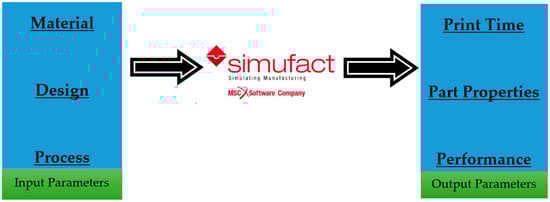
Figure 1.
Overall approach to predict L-PBF simulations.
Thermomechanical modeling was used to simulate the layer-by-layer L-PBF printing process. To model and simulate the L-PBF printing process using Simufact software, accurate simulation input parameters are required to define the thermomechanical simulation in terms of mesh size, material properties, etc.
The wrought–annealed 25Cr7Ni stainless steel data used for simulation were density (7.7 g/cc), yield strength (650 MPa), and ultimate tensile strength (870 MPa), based on the mechanical property characterization. A cube of dimensions (10 × 8 × 10) mm was used for process simulations, similar to the one fabricated using the L-PBF process.
Table 2 collates the process parameters and values used in the study for the fabrication of the cube.
Table 2.
Printing process and simulation parameters used in Simufact.
3. Results and Discussion
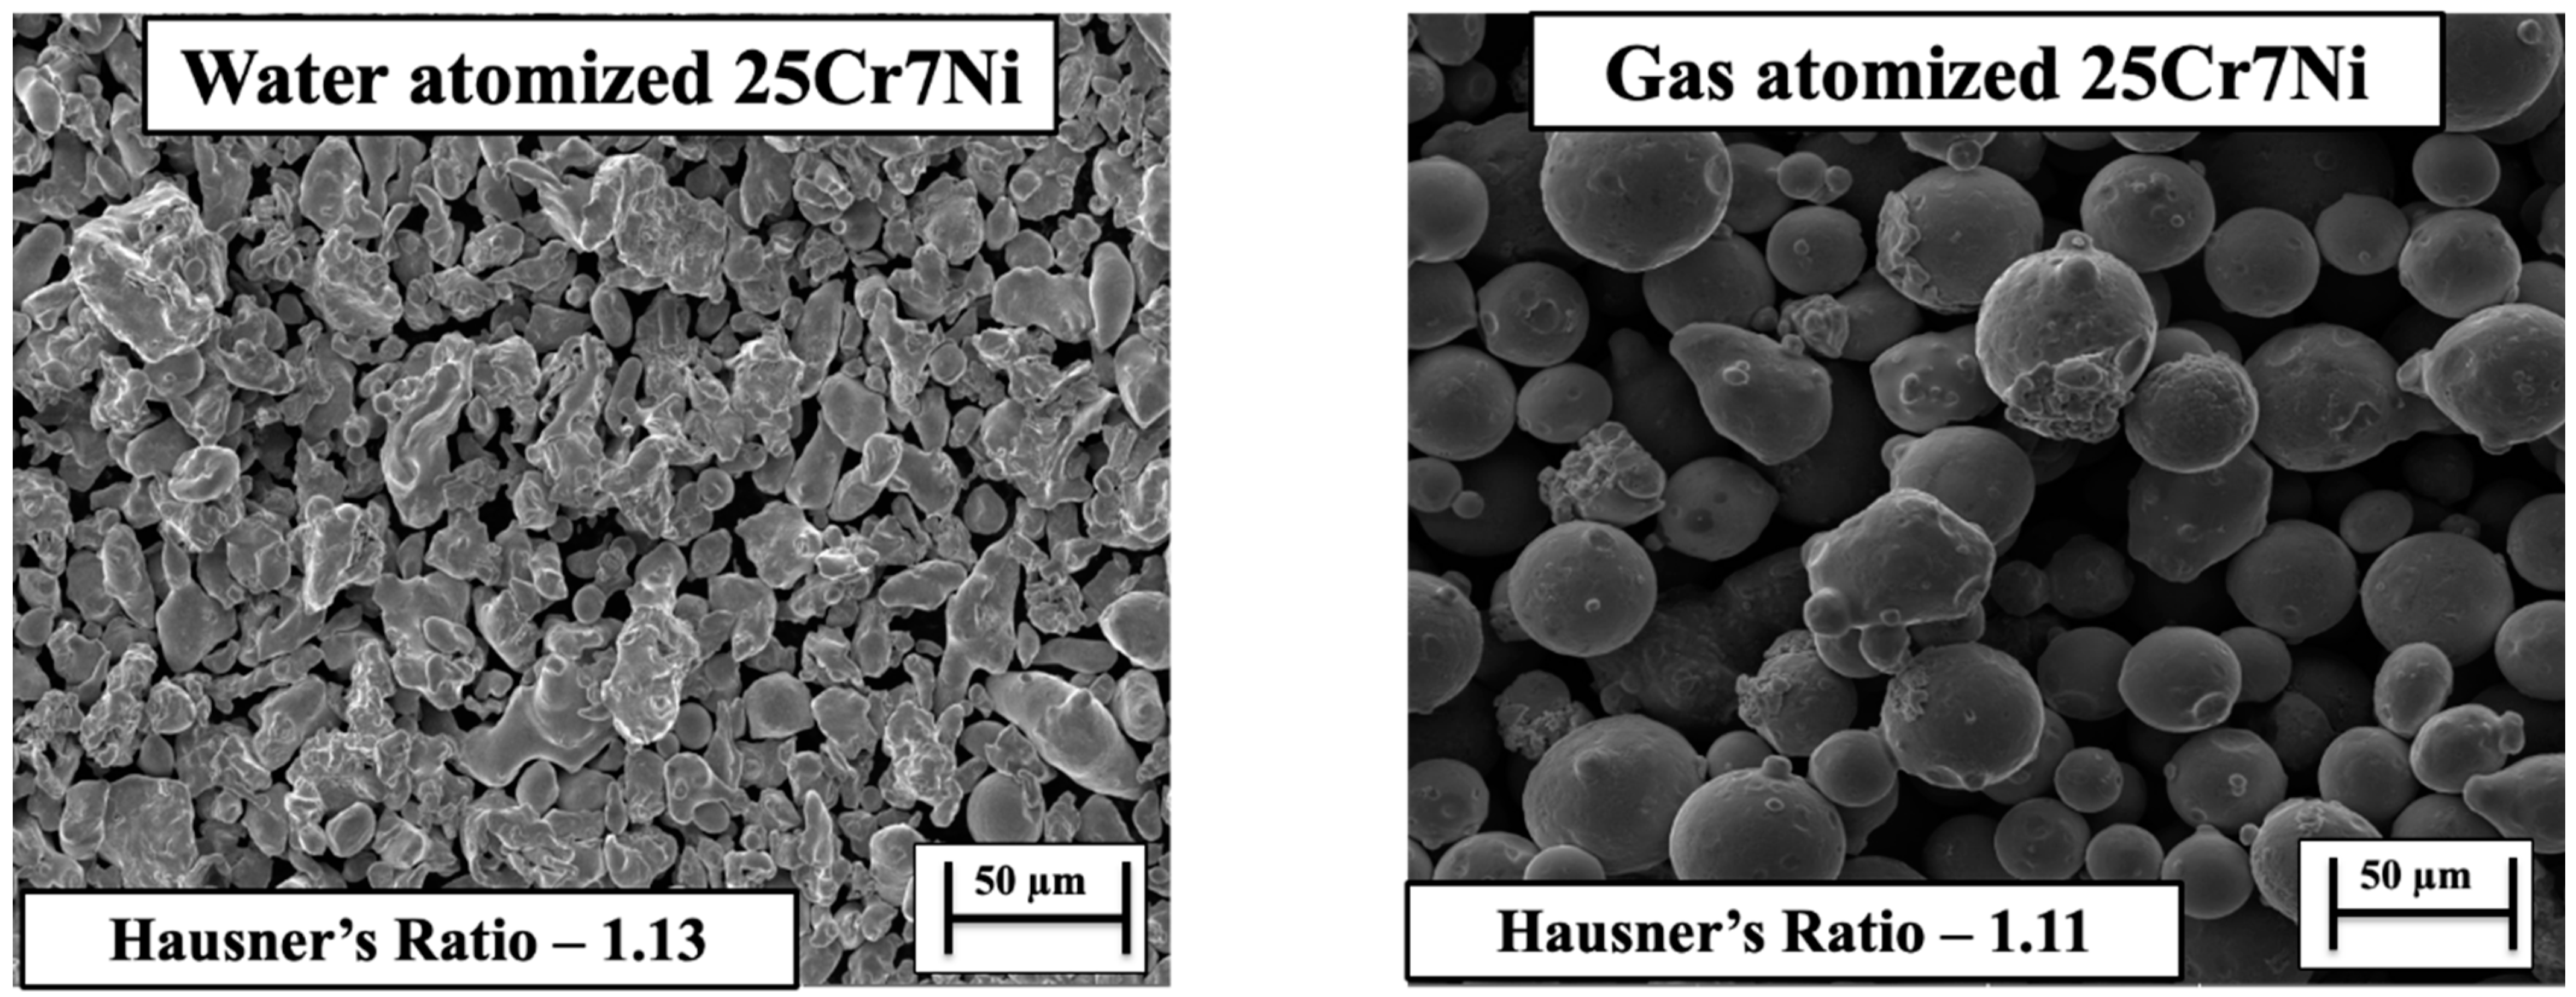
From the SEM micrographs in Figure 2, we can see that the gas atomized powders had a more uniform and a spherical morphology in comparison to the water atomized powders. The observed morphology trend could be explained by the atomization media/atomizing jets, with water atomization employing water and gas atomization using gases such as Ar and N. The process workflow of the atomization process involves segregating the metal melt introduced into the atomizer, through an atomizing jet, into droplets. The segregated droplets cool down and solidify into water slurry (in case of water atomization)/powder slurry (in case of gas atomization) [8]. The cooling rates afforded by a water atomizing medium are about two orders of magnitude higher than those of the gas atomizing medium, which restricts the time available for the segregated melt droplet to solidify under its own surface tension into spherical particles under water atomization. This is the main reason for the irregular morphology of powders atomized through water atomization [7,20].
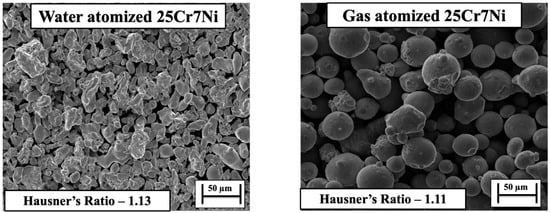
Figure 2.
SEM micrographs of (left) water atomized 25Cr7Ni powder and (right) gas atomized 25Cr7Ni powder.
Comparing the bulk densities characterized for the starting powders, the gas atomized powder had a higher bulk density of 4.28 ± 0.02 g/cc in comparison to the water atomized powder, which had a bulk density of 3.0 ± 0.01 g/cc. When analyzing the D10 sizes and the D90 sizes of the starting powders, the water atomized powders showed a wider distribution of fine and large sized particles (D10 16 μm and the D90 62 μm) than did the gas atomized powders (D10 20.6 μm and the D90 51.9 μm). In the works of [21,22], a wider distribution of particle sizes enabled a higher bulk/powder bed packing density, with finer powder particles filling in the voids between the larger sized powder particles. In the context of the present study, water atomized powders, in spite of a wider particle size distribution, yielded a lower bulk density than did gas atomized powders, due to the irregular morphology, promoting interlocking between the powder particles, and in-turn, retarding powder flow and spread [23]. The Hausner’s ratio, which aids in quantifying the powder bed packing density, was characterized for water atomized powders as 1.13 and gas atomized powders as 1.11, with a lower value related to a higher bulk/powder bed packing density.
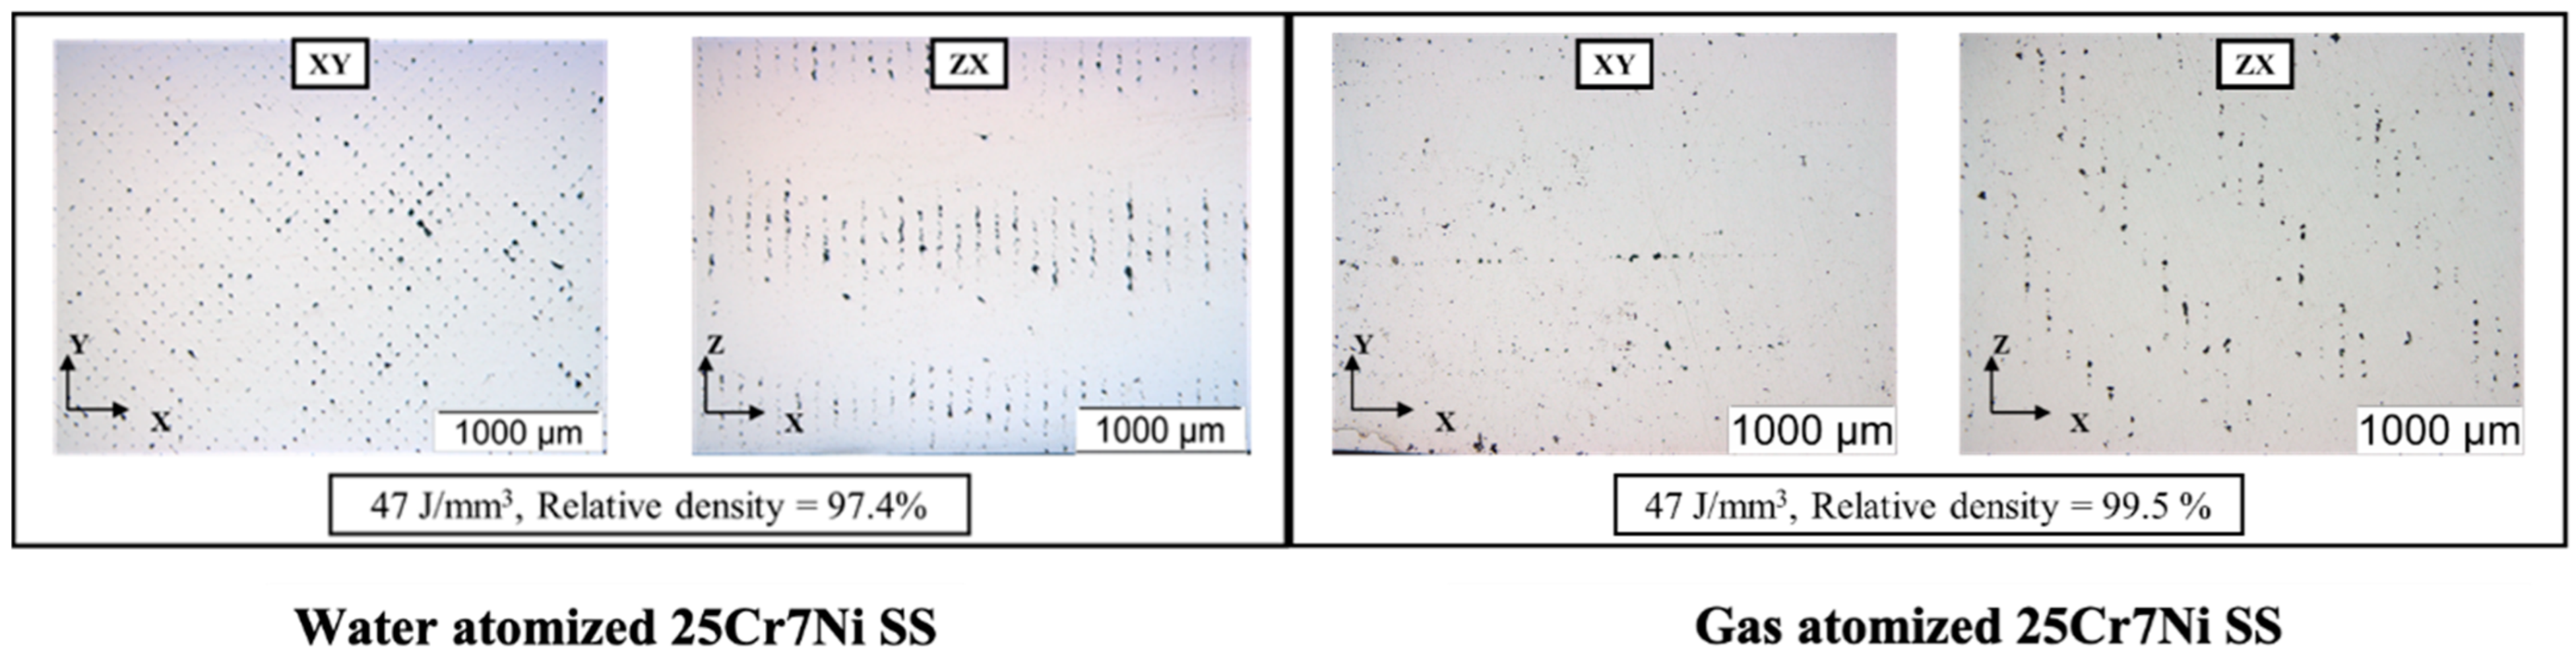
The Archimedes density and the relative density of the as-printed L-PBF samples from the water atomized powders were characterized to be 7.48 g/cc, and 97.4% were lower than the densities of the as-printed L-PBF samples from the gas atomized powders, which were 7.62 g/cc and 99.5%, related to the lower powder bed packing density of water atomized powders. The unpacked voids in the powder bed were prevalent in the water atomized powders, which were primarily solidified as porosities in the as-printed samples [24]. The optical micrographs in Figure 3 capture the distribution of pores in both the scan (XY) and build directions (ZX) in the L-PBF as-printed samples. The average porosity in the as-printed samples from the water atomized powders were characterized to be over 3% in comparison to less than 0.5% in the as-printed samples from the gas-atomized powders, corelating with the results for powder bed packing density. The porosity was characterized using image J software.
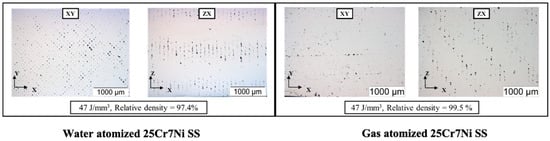
Figure 3.
Optical micrographs of L-PBF processed water atomized 25Cr7Ni samples (left) and the gas atomized 25Cr7Ni samples (right).
Apart from powder bed compaction, spatter generation (liquid spattering and hot powder spattering) during the interaction of the laser with the melt pool and the powder particles contribute to the evolution of porosity in the L-PBF as-printed samples [25,26]. Considering hot powder spattering, the ejection of unmelted powder by the melt pool vapors [23] showed that the irregular morphology of water atomized powders promoted interlocking between powder particles, resulting in larger sized spatters being ejected in comparison to similarly sized, spherical gas atomized powders along the laser scan tracks. In studying the optical micrographs along the scan direction (XY), as shown in Figure 3 in this context, for the same process parameters (laser power, scan speed, hatch spacing, and layer thickness), the as-printed samples from water atomized powders exhibited more porosity than the as-printed samples from gas atomized powders.
The oxygen content in the starting powders of water and gas atomized stainless steel powders were characterized using a Leco elemental analyzer to be 0.171 ± 0.042% in water atomized powder and 0.07 ± 0.005% in gas atomized powder. Kaplan et al. [27] reported that even a small variation in concentrations of surface-active elements such as oxygen can directly impact the thermo-capillary forces of the melt, with a higher oxygen content resulting in lower surface tension of the melt and a larger liquid spatter able to escape the melt. The higher oxygen content in the water atomized powders could have resulted in larger liquid spatters, increasing the porosity of their as-printed L-PBF parts. The reduction in the surface tension of the melt pool also decreases the wettability of the melt, with the powder particles leading to porosities from the lack of fusion between the powder layers [23].
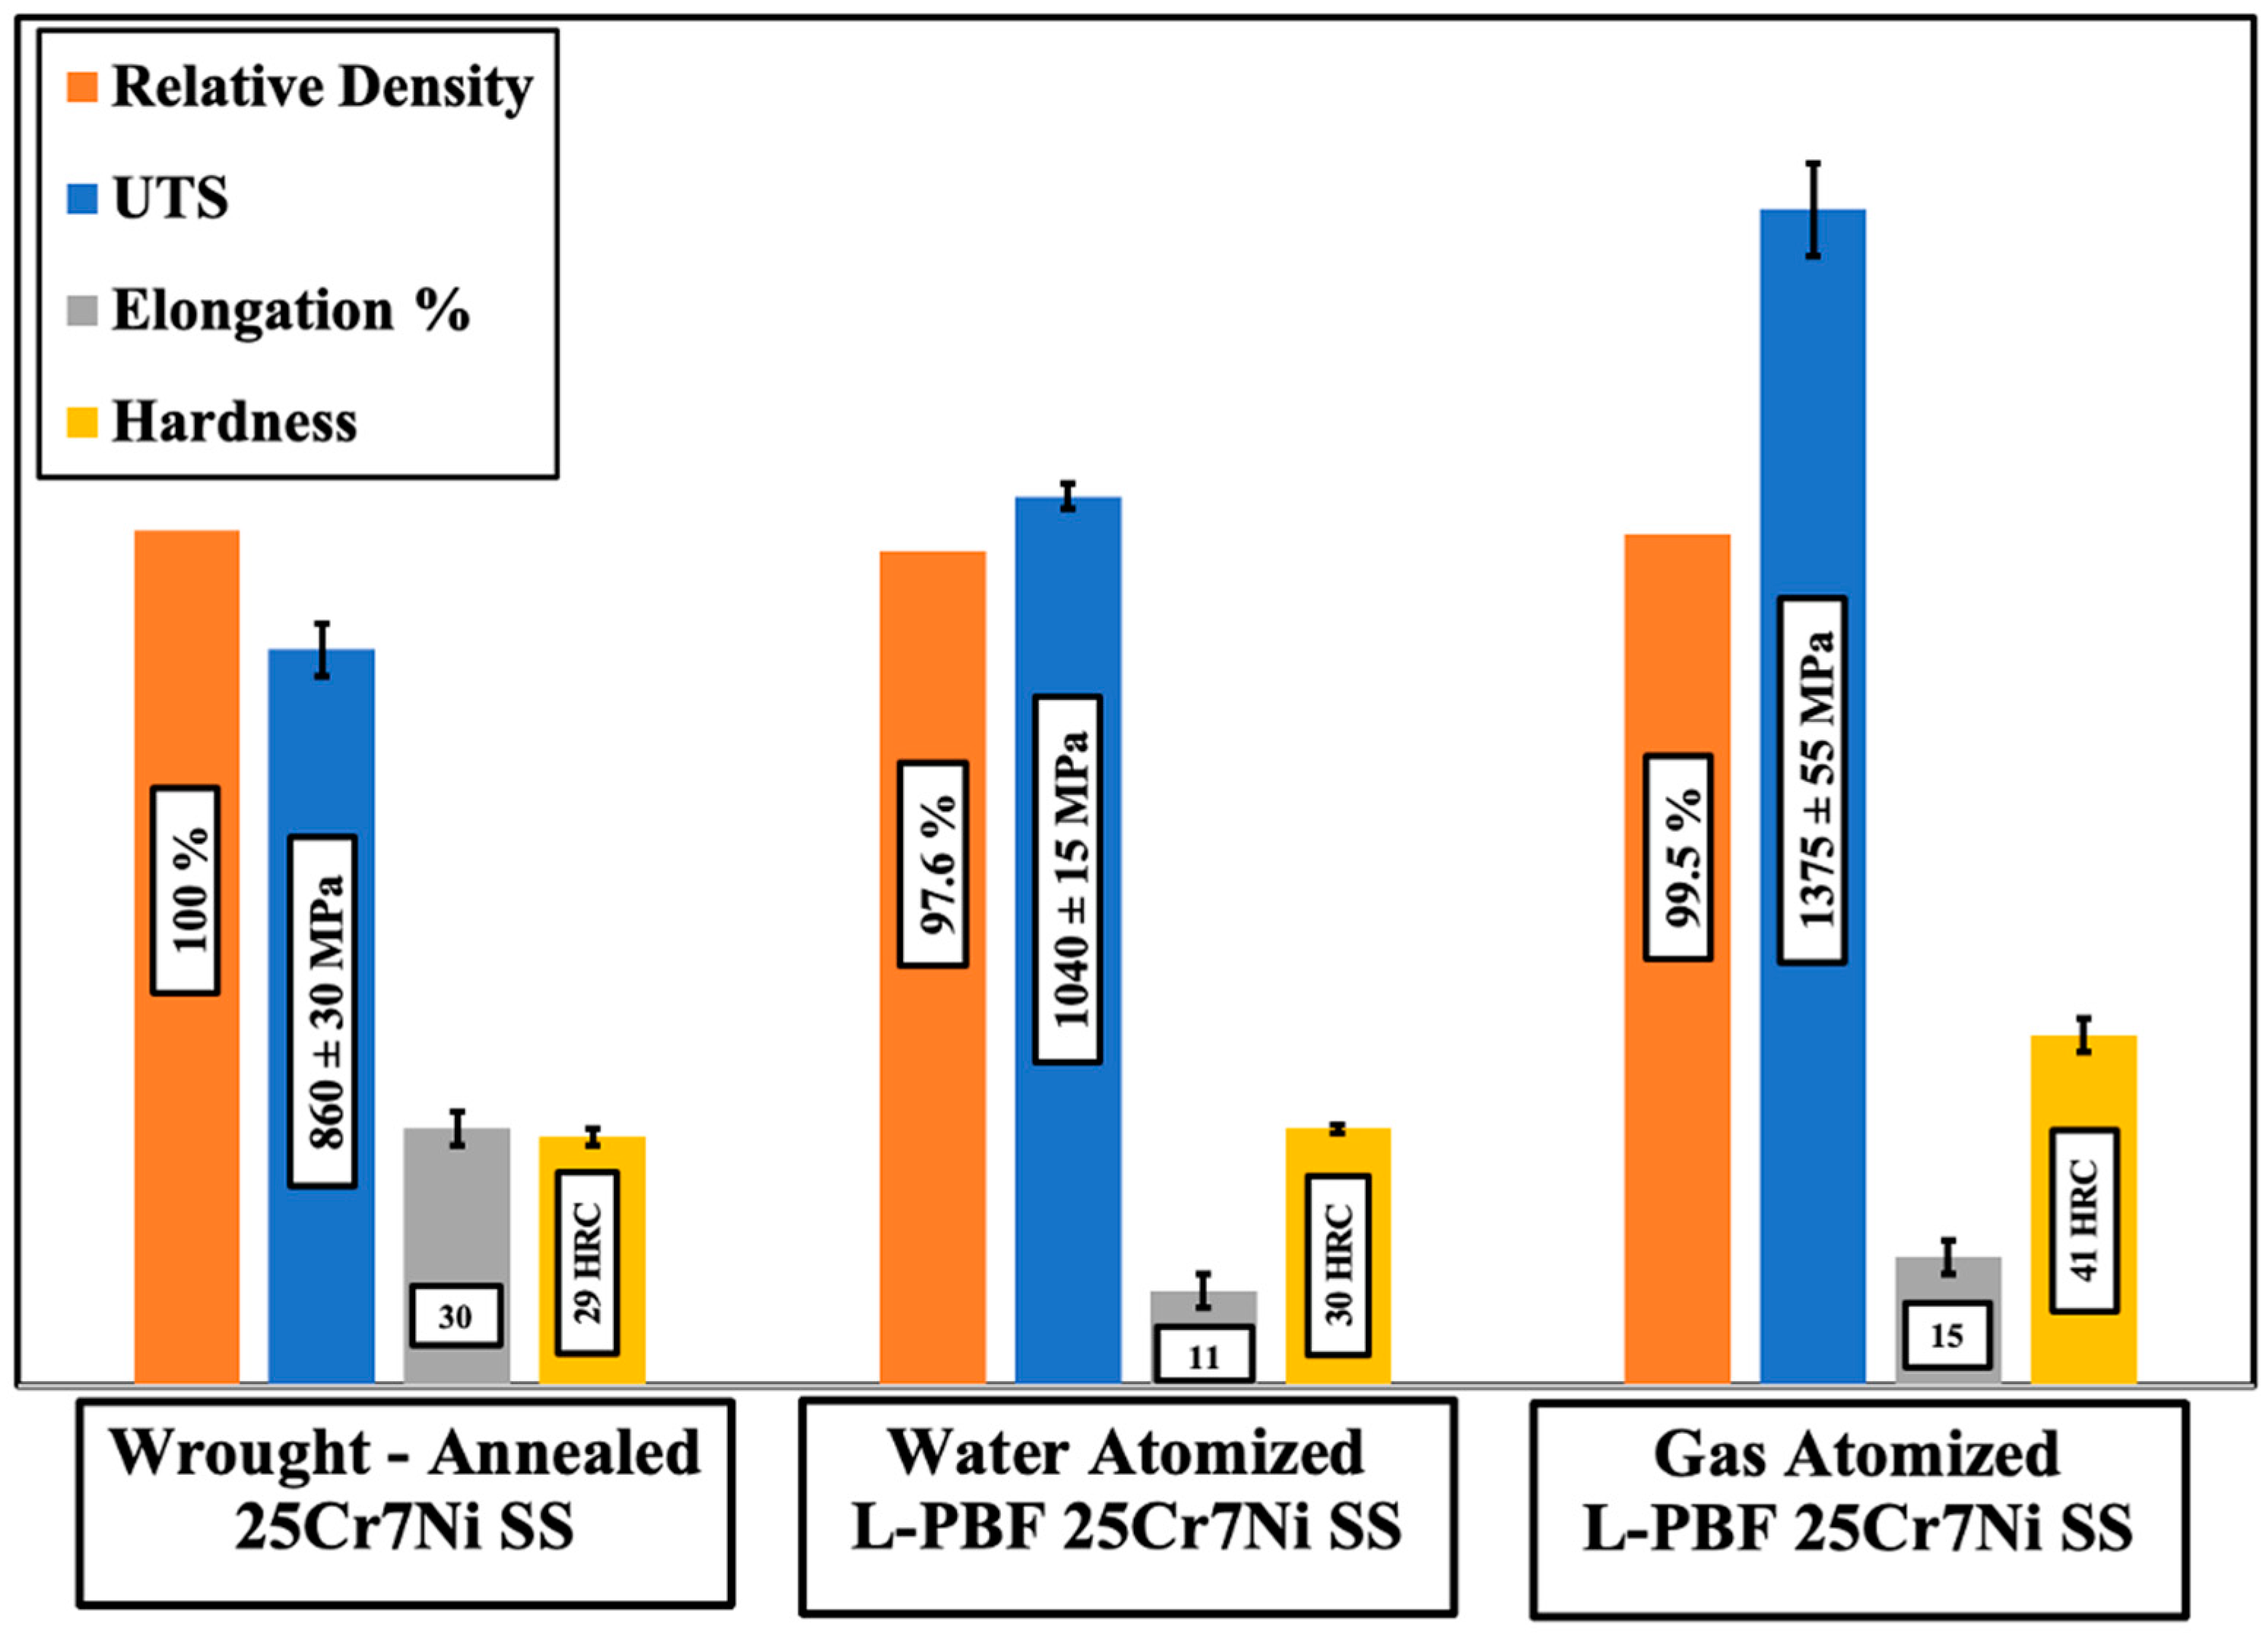
Figure 4 collates the mechanical properties of the L-PBF samples printed from the water atomized and gas atomized powders of 25Cr7Ni stainless steels with a wrought–annealed 25Cr7Ni stainless steel. L-PBF samples from both the powder lots had a higher UTS and hardness than the wrought–annealed 25Cr7Ni stainless steel sample, primarily due to the high dislocation densities inherent in the L-PBF as-printed samples from the intense thermal cycles of the process [15], as well as grain refinement from high cooling rates [14]. The higher elongation of the wrought–annealed samples over the L-PBF samples can partially be attributed to the lack of porosities in these samples. Comparing the L-PBF samples, the samples produced from gas atomized powders had a higher UTS and elongation, as well as a higher hardness, than the samples produced from water atomized powders. The higher porosity of the samples from the water atomized powder lot could be one of the reasons for this difference in the mechanical properties, as a lack of densification in the L-PBF samples has been shown to have a limiting effect on the as-printed L-PBF sample mechanical properties [10,18]. In terms of the chemical compositions of the two powder lots, the gas atomized powders contained more than twice the amount of N, three times the amount of Mo, and an over nine times greater Mn content than did the water atomized powders. Mo and Ni are strong substitutional solid solution strengthening elements, and similarly, N is a strong interstitial solid solution strengthening element, with Mn contributing towards marginally improving UTS without compromising ductility [28,29,30]. The higher UTS and elongation of the L-PBF samples from the gas atomized powders over the L-PBF samples obtained from the water atomized powders can also be explained based on the previously mentioned influence of the alloying elements.
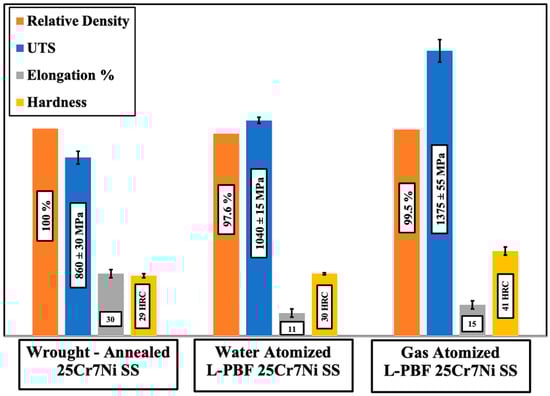
Figure 4.
Comparison of mechanical properties.
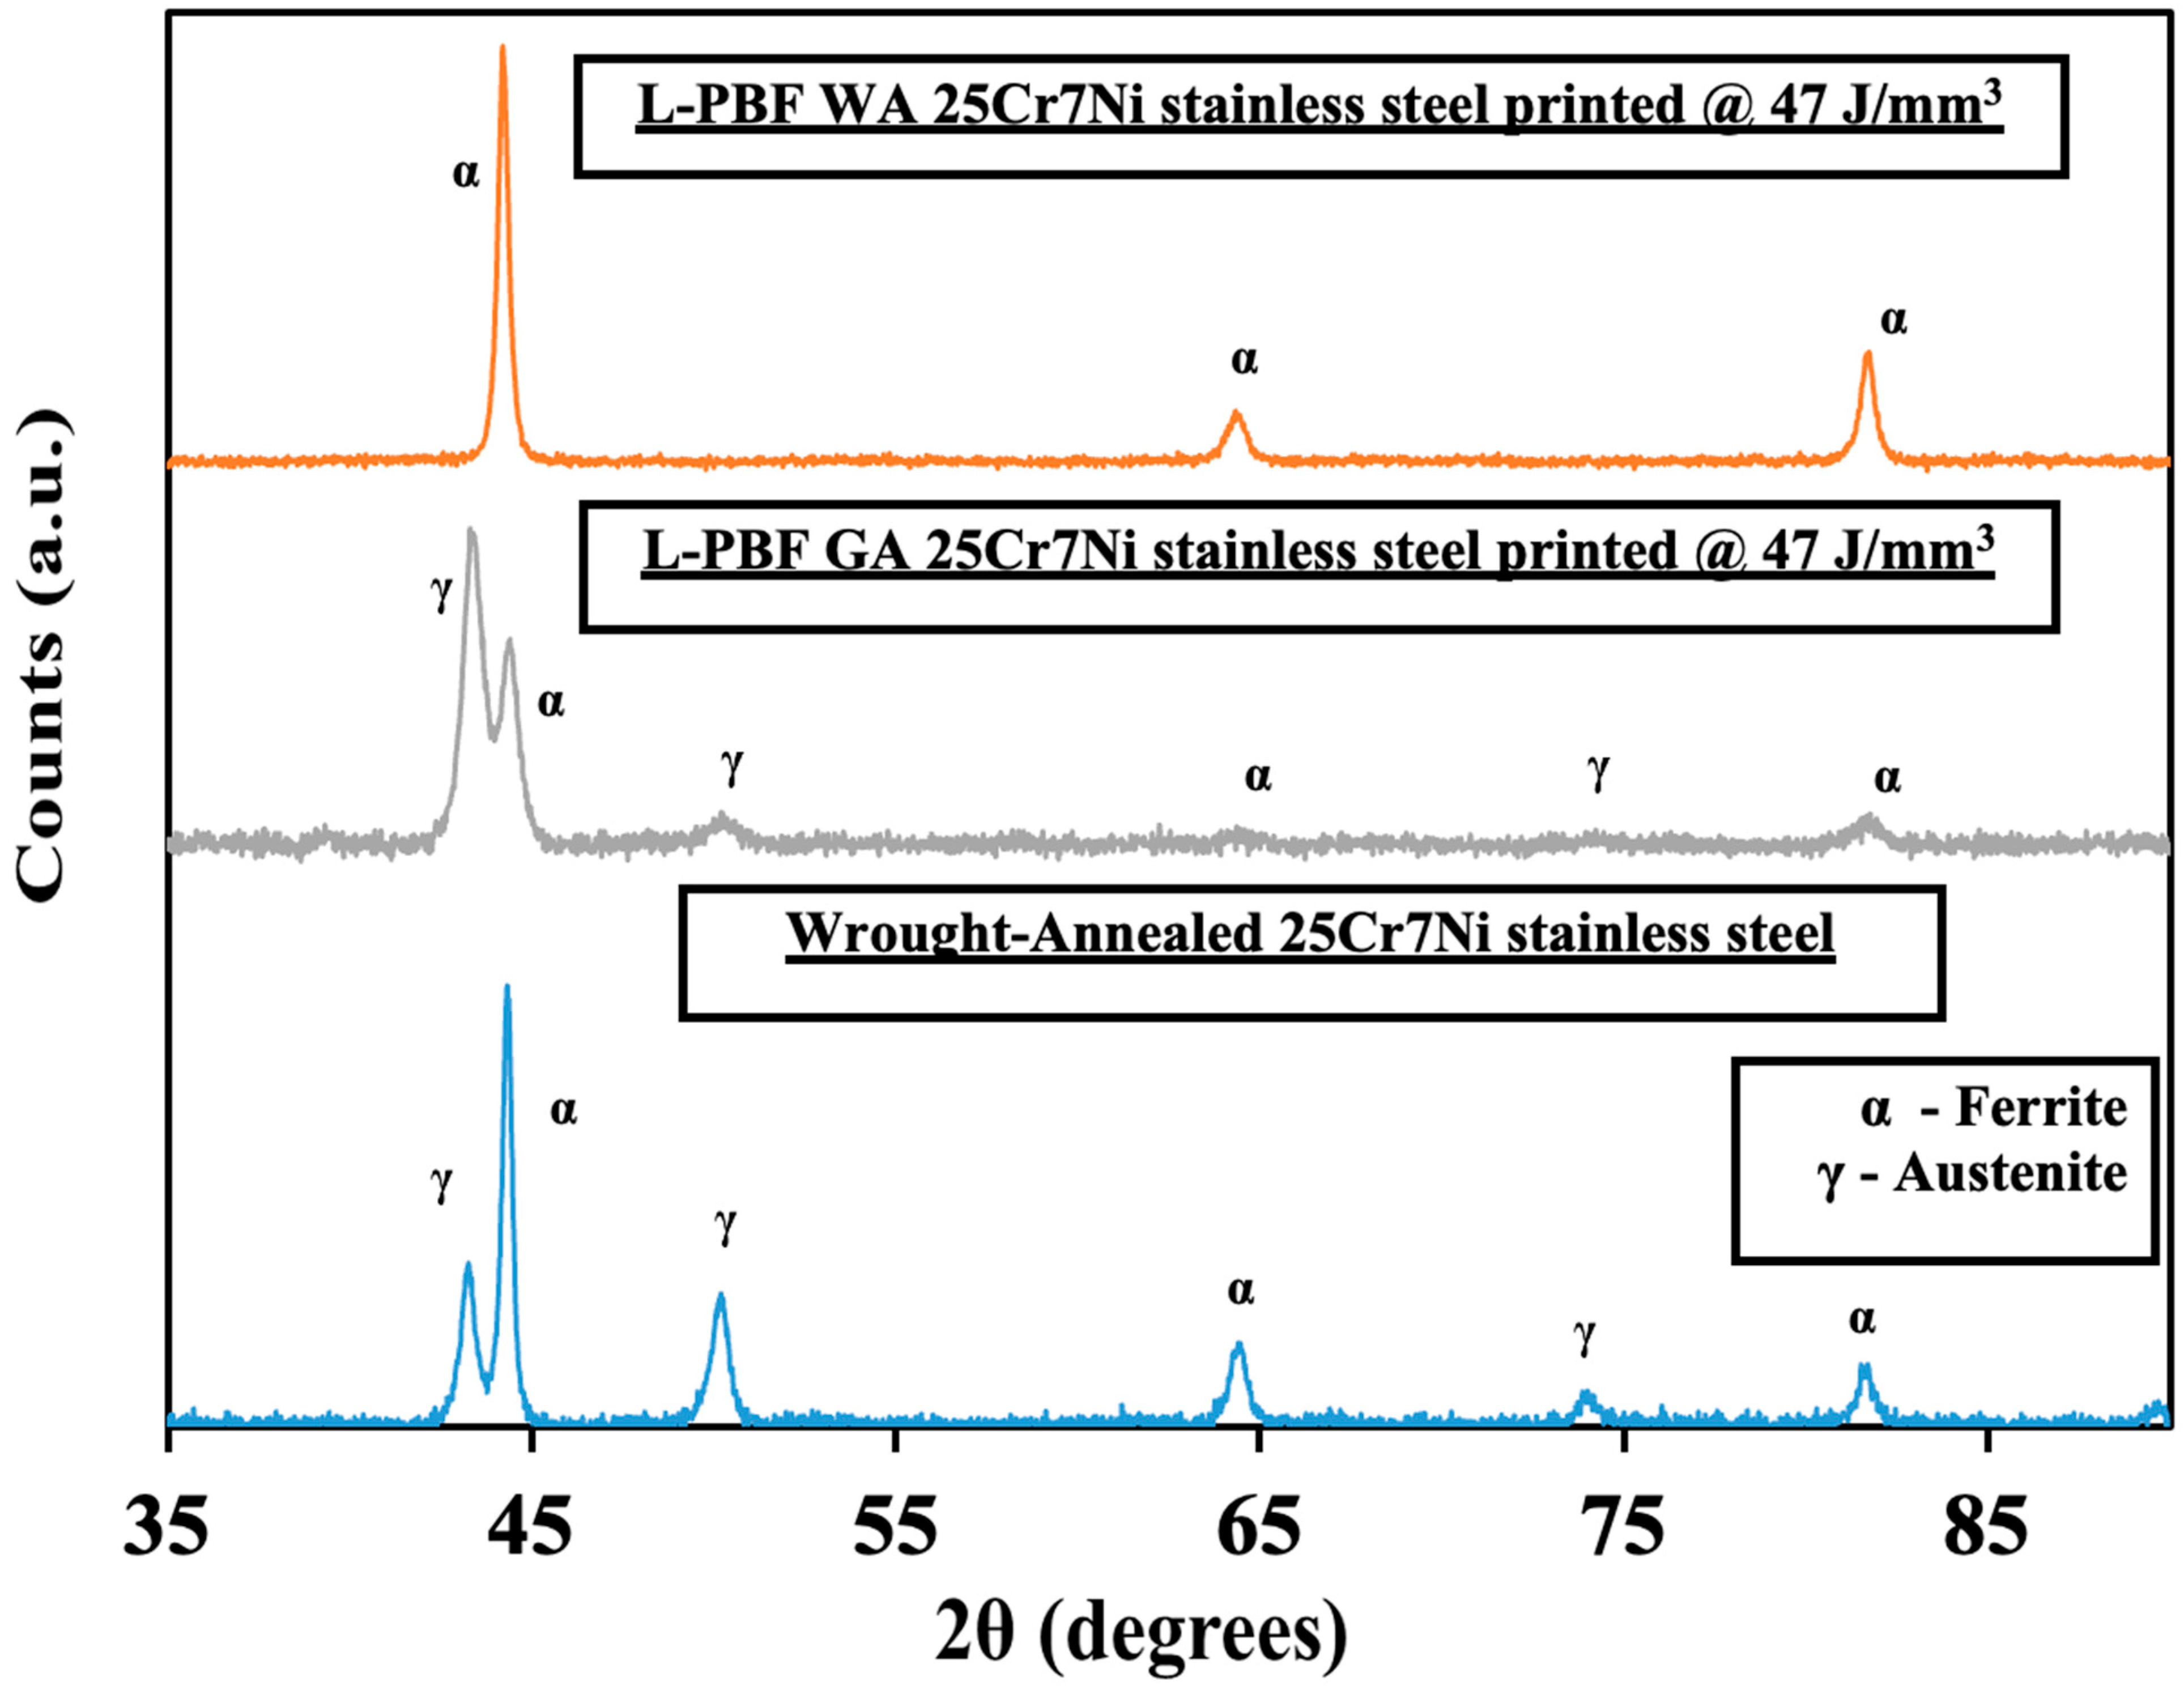
Figure 5 collates the XRD profiles for a wrought–annealed, L-PBF samples from gas atomized (GA) and water atomized (WA) powders of 25Cr7Ni stainless steel. Both austenite peaks (2θ = 43°, 50°, 74°) and ferrite peaks (2θ = 44°, 64°, 81°) were registered in the XRD profile of the wrought–annealed 25Cr7Ni stainless steel sample. The XRD profiles of the L-PBF samples printed from the water atomized powders displayed only ferrite peaks, while the L-PBF samples from the gas atomized powders displayed both ferrite and austenite peaks. The above observation can be explained based on two competing phenomena. The high cooling rates involved in the L-PBF processes (106–107 K/s) effectively suppress the decomposition of ferrite into austenite in the as-printed state during fabrication [31]. Specific elements in the alloy composition, such as nitrogen (primary austenite phase stabilizer) and manganese (improves solubility of nitrogen in austenite), aid in stabilizing the retained austenite formed during the L-PBF process [28,32]. With no N and over nine times less Mn in the water atomized powder in comparison to gas atomized powders, the possibility of any retained austenite in the corresponding L-PBF samples of the water atomized powders is completely negated by the high cooling rates of the L-PBF process. The presence of austenite in the L-PBF samples printed from the gas atomized powders can also be related to their higher elongation compared to that in the samples from water atomized powder, as the austenite phase has been shown to afford higher elongation than ferrite phase [18].
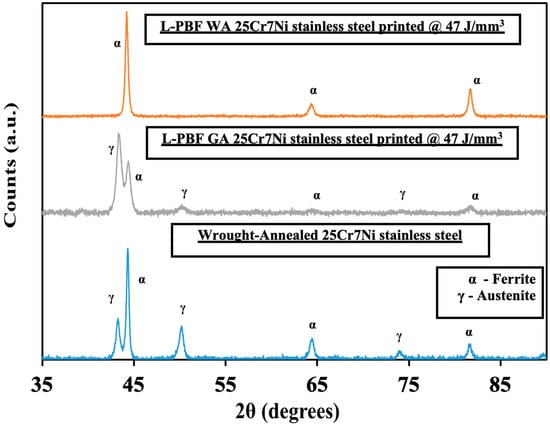
Figure 5.
Collated XRD profiles of (top) L-PBF water atomized, (middle) L-PBF gas atomized, and (bottom) wrought–annealed 25Cr7Ni samples.
The electro-etched micrographs in Figure 6 corroborate the XRD results, with the L-PBF samples from the water atomized powders being completely etched to reveal a 100% ferrite microstructure and the L-PBF samples from the gas atomized powders revealing both an etched ferrite phase and an unetched grain boundary austenite phase. The fraction of retained austenite in the L-PBF samples from the gas atomized powders were estimated using Image J software to be around 15%. Detrimental phases, such as σ and χ phases, were not observed in either of the cases.
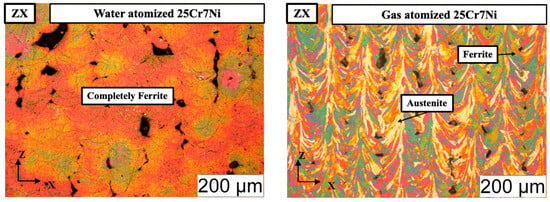
Figure 6.
Optical micrographs of the electro-etched L-PBF processed: (left) water atomized 25Cr7Ni samples and (right) gas atomized 25Cr7Ni samples along the build direction (ZX).
With the presence of both ferrite and grain boundary austenite in the L-PBF samples from the gas atomized powder, the corresponding electro-etched samples were observed under SEM and EDS to determine if there was any elemental partitioning/segregation between the phases. The SEM micrographs (Figure 7) did not reveal any precipitates, nor the EDS show any elemental partitioning between the ferrite and austenite phases.

Figure 7.
SEM micrographs of the electro-etched L-PBF gas atomized 25Cr7Ni sample along the build direction (ZX) indicated by the white arrow.
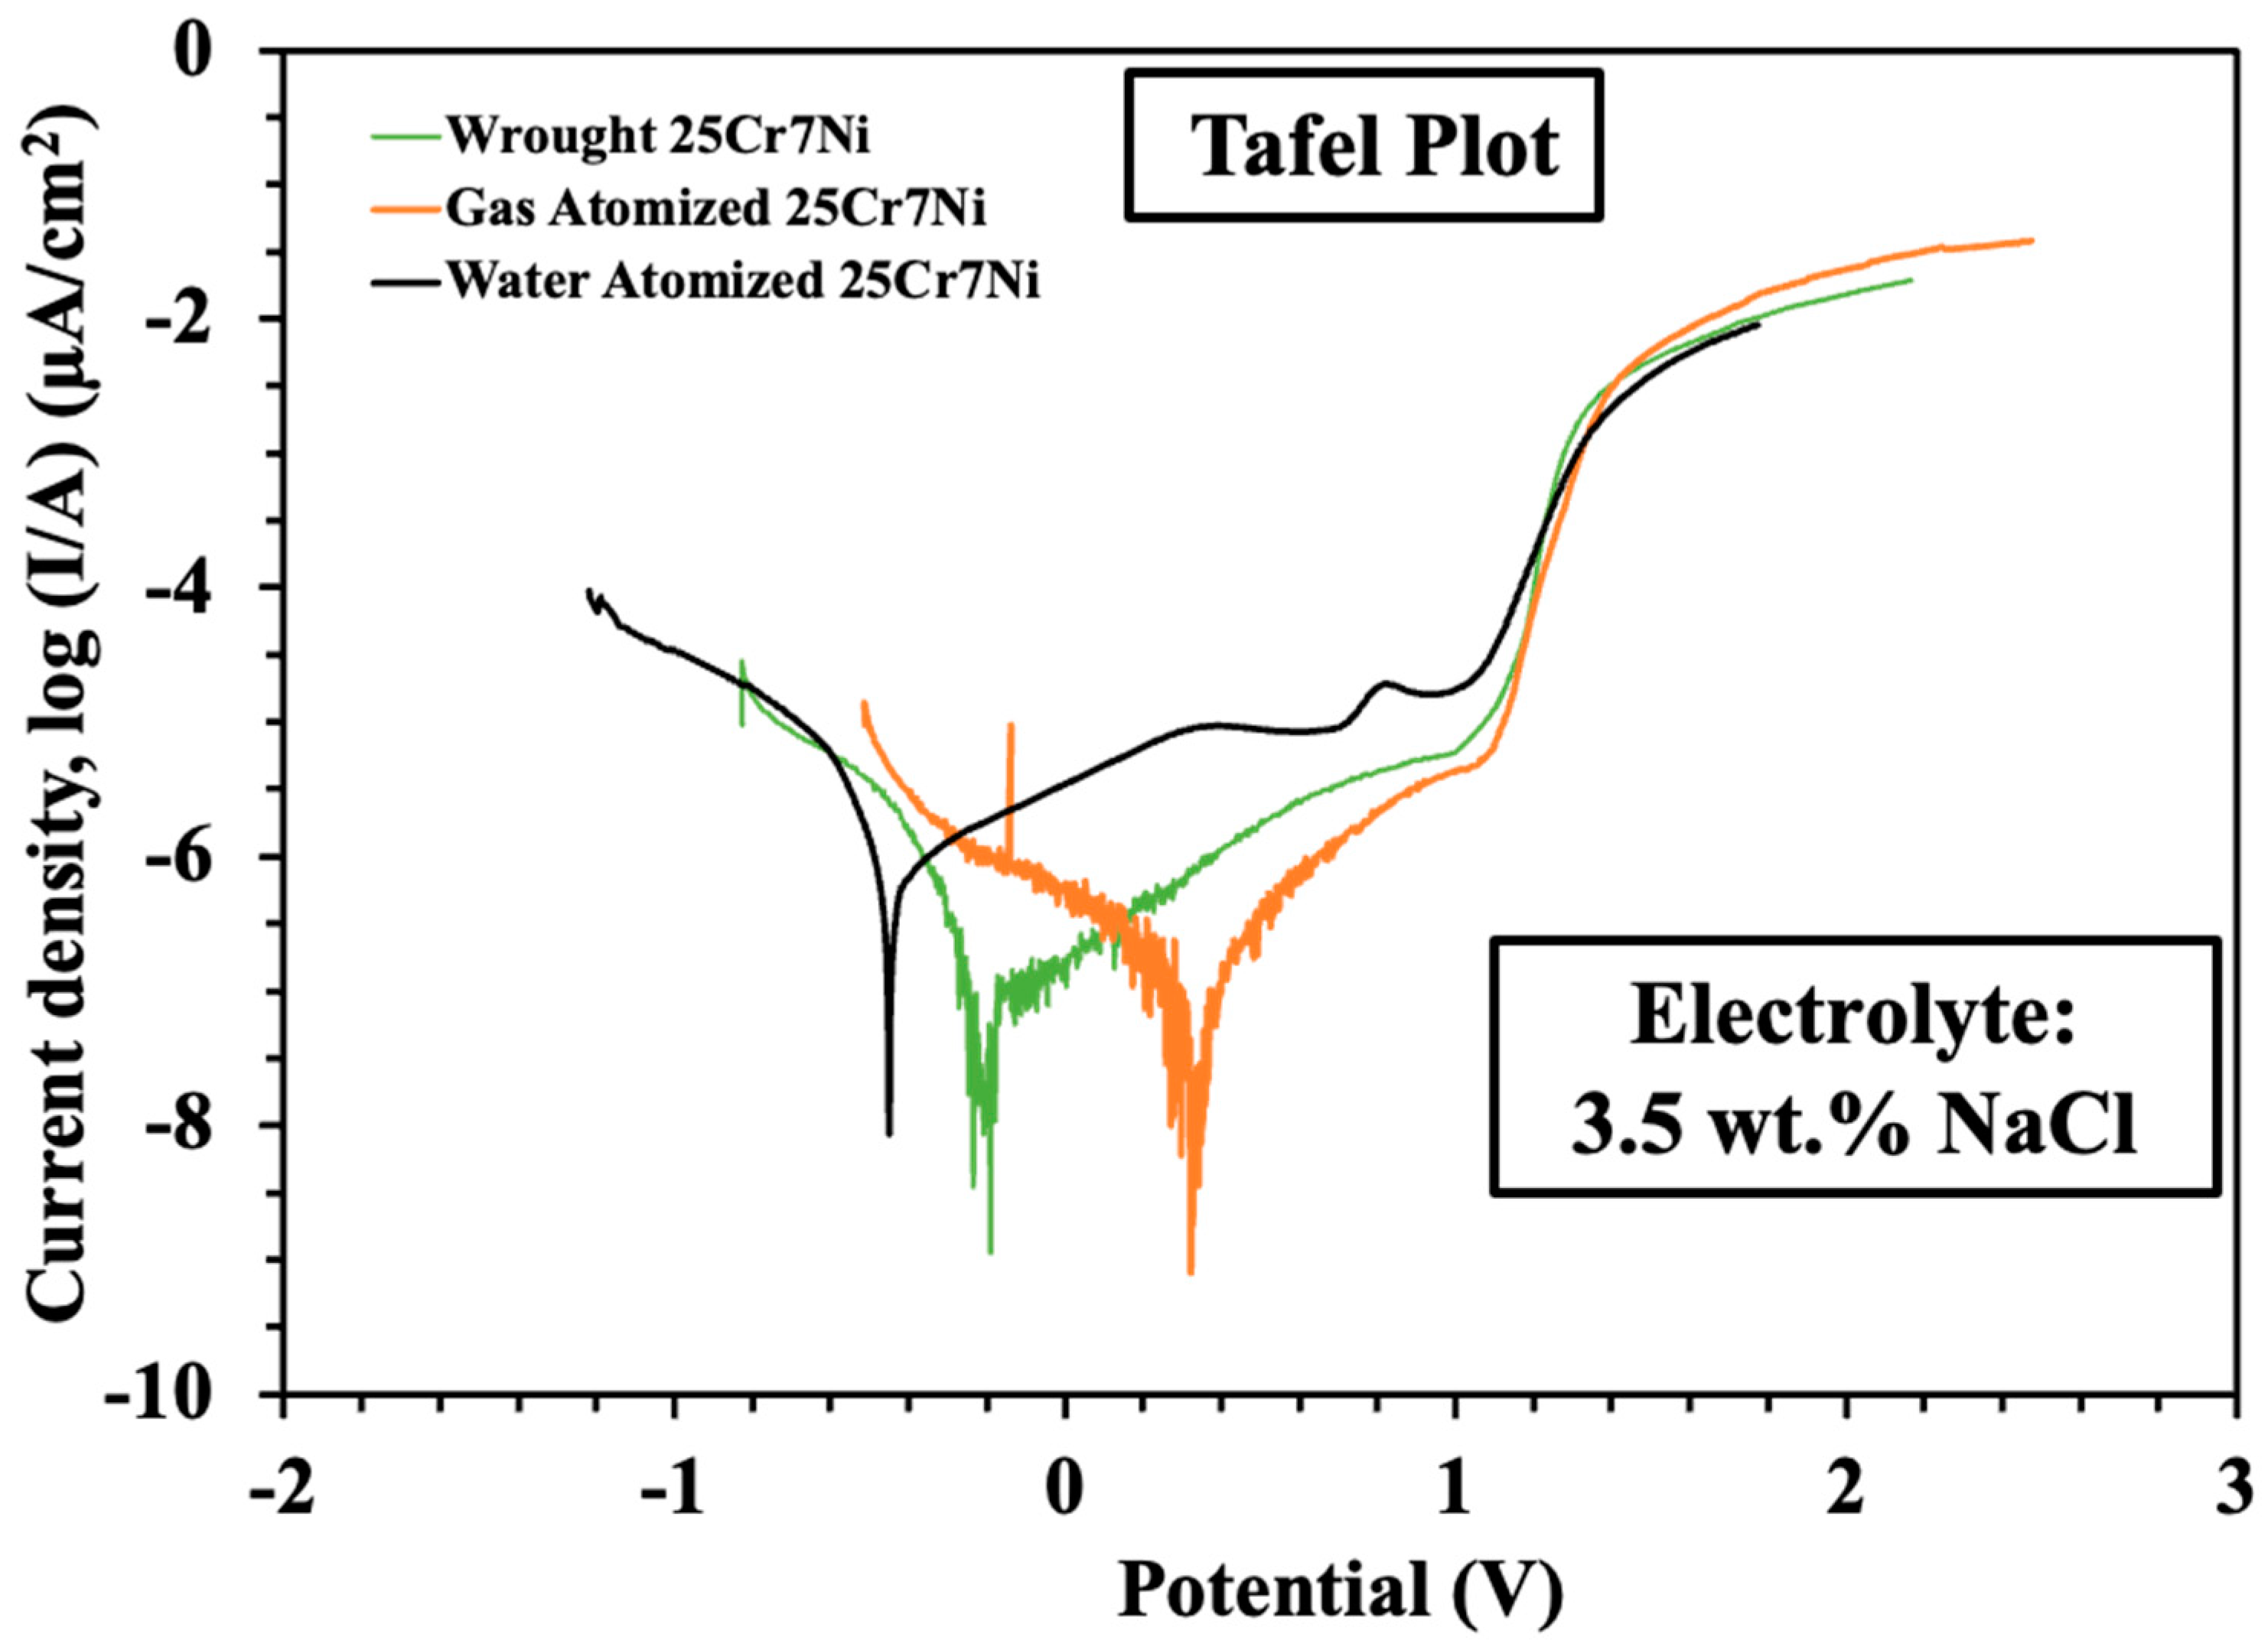
The results from the linear sweep voltammetry experiments were processed using NOVA software, from which Tafel plots were extracted, as seen in Figure 8. The corrosion properties of all the samples in terms of corrosion current, breakdown potential, polarization resistance, and the corrosion rate were obtained using these equations, along with the and Butler–Volmer equations [9].
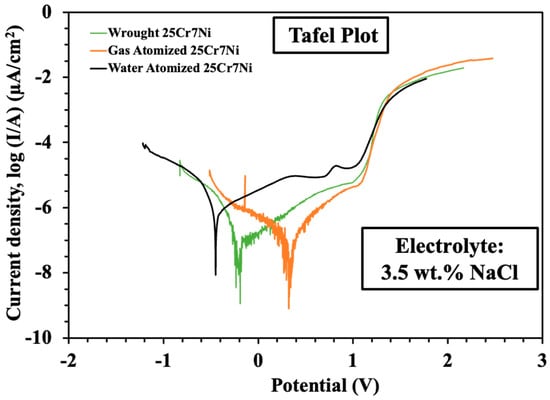
Figure 8.
Tafel plots from the linear sweep voltammetry experiments collated from the L-PBF sample of water atomized (black), wrought–annealed (green), and gas atomized (orange) 25Cr7Ni stainless steel.
Table 3 collates the corrosion properties of the L-PBF samples from the gas atomized powders, water atomized powders, and wrought–annealed 25Cr7Ni stainless steels. The L-PBF samples from the gas atomized powders exhibited about 6 times the corrosion resistance compared to that of the L-PBF samples from the water atomized powder in terms of higher polarization resistance and breakdown potential, lower corrosion current, and corrosion rate. They also showed a comparable corrosion resistance to the wrought–annealed 25Cr7Ni stainless steel.
Table 3.
Comparison of corrosion properties.
The higher corrosion resistance of the L-PBF samples from the gas atomized powders compared to those of the L-PBF samples from the water atomized powders can be reasoned on two fronts. Subrata et al. [9] and Irrinki et al. [10] reported that the inherent part porosity areas in the as-printed L-PBF samples served as sites for localized pitting corrosion, primarily due the lack of exposure of the electrolyte in the pores to oxygen, decreasing their pH and promoting further corrosion [33,34]. Looking at the corrosion resistance trend in this context, the calculated porosity of the L-PBF samples from the water atomized powders was over 3% in comparison to less than 0.5% in the case of L-PBF samples from the gas atomized powders, which could in-turn contribute to a higher corrosion resistance in the L-PBF samples from the gas atomized powders. Next, the influence of the alloying elements in the starting powders and their corresponding influence on the phases evolved on the corrosion properties is considered. The gas atomized powders contained higher amounts of N and Mn, which, being strong austenite stabilizers, promoted the retention of 15% austenite in the L-PBF samples in comparison to the results for the water atomized powders, which contained no N and nine times less Mn, leading to the complete suppression of austenite formation in their corresponding L-PBF samples. The austenite phase has been widely reported to show higher corrosion resistance properties than does the ferrite phase [12,35]. Apart from austenite stabilization, N inherently retards the rate of the corrosion process [36]. The gas atomized powders also contained more than three times more Mo than did the water atomized powders. The presence of Mo is important for the passivation of corroding surfaces in stainless steel systems, in turn increasing their corrosion resistance [28].
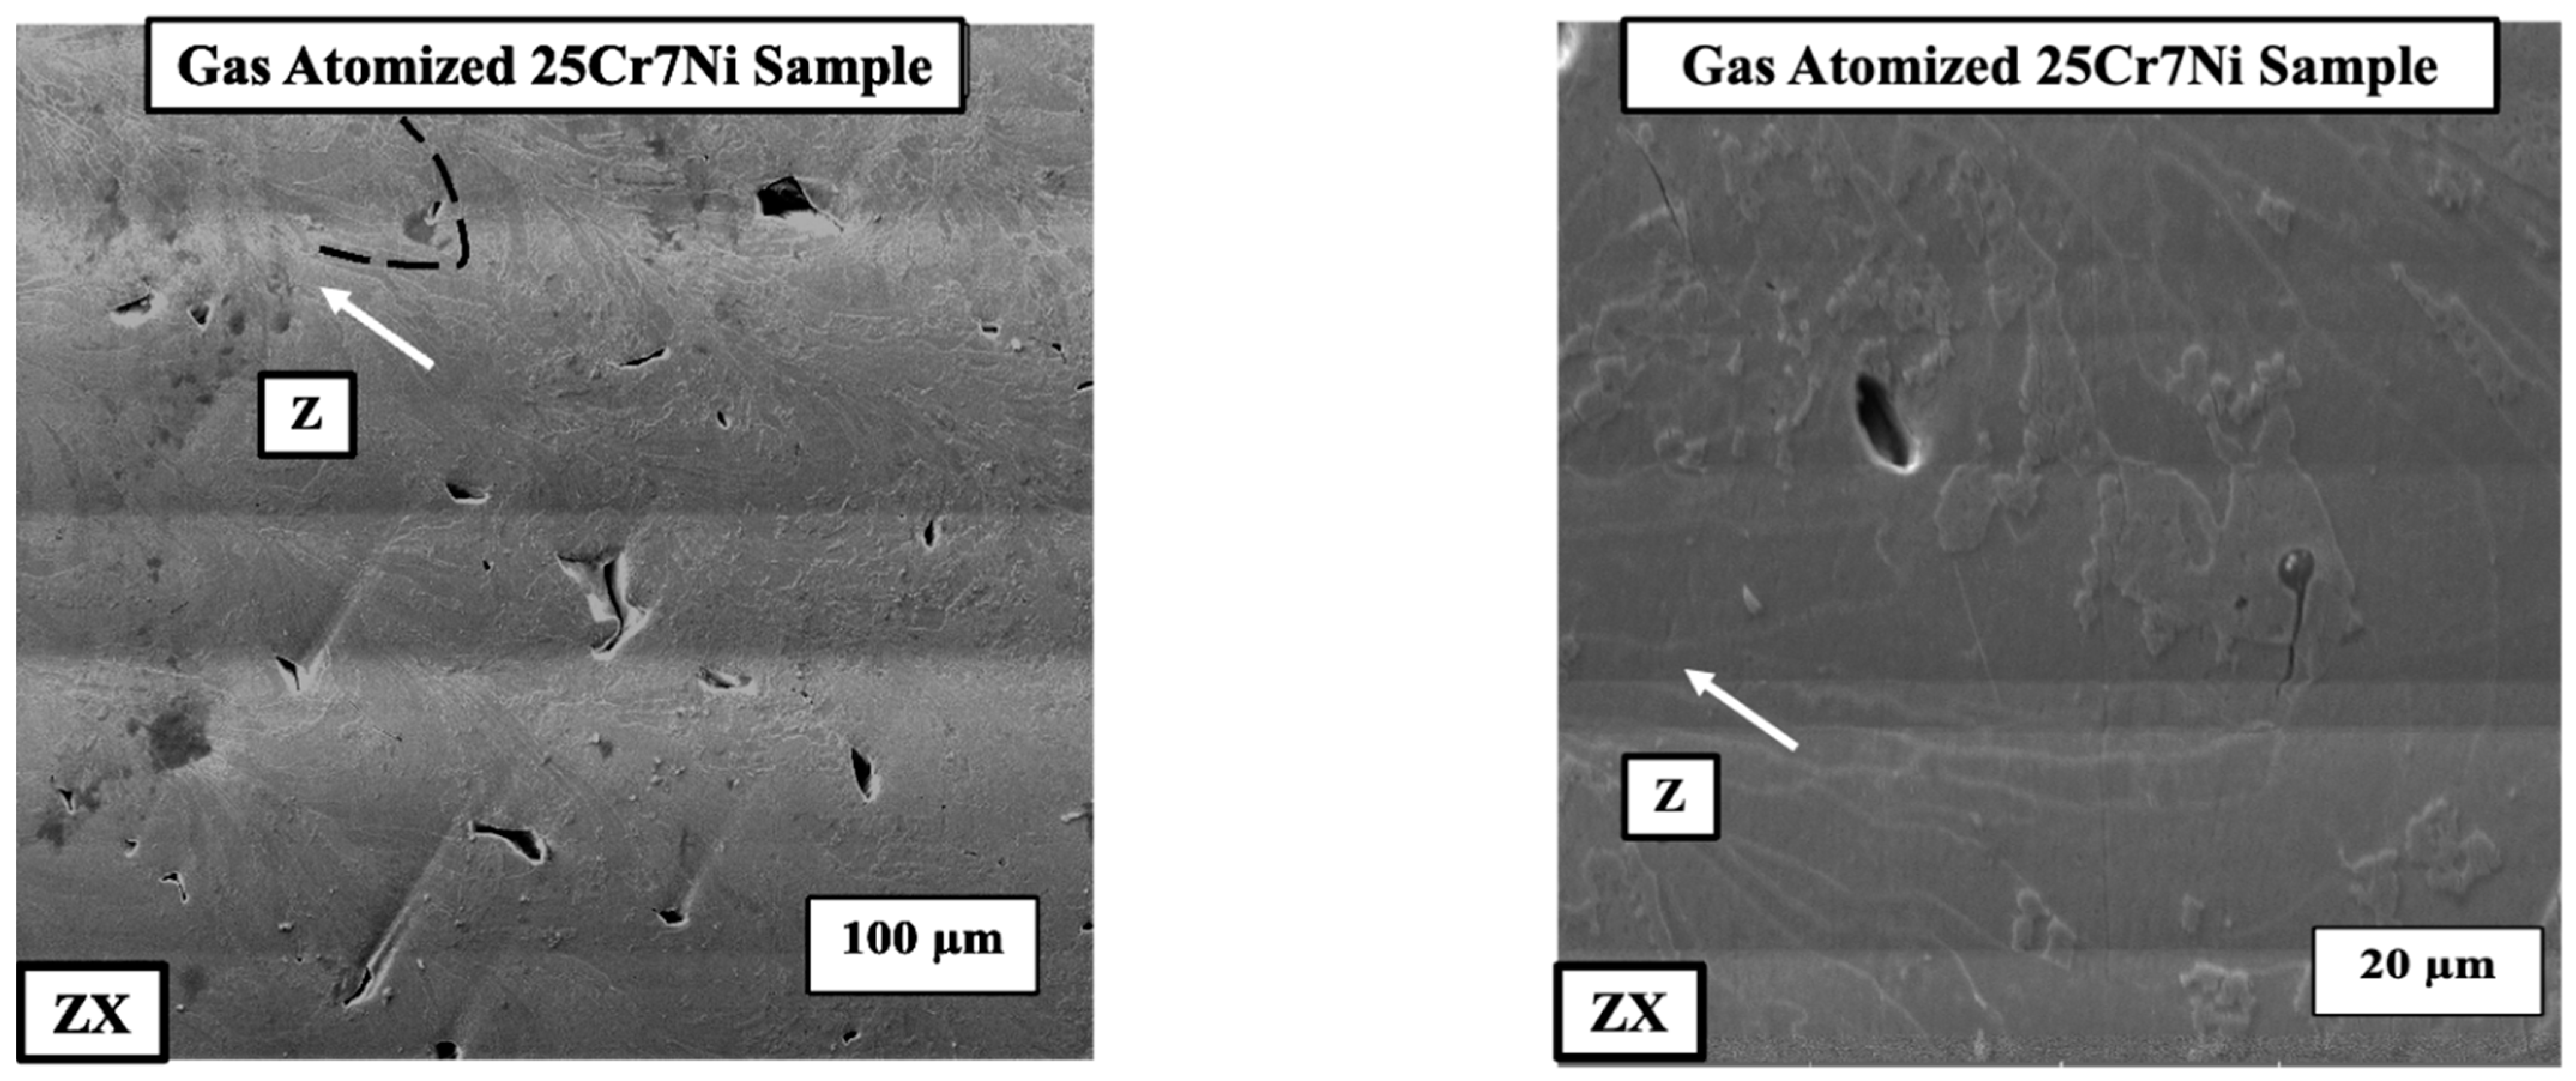
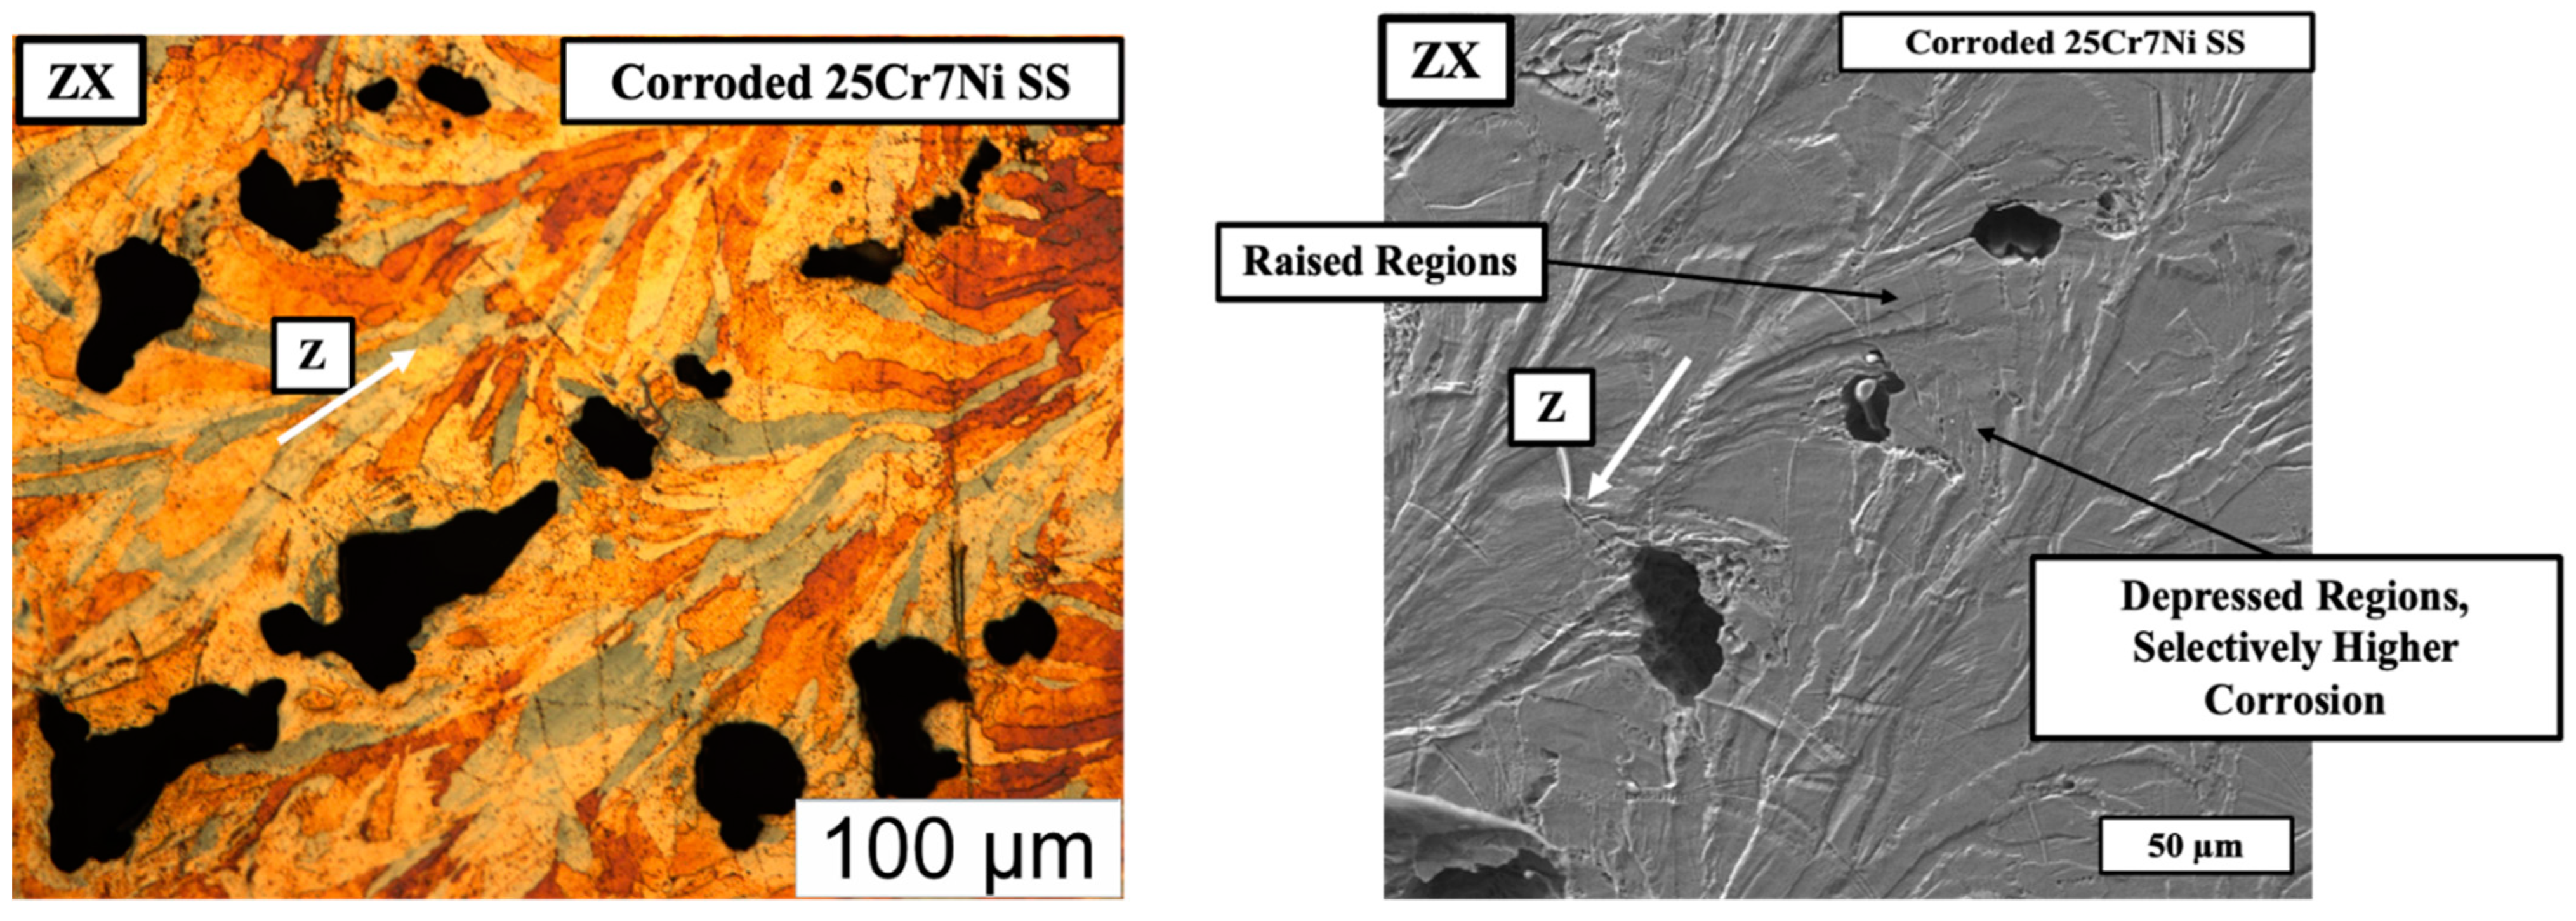
In regards to the corrosion of the L-PBF samples printed from the gas atomized powders, Figure 9 (left) captures the optical micrograph of corroded and eletroetched L-PBF sample from the gas atomized 25Cr7Ni stainless steel powder, and the SEM micrograph (right) of the corroded and un-etched L-PBF sample from the gas atomized 25Cr7Ni stainless steel powder in the build direction (ZX). In the SEM micrograph, where the sample is corroded, alternatively raised and depressed regions, with the epitaxy similar to the etched microstructure of ferrite and grain boundary austenite, is observed. The corrosion pits also are selectively present in the depressed regions. Upon eletroetching, the depressed/corroded regions are revealed to be ferrite, possibly indicating the susceptibility of the ferrite regions in the 25Cr7Ni stainless steel samples to undergo a higher degree of corrosion than do the austenitic regions.
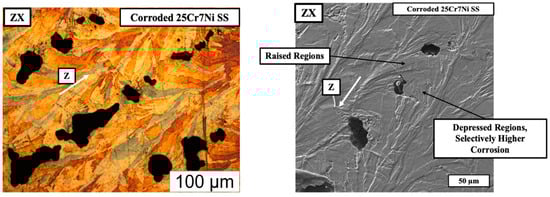
Figure 9.
The optical micrograph of corroded and eletroetched (left) and the SEM micrograph (right) of the corroded and un-etched L-PBF gas atomized sample along the building direction indicated by the white arrow.
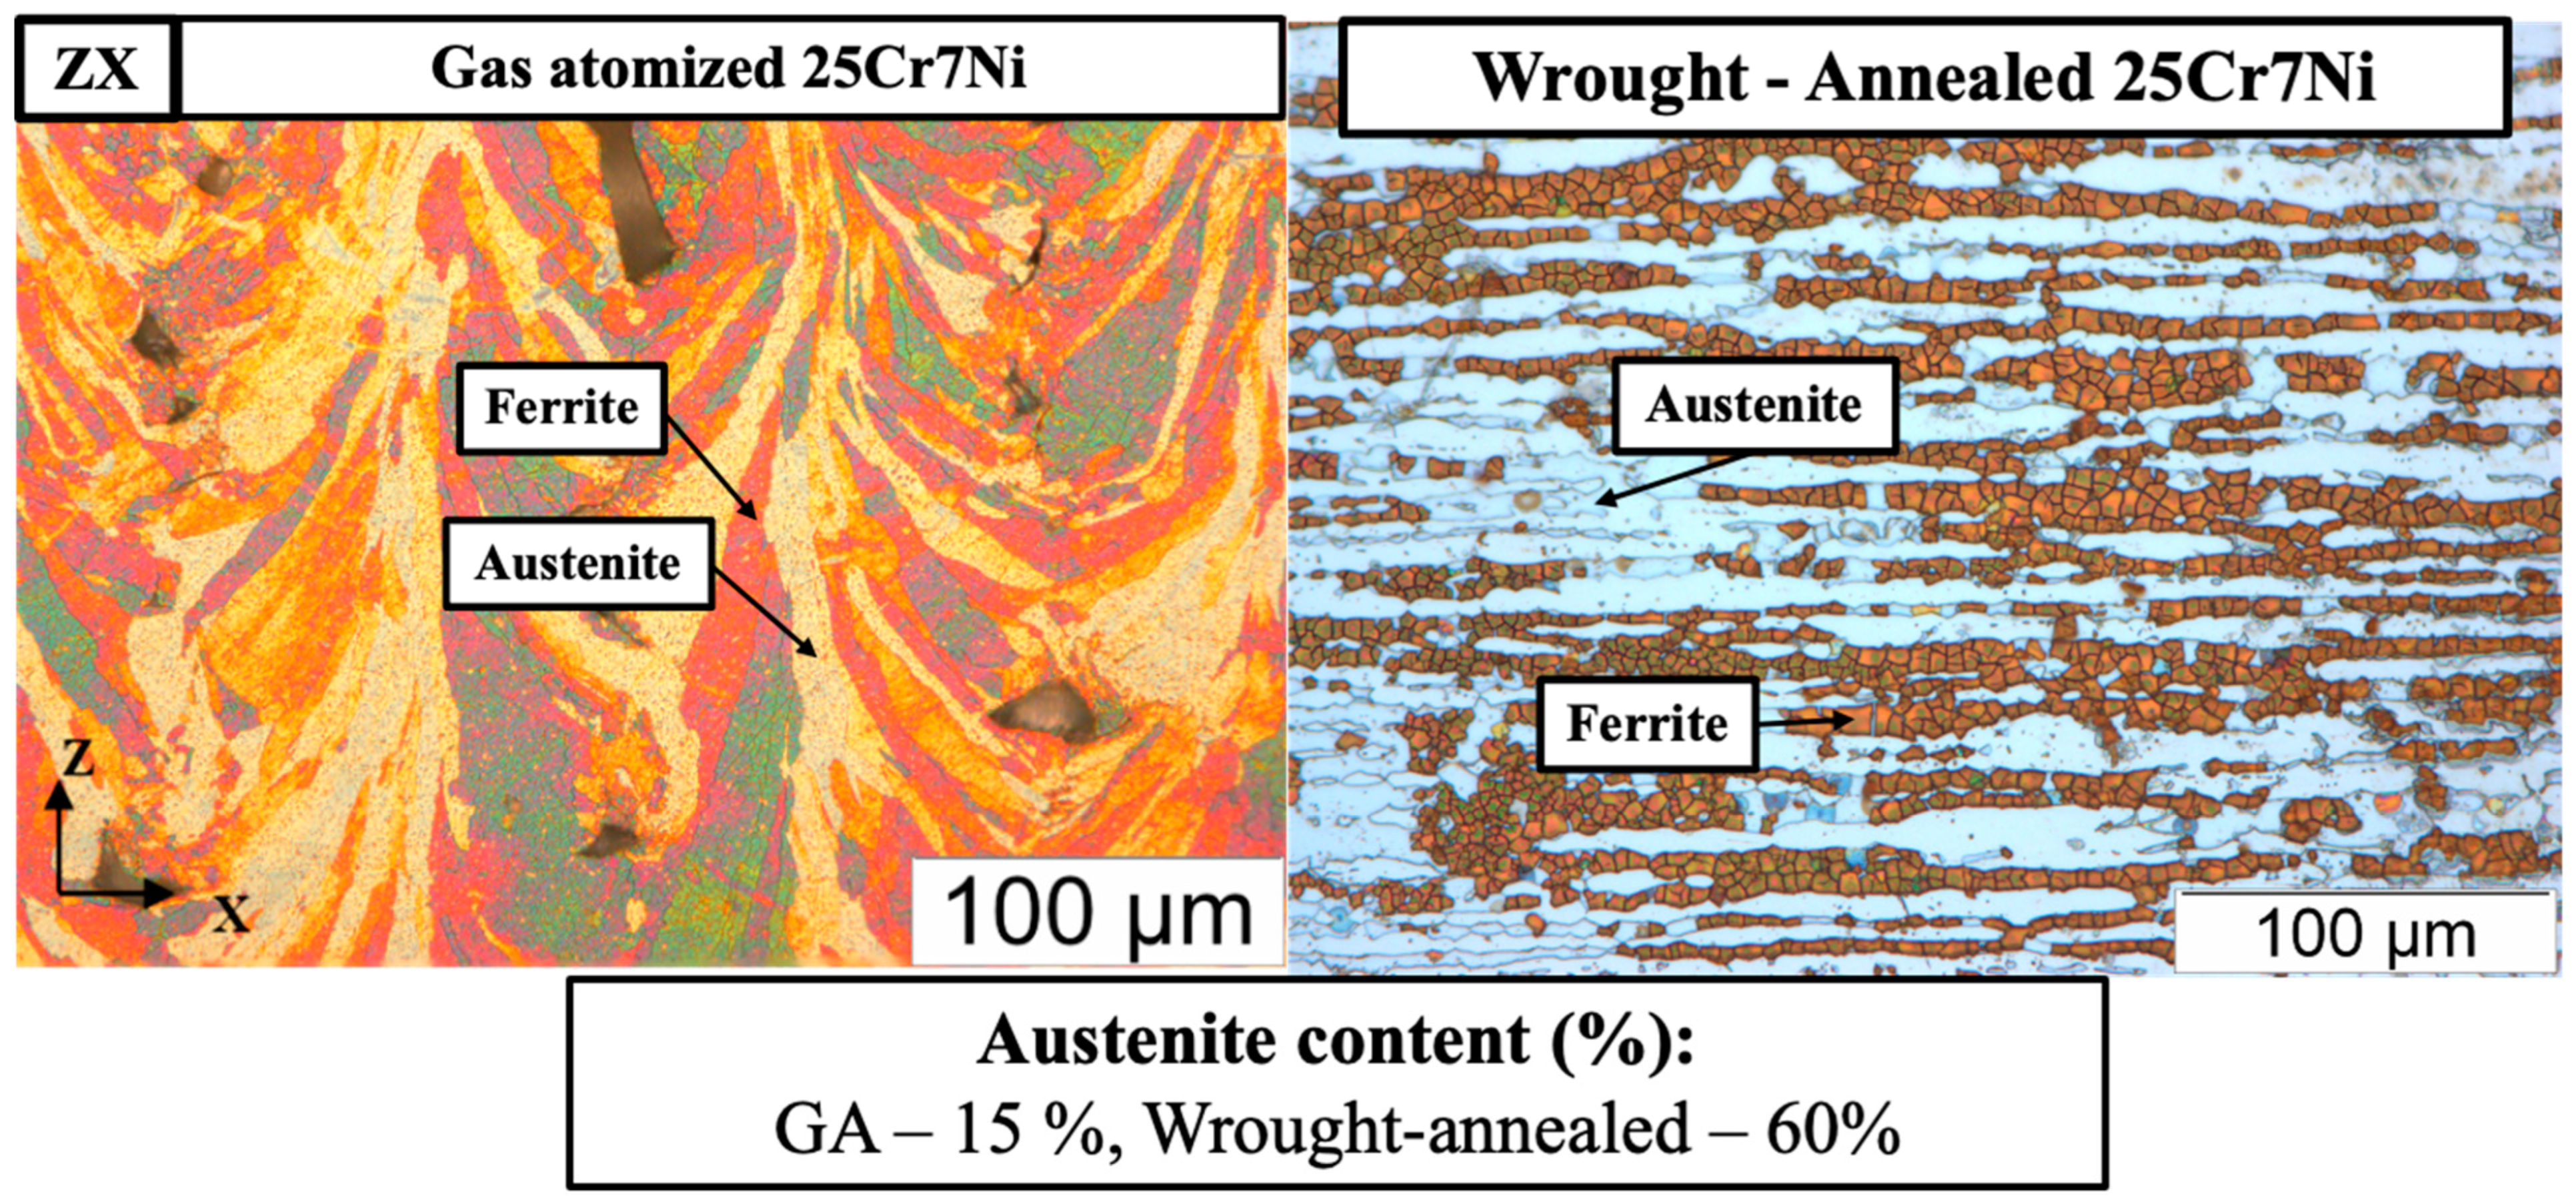
The L-PBF samples from gas atomized powders had a comparable corrosion resistance to that of the wrought–annealed 25Cr7Ni stainless steel. Both the samples exhibited comparable chemical compositions. However, the L-PBF samples from the gas atomized powders, despite containing four times lower amounts of austenite phase as seen in Figure 10, were able to match the corrosion resistance of the wrought–annealed samples. One observable difference between the etched micrographs was the texture of the evolved microstructure between the L-PBF sample and the wrought–annealed sample. With the texture of the grains and the microstructure having a significant impact on the corrosion resistance of the alloy [37,38], the observed high corrosion resistance of the L-PBF samples from gas atomized powders comparable to that of the wrought–annealed 25Cr7Ni stainless steel samples, in spite of a lower austenite content, can be attributed to the difference in their ferrite/austenite microstructure textures.
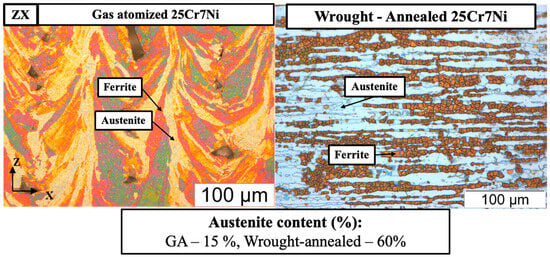
Figure 10.
Eletroetched optical micrographs of L-PBF samples from gas atomized (GA) powders and wrought–annealed 25Cr7Ni stainless steel.
3.1. Simulation Results
3.1.1. Mesh Size Optimization
The mesh size of the process simulation was identified based on the variation in the output parameters as a function of the voxel mesh size. The residual stresses were used as the response parameter to identify the effect of varying the voxel mesh size. The results are tabulated in the Table 4. Higher values of voxel mesh sizes appear to overestimate the resulting stresses, which reduces and plateaus at a voxel mesh size of less than 1. Based on this observation, the voxel mesh size is optimized to be 1. One interesting aspect of this result is that the recorded residual stress is similar to the yield stress of a wrought–annealed 25Cr7Ni stainless steel (~500 MPa) [1], which would indicate the plastic deformation of the as-printed cube.
Table 4.
Yield Stress values in MPa for different voxel size.
3.1.2. Temperature Distribution and Thermal History
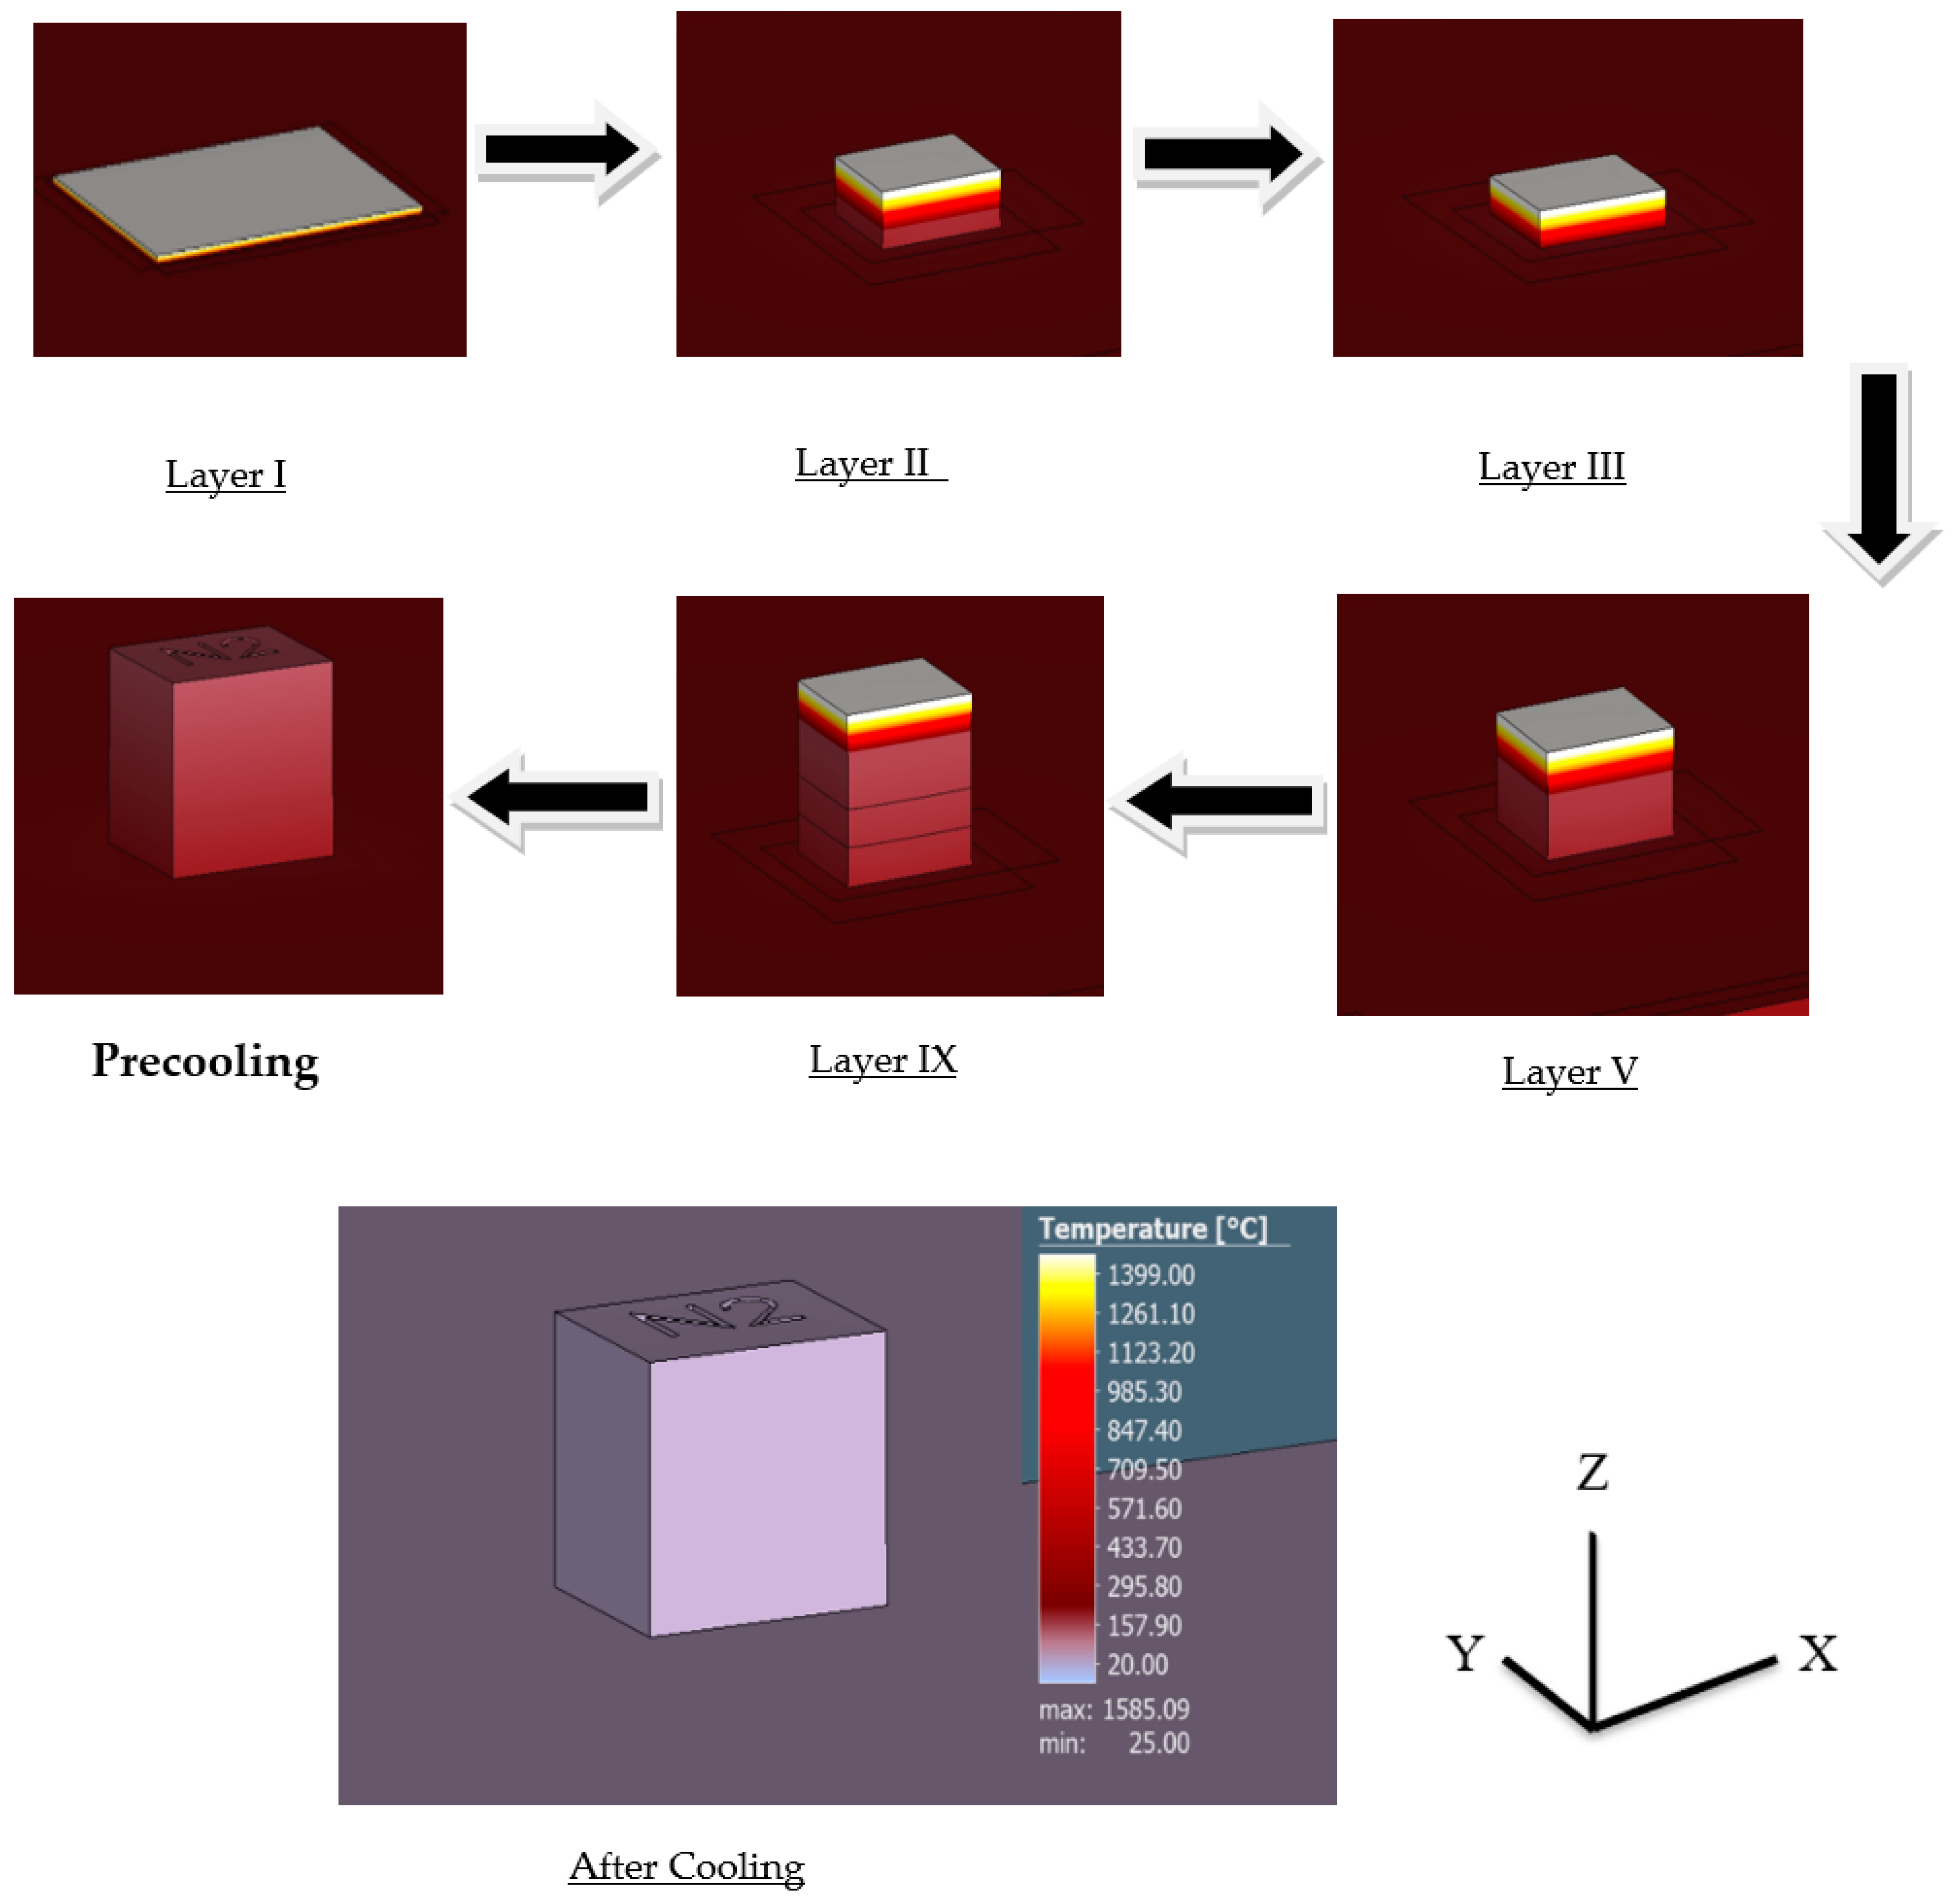
Layer by layer results evaluate the formation of the sample during the printing process with significant changes in time. The results of the thermal simulation provide a layer by layer formation of the cube during the printing process along with their corresponding temperature, as seen in Figure 11 with the highest recorded temperature being around 1400 °C.

Figure 11.
Layer by layer thermal simulation results.
3.1.3. Distortion and Residual Stresses
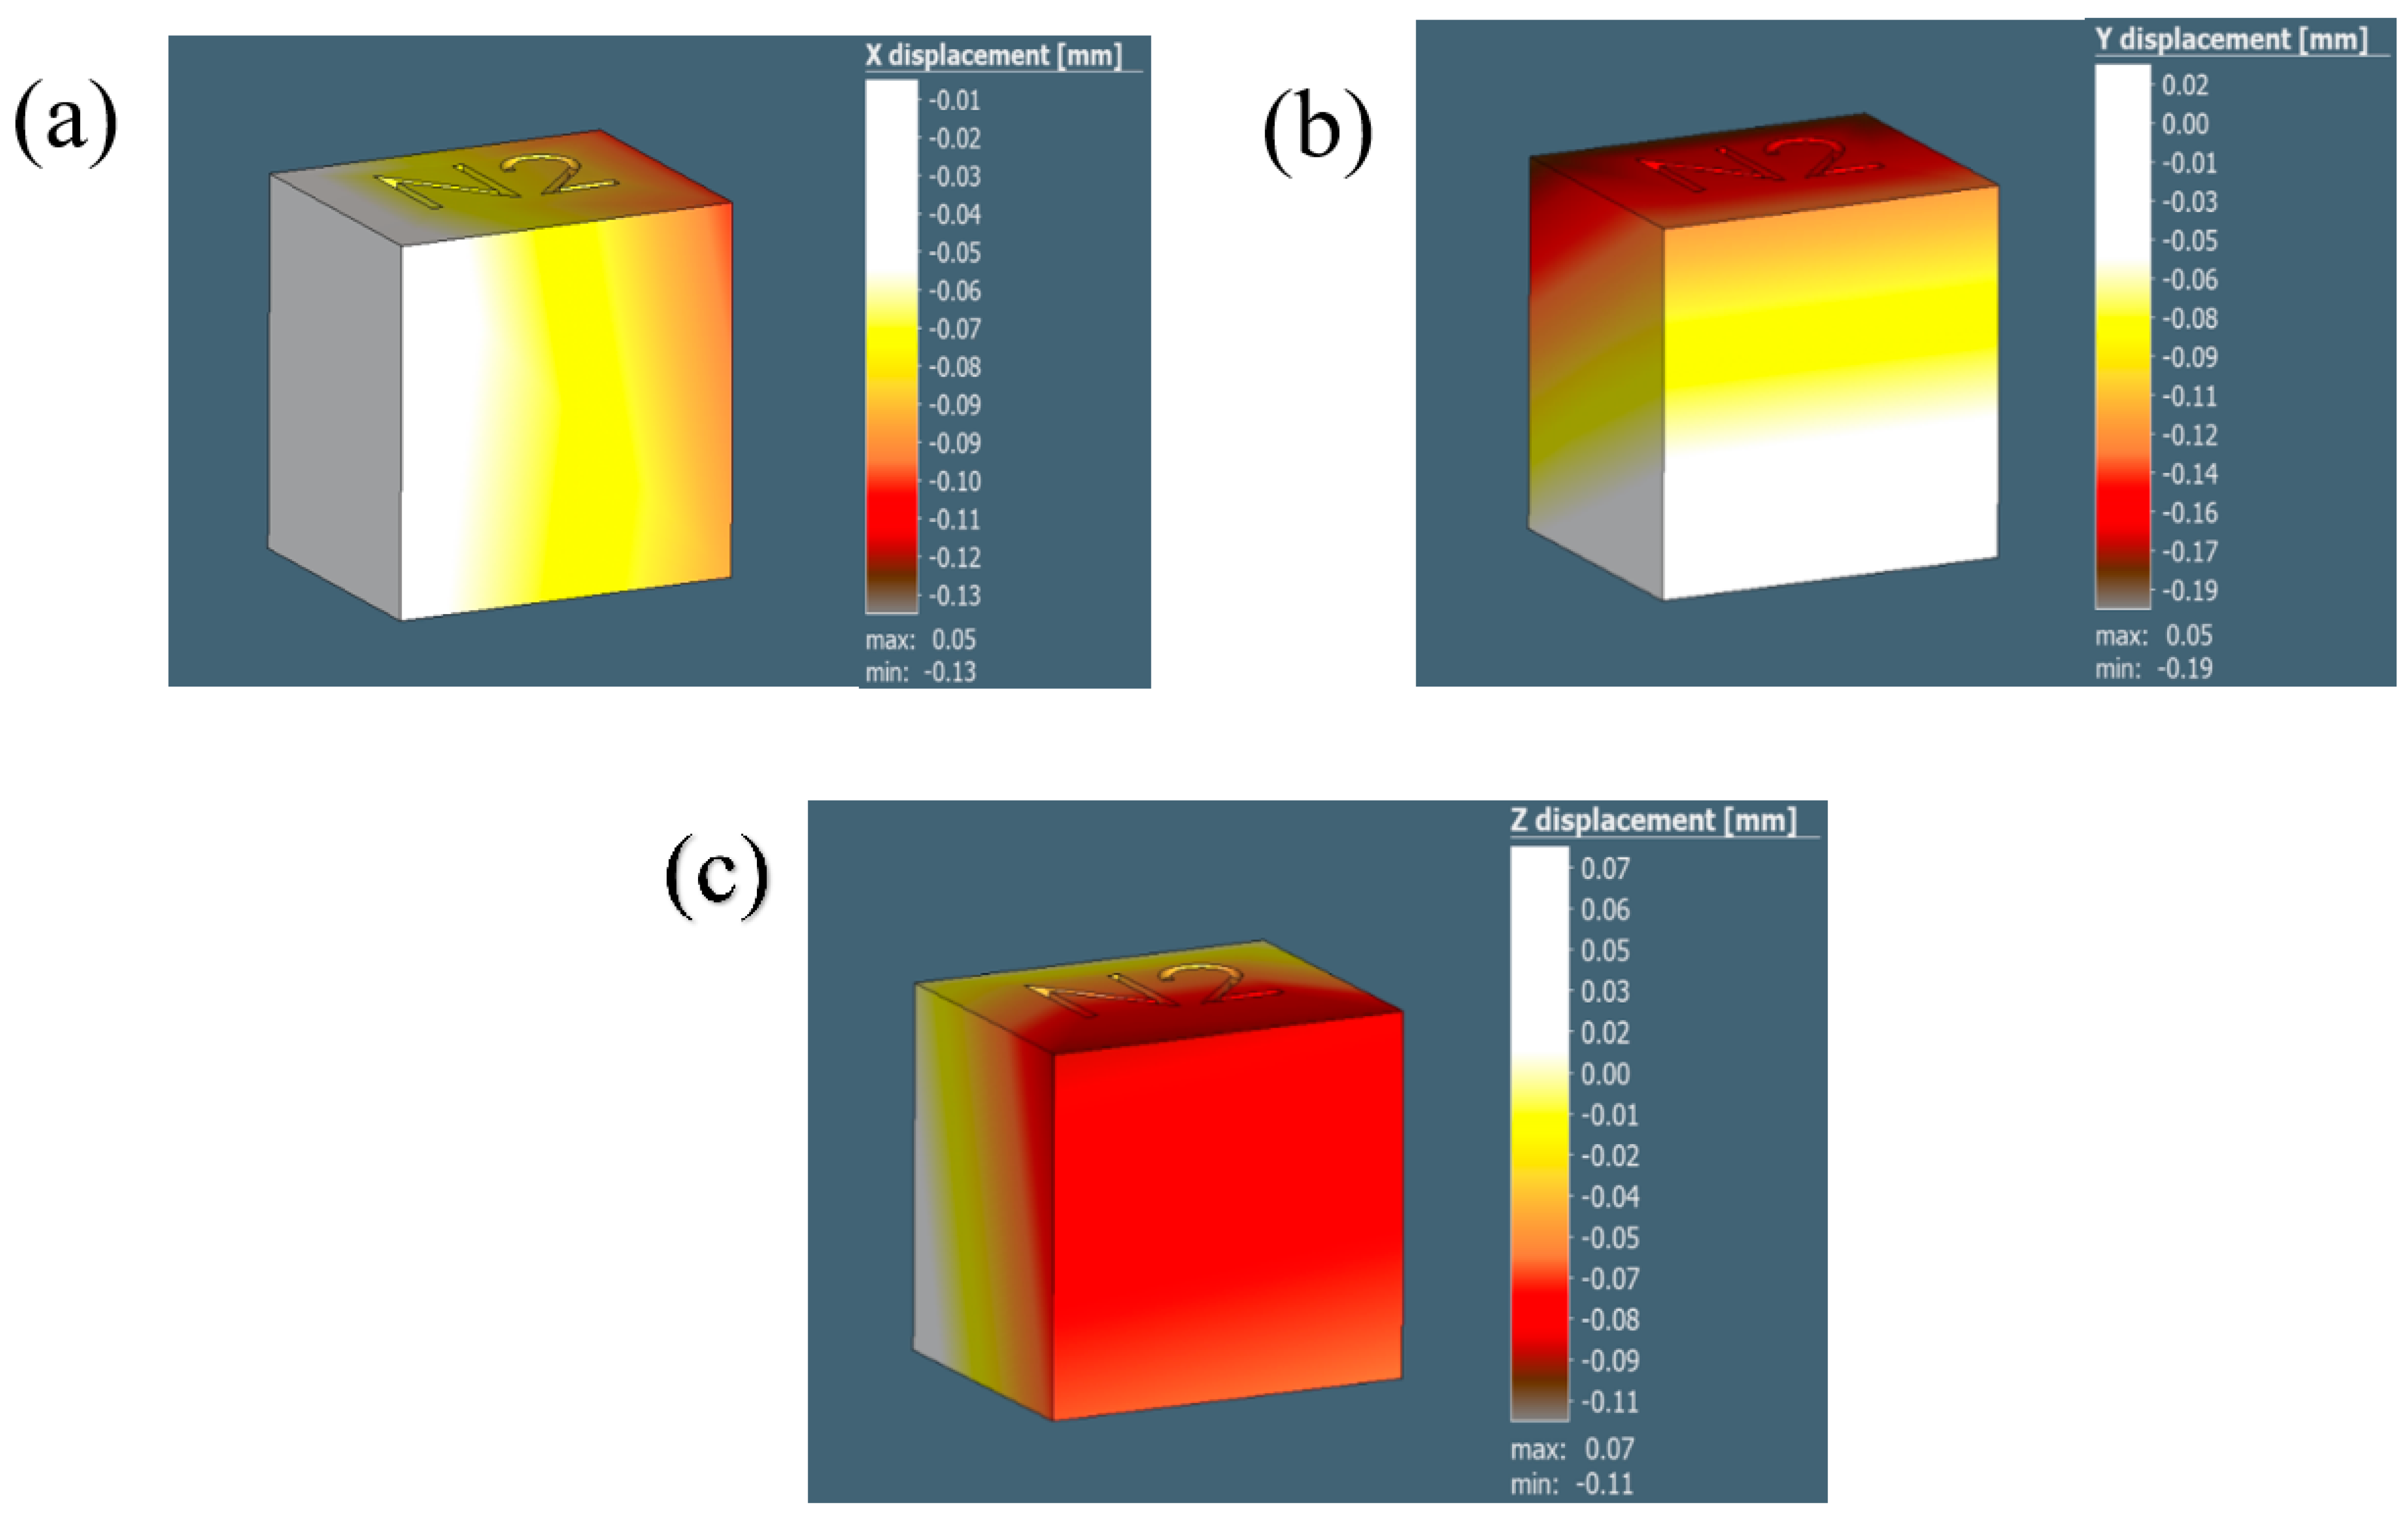
The distortion/displacement of the model along the X, Y, and Z directions and the equivalent residual stresses developed after the process simulation are represented in Figure 12 and tabulated in Table 5. The experimental results are collated and compared to the simulation results in Table 6.

Figure 12.
The illustrations in (a–c) demonstrate the displacement results for the 0.5 mm voxel size in the X, Y, and Z directions, respectively.
Table 5.
Overall dimensions of the cube in different directions (X, Y, and Z) for different voxel sizes obtained after simulation using Simufact software.
Table 6.
Comparison of results before cutting the cube sample.
According to Table 5, the voxel mesh sizes of 1, 0.8, and 0.5 provide comparable dimensions for the cube model from the process simulation along all the directions, validating the initial choice of a voxel mesh size (1).
The dimensions of the cube model fabricated using the L-PBF process, along all the axes, show a reasonable comparison to the actual cube fabricated with 25Cr7Ni stainless steels through L-PBF, as seen in Table 6. This indicates that the thermomechanical simulation and simulation input parameters were able to effectively capture the distortion present in the as-printed samples through process simulation. Further results generated are included in the Appendix A.
4. Summary and Conclusions
Higher densification was achieved in the L-PBF samples printed from gas atomized 25Cr7Ni stainless steel powder with spherical morphology compared to the water atomized 25Cr7Ni powder with irregular morphology of the L-PBF samples due to higher powder bed packing density contributing to the superior densification of samples.
The microstructures of the samples printed from the gas atomized 25Cr7Ni powders displayed significant amount of retained austenite phase, along with ferrite. The presence of higher amounts of austenite stabilizers like N, Mn, and Ni in the gas atomized powders compared to the water atomized powders contributed to the presence of austenite phase in the microstructure, which indicate the possibility of using L-PBF technology to achieve a duplex microstructure (50–50%) with additional thermal treatment.
A lack of porosities in the L-PBF samples from the gas atomized powders translated into a higher set of mechanical properties (UTS, elongation, hardness) over those of the L-PBF samples obtained from the water atomized powders and the wrought–annealed 25Cr7Ni stainless steel.
The LPBF printed samples from gas atomized powders showed superior corrosion resistance properties compared to those of the samples printed from the water atomized powders, possibly due to the presence of austenite phase, higher amounts of N, Mo, and Mn, and the lower porosities in the samples printed from gas atomized powders.
The comparable corrosion resistance of the L-PBF samples from gas atomized powders with wrought–annealed25Cr7Ni stainless steels, despite containing four times lower amounts of austenite, could be due to the characteristic austenite microstructure texture in the L-PBF samples.
With higher UTS and hardness, along with comparable corrosion resistance properties, the as-printed L-PBF samples from the gas atomized powders can replace the wrought–annealed25Cr7Ni stainless steel.
The L-PBF process was modeled using the Simufact platform as a thermo-mechanical simulation wherein the simulation input parameters in terms of material properties and mesh sizes were optimized, and the L-PBF process was simulated for a model cube; the simulation was able to capture the as-printed distortions in the cube as seen from their significant agreement with the dimension values from experimental validation.
Author Contributions
A.A.A.—Conceptualization, Methodology, Validation, Investigation, Visualization, Writing Original draft; S.K.—Simulation work, Methodology, Investigation, Writing; M.Q.S.—Methodology, Investigation; R.K.E.—Supervision; S.V.A.—Supervision. All authors have read and agreed to the published version of the manuscript.
Funding
There was no specific funding source.
Data Availability Statement
Not applicable.
Acknowledgments
The authors would like to acknowledge Jacob Schopp of the Electrical and Computer Engineering Department, University of Louisville, for conducting the sample preparation for the mechanical characterization and metallography used in this study.
Conflicts of Interest
The authors declare no conflict of interest.
Appendix A
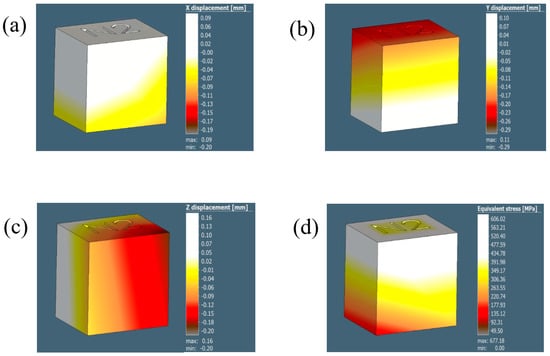
Figure A1.
The illustrations in (a–d) show the displacements results for the 0.8 mm voxel size in the X, Y, and Z direction and thquivalent stress, respectively.
Figure A1.
The illustrations in (a–d) show the displacements results for the 0.8 mm voxel size in the X, Y, and Z direction and thquivalent stress, respectively.
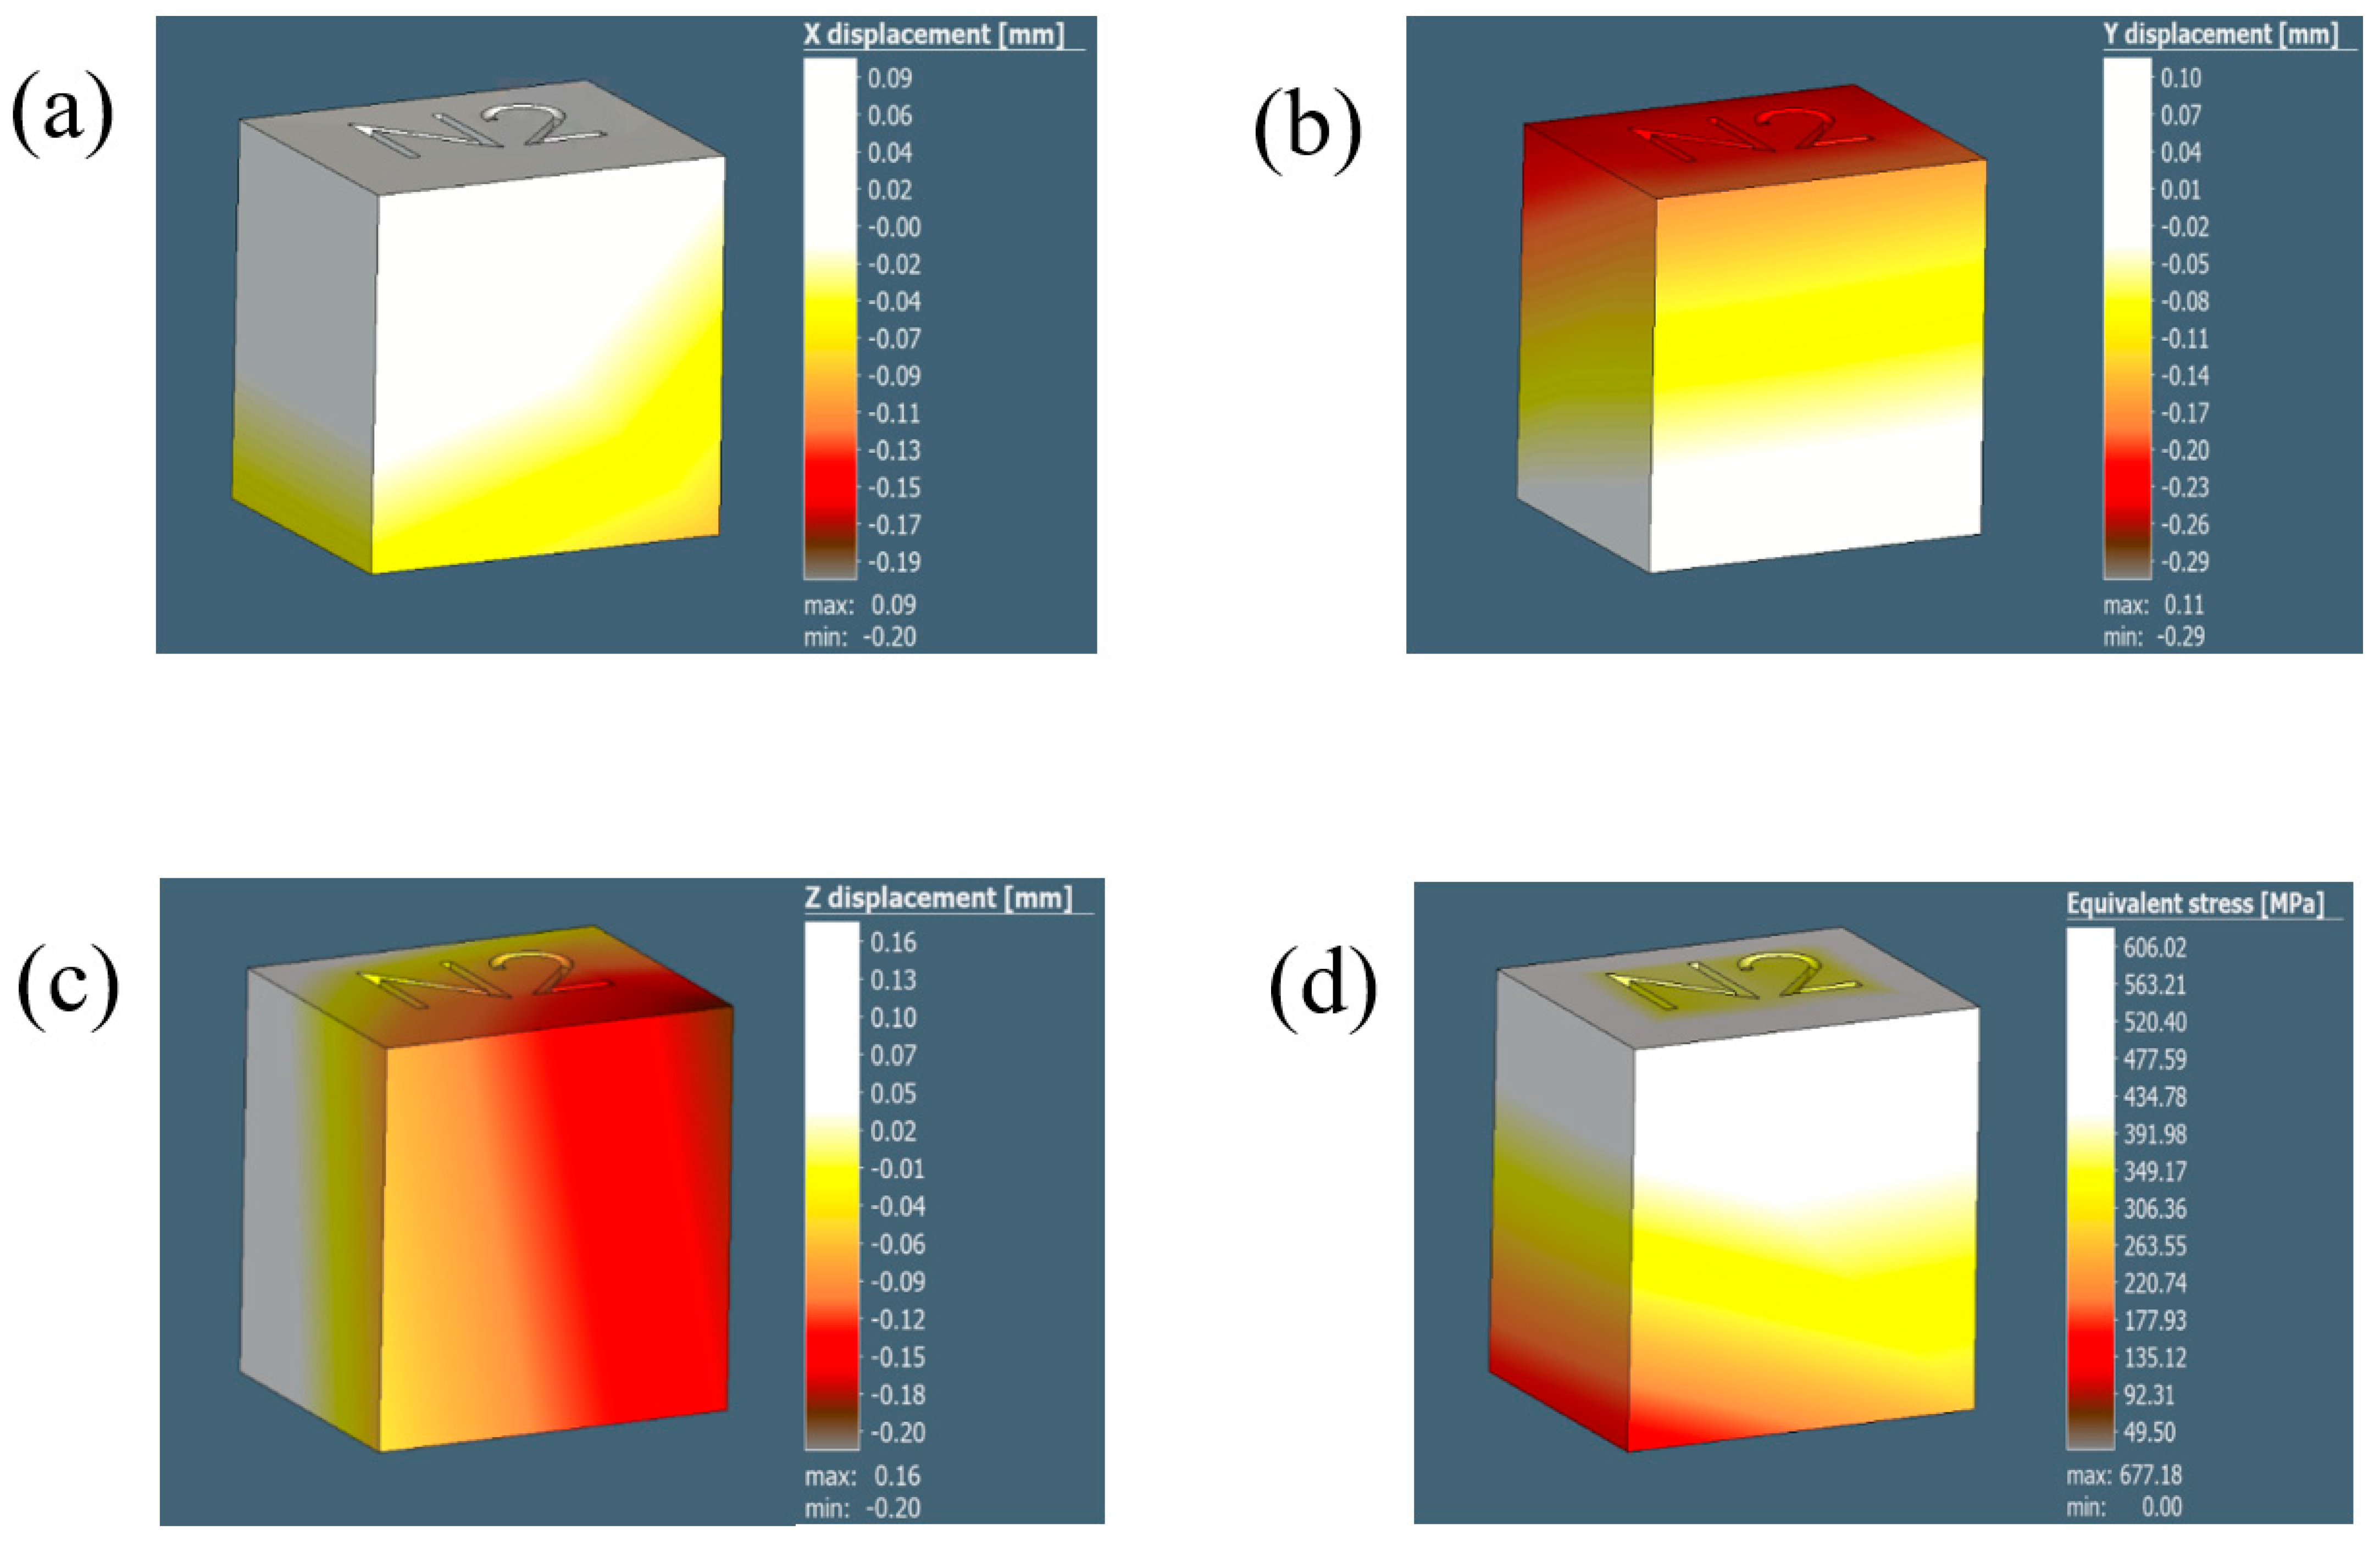
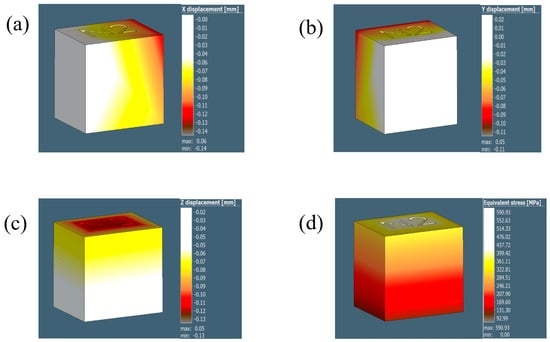
Figure A2.
The illustrations in (a–d) show the displacement results for the 1 mm voxel size in the X, Y, and Z direction and the equivalent stress, respectively.
Figure A2.
The illustrations in (a–d) show the displacement results for the 1 mm voxel size in the X, Y, and Z direction and the equivalent stress, respectively.
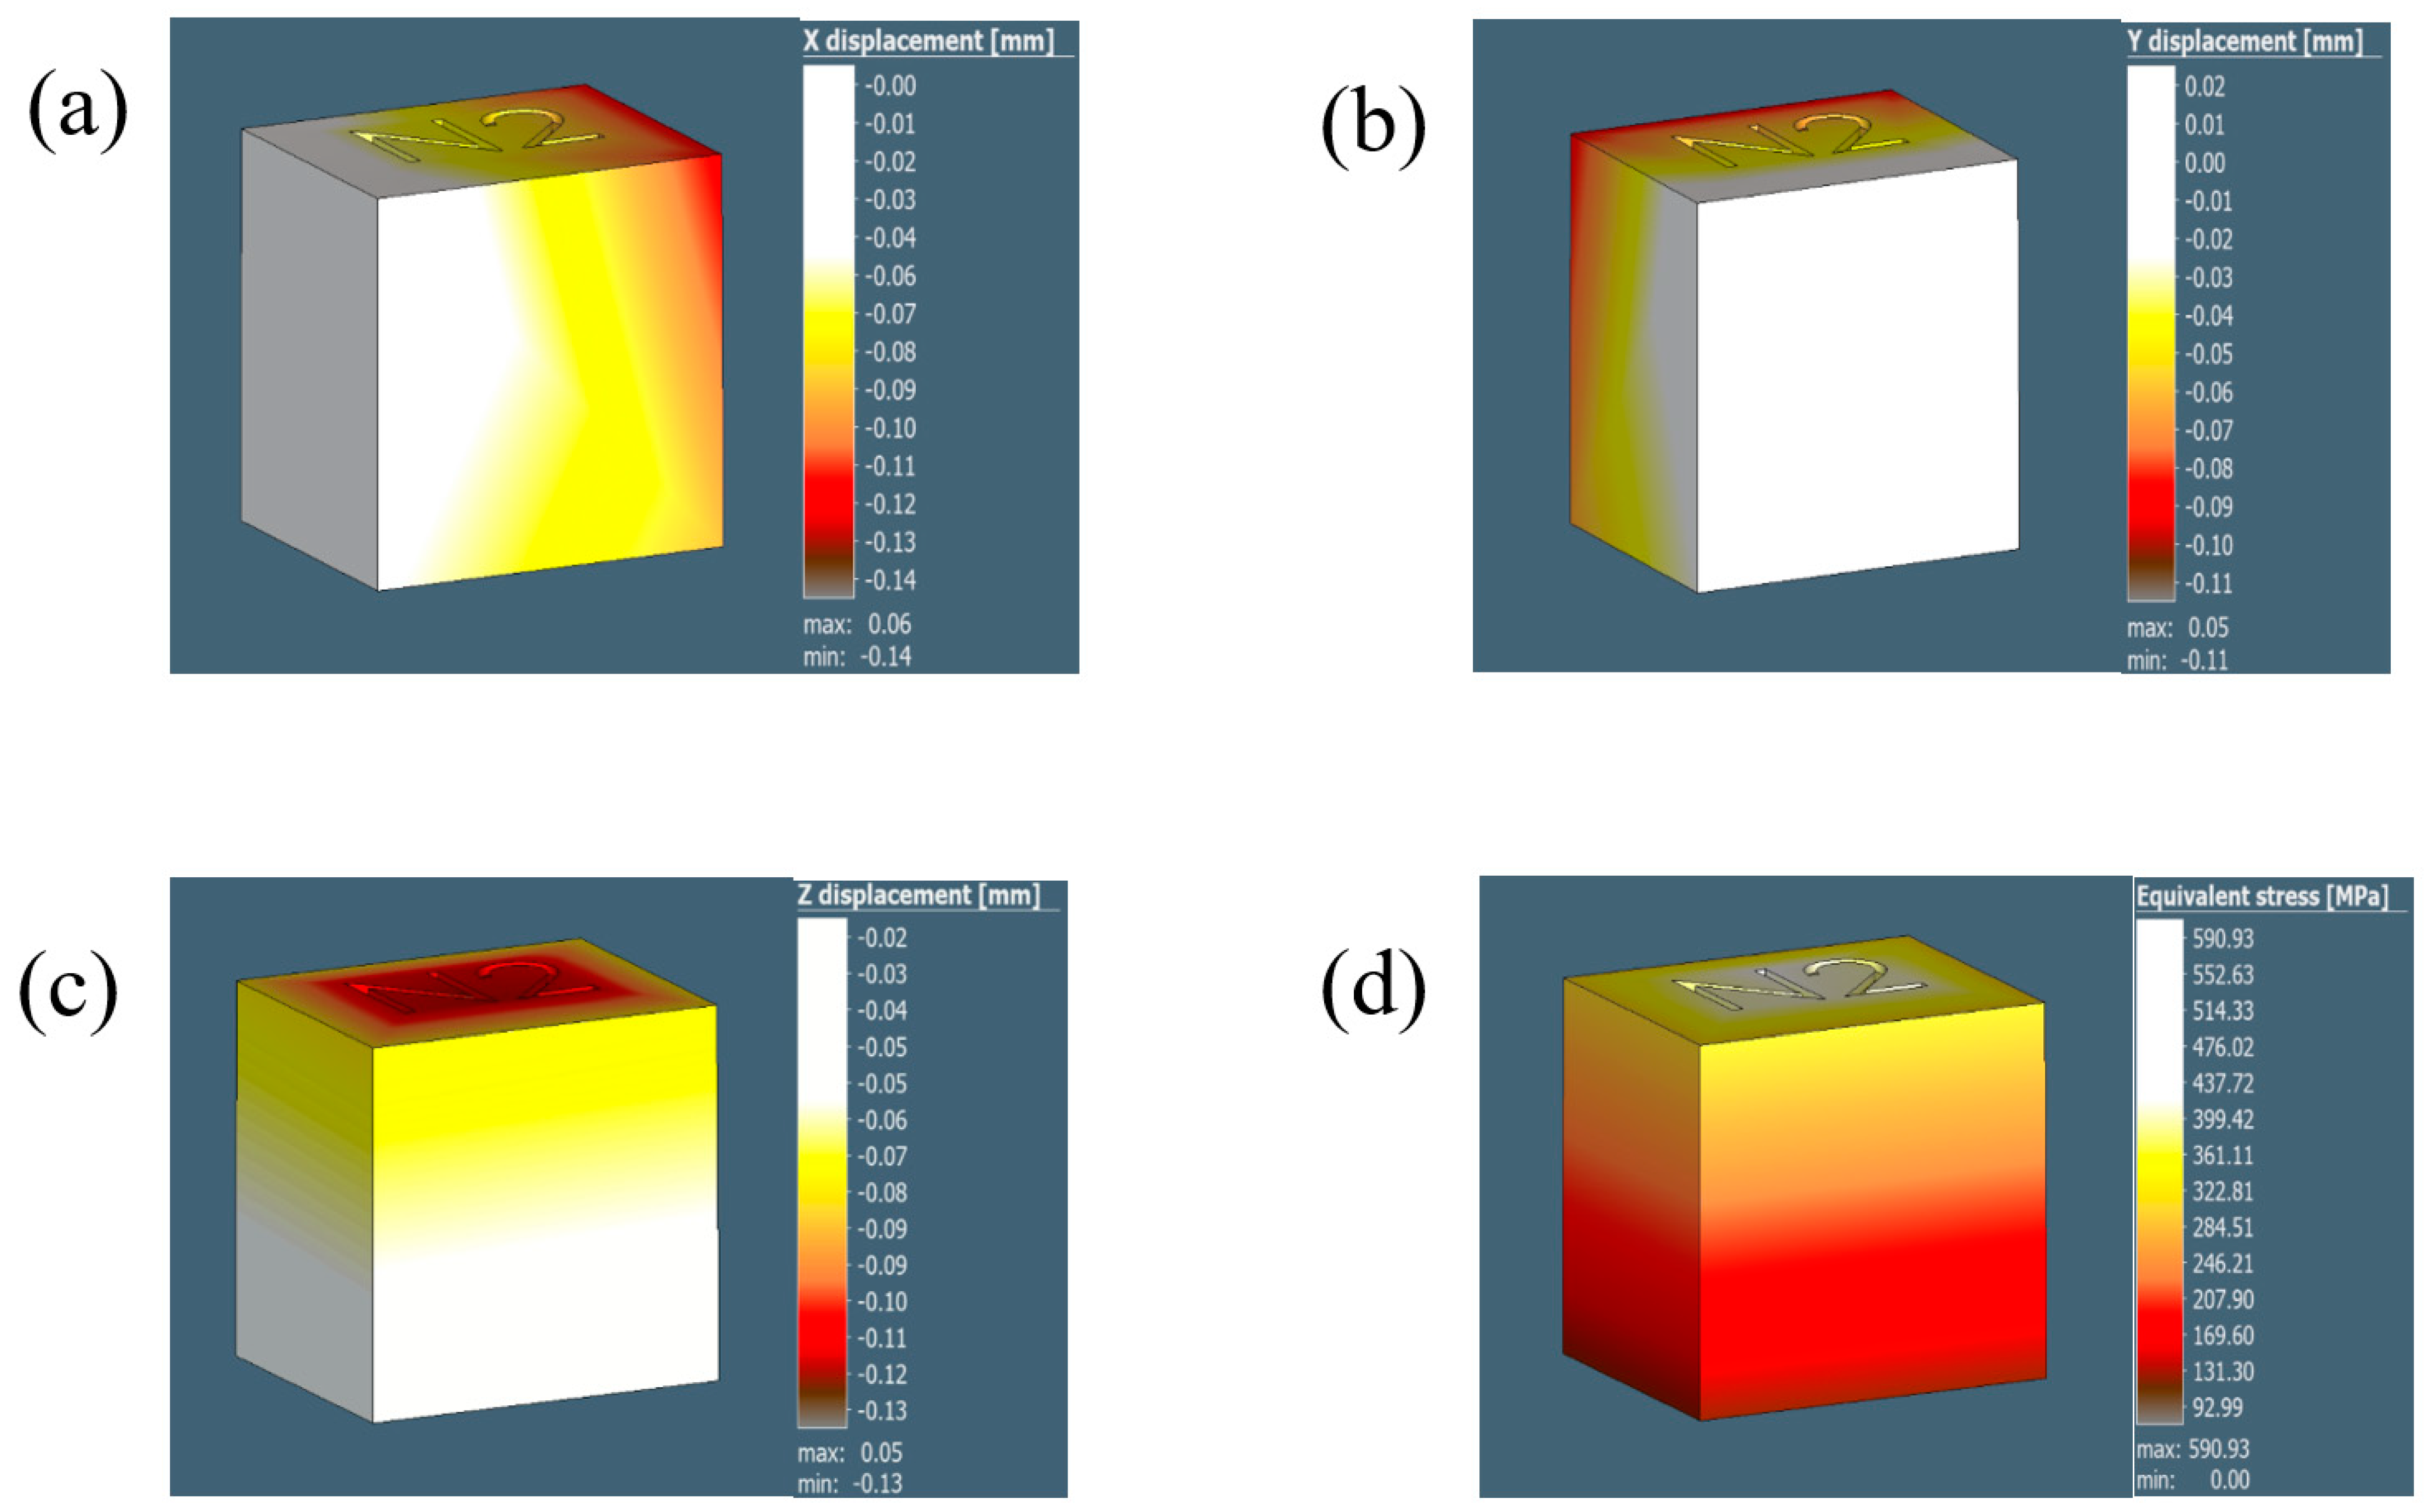
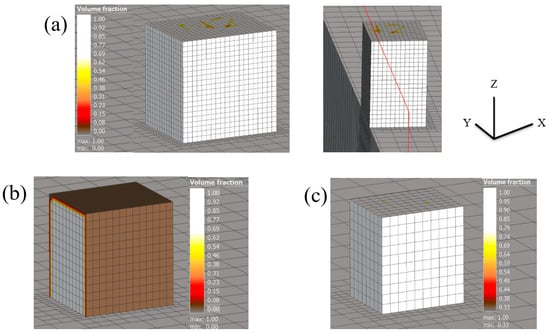
Figure A3.
The illustrations in (a–c) show the dispalcement results for the 0.5, 0.8 mm, and 1 mm voxel size, respectively.
Figure A3.
The illustrations in (a–c) show the dispalcement results for the 0.5, 0.8 mm, and 1 mm voxel size, respectively.

References
- Gunn, R.N. Duplex Stainless Steels Microstructure, Properties and Applications. In Anti-Corrosion Methods and Materials; Emerald Group Publishing Limited: Bingley, UK, 1998. [Google Scholar] [CrossRef]
- Engineering, C. Chapter 05: Corrosion Resistance of Stainless Steels 1, (n.d.) 1–61. Available online: https://www.worldstainless.org/files/issf/Education/English/Module_05_Corrosion_Resistance_of_Stainless_Steels_en.pdf (accessed on 30 June 2023).
- Davanageri, M.B.; Narendranath, S.; Kadoli, R.; Chen, T.H.; Weng, K.L.; Yang, J.R.; Llorca-Isern, N.; López-Luque, H. Influence of heat treatment on microstructure, hardness and wear behavior of super duplex stainless steel AISI 2507. Am. J. Mater. Sci. 2015, 5, 48–52. [Google Scholar]
- Llorca-Isern, N.; López-Luque, H.; López-Jiménez, I.; Biezma, M.V. Identification of sigma and chi phases in duplex stainless steels. Mater. Charact. 2016, 112, 20–29. [Google Scholar] [CrossRef]
- Gu, D. Laser Additive Manufacturing of High-Performance Materials. In Laser Additive Manufacturing of High-Performance Materials; Springer: Berlin, Germany, 2015; pp. 1–311. [Google Scholar] [CrossRef]
- Guo, A.; Beddow, J.K.; Vetter, A.F. A simple relationship between particle shape effects and density, flow rate and Hausner Ratio. Powder Technol. 1985, 43, 279–284. [Google Scholar] [CrossRef]
- Zwiren, A.; Schade, C.; Hoeges, S. Economic Additive Manufacturing Using Water Atomized Stainless Steel Powder, (n.d.) 1–16. Available online: https://www.gknpm.com/globalassets/downloads/hoeganaes/technical-library/technical-papers/am/zwiren_economic-additive-manufacturing-using-water-atomized-stainless-steel-powder.pdf/ (accessed on 30 June 2023).
- Lawley, A. Atomization. In Encyclopedia of Materials: Science and Technology; Elsevier Ltd.: Amsterdam, The Netherlands, 2001. [Google Scholar] [CrossRef]
- Nath, S.D. Process-Property-Microstructure Relationships in Laser-Powder Bed Fusion of 420 Stainless Steel. Ph.D. Thesis, University of Louisville, St. Louisville, KY, USA, 2018. [Google Scholar]
- Irrinki, H. Material-Process-Property Relationships of 17-4 Stainless Steel Fabricated by laser-Powder Bed Fusion Followed by Hot Isostatic Pressing. Ph.D. Thesis, University of Louisville, St. Louisville, KY, USA, 2018. [Google Scholar]
- Pocajt, V. Water Atomization Process: Part Two. Total Materia; Kobe Steel Ltd.: Kobe, Japan, 2021. [Google Scholar]
- Reed, R.P. Nitrogen in Austenitic Stainless Steels. JOM 1989, 41, 16–21. [Google Scholar] [CrossRef]
- Tsuge, H.Y.; Tarutani, T. Kudo. Effect of Nitorgen on The Localized Corrosion Resistance of Duplex Stainless Steel Simulated Weldments. Corrosion 1988, 41, 16–21. [Google Scholar] [CrossRef]
- Saeidi, K.; Kevetkova, L.; Lofaj, F.; Shen, Z. Novel ferritic stainless steel formed by laser melting from duplex stainless steel powder with advanced mechanical properties and high ductility. Mater. Sci. Eng. A 2016, 665, 59–65. [Google Scholar] [CrossRef]
- Hengsbach, F.; Koppa, P.; Duschik, K.; Holzweissig, M.J.; Burns, M.; Nellesen, J.; Tillmann, W.; Tröster, T.; Hoyer, K.P.; Schaper, M. Duplex stainless steel fabricated by selective laser melting—Microstructural and mechanical properties. Mater. Des. 2017, 133, 136–142. [Google Scholar] [CrossRef]
- Davidson, K.P.; Singamneni, S.B. Metallographic evaluation of duplex stainless steel powders processed by selective laser melting. Rapid Prototyp. J. 2017, 23, 1146–1163. [Google Scholar] [CrossRef]
- Raffeis, I.; Vroomen, U.; Adjei-Kyeremeh, F.; Großmann, D.; Hammelrath, H.; Westhoff, E.; Bremen, S.; Bozza, D.B.; Bührig-Polaczek, A. Comparative investigations into microstructural and mechanical properties of as-cast and laser powder bed fusion (LPBF) fabricated duplex steel (1.4517). Materwiss Werksttech 2020, 51, 432–444. [Google Scholar] [CrossRef]
- Chao, Q.; Cruz, V.; Thomas, S.; Birbilis, N.; Collins, P.; Taylor, A.; Hodgson, P.D.; Fabijanic, D. On the enhanced corrosion resistance of a selective laser melted austenitic stainless steel. Scr. Mater. 2017, 141, 94–98. [Google Scholar] [CrossRef]
- Anderson, I.E.; White, E.M.H.; Dehoff, R. Feedstock powder processing research needs for additive manufacturing development. Curr. Opin. Solid State Mater. Science 2018, 22, 8–15. [Google Scholar] [CrossRef]
- Tan, J.H.; Wong, W.L.E.; Dalgarno, K.W. An overview of powder granulometry on feedstock and part performance in the selective laser melting process. Addit. Manuf. 2017, 18, 228–255. [Google Scholar] [CrossRef]
- Wischeropp, T.M.; Emmelmann, C.; Brandt, M.; Pateras, A. Measurement of actual powder layer height and packing density in a single layer in selective laser melting. Addit. Manuf. 2019, 28, 176–183. [Google Scholar] [CrossRef]
- Fedina, T.; Sundqvist, J.; Powell, J.; Kaplan, A.F.H. A comparative study of water and gas atomized low alloy steel powders for additive manufacturing. Addit. Manuf. 2020, 36, 11. [Google Scholar] [CrossRef]
- Li, R.; Shi, Y.; Wang, Z.; Wang, L.; Liu, J.; Jiang, W. Densification behavior of gas and water atomized 316L stainless steel powder during selective laser melting. Appl. Surf. Sci. 2010, 256, 4350–4356. [Google Scholar] [CrossRef]
- Martin, A.A.; Calta, N.P.; Khairallah, S.A.; Wang, J.; Depond, P.J.; Fong, A.Y.; Thampy, V.; Guss, G.M.; Kiss, A.M.; Stone, K.H.; et al. Dynamics of pore formation during laser powder bed fusion additive manufacturing. Nat. Commun. 2019, 10, 1987. [Google Scholar] [CrossRef] [PubMed]
- Ly, S.; Rubenchik, A.M.; Khairallah, S.A.; Guss, G.; Matthews, M.J. Metal vapor micro-jet controls material redistribution in laser powder bed fusion additive manufacturing. Sci. Rep. 2017, 7, 4085. [Google Scholar] [CrossRef]
- Kaplan, A.F.H.; Powell, J. Spatter in laser welding. J. Laser Appl. 2011, 23, 32005. [Google Scholar] [CrossRef]
- Lippold, J.C. Welding Metallurgy and Weldability; John Wiley & Sons: Hoboken, NJ, USA, 2014. [Google Scholar] [CrossRef]
- Folkhard, E. Significance of Constitution Diagrams for the Understanding of Welding Phenomena. In Welding Metallurgy of Stainless Steels; Folkhard, E., Ed.; Springer: Vienna, Austria, 1988; pp. 1–51. [Google Scholar] [CrossRef]
- Saeidi, K.; Gao, X.; Lofaj, F.; Kvetková, L.; Shen, Z.J. Transformation of austenite to duplex austenite-ferrite assembly in annealed stainless steel 316L consolidated by laser melting. J. Alloys Compd. 2015, 633, 463–469. [Google Scholar] [CrossRef]
- Chail, G.; Kangas, P. Super and hyper duplex stainless steels: Structures, properties and applications. Procedia Struct. Integr. 2 2016, 2, 1755–1762. [Google Scholar] [CrossRef]
- Buchanan, R.A.; Stansbury, E.E. Electrochemical Corrosion. Ph.D. Thesis, University of Louisville, St. Louisville, KY, USA, 2005. [Google Scholar] [CrossRef]
- Sander, G.; Thomas, S.; Cruz, V.; Jurg, M.; Birbilis, N.; Gao, X.; Brameld, M.; Hutchinson, C.R. On The Corrosion and Metastable Pitting Characteristics of 316L Stainless Steel Produced by Selective Laser Melting. J. Electrochem. Soc. 2017, 164, C250–C257. [Google Scholar] [CrossRef]
- Voronenko, B.I. Austenitic-ferritic stainless steels: A state-of-the-art review. Met. Sci. Heat Treat. 1997, 39, 428–437. [Google Scholar] [CrossRef]
- Ghanem, W.A. Effect of nitrogen on the corrosion behavior of austenitic stainless steel in chloride solutions. In Proceedings of the EUROCORR 2004—European Corrosion Conference: Long Term Prediction and Modelling of Corrosion, Nice, France, 12–16 September 2004. [Google Scholar] [CrossRef]
- Xin, R.; Wang, M.; Gao, J.; Liu, P.; Liu, Q. Effect of Microstructure and Texture on Corrosion Resistance of Magnesium Alloy. Mater. Sci. Forum 2009, 610–613, 1160–1163. [Google Scholar] [CrossRef]
- Li, D.-W.; Wang, H.-Y.; Wei, D.-S.; Zhao, Z.-X.; Liu, Y. Effects of Deformation Texture and Grain Size on Corrosion Behavior of Mg-3Al-1Zn Alloy Sheets. ACS Omega 2020, 5, 1448–1456. [Google Scholar] [CrossRef]
- Bronkhorst, C.A.; Mayeur, J.R.; Livescu, V.; Pokharel, R.; Brown, D.W.; Gray, G.T. Structural representation of additively manufactured 316L austenitic stainless steel. Int. J. Plast. 2019, 118, 70–86. [Google Scholar] [CrossRef]
- Wu, X.; Zhu, W.; He, Y. Deformation Prediction and Experimental Study of 316L Stainless Steel Thin-Walled Parts Processed by Additive-Subtractive Hybrid Manufacturing. Materials 2021, 14, 5582. [Google Scholar] [CrossRef]


Disclaimer/Publisher’s Note: The statements, opinions and data contained in all publications are solely those of the individual author(s) and contributor(s) and not of MDPI and/or the editor(s). MDPI and/or the editor(s) disclaim responsibility for any injury to people or property resulting from any ideas, methods, instructions or products referred to in the content. |
© 2023 by the authors. Licensee MDPI, Basel, Switzerland. This article is an open access article distributed under the terms and conditions of the Creative Commons Attribution (CC BY) license (https://creativecommons.org/licenses/by/4.0/).