Article

Effect of Various Processes on Microstructure of CoCrFeNiAlx High-Entropy Alloy Shot Peening Layer

1
School of Materials Science and Engineering, Shanghai Jiao Tong University, Shanghai 200240, China
2
Key Laboratory of Advanced Materials Technology Ministry of Education, Southwest Jiaotong University, Chengdu 610031, China
*
Author to whom correspondence should be addressed.
Metals 2023, 13(8), 1441; https://doi.org/10.3390/met13081441
Submission received: 13 June 2023 / Revised: 29 July 2023 / Accepted: 2 August 2023 / Published: 11 August 2023
(This article belongs to the Special Issue Thermomechanical Treatment of Metals and Alloys)

Abstract

:
The change in microstructure caused by shot peening can strengthen the material and play an important role in improving the fatigue properties of the material. In order to investigate the related properties such as plastic strain anddislocation activity, the microstructure of CoCrFeNiAlx alloy shot peening layer under different processes was studied. The material exhibited a single austenitic phase, and the FCC crystal structure remained unchanged despite variations in shot peening intensity. Microstructure analysis indicates that with the increase in shot peening intensity, the grain size of the shot peening layer decreases obviously, and the content of microscopic distortion on the surface of the shot peening layer is the highest, and gradually decreases with the increase in depth. At the same time, the roughness of the sample surface is also reduced, which can enhance the fatigue strength and life of the sample. A TEM study revealed the microstructure of the shot peening layer. During the impact of shot peening, the twins produced gradually subdivided the initial grain into smaller slices. With the accumulation of plastic strain, dislocation activity begins to dominate the deformation process. The deformation-induced dislocations accumulate gradually in the small pieces and accumulate into dislocations perpendicular to the secondary twins. These results could be conducive to providing reference and theoretical basis for improving and strengthening the mechanical properties of a series of materials such as high-entropy alloy.

1. Introduction

CoCrFeNi high-entropy alloys with high strength, corrosion resistance, high temperature resistance, abrasion resistance, and many other performance advantages, this alloy exhibits excellent plastic deformation ability when stretched at room temperature [1,2,3,4]. When stretched at a temperature lower than room temperature, due to the gradual reduction of dislocation energy, a more stable HCP phase is formed, which results in better plasticity and has gained extensive attention from researchers [5,6,7]. The AlCoCrFeNi series of high-entropy alloys is currently one of the most extensively researched high-entropy alloy systems. Through composition regulation and thermal–mechanical treatments, diverse microstructures can be generated. By incorporating various strengthening mechanisms, the mechanical properties of the alloy can be adjusted over a broad range. It has been demonstrated that the incorporation of multiple strengthening mechanisms can enhance the strength of alloys, rendering them ideal materials for investigating high-entropy alloy strengthening methods [8]. In this respect, numerous scholars have conducted a series of related studies and achieved significant progress and accomplishments. Wang et al. fabricated a CoCrFeNiAlx high-entropy alloy and observed that the phase structure of the alloy was significantly affected by the Al content, and found that the BCC phase in the as-cast alloy obtained by melting was a nanoscale two-phase structure generated by the mechanism of amplitude modulation decomposition [9]. It can be inferred that the Al content plays a pivotal role in determining the phase structure of CoCrFeNiAlx high-entropy alloy. Subsequent studies have also revealed that different processing methods exert an influence on the alloy’s phase structure. Lyu et al. investigated the microstructure and properties of CoCrFeNiAlx (x = 0.1, 0.5, 1) high-entropy alloys enhanced by laser surface remelting [10]. The results not only showed that the structure of alloys in different states changed from FCC to BCC structure with the increase in Al content, but also found that the phase structure of alloys in different states was not the same. Rao et al. studied the influence of different structures on the relative properties of CoCrFeNiAlx high-entropy alloy [11]. The annealing process resulted in the precipitation of two secondary phases, namely σ phase and θ phase, within the CoCrFeNiAl0.7 alloy. The θ phase is the aluminum-enriched phase. The sample’s tensile mechanical properties were evaluated, revealing that the alloy’s yield strength is attributed to both B2 and σ phases. The higher the Al content in CoCrFeNiAlx high-entropy alloy, the greater its yield strength, but with a decrease in plasticity. Additionally, Al content has a direct impact on the performance of this alloy; for a given cast alloy, increasing Al content results in increased hardness [12]. In addition to elemental composition, the processing technology of high-entropy alloys also significantly impacts their properties. For instance, Wang et al. carried out cold rolling and heat treatment of CoCrFe1.25Ni1.25Al0.25 high-entropy alloy, and found that the alloy had a higher work hardening effect during cold rolling, and the fracture mode of the samples after cold rolling changed from as-cast intergranular fracture to dimple fracture [13]. Cold rolling of the alloy after annealing heat treatment, the annealing softening phenomenon in a high-entropy alloy, yield strength, and hardness were to fall. From research on CoCrFeNiMn high-entropy alloys, it has been discovered that the face-centered cubic (FCC) structure of these alloys exhibits low intensity, while the body-centered cubic (BCC) structure tends to lack plasticity meaning low strength. In addition, high-entropy alloys can be strengthened through high-density dislocation and nanocrystalline boundaries. Therefore, by plastic-hardening (shot peening) on the surface of high-entropy alloy, by selecting different shot peening processes, adjusting surface dislocation and grain boundary density to achieve value-added effects, the surface hardness and the depth of the plastic strain layer can be improved, and the service behavior of the material surface can be improved.
The surface modification of high-entropy alloys can improve their wear resistance and corrosion resistance, which is expected to replace the traditional wear-resistant material of high manganese steel due to insufficient plastic hardening, resulting in reduced wear resistance, chromium cast iron is difficult to process, and can also be quickly prepared by spraying method.
Shot peening (SP) is one of the most typical deformation-strengthening methods, which can effectively prolong the fatigue life of products and parts. In the process of shot peening, plastic deformation occurs on the surface and sub-surface of the component through continuous percussion of the high-speed pellet. In this way, special cold hardening of the metal is generated on the plastic surface. High residual compressive stress is introduced, and the microstructure of the material is optimized [14,15,16,17,18]. The residual compressive stress field distribution and microstructure enhancement of the shot peening layer can effectively retard microcrack propagation, thereby enhancing resistance to fatigue fracture, stress corrosion, and high-temperature oxidation [19,20,21]. After undergoing the appropriate shot peening process, the residual compressive stress field distribution within the shot peening layer is optimized, resulting in finer crystal blocks and an increased content of micro-distortion and dislocation density. Nickel-based superalloy components typically operate under high temperatures and high load conditions. The residual compressive stress and microstructure of the shot peening layer will relax and change under these conditions, resulting in a reduction in the fatigue strength and yield strength of the materials. Therefore, it is crucial to study relaxation behavior for the safe use of parts during service overcharging. In this study, the wear behavior and mechanism of CoCrFeNiAlx high-entropy alloy with FCC and BCC duplex alloys under casting conditions were investigated. Shot peening treatment was conducted to explore the distribution of residual stress in different shot peening processes, as well as the evolution of microstructure in the composite shot peening layer. Finally, a discourse on the reinforcement mechanism is achieved through the amalgamation of mechanical properties inherent in the shot peening layer.

2. Experimental

2.1. Material Preparation

In this paper, the strengthening behavior of CoCrFeNiAlx system high-entropy alloys was studied, and five groups of CoCrFeNiAlx system high-entropy alloys containing 0 at.%, 1 at.%, 2 at.%, 3 at.%, and 4 at.% Al were prepared. In this study, high-purity Fe, Co, Cr, Ni, and Al elemental metals (purity: 99.99 wt.%) were proportioned according to a certain atomic ratio by vacuum arc furnace melting. The specific ratio is shown in Table 1. Under the protection of Ar gas for melting, in order to make the composition mixed evenly, the alloy after 5 times of repeated melting formed, to ensure the alloy composition mixed evenly.
The specific smelting process, parameter control, and precautions are as follows: (1) Ingredients: for massive metal raw materials, use an electric wire brush to remove the oxide layer on the metal surface; granular metal raw materials, using dilute hydrochloric acid (concentration 5–7%) to remove the surface oxide layer. After grinding and pickling, raw materials need to be placed in anhydrous ethanol for cleaning with an ultrasonic device, washed and dried, and metal weighing and batching are carried out with precision balance (Sartorius BS 223S) according to the alloy ratio. The prepared alloy materials are put in a drying oven for reserve. (2) Loading: the weighed and dried raw materials are placed in the copper crucible in a conical shape according to the principle of small pieces under, large pieces on, and granular materials in the gap. The bulk material is placed in the arcing position to melt it and then flows down to wrap the conical material pile to reduce the oxidation of the alloy. (3) Vacuum extraction: The master alloy ingot is prepared by non-consumable arc melting under the protection atmosphere of high-purity argon. A tungsten electrode is used and the furnace cavity was vacuum-pumped to 3.0 × 10⁻³ Pa by a two-stage pump, and 99.99 wt.% of high-purity argon is pumped into the furnace to a surface pressure of −0.05 MPa. (4) Melting: Under vacuum conditions with argon protection, arc melting is performed at a current of less than 500 A. The first melt involves sponge titanium or a high-purity Zr block deoxygenation washing furnace to further reduce the partial pressure of oxygen in the melting atmosphere for a duration of 2–5 min. When ingot casting, after the complete melting of raw materials, turn on the electromagnetic stirring device for full stirring and perform alloy ingot melting 3–5 times to ensure uniform composition. After each smelting process, the ingots are flipped using a sampling spoon to ensure consistent composition. Prior to each smelting process, titanium sponge or high-purity zirconium is melted once in order to decrease the oxygen partial pressure within the furnace. The smelting process lasted for 2–5 min, followed by cooling the samples to room temperature. Each ingot weighed between 50 and 80 g. Through repeated turning and melting, the composition of the alloy ingot was homogenized until all elements were evenly distributed. The surface of the ingot appeared uniformly colored. Then, the high-entropy CoCrFeNiAlx alloy components underwent appropriate shot peening treatment. The specific experiment was conducted in the following steps: (1) sample cutting. Select a single component of A2 sample 20 × 15 × 4 mm3 divided into 4 small samples, 10 × 15 × 2 mm3. (2) Shot peening test. Three samples were shot peening with different strengths (0.1, 0.2, 0.3 mmA, and compound shot peening with 0.3 + 0.1 mmA single side for 20 s; teinforced with cast steel shot.

2.2. Characterization

The phase composition analysis of the processed composite ceramic materials was carried out by the Rigaku Mini Flex benchtop X-rays diffraction (XRD) technique using Cu radiation by increasing the diffraction 2θ angle in the range of 10° to 120° with a step size of 0.03°. With the XRD measurement data, the crystal structure was further investigated by Rietveld refinement using the Global Sustainability Assessment System software (GSAS-II, Los Alamos National Laboratory Report LAUR 86-748, Los Alamos, NM, USA). The four samples were tested by SEM after shot peening. A scanning electron microscope (JEOL Ltd., Tokyo, Japan) (working distance: 20 mm, working voltage: 20 kV) was used to compare the surface morphologies of high-entropy alloy strengthened by different shot peening processes.
In order to study the influence of shot peening technology on the surface morphology of the sample, the cross-section structure was observed using the optical microscope Zeiss Axio Observer A1 (Zeiss, Jena, Germany). The surface roughness of samples subjected to different shot peening intensities was measured using a TR220 surface roughness instrument (Zhongzhong Intelligent (Jining) Design and Research Institute, Jining, China). The changes in roughness before and after shot peening were characterized by two parameters, namely the contour arithmetic mean deviation Ra and micro-roughness ten-point height Rz, to determine the impact of various shot peening processes on the surface roughness of high-entropy alloy. The surface layer of the composite was analyzed in detail using the JEOL JEM-2100F transmission electron microscope (JEOL Ltd., Tokyo, Japan) to observe and analyze the microstructural effects of shot peening, as well as to monitor the evolution of dislocation configuration on the shot-peened surface. In the TEM measurement process, the thin foils went through slicing, flat-stone milling, nailing, and ion thinning.

3. Results and Discussion
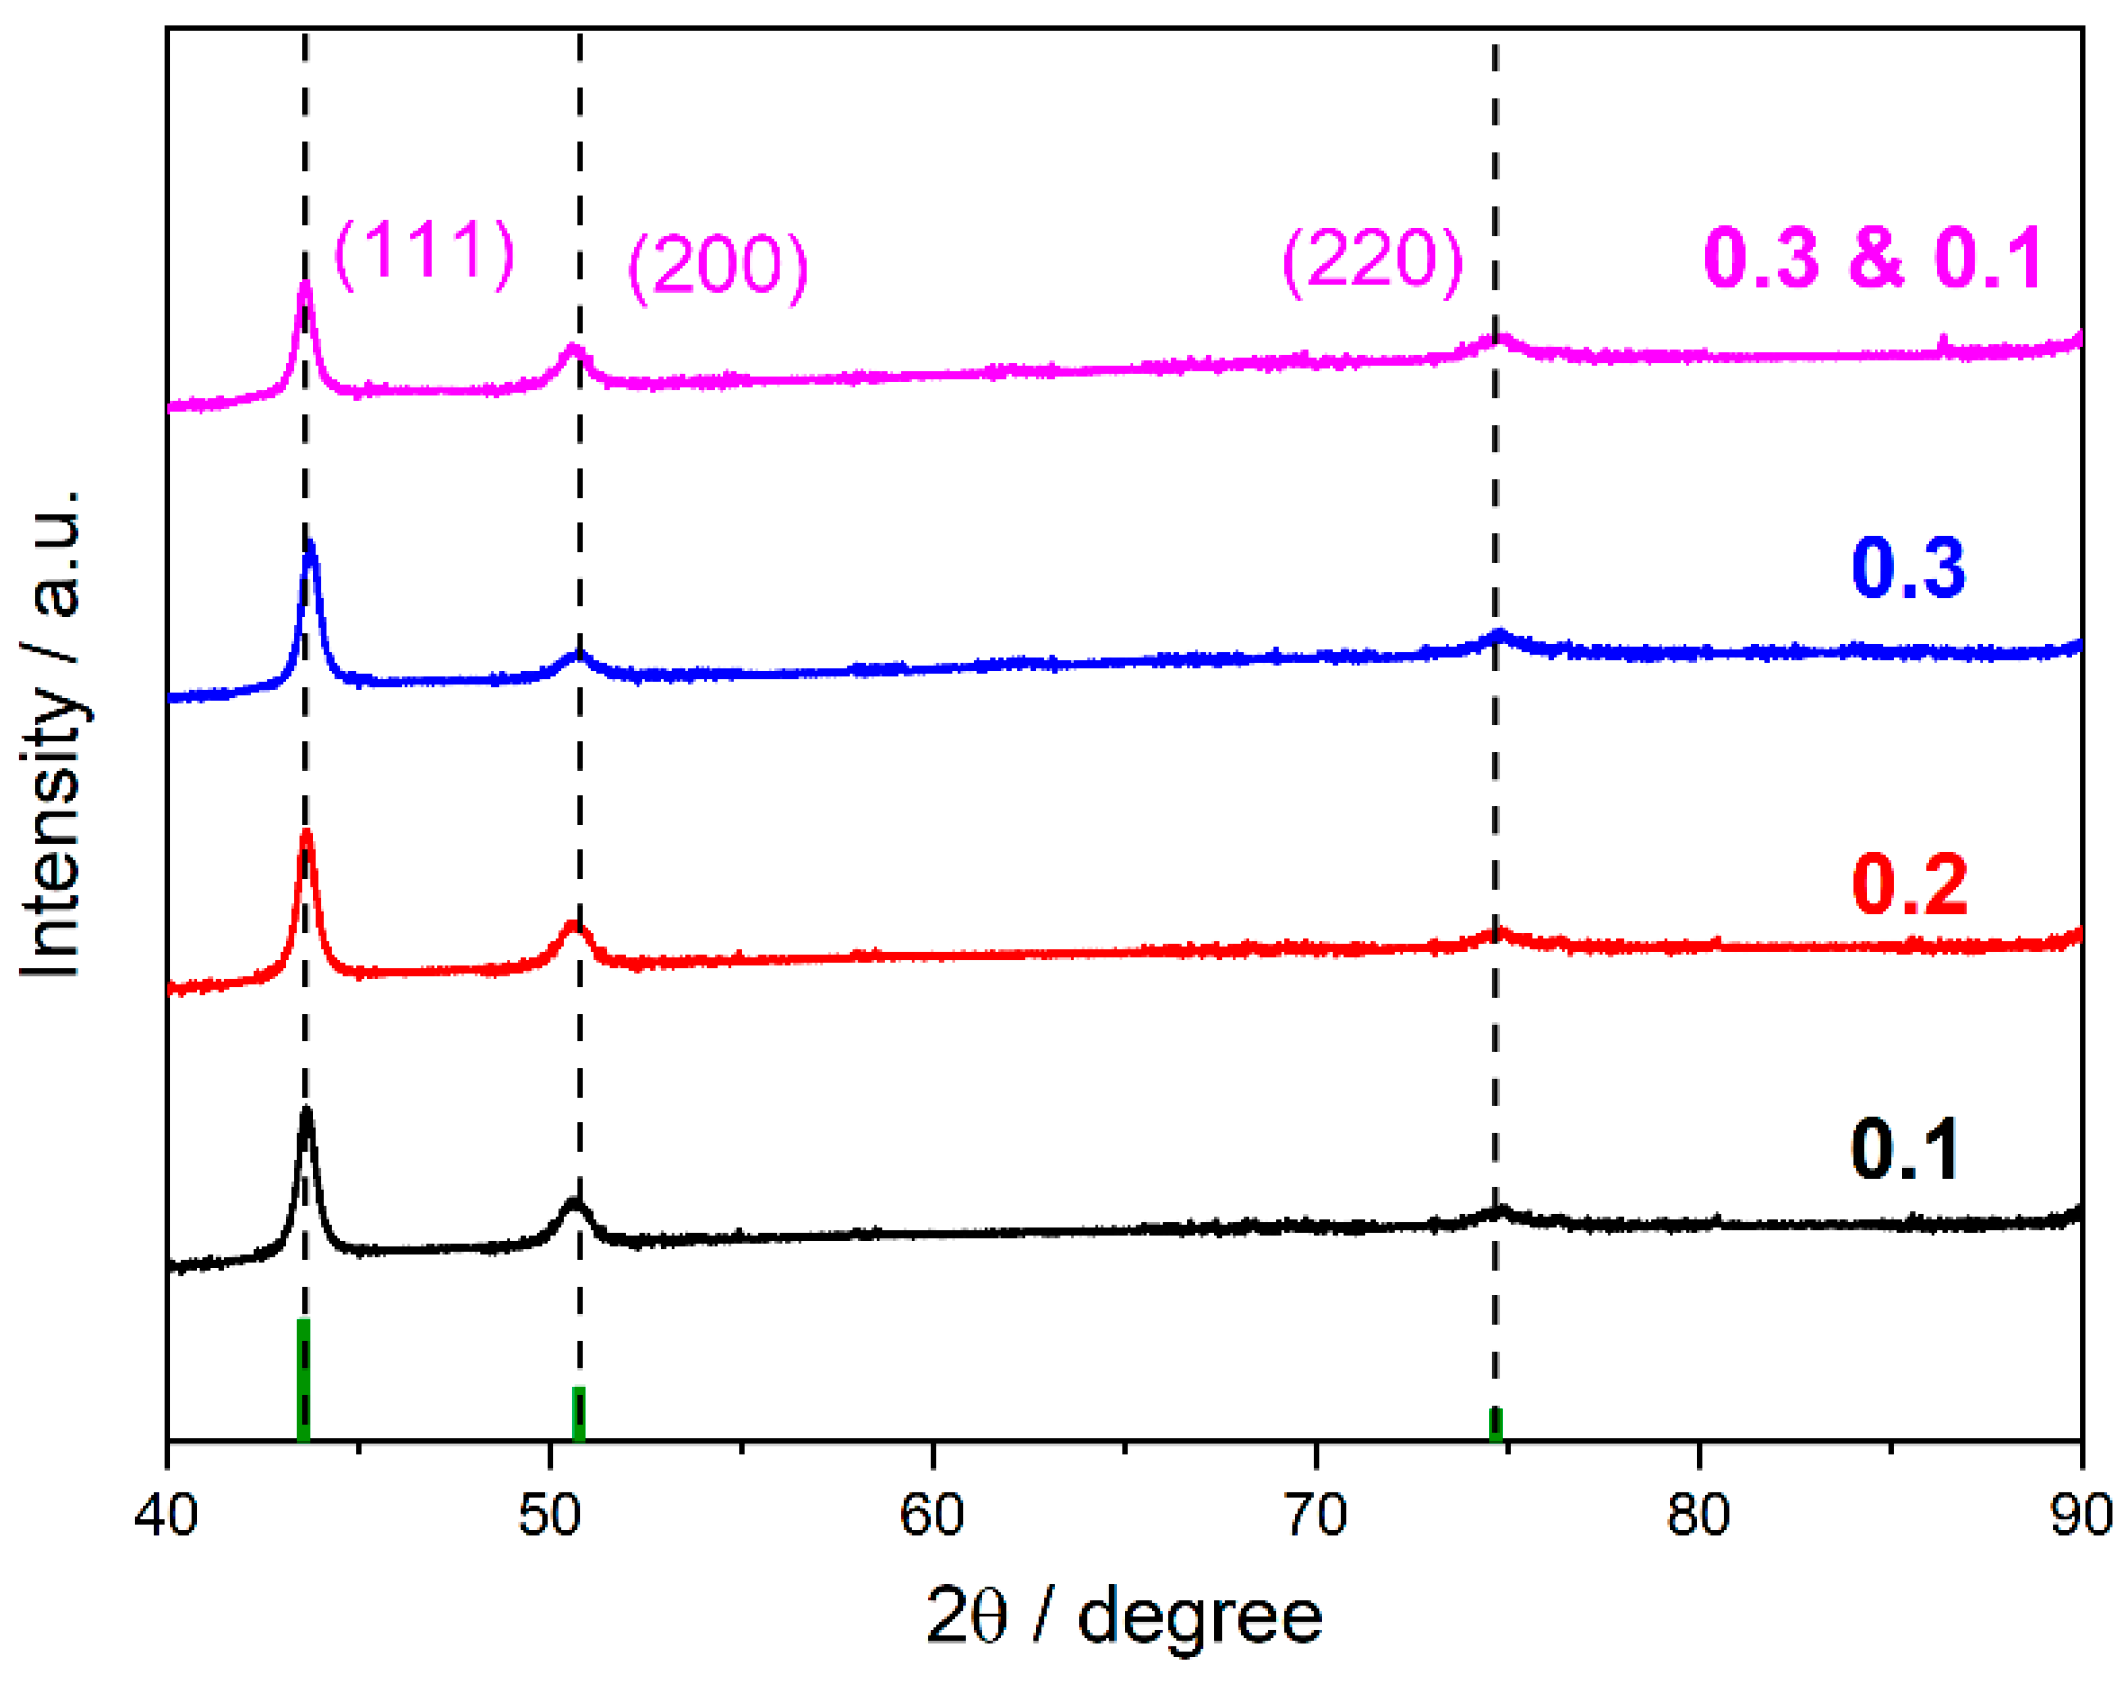
3.1. XRD Analysis

During the shot peening process, the material’s surface layer undergoes repeated plastic deformation, resulting in microstructural changes that alter its mechanical properties. Compared to other analytical methods, X-ray diffraction linear analysis requires minimal sample preparation and yields reliable statistical results. The change in the microstructure of the material causes the change in the width and intensity of the diffraction peak. By analyzing the XRD profile of the material, the microstructure information of the corresponding crystal plane, such as the crystal block size, micro-distortion, and dislocation density, can be calculated without destroying the original structure of the part.
The X-ray diffraction patterns of samples subjected to various shot peening conditions are presented in Figure 1. As depicted, the material exhibited a single austenite phase and the FCC crystal structure remained unchanged despite variations in shot peening intensity. However, a meticulous analysis of the atlas revealed that shot peening under varying conditions led to distinct alterations in peak position, intensity, and half-peak width corresponding to different crystal faces within the sample structure. This indicated that diverse intensities of shot peening caused changes in material microstructure. As depicted in Figure 2, the (111) crystal surface of the sample exhibited an inclination toward higher angles with a continuous increase in shot peening intensity (0.1~0.3 mmA, from 43.65 to 43.78 degrees), indicating a gradual rise in residual stress within the sample as shot peening intensity increases. When the sample underwent composite shot peening (0.3 + 0.1 mmA), the peak position corresponding to the (111) crystal surface shifted to the left (43.63 degrees) compared with the angle corresponding to 0.3 mmA peening, indicating that composite shot peening can effectively improve the surface state of the material and relieve the excess residual stress on the material surface, as reported in reference [22].

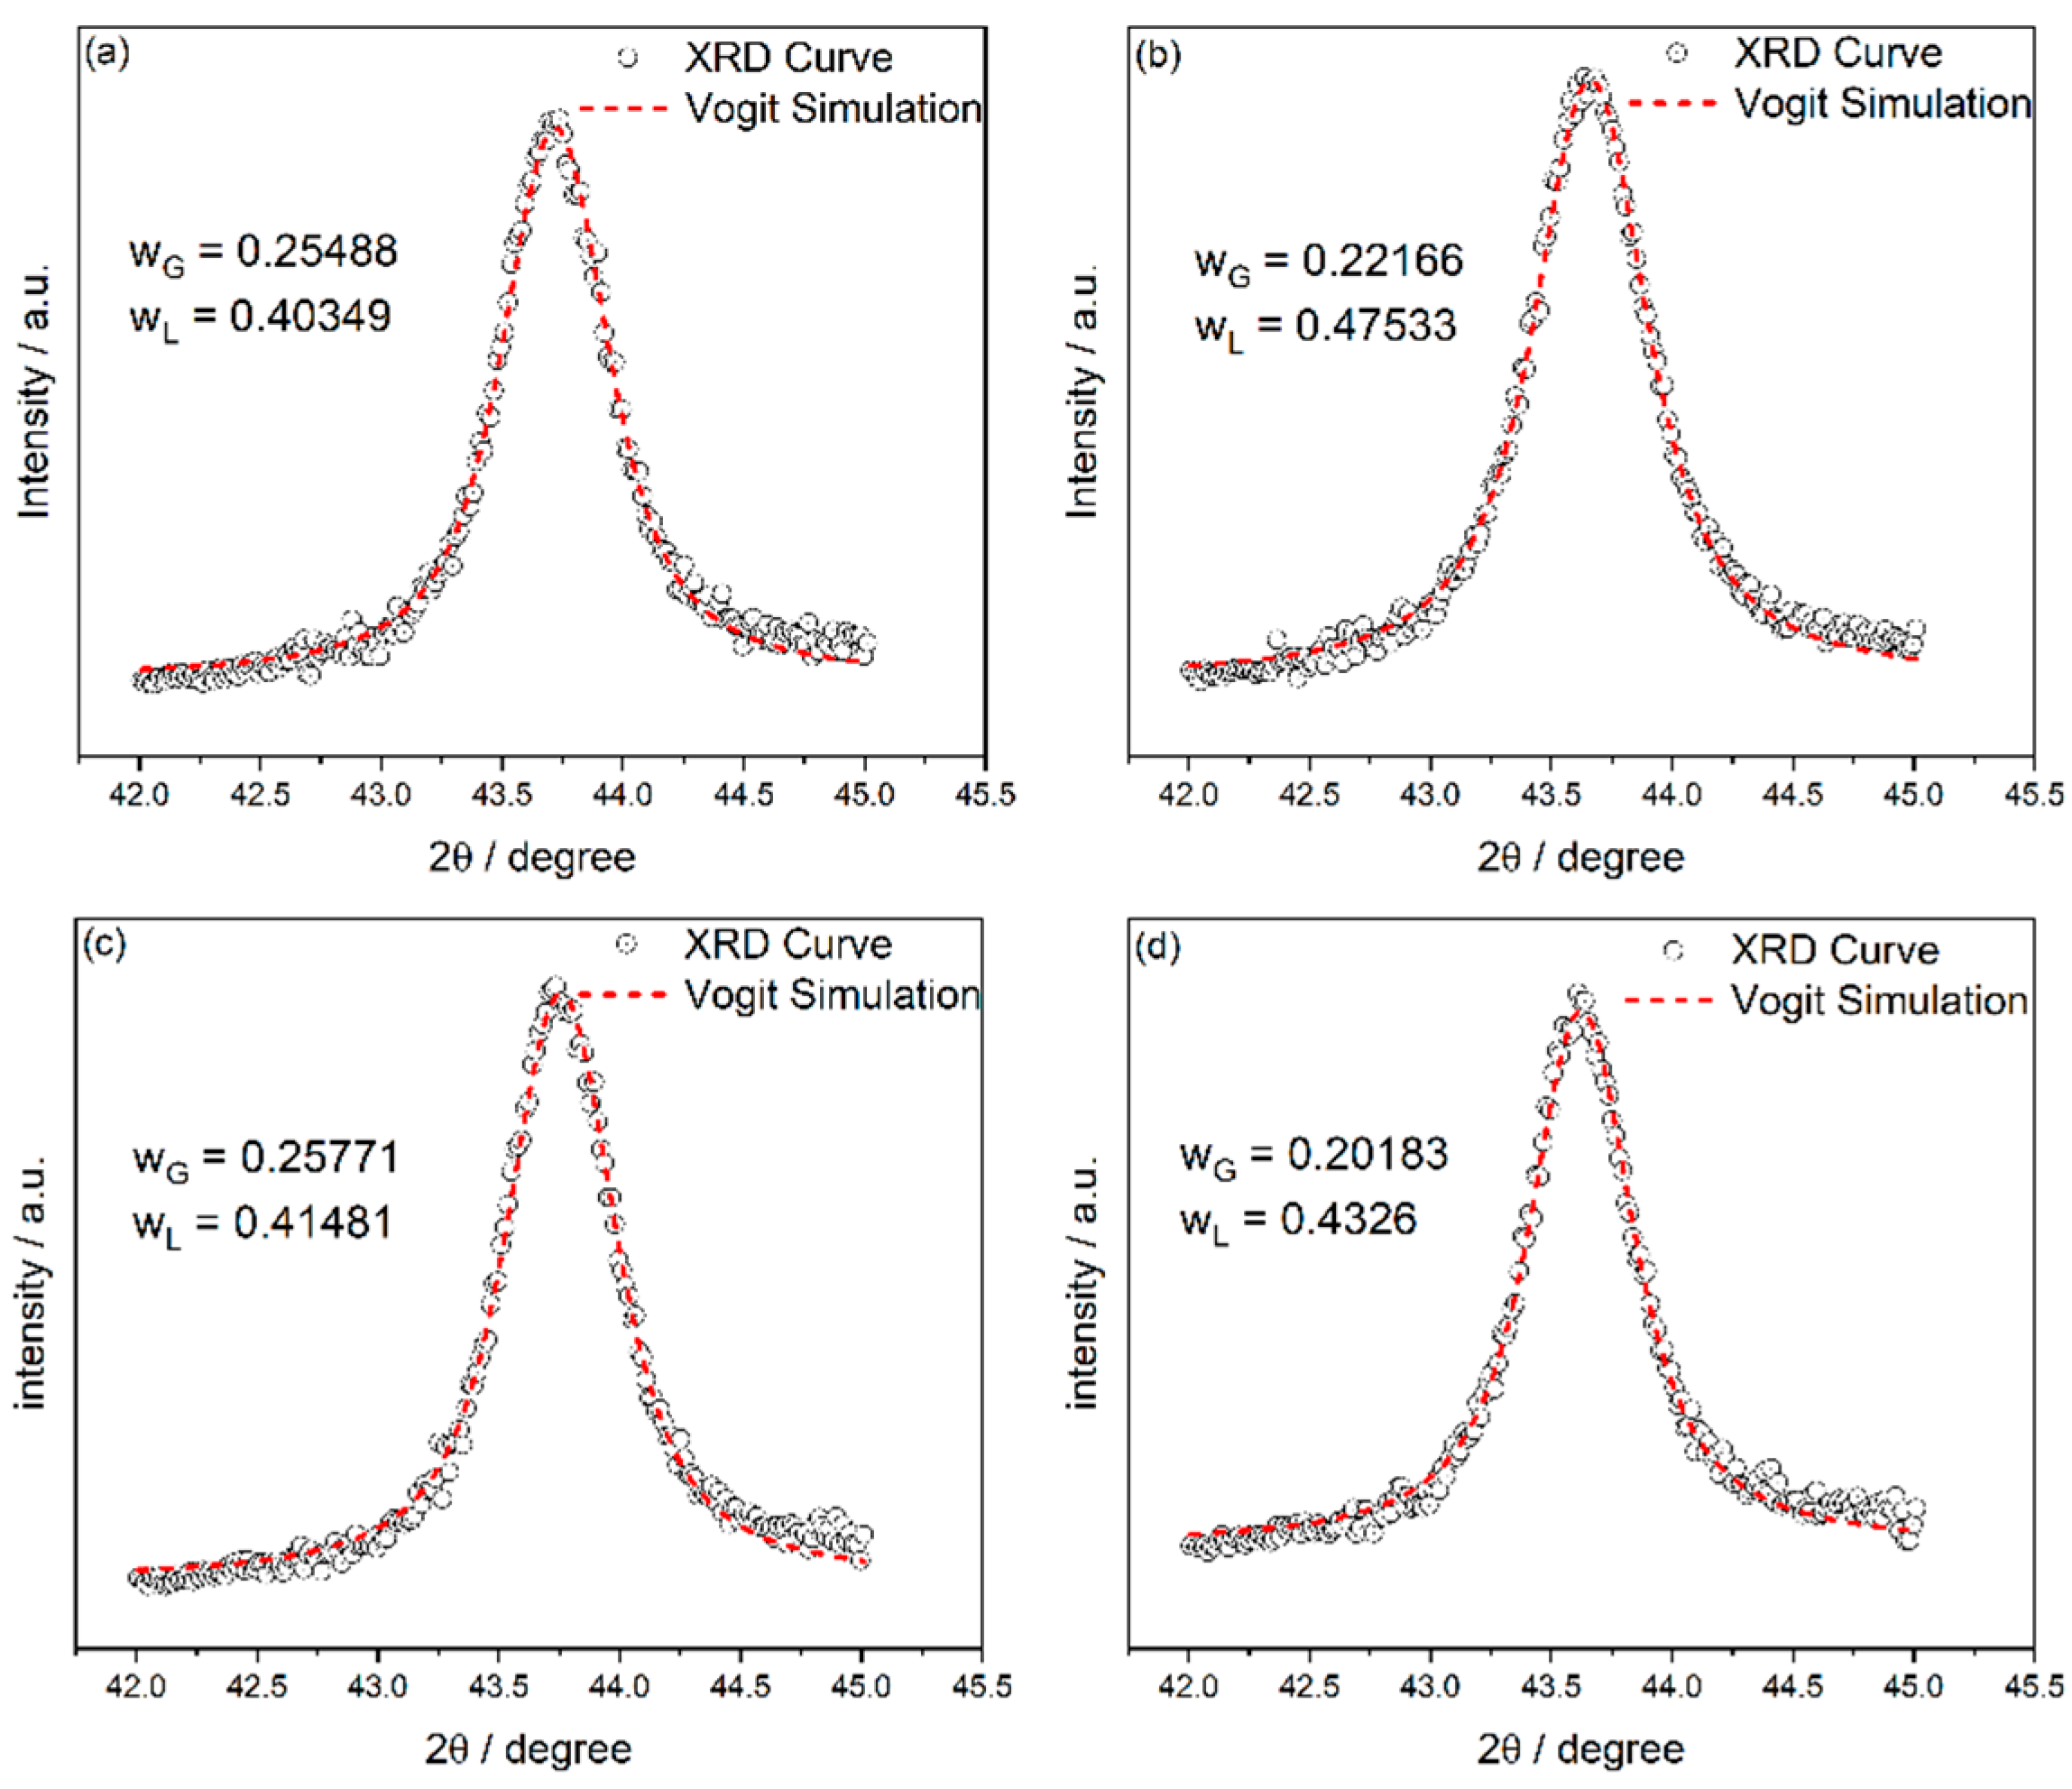
3.1.1. Voigt Approximate Function Method for Linear Analysis

It is widely acknowledged that the broadening effect caused by microscopic strain can be approximated by a Gaussian function, while the linear broadening resulting from block size refinement can be approximated by a Lorentzian function. The Voigt method is based on this principle. To analyze XRD patterns using the Voigt function, the Voigt curve representing the ideal diffraction line of 1 can be constructed by providing the peak position of the diffraction peak 2θ, test interval, Gauss function peak height Ig, background height Ib, calculated step size and integral width of Gauss and Lorentz components. The mathematical expression for Voigt is as follows:
I = I 0 + f 1 f 2 2 θ = I 0 + A 2 l n 2 π 3 2   w L w G 2 e t 2 l n 2 w L w G 2 + 4 l n 2 2 θ 2 θ 0 w G 2
f 1 2 θ = 2 A π w L 4 2 θ 2 θ 0 + w L 2
f 2 2 θ = 4 l n 2 π e 4 l n 2 w G 2 2 θ 2 w G
The Voigt function fitting diagram of diffraction peaks (111) is presented in Figure 2, illustrating the effect of different shot peening intensities.
According to the formula:
w G f 2 = w G h 2 w G g 2
w L f = w L h w L g
where f, h, and g represent the physical line, measured line, and instrument line respectively. The grain size and microdistortion content can be calculated by integral broadening. The results of Voigt approximation function method calculations on the (111) crystal surface of the material are presented in Table 2. Following various intensity shot peening treatments, significant changes are observed in the crystal size, micro-distortion, and dislocation density of the material surface. With the increase in shot peening intensity, the crystal block size on the material surface decreases from 17.6 nm (0.1 mmA) to 16.8 nm (0.3 mmA), while the number of microdistortions increases from 5.9 × 10⁻³ (0.1 mmA) to 6.3 × 10⁻³ (0.3 mmA). However, the surface crystal block size and micro-distortion number of the material showed small changes after composite shot peening (0.3 + 0.1 mmA), measuring at 16.5 nm and 6.3 × 10⁻³, respectively.
The dislocation density content can be obtained by combining the crystal block size and microdistortion content with the following formula [23]:
δ = 2 3 b ε 2 1 / 2 D
Increasing dislocation density leads to intensified mutual delivery of dislocation in motion within the material, resulting in fixed barriers such as step cutting and dislocation entanglement, which increase the resistance of dislocation motion and cause increased deformation resistance, making it difficult for the material to continue plastic deformation, thus improving the strength σ of the sample metal [24,25]. According to the formula:
Δ σ = α b G δ 1 / 2
The strength is proportional to the half power of the dislocation density δ, and the larger the Burgers vector b of the dislocation, the more significant the strengthening effect. As shown in Table 2, the results showed that the dislocation density content increased from 4.1 m−2 (0.1 mmA) to 4.9 m−2 (0.3 mmA), which greatly increased the mechanical strength of the material. However, the dislocation density of compound shot peening (0.3 + 0.1 mmA) is not much different from that of the sample strengthened with 0.3 mmA shot peening, indicating that the coverage of shot peening on the surface of the sample tends to be saturated.

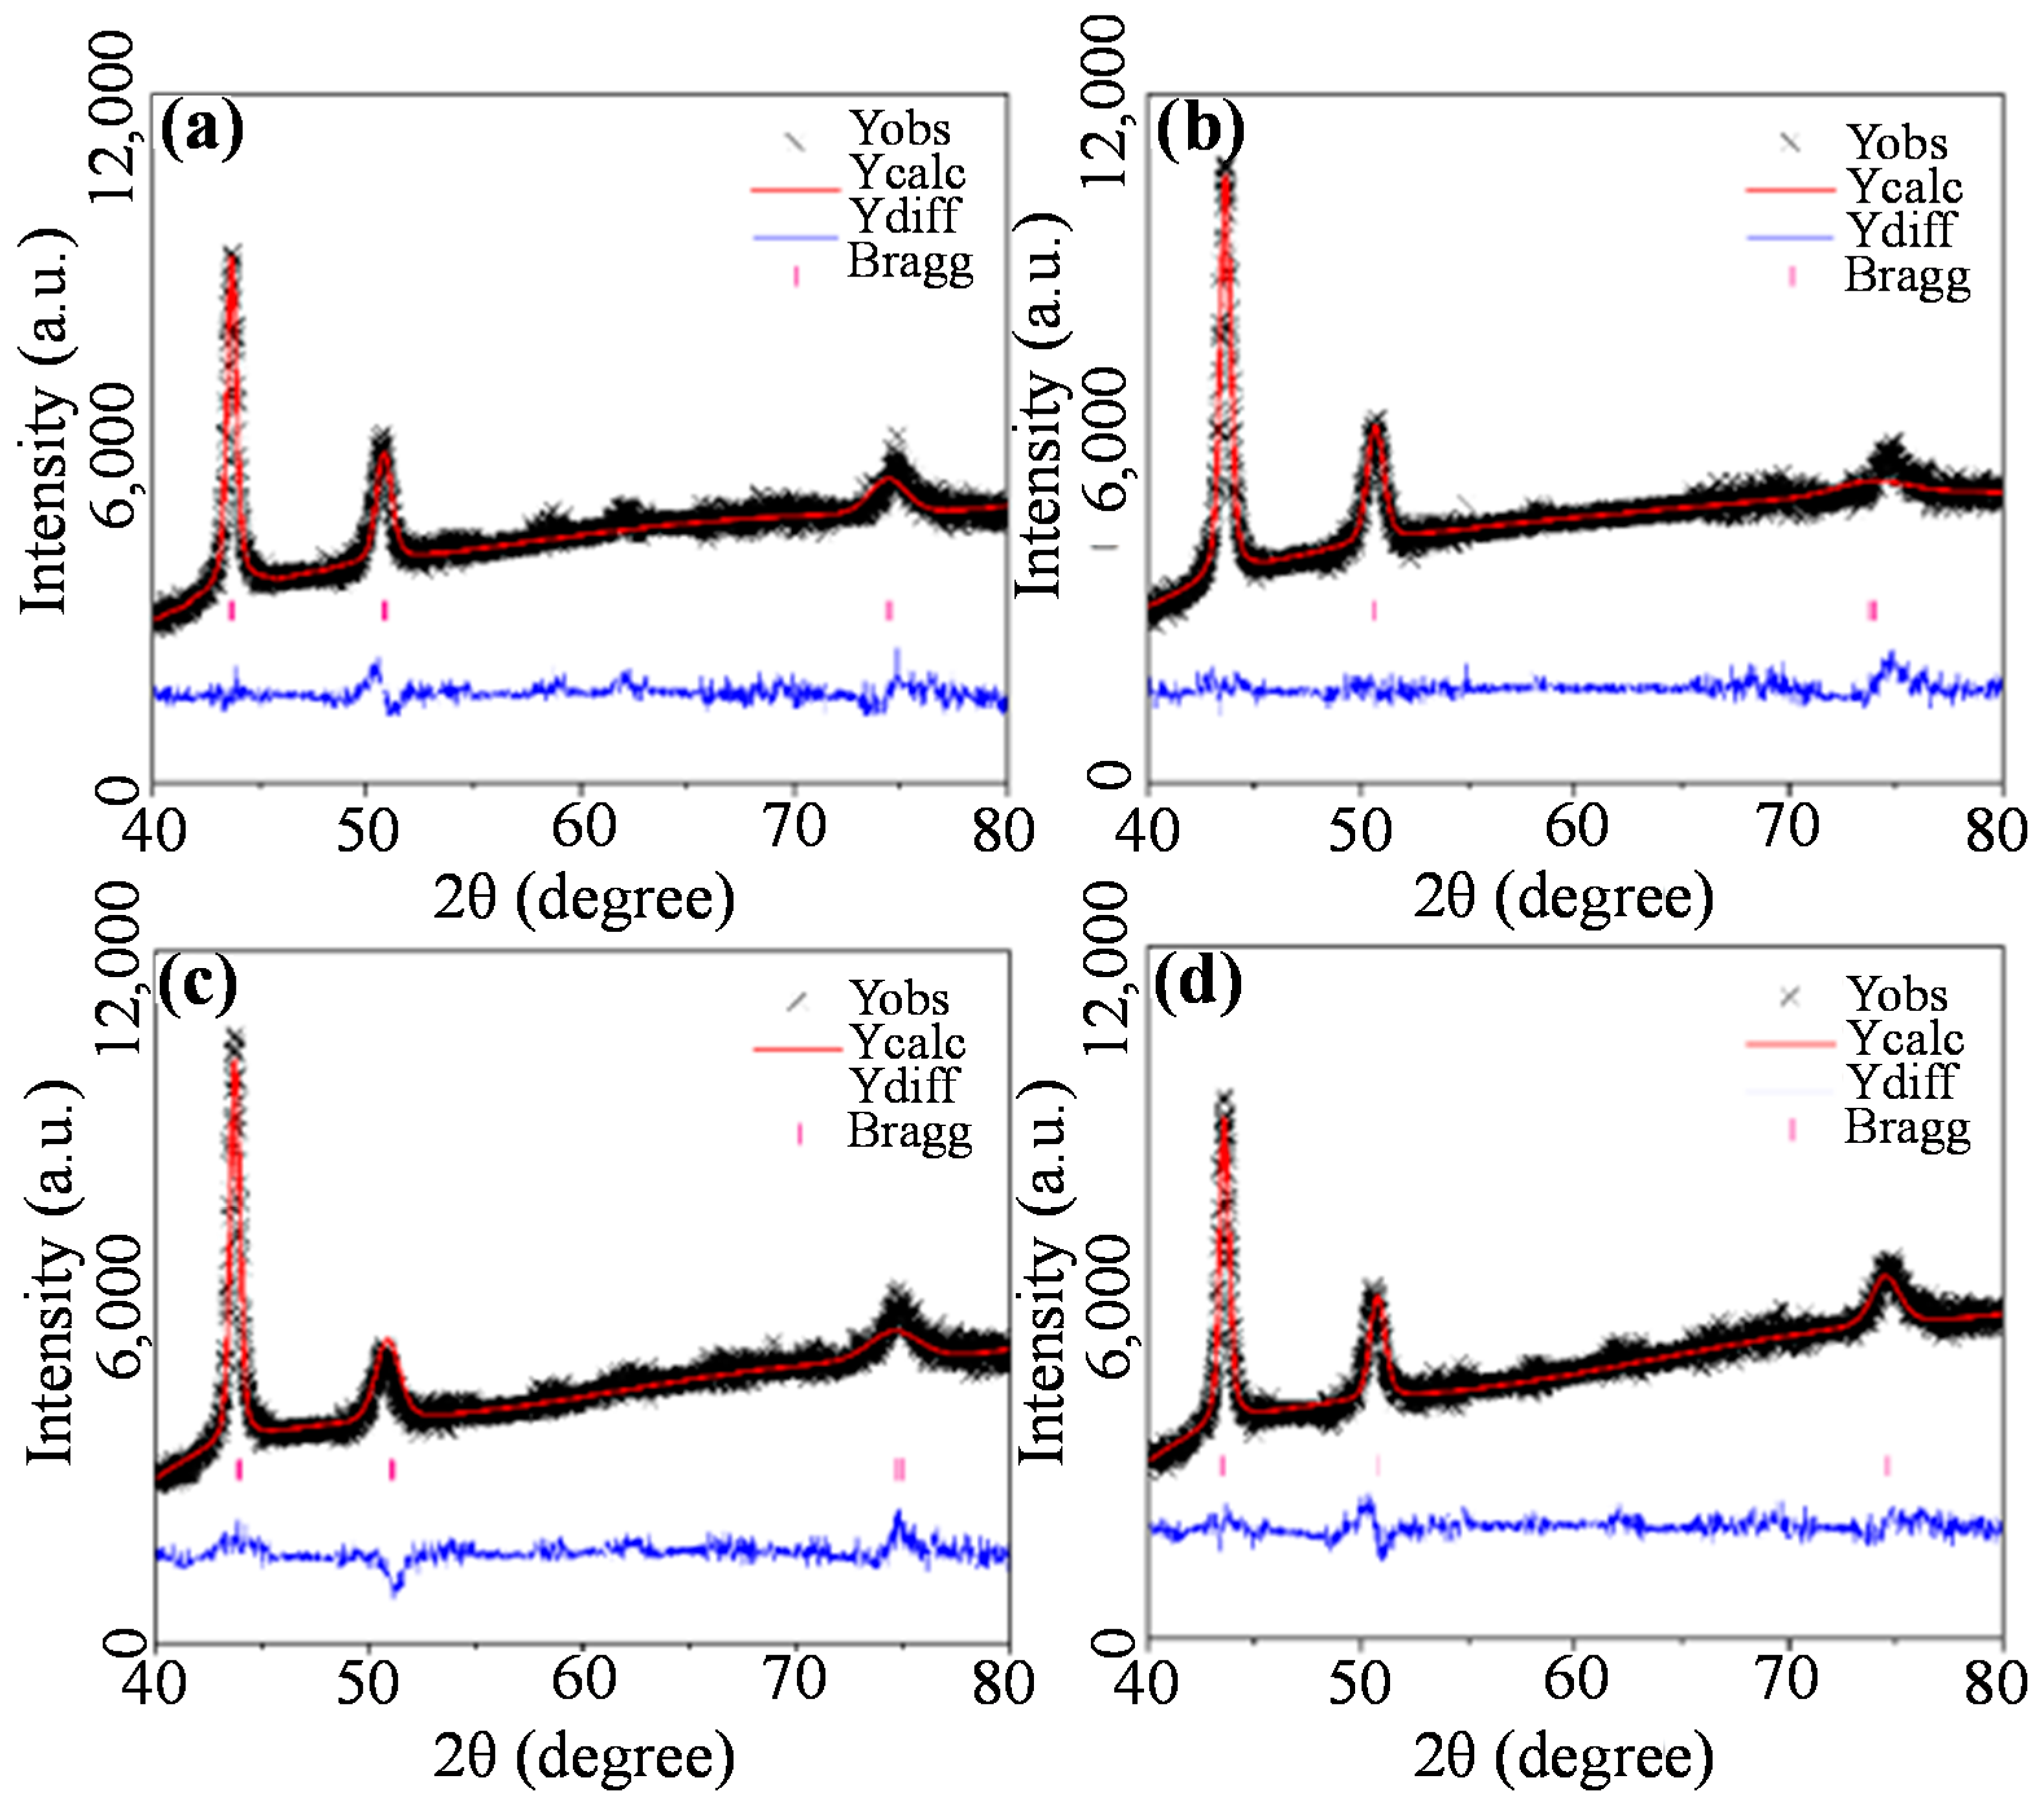
3.1.2. Rietveld Full Spectrum Analysis

As we all know, although the single-peak Voigt method can quickly determine the changes in the microstructure of the shot peening layer, due to the limitations of the data and the over-dependence on the intensity of the peak shape and the background, the results are greatly affected by the single peak shape. As is widely acknowledged, the single-peak Voigt method can rapidly identify variations in the microstructure of shot peening layers. However, due to data limitations and an excessive reliance on peak shape intensity and background, results are significantly impacted by a singular peak shape.
By comparing the calculated and experimental values point by point through a computer program, and adjusting the structural parameters and peak shape parameters, Rietveld full spectrum analysis can obtain the exact crystal structure, and thus obtain the grain size and micro-strain of the material.
When analyzing the entire diffraction pattern data with Rietveld, the X-ray spectrum can be regarded as consisting of 2θi and diffraction intensity data columns at a certain equal spacing [26,27,28]. In the case of a known crystal structure, the intensity corresponding to each 2θi is calculated based on structural and peak shape parameters. The least squares method is then employed to iteratively adjust various parameters in order to minimize the difference M and obtain accurate crystal structure parameters and peak shape information, as expressed by the following formula:
Y c i = S i L k F k 2 G k i 2 θ i 2 θ k P k A * θ + Y b i
M = i W i Y o i Y c i 2
Yoi represents the measured strength, Yci denotes the theoretical strength, S is the scale factor, Lk stands for the product of Lorentz factor, bias factor, and multiplicity factor, Pk refers to the preferred orientation function, A*(θ) represents the reciprocal of sample absorption coefficient, Fk indicates structural factor, while Ybi signifies back bottom strength.
The reliability of the fitting results is calculated by the reliability factor, namely the R-factor (usually Rp and Rwp as reference standards):
R p = Y o i Y c i / Y o i
R w p = W i Y o i Y c i 2 / W i Y o i 2 1 / 2
The calculated results are shown in Figure 3 and Table 3. It can be observed that both Rp and Rwp are below 10%, indicating a high degree of map fitting and accurate and reliable data results.
R h = R o + R 1 K 4 1 x , φ + R 2 K 6 1 x , φ +
ε h h 2 E H 4 = E 1 h 4 + k 4 + l 4 + 2 E 2 h 2 k 2 + h 2 l 2 + l 2 k 2
The Popa model was used to analyze the Rietveld-fitted atlas, and the integral widths of Gauss and Lorentz components were computed by substituting <Rh> and <ε2hh> into the formula [29,30]. Subsequently, convolution of the Voigt function with the instrument peak shape function was performed to obtain anisotropic characteristics of block size and microdistortion for different crystal faces of the material. The results are presented in Table 4.
The maximum numerical degree of crystal block size was located on the (111) crystal plane, primarily due to its high resistance to slip compared with other planes. As shot peening intensity increased, the amplitude of variation in the crystal size gradually decreased in all directions on the sample surface, indicating that the shot peening coverage approaches saturation. As shown in Table 5, the distribution of microdistortion was opposite to the size of the crystal block, indicating a large variation in the (220) crystal plane with a value of 7.9 × 10⁻³. The finer the grain size, the larger the grain boundary area, according to the Hall–Patch formula [31,32]:
σ s = σ 0 + k d 1 2
The smaller the average grain diameter d, the higher the yield strength σs.

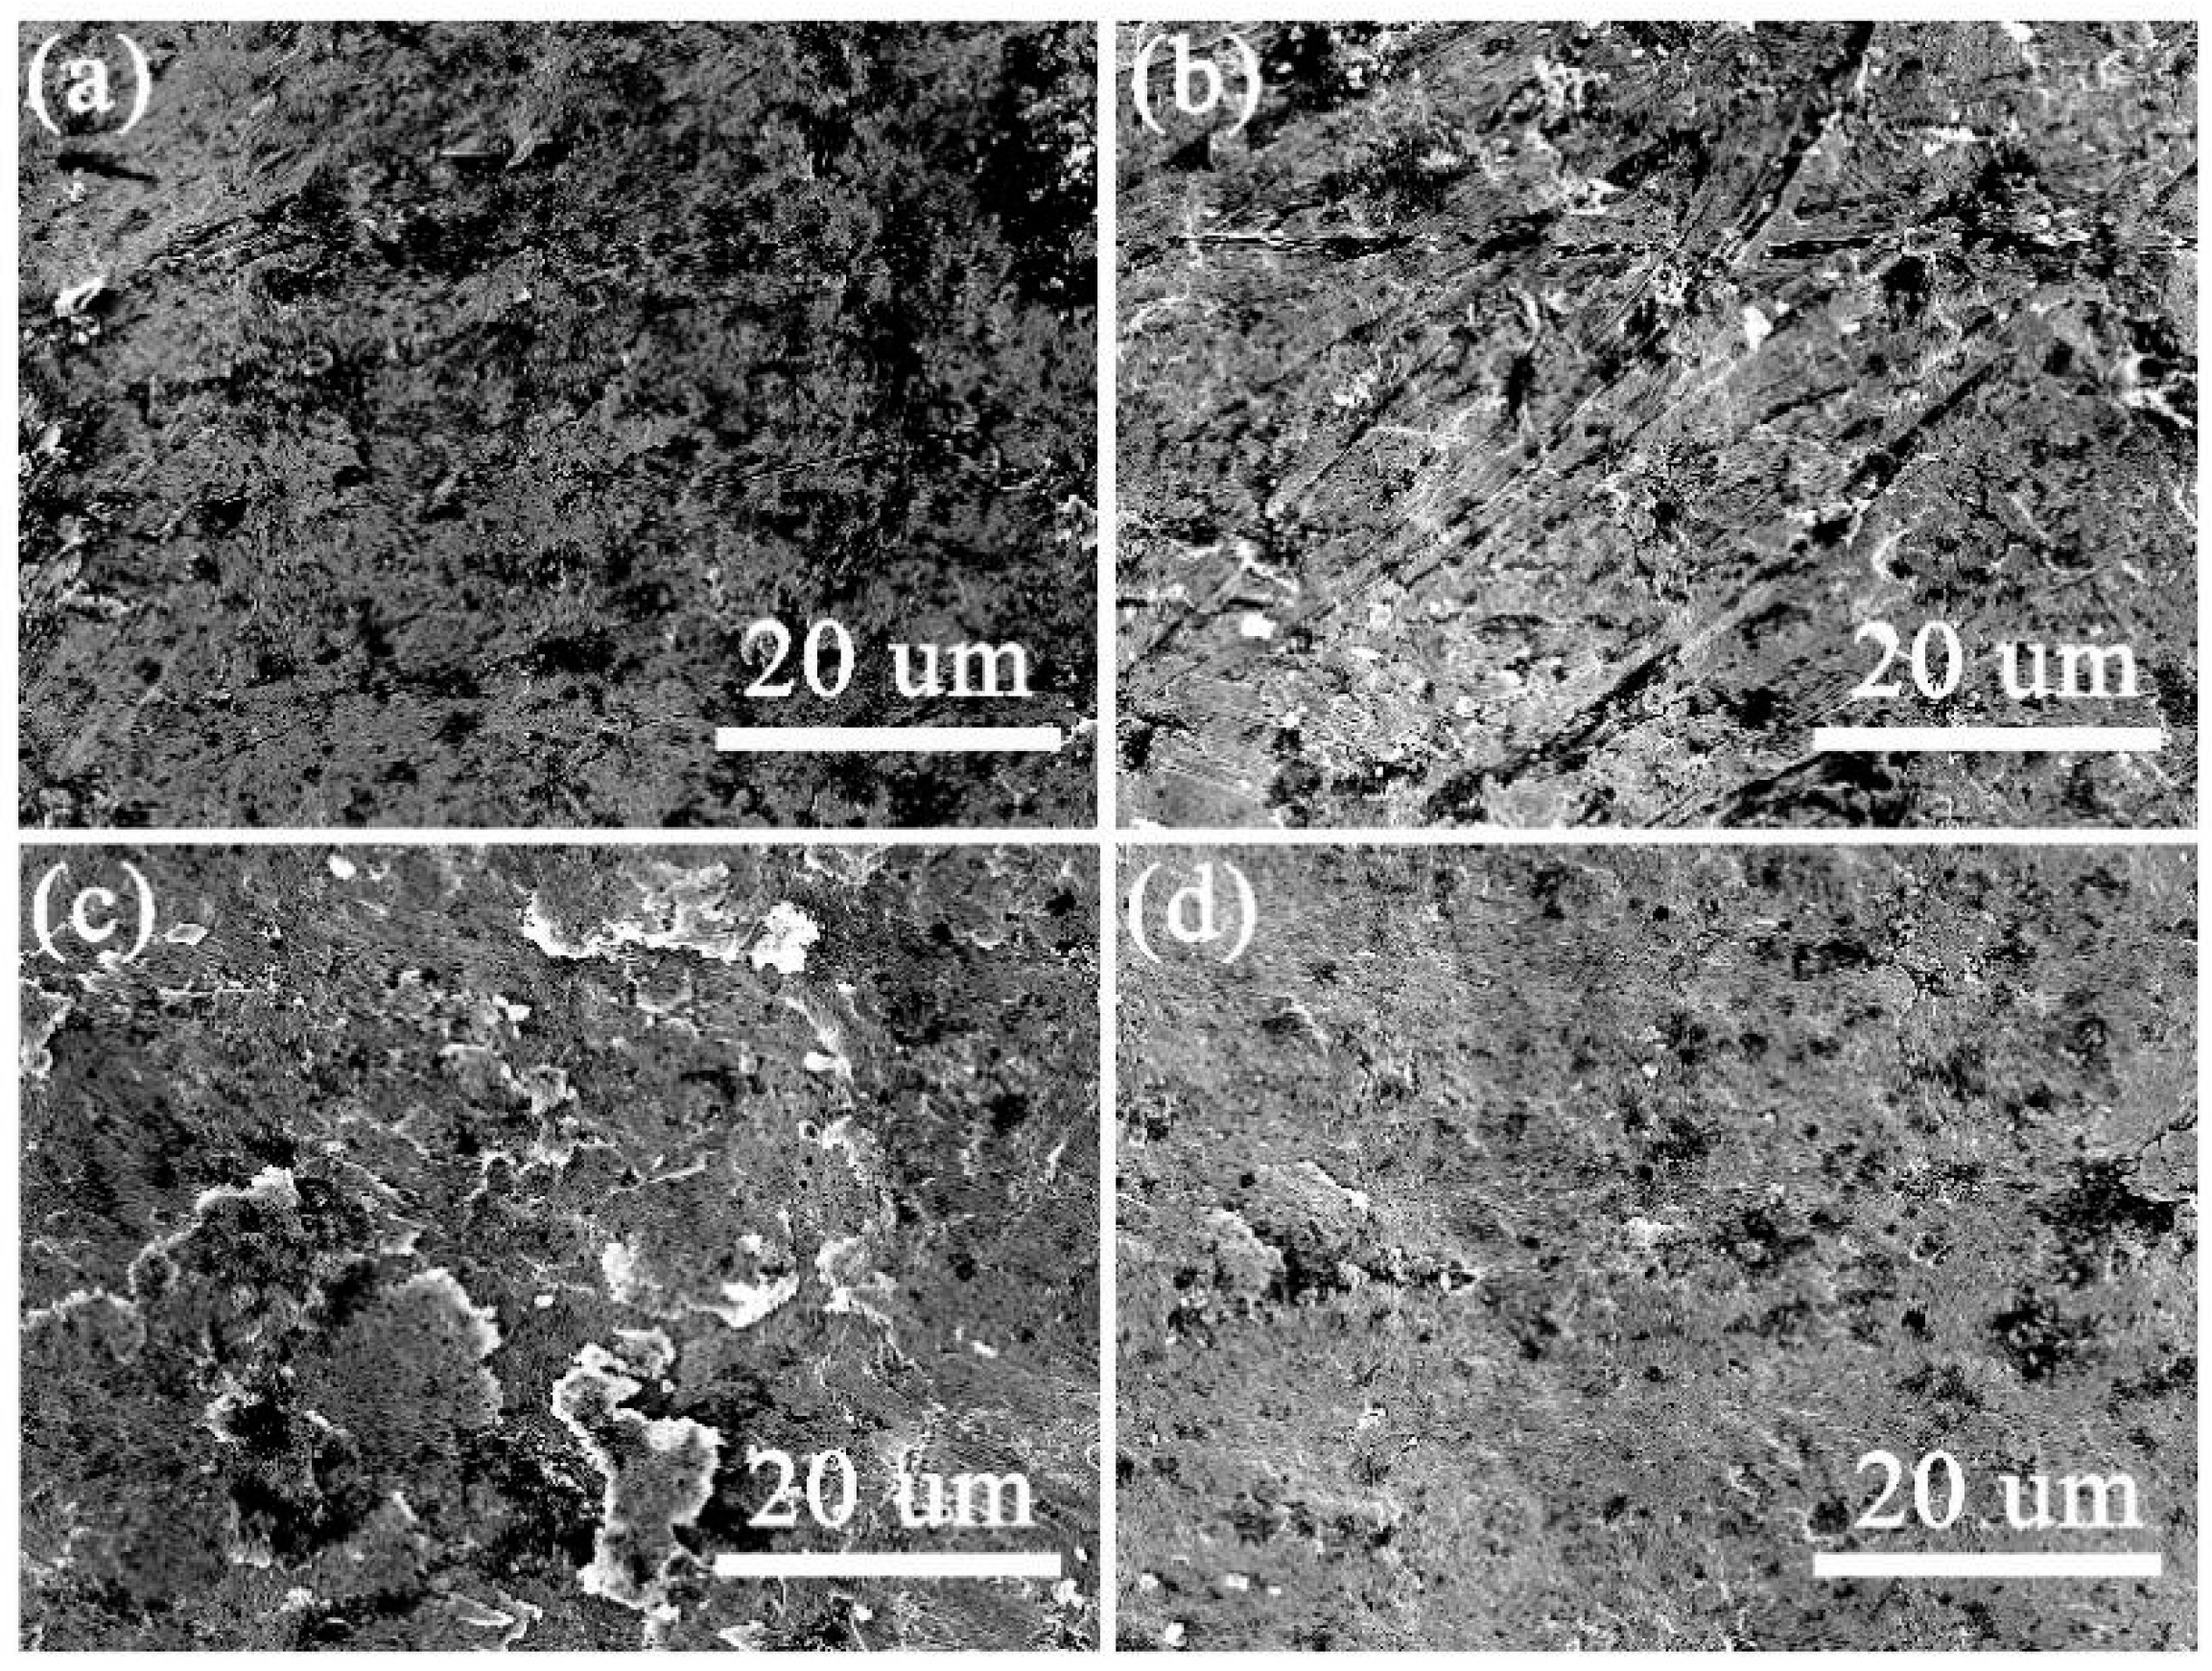
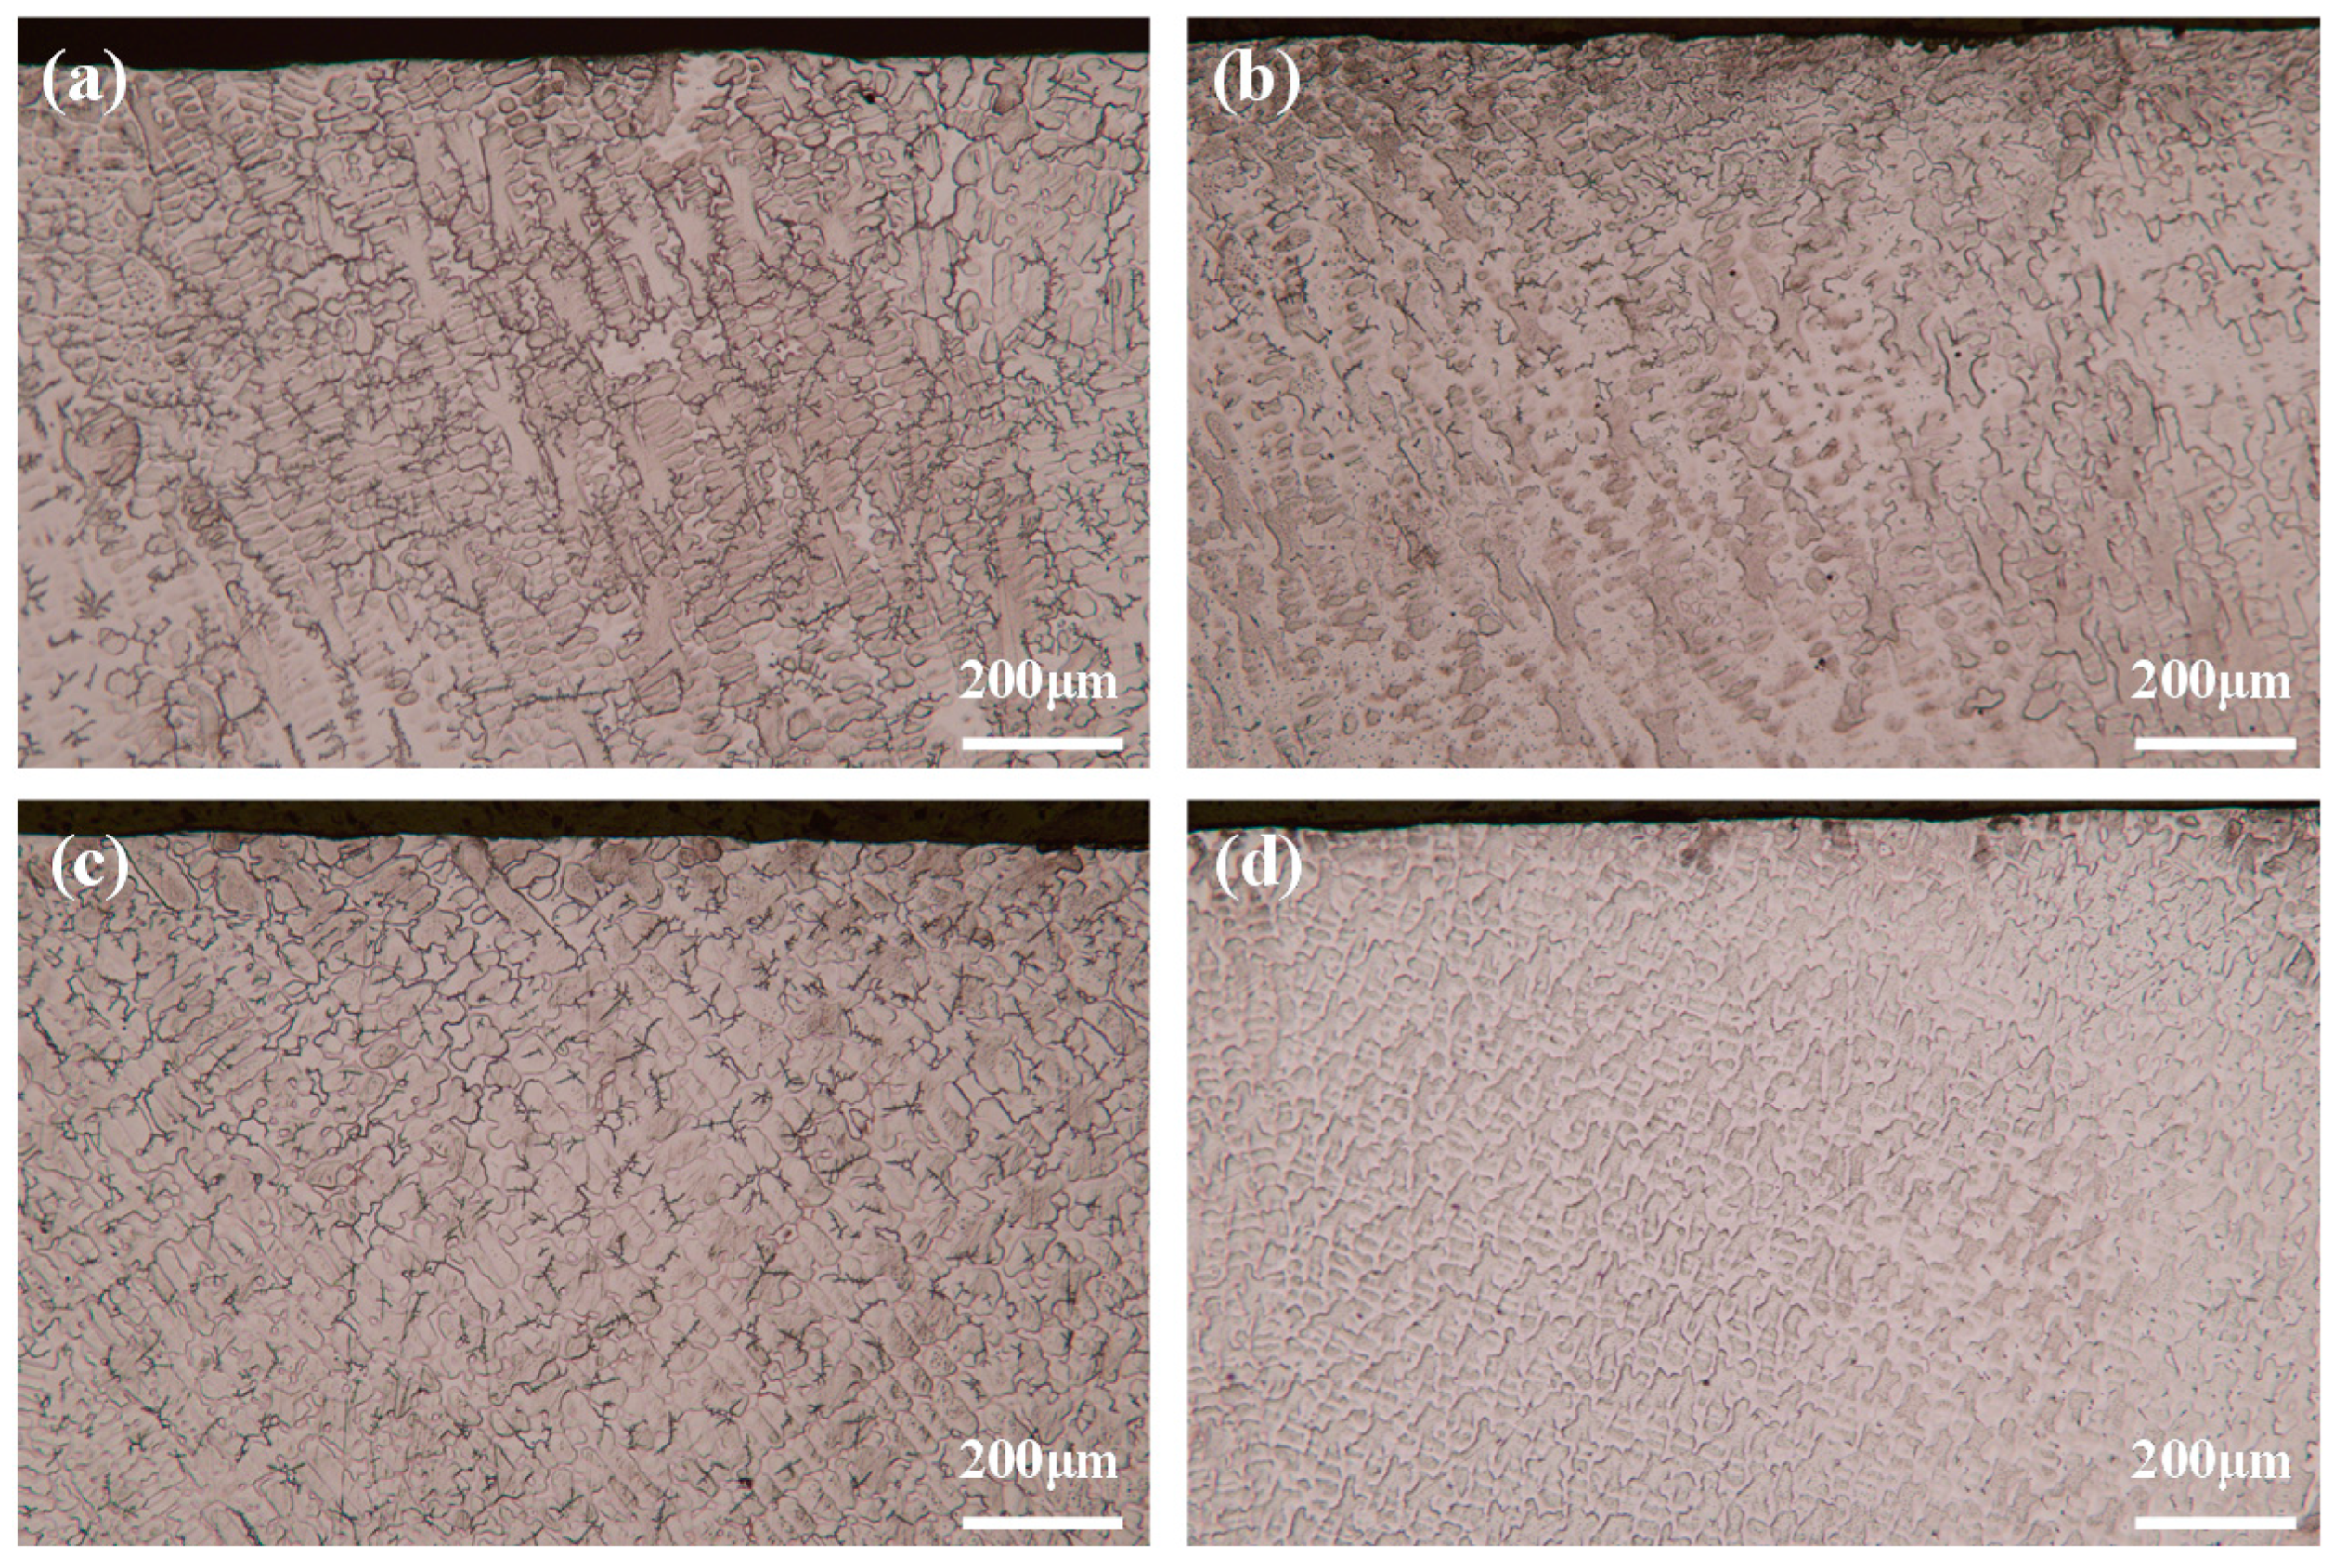
3.2. Surface Morphology Analysis

The surface morphologies of CoCrFeNiAlx high entropy samples were analyzed under various shot peening conditions. The scanning electron microscope was used to amplify the sample surfaces by 500 times, and the resulting morphologies are presented in Figure 4. It can be seen from the surface morphology that the strength difference of shot peening has a significant effect on the surface structural difference of the samples. As depicted in Figure 4c, conspicuous concave and convex traces were observed on the surface of the sample, resulting in cooling and hardening during plastic deformation, which prompted the emergence of a residual stress layer. In this way, the surface strength, fatigue strength, and stress corrosion resistance of components can be improved. Compared with the surface topography characteristics in Figure 4c, the composite shot peening with 0.3 + 0.1 mmA showed uniform distribution of surface topography and small roughness. Although the sample underwent a high-strength shot peening of 0.3 mmA, it can be observed that secondary shot peening with low strength effectively reduced material surface roughness and promoted a more uniform distribution of the surface structure in the sample. The flat and smooth surface can effectively inhibit the tip enrichment of external stress and further enhance the mechanical strength of the material surface.
The metallographic structure of the sample section was observed using the Carl Zeiss Observer microscope. Through shot peening, the residual compressive stress was introduced into the outer surface layer of the member, while the residual tensile stress was generated in the subsurface layer, which led to the corresponding changes in the microstructure of the surface layer of the material.
Figure 5 shows the sectional metallographic diagram of the high-entropy CoCrFeNiAlx alloy shot peening layer. It can be observed that, as the intensity of shot peening increased, the grain size on the sample surface gradually decreased, while the depth of the plastic deformation zone was gradually deepened. After 0.3 + 0.1 mmA combined shot peening treatment, the crystal blocks of the shot peening layer were refined obviously, and the content of microscopic distortion on the surface was the highest, which gradually decreased with the increase in depth. After the optimization of low strength shot peening, the flat residual stress layer is beneficial to reduce the actual tensile stress level of the material, delay the fatigue crack propagation, and improve the local fatigue strength of the material. The strengthening effect of microstructure is generally believed to primarily manifest in inhibiting the initiation of fatigue microcracks, while the optimization effect of residual stress can mitigate the propagation of such cracks, thereby enhancing both fatigue strength and life.

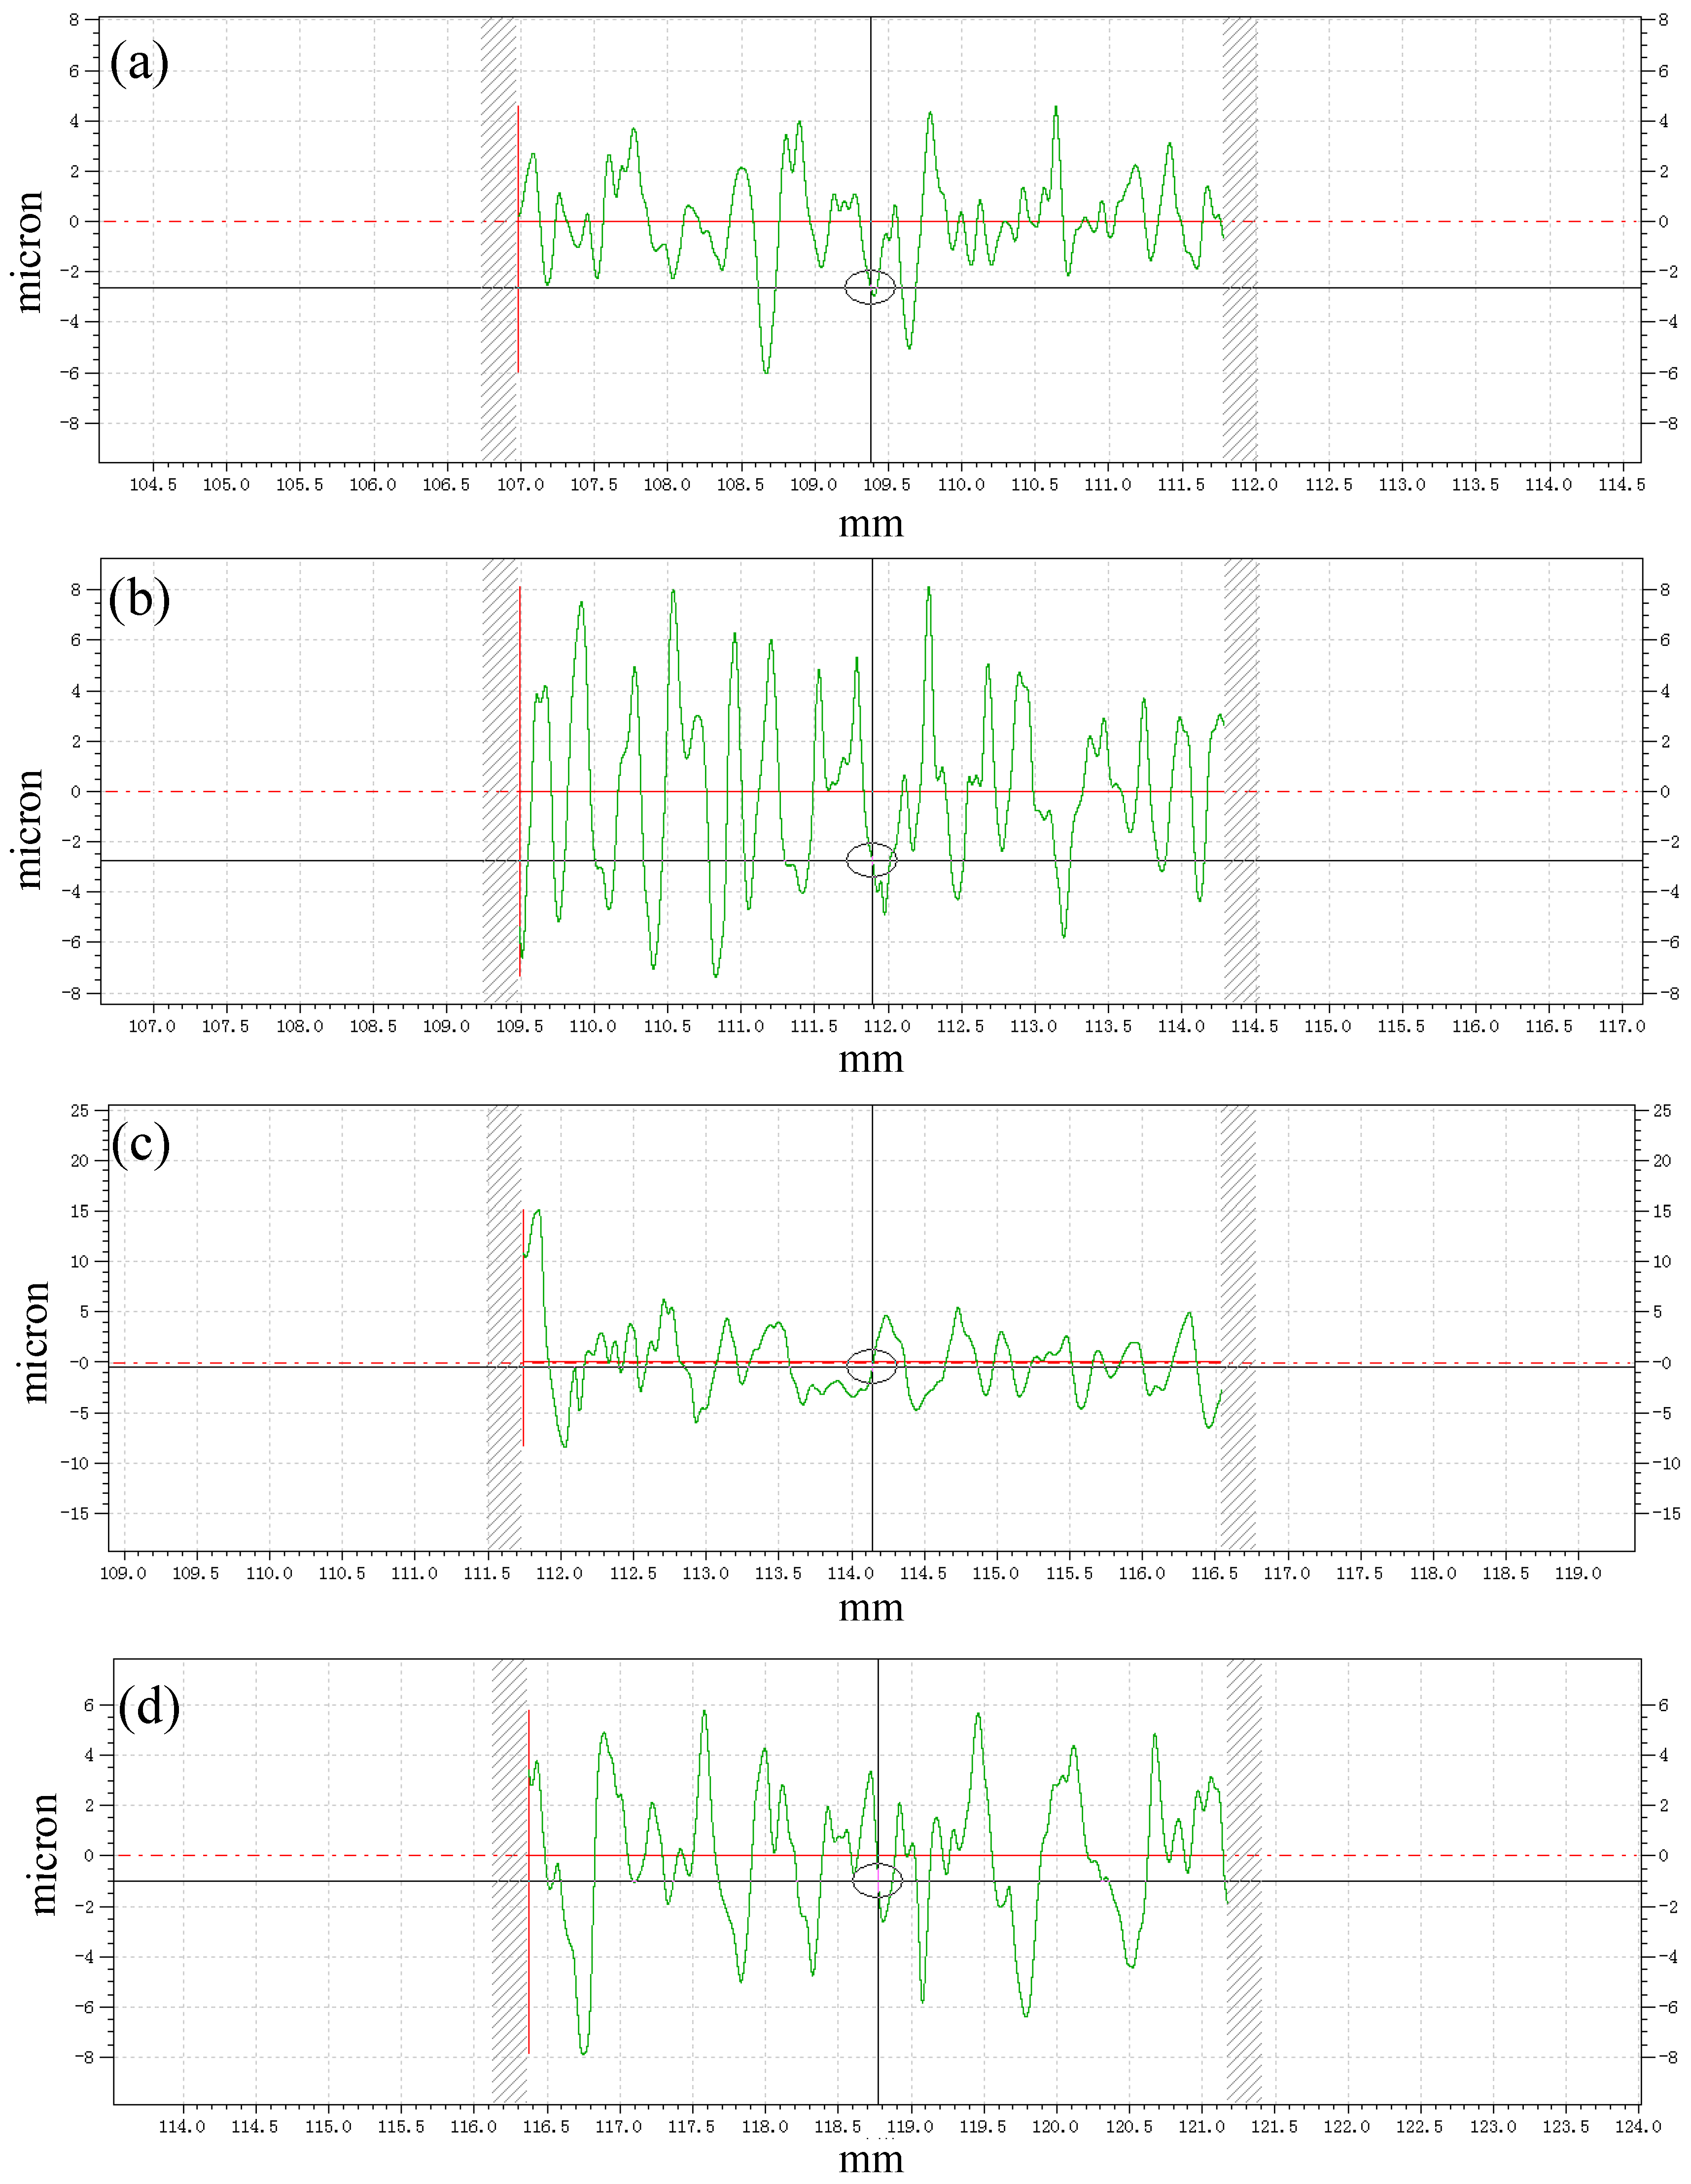
3.3. Surface Roughness Characterization

Figure 6 shows the surface roughness profile of high-entropy CoCrFeNiAlx alloy samples after different shot peening optimization. From 0.1 to 0.3 mmA, the sample surface gradually increased with the increase in shot peening intensity. The values of Ra and Rz increased from 1.35 and 7.19 (0.1 mmA) to 2.78 and 12.22 (0.3 mmA), as shown in Table 6. In addition, it can be seen from the analysis data that compared with 0.1–0.2 mmA, the increase in roughness of the 0.2–0.3 mmA samples was significantly reduced, which also confirmed from the side that the plastic deformation caused by shot peening gradually tended to the saturation state, which is consistent with the conclusion of XRD and SEM data above. Although shot peening introduce stress strengthening and fine grain strengthening into the specimen, the increase in specimen surface roughness leads to stress concentration, accelerates surface crack expansion, and greatly reduces the fatigue life of the specimen. After the combined shot peening, it can be seen that the values were reduced to 2.17, 10.71 (0.3 + 0.1 mmA). It can be seen that combined shot peening can effectively reduce the increase in specimen surface roughness caused by single-shot peening, and thus increase the fatigue life of the specimen.

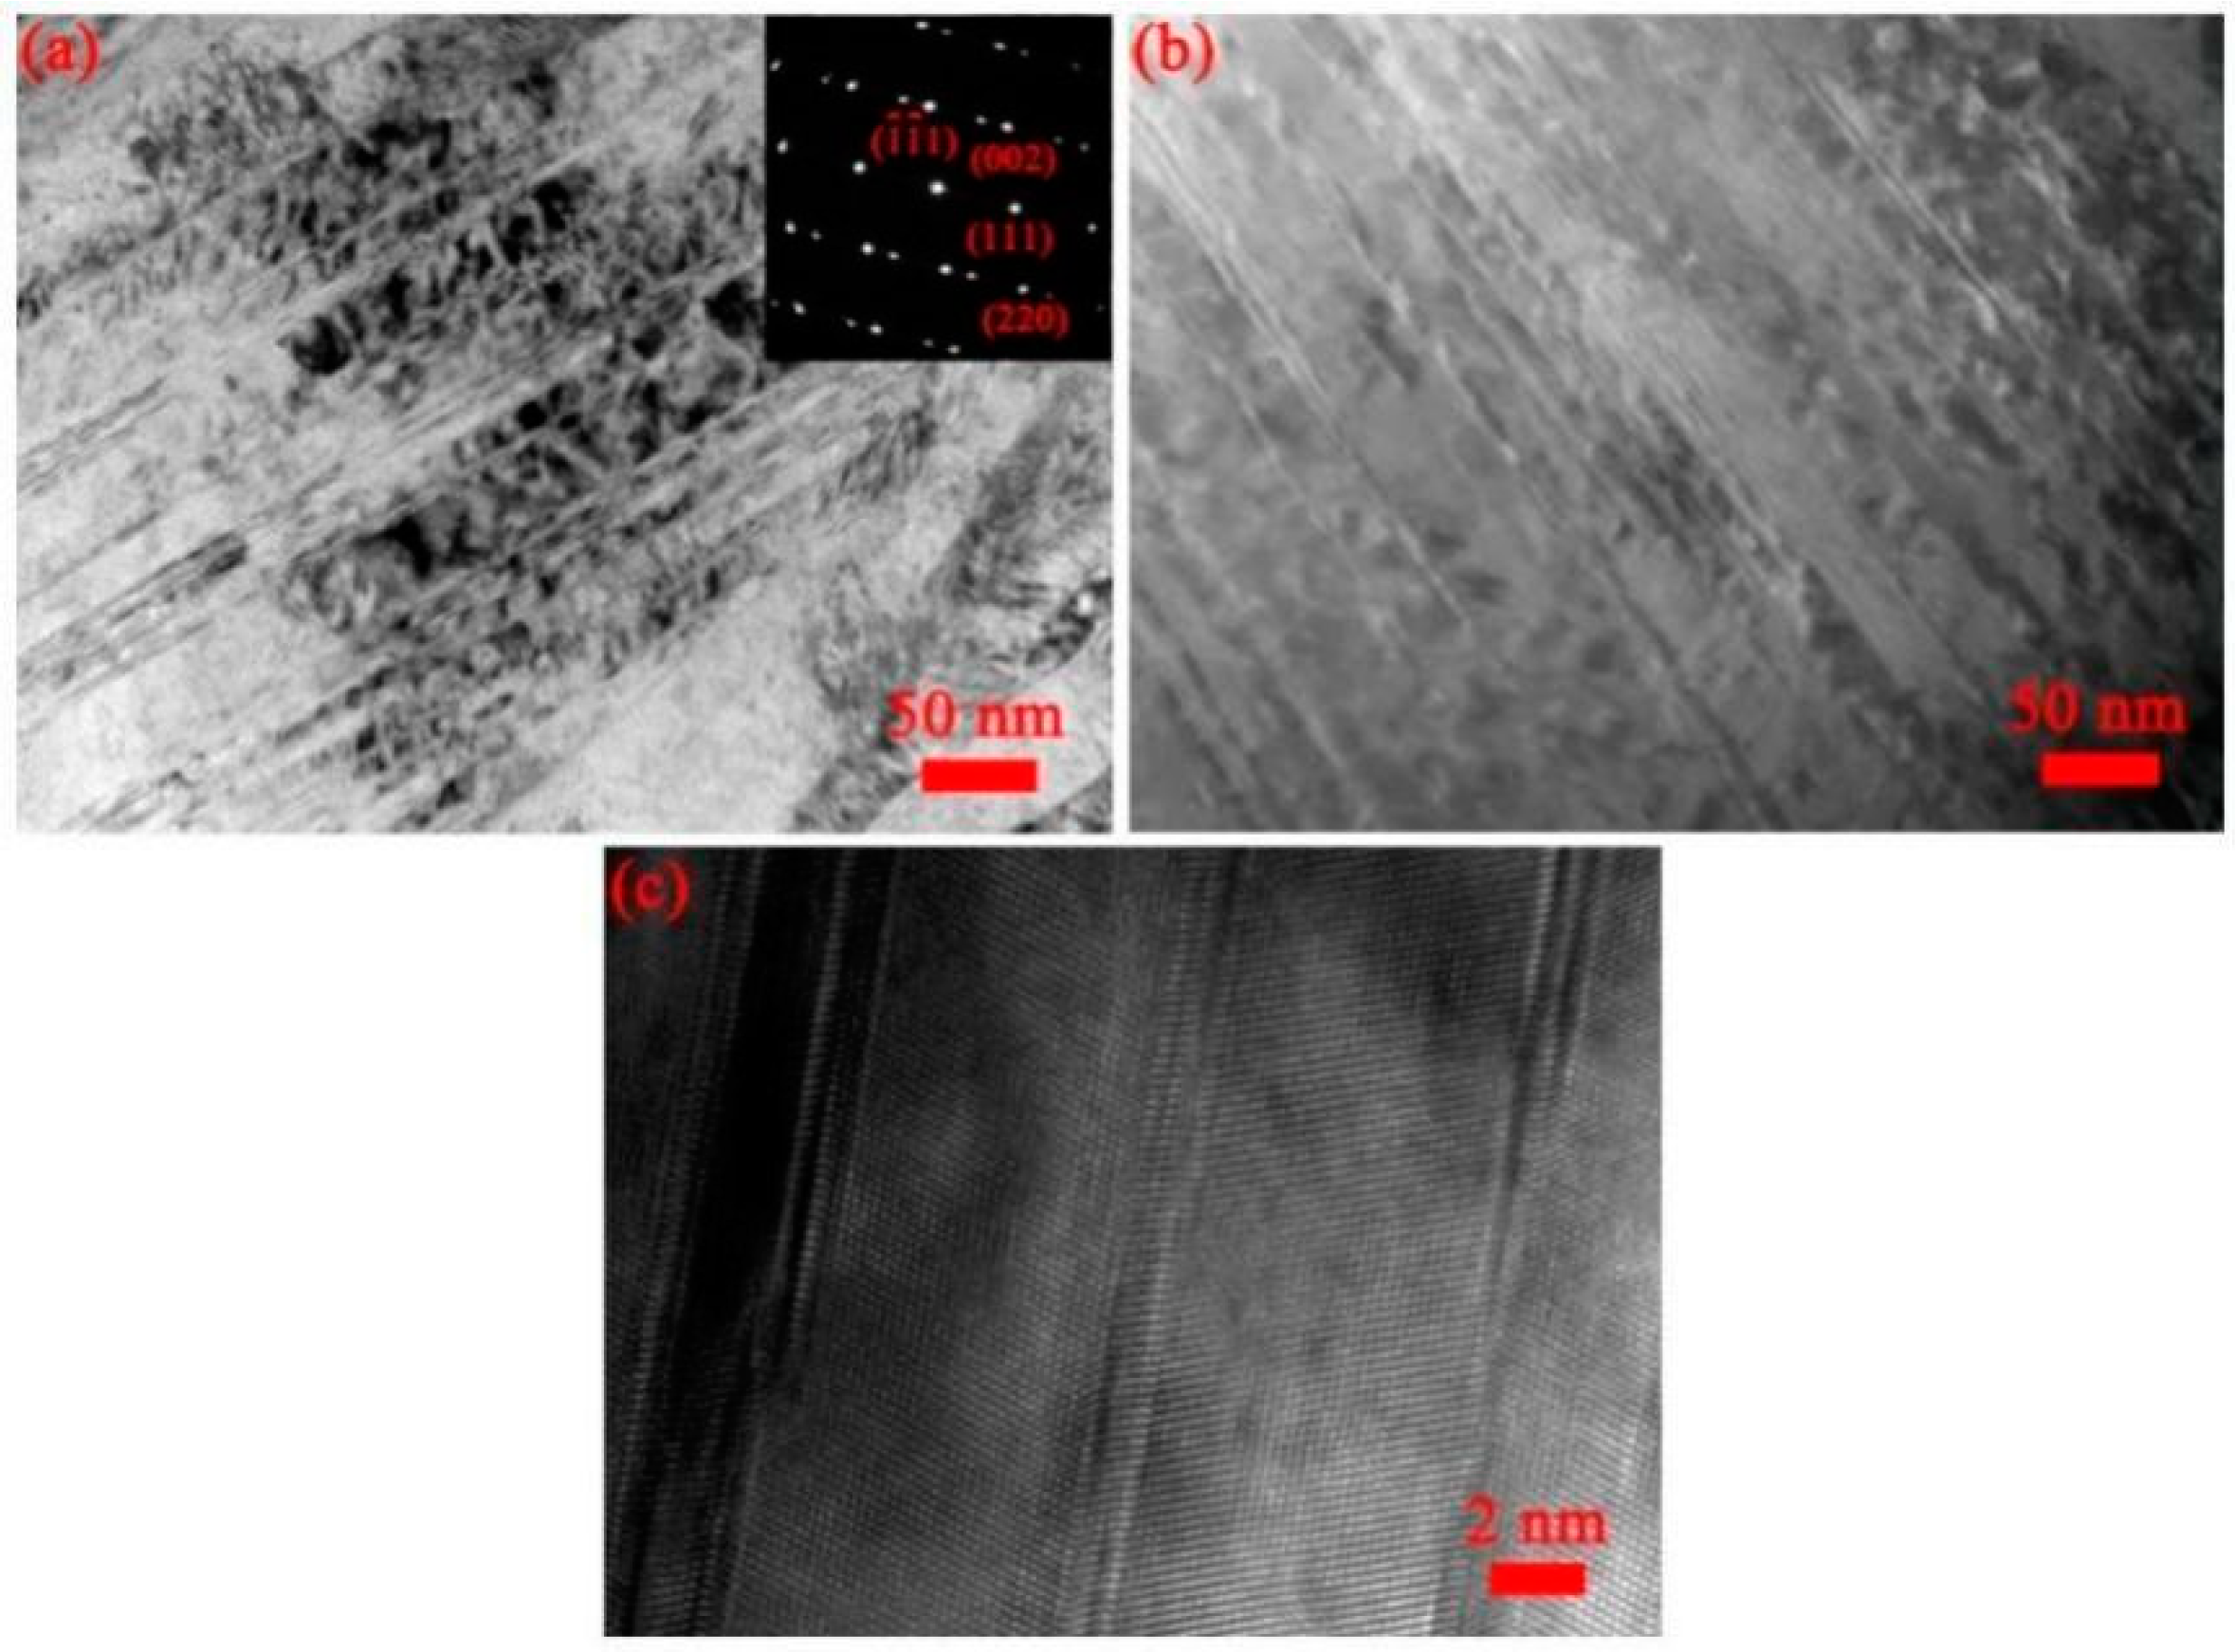
3.4. Transmission Electron Microscope Analysis

After shot peening with an intensity of 0.3 + 0.1 mmA, the metallographic diagram reveals that the sample surface exhibits conspicuous slip bands and fine crystal features. However, metallography alone was insufficient to determine the microstructure evolution of the samples. Therefore, high-resolution transmission electron microscopy (HRTEM) was utilized for detailed analysis of the sample structure in order to ascertain the effect of shot peening on material microstructure.
According to previous studies, because the stacking fault energy (18.3~30 mJ m−2) of the sample alloys was relatively low, dislocation slip and deformation twins occurred during shot peening, both of which contributed to grain refinement. According to prior research, the relatively low stacking fault energy (18.3~30 mJ m−2) of the sample alloys led to dislocation glide and deformation twins during shot peening, both of which contribute to grain refinement. Based on bright field transmission electron microscopy (TEM) analysis of the sample surface (Figure 7), it was evident that the material underwent significant surface slip. When combined with the pattern diffraction in the illustration, it can be observed that the slip plane of the sample was oriented along (111), accompanied by twinning phenomena. Moreover, according to the dark field TEM of the sample in Figure 6b, obvious deformation in twin beams and dislocation channels formed by dislocation stacking can be observed. In addition to dislocation, high-density dislocation channels, and shear bands, twin beams also exist in the matrix grains, forming T-M slats with alternating distribution of twins and matrix. Further HRTEM analysis of the sample surface (Figure 6) proved that these high-density dislocation channels were slip lines on the surface of face-centered cubic crystals. It is speculated that during the initial shot peening, the twins produced and subdivided the initial grain into thin slices in one direction. Next, secondary twins perpendicular to the former continued to subdivide the lamella into smaller sizes. With the accumulation of plastic strain, dislocation activity became dominant in the deformation process. Deformation-induced dislocations accumulated in small wafers and piled up to form perpendicular dislocations to the secondary twin. According to the modified Hall–Patch formula (16), we can know that dislocation strengthening and fine grain strengthening contribute significantly to the final strength of alloy samples [33,34]:
σ 0.2 = σ 0 + M α G b δ + K d s 1 / 2 + d τ 1 / 2
where σ0.2 represents the yield strength, σ0 denotes lattice resistance, δ signifies dislocation density, ds refers to slip bandwidth, dτ indicates twin width, and all other variables are constants.

4. Conclusions

In this chapter, the microstructure distribution of the shot peening layer in a high-entropy CoCrFeNiAlx alloy strengthened by different shot peening processes was studied in detail using XRD and TEM. The conclusion can be drawn that: (1) As shot peening intensity increases, the range of microdistortion variation on sample surfaces gradually reduces. Shot peening can reduce the surface roughness and enhance the fatigue strength and life of the sample while ensuring the fine crystallization and micro-distortion of the sample surface. (2) The result of the Rietveld full spectrum indicates that different shot peening processes lead to slippage of the crystal surface. The (111) crystal plane is difficult to slip, while the (220) crystal plane shows a maximum change with a value of 7.9 × 10⁻³. (3) During the impact of shot peening, the microstructure of the high-entropy CoCrFeNiAlx alloy shot peening layer the twins produced gradually subdivided the initial grain into smaller slices. With the accumulation of plastic strain, dislocation activity gradually became dominant in the deformation process. The deformation-induced dislocations gradually accumulated in small wafers and formed perpendicular dislocations to secondary twins.

Author Contributions

Conceptualization, X.L.; software, G.G. and J.X.; validation, X.L. and J.X.; formal analysis, J.X.; resources, C.J.; data curation, J.X.; writing—original draft, X.L.; writing—review and editing, C.J.; visualization, J.X.; supervision, G.G. and C.J.; project administration, C.J.; funding acquisition, C.J. All authors have read and agreed to the published version of the manuscript.

Funding

This work was supported by the Fundamental Research Funds for the Central Universities (Grant Nos. 2682022ZTPY003, 2682022CX021, 2682021GF023, 2682022ZTPY090, and 2682022ZK051).

Data Availability Statement

Not available.

Conflicts of Interest

The authors declare no conflict of interest.

References

  1. Bagherifard, S. Enhancing the Structural Performance of Lightweight Metals by Shot Peening. Adv. Eng. Mater. 2019, 21, 1801140. [Google Scholar] [CrossRef]
  2. Zhao, J.; Tang, J.; Zhou, W.; Jiang, T.; Liu, H.; Xing, B. Numerical Modeling and Experimental Verification of Residual Stress Distribution Evolution of 12Cr2Ni4A Steel Generated by Shot Peening. Surf. Coat. Technol. 2022, 43, 127993. [Google Scholar] [CrossRef]
  3. Kumar, P.; Mahobia, G.S.; Mandal, S.; Singh, V.; Chattopadhyay, K. Enhanced Corrosion Resistance of the Surface Modified Ti-13Nb-13Zr Alloy by Ultrasonic Shot Peening. Corros. Sci. 2021, 189, 109597. [Google Scholar] [CrossRef]
  4. Choi, J.W.; Kim, J.T.; Hong, S.H.; Park, H.J.; Jumaev, E.; Kim, K.B. Investigation of Correlation between the Microstructural Characteristics and Mechanical Properties of (CoCuFeNi)100-XAlx High Entropy Alloys. J. Alloys Compd. 2023, 933, 167679. [Google Scholar] [CrossRef]
  5. Tsai, M.T.; Huang, J.C.; Tsai, W.Y.; Chou, T.H.; Chen, C.F.; Li, T.H.; Jang, J.S.C. Effects of Ultrasonic Surface Mechanical Attrition Treatment on Microstructures and Mechanical Properties of High Entropy Alloys. Intermetallics 2018, 93, 113–121. [Google Scholar] [CrossRef]
  6. Hasan, M.N.; Liu, Y.F.; An, X.H.; Gu, J.; Song, M.; Cao, Y.; Li, Y.S.; Zhu, Y.T.; Liao, X.Z. Simultaneously Enhancing Strength and Ductility of a High-Entropy Alloy via Gradient Hierarchical Microstructures. Int. J. Plast. 2019, 123, 178–195. [Google Scholar] [CrossRef]
  7. Kim, M.J.; Kang, G.C.; Hong, S.H.; Park, H.J.; Mun, S.C.; Song, G.; Kim, K.B. Understanding Microstructure and Mechanical Properties of (AlTa0.76)XCoCrFeNi2.1 Eutectic High Entropy Alloys via Thermo-Physical Parameters. J. Mater. Sci. Technol. 2020, 57, 131–137. [Google Scholar] [CrossRef]
  8. Tong, Z.; Liu, H.; Jiao, J.; Zhou, W.; Yang, Y.; Ren, X. Microstructure, Microhardness and Residual Stress of Laser Additive Manufactured CoCrFeMnNi High-Entropy Alloy Subjected to Laser Shock Peening. J. Mater. Process. Technol. 2020, 285, 116806. [Google Scholar] [CrossRef]
  9. Yang, T.; Xia, S.; Liu, S.; Wang, C.; Liu, S.; Zhang, Y.; Xue, J.; Yan, S.; Wang, Y. Effects of AL Addition on Microstructure and Mechanical Properties of AlxCoCrFeNi High-Entropy Alloy. Mater. Sci. Eng. A 2015, 648, 15–22. [Google Scholar] [CrossRef]
  10. Lyu, P.; Gao, Q.; Peng, T.; Yuan, H.; Guan, Q.; Cai, J.; Liu, H.; Liu, X. Microstructure and Properties of CoCrFeNiAlx (x = 0.1, 0.5, 1) High-Entropy Alloys Enhanced by Laser Surface Remelting. Mater. Charact. 2022, 185, 111717. [Google Scholar] [CrossRef]
  11. Rao, J.C.; Diao, H.Y.; Ocelík, V.; Vainchtein, D.; Zhang, C.; Kuo, C.; Tang, Z.; Guo, W.; Poplawsky, J.D.; Zhou, Y.; et al. Secondary Phases in AlxCoCrFeNi High-Entropy Alloys: An in-Situ TEM Heating Study and Thermodynamic Appraisal. Acta Mater. 2017, 131, 206–220. [Google Scholar] [CrossRef] [Green Version]
  12. Cao, T.; Shang, J.; Zhao, J.; Cheng, C.; Wang, R.; Wang, H. The Influence of Al Elements on the Structure and the Creep Behavior of AlxCoCrFeNi High Entropy Alloys. Mater. Lett. 2016, 164, 344–347. [Google Scholar] [CrossRef]
  13. Wang, Z.; Gao, M.C.; Ma, S.G.; Yang, H.J.; Wang, Z.H.; Ziomek-Moroz, M.; Qiao, J.W. Effect of Cold Rolling on the Microstructure and Mechanical Properties of Al0.25CoCrFe1.25Ni1.25 High-Entropy Alloy. Mater. Sci. Eng. A 2015, 645, 163–169. [Google Scholar] [CrossRef]
  14. Kim, T.; Lee, H.; Jung, S.; Lee, J.H. A 3D FE Model with Plastic Shot for Evaluation of Equi-Biaxial Peening Residual Stress Due to Multi-Impacts. Surf. Coat. Technol. 2012, 206, 3125–3136. [Google Scholar] [CrossRef]
  15. Mahmoudi, A.H.; Jamali, A.M.; Salahi, F.; Khajeian, A. Effects of Water Jet Peening on Residual Stresses, Roughness, and Fatigue. Surf. Eng. 2021, 37, 972–981. [Google Scholar] [CrossRef]
  16. Weizhi, L.; Chuanhai, J.; Ji, V. Surface Layer Characteristics of TiB2/Al Composite by Stress Peening. Mater. Trans. 2009, 50, 837–840. [Google Scholar] [CrossRef] [Green Version]
  17. Hong, T.; Ooi, J.Y.; Shaw, B. A Numerical Simulation to Relate the Shot Peening Parameters to the Induced Residual Stresses. Eng. Fail. Anal. 2008, 15, 1097–1110. [Google Scholar] [CrossRef]
  18. Meo, M.; Vignjevic, R. Finite Element Analysis of Residual Stress Induced by Shot Peening Process. Adv. Eng. Softw. 2003, 34, 569–575. [Google Scholar] [CrossRef]
  19. Fu, P.; Jiang, C. Residual Stress Relaxation and Micro-Structural Development of the Surface Layer of 18CrNiMo7-6 Steel after Shot Peening during Isothermal Annealing. Mater. Des. 2014, 56, 1034–1038. [Google Scholar] [CrossRef]
  20. Turnbull, A.; Pitts, J.J.; Lord, J.D. Residual Stress Relaxation in Shot Peened High Strength Low Alloy Steel. Mater. Sci. Technol. 2008, 24, 327–334. [Google Scholar] [CrossRef]
  21. Gao, Y.K. Influence of Shot Peening on Tension-Tension Fatigue Properties in Ti-10V-2Fe-3Al Titanium Alloy. Zhongguo Youse Jinshu Xuebao/Chin. J. Nonferrous Met. 2004, 14, 60–63. [Google Scholar]
  22. Zhang, P.; Wang, S.; Lin, Z.; Yue, X.; Gao, Y.; Zhang, S.; Yang, H. Investigation on the Mechanism of Micro-Milling CoCrFeNiAlX High Entropy Alloys with End Milling Cutters. Vacuum 2023, 211, 11939. [Google Scholar] [CrossRef]
  23. Chen, L.; Xiong, X.; Tao, X.; Su, Y.; Qiao, L. Corrigendum to “Effect of Dislocation Cell Walls on Hydrogen Adsorption, Hydrogen Trapping and Hydrogen Embrittlement Resistance” [Corros. Sci. (2020) 108428]. Corros. Sci. 2020, 169, 108623. [Google Scholar] [CrossRef]
  24. Fan, H.; Wang, Q.; El-Awady, J.A.; Raabe, D.; Zaiser, M. Strain Rate Dependency of Dislocation Plasticity. Nat. Commun. 2021, 12, 1845. [Google Scholar] [CrossRef]
  25. Ma, A.; Roters, F.; Raabe, D. A Dislocation Density Based Constitutive Law for BCC Materials in Crystal Plasticity FEM. Comput. Mater. Sci. 2007, 39, 91–95. [Google Scholar] [CrossRef]
  26. Kumar, L.; Kumar, P.; Narayan, A.; Kar, M. Rietveld Analysis of XRD Patterns of Different Sizes of Nanocrystalline Cobalt Ferrite. Int. Nano Lett. 2013, 3, 8. [Google Scholar] [CrossRef] [Green Version]
  27. Srdić, V.V.; Winterer, M. Aluminum-Doped Zirconia Nanopowders: Chemical Vapor Synthesis and Structural Analysis by Rietveld Refinement of X-Ray Diffraction Data. Chem. Mater. 2003, 15, 2668–2674. [Google Scholar] [CrossRef]
  28. Young, R.A.; Wiles, D.B. Profile Shape Functions in Rietveld Refinements. J. Appl. Crystallogr. 1982, 15, 430–438. [Google Scholar] [CrossRef]
  29. Popa, N.C. The (Hkl) Dependence of Diffraction-Line Broadening Caused by Strain and Size for All Laue Groups in Rietveld Refinement. J. Appl. Crystallogr. 1998, 31, 176–180. [Google Scholar] [CrossRef]
  30. Murugesan, S.; Kuppusami, P.; Mohandas, E.; Vijayalakshmi, M. X-Ray Diffraction Rietveld Analysis of Cold Worked Austenitic Stainless Steel. Mater. Lett. 2012, 67, 173–176. [Google Scholar] [CrossRef]
  31. Hansen, N. Hall-Petch Relation and Boundary Strengthening. Scr. Mater. 2004, 51, 801–806. [Google Scholar] [CrossRef]
  32. Weertman, J.R. Hall-Petch Strengthening in Nanocrystalline Metals. Mater. Sci. Eng. A 1993, 166, 161–167. [Google Scholar] [CrossRef]
  33. Jiang, L.; Fu, H.; Zhang, H.; Xie, J. Physical Mechanism Interpretation of Polycrystalline Metals’ Yield Strength via a Data-Driven Method: A Novel Hall–Petch Relationship. Acta Mater. 2022, 231, 117868. [Google Scholar] [CrossRef]
  34. Klimova, M.; Zherebtsov, S.; Stepanov, N.; Salishchev, G.; Haase, C.; Molodov, D.A. Microstructure and Texture Evolution of a High Manganese TWIP Steel during Cryo-Rolling. Mater. Charact. 2017, 132, 20–30. [Google Scholar] [CrossRef]
Figure 1. XRD patterns of the samples with different shot peening treatments.
Metals 13 01441 g001
Figure 2. Fitted results of shot peened samples (111) by Pesudo–Voigt method: (a) 0.1 mmA, (b) 0.2 mmA, (c) 0.3 mmA and (d) 0.3 + 0.1 mmA.
Metals 13 01441 g002
Figure 3. XRD patterns of shot peened samples by Rietveld method: (a) 0.1 mmA, (b) 0.2 mmA, (c) 0.3, mmA and (d) 0.3 + 0.1 mmA.
Metals 13 01441 g003
Figure 4. SEM of the samples with different intensities of shot peening: (a) 0.1 mmA, (b) 0.2 mmA, (c) 0.3, mmA and (d) 0.3 + 0.1 mmA.
Metals 13 01441 g004
Figure 5. Metallographic microscope of the samples with different intensities of shot peening: (a) 0.1 mmA, (b) 0.2 mmA, (c) 0.3 mmA, and (d) 0.3 + 0.1 mmA.
Metals 13 01441 g005
Figure 6. Roughness of variously shot peening: (a) 0.1 mmA, (b) 0.2 mmA, (c) 0.3 mmA and (d) 0.3+0.1 mmA.
Metals 13 01441 g006
Figure 7. TEM bright field (a) and dark field (b) micrographs of the sample with 0.3 + 0.1 mmA shot peening, (c) HRTEM.
Metals 13 01441 g007
Table 1. Composition of high-entropy alloy prepared by vacuum melting (at.%).
SamplesFeCoCrNiMoAl
A025.722.7423.9923.234.340
A125.722.7423.9923.233.341
A225.722.7423.9923.232.342
A325.722.7423.9923.231.343
A425.722.7423.9923.2304
Table 2. Microstructure of variously shot peened samples (111) calculated by Voigt method.
(111)0.10.20.30.3 + 0.1
Crystal block size (nm)17.616.316.816.5
Microdistortion (10−3)6.06.26.56.3
Dislocation density (×1010 (m−2))4.14.34.94.6
Table 3. The values of R for variously shot peened samples.
Reliability Factor0.10.20.30.3 + 0.1
Rp1.491.431.661.5
Rwp1.961.892.281.97
Table 4. Domain size of variously shot peened samples by Rietveld method (unit: nm).
(hkl)0.10.20.30.3 + 0.1
(111)15.5915.8114.2814.48
(200)10.249.209.049.18
(220)12.199.756.677.30
Table 5. Microstrain of variously shot peened samples by Rietveld method (×10−3).
(hkl)0.10.20.30.3 + 0.1
(111)5.985.896.536.23
(200)7.918.818.978.56
(220)4.695.868.567.93
Table 6. The values of roughness for variously shot peened samples.
Heading0.10.20.30.3 + 0.1
Ra1.352.692.782.17
Rz7.1911.8712.2210.71
Disclaimer/Publisher’s Note: The statements, opinions and data contained in all publications are solely those of the individual author(s) and contributor(s) and not of MDPI and/or the editor(s). MDPI and/or the editor(s) disclaim responsibility for any injury to people or property resulting from any ideas, methods, instructions or products referred to in the content.

