Article

Hot Workability Investigation of an Fe-Al-Ta Alloy Using Deformation Processing Maps

1
Chair of Physical Metallurgy and Materials Technology, Brandenburg University of Technology Cottbus-Senftenberg, Platz der Deutschen Einheit 1, Konrad-Wachsmann-Allee 13, 03044 Cottbus, Germany
2
Access e.V., Intzestr. 5, 52072 Aachen, Germany
3
Helmholtz-Zentrum Berlin für Materialien und Energie GmbH, Hahn-Meitner-Platz 1, 14109 Berlin, Germany
*
Author to whom correspondence should be addressed.
Metals 2023, 13(7), 1195; https://doi.org/10.3390/met13071195
Submission received: 6 June 2023 / Revised: 22 June 2023 / Accepted: 26 June 2023 / Published: 27 June 2023
(This article belongs to the Special Issue Thermomechanical Treatment of Metals and Alloys)

Abstract

:
Fe-Al-Ta alloys are expected to replace high-alloyed steels in steam turbine blades. However, the mechanical properties of the forged blades are still not optimal due to limited grain refinement during hot forging and the coarse-grained microstructure inherited from the as-cast precursor. It is, therefore, essential to investigate the hot deformation behavior of the alloy to identify the optimum range for the deformation parameters leading to good hot workability with significant grain refinement. The hot deformation behavior and hot workability of an Fe-25Al-1.5Ta (at.%) alloy were investigated in the present work using constitutive modeling and the concept of processing maps. Uniaxial compression tests were conducted in a strain rate range from 0.0013 s−1 to 1 s−1 and in a temperature range from 900 °C to 1100 °C, where a disordered A2 α-(Fe, Al) matrix phase along with a C14-(Fe, Al)2Ta Laves phase were confirmed by X-ray diffraction. The flow stress–strain curves showed a broad maximum followed by a slight drop in stress until a steady state was reached. The optimum processing window for the studied alloy was located at 910–1060 °C/0.0013–0.005 s−1, where the efficiency of the power dissipation (η) and strain rate sensitivity (m) reached 50% and 0.33, respectively. The material underwent a combination of dynamic recovery and dynamic recrystallization over the whole tested deformation range. No flow instabilities were predicted based on Prasad’s flow instability criterion when deformation was performed up to a true strain of 0.5 and 0.8, indicating a high degree of hot workability of the studied alloy over the entire deformation range tested. The current study reveals a well-suited parameter range for the safe and efficient deformation of Fe-Al-Ta alloys, which may contribute to the optimization of the thermomechanical processing of this alloy.

1. Introduction

Iron aluminides are Fe-Al alloys with 20–50 at.% (all compositions are given in the text in atomic percent unless otherwise stated) Al, in which the matrix consists of a disordered bcc (Fe, Al) solid solution (A2) or an ordered intermetallic phases FeAl (B2) and Fe3Al (D03). Their features include excellent oxidation resistance, about 30% lower density than commercial superalloys, low manufacturing costs, and they can reduce the use of strategic elements, such as Ni, Cr, and Mo, in materials for structural applications [1]. Iron aluminide-based alloys may address a key challenge in the power generation industries by replacing heavy and rather expensive advanced steels with more creep-resistant and lightweight alloys in ultra-supercritical steam turbines [1,2]. Nonetheless, low strength and creep resistance at temperatures above 600 °C have limited their potential application [1].
Advanced iron aluminide alloys strengthened with ternary Laves phase precipitates based on (Fe, Al)2Ta have been revealed to be very promising to improve the high-temperature mechanical properties of iron aluminides. They can be considered potential candidates to possibly replace high-alloyed steels up to a service temperature of 650–800 °C, primarily because of their superior creep resistance and excellent oxidation resistance up to 800 °C [3,4,5,6]. Despite several investigations on microstructure formation and high-temperature oxidation and creep properties of Fe-Al-Ta alloys [4,5,7,8], their hot deformation behavior and dynamic restoration mechanisms have only been studied to a limited degree. In earlier studies by the author, the hot deformation behavior and microstructure evolution of Fe-25Al-1.5Ta alloys produced by spark plasma sintering (SPS) were investigated in the temperature range of 900–1100 °C, where a disordered A2 α-(Fe, Al) solid solution phase was stable along with the C14 Laves phase [9,10,11]. The presence of a fine-grained (average size of 7 μm) and equiaxed microstructure at a hot working temperature was reported to improve workability and led to a wide processing window without flow instability over the entire deformation range tested (900–1100 °C/0.0013–1 s−1). The optimum processing domain for the SPSed Fe-25Al-1.5Ta alloy was located at 1050–1100 °C/0.0013–0.01 s−1, with a power dissipation efficiency of between 40 to 50%, where the material underwent dynamic recrystallization (DRX). Whereas, dynamic recovery (DRV) was the major softening mechanism that occurred at low temperature and high strain rate domains. The hot deformation behavior of the SPSed Fe-25Al-1.5Ta alloy was also investigated in the temperature range of 800–850 °C, where an ordered B2-FeAl and C14 Laves phase coexist [10,11]. The processing map predicted a domain of flow instability, resulting from cracking, in the range at lower temperatures and higher strain rates (800 °C/1 s−1).
Laser powder bed fusion (LPBF) additive manufacturing of Fe-25Al-1.5Ta alloys was also investigated [12], which could open up new possibilities to combine the beneficial properties of precipitation-strengthened Fe-Al-Ta iron aluminides with the geometric complexity of L-PBF to produce lightweight high-temperature resistant model alloys for turbine blades. Hot compression revealed a practical thermomechanical post-processing treatment for Fe-Al-Ta iron aluminides built by LPBF [13]. The hot working refined the epitaxially elongated grains in the LPBF builds and reduced the porosity. The microstructure and hot deformation behavior of LPBF and conventionally cast Fe-25Al-1.5Ta alloys were compared [14]. The LPBF builds recrystallized in a similar way to the as-cast samples during hot deformation. Nevertheless, the LPBF-produced samples were subject to less work hardening, requiring less deformation resistance and, therefore, could be formed by a lower deformation force.
The properties of the Fe-Al-Ta alloys at elevated temperatures, such as the flow behaviors, deformation mechanisms, and microstructural changes, have not been sufficiently investigated. Nonetheless, they are expected to replace high-alloyed steels in critical components. Steam turbine blades have been successfully formed by conventional forging from as-cast Fe-25Al-2Ta ingots. However, the mechanical properties of the forged blades are still not optimal due to the coarse-grained (100–1000 μm) microstructure inherited from the as-cast precursor [15]. If Fe-Al-Ta alloys are to be made available for commercial applications in the future, they will be produced by thermomechanical processing at high temperatures like other commercially produced metals and alloys. Thermomechanical processing can control not only the shapes of the metal products but also their microstructures and textures, by adjusting the processing parameters to achieve tailored mechanical properties for specific applications. It is, therefore, essential to investigate the behavior and microstructural evolution of Fe-Al-Ta alloys during thermomechanical processing at hot deformation temperatures. The present study aims to investigate the hot deformation behavior and the corresponding deformation mechanisms of an Fe-25Al-1.5Ta cast alloy, by using processing maps during hot compression at a temperature range of 900–1100 °C, where a disordered A2 α-(Fe, Al) and C14-(Fe, Al)2Ta Laves phases coexist. The microstructure at room temperature is mainly composed of equiaxed grains decorated with C14 precipitates over the entire cylindrical cross-section. A series of isothermal compression tests at high temperatures are conducted under different strain rates up to a true strain of 0.8, and the dependence of the flow stress on the temperature and strain rate are studied. The constitutive flow behavior is modeled based on the hyperbolic sinusoidal Arrhenius-type equations, and the mathematical relations are derived to describe the flow behavior and the correlation between the characteristic parameters and the Zener–Hollomon (Z) parameter. The critical stress values for the onset of dynamic recrystallization (DRX) are determined by locating the inflection points on the Kocks–Mecking plots. Processing maps based on a dynamic materials model (DMM) are constructed at different strains to evaluate the hot workability and recognize the safe and unsafe processing domains and active deformation mechanisms.
The present study includes the phase identification results at different deformation temperatures and detailed microstructural characterization after deformation and considers hot deformation processing maps at different strains compared to existing research [10].

2. Materials and Methods

2.1. Specimen Manufacturing

Ingots of Fe-25Al-1.5Ta (at.%) alloy with a diameter of 30 mm and a length of 140 mm were produced by centrifugal investment casting from an Fe-20wt%Ta master alloy and Fe and Al elements with 99.93 wt% and 99.996 wt% purity, respectively, by Access e.V. Aachen, Germany. Casting was performed using a Linn Supercast Device (Linn High Therm GmbH, Hirschbach, Germany), with 1.8 kg of melt at a temperature of 1550 °C using an Al2O3 preheated shell mold and crucible under a vacuum of 0.1 mbar. Wet chemical analysis revealed an 80.19Fe-19.64Ta master alloy with only 0.17 wt% of impurities. Energy dispersive X-ray spectroscopy (EDX) analysis of the chemical composition of the cast ingots found an average content in the constituent elements of 25.24 at% for Al, 1.51 at% for Ta, and 73.26 at% for Fe. A Zeiss optical microscope (OM) image of a specimen prepared and etched according to [16] and a BSE-SEM micrograph are shown in Figure 1a,b. The microstructure is comprised of equiaxed grains decorated with C14 precipitates over the cylindrical cross-section. For more details on the microstructure of the as-cast material, readers are referred to [10].

2.2. Phase Identification

For temperature-dependent phase identification, a Bruker D8 Advance X-ray diffractometer was applied (X-ray CoreLab, Helmholtz-Zentrum Berlin, Berlin, Germany), using Cu-Kα radiation (λ = 0.15418 nm), an angular range of 15–70° 2θ, and a step size of 0.05°. The diffractometer was equipped with an Anton Paar HTK 1200N (Anton Paar ProveTec GmbH, Blankenfelde-Mahlow, Germany) high-temperature oven chamber, with a corundum sample carrier and Pt/Rh thermocouple. Measurements were carried out at sample temperatures of 900 °C, 1000 °C, and 1100 °C under a vacuum of 9.4 × 10⁻³ mbar.

2.3. Hot Compression Tests

Cylindrical specimens with a diameter of 5 mm and a height of 8 mm were cut from the cast ingot using an electric discharge wire-cutting machine. Lab-scale isothermal compression tests were conducted on a DIL805A/D/T deformation dilatometer under an Ar atmosphere. The specimens were heated to the deformation temperature with an induction heating system at a rate of 10 K/s and kept isothermal for 3 min to homogenize the temperature within the specimens before compression. The specimens were compressed in the temperature range between 900 °C to 1100 °C, where the disordered A2 and C14 Laves phases are stable (the as-cast Fe-25Al-1.5Ta alloy showed a B2-to-A2 order–disorder transition at around 840 °C [10]), with strain rates from 0.0013 s−1 to 1 s−1 up to a true strain of 0.8. The deformed specimens were cooled immediately after deformation to preserve the high-temperature microstructures.

2.4. Microstructure Characterization

Metallographic examinations were carried out on specimens sectioned parallel to the loading direction. The sections were prepared in accordance with the applicable standard procedures. The microstructures of the starting and deformed specimens were characterized by a scanning electron microscope (SEM) TESCAN MIRA II (Brno, Czech Republic), equipped with an energy-dispersive X-ray spectrometer (Aztec EDX system, Oxford Instruments, Abingdon, UK), and high-resolution electron backscatter diffraction (Aztec EBSD system, Oxford Instruments, UK) detectors. All the observations were carried out in the center of the deformed specimens.

2.5. Strain Rate Sensitivity Map

The relationship between the true stress and the true strain rate in the logarithmic scale can be expressed by a 3-order polynomial fit using the following equation:
l o g σ = a + b l o g ε ˙ + c ( l o g ε ˙ ) 2 + d l o g ε ˙ 3
where a, b, c, and d are material parameters depending on the temperature. By forming partial differentials on both sides of Equation (1), the strain rate sensitivity, m, can be formulated by:
m = l o g σ l o g ε ˙ = b + 2 c   l o g ε ˙ + 3 d   ( log ε ˙ ) 2
The 3D variation of m as a function of T and ε ˙ is plotted, and the possible correlation between the variation of m and the microstructure evolution during hot deformation is discussed.

2.6. Dynamic Materials Model

The concept of processing maps, based on the principles of the dynamic materials model (DMM), was first proposed by Prasad [17] to model the hot forging behavior of a Ti-6242 alloy. The strain rate sensitivity (m), activation energy (Q), the efficiency of power dissipation (η), and instability maps are used to evaluate the hot workability of the material in question. The DMM provides a physical interpretation of the strain rate sensitivity of the flow stress, m, as a power-partitioning factor between the heat generation during the plastic flow and the microstructural change.
A processing map can predict either ‘safe’ or ‘unsafe’ hot deformation domains for a given material. Dynamic recovery (DRV), dynamic recrystallization (DRX), and superplasticity are the safe mechanisms. In contrast, flow localization, adiabatic heating, dynamic strain aging, void formation, and cracking are damage mechanisms leading to flow instability [18]. A processing map is built by superimposing a power dissipation map and an instability map. At a given temperature in the hot working regime, the externally applied power is consumed via two major paths: heat generation due to the plastic flow and dissipation due to microstructural changes. The instantaneously dissipated total power is determined by the following:
P = 0 ε ¯ ˙ σ ¯ . d ε ¯ ˙ + 0 σ ¯ ε ¯ ˙ .   d σ ¯ = G + J
where σ ¯ and ε ¯ ˙ are the effective stress and the effective strain rate, respectively. The first and second integrals are called G (content) and J (co-content) and represent the power dissipation through plastic deformation and microstructural dissipation, respectively. The relative partitioning of power between the heat generation and microstructural transitions is defined by the strain rate sensitivity (of flow stress), m, as follows:
m = d J d G = ε ¯ ˙   d σ ¯ σ ¯ d ε ¯ ˙ = d   l n σ ¯ d   l n ε ¯ ˙
The efficiency of the power dissipation (η) with respect to a linear dissipator (m = 1) is defined by:
J / P J / P l i n e a r = m / m + 1 1 / 2 = 2 m m + 1 η
A power dissipation map displays the 3D variation of η as a function of the temperature and strain rate.
Instability maps are developed based on a continuum instability criterion derived from the extremum principles of irreversible thermodynamics when applied to the continuum mechanics of a large plastic flow, as proposed by Ziegler [19]. The instability criterion is given by the dimensionless parameter ξ, as follows:
ξ ε ¯ ˙ = ln ( m / m + 1 ) l n ε ˙ + m 0
A flow instability map represents the variation in the dimensionless instability parameter, ξ, with the deformation temperature and strain rate. The parameter ξ is calculated by substituting Equation (2) with Equation (6) as follows:
ξ ε ˙ = 2 c + 6 d   l o g ε ˙ m m + 1   l n ε ˙ + m
The temperature and strain rate regime with negative ξ values results in flow instability, which should be avoided during hot deformation operations. In contrast, the temperature and strain rate condition where the efficiency of the power dissipation takes its maximum without causing flow instability is considered the optimum processing window for hot working. Based on the results obtained from the microstructural investigations, the deformation mechanisms are characterized and correlated with different regions of the processing maps.

3. Results

3.1. Phase Constituents at Deformation Temperatures

The XRD pattern for the studied alloy at 900 °C, 1000 °C, and 1100 °C, shown in Figure 2, confirms a phase mixture of A2 α-(Fe, Al) and C14-(Fe, Al)2Ta in the material at each deformation temperature. The differential scanning calorimetry (DSC) indicated the B2-order to A2-disorder transition temperature to be around 840 °C for the as-cast Fe-25Al-1.5Ta alloy [10]. Therefore, it is confirmed that the deformation in the selected temperature range of 900–1100 °C was performed in a mixture phase field composed of A2 and C14 Laves phases. Earlier investigations revealed that the C14 precipitations mainly decorated the grain boundaries of the Fe-Al matrix, as also confirmed in Figure 1b [9,10].

3.2. Flow Stress–Strain Behavior and Kocks–Mecking Plots

Figure 3 shows the true strain–true stress curves for the Fe-25Al-1.5Ta samples hot compressed to a true strain of 0.8 at different temperatures and strain rates. The flow stress decreases with the decreasing strain rate. None of the curves show an obviously flat shape from the maximum stress associated with the DRV. Except for 900 °C/1 s−1, the flow curves exhibit a broad flow stress peak followed by a slight drop. This shape is typical in the occurrence of the DRX in conventional BCC metals, such as α-iron, where a significant stress drop in the flow stress–strain curves was not observed despite the occurrence of the DRX [20,21]. For deformation with a higher strain rate of 1 s−1 at 900 °C, the curve shows a distinct initial peak in stress followed by a drop in stress, which is pretty similar to the typical curve for the DRX of FCC metals and alloys [22].
To determine the critical stress for the initiation of the DRX, the inflection point on the Kocks–Mecking (work-hardening rate, θ = /, versus flow stress, σ) plots were located using the so-called second-derivative criterion [23]. A method proposed by [24] was used for fitting a 3rd-order polynomial to the θ-σ curves up to the peak stress. Figure 4a shows exemplarily the θ-σ curves for the Fe-25Al-1.5Ta samples hot compressed at 1000 °C up to a true strain of 0.8, with different strain rates. The curves exhibit an inflection point, which indicates the critical stress for the onset of the DRX. Figure 4b illustrates the relationship between the peak stress and the critical stress values for the onset of the DRX for all the deformed samples, providing a relationship of σc/σp = 0.90 (σp and σc denote peak stress and critical stress, respectively).

3.3. Kinetic Analysis of the Flow Behavior and the Constitutive Equations

A constitutive equation presents the functional dependence of the flow stress on the hot deformation parameters, including the strain, strain rate, and temperature. When a material undergoes deformation at elevated temperatures, the relationship between the flow stress and processing parameters is generally expressed by the classical hyperbolic function proposed by Sellars and Tegart [25]:
ε ˙ = A   sin h α σ n exp Q R T
where ε ˙ is the strain rate (s−1), σ is the steady-state stress (MPa), Q is the apparent activation energy of the hot deformation (kJ·mol−1), T is the absolute deformation temperature (K), R is the universal gas constant (8.314 J·mol−1·K−1), n is the stress component, and A and α are material constants. By taking the natural logarithm from Equation (8), Q can be obtained by:
Q = R ·   l n ε ˙   l n sinh α σ T ·     l n sinh α σ   1 / T ε ˙
The material constant α is provided by:
α = β n 1 = l n ε ˙ / σ T l n ε ˙ / l n σ T
The relationships between the σ, lnσ, and ln ε ˙ at a true strain of 0.8 are plotted in Figure 5. The slope in the plots obtained by linear regression provided an average value of 4.19 for n1 and 0.08 for β. Subsequently, the constant α is calculated as 0.019 according to Equation (10).
The plots for (ln ε ˙ − ln[sinh(ασ)]) and (ln[sinh(ασ)] − 1/T) at a true strain of 0.8 are plotted in Figure 6a,b. The obtained average slopes in the plots provide an average of 385 kJ·mol−1 for Q at a strain of 0.8. This value is comparatively higher than that of Q obtained for the SPSed Fe-25Al-1.5Ta alloy in the disordered A2 regime (436 kJ·mol−1 [9]), indicating that the studied as-cast material is less resistant to deformation than the SPSed material.
A temperature-compensated strain rate, known as the Zener–Hollomon parameter (Z), is usually used to show the combined effect of the deformation temperature and strain rate on the deformation process. Z is provided by:
Z = ε ˙ exp Q R T = A sinh α σ n
The obtained average Q value was used to calculate Z using Equation (11). In Figure 6c, the dependence of lnZ on ln[sinh(ασ)] at a true strain of 0.8 is plotted. The stress peak is sensitive to the deformation variables, and the peak stress value is influenced by Z. Through linear fitting, the constants of n and A in Equation (11) are calculated as 2.72 and 1.13 × 10¹⁴, respectively. The constant α was already calculated as 0.019 by Equation (10). The constitutive equation for the hot deformation of the studied Fe-25Al-1.5Ta alloy associated with steady-state stress can be formulated as follows:
σ = 1 0.019   l n Z 1.13 × 10 14 1 2.72 + Z 1.13 × 10 14 2 2.72 + 1 1 2
The dependence of the characteristic stress and strain values on the deformation parameters can be expressed using the dimensionless parameter Z/A [26]. Figure 7 depicts the given parameters as a function of Z/A, and the corresponding equations derived from the linear fitting are listed in Table 1.

4. Processing Maps

4.1. Activation Energy of Hot Deformation Map

Figure 8a exhibits the dependence of Q on the deformation parameters at a true strain of 0.8. The Q varies between 255 and 590 kJ·mol−1 over the deformation range tested, with an average value of 385 kJ·mol−1. The lowest Q is obtained when deformation is performed at the lowest temperature and the lowest strain rate, 900 °C/0.0013 s−1. In contrast, the peak value of Q is achieved at 1100 °C/1 s−1 at a true strain of 0.8.

4.2. Strain Rate Sensitivity Map

A strain rate sensitivity (m) map for the studied Fe-25Al-1.5Ta alloy deformed in the (A2 + C14)- phase field at a true strain of 0.8 is displayed in Figure 8b. The values of m vary between 0.16 to 0.33 for the tested deformation range. Domains with the highest m values are located where the deformation is conducted at 1000 °C/0.0013 s−1. In contrast, the lowest m values are achieved in the lowest temperature and the highest strain rate region (high Z conditions). Importantly, regions with negative m values corresponding to several flow instability mechanisms, including flow localization, shear band formation, dynamic strain aging, and cracking [17], are not observed at a true strain of 0.8.

4.3. Processing Map

The iso-contour processing maps constructed for the Fe-25Al-1.5Ta alloy at a true strain of 0.2, 0.5, and 0.8, encompassing the strain rate and temperature ranges, are shown in Figure 9a–c, respectively. The solid and dash contour numbers indicate the efficiency of the power dissipation in percent and the instability parameter, respectively. The processing maps represent different regions; the stable flow regions with high efficiency are highlighted in yellow and are denoted as D1, D2, and D3, as well as a region with low efficiency, including flow instability hatched and denoted as S in (a). The main characteristics of each domain are summarized as follows:
D1—The optimum (most efficient) processing window where deformation is conducted at 1000–1100 °C/0.0013–0.004 s−1 up to a true strain of 0.2. The power dissipation efficiency and the strain rate sensitivity parameters range from 45 to 53% and 0.32 to 0.35, respectively.
S1—The flow instability domain occurs at 900–928 °C/0.45–1 s−1/0.2, where the instability parameter (ξ) is −0.06. The power dissipation efficiency and the strain rate sensitivity are as low as 18% and 0.1, respectively. The flow instability domain was not observed when deformed to a true strain of 0.5 and 0.8.
D2—The optimum processing window where deformation occurs at 960–1100 °C/0.0013–0.005 s−1 up to a true strain of 0.5. The power dissipation efficiency and the strain rate sensitivity parameter vary from 46 to 50% and 0.28 to 0.33, respectively.
D3—The optimum processing window for deformation up to a true strain of 0.8 in the range of 910–1060 °C/0.0013–0.005 s−1. The power dissipation efficiency and the strain rate sensitivity vary from 45 to 50% and 0.29 to 0.33, respectively.

5. Discussion

The deformation temperature and strain rate affect the flow stress behavior of the studied Fe-25Al-1.5Ta alloy. The flow stress decreases with the decreasing strain rate and increasing temperature. None of the curves show an obviously flat shape from the maximum stress associated with the DRV. Except for 900 °C/1 s−1, the flow curves exhibit a broad flow stress peak followed by a slight drop. This shape is typical in the occurrence of the DRX in the BCC α-iron, where a significant drop in stress was not observed in the flow stress–strain curves despite the occurrence of the DRX [20,21]. When deformation occurs with a higher strain rate of 1 s−1 at 900 °C, the flow curve shows an initial stress peak followed by a drop in stress, typical of the DRX in FCC metals and alloys [22].
The processing maps in Figure 9 reveal that the most efficient domains occur during deformation with a low strain rate (0.0013–0.005 s−1), over the entire deformation temperature range investigated. The peak efficiency of 53% occurring at 1100 °C/0.0013 s−1 at a strain of 0.2 and 50% occurring at 1100 °C/0.0013 s−1 and 1000 °C/0.0013 s−1, respectively, for the strains at 0.5 and 0.8 may be attributed to the occurrence of the DRX. To identify the major restoration mechanism(s), the microstructure of the specimens deformed up to a true strain of 0.8 within the optimum processing window for D3 was characterized by SEM.

5.1. Characterization of the Deformed Specimens

Figure 10a–c shows the OM and SEM images of the longitudinal cross-sections of the Fe-25Al-1.5Ta specimens compressed up to a true strain of 0.8 at 1000 °C, with a strain rate of 0.0013 s−1 (corresponding to the most efficient deformation condition within the optimum processing window for D3). To investigate the dependence of the microstructure on the strain rate, the microstructure of a sample deformed under the same conditions but with a higher strain rate of 1 s−1 is also presented in Figure 9d–f. The material was subjected to little or even no deformation in the areas close to the forging dies (known as the dead metal zone). In contrast, deformation was localized mainly in the central region of the specimens, characterized as flat, heavily deformed grains, elongated perpendicular to the compression axis (CA), as shown in Figure 10a,b.
No cracks are visible in the deformed specimens, suggesting a high degree of workability in the studied alloy. Figure 10b,c shows the SEM backscatter electron images of the Fe-25Al-1.5Ta specimen deformed at 1000 °C/0.0013 s−1. The deformed grains are fragmented into subregions with a continuous variation in the BSE contrast, indicating the annihilation of dislocations and their rearrangement into substructures (DRV). In addition to the substructures within the deformed grains, some small equiaxed grains are visible near the original grain boundaries, indicated by the arrows in Figure 10c. These small grains are more pronounced in the specimen deformed at a lower strain rate of 0.0013 s−1, as seen in (f). An increase in the fraction and the size of the small grains with the decreasing strain rate indicates that these grains were recrystallized dynamically during the hot deformation. It should be mentioned that the potential role of the Laves phase precipitates decorating the original grain boundaries in accelerating or retarding the DRX will be published elsewhere and is not discussed in the current paper.

5.2. Flow Softening Mechanisms

The underlying deformation mechanisms involved in the deformation region D3 in the processing map are discussed below:
D3: 910–1060 °C/0.0013–0.005 s−1—A stable flow region with the highest efficiency where the power dissipation efficiency ranges from 45% to 50%. At 1000 °C/0.0013 s−1, the highest power dissipation efficiency (η ≈ 50%) and strain rate sensitivity (m = 0.33) are reached. These values are generally considered for the DRX to be the dominant restoration process for a wide range of metallic materials [18]. However, the SEM micrographs for the sample deformed at 1000 °C/0.0013 s−1 show that the deformed grains are fragmented into subregions with a continuous variation in the BSE contrast, indicating the annihilation of dislocations and their rearrangement into substructures (DRV). In addition to the substructures, some small grains are visible near pre-existing grain boundaries. The fraction and the size of the fine grains increased with the decreasing strain rate, which indicates that those grains were likely recrystallized dynamically during deformation. Therefore, a combination of DRV and DRX occurs in the samples deformed within the D3 domain.

5.3. Flow Instability Mechanism

Over the whole deformation range investigated in the current study, no instability domains were predicted based on Prasad’s flow instability criterion when deformation was conducted up to a true strain of 0.5 and 0.8. The safe flow behavior without instability suggests a high degree of hot workability in the studied alloy at the deformation range of 900–1100 °C/0.0013–1 s−1. This result agrees with the literature reporting a stable flow behavior during deformation at 900–1100 °C for the binary Fe3Al and ternary Fe3Al-Ta alloys [9,27].
When deformation is performed up to a lower true strain of 0.2, an instability domain appears in the processing map, denoted as S in Figure 9a. The flow instability domain occurs at 900–928 °C/0.45–1 s−1, where the instability parameter (ξ) is negative (−0.06). The values for the power dissipation efficiency and the strain rate sensitivity parameter are as low as 18% and 0.1, respectively. The flow instability was rarely due to cracking, as the power dissipation efficiency corresponding to the cracking process is generally high because the conversion of the deformation energy into surface energy is highly efficient. In addition, the specimens deformed under the same conditions up to higher strains of 0.5 and 0.8 (Figure 10a,b) did not reveal cracks. At low temperatures and high strain rates, adiabatic shear bands [28] or flow localization [29,30,31] are likely to form, leading to flow instability in the processing maps.
It is noteworthy that the instability regime occurs under high Z conditions (see Equation (11)), whereas the optimum processing domains for D1, D2, and D3 supporting stable flow occur under low Z conditions. Under low Z conditions, sufficient time is available for dislocation motion, and deformation heating is avoided at low strain rates [32]. In contrast, flow localization occurs under high Z conditions because adiabatic heat cannot be efficiently dissipated in a short time during high strain rate deformation.

6. Conclusions

The hot deformation behavior and restoration processes for an Fe-25Al-1.5Ta alloy produced by centrifugal investment casting were investigated using hot-compression tests with strain rates ranging from 0.0013 s−1 to 1 s−1 at temperatures between 900 and 1100 °C, where the disordered A2 α-(Fe, Al) and the C14-(Fe, Al)2Ta Laves phase coexisted. Based on the flow stress–strain behaviors and microstructural observations, the main conclusions can be summarized as follows:
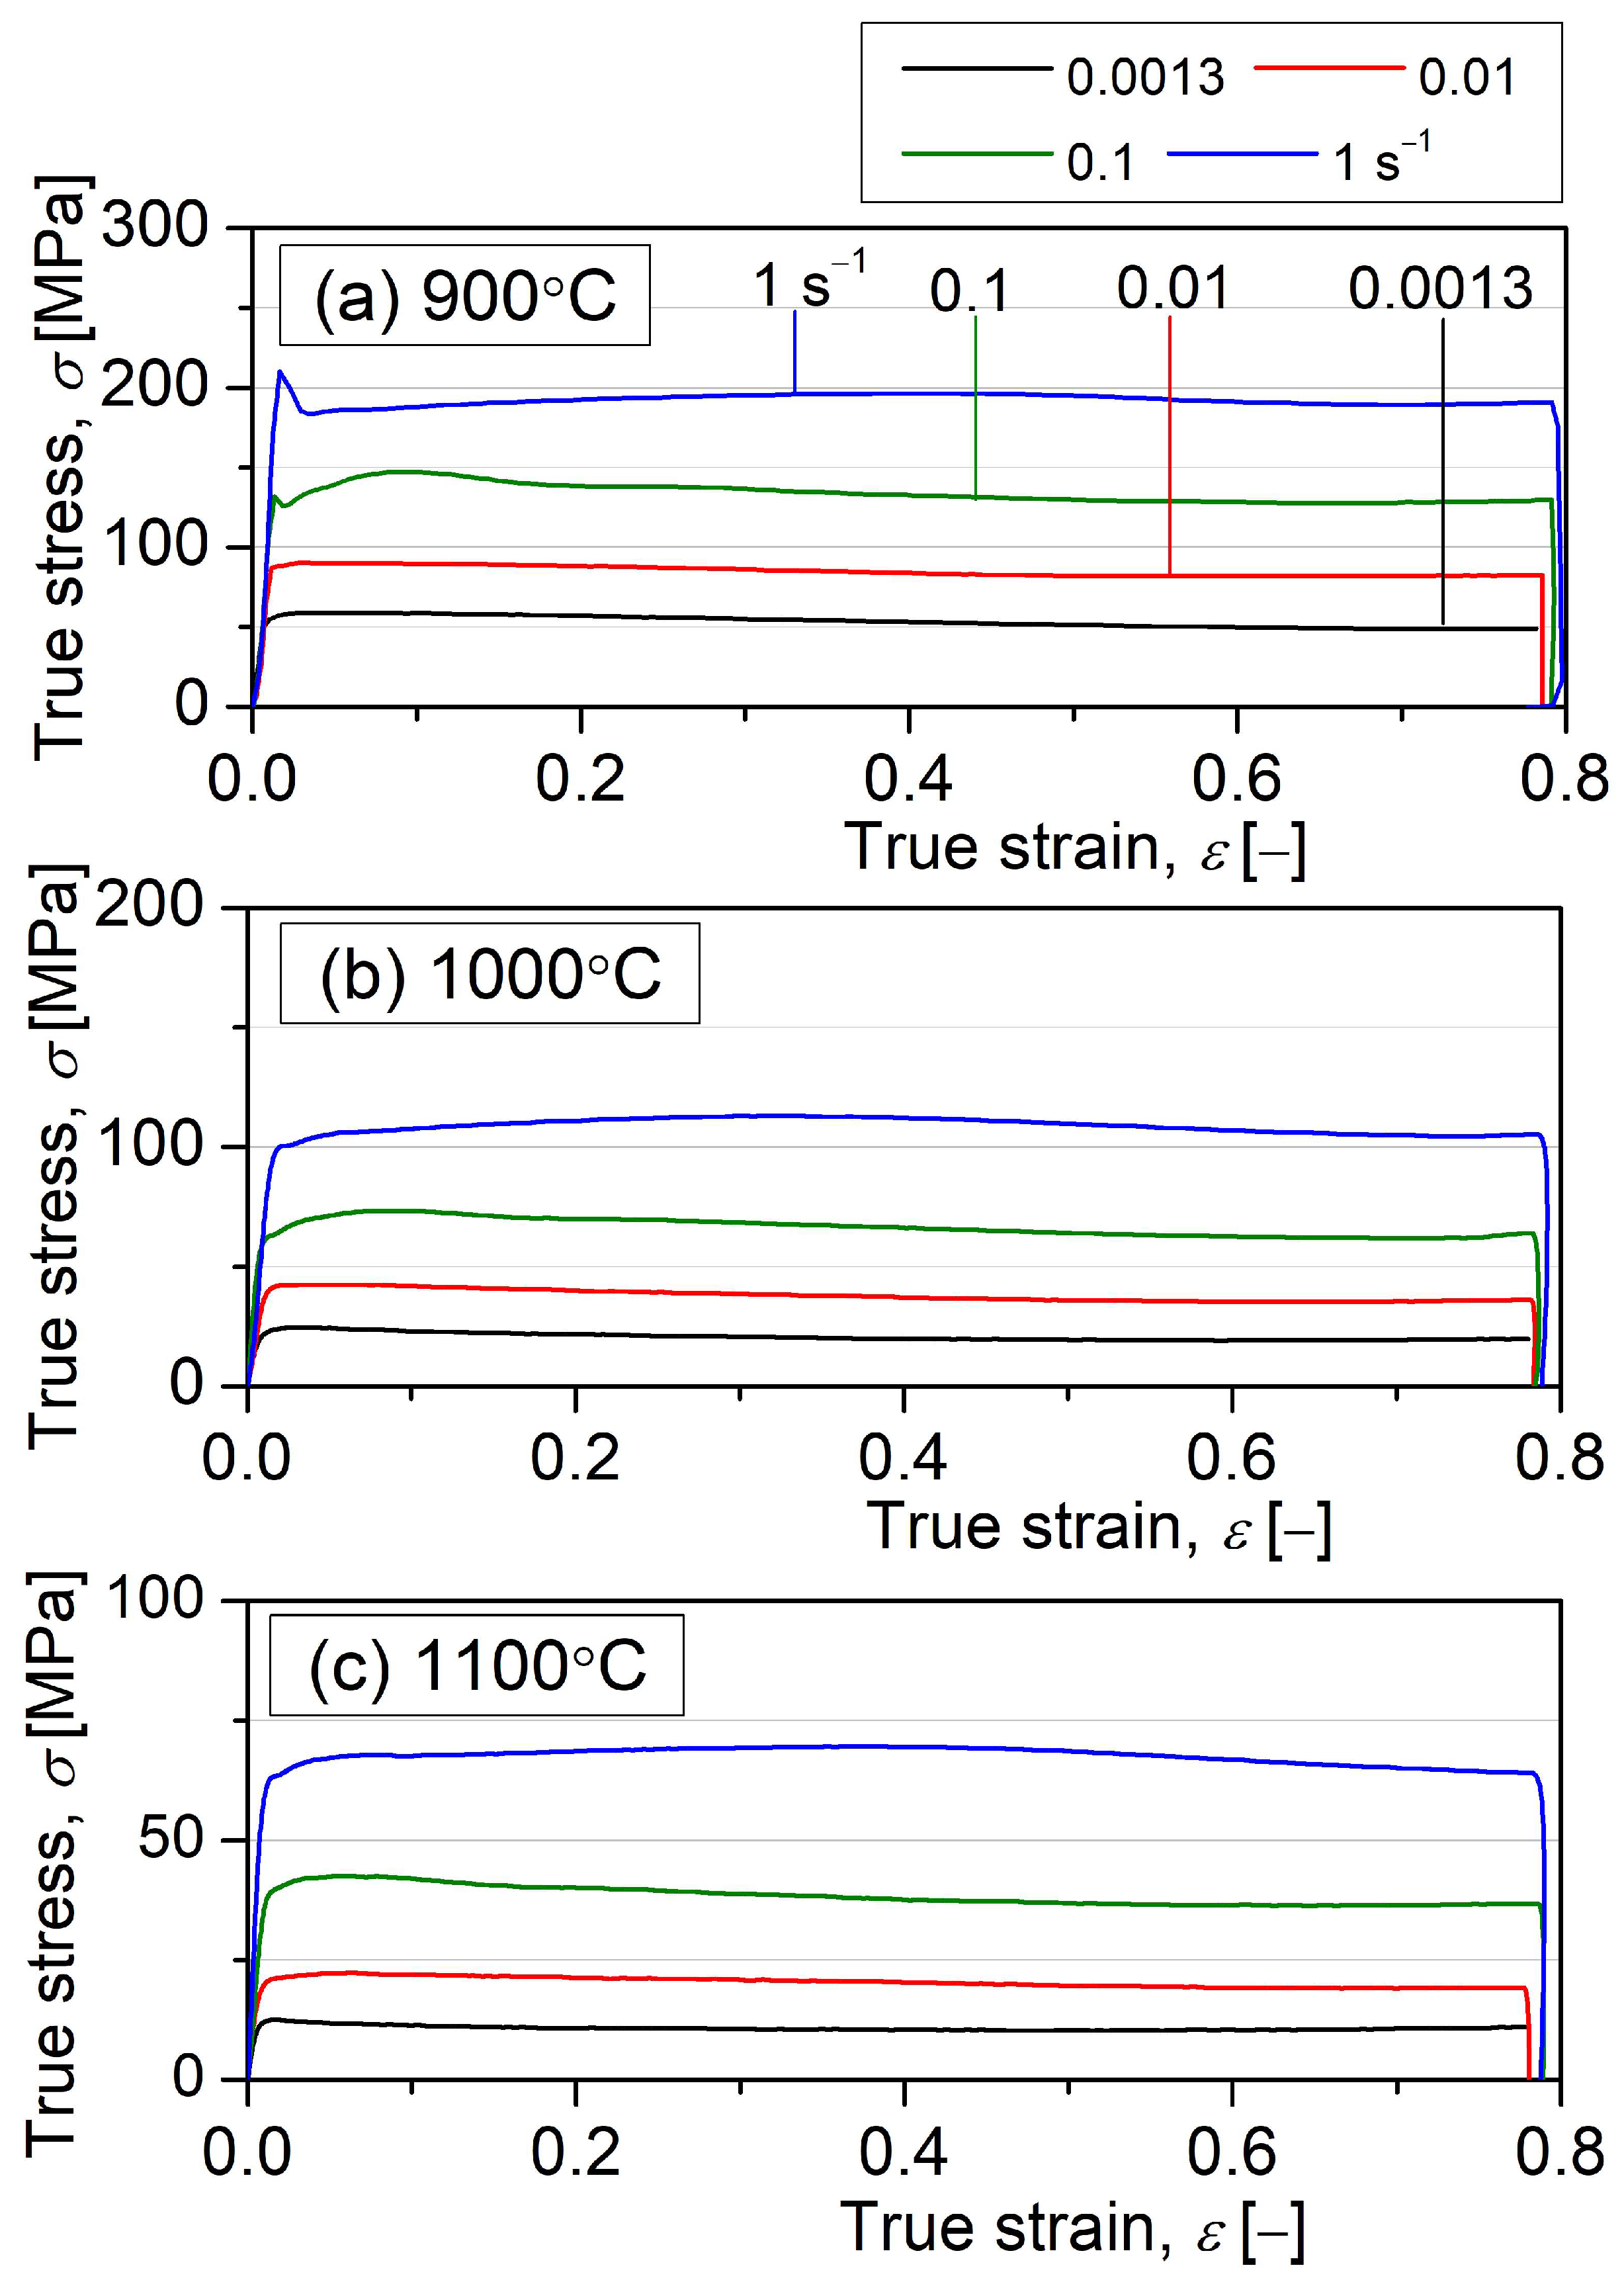
The flow stress–strain curves showed a broad maximum followed by a slight decrease in stress until a steady state was reached. When deformed at a strain rate of 1 s−1 at 900 °C, the flow curves exhibited a distinct stress peak followed by a stress drop.
The constitutive equation for hot deformation for the studied Fe-25Al-1.5Ta alloy can be formulated as: σ = 1 0.019 ln Z 1.13 × 10 14 1 2.72 + Z 1.13 × 10 14 2 2.72 + 1 1 2 .
The activation energy (Q) for hot deformation was averaged to 385 kJ·mol−1 over the entire deformation range using the stress–strain data obtained from the flow curves.
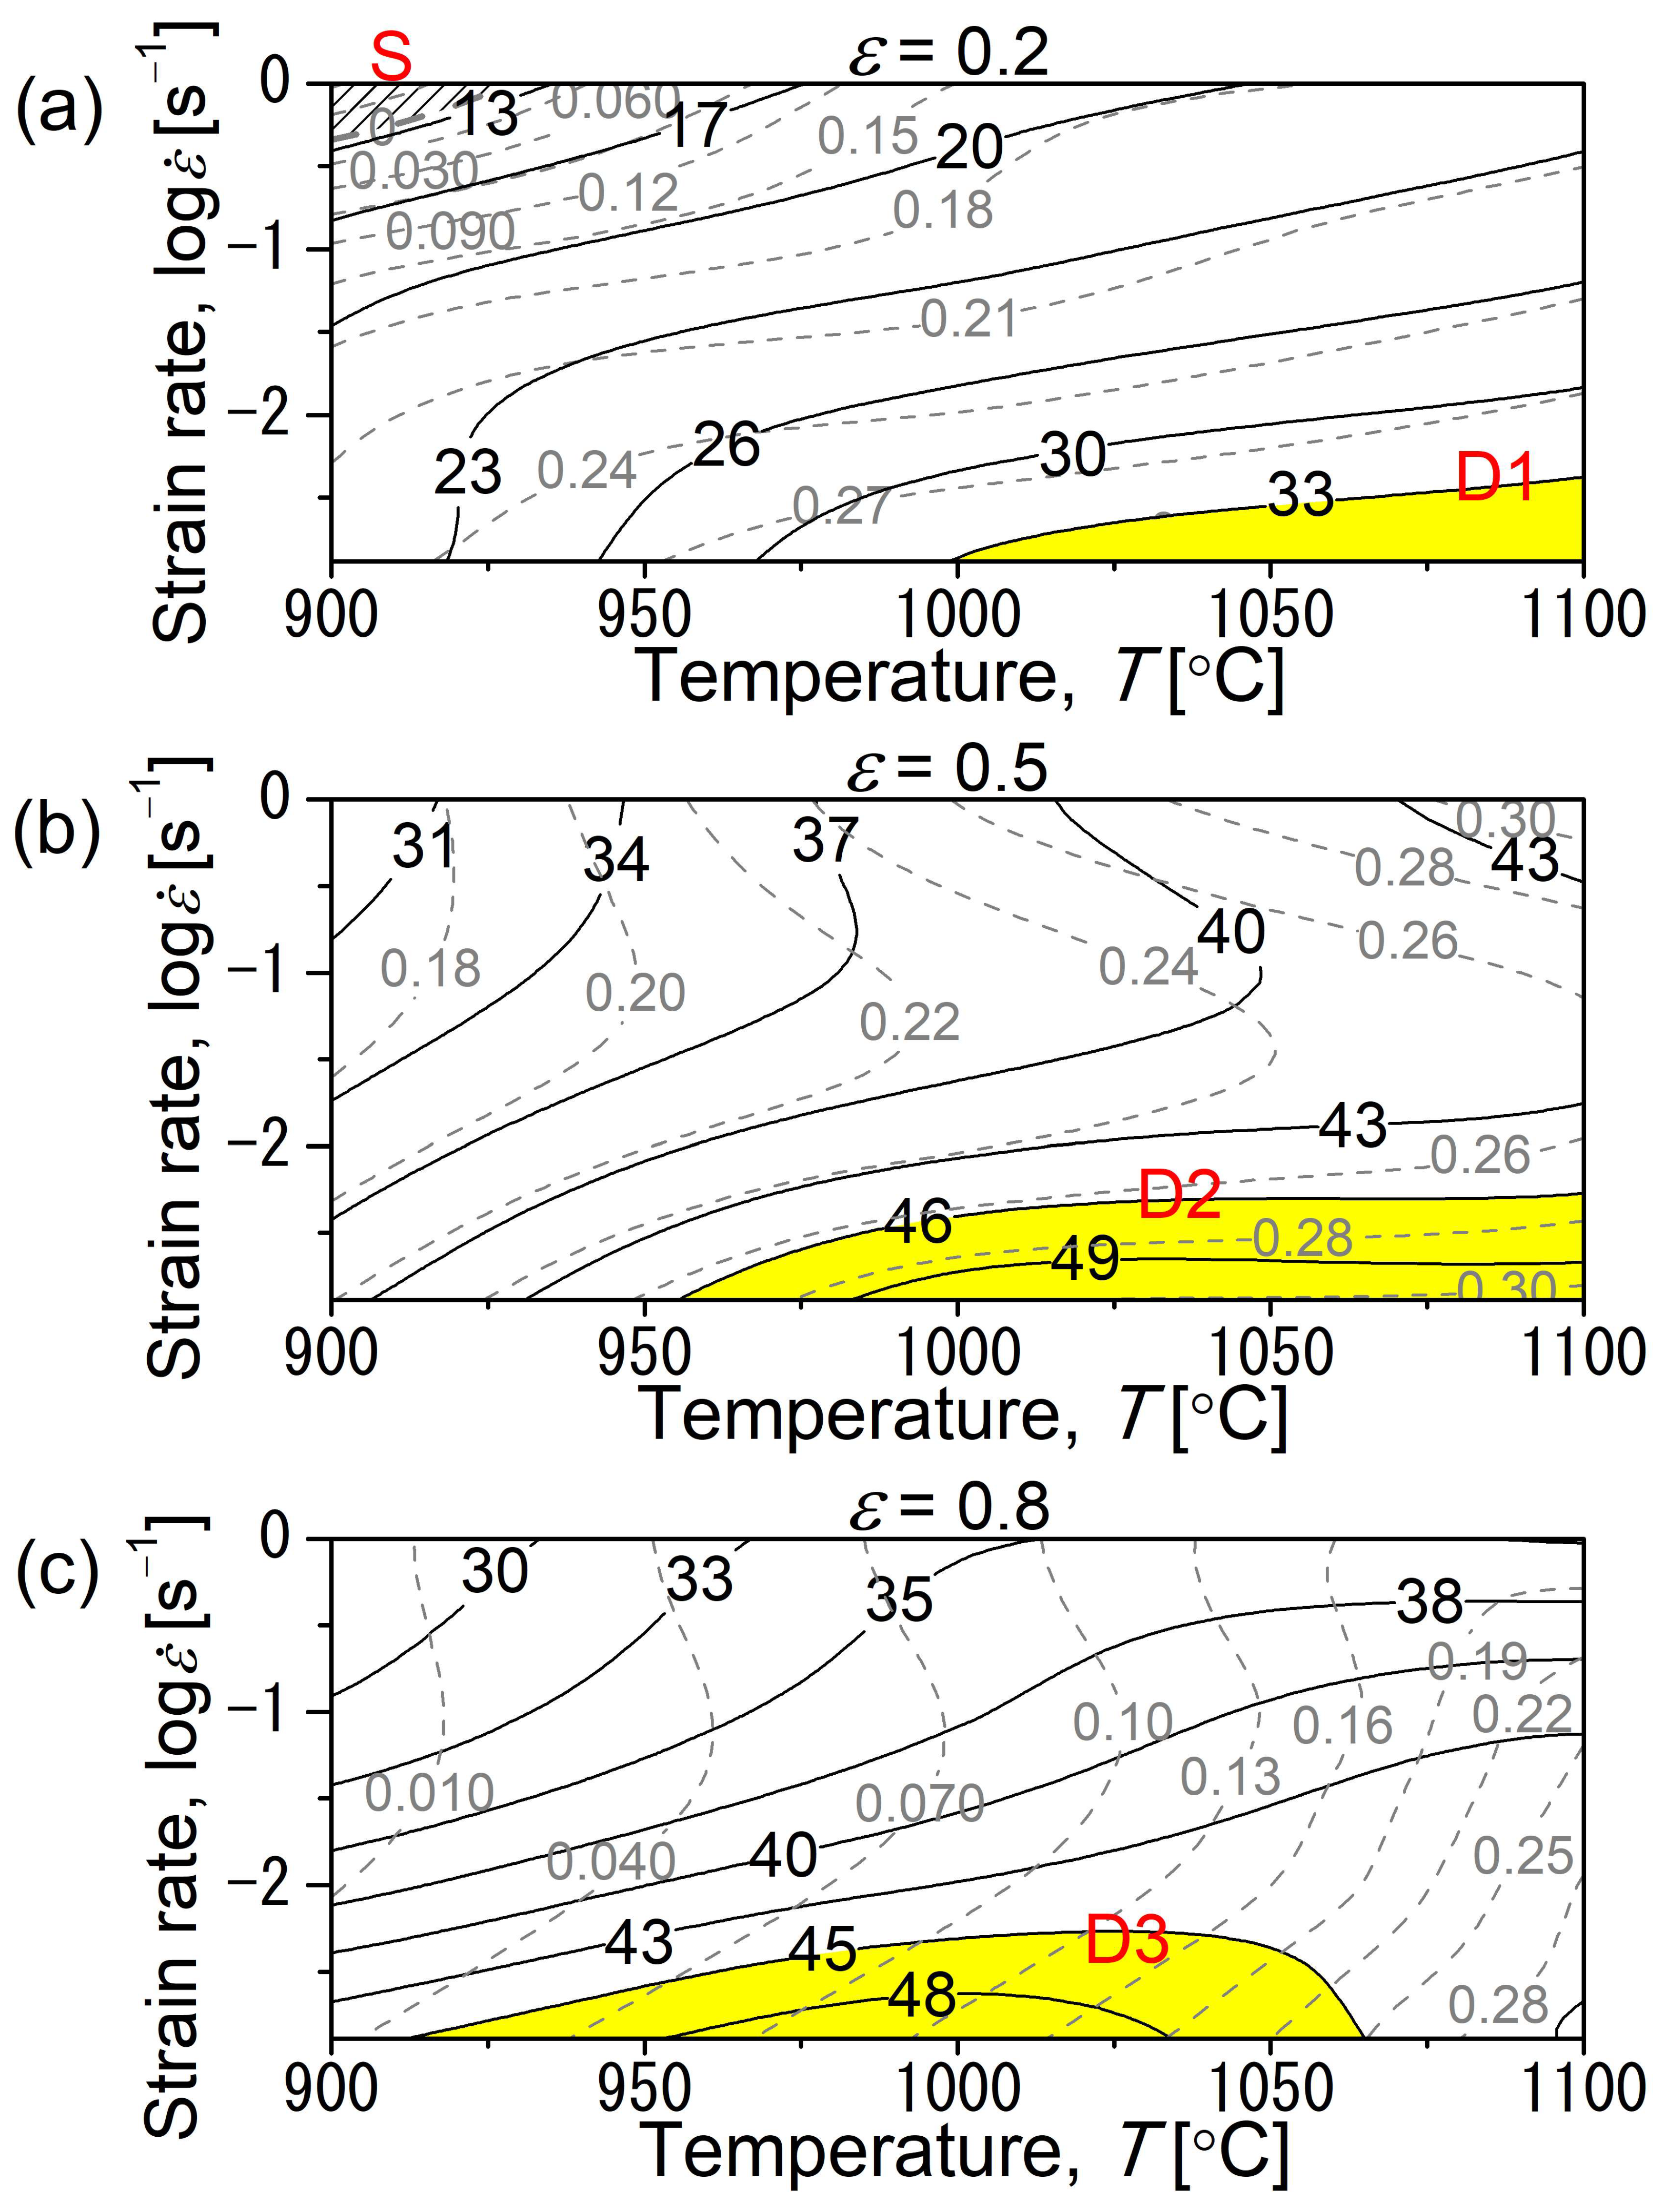
The optimum processing windows for the studied alloy were located at 1000–1100 °C/0.0013–0.004 s−1, 960–1100 °C/0.0013–0.005 s−1, and 910–1060 °C/0.0013–0.005 s−1 when deformation was conducted up to a true strain of 0.2, 0.5, and 0.8, respectively.
No instability domains were predicted based on Prasad’s flow instability criterion when deformation was performed up to a true strain of 0.5 and 0.8, indicating a high degree of hot workability at the deformation range of 900–1100 °C/0.0013–1 s−1.
When deformed up to a lower strain of 0.2, the processing map predicted a domain of flow instability, likely resulting from flow localization in the range of lower temperatures and higher strain rates (900–928 °C/0.45–1 s−1).
The dynamic recovery of the dislocations into substructures and the formation of fine recrystallized grains at the pre-existing grain boundaries were characterized as possible mechanisms of flow softening.
The critical strain and stress for the onset of recrystallization were correlated to the Zener–Hollomon parameter (Z) by ε c = 0.01 Z 1.13 × 10 14 0.11 and σ c = 56 + 13 ln Z 1.13 × 10 14 .
In summary, based on experimental and modeling approaches, we demonstrated that complex softening processes, characterized by a combination of the DRV and DRX, contribute efficiently to the high degree of hot deformability of the Fe-25Al-1.5Ta alloy with a strengthening Laves phase.

Author Contributions

Conceptualization, A.E.; Methodology, A.E.; Investigation, A.E., H.M. and M.T.; Resources, H.M.; Writing—original draft preparation, A.E.; Writing—Review & Editing, A.E., H.M. and M.T.; Supervision, A.E. All authors have read and agreed to the published version of the manuscript.

Funding

This research received no external funding.

Data Availability Statement

The data are available on request from the corresponding authors.

Acknowledgments

The material and process development was supported by the Graduate Research School “LokPro” at BTU Cottbus-Senftenberg. A. Emdadi acknowledges Access e.V. Center (Aachen, Germany) for optical microscopy.

Conflicts of Interest

The authors declare no conflict of interest.

References

  1. Palm, M.; Stein, F.; Dehm, G. Iron Aluminides. Annu. Rev. Mater. Res. 2019, 49, 297–326. [Google Scholar] [CrossRef]
  2. Morris, D.G.; Muñoz-Morris, M.A. Recent Developments Toward the Application of Iron Aluminides in Fossil Fuel Technologies. Adv. Eng. Mater. 2011, 13, 43–47. [Google Scholar] [CrossRef]
  3. Risanti, D.D.; Sauthoff, G. Microstructures and mechanical properties of Fe-Al-Ta alloys with strengthening Laves phase. Intermetallics 2011, 19, 1727–1736. [Google Scholar] [CrossRef]
  4. Prokopčáková, P.; Švec, M.; Palm, M. Microstructural evolution and creep of Fe-Al-Ta alloys. Int. J. Mater. Res. 2016, 107, 396–405. [Google Scholar] [CrossRef]
  5. Palm, M. Fe–Al materials for structural applications at high temperatures: Current research at MPIE. Int. J. Mater. Res. 2009, 100, 277–287. [Google Scholar] [CrossRef]
  6. Hotař, A.; Palm, M. Oxidation resistance of Fe-25Al-2Ta (at.%) in air. Intermetallics 2010, 18, 1390–1395. [Google Scholar] [CrossRef]
  7. Risanti, D.; Sauthoff, G. Iron–Aluminium-Base Alloys with Strengthening Laves Phase for Structural Applications at High Temperatures. Mater. Sci. Forum 2005, 475–479, 865–868. [Google Scholar]
  8. Pütz, R.D.; Zander, D. High temperature oxidation mechanisms of grain refined Fe-25Al-1.5Ta(+TaC/+(Ta,Nb)C) iron aluminides at 700 °C in air. Corros. Sci. 2022, 198, 110149. [Google Scholar] [CrossRef]
  9. Emdadi, A.; Sizova, I.; Bambach, M.; Hecht, U. Hot deformation behavior of a spark plasma sintered Fe-25Al-1.5Ta alloy with strengthening Laves phase. Intermetallics 2019, 109, 123–134. [Google Scholar] [CrossRef]
  10. Emdadi, A. High-Temperature Deformation Behavior of Intermetallic Titanium and Iron Aluminides Produced by Spark Plasma Sintering, 1st ed.; Shaker: Düren, Germany, 2021. [Google Scholar]
  11. Emdadi, A.; Sizova, I.; Stryzhyboroda, O.; Hecht, U.; Buhl, J.; Bambach, M. Hot Workability of a Spark Plasma Sintered Intermetallic Iron Aluminide Alloy Above and Below the Order-disorder Transition Temperature. Procedia Manuf. 2020, 47, 1281–1287. [Google Scholar] [CrossRef]
  12. Emdadi, A.; Bolz, S.; Buhl, J.; Weiß, S.; Bambach, M. Laser Powder Bed Fusion Additive Manufacturing of Fe3Al-1.5Ta Iron Aluminide with Strengthening Laves Phase. Metals 2022, 12, 997. [Google Scholar] [CrossRef]
  13. Emdadi, A.; Bolz, S.; Jensch, F.; Tovar, M.; Weiß, S. On the Hot Deformation of a Fe-Al-Ta Iron Aluminide Prepared via Laser Powder Bed Fusion. Crystals 2023, 13, 627. [Google Scholar] [CrossRef]
  14. Emdadi, A.; Weiß, S. A Comparative Study of Microstructure and Hot Deformability of a Fe–Al–Ta Iron Aluminide Prepared via Additive Manufacturing and Conventional Casting. Crystals 2022, 12, 1709. [Google Scholar] [CrossRef]
  15. Hanus, P.; Bartsch, E.; Palm, M.; Krein, R.; Bauer-Partenheimer, K.; Janschek, P. Mechanical properties of a forged Fe–25Al–2Ta steam turbine blade. Intermetallics 2010, 18, 1379–1384. [Google Scholar] [CrossRef]
  16. Schaberger-Zimmermann, E.; Pütz, R.D.; Subašić, E.; Zander, D. Development of a Two-Stage Etching Procedure for Grain Analysis of Intermetallic Iron Aluminides (Fe-Al-Ta). Pract. Metallogr. 2021, 58, 120–128. [Google Scholar] [CrossRef]
  17. Prasad, Y.V.R.K.; Gegel, H.L.; Doraivelu, S.M.; Malas, J.C.; Morgan, J.T.; Lark, K.A.; Barker, D.R. Modeling of dynamic material behavior in hot deformation: Forging of Ti-6242. Metall. Trans. A 1984, 15, 1883–1892. [Google Scholar] [CrossRef]
  18. Prasad, Y.V.R.K. Processing Maps: A Status Report. J. Mater. Eng. Perform. 2003, 12, 638–645. [Google Scholar] [CrossRef]
  19. Ziegler, H.; Eidgenössische Technische Hochschule. Some Extremum Principles in Irreversible Thermodynamics, with Application to Continuum Mechanics. Prog. Solid Mech. 1963, 4, 93–193. [Google Scholar]
  20. Tsuji, N.; Matsubara, Y.; Saito, Y. Dynamic recrystallization of ferrite in interstitial free steel. Scr. Mater. 1997, 37, 477–484. [Google Scholar] [CrossRef]
  21. Tsuji, N.; Matsubara, Y.; Saito, Y.; Maki, T. Occurrence of Dynamic Recrystallization in Ferritic Iron. J. Jpn. Inst. Met. Mater. 1998, 62, 967–976. [Google Scholar] [CrossRef]
  22. Huang, K.; Logé, R. A review of dynamic recrystallization phenomena in metallic materials. Mater. Des. 2016, 111, 548–574. [Google Scholar] [CrossRef]
  23. Poliak, E.; Jonas, J. A one-parameter approach to determining the critical conditions for the initiation of dynamic recrystallization. Acta Mater. 1996, 44, 127–136. [Google Scholar] [CrossRef]
  24. Najafizadeh, A.; Jonas, J.J. Predicting the Critical Stress for Initiation of Dynamic Recrystallization. ISIJ Int. 2006, 46, 1679–1684. [Google Scholar] [CrossRef]
  25. Sellars, C.; McTegart, W. On the mechanism of hot deformation. Acta Met. 1966, 14, 1136–1138. [Google Scholar] [CrossRef]
  26. Kim, S.-I.; Yoo, Y.-C. Prediction of dynamic recrystallisation behaviour of AISI type 4140 medium carbon steel. Mater. Sci. Technol. 2002, 18, 160–164. [Google Scholar] [CrossRef]
  27. Łyszkowski, R.; Bystrzycki, J. Hot deformation and processing maps of an Fe3Al intermetallic alloy. Intermetallics 2006, 14, 1231–1237. [Google Scholar] [CrossRef]
  28. Liu, C.; Guan, H.; Tai, Q.; Yuan, F.; Han, F.; Gu, H.; Zhang, L.; Li, G. Microstructure, texture and mechanical studies of an inconspicuous shear band formed during hot compression of Ti-6Al-4V alloy. Mater. Sci. Eng. A 2017, 698, 18–26. [Google Scholar] [CrossRef]
  29. Emdadi, A.; Stryzhyboroda, O.; Hecht, U.; Bambach, M. Complex dynamic restoration processes leading to a high degree of deformability in a dual-phase Al0.5CoCrFeNi high entropy alloy. J. Alloys Compd. 2022, 918, 165583. [Google Scholar] [CrossRef]
  30. Ke, B.; Ye, L.; Tang, J.; Zhang, Y.; Liu, S.; Lin, H.; Dong, Y.; Liu, X. Hot deformation behavior and 3D processing maps of AA7020 aluminum alloy. J. Alloy. Compd. 2020, 845, 156113. [Google Scholar] [CrossRef]
  31. Lei, C.; Wang, Q.; Tang, H.; Liu, T.; Li, Z.; Jiang, H.; Wang, K.; Ebrahimi, M.; Ding, W. Hot deformation constitutive model and processing maps of homogenized Al-5Mg-3Zn-1Cu alloy. J. Mater. Res. Technol. 2021, 14, 324–339. [Google Scholar] [CrossRef]
  32. Ghosh, S.; Hamada, A.; Patnamsetty, M.; Borek, W.; Gouda, M.; Chiba, A.; Ebied, S. Constitutive modeling and hot deformation processing map of a new biomaterial Ti-14Cr alloy. J. Mater. Res. Technol. 2022, 20, 4097–4113. [Google Scholar] [CrossRef]
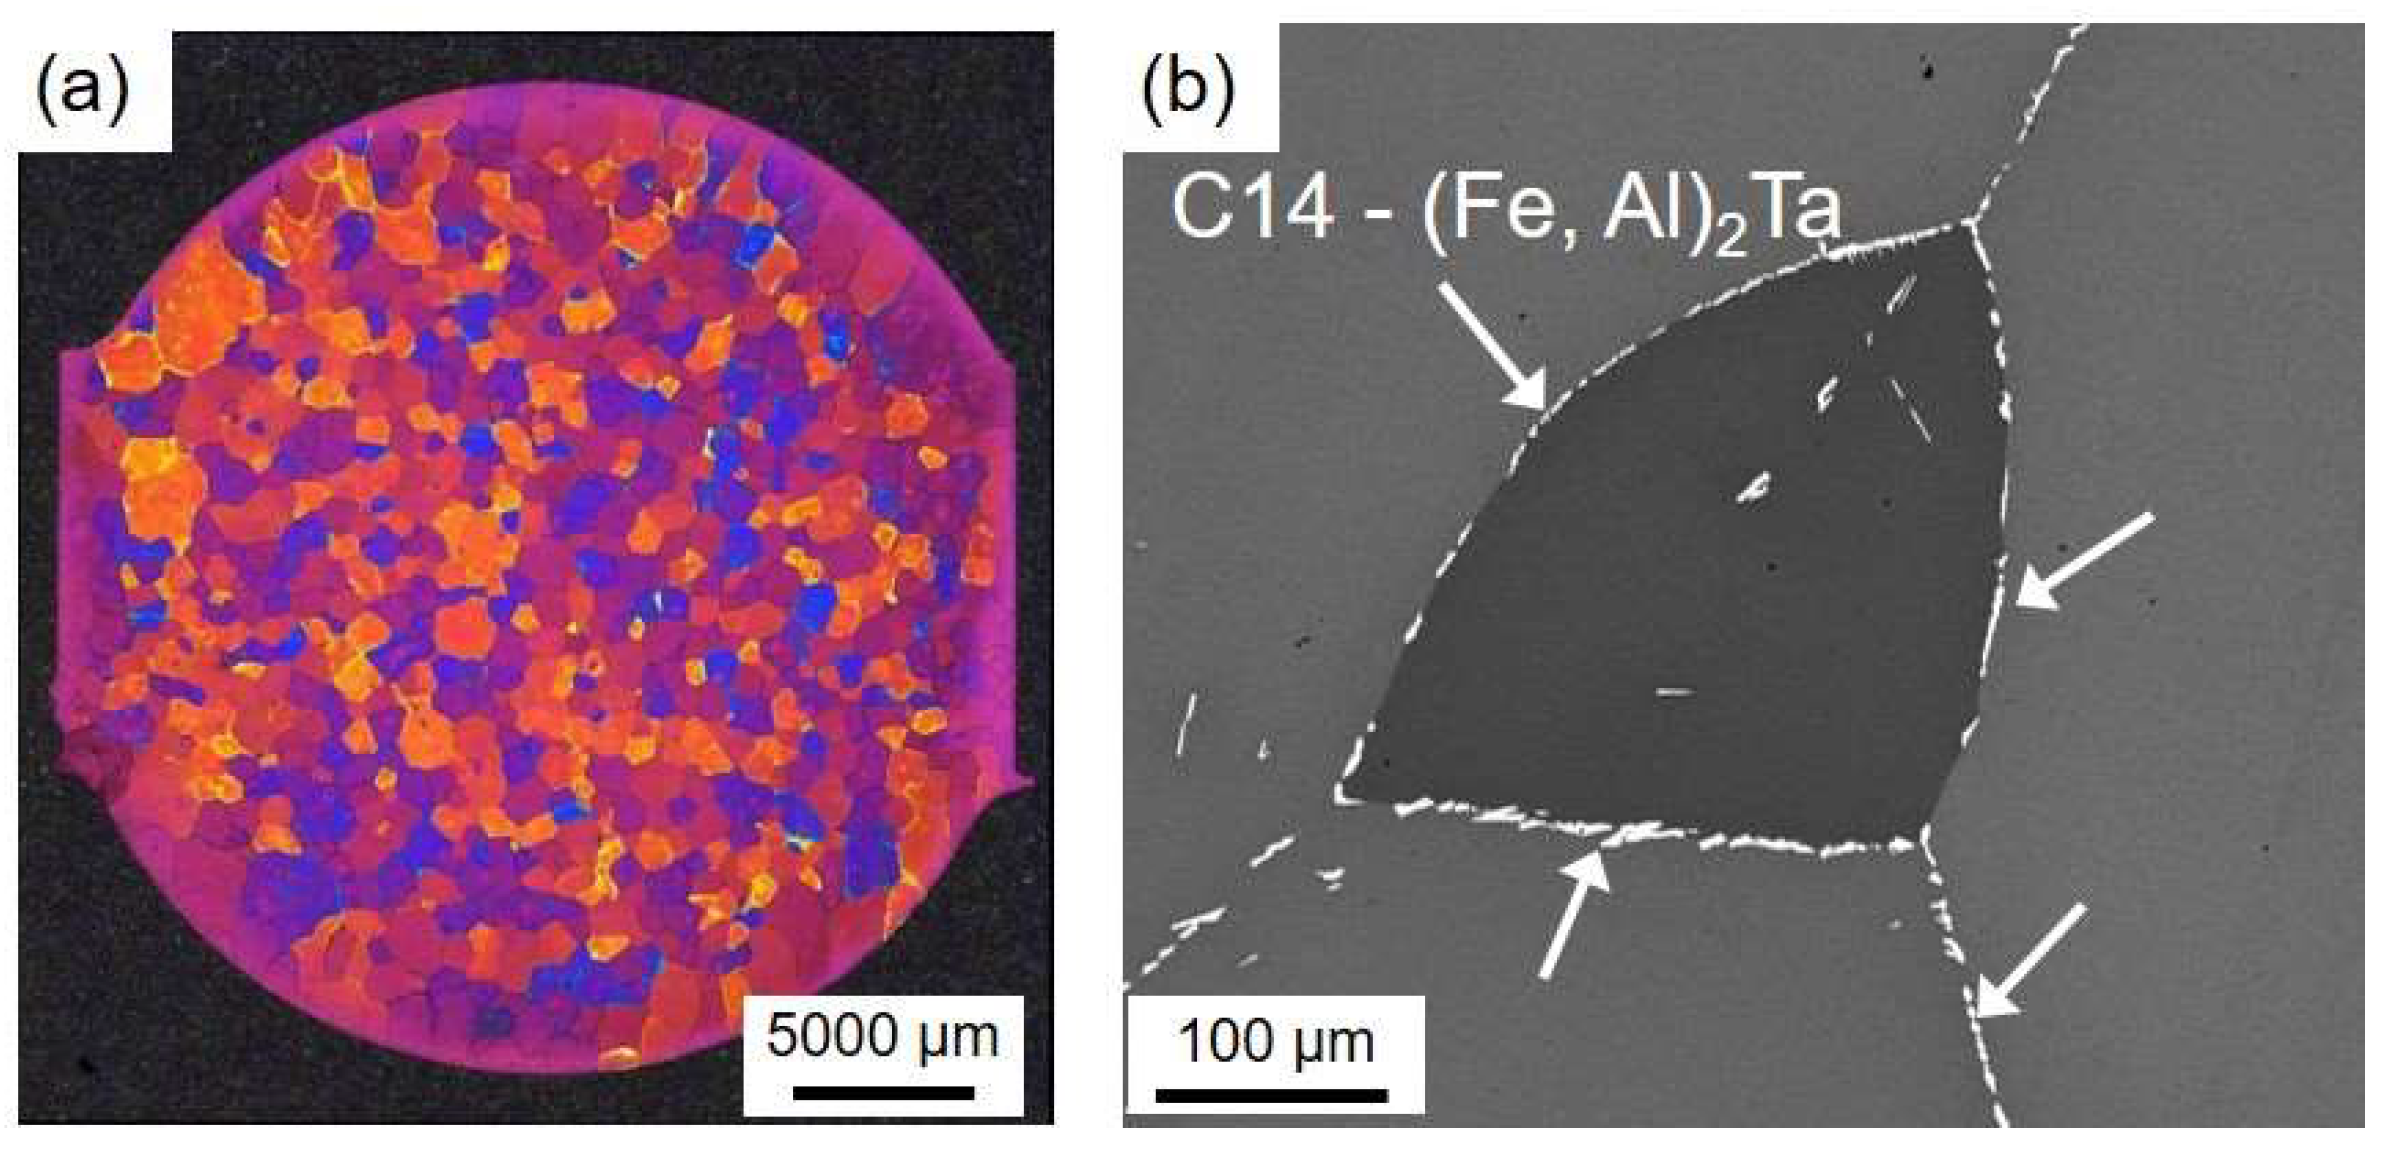
Figure 1. OM image (a) and SEM-BSE micrograph (b) of the as-cast Fe-25Al-1.5Ta alloy, showing the λ-C14 Laves phase precipitates (indicated by the arrows) located mainly at the grain boundaries and occasionally within the grains.
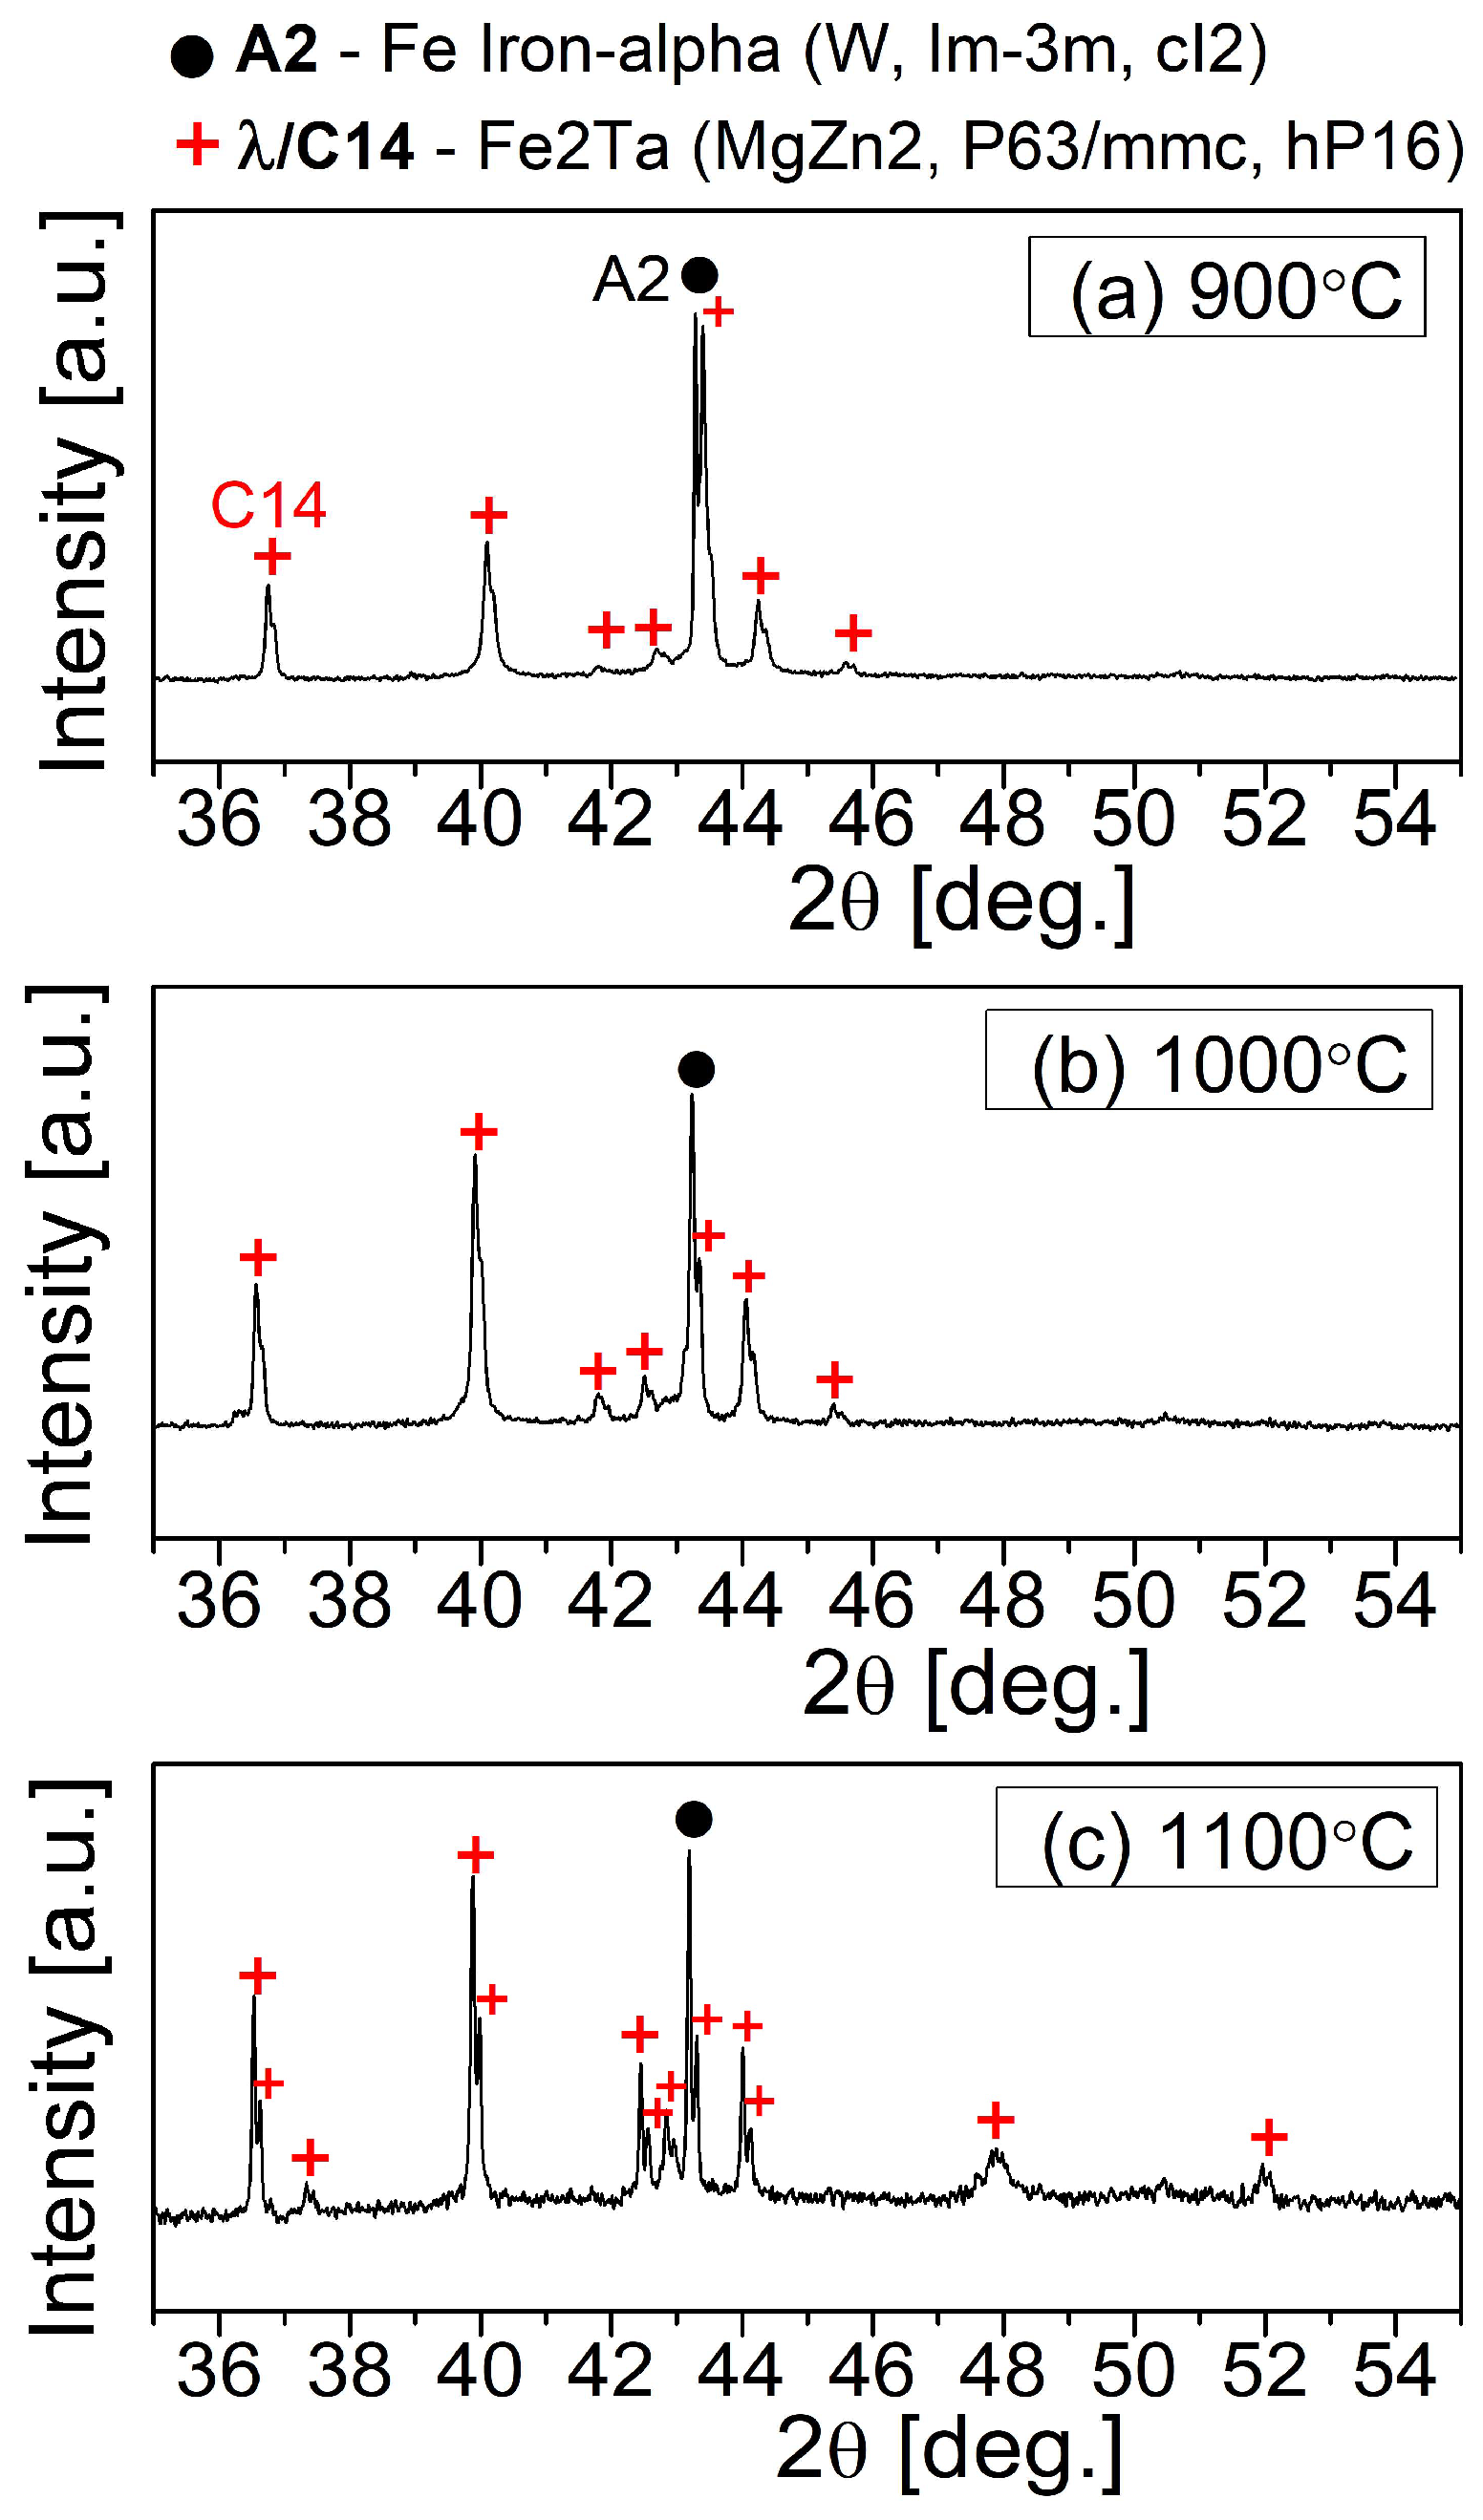
Metals 13 01195 g001
Figure 2. XRD patterns for the Fe-25Al-1.5Ta samples at different temperatures showing a dual-phase mixture of A2 and C14 Laves phase over the whole temperature range tested.
Metals 13 01195 g002
Figure 3. True stress–strain flow curves for the as-cast Fe-25Al-1.5Ta alloy specimens hot compressed up to a true strain of 0.8 at different temperatures and strain rates.
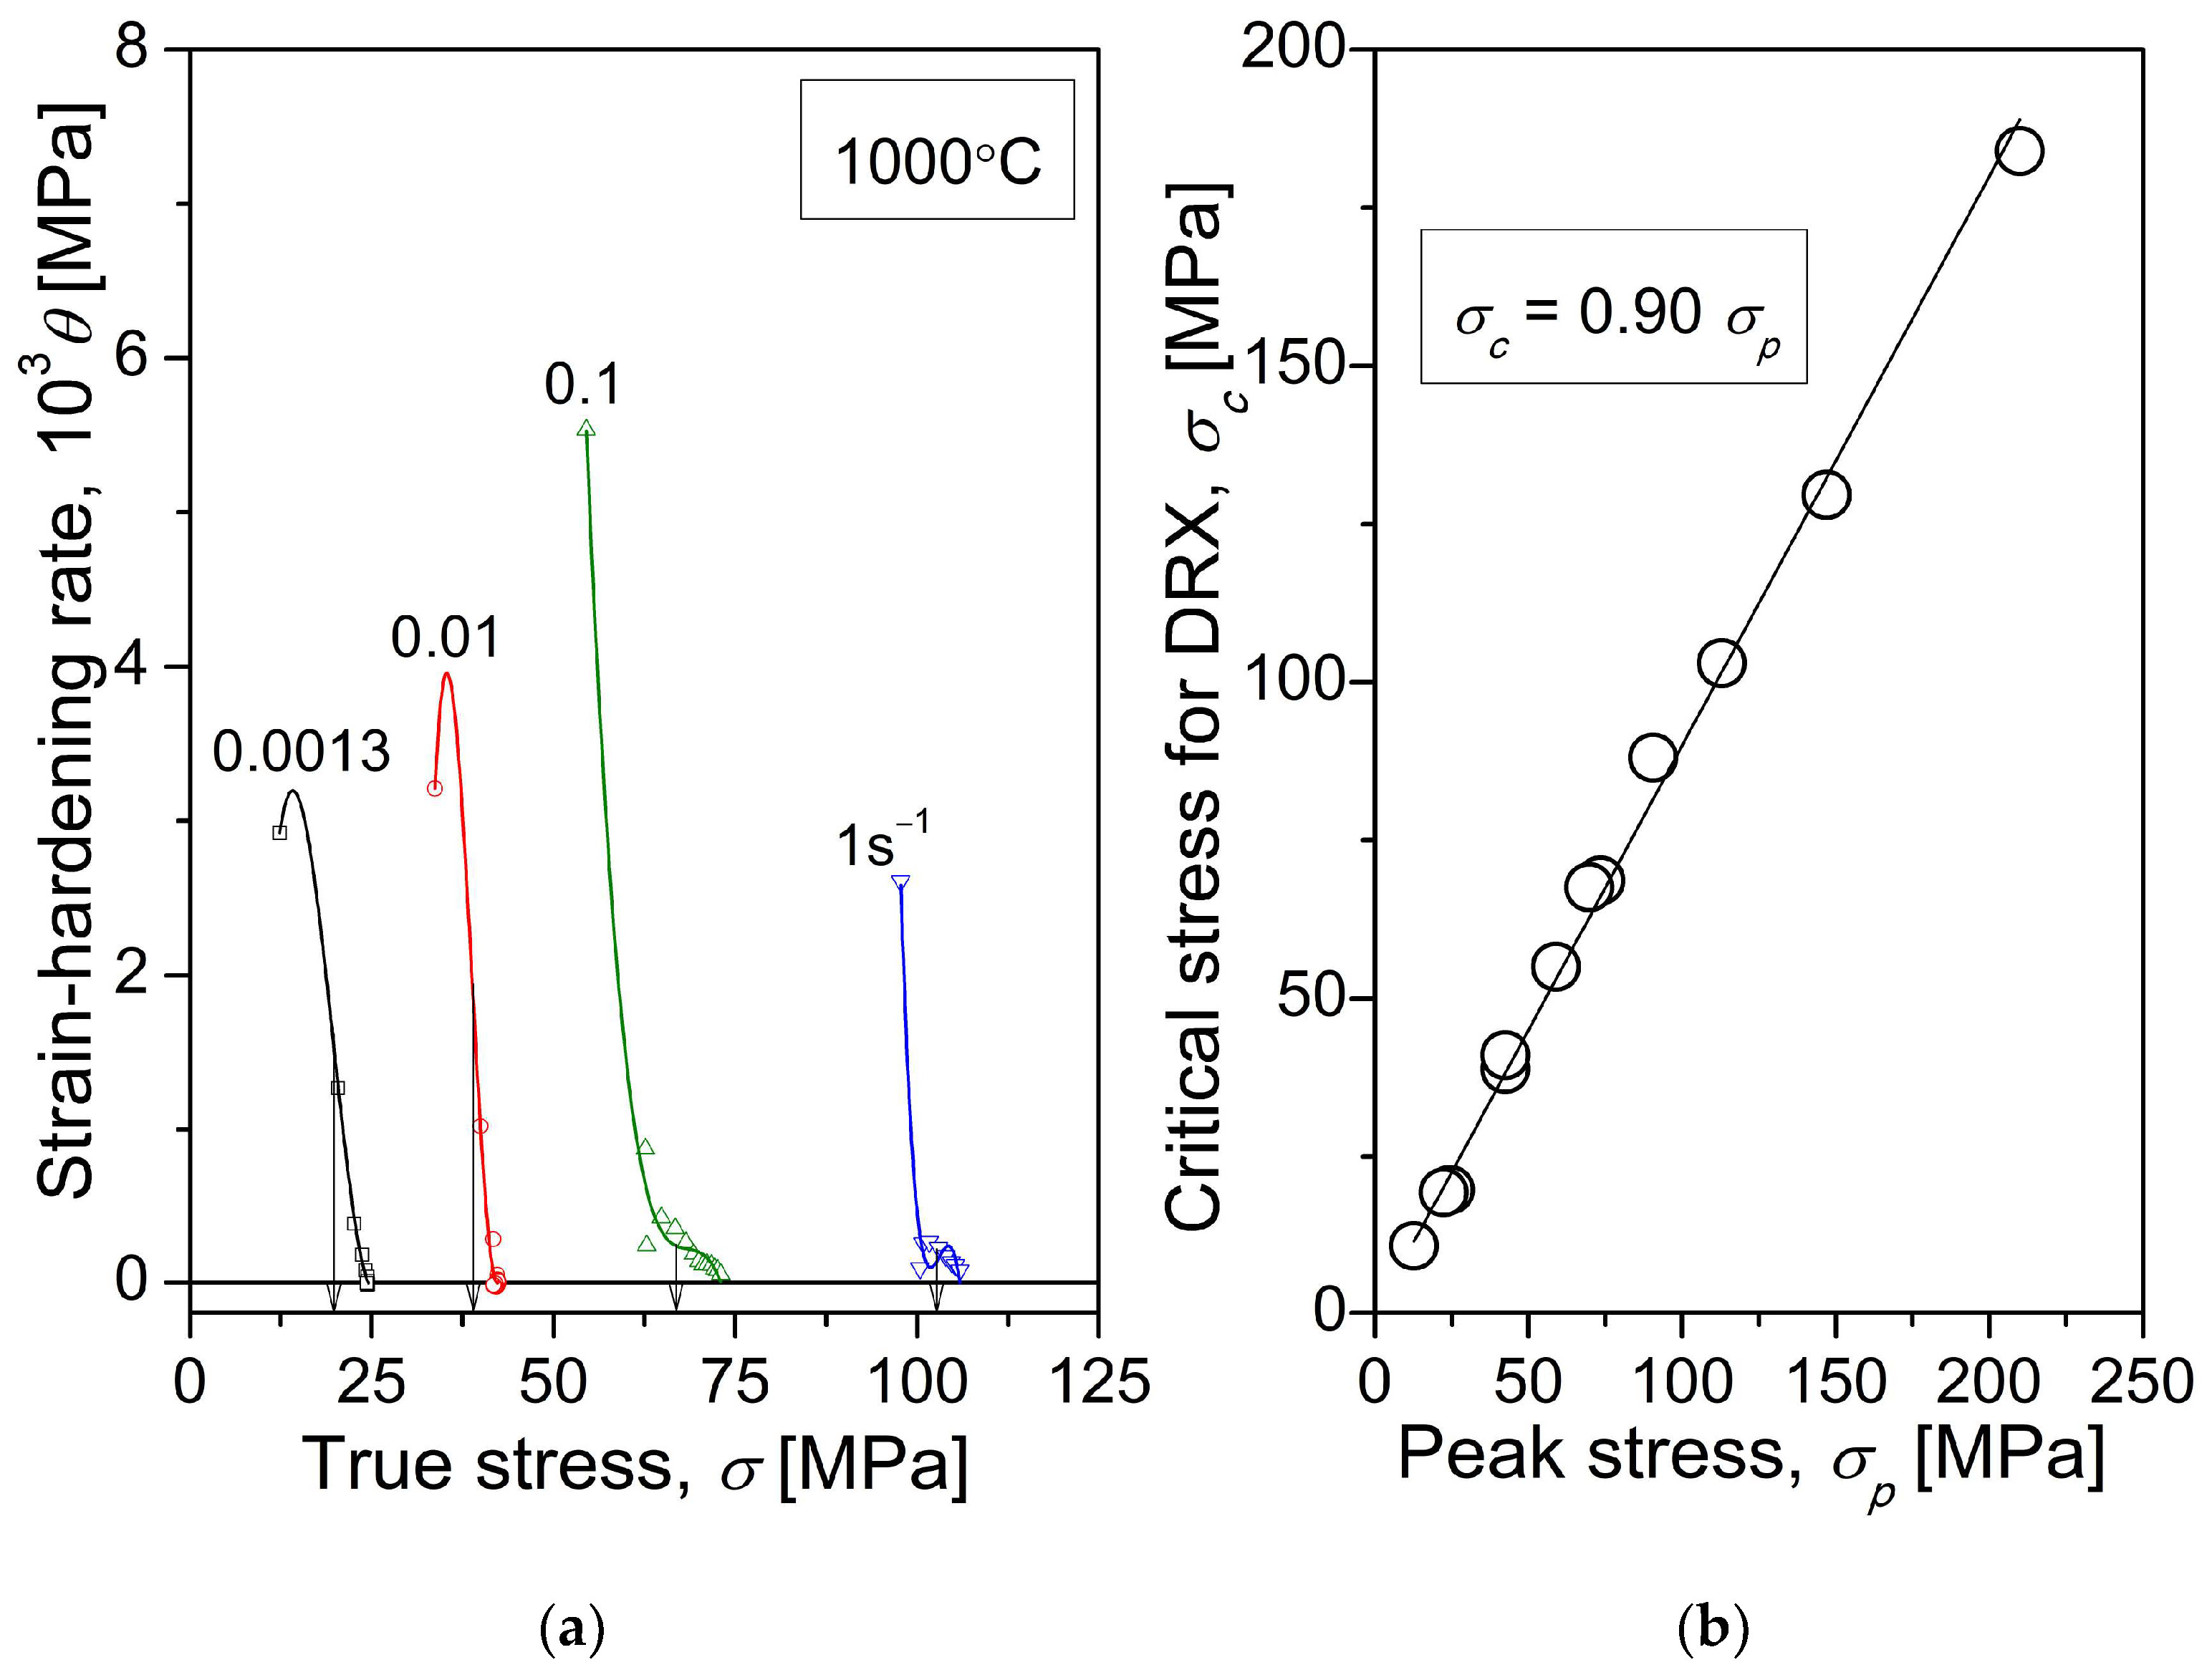
Metals 13 01195 g003
Figure 4. The plots for the strain-hardening rate (θ) as a function of true stress (σ) for the Fe-25Al-1.5Ta samples hot compressed with different strain rates to a true strain of 0.8 at 1000 °C (a), and critical stress for the initiation of the DRX (σc) as a function of the peak stress (σp) (b) providing σc/σp = 0.9. The θ-σ data points were fitted using a 3rd-degree polynomial. Arrows in (a) point to σc.
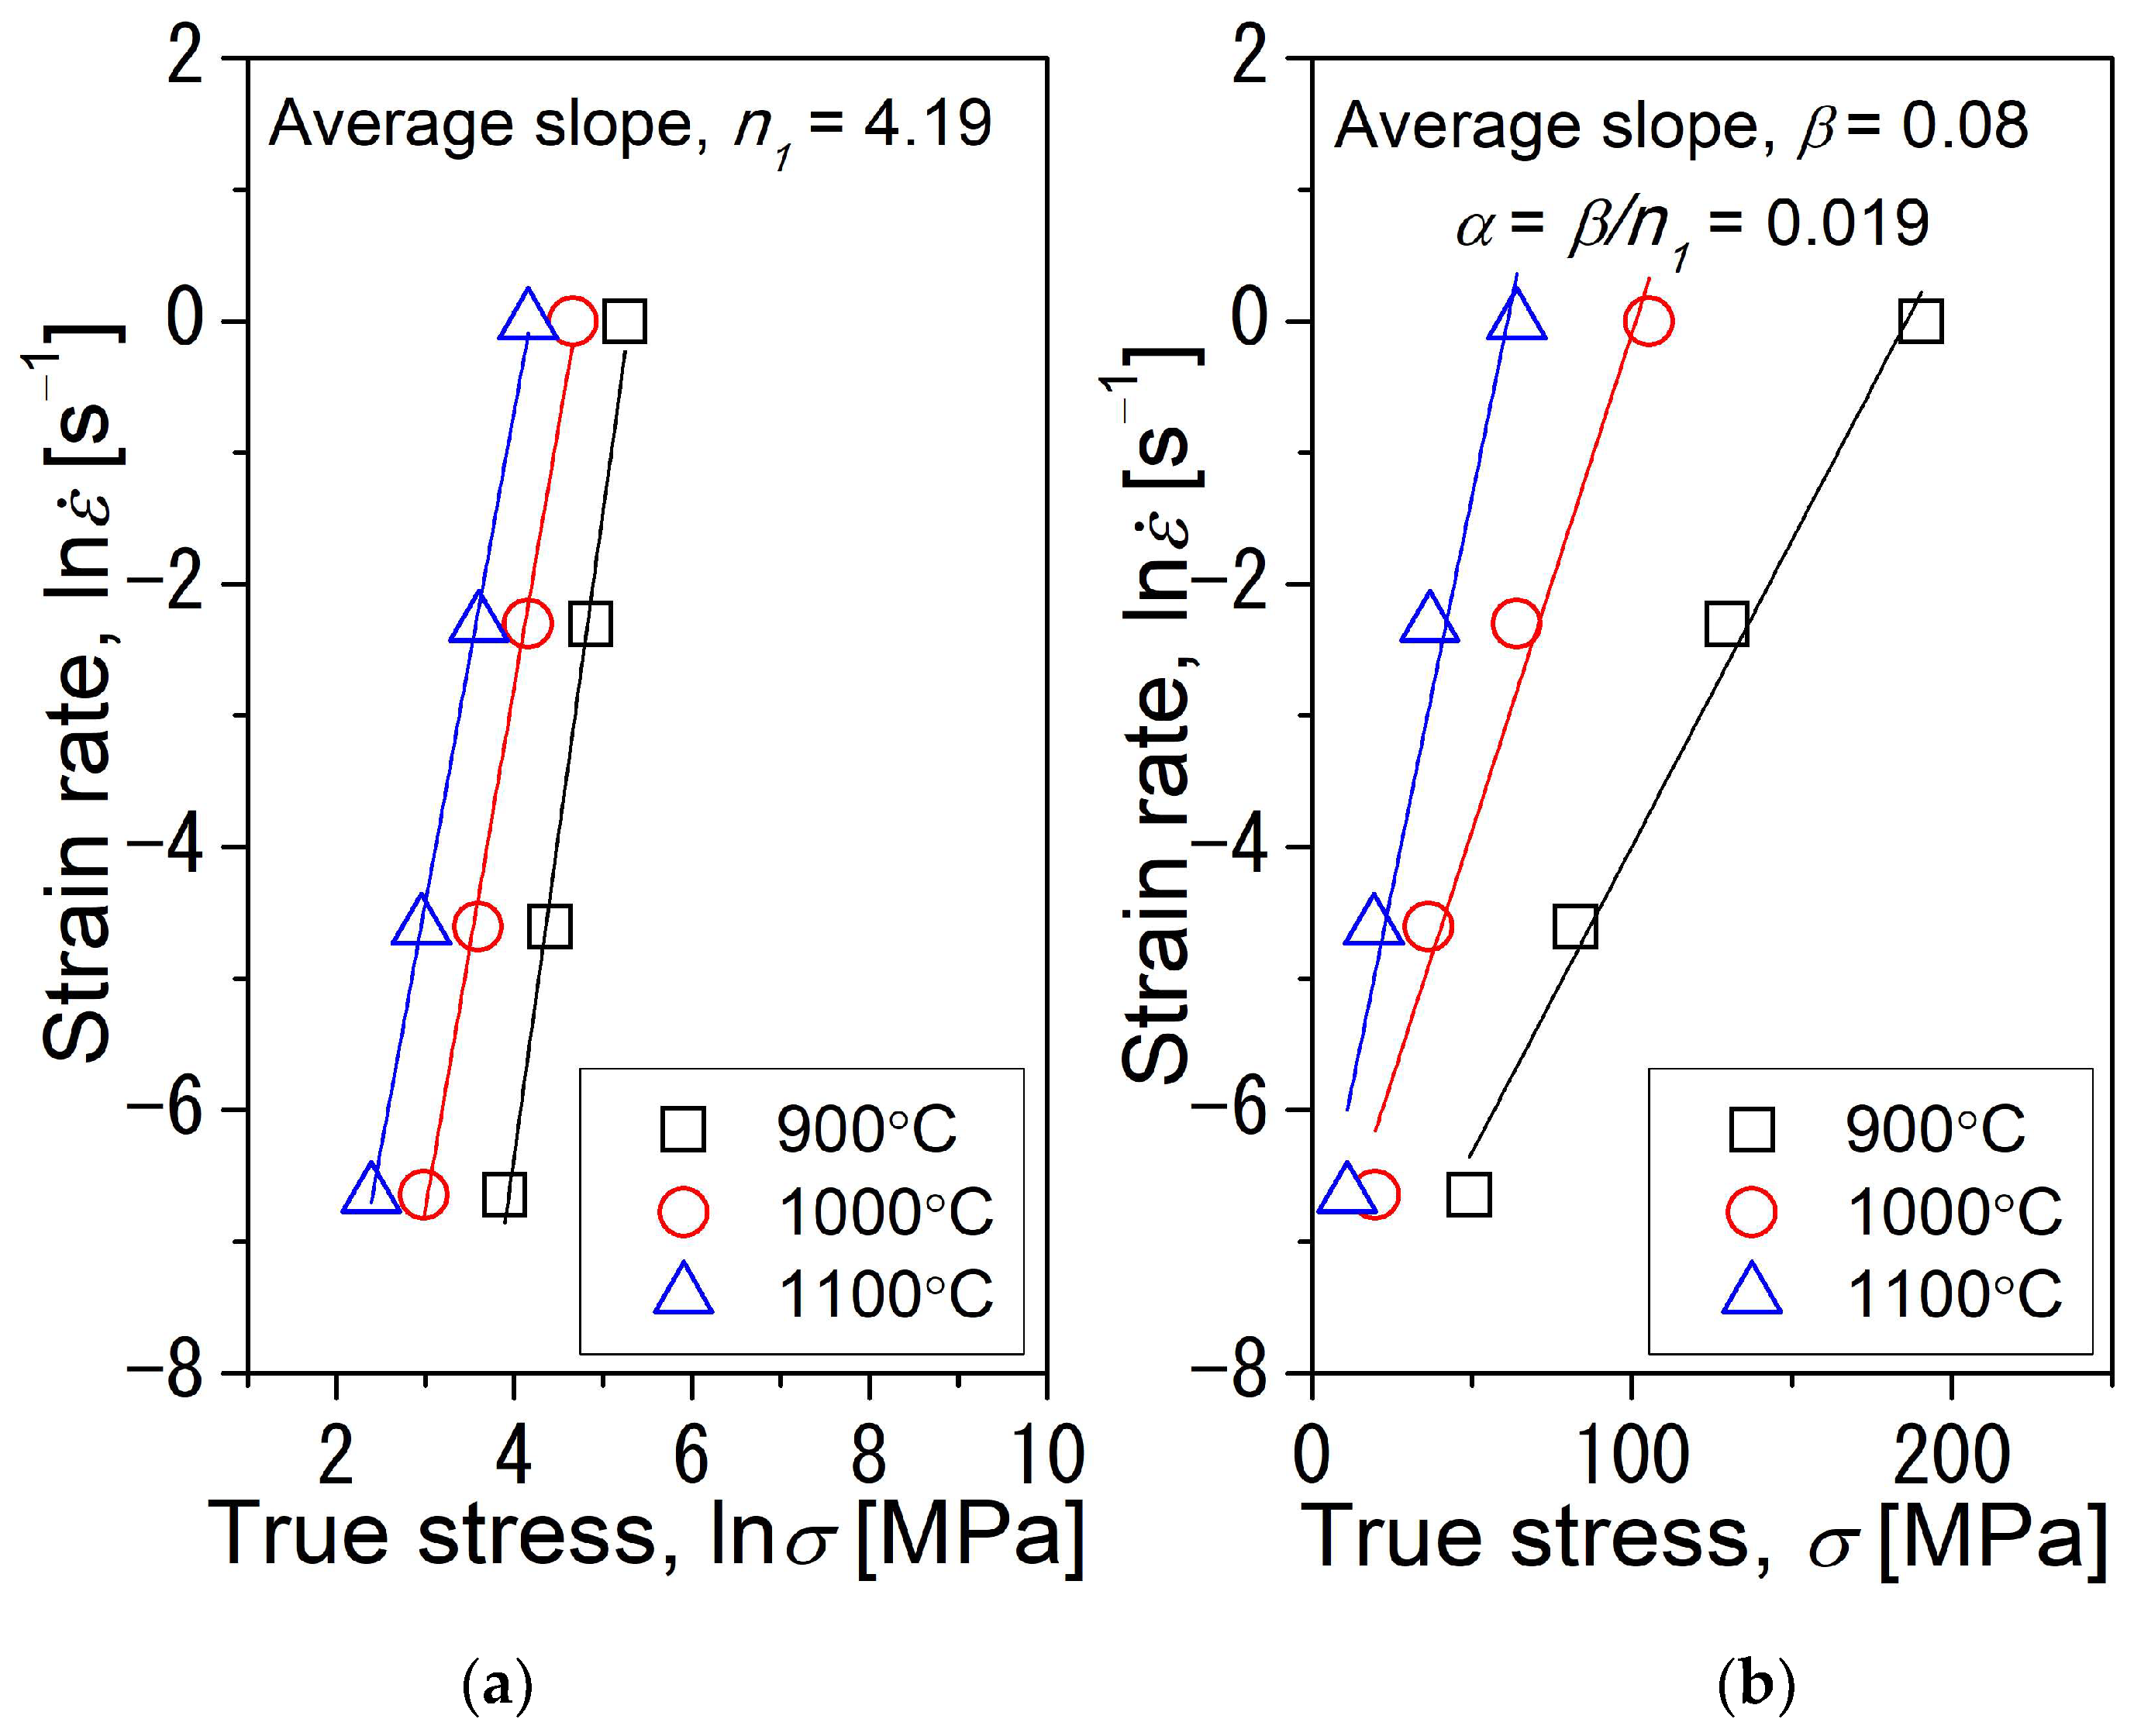
Metals 13 01195 g004
Figure 5. Flow stress analysis for the Fe-25Al-1.5Ta alloy showing the linear fit for the ln (strain rate) vs. ln (stress) (a) and ln (strain rate) vs. stress (b), obtained from the flow stress–strain curves at a strain of 0.8. The average slope values in (a,b) are the parameters n1 and β, respectively, and β/n1 gives α.
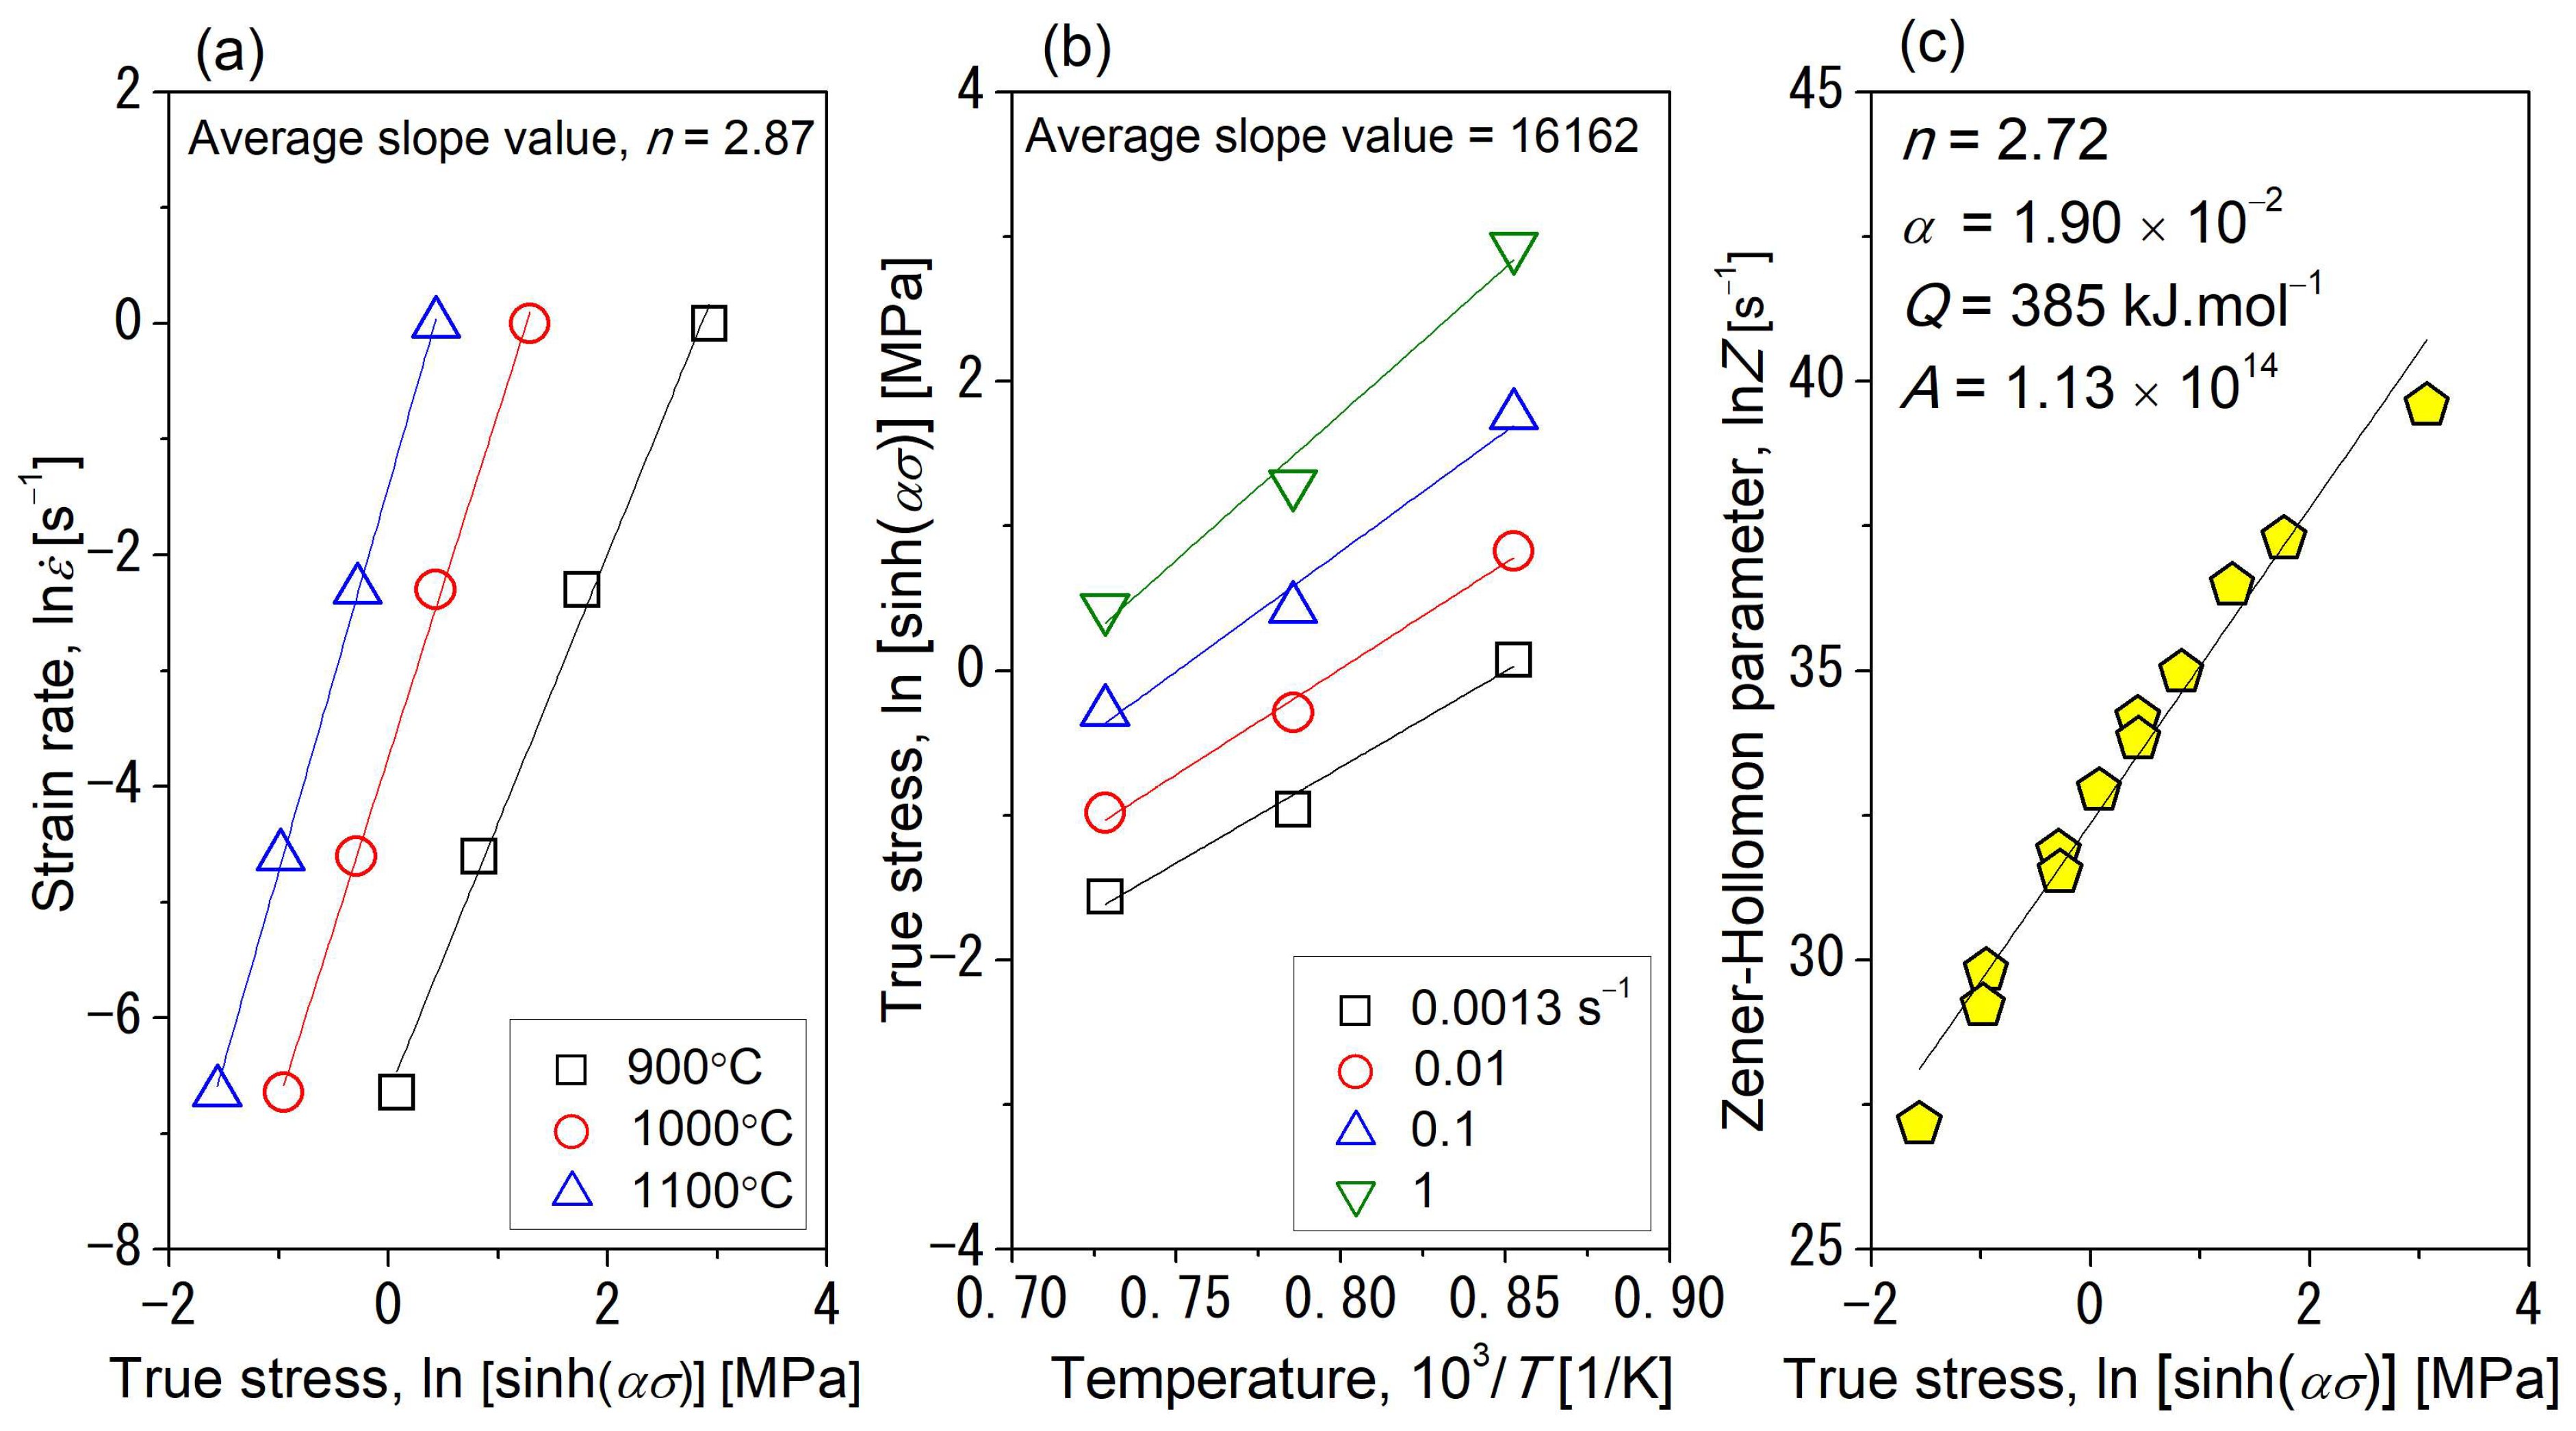
Metals 13 01195 g005
Figure 6. Flow behavior kinetic analysis for the Fe-25Al-1.5Ta alloy showing the linear fit for the ln ε ˙ vs. ln[sinh(ασ)] at different temperatures (a), ln[sinh(ασ)] vs. 1/T at different strain rates (b), and lnZ vs. ln[sinh(ασ)] (c), obtained from the flow curves at a true strain of 0.8.
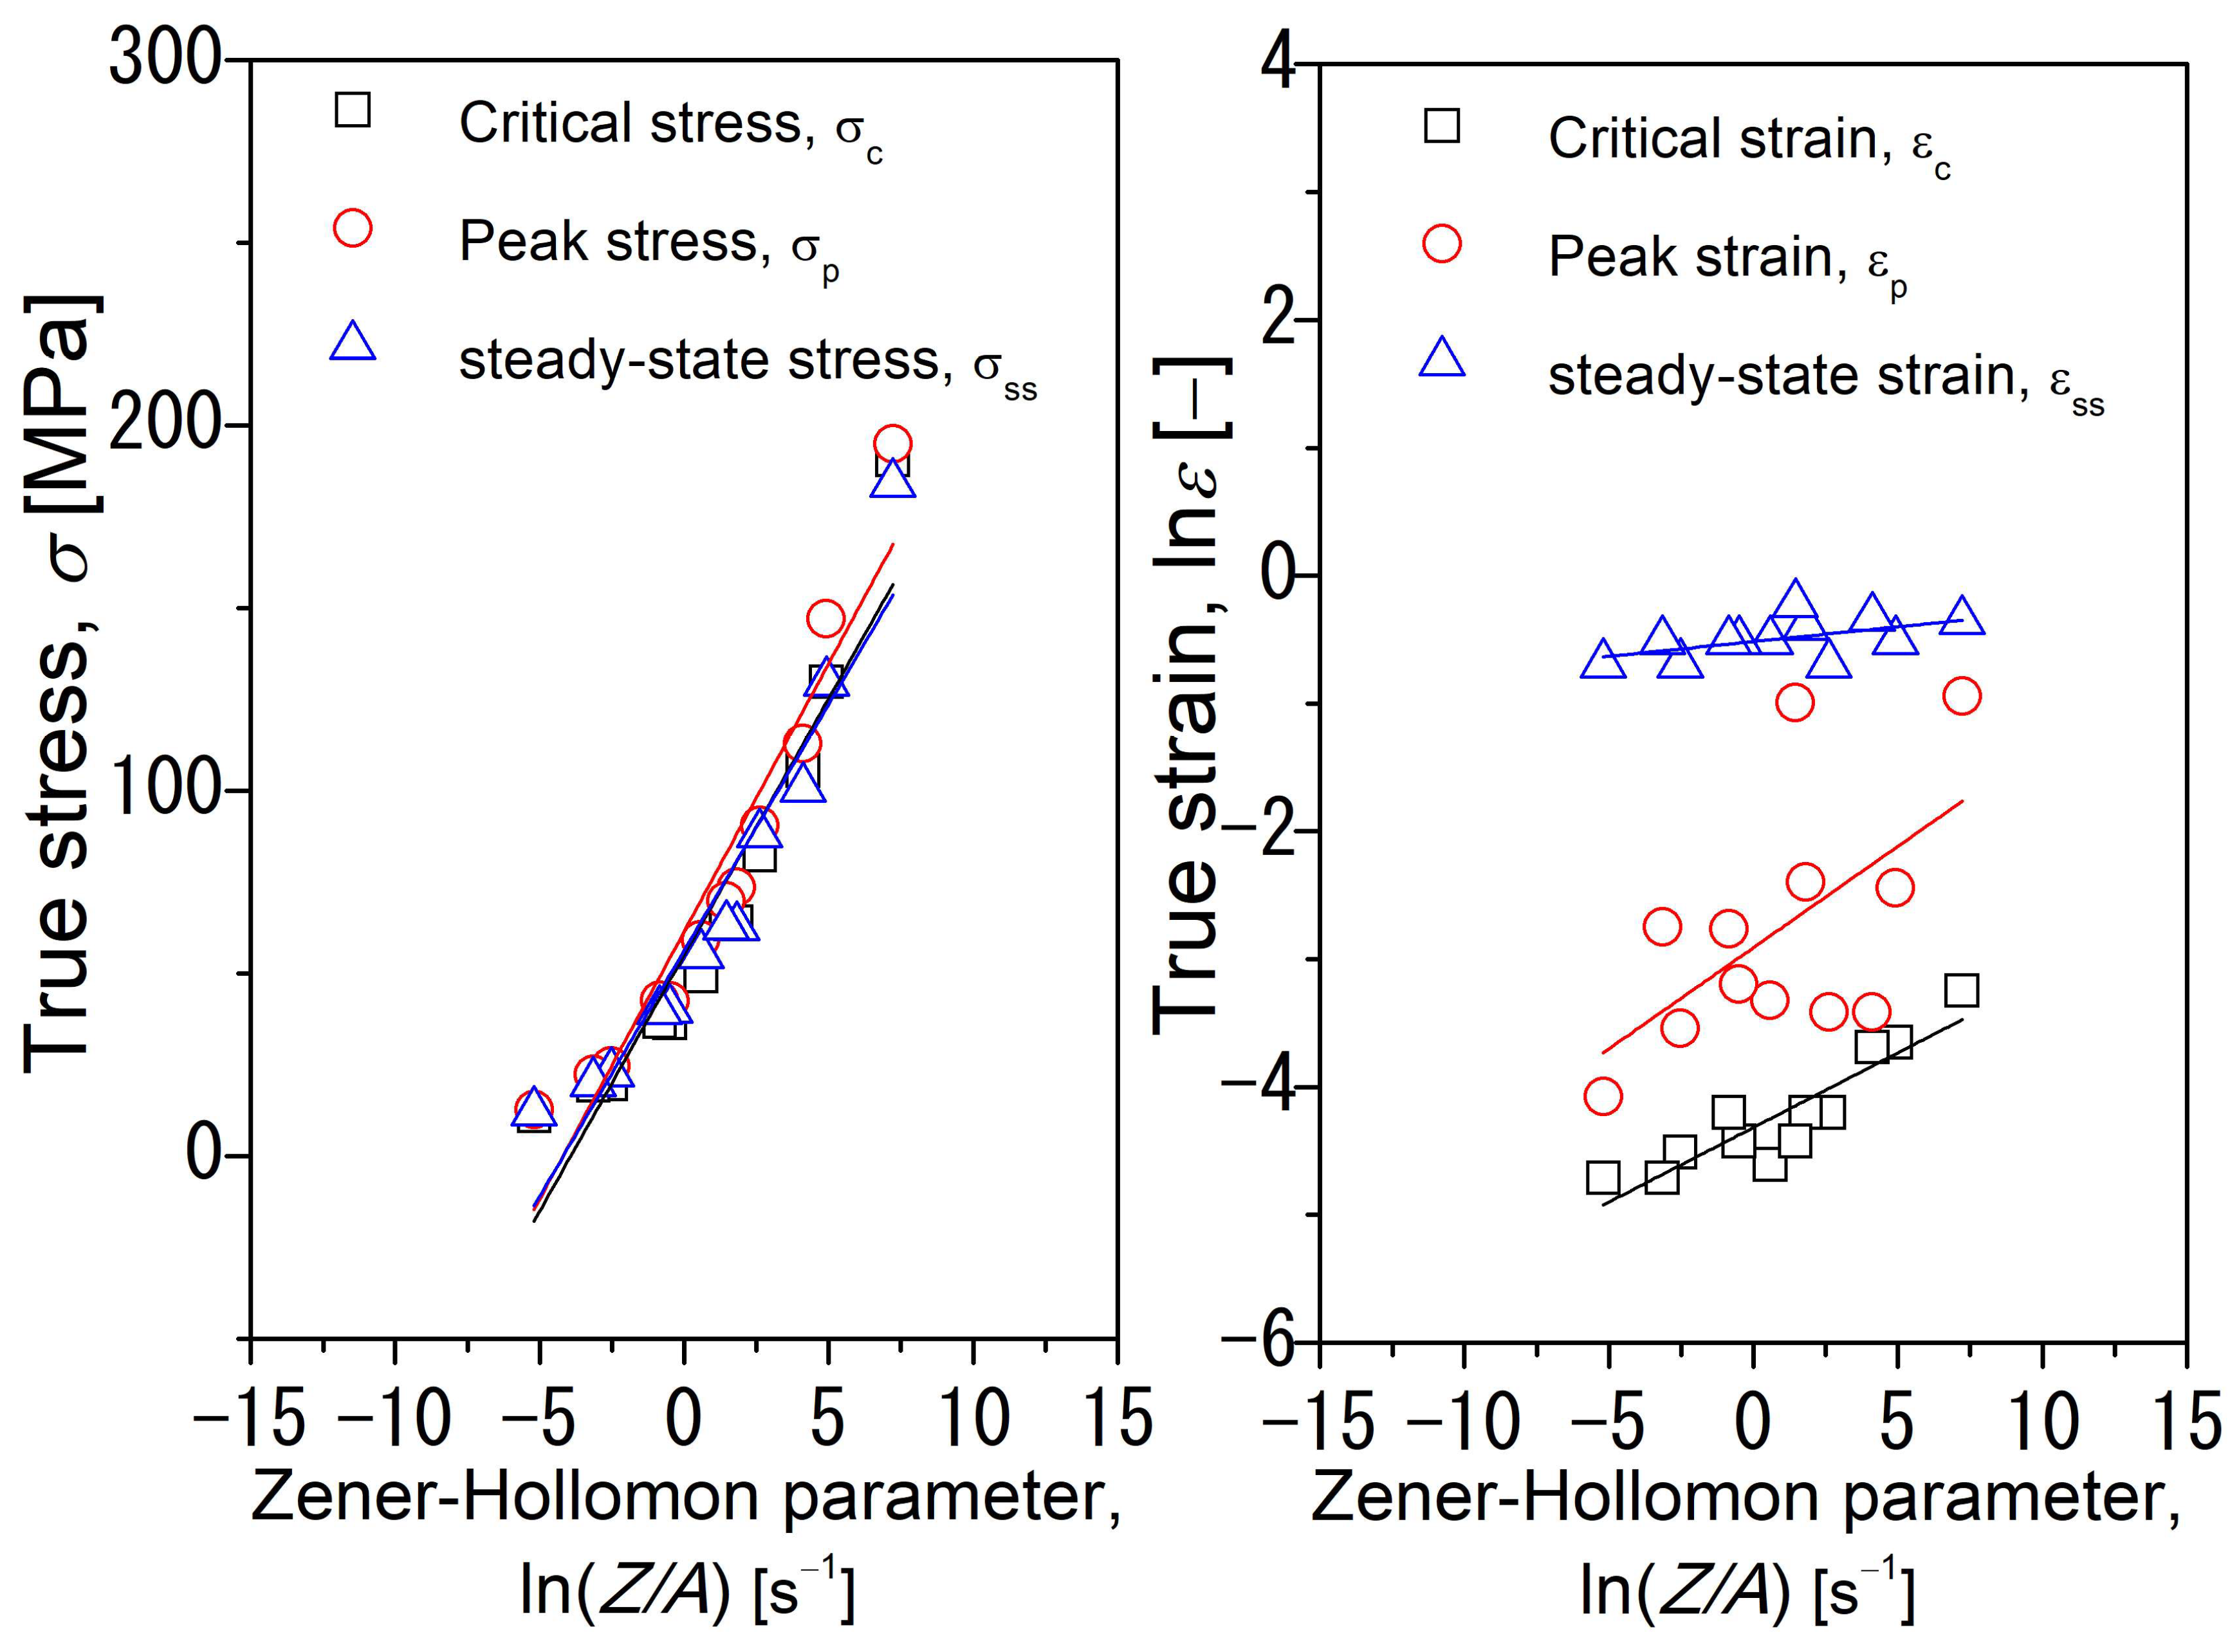
Metals 13 01195 g006
Figure 7. Relationships between the dimensionless parameter Z/A and the given parameters (σc/εc—critical stress and strain for the onset of the DRX, σp/εp—peak stress and strain, σss/εss—steady-state stress and strain) obtained through linear fitting.
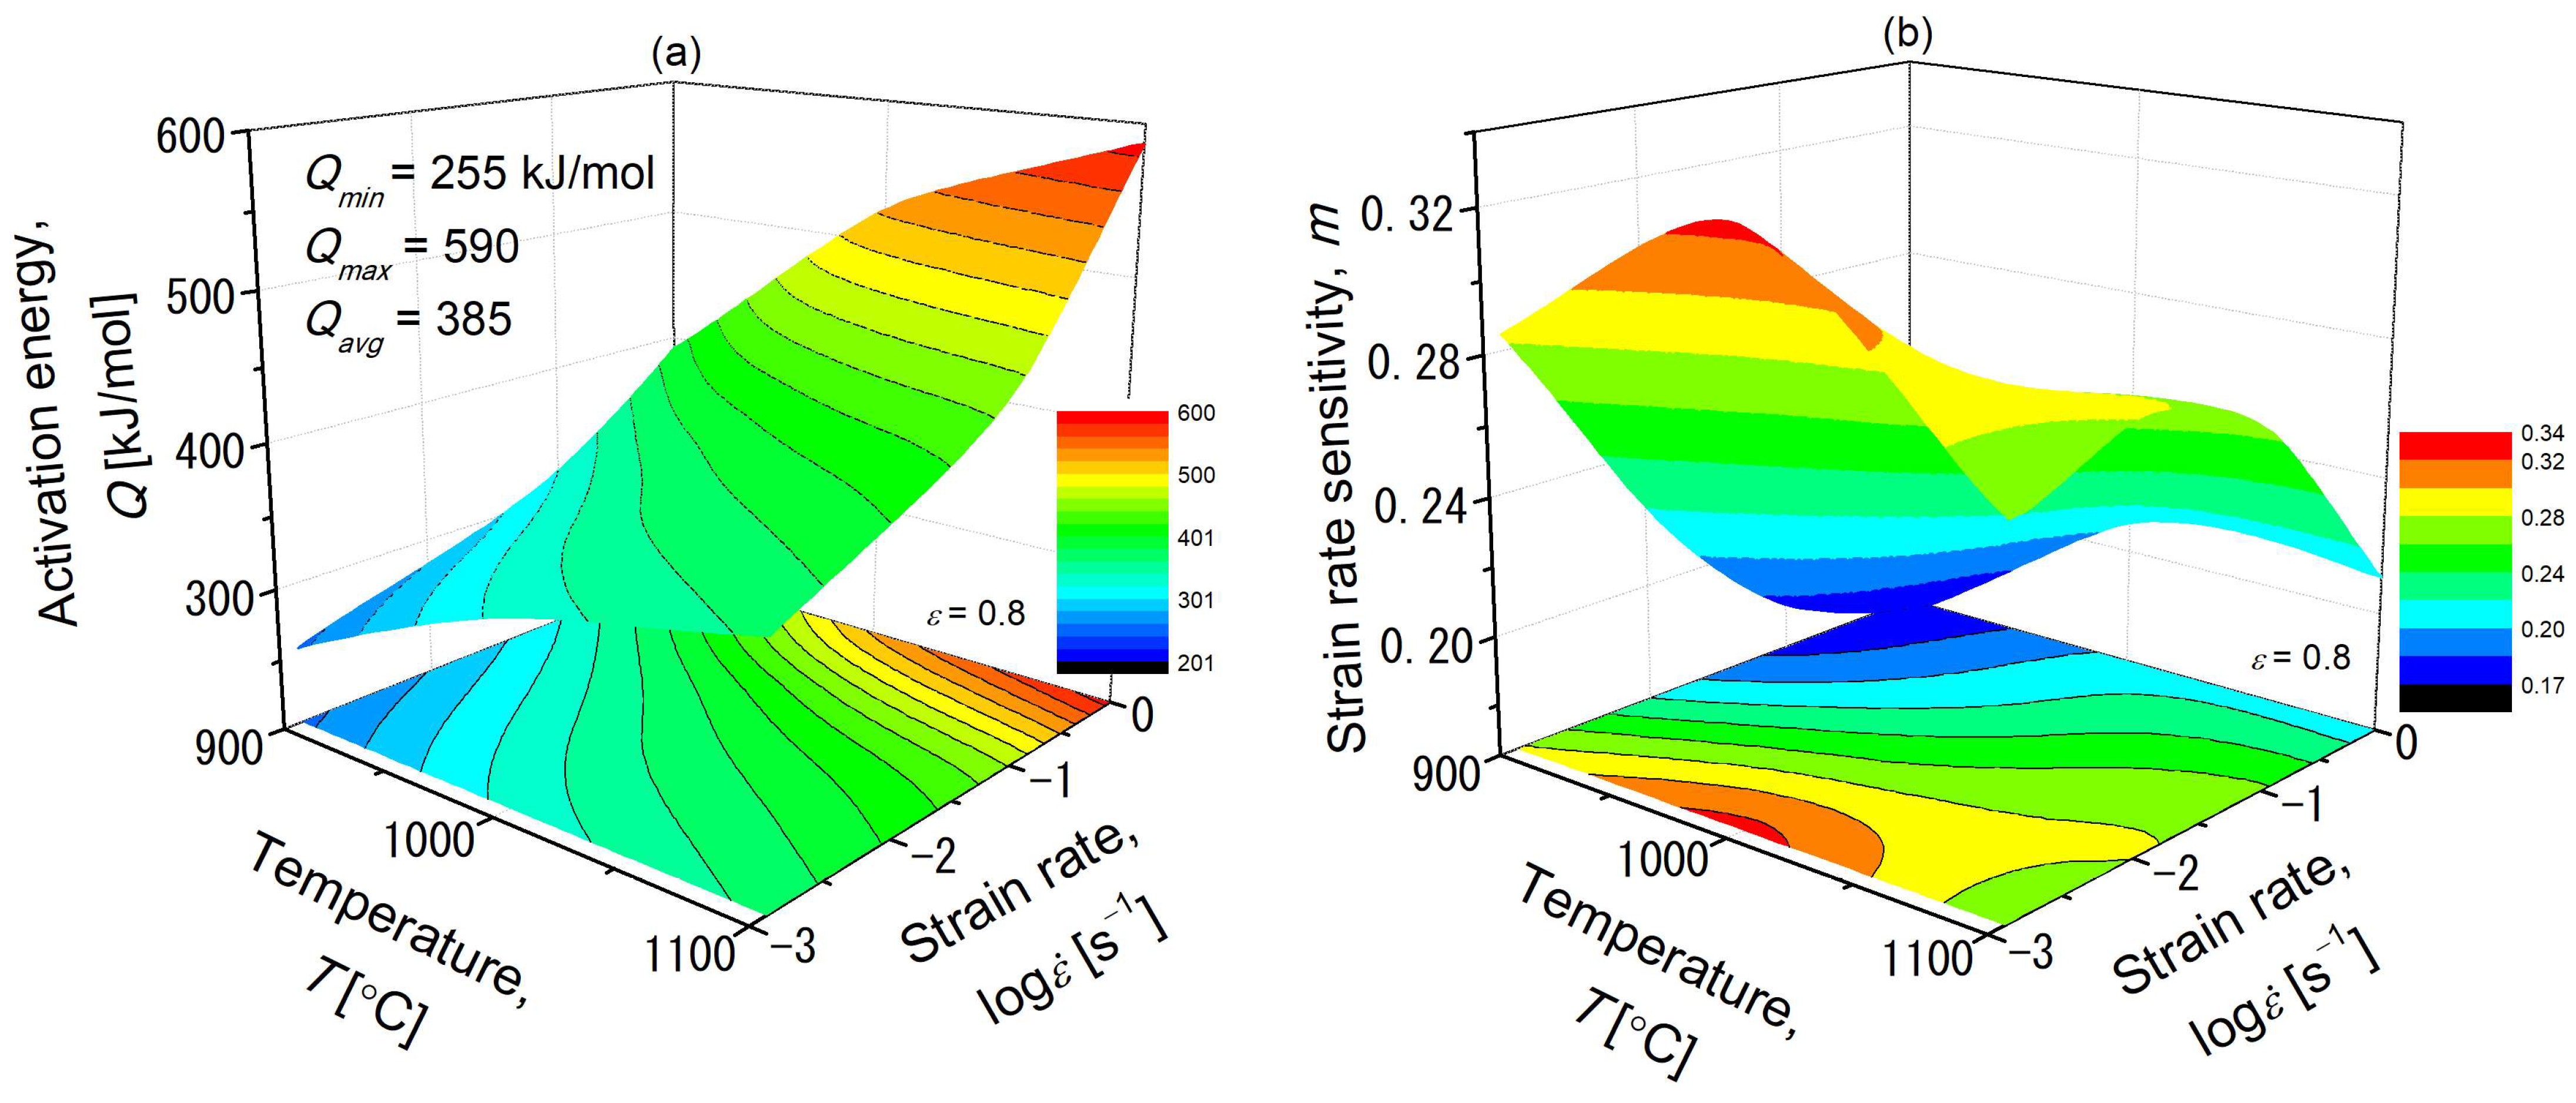
Metals 13 01195 g007
Figure 8. Three-dimensional activation energy, Q, (a) and strain rate sensitivity, m, (b) maps for the Fe-25Al-1.5Ta alloy at a true strain of 0.8, showing the average Q of 385 kJ·mol−1 over the whole deformation range and the highest m value of 0.33 at 1000 °C/0.0013 s−1.
Metals 13 01195 g008
Figure 9. Processing map for the as-cast Fe-25Al-1.5Ta alloy at a true strain of 0.2 (a), 0.5 (b), and 0.8 (c), showing the safe and unsafe processing domains. The hatched region S in (a) represents a low-efficiency domain, including flow instability at 900 °C/1 s−1. The areas highlighted in yellow (denoted as D1, D2, and D3) indicate the optimum processing windows with the most efficient energy dissipation. The solid and dash contour numbers indicate the efficiency of the power dissipation (η) in percent and the instability parameter (ξ), respectively.
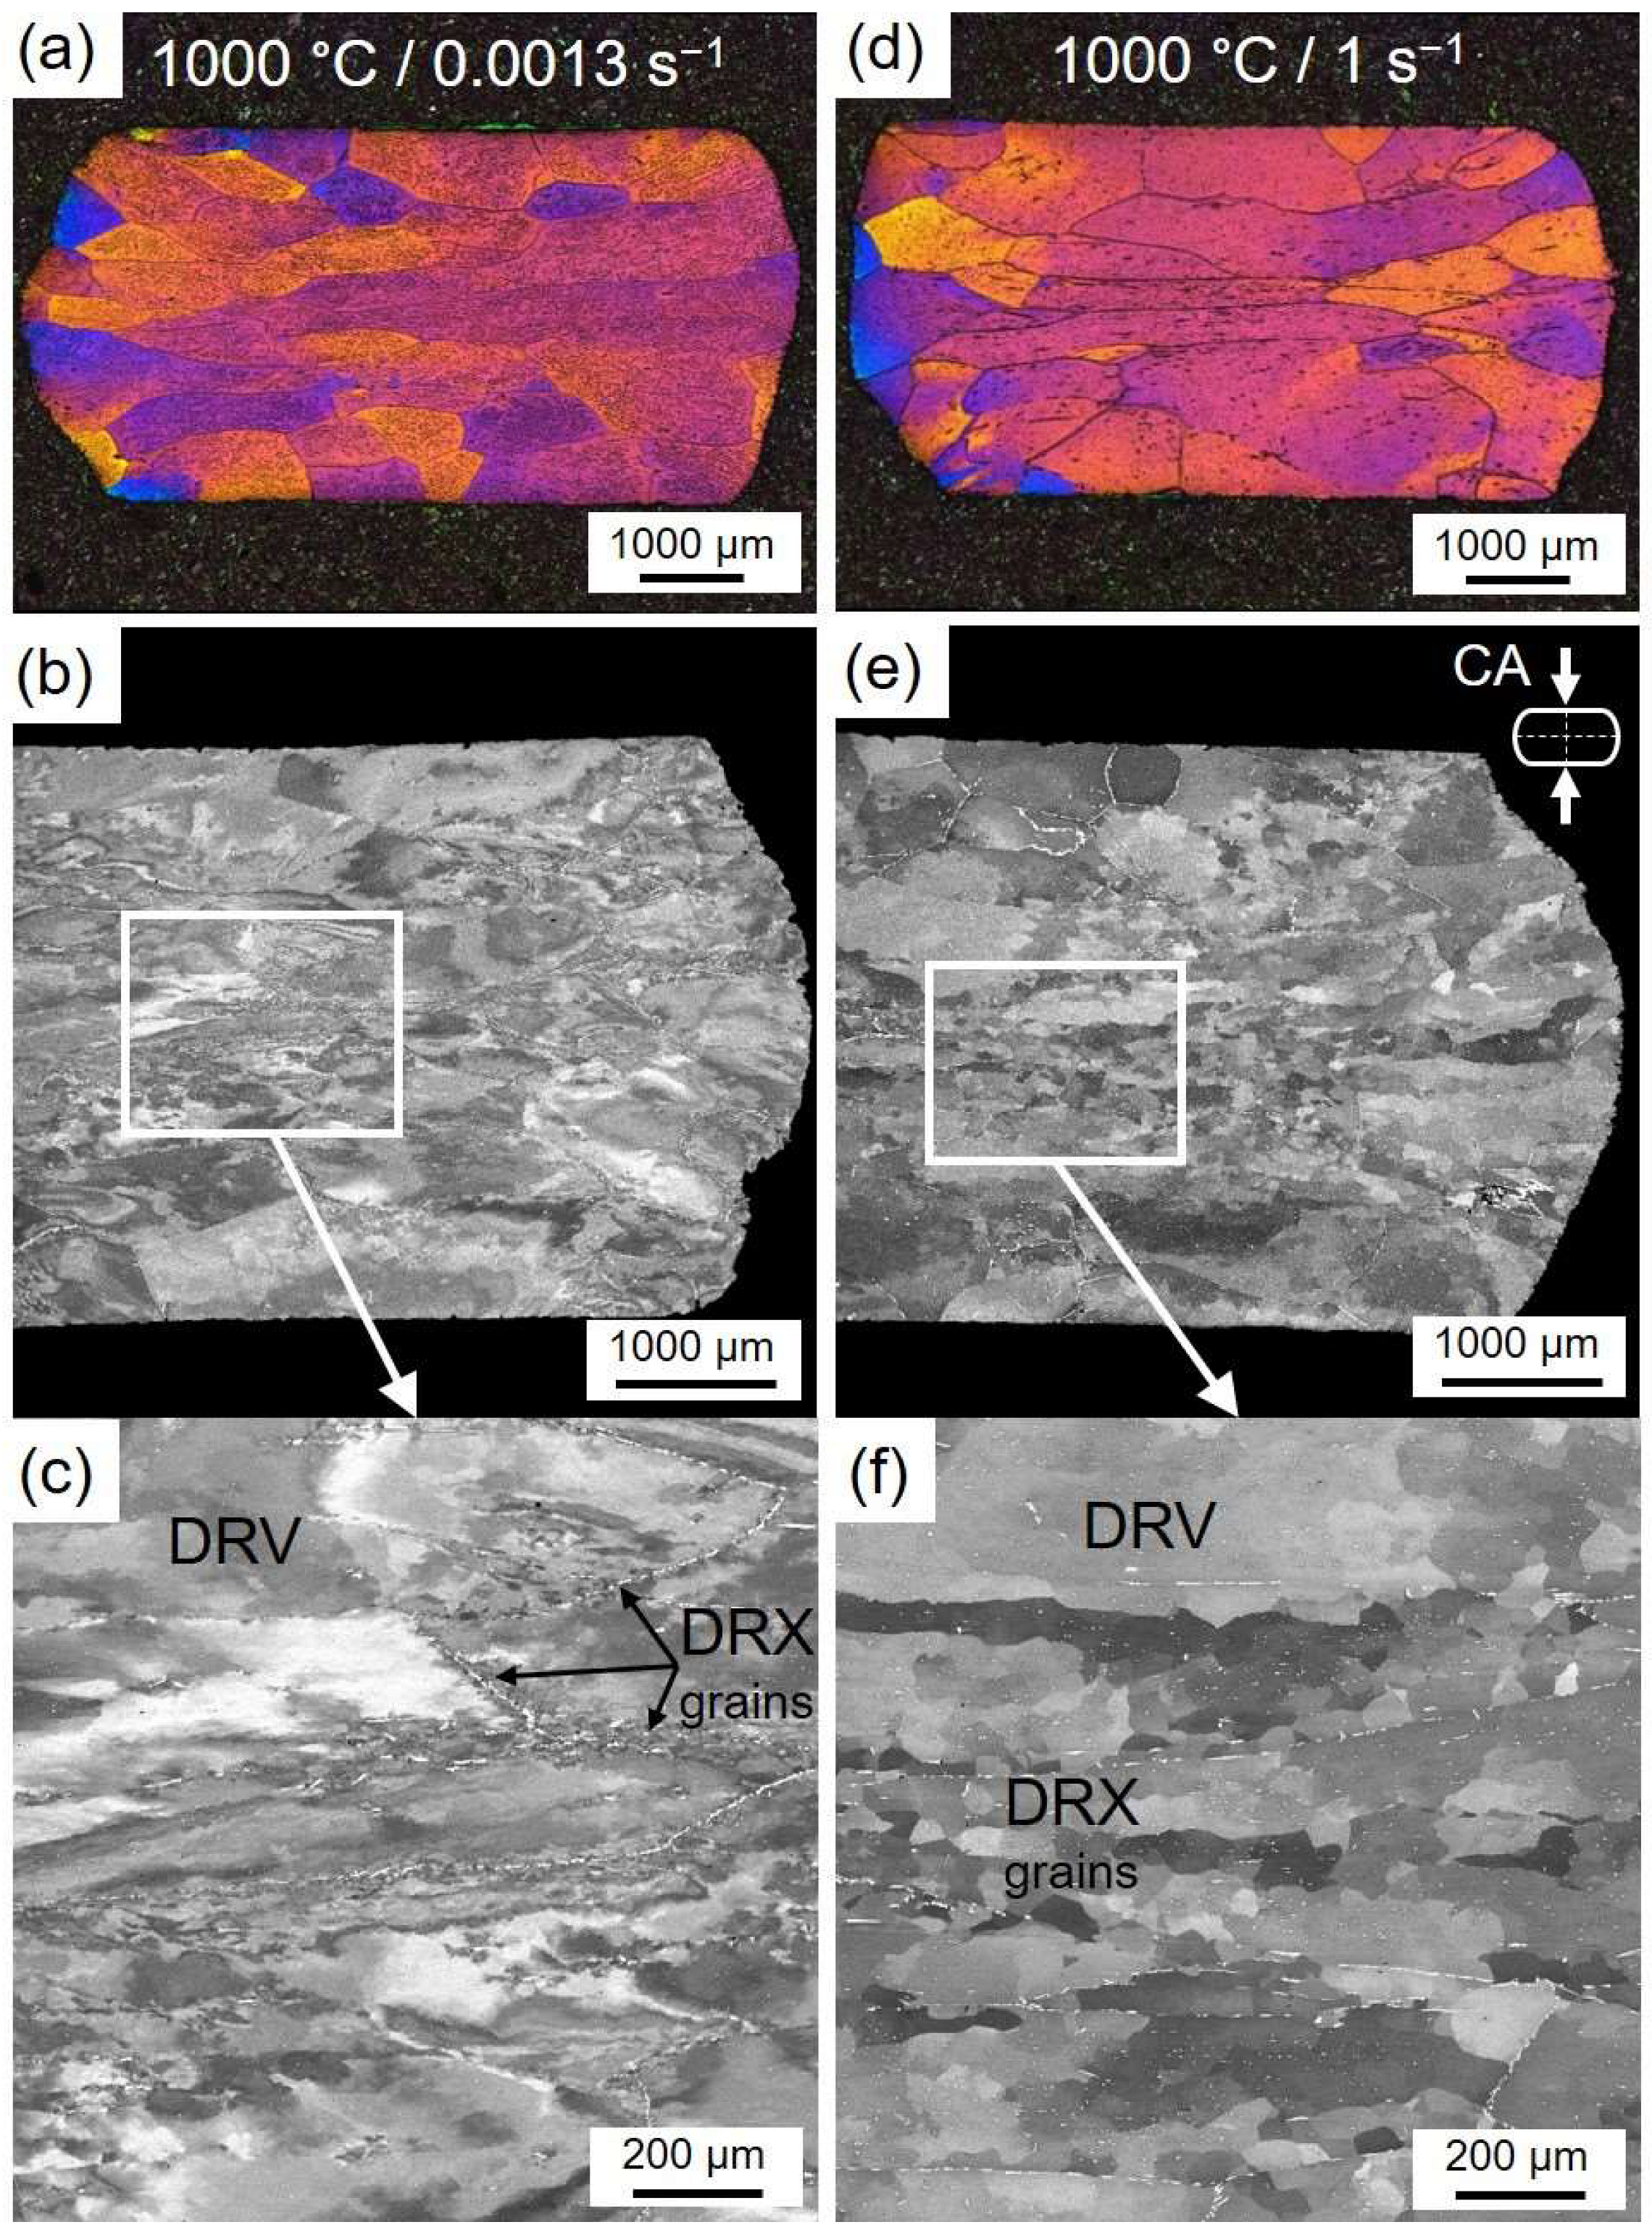
Metals 13 01195 g009
Figure 10. Representative OM image (a,d) and BSE-SEM micrographs (b,c,e,f) for the Fe-25Al-1.5Ta specimens hot compressed to a true strain of 0.8 at 1000 °C with a strain rate of 0.0013 s−1, corresponding to D3 in the processing map in Figure 9c, (ac) and 1 s−1 (df), showing elongated deformed grains with orientation gradients and substructures inside and a few small grains located close to the initial grain boundary regions (indicated by the arrows). The C14 Laves phase precipitates appear white in the BSE-SEM micrographs. The compression axis (CA) is vertical.
Metals 13 01195 g010
Table 1. The constitutive equations derived for the as-cast Fe-25Al-1.5Ta alloy describing the flow behavior and the correlation between the given parameters (σc/εc—critical stress and strain for the initiation of the DRX, σp/εp—peak stress and strain, σss/εss—steady-state stress and strain), and the dimensionless parameter Z/A.
Z = ε ˙ exp 385.000 8.314 T = 1.13 × 10 14   sinh 0.019 σ 2.72
σ c = 56 + 13 ln Z A ε c = 0.01 Z A 0.11
σ p = 61 + 15 ln Z A ε p = 0.05 Z A 0.15
σ s s = 55 + 14 ln Z A ε s s = 0.6 Z A 0.02
Disclaimer/Publisher’s Note: The statements, opinions and data contained in all publications are solely those of the individual author(s) and contributor(s) and not of MDPI and/or the editor(s). MDPI and/or the editor(s) disclaim responsibility for any injury to people or property resulting from any ideas, methods, instructions or products referred to in the content.

