
Investigation of Oxide Thickness on Technical Aluminium Alloys—A Comparison of Characterization Methods
 , , and
Abstract
:1. Introduction
2. Materials and Methods
2.1. Materials
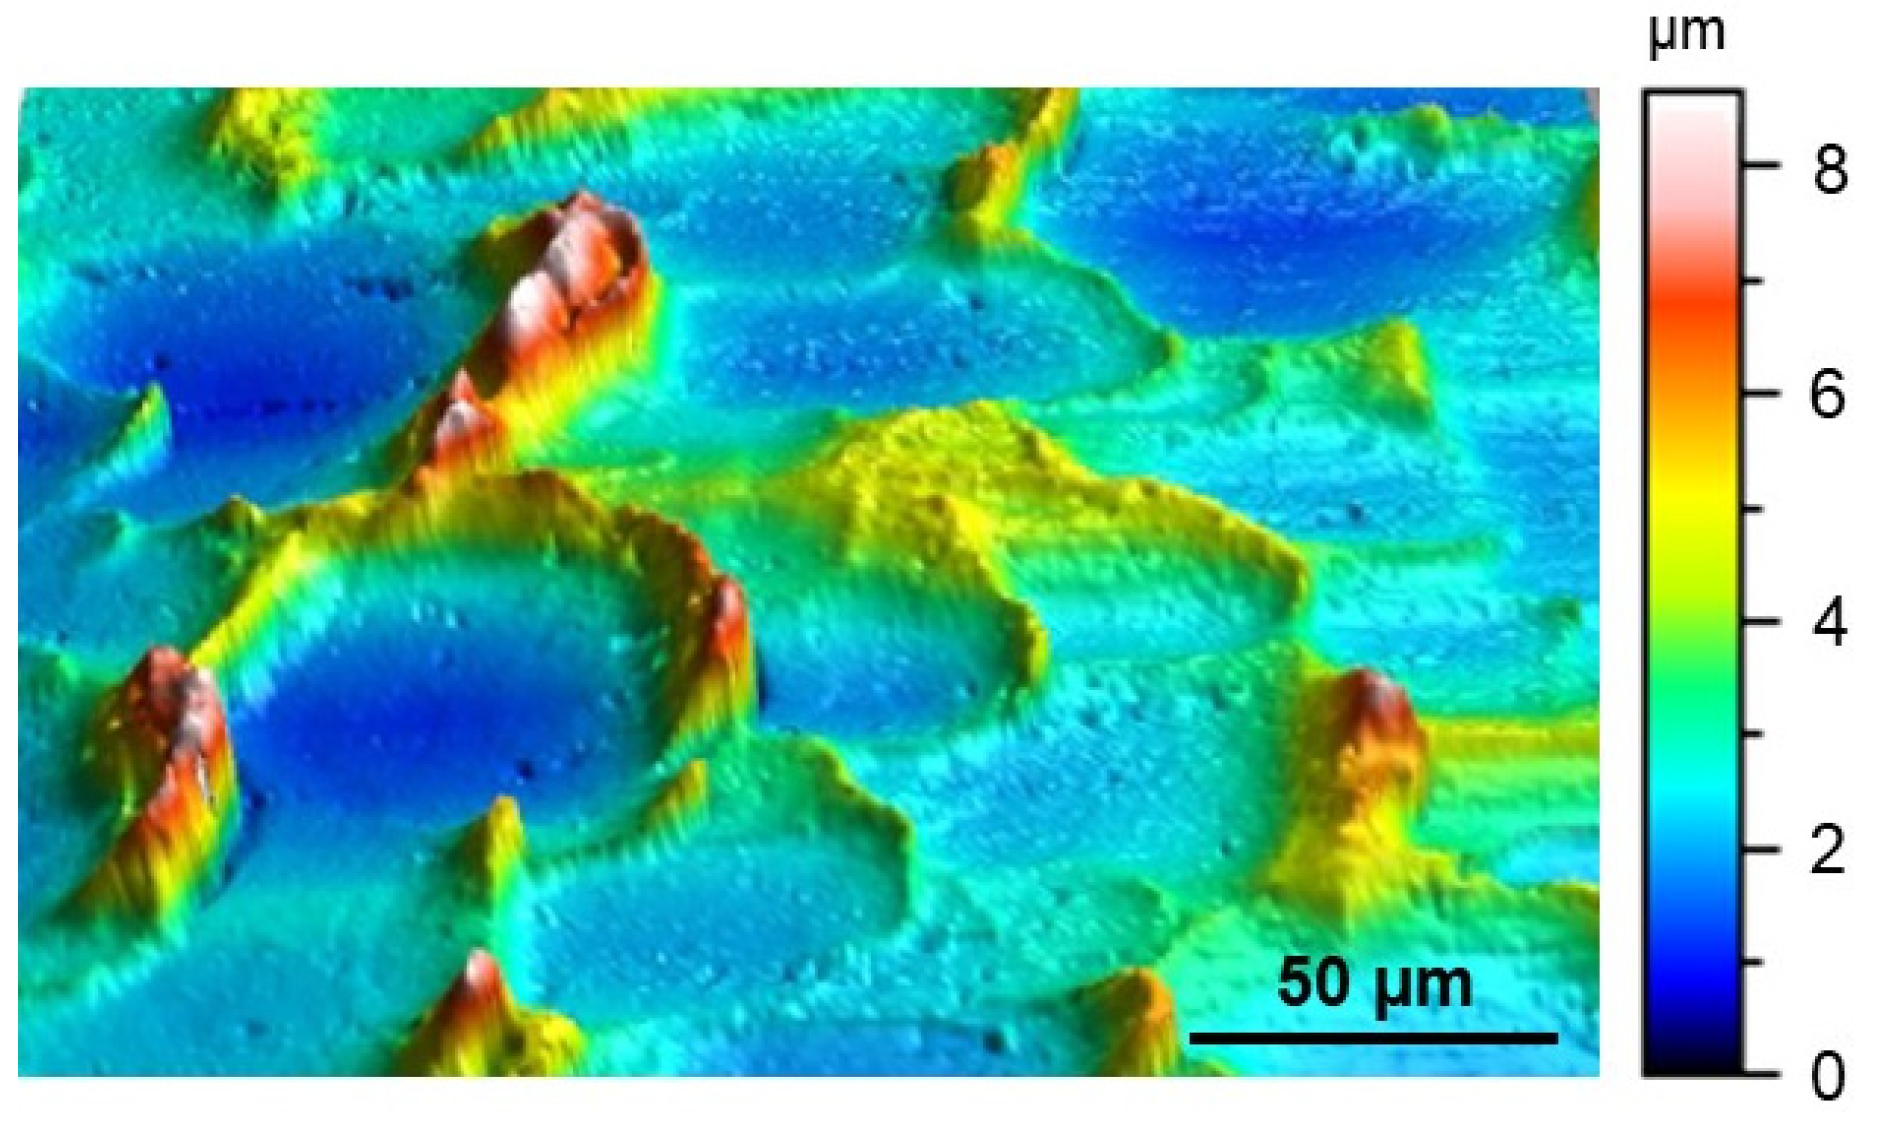
2.2. Sample Preparation
2.3. Instrumentation
3. Results
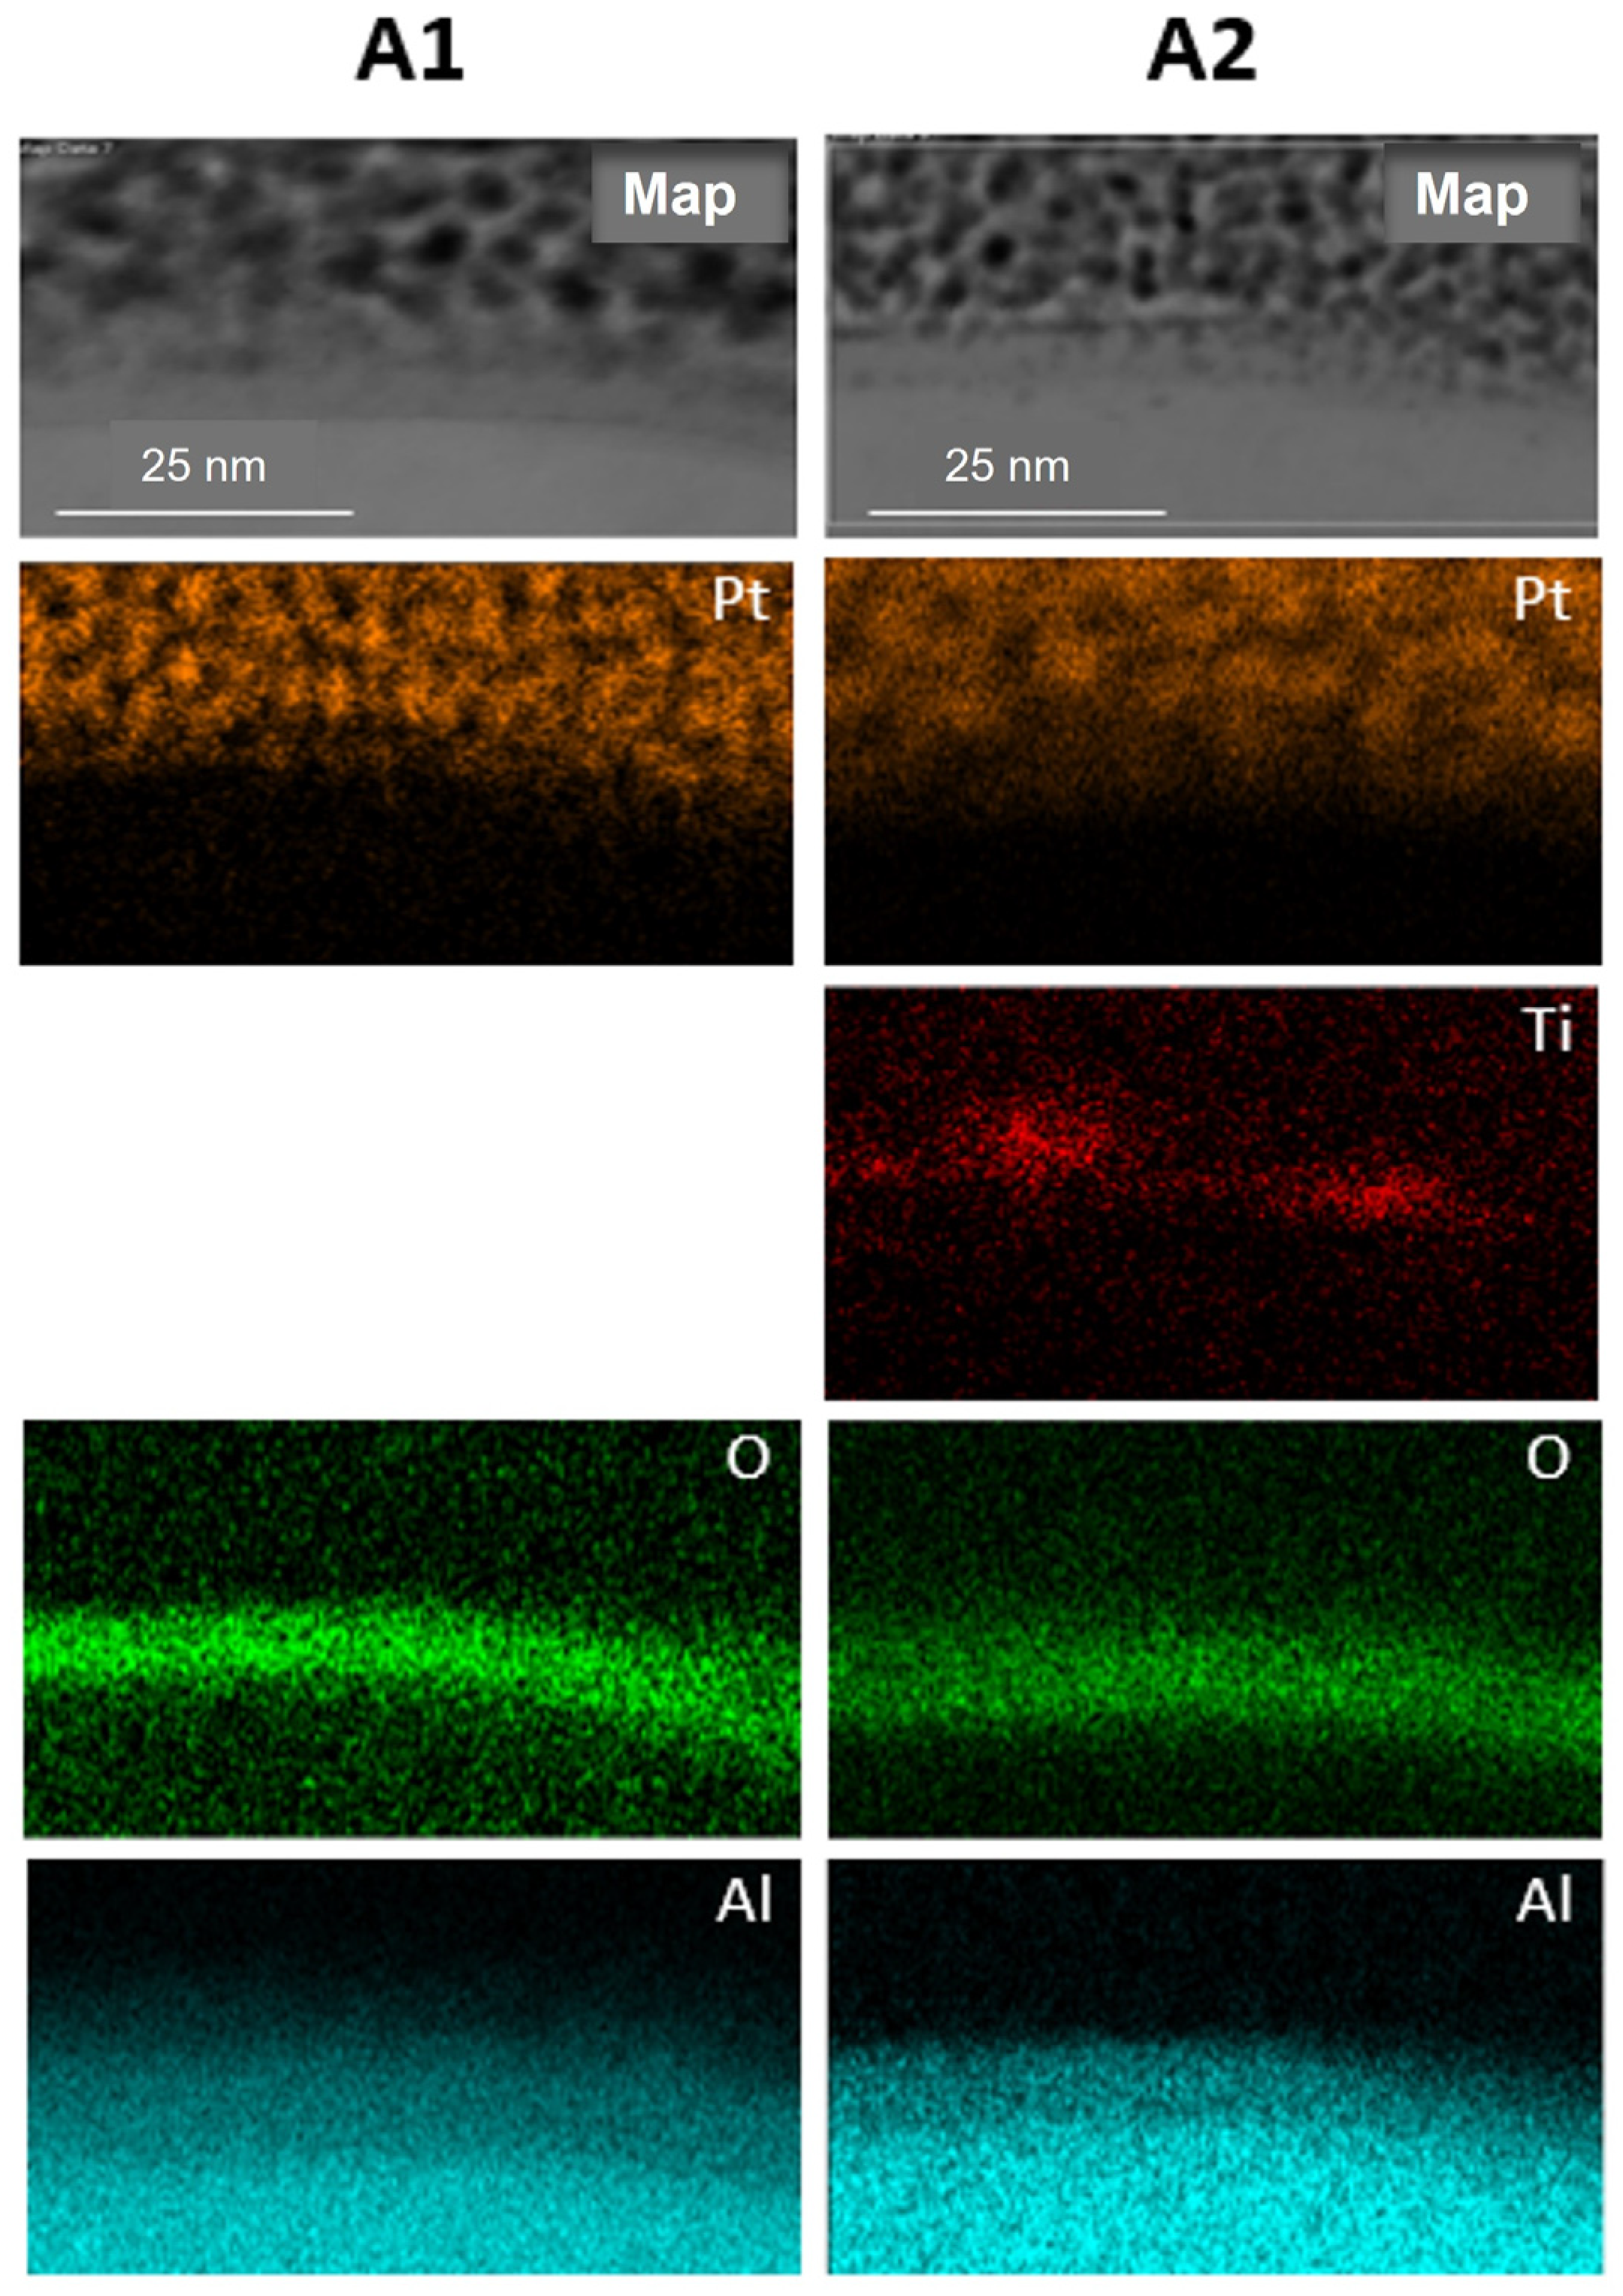
3.1. Reference Value from Transmission Electron Microscopy
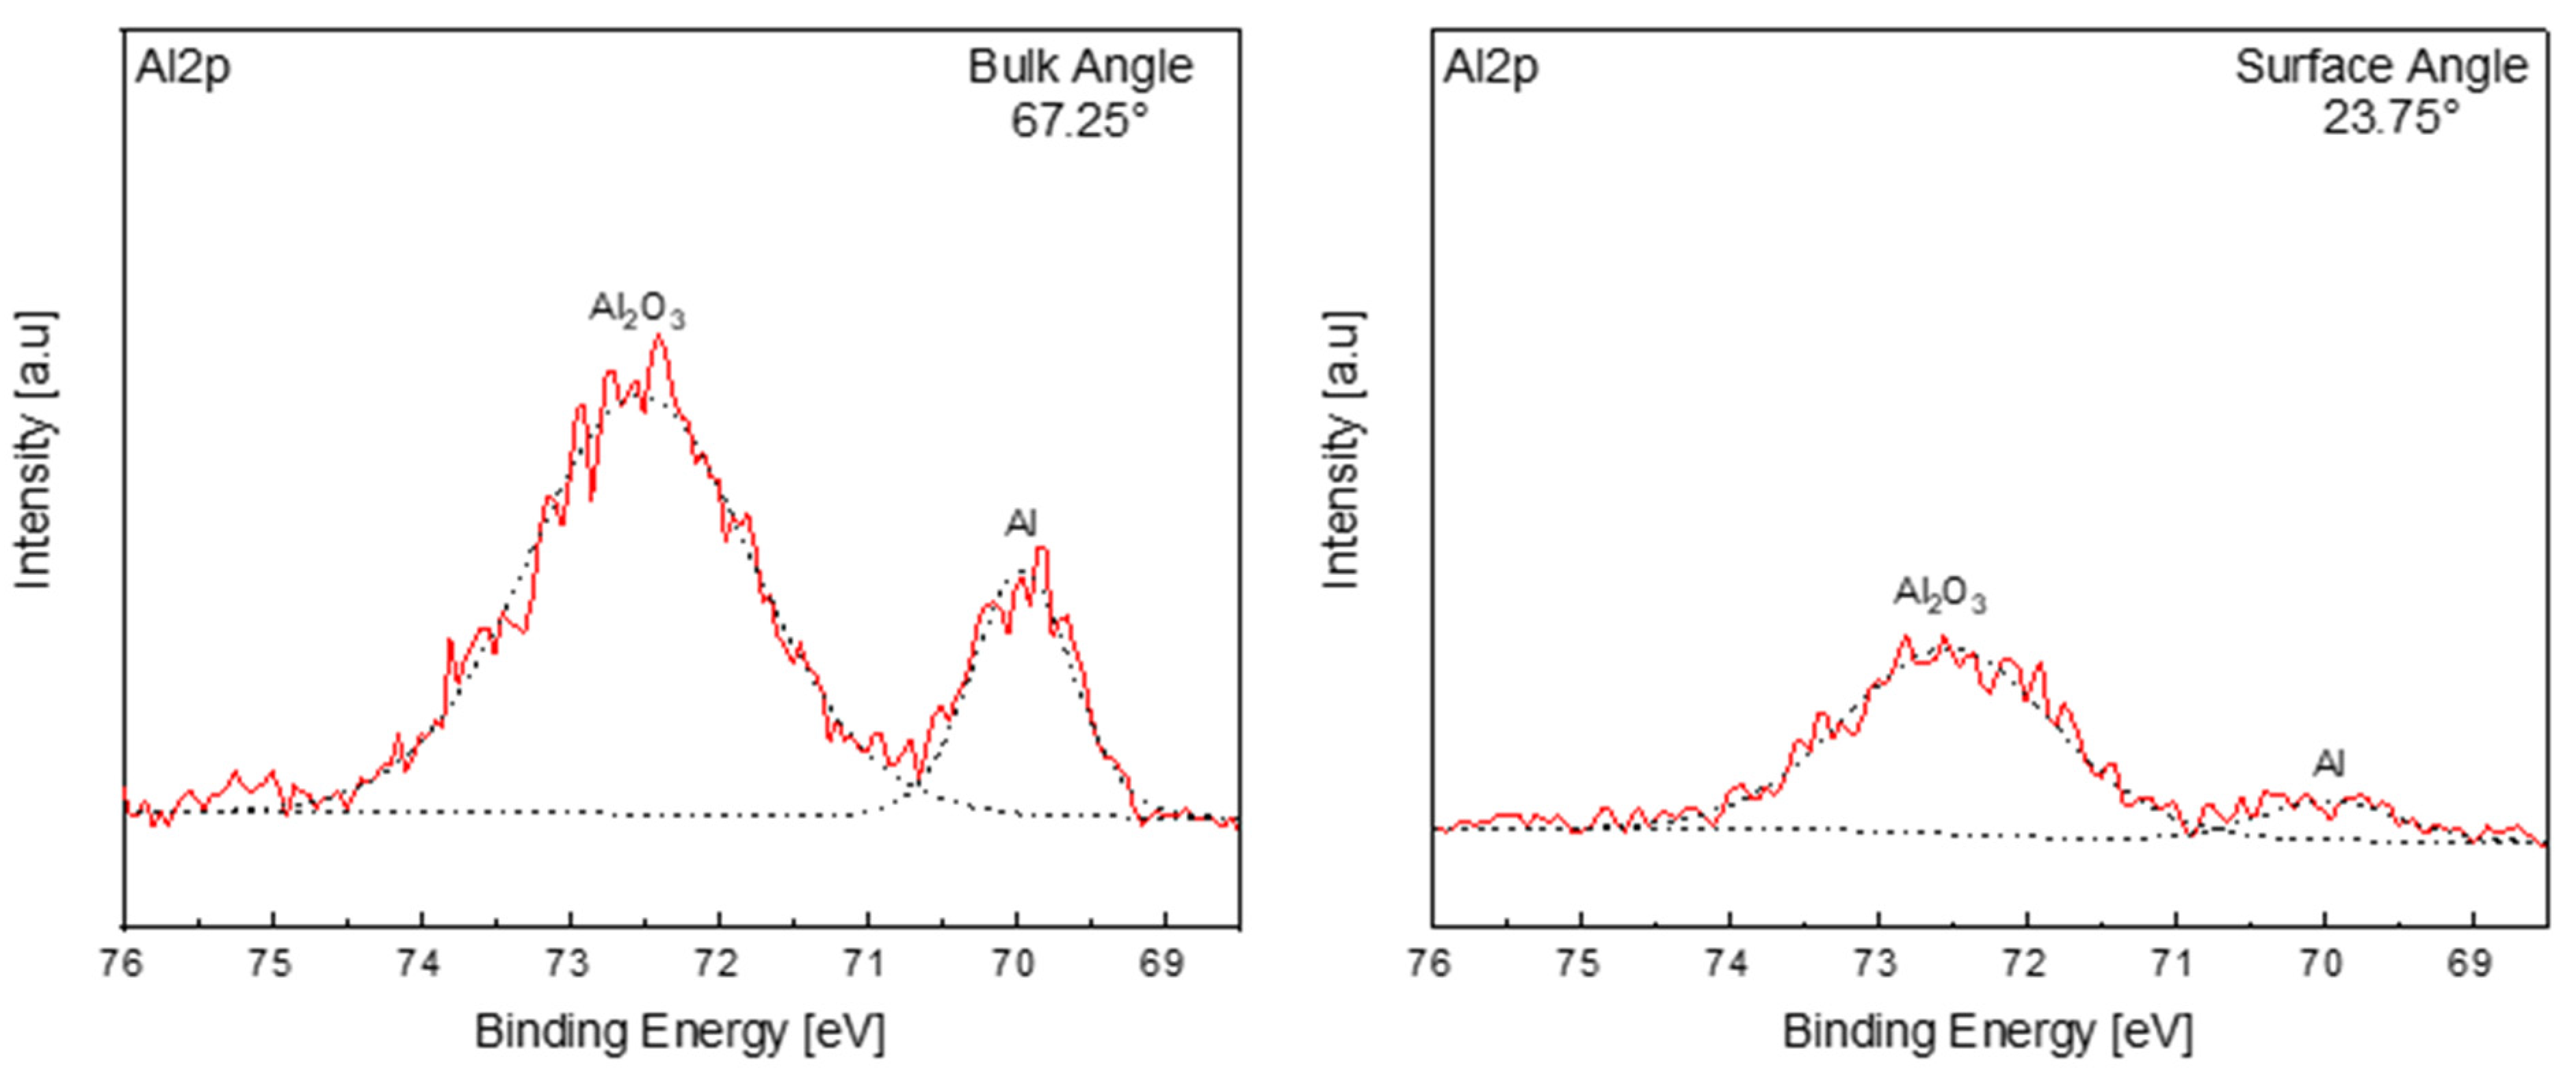
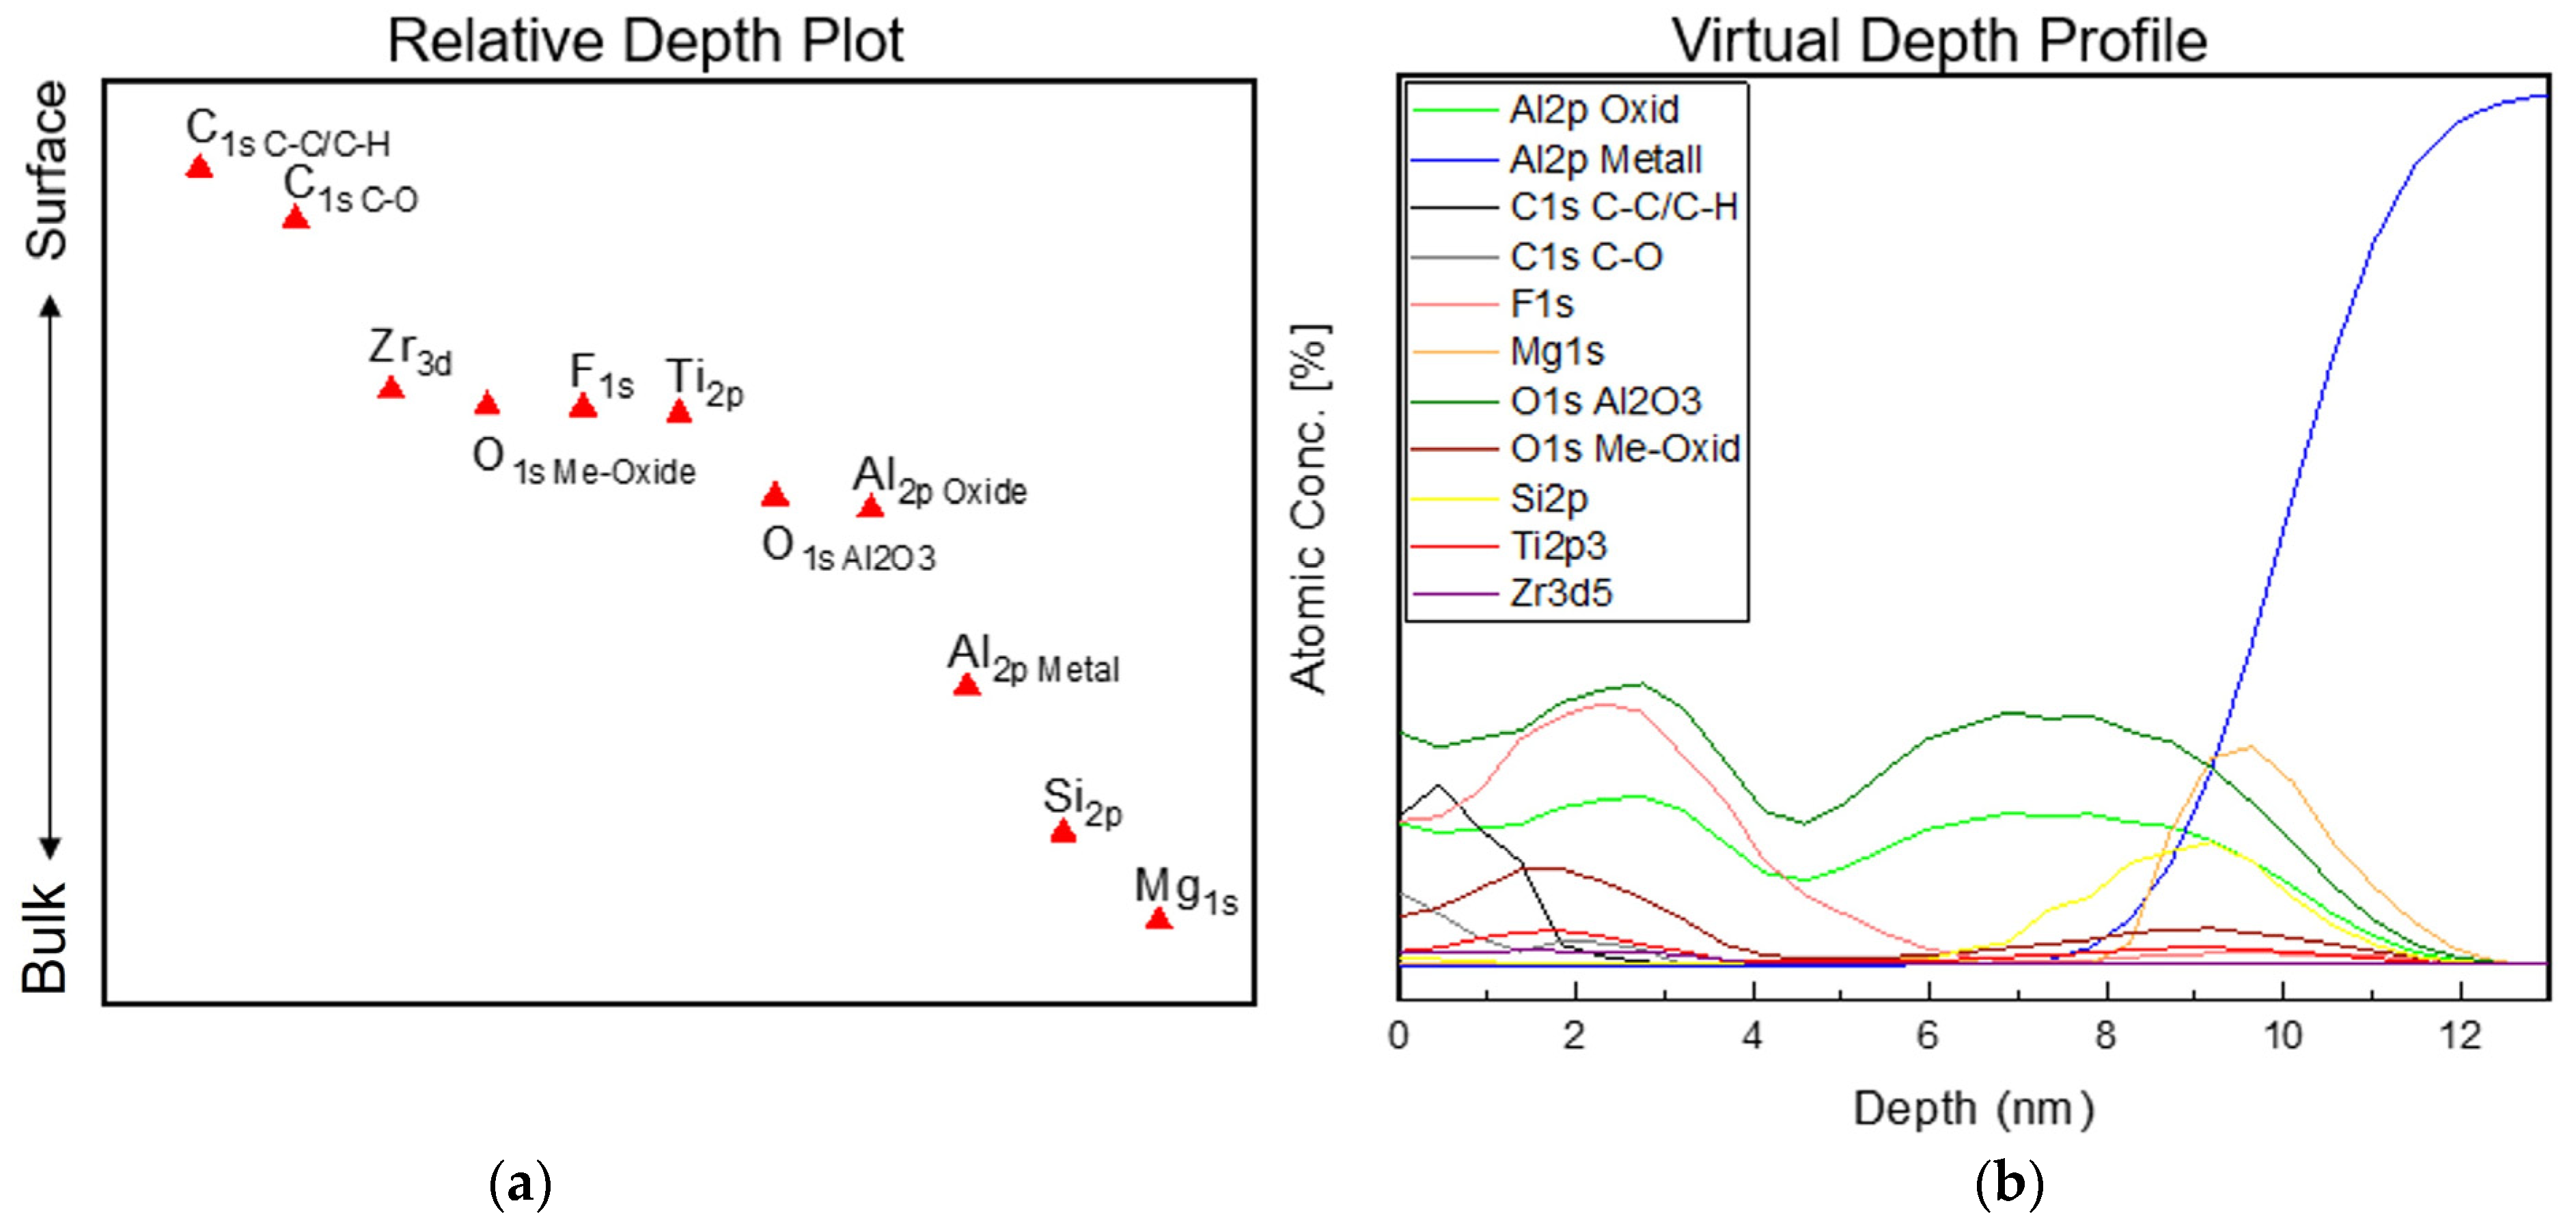
3.2. XPS
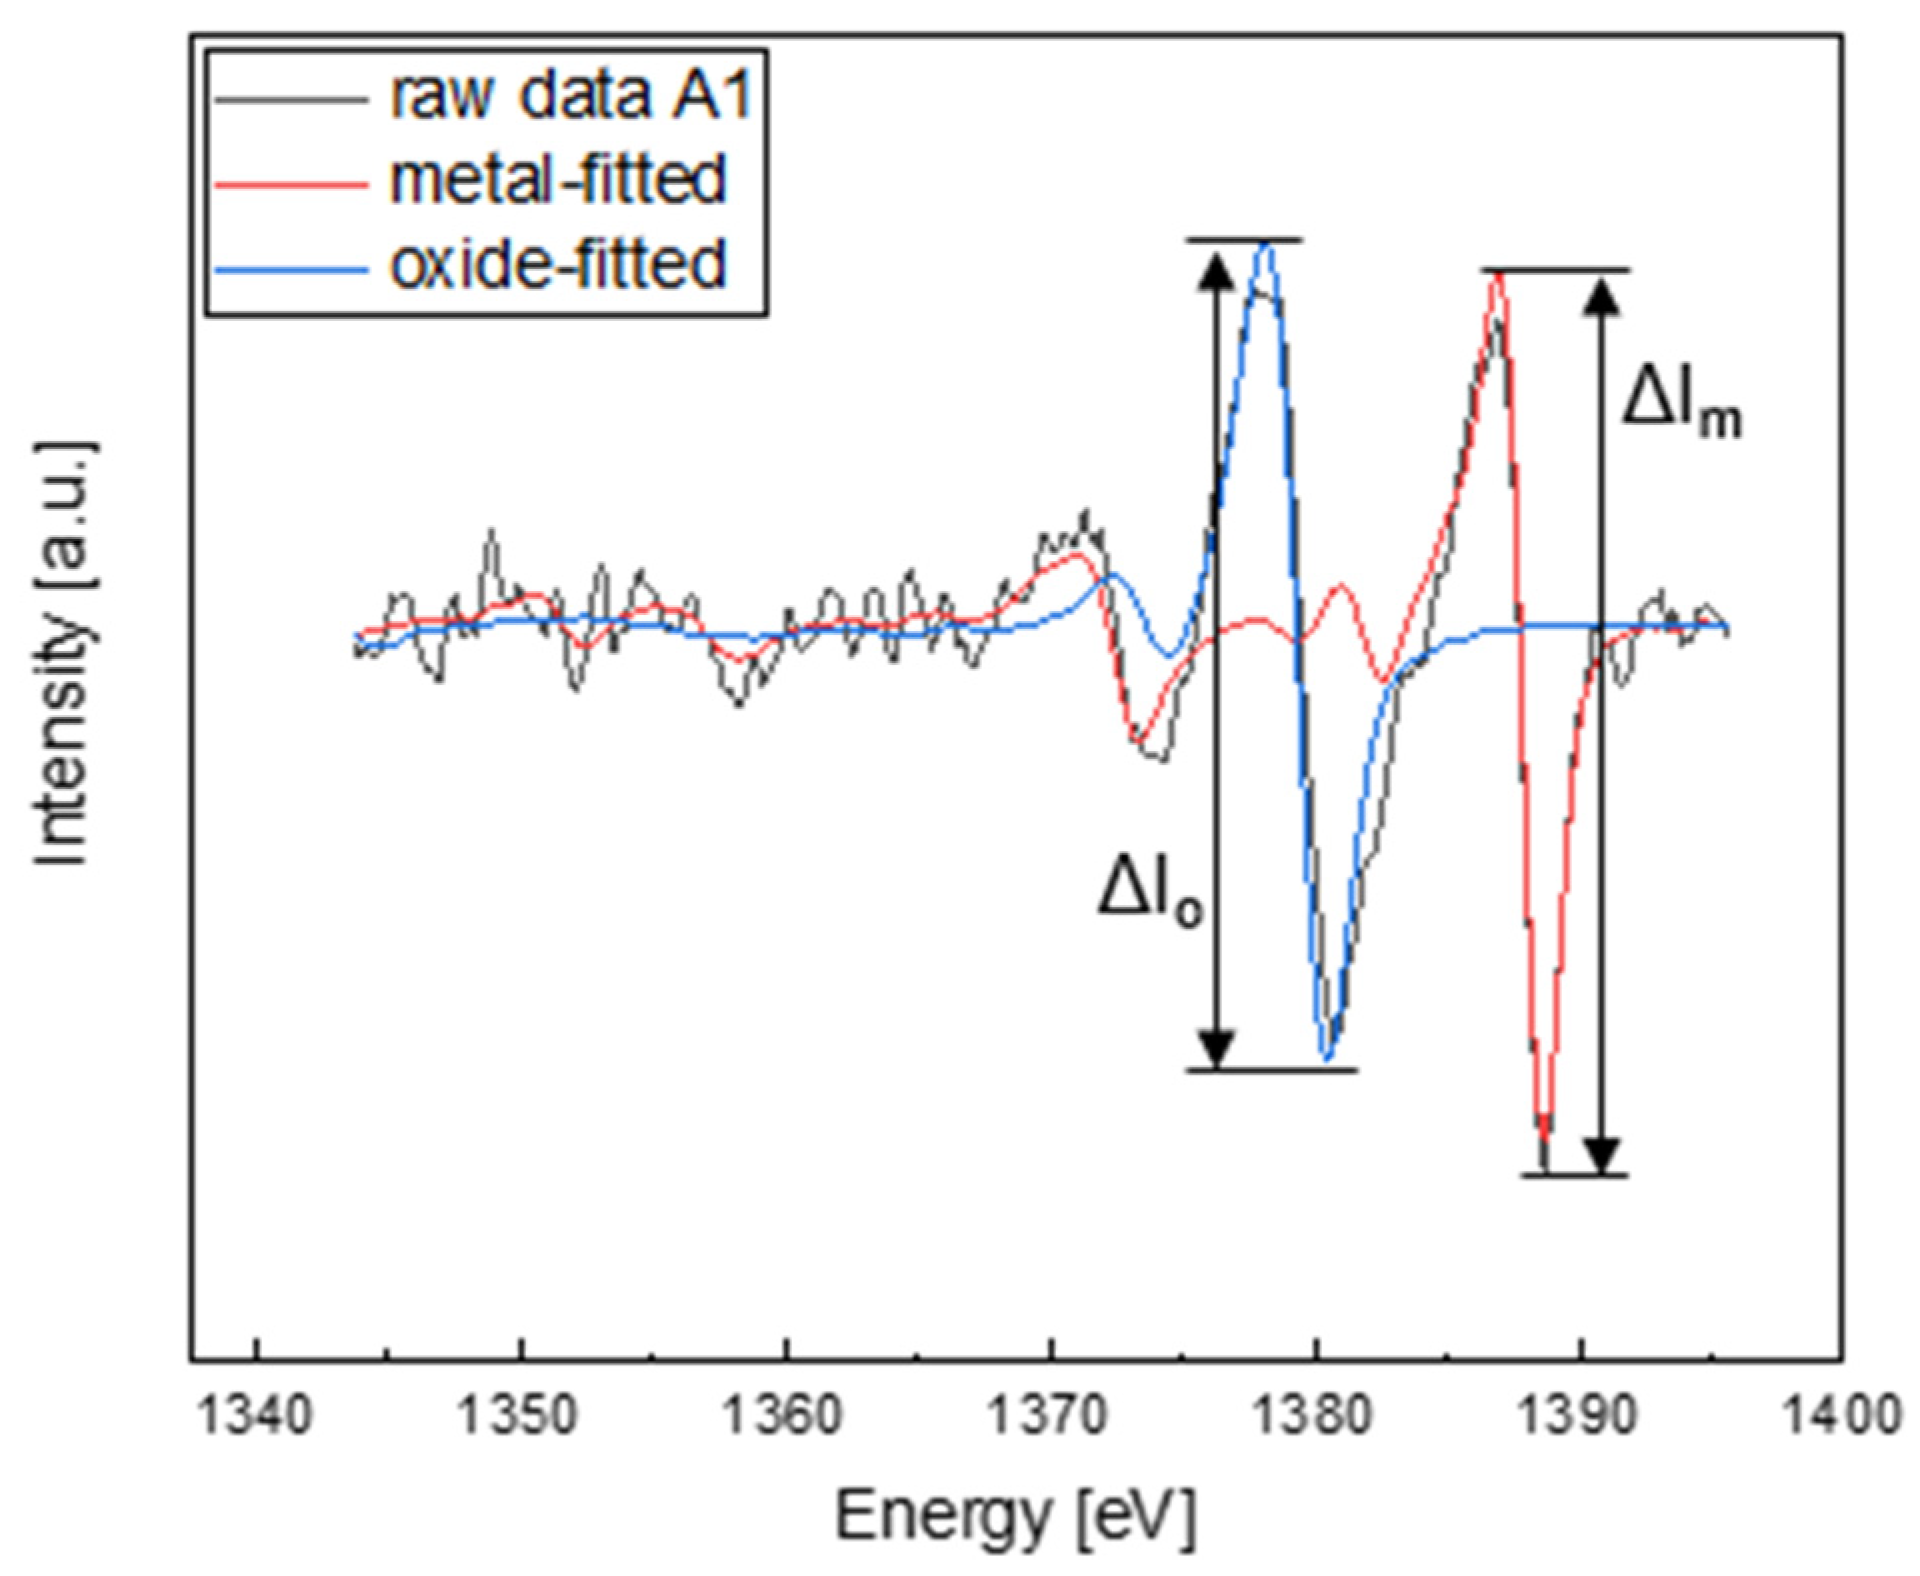
3.3. AES
4. Discussion
5. Conclusions
- (1)
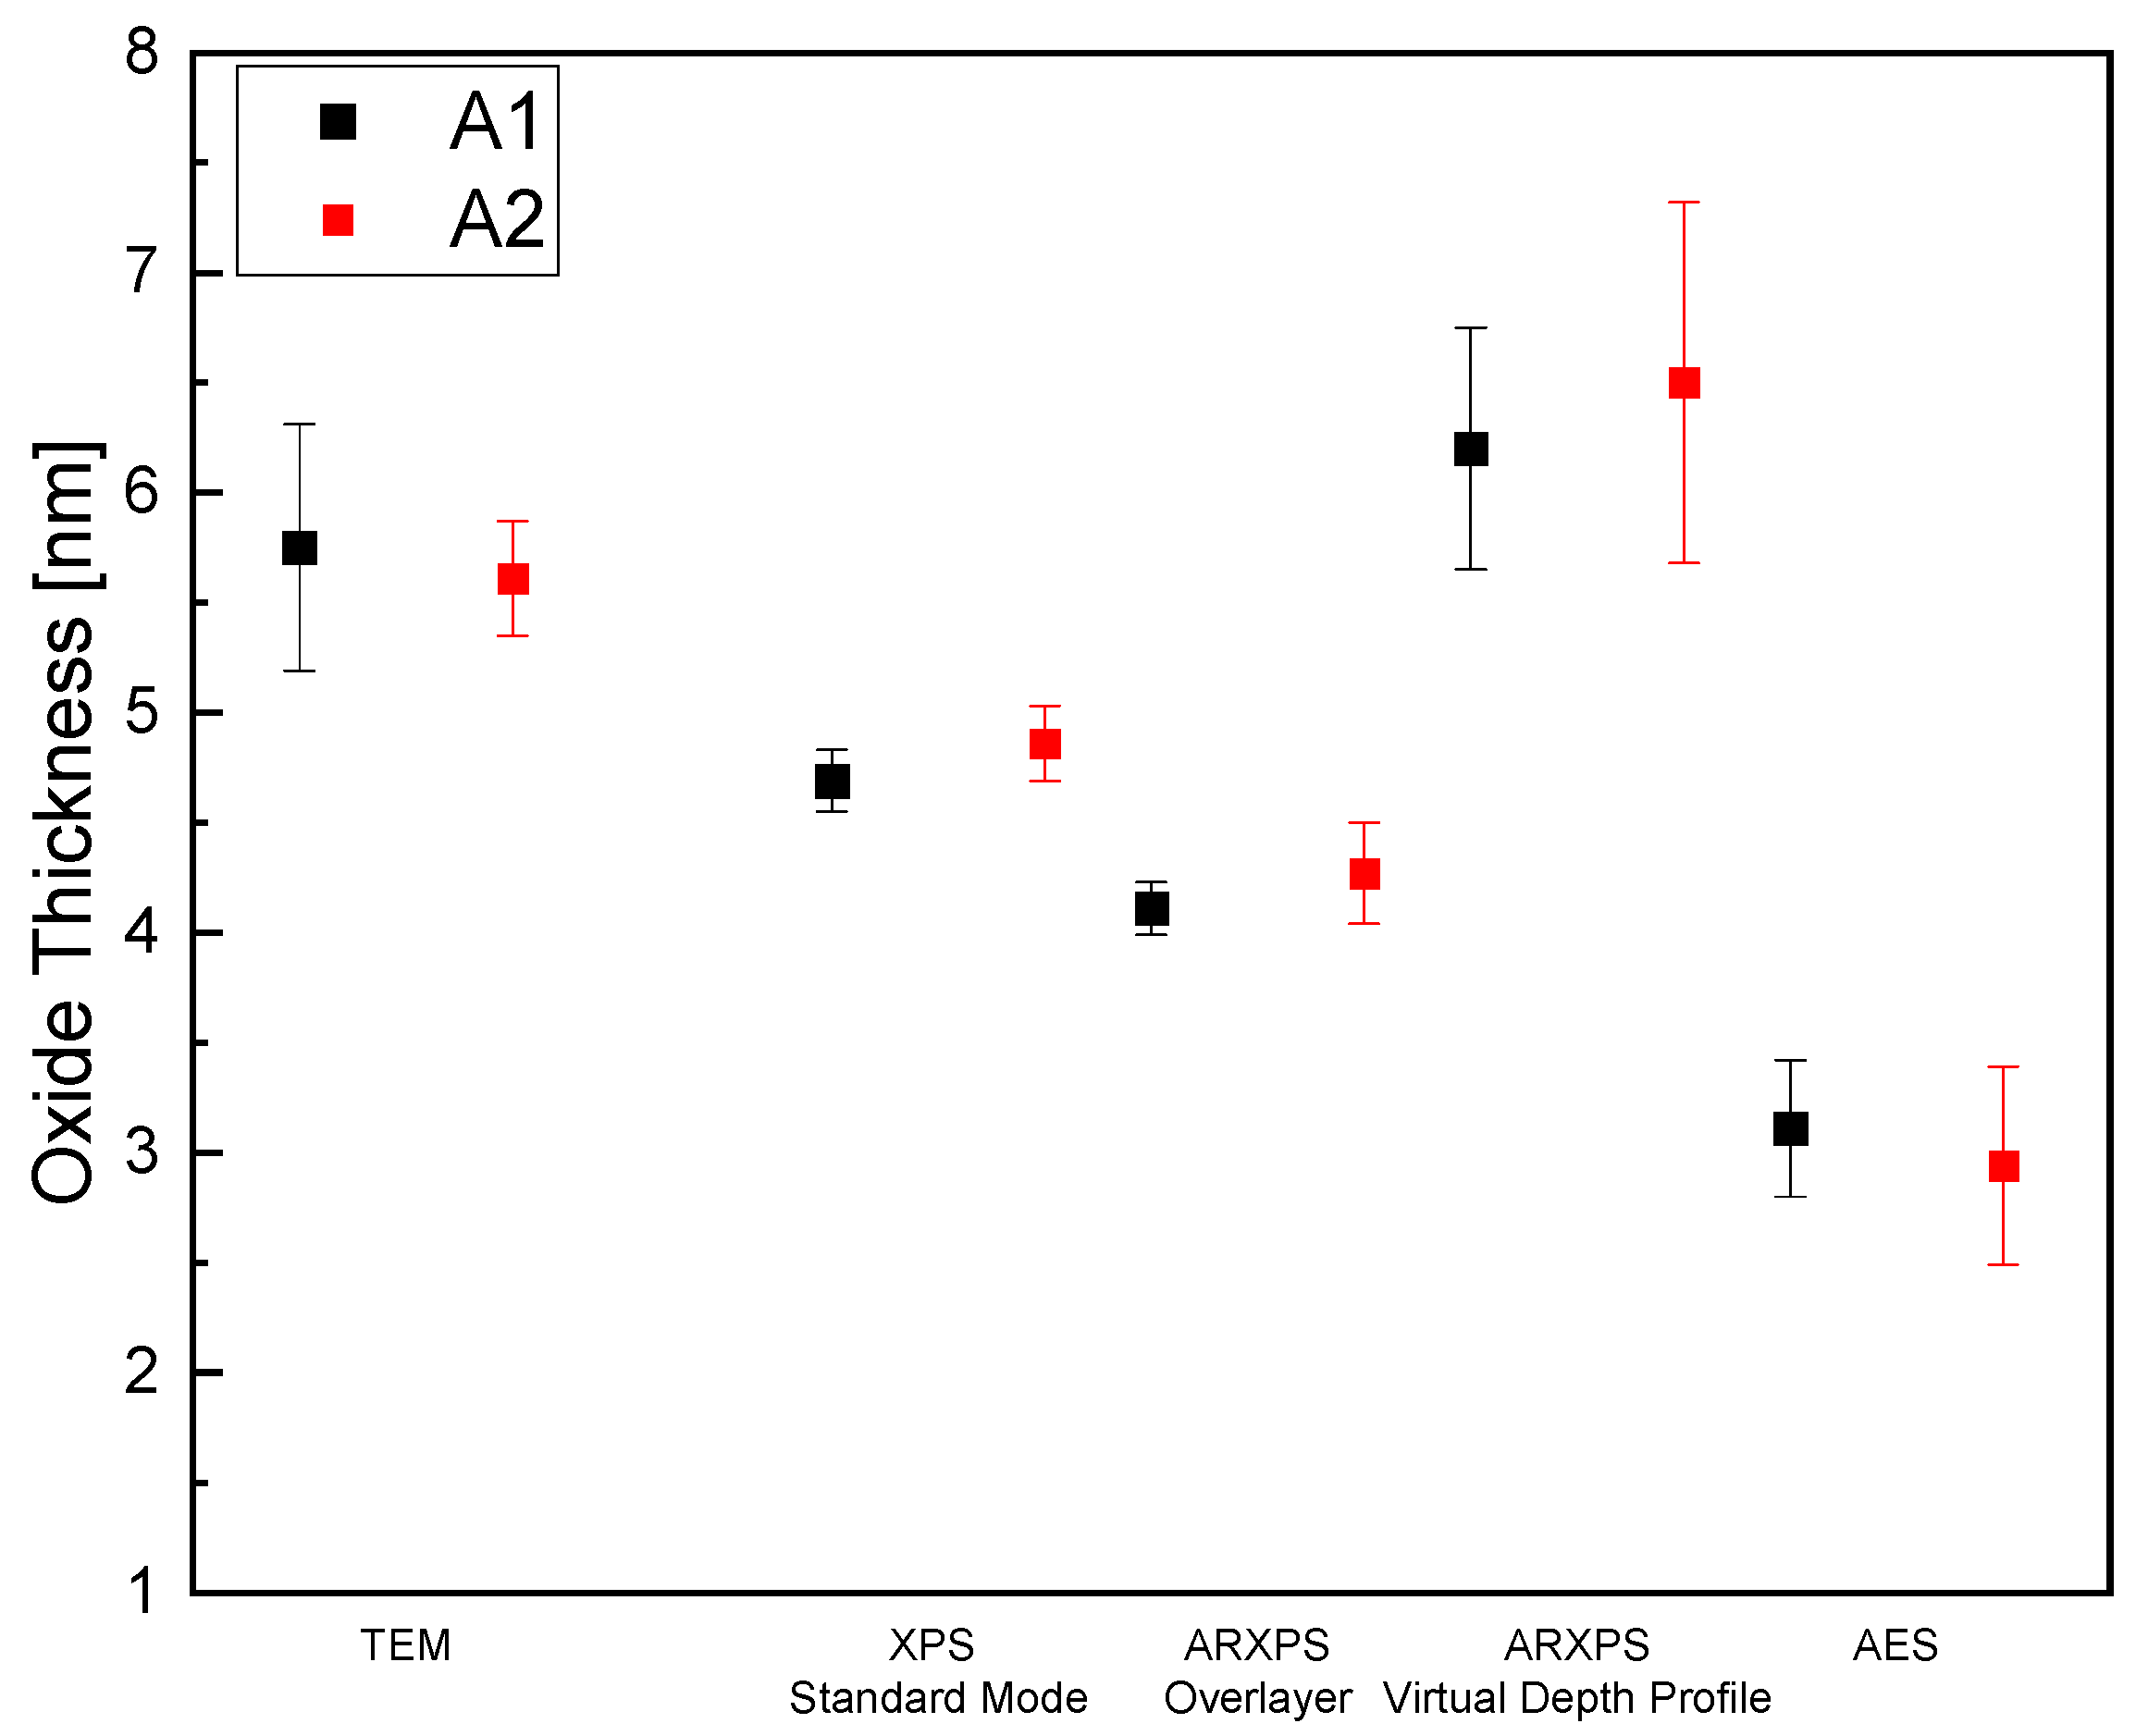
- The results show that XPS gives reproducibly accurate averaged values of the thickness and provides even the possibility to generate information about elemental and chemical surface composition and additionally provides information about the average depth distribution of different elemental species and the resulting layer structure.
- (2)
- Although TEM offers the highest lateral resolution and therefore the most direct and accurate way for oxide thickness quantification, it should be considered that the results are referred only to a rather confined region of the real samples surface. Reliable conclusions based on TEM measurements require statistical validity by accessing multiple measurement positions evenly distributed on the samples surface. Furthermore, sample preparation for TEM investigations requires significantly higher experimental effort as compared, e.g., for XPS.
- (3)
- In this study, AES acted as a link between the nanoscopic view of TEM and the laterally averaging characteristics of XPS. However, the destructiveness of the focused electron beam during AES measurements becomes apparent in the results, where a significant degradation of the oxide layer was detected.
- (4)
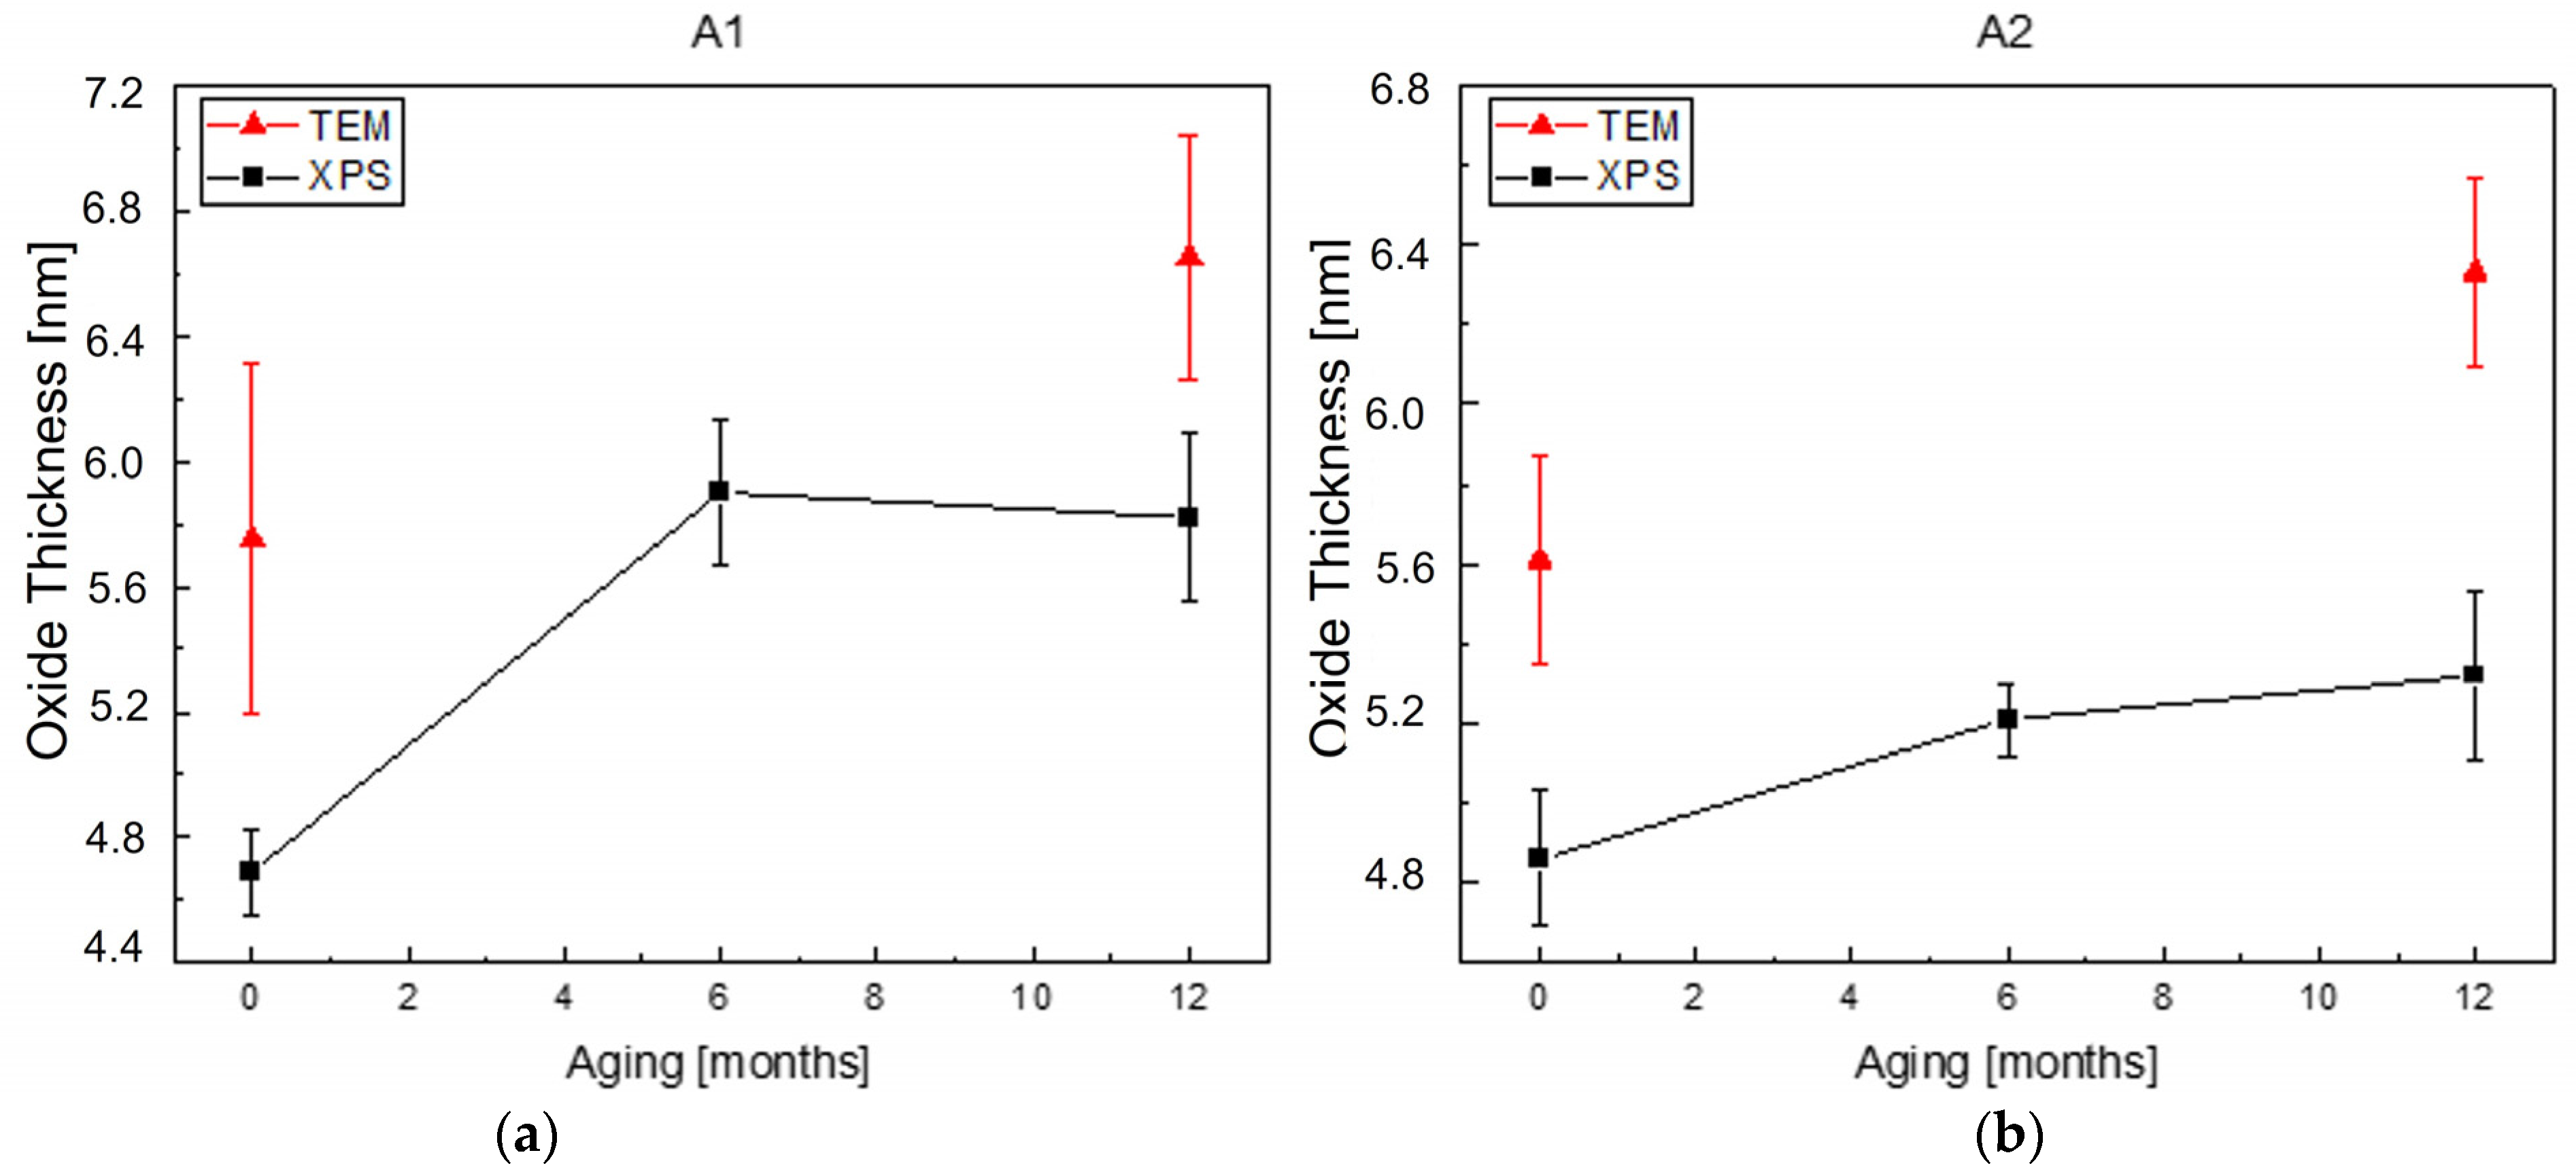
- Finally, an aging test at standard storage conditions proved that the aluminium oxide layer determination by means of XPS is reproducible and in combination with a short measurement time and minimal sample preparation requirements, a highly suitable method for the characterization of technical aluminium surfaces. This work further clearly illustrates the importance of knowing the individual characteristics and strengths of each measurement technique, especially when performing industry related applied research.
Author Contributions
Funding
Data Availability Statement
Acknowledgments
Conflicts of Interest
References
- Njuguna, J. Lightweight Composite Structures in Transport: Design, Manufacturing, Analysis and Performance; Elsevier Science: Amsterdam, The Netherlands, 2016. [Google Scholar]
- Hirsch, J. Recent development in aluminium for automotive applications. Trans. Nonferrous Met. Soc. China 2014, 24, 1995–2002. [Google Scholar] [CrossRef]
- Crolla, D.; Ribbens, W.; Heisler, H.; Blundell, M.; Harty, D.; Brown, J.; Serpento, S.; Robertson, A.; Garrett, T.; Fenton, J.; et al. Automotive Engineering e-Mega Reference; Elsevier Science: Amsterdam, The Netherlands, 2009. [Google Scholar]
- Cavezza, F.; Boehm, M.; Terryn, H.; Hauffman, T. A Review on Adhesively Bonded Aluminium Joints in the Automotive Industry. Metals 2020, 10, 730. [Google Scholar] [CrossRef]
- Pana, G.M. Developments of audi space frame technology for automotive body aluminum construction. Appl. Mech. Mat. 2020, 896, 127–132. [Google Scholar] [CrossRef]
- Association, E.A. EAA Aluminium Automotive Manual—Joining, The Aluminium Automotive Manual; European Aluminium Association: Ljubljana, Slovenia, 2015; pp. 1–5. [Google Scholar]
- Mercier, D.; Rouchaud, J.-C.; Barthés-Labrousse, M.-G. Interaction of amines with native aluminium oxide layers in non-aqueous environment: Application to the understanding of the formation of epoxy-amine/metal Interphases. Appl. Surf. Sci. 2008, 254, 6495–6503. [Google Scholar] [CrossRef]
- Morsch, S.; Liu, Y.; Malanin, M.; Formanek, P.; Eichhorn, K.-J. Exploring wheter a buried nanoscale interphase exists within epoxy-amine coatings: Implications for adhesion, fracture thoughness and corrosion resistance. Appl. Nano Mater. 2019, 2, 2494–2502. [Google Scholar] [CrossRef]
- Wu, G.; Dash, K.; Galano, M.L.; O’Reilly, K.A.Q. Oxidation studies of Al alloys: Part II Al-Mg alloy. Corros. Sci. 2019, 155, 97–108. [Google Scholar] [CrossRef]
- Bechtel, S.; Nies, C.; Fug, F.; Grandthyll, S.; Müller, F.; Possart, W. Thin epoxy layers on native aluminium oxide: Specific ageing processes in mild conditions. Thin. Solid Films 2020, 695, 137756. [Google Scholar] [CrossRef]
- Cornette, P.; Zanna, S.; Seyeux, A.; Costa, D.; Marcus, P. The native oxide film on a model aluminium-copper alloy studied by XPS and ToF-SIMS. Corros. Sci. 2020, 174, 108837. [Google Scholar] [CrossRef]
- Takano, T.; Matsuya, H.; Kowalski, D.; Kitano, S.; Aoki, Y.; Habazaki, H. Raman and glow discharge optical emission spectroscopy studies on structure and anion incorporation properties of a hydrated alumina film on aluminum. Appl. Surf. Sci. 2022, 592, 153321. [Google Scholar] [CrossRef]
- Strohmeier, B.R. An ESCA method for determining the oxide thickness in aluminum alloys. Surf. Interface Anal. 1990, 15, 51–56. [Google Scholar] [CrossRef]
- Suárez-Campos, G.; Cabrera-German, D.; Castelo-González, A.O.; Avila-Avendano, C.; Ríos, J.L.F.; Quevedo-López, M.A.; Aceves, R.; Hu, H.; Sotelo-Lerma, M. Characterization of aluminum oxide thin films obtained by chemical solution deposition and annealing for metal-insulator-metal dielectric capacitor applications. Appl. Surf. Sci. 2020, 513, 145879. [Google Scholar] [CrossRef]
- Din, R.U.; Gudla, V.C.; Jellesen, M.S.; Ambat, R. Accelerated growth of oxide film on aluminium alloys under steam: Part I: Effects of alloy chemistry and steam vapour pressure on microstructure. Surf. Coat. Tech. 2015, 276, 77–88. [Google Scholar] [CrossRef]
- Evangelisti, F.; Stiefel, M.; Guseva, O.; Nia, R.P.; Hauert, R.; Hack, E.; Jeurgens, L.P.H.; Ambrosio, F.; Pasquarello, A.; Schmutz, P.; et al. Electronic and structural characterization of barrier-type amorphous aluminium oxide. Electrochim. Acta 2017, 224, 503–516. [Google Scholar] [CrossRef]
- Liu, E.; Pan, Q.; Liu, B.; Ye, J. Microstructure Evolution of the near-surface deformed layer and corrosion behaviour of hot rolled AA7050 aluminium alloy. Materials 2023, 16, 4632. [Google Scholar] [CrossRef] [PubMed]
- Lunder, O. Chromate-Free Pre-Treatment of Aluminium for Adhesive Bonding. Ph.D. Thesis, Norwegian University of Science and Technology, Trondheim, Norway, 2003. [Google Scholar]
- Huttunen-Saarivirta, E.; Heino, H.; Vaajoki, A.; Hakala, T.J.; Ronkainen, H. Wear of additively manufactured tool steel in contact with aluminium alloy. Wear 2019, 202934, 432–433. [Google Scholar] [CrossRef]
- Andreatta, F.; Turco, A.; de Graeve, I.; Terryn, H.; de Wit, J.H.W.; Fedrizzi, L. SKPFM and SEM study of the deposition mechanism of Zr/Ti based pre-treatment on AA6016 aluminum alloy. Surf. Coat. Tech. 2007, 201, 7668–7685. [Google Scholar] [CrossRef]
- Duchoslav, J.; Kehrer, M.; Truglas, T.; Groiß, H.; Nadlinger, M.; Hader-Kregl, L.; Riener, C.K.; Arndt, M.; Stellnberger, K.H.; Luckeneder, G.; et al. The effect of plasma treatment on the surface chemistry and structure of ZnMgAl coatings. Appl. Surf. Sci. 2020, 504, 144457. [Google Scholar] [CrossRef]
- Duchoslav, J.; Arndt, M.; Steinberger, R.; Keppert, T.; Luckeneder, G.; Stellnberger, K.H.; Hagler, J.; Riener, C.K.; Angeli, G.; Stifter, D. Nanoscopic view on the initial stages of corrosion of hot dip galvanized Zn-Mg-Al coatings. Corros. Sci. 2014, 83, 327–334. [Google Scholar] [CrossRef]
- Arndt, M.; Duchoslav, J.; Itani, H.; Hesser, G.; Riener, C.K.; Angeli, G.; Preis, K.; Stifter, D.; Hingerl, K. Nanoscale analysis of surface oxides on ZnMgAl hot-dip-coated steel sheets. Anal. Bioanal. Chem. 2012, 403, 651–661. [Google Scholar] [CrossRef]
- Tanuma, S.; Powell, C.J.; Penn, D.R. Calculations of electron inelastic mean free paths for 31 materials. Surf. Interface Anal. 1988, 11, 577–589. [Google Scholar] [CrossRef]
- Rullik, L.; Evertsson, J.; Johansson, N.; Bertram, F.; Nilsson, J.-O.; Zakharov, A.A.; Mikkelsen, A.; Lundgren, E. Surface oxide development on aluminum alloy 6063 during heat treatment. Surf. Int. Anal. 2019, 51, 1214–1224. [Google Scholar] [CrossRef]
- Cabrera, N.; Mott, N.F. Theory of the oxidation of metals. Rep. Prog. Phys. 1949, 12, 163–184. [Google Scholar] [CrossRef]


| Label | Alloy | Composition | Surface Treatment Procedure | Surface Texture |
|---|---|---|---|---|
| A1 | AA6016 | Al98Mg0.6Si1.4 | pickling and cleaning | EDT |
| A2 | AA6016 | Al98Mg0.6Si1.4 | pickling, cleaning and passivation | EDT |
| Sample | Av. Oxide Layer Thickness [nm] |
|---|---|
| A1 | 5.8 ± 0.6 |
| A2 | 5.6 ± 0.3 |
| Sample | Elemental Composition [at.%] | ||||||
|---|---|---|---|---|---|---|---|
| Al | O | C | F | Mg | Ti | Zr | |
| A1 | 19 | 38 | 31 | 5 | 0.4 | ||
| A2 | 16 | 29 | 32 | 18 | 0.6 | 1.4 | 1.1 |
| Sample | Oxide Thickness Standard Mode [nm] | Oxide Thickness AR-Overlayer [nm] | Oxide Thickness Virtual Depth Profile [nm] |
|---|---|---|---|
| A1 | 4.7 ± 0.1 | 4.1 ± 0.1 | 6.2 ± 0.6 |
| A2 | 4.9 ± 0.2 | 4.3 ± 0.2 | 6.5 ± 0.8 |
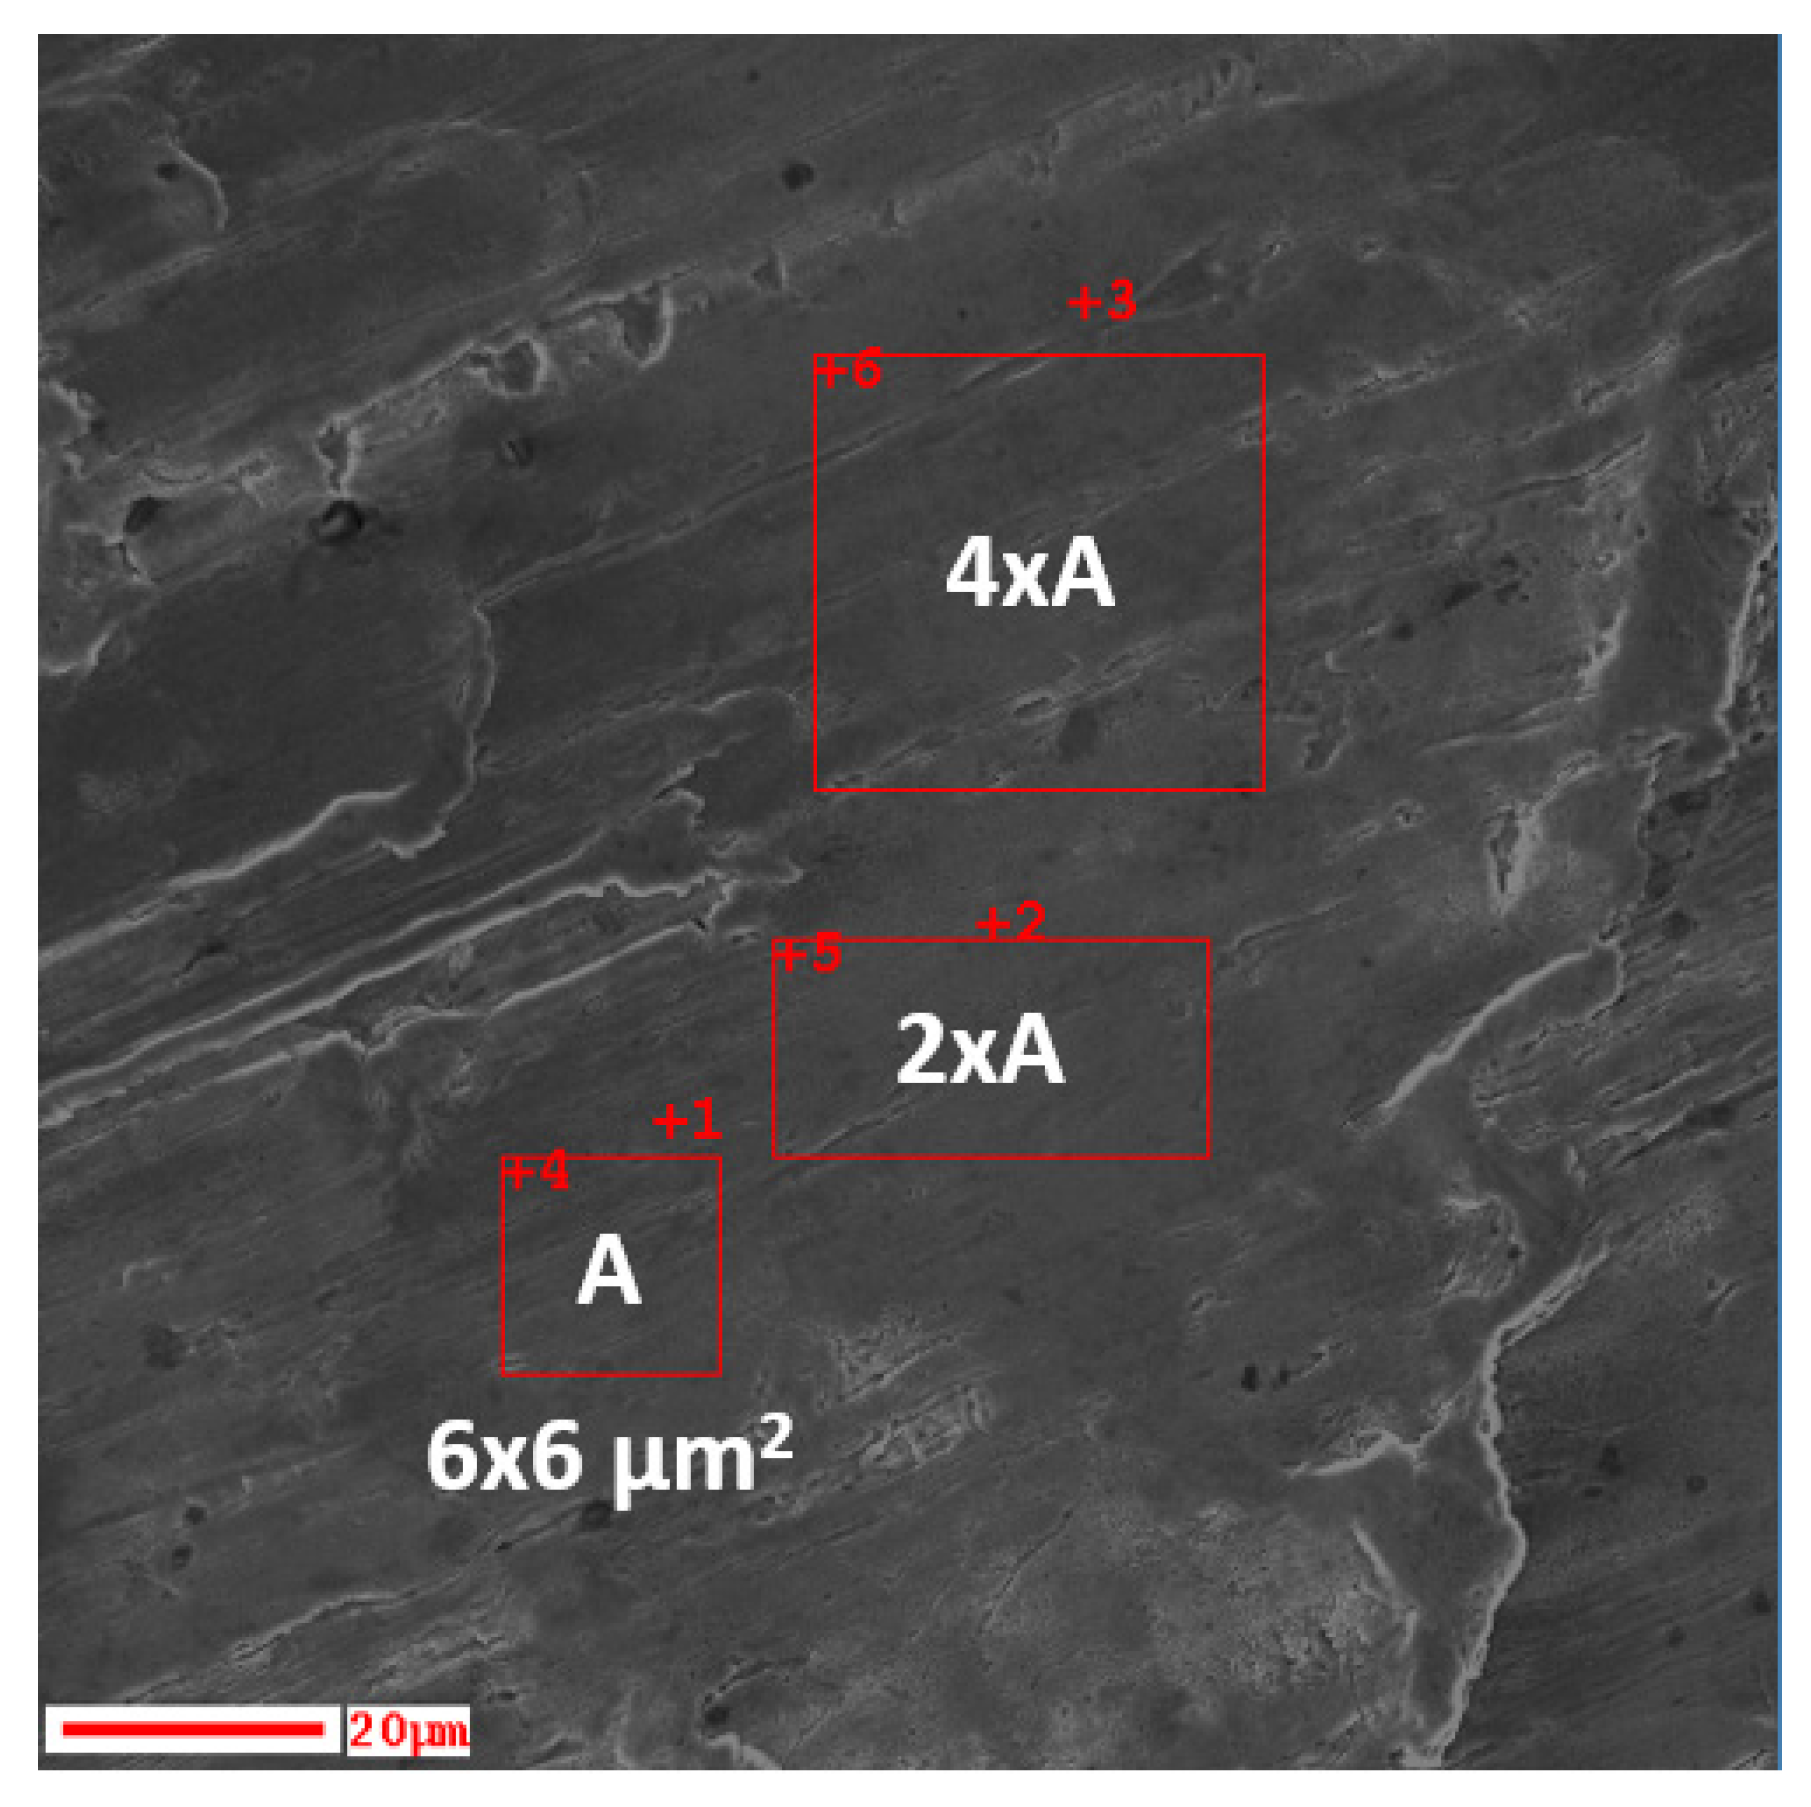
| Sample | Measurement Point/Area | Oxide Thickness [nm] | Mode |
|---|---|---|---|
| A1 | 1–3 | 0.69 | Point |
| 4 | 2.11 | Area A | |
| 5 | 2.60 | Area 2A | |
| 6 | 3.10 | Area 4A |
Disclaimer/Publisher’s Note: The statements, opinions and data contained in all publications are solely those of the individual author(s) and contributor(s) and not of MDPI and/or the editor(s). MDPI and/or the editor(s) disclaim responsibility for any injury to people or property resulting from any ideas, methods, instructions or products referred to in the content. |
© 2023 by the authors. Licensee MDPI, Basel, Switzerland. This article is an open access article distributed under the terms and conditions of the Creative Commons Attribution (CC BY) license (https://creativecommons.org/licenses/by/4.0/).
Share and Cite
Gruber, R.; Singewald, T.D.; Bruckner, T.M.; Hader-Kregl, L.; Hafner, M.; Groiss, H.; Duchoslav, J.; Stifter, D. Investigation of Oxide Thickness on Technical Aluminium Alloys—A Comparison of Characterization Methods. Metals 2023, 13, 1322. https://doi.org/10.3390/met13071322
Gruber R, Singewald TD, Bruckner TM, Hader-Kregl L, Hafner M, Groiss H, Duchoslav J, Stifter D. Investigation of Oxide Thickness on Technical Aluminium Alloys—A Comparison of Characterization Methods. Metals. 2023; 13(7):1322. https://doi.org/10.3390/met13071322
Chicago/Turabian StyleGruber, Ralph, Tanja Denise Singewald, Thomas Maximilian Bruckner, Laura Hader-Kregl, Martina Hafner, Heiko Groiss, Jiri Duchoslav, and David Stifter. 2023. "Investigation of Oxide Thickness on Technical Aluminium Alloys—A Comparison of Characterization Methods" Metals 13, no. 7: 1322. https://doi.org/10.3390/met13071322
APA StyleGruber, R., Singewald, T. D., Bruckner, T. M., Hader-Kregl, L., Hafner, M., Groiss, H., Duchoslav, J., & Stifter, D. (2023). Investigation of Oxide Thickness on Technical Aluminium Alloys—A Comparison of Characterization Methods. Metals, 13(7), 1322. https://doi.org/10.3390/met13071322