Abstract
In order to improve the hold and function of dentures for the patient, various prostheses made of metal, mostly metal alloys, are used every day in dental practise. Cobalt-chromium alloys are usually the first choice because they have very good mechanical properties and satisfactory clinical conditions. Nowadays, laser welding is increasingly used in dental practise due to its numerous advantages over other technologies. In this work, therefore, six commercially available Co-Cr alloys were investigated. Three of them are used for metal-ceramic work, two for denture frameworks and one is suitable for both applications. They were joined by laser welding and subsequently analysed microscopically. Their mechanical properties were determined and statistically evaluated. The microhardness of the laser-welded alloys is in the range of 282–465 MPa in the weld zone and between 283 and 435 MPa in the heat-affected zone. The flexural strength of the laser-welded alloys is lower than the control group, but an alloy for the metal-ceramic work (I-BOND NF) shows very similar value. Furthermore, this alloy, together with two other metal-ceramic alloys, survived a maximum of cycles in dynamic tests. It was found that the laser method can be used for joining Co-Cr alloys while ensuring appropriate parameters that guarantee the quality of the dental work.
1. Introduction
In dental practise, various prosthetic appliances made of metal, mostly metal alloys, are used every day to improve upon the dental prosthetic’s retention and function for the patient. Metal combinations are made to reduce the tendency to corrosion, increase strength and hardness, reduce ion elution, and increase biocompatibility. Due to their extremely good mechanical properties and satisfactory clinical conditions, cobalt-chromium alloys are usually the first choice for prosthetics as dental base metals used for crowns, precision attachments, clasps and removable partial dentures. Cobalt-chromium alloys usually contain 35–65% cobalt (Co), 25–35% chromium (Cr), 0–30% nickel (Ni), >4% molybdenum (Mo) and trace elements such as beryllium, aluminium, tungsten, silicon, carbon, gallium and iron [1,2,3,4].
Since prosthetic alloys are used as a working material in a biologically active environment (the mouth), they must meet the biomechanical and electrochemical conditions that prevail in the oral cavity. This refers to resistance to deformation and strong chewing forces or structural fractures, as well as reduced ion release to avoid allergic and toxic reactions to metals or corrosion. Chromium is responsible for the alloy being corrosion resistant and not darkening thanks to the oxidised surface of the casting. Due to the oxidation and corrosion resistance, cobalt-chromium alloys are suitable for use in the oral cavity [5,6,7]. The higher the chromium content in the alloy, the more corrosion resistant it is, but large amounts of chromium (more than 30%) in the alloy make casting more difficult and the alloy breaks more easily due to the formation of a brittle phase σ. Molybdenum as an additive improves mechanical properties by reducing the crystal size and contributes to corrosion resistance. The most important element for strength is carbon, which influences the microhardness and ductility of the alloy. However, carbon combines with chromium to form chromium carbide, which is embedded in the hexagonal structure and leads to greater hardness and strength, but also increases internal stresses, making the alloy more brittle. Further, the precipitation of chromium carbides reduces the amount of Cr required for the formation of an oxide layer, which increases the susceptibility of the alloy to corrosion [6,8,9].
When damage, cracks and fractures occur in the metal structure, they can be reconnected by soldering or welding. Joints made by soldering or welding must have a tensile strength of 350 MPa and be structurally homogeneous, without micro-irregularities and susceptibility to corrosion. The most common types of soldering are open flame soldering, re-soldering and infrared soldering. Welding techniques are more commonly used in dentistry: electric resistance welding, plasma welding, laser welding and arc welding with shielding gas (TIG). Welding techniques are more commonly used due to better compatibility and strength of the resulting joints and higher productivity [5,9,10,11]. In welding it may be necessary to use additional material that has the same composition as the base material, but in laser welding this is not necessary. Therefore, in laser welding, both corrosion resistance and other properties can be improved compared to conventional brazing. In laser welding, a cost-effective and safe procedure, the heat is concentrated on the weld itself and does not spread, so the laser can weld directly in the patient’s mouth without damaging the surrounding biological structures. Lasers are also useful because their beams can penetrate deep into the material and completely fill the damage. The monochromatic, coherent and collinear beam of light they produce is very well used in dentistry [12,13,14].
The process of laser welding takes place when both materials are sufficiently heated and joined together. With the help of the light energy of the laser, which is absorbed into heat energy in the material, the atomic forces in the crystal lattice of the metal are brought into the desired position. The shorter the wavelength of the laser light, the better the absorption of the light. The energy of the laser beam is concentrated in points so that the highest precision is possible when working in narrow areas. However, part of the light energy of the laser is reflected by the surface. Another part penetrates the material and the third part is absorbed in heat. How much of it is absorbed in the material depends on the properties of the metals to be welded. For cobalt-chromium alloys, for example, almost all the energy of the laser light can be absorbed and converted into heat. The shape of the weld seam is also important. The parts to be joined are pressed into the desired position and a laser beam is passed over them. In most cases, the joint is not fully welded and small irregularities remain in the joint that can cause stress concentration on the rest of the joint [15,16,17].
The main advantages of laser welding are the high energy concentration and welding speed, the high penetration depth of the beam into the material, the low heat input, the low total temperature rise and the effect on a narrow surface with a high cooling rate and low deformations [12,13,15,16,17]. However, it should be mentioned that welded areas have a higher probability of damage than the rest of the structure, and weakened areas of the basic structure are also possible, so it is recommended to use them in low-stress zones. Although the amount of heat concentrated is small, thermal stresses still occur due to differences in material strength, so internal stresses and deformations should be minimised. The main disadvantage of lasers is the size and noise they produce, as well as the price, but today there are smaller lasers on the market that are more suitable for use in the laboratory [12,15,18,19].
Some of the studies comparing the mechanical properties and hardness of laser welds and TIG welds showed that laser welds are much harder, less flexible and less deformable, and more resistant to corrosion [18,20]. Also, when comparing the mechanical properties of cobalt-chromium alloys produced by casting and selective laser melting, the laser shows extremely higher hardness and strength than alloys produced by casting, which shows us the resistance to chewing forces in the oral cavity without fractures and breaks [21]. However, there are also studies that examined the homogeneity of laser and TIG welds. The laser weld was clean, with overlaps of 20–40%, but cracks were visible along the entire length of the weld, and in the TIG-welded sample, the weld material was uniform, without visible irregularities and with less porosity [22]. On the other hand, comparing the laser-welded joints of the Co-Cr alloy with those that were soldered, it can be seen that the laser welding has excellent corrosion resistance, but its tensile strength is limited due to the shallow penetration of the weld. Soldered joints are less resistant to corrosion but have a much higher tensile strength, much more similar to the forces in the oral cavity [23]. Laser-welded alloys often exhibit defects due to residual stresses caused by temperature variations during the welding process. Residual stresses affect the mechanical properties of welds, making them more prone to cracking [24]. In another study monitoring the stress distribution around implants in laser-welded and TIG-welded screw frames, there was no difference between the techniques in terms of peri-implant stresses, i.e., the stress results were similar for both techniques and independent of the measurement region on the bone [25].
Besides Co-Cr dental alloys, there are some dental alloys such as gold, titanium and nickel-chromium alloys that are joined with lasers. Gold alloys have the advantage of excellent thermal conductivity but poor heat absorption due to their high reflectivity for the laser wavelength. In contrast, NiCr-based alloys have low reflectivity and lower thermal conductivity. Their poor weldability is due to the high content of carbon and boron. The high reactivity with oxygen and nitrogen at high temperatures has proven to be the main problem when welding titanium [16,26].
The aim of this work is to determine the suitability of laser welding as a technology for joining Co-Cr alloys and the suitability of six commercially available Co-Cr alloys for laser welding. For this purpose, unwelded and welded Co-Cr alloys were analysed microscopically and their mechanical properties were determined.
2. Materials and Methods
In this study castings of six cobalt-chromium alloys from different manufacturers were used (Table 1). Three alloys (VI-COMP, Wirobond C and I-BOND NF) are used for the fabrication of metal-ceramic works, two (Wisil M and I-MG) for denture frameworks and one alloy (Brealloy F 400) is suitable for both purposes. All alloys differ in their mechanical and physical properties. Their declared properties are listed in Table 2.

Table 1.
Technical specifications of used alloys.

Table 2.
Properties of used alloys.
First, a mould for casting the specimens was made with the dimensions 32 mm × 10 mm × 1 mm. The mould was made of stainless steel. The wax samples of Wisil M and VI-COMP, whose dimensions correspond to the standard ISO [27], were modelled in a rubber mould with a measuring accuracy of 0.01 mm. They were then embedded in phosphate investment material (Prestovest, Zlatarna Celje, Celje, Slovenia). The flask was preheated to 750 °C in a programmed furnace (ZC G8, Zlatarna Celje, Slovenia) and the alloys were cast in a centrifugal casting machine (Zlatarna Celje, Slovenia). The flasks were air-cooled according to the manufacturer’s instructions. To remove the residues of the investment, the castings were sandblasted with aluminium oxide particles with a diameter of 110 µm (Barth 322 sandblaster, Barth, Germany). The channels made for the casting were removed with cutting discs and the surface of the specimens was treated with sandpaper and polished to a high gloss with a deerskin brush. A polishing machine CDG (Carlo di Georgio, Milan, Italy) was also used. The other four alloys (I-BOND NF, I-MG, Wirobond C and Brealloy F-400) were modelled from non-transparent polymer investments (Interdent, Celje, Slovenia) with the same dimensions. They were also processed on a Nonstop cutter (Silfradent, Santa Sofia, Italy). Speed investment Intervest K+B (Interdent, Celje, Slovenia) was used for investment at 950 °C for 60 min. The alloys were inductively melted and cast in a pressure-vacuum casting machine (Nautilus, Bego, Bremen, Germany). The castings were also sandblasted with particles of 99.96% pure aluminium trioxide. Surface defects and oxides were removed electrolytically in ELTROPOL electrolyte (Bego, Bremen, Germany) at 45 °C for 10 min until a high gloss was achieved.
Twenty-seven samples of each alloy were cast with specific dimensions. In the next phase, six samples were selected from each alloy. Three of them were cut in half on an Accuto 2 cutter (Struers, Rodovre, Denmark) and later joined together, while three samples remained as a control group. For each alloy, there was a control group consisting of three casting samples measuring 32 mm × 10 mm × 1 mm, which were neither cut nor joined.
2.1. Joining the Specimens with the Laser
The cut samples were joined together with a laser. The hybrid laser “Hercules” (Interdent, Celje, Slovenia) was used to join the specimens. The parameters for laser welding were: argon pressure 2–3 bar, laser beam diameter 0.7 mm, voltage 290 V and time 11 ms. The welding process starts by opening the gas valve and releasing a stream of inert gas at the joint, then the laser is switched on. First the root of the weld is welded, then the face. The entire process was carried out under 15× magnification.
2.2. Microscopic Characterisation of the Samples
The characterisation of the samples includes the microscopic analysis of the weld materials. The appearance of the welds, the width, the homogeneity and the porosity of the welds were characterised for all samples using an Olympus GX51 light microscope with a CCD camera (Olympus, Tokyo, Japan). The samples for metallographic analysis of the microstructure were prepared by grinding, polishing and etching. First, they are embedded in Varidur 20 acrylate with a powder-to-liquid ratio of 2:1 without additional heating. Grinding was conducted automatically with 120, 320, 600 and 1000 grit papers with water cooling. After grinding, the samples were polished to achieve a high surface gloss and to remove grinding residues. Polishing cloths and pastes with diamond abrasives and Lubricant blue (Struers, Rodovre, Denmark) were used for polishing. After polishing, the samples were electrolytically etched with a 10% solution of chromic acid in water with a current of 100 mA for 30 s.
2.3. Mechanical Testing of the Samples
The next procedure was to measure the microhardness using the Vickers method, HV0.2. The measurement was made using a microhardness tester PMT-3 (LOMP PLC, St. Petersburg, Russia). It was measured horizontally across the cross-section of each specimen, recording the base material (BM), the heat-affected zone (HAZ) and the weld zone (WZ). On each section, 10 impressions were made in a zigzag line with a distance of 10 µm between each impression. Three series of measurements were carried out on each sample and the mean values were calculated.
The flexural strength test was performed by a bending test on a mechanical testing machine (VEB Werkstoffpruefmaschinen, Berlin, Germany) according to the standard [28]. The nominal test load was 400 kN and the measuring range was between 0.1% and 100% of the nominal load. The specimens were tested at three points bending. The distance between the cylindrical supports was 24 mm and the load was applied directly to the connection point. The specimen was loaded with a constant displacement of the mandrel of 5 mm/min. The test continued until the specimen failed or slipped off the support. During the test, the force and the corresponding deflection of the specimen were measured continuously. The flexural strength test gave the flexural strength values of each specimen and the deflection at which the specimen broke or slipped.
The dynamic test as a cyclic bending fatigue test was performed on an alloy specimen on an LRX machine with integrated Nexygen software (Lloyd Instruments, Fareham, UK). The distance between the supports was 24 mm, the mandrel diameter 1 mm and the speed of the mandrel was 10 mm/min. In the mouth, there are masticatory forces, which can be up to 900 N, and oral forces (forces of the tongue, lips, cheeks), which are much smaller in value but much more dangerous because of their direction It is known that vertical forces act 9 min/day and that they amount to 3–5 N per tooth when swallowing [29]. Based on the possible maximum values of the masticatory forces, the number of cycles was set at 1000. For each sample, the cycle at which it broke was recorded, or it was noted that it had survived all 1000 cycles without visible damage.
2.4. Statistical Data Processing
The results obtained were statistically analysed using the SAS statistical package on the Windows platform with a significance level of α = 0.05. The microhardness, flexural strength and deflection were described by the mean and standard deviation. A factorial MANOVA was used to investigate the influence of alloy and group on flexural strength and deflection, and Tukey’s test was used for post-hoc comparisons.
3. Results
3.1. Microscopic Characterisation
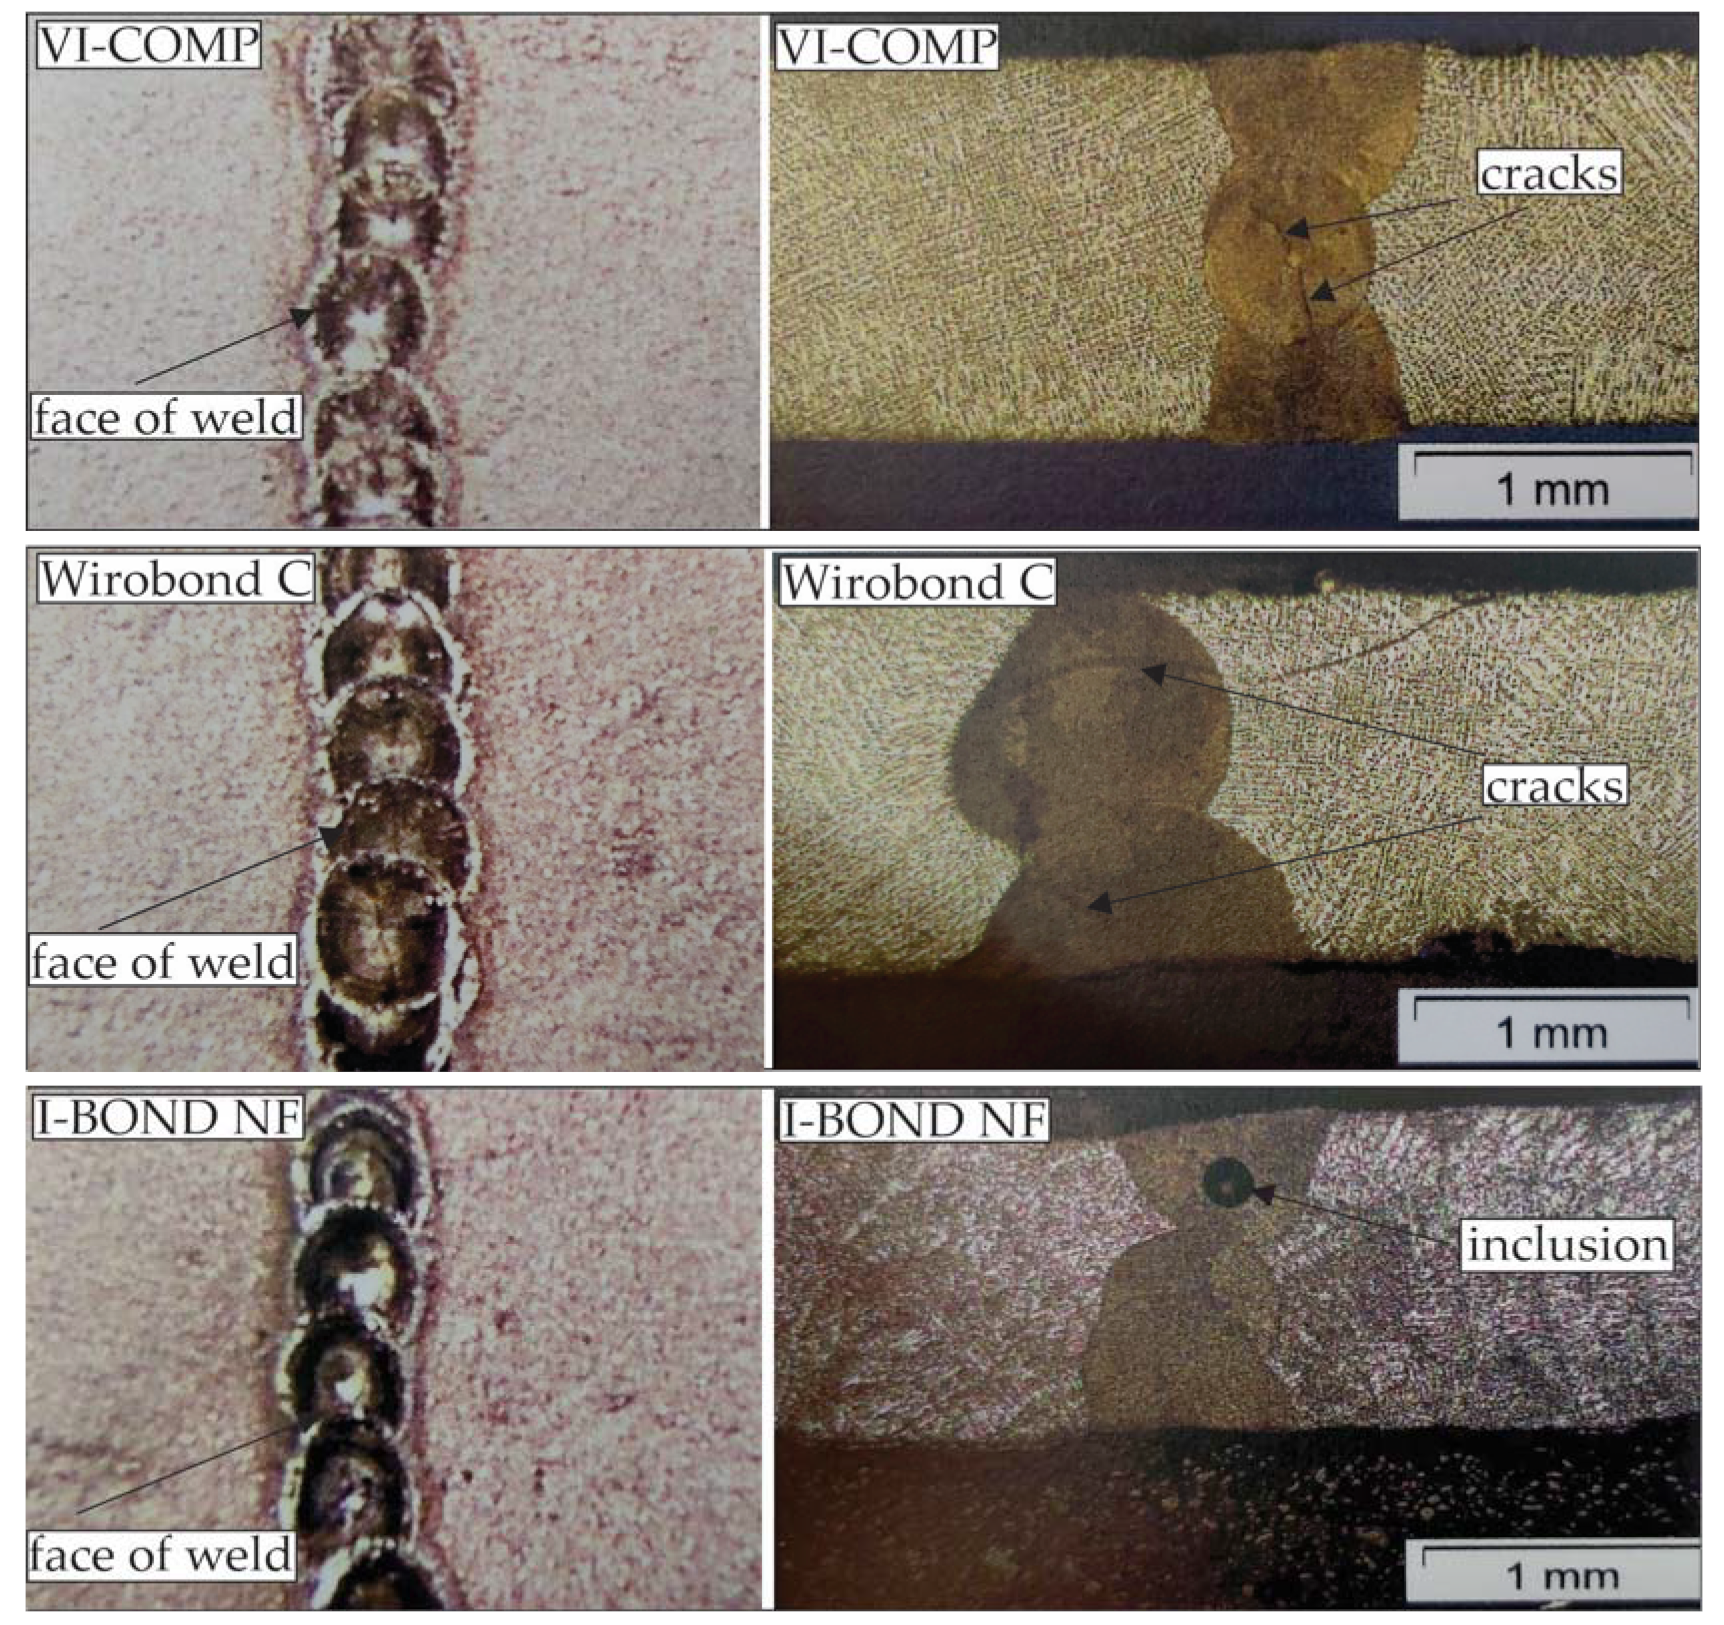
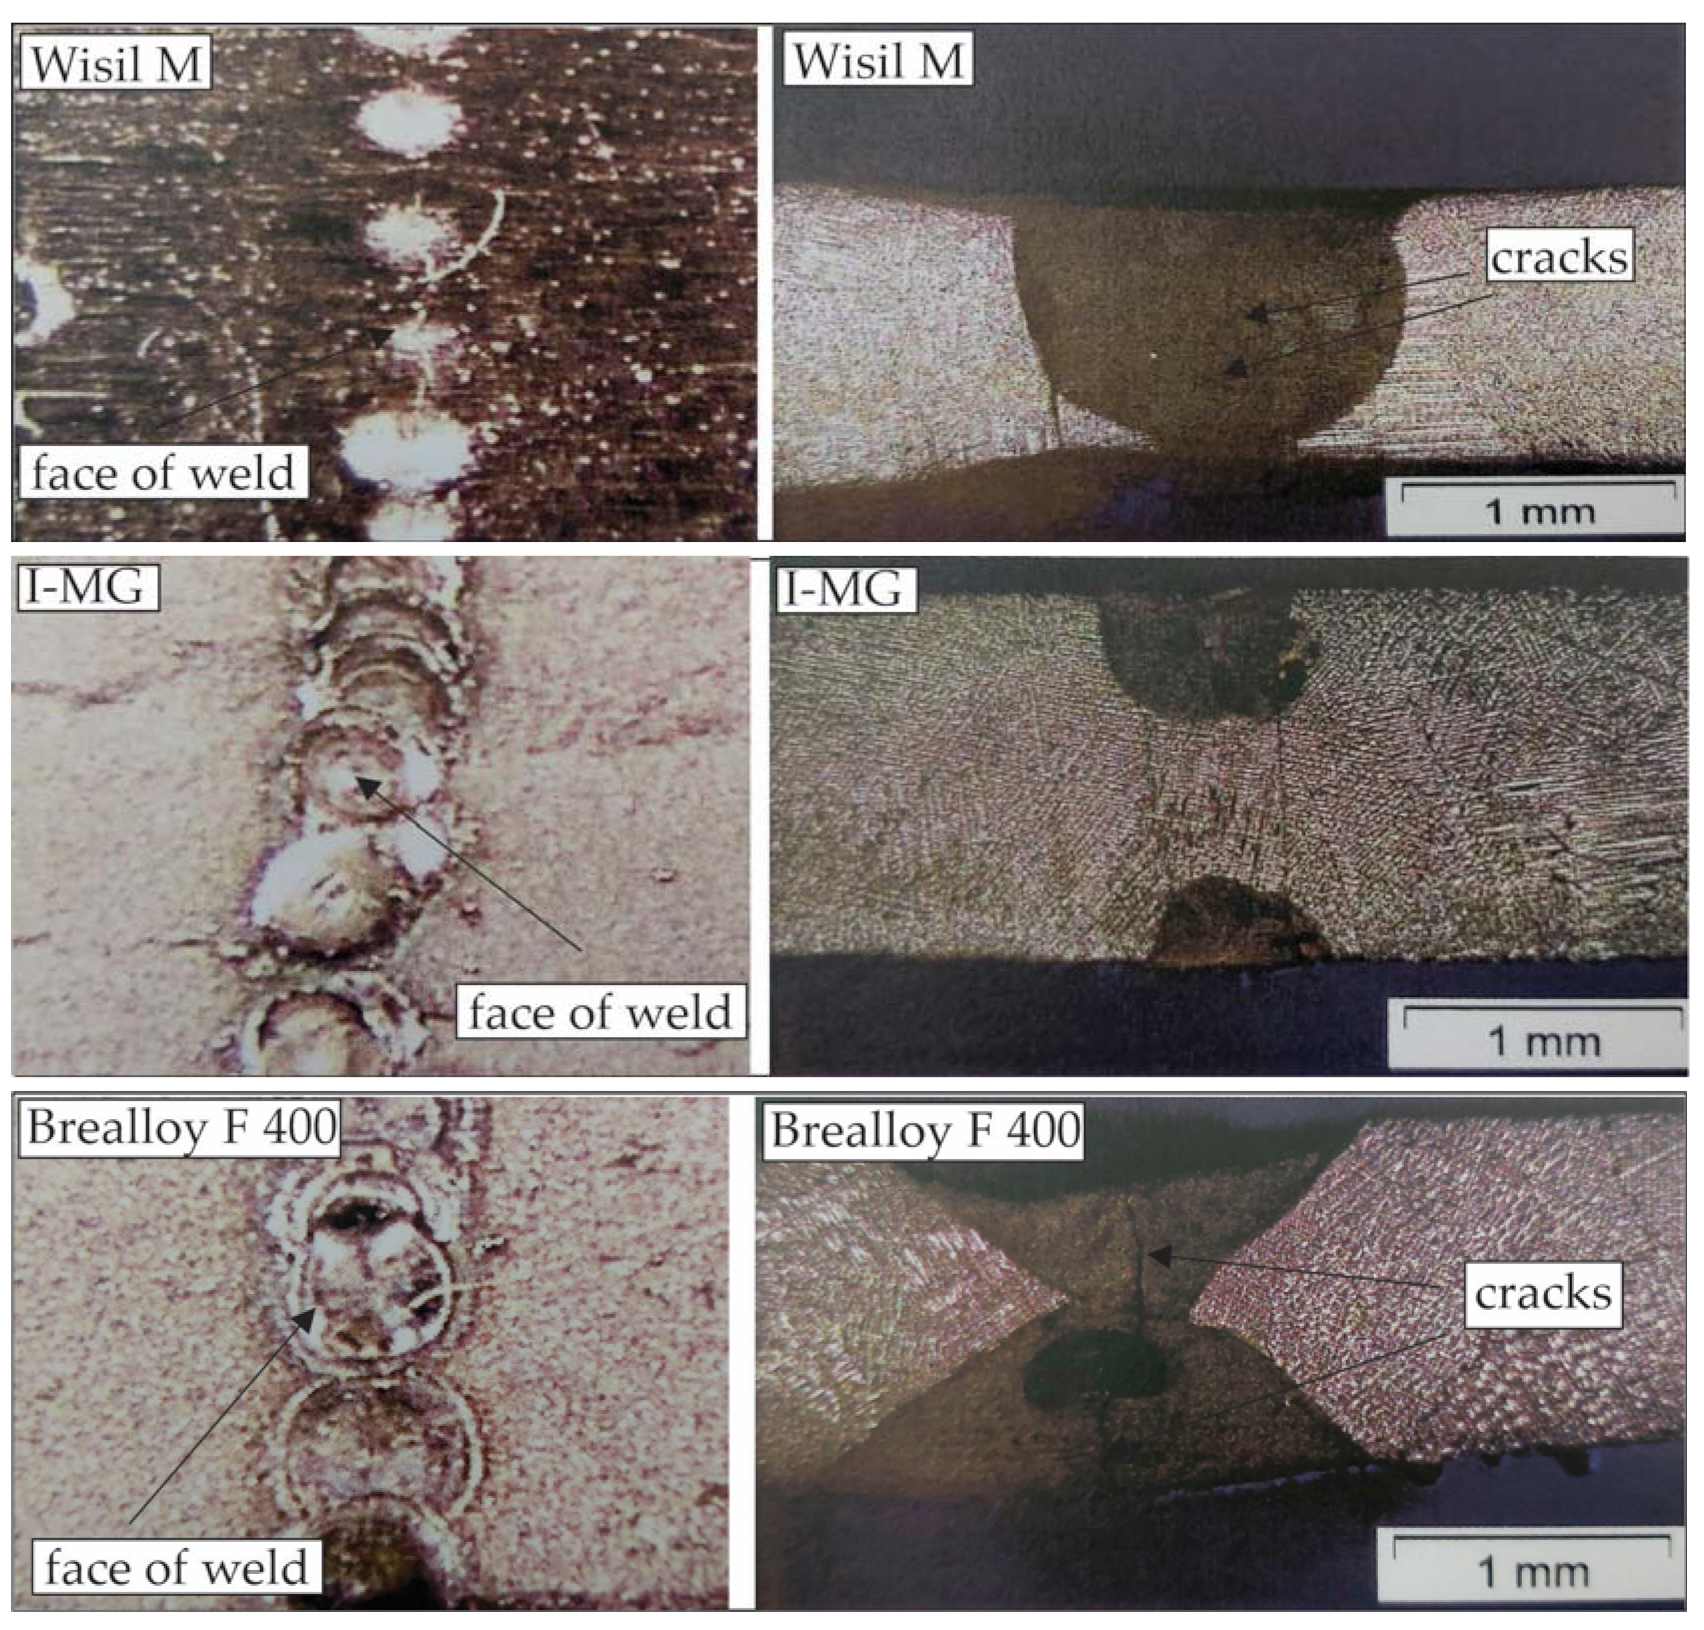
After joining the specimens, the microstructural characteristics of the base material (BM), the heat-affected zone (HAZ) and the weld zone (WZ) were analysed to understand the relationship between the external appearance of the weld surface and the properties obtained. In the detailed analysis of all welded materials, the homogeneity of the weld, the grain size and shape, defects in the weld and defects in the face and root of the weld, porosity, mechanical features and foreign inclusions were investigated. Macroscopic and microscopic images are shown in Figure 1 and Figure 2. The macroscopic images show a top view of the welding line and the microstructure images show a cross-section through the welding line.
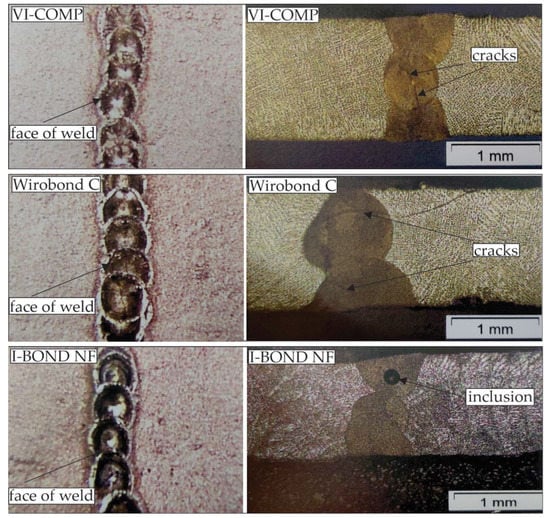
Figure 1.
Macrographs of the face of the welds and micrographs of the welded alloys for metal-ceramic works.
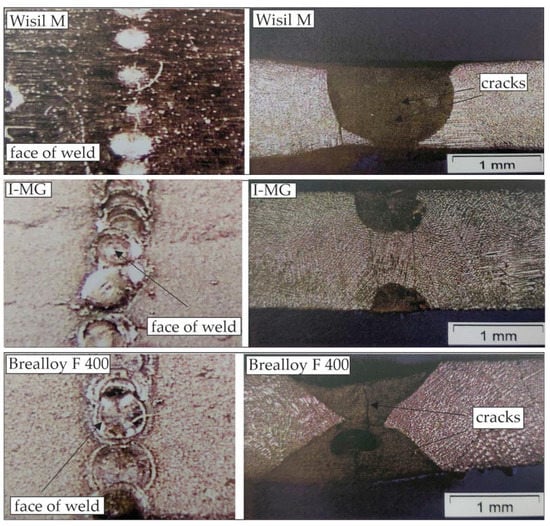
Figure 2.
Macrographs of the face of the welds and micrographs of the welded alloys for denture frameworks.
Figure 1 shows the appearance of the weld and the micrographs of the laser-jointed specimens of the metal-ceramic systems VI-COMP, Wirobond C and I-BOND NF.
The macro analysis of the VI-COMP alloy shows a clean laser joint with sufficient overlap. Microscopic observation shows a longitudinal crack of irregular shape within the central weld spot.
Macroscopically, the laser weld of the Wirobond C alloy is very clean with no visible porosity or cracks. Microscopically, a star-shaped crack can be seen in the center of the weld, spreading radially. On the outer sides of the weld, there are small cracks in separate groups that are not connected to each other.
The I-Bond NF weld looks clean, with prescribed overlaps of each subsequent weld, technologically correct. Microscopically, a foreign inclusion is visible, which is most likely oxide that remained trapped in the material during solidification.
The laser-welded specimens, the appearance of the weld surface and the microscopic images of the alloys for Wisil M, I-MG and Brealloy F 400 for denture frameworks are shown in Figure 2.
The weld of Wisil M macroscopically shows a clean joint, polished after welding and without visible defects during welding. Microanalysis revealed an unwelded root of the weld and small, concentrated star-shaped cracks in the centre of the weld spot.
Specimens I-MG have multiple layers of overlapping spot welds and porosity is present, especially highlighted at the edges of the welds. Microanalysis shows an insufficiently welded joint in the inner part of the joint.
Brealloy F 400 is also a multilayer weld. It shows an irregular appearance of the weld with one wider and one narrower weld in some places. Examination with a light microscope revealed a longitudinal crack in the cross-section of the weld.
3.2. Microhardness Measurements
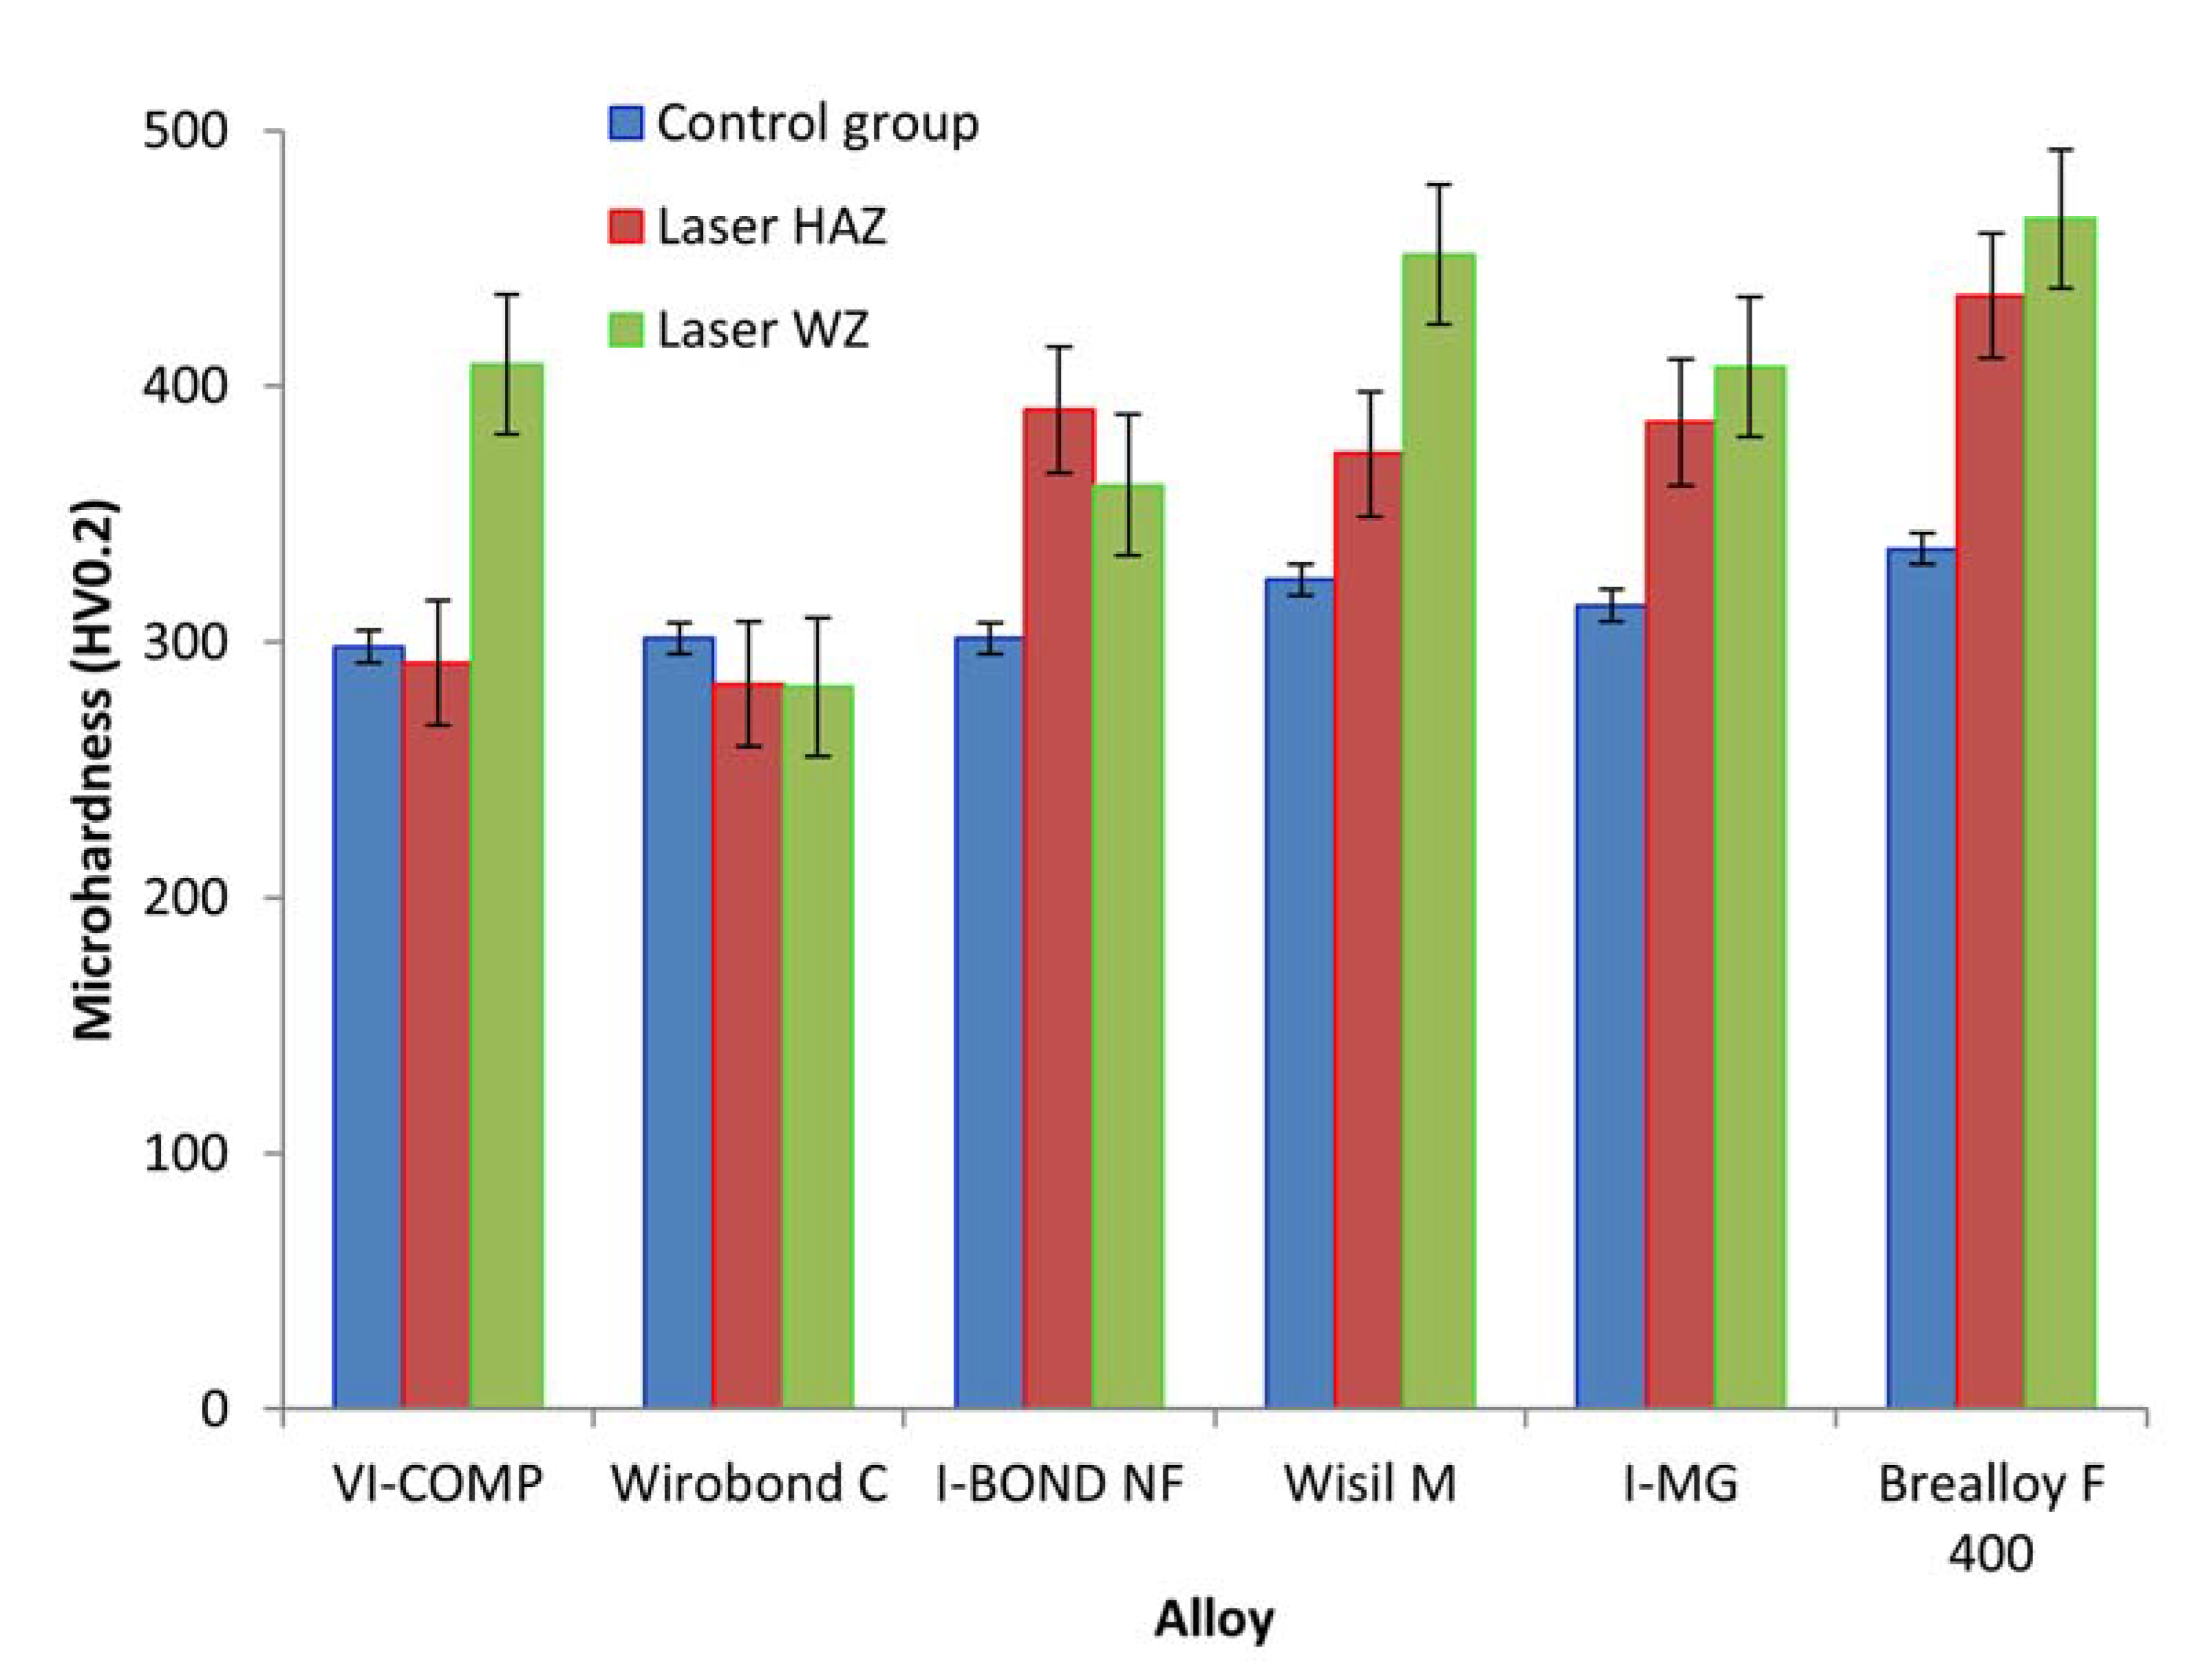
To assess the quality of the joint, the microhardness is measured in the area of the base material (BM), the heat-affected zone (HAZ) and the weld zone (WZ). The microhardness was measured on all specimens using the Vickers method at a load of 1.96 N (HV0.2). Table 3 shows the statistical evaluation of the results obtained.

Table 3.
Microhardness (HV0.2): sample, mean and standard deviation (SD).
Looking at the microhardness values of the cast base material in Figure 3, the alloy Brealloy F 400 proved to be the hardest. All other samples showed no significant differences in the microhardness values of the BM. Regardless of the measurement location (weld metal or heat-affected zone), Brealloy F 400 is indeed the hardest material in this study. The weld zone of the alloys Wisil M, VI-COMP and I-MG are close behind Brealloy F 400. The weld zone of the alloy I-BOND NF follows in fourth place and Wirobond C in last place. Wirobond C also has the lowest HAZ values of all samples, followed by VI-COMP. The HAZ and WZ microhardness values of all other alloys, Wisil M, I-MG and I-BOND NF are close to the hardest welded alloy in this study, Brealloy F 400. The HAZ and WZ microhardness values of these three alloys are also higher than the microhardness value of BM.
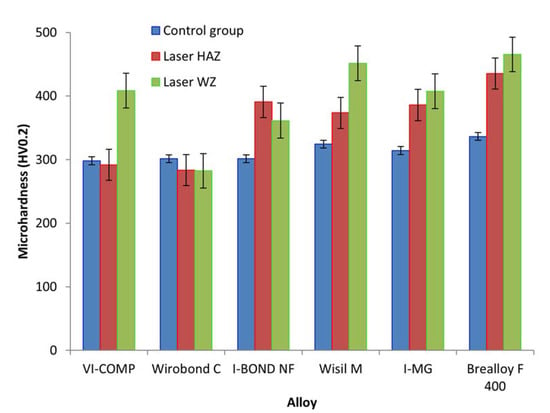
Figure 3.
Microhardness (mean value).
3.3. Flexural Test
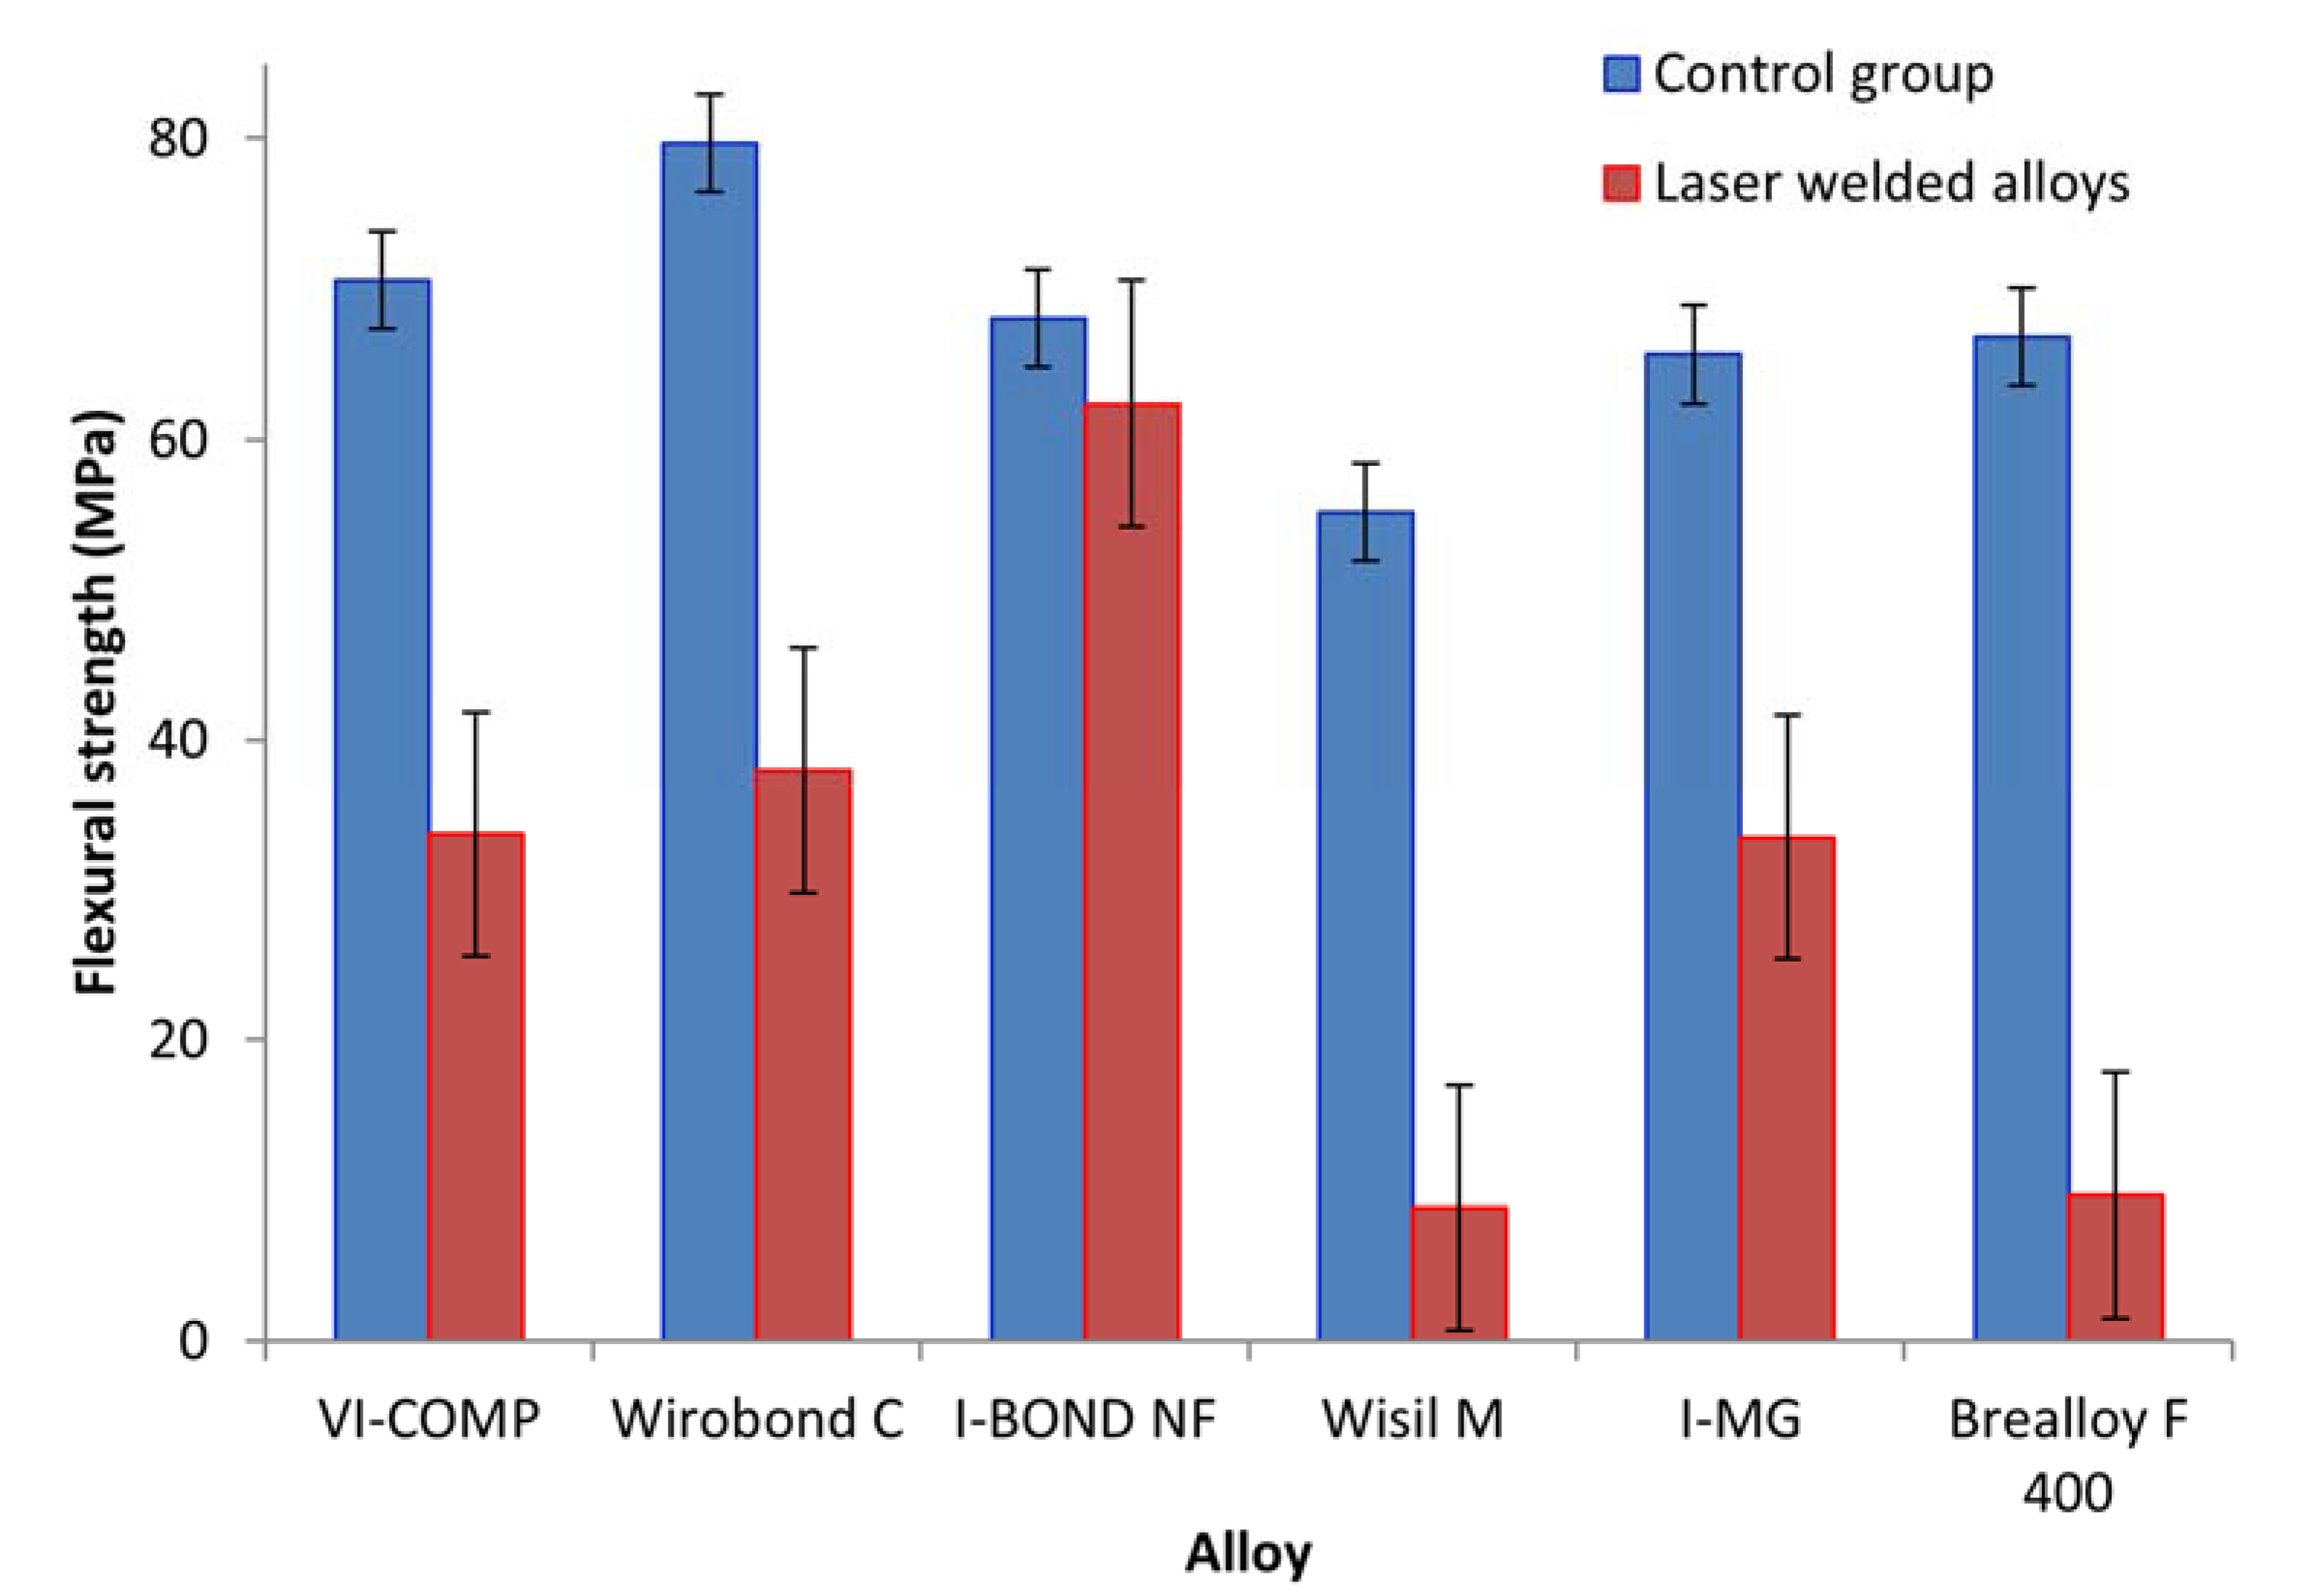
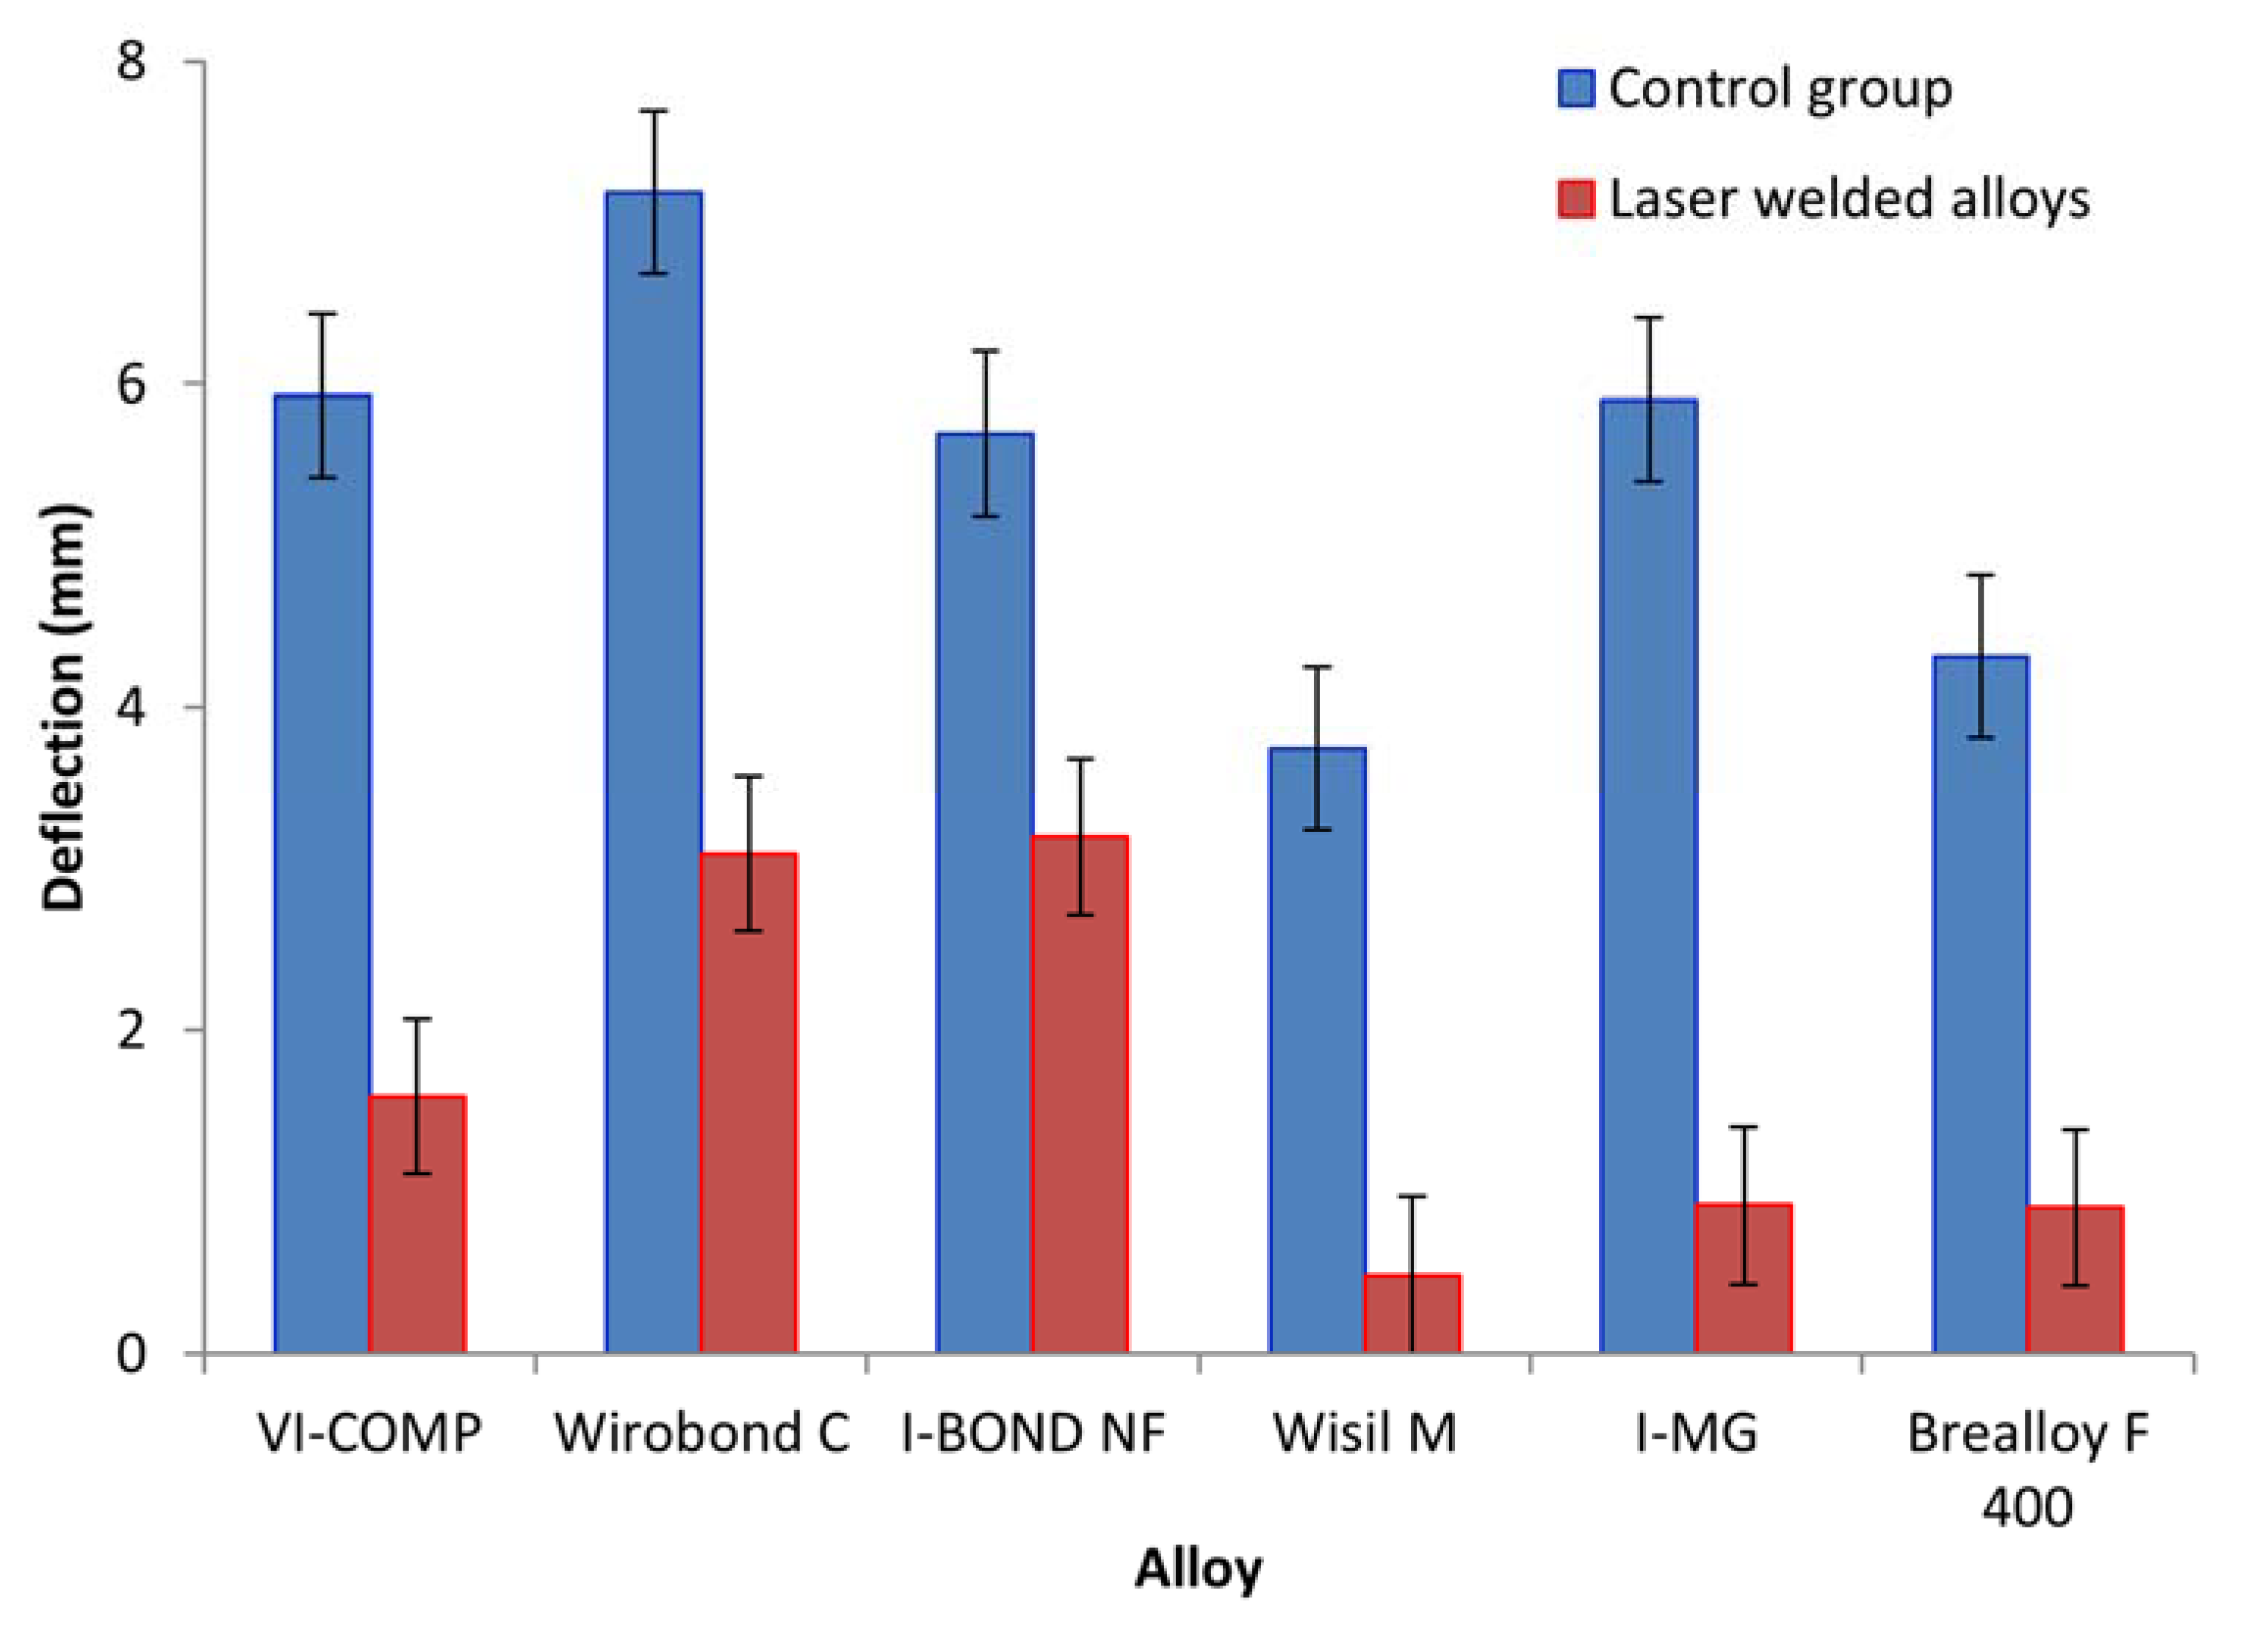
The flexural strength tests gave force and deflection values for this force. The maximum force that the material can withstand is the force that causes a crack in the weld or in the base material. The value of this force was used to calculate the flexural strength of the tested specimens. The results of the statistical analysis of the flexural strength measurements are shown in Table 4 and Figure 4, while Table 5 and Figure 5 show the results for deflection.

Table 4.
Flexural strength (MPa): sample size, mean and standard deviation (SD).
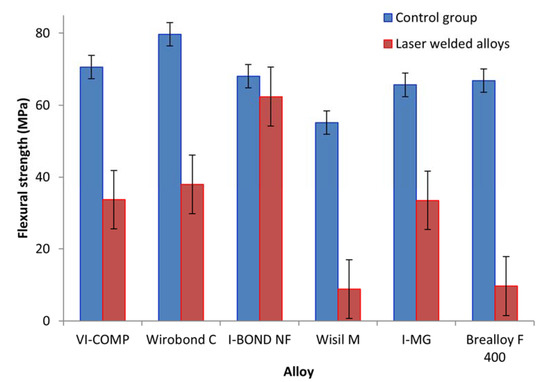
Figure 4.
Flexural strength (mean value).

Table 5.
Deflection (mm): sample size, mean and standard deviation (SD).
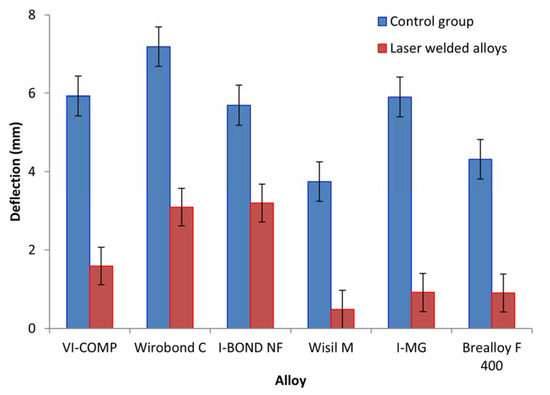
Figure 5.
Deflection (mean value).
In the first step, the influence of the welding type and the alloy on the flexural strength and the deflection was tested with the MANOVA test. Table 6 shows that Wilks’ lambda is significant for both factors (group and alloy) and the interaction of group and alloy (p < 0.05 for Wilks’ lambda).

Table 6.
Results for the MANOVA test.
In the next step, the influence of the alloy and the type of welding on the flexural strength was tested with the ANOVA test. The results are shown in Table 7.

Table 7.
ANOVA table for flexural strength.
Table 7 shows that the group (type of welding) and the type of alloy influence the flexural strength (p < 0.0001; ANOVA test). Similarly, the interaction of alloy and welding type is significant (p < 0.0001; ANOVA test). Due to the significant interaction of alloy and group, a comparison of all 12 groups was made using the Tukey test, comparing only the alloys for each weld type separately and the weld types for each alloy separately (36 comparisons). The result of the comparison is shown in Table 8.

Table 8.
Comparison of flexural strength with respect to alloy and type of welding.
The flexural strength of the control group is significantly higher for all alloys except for I-BOND NF, where no statistically significant difference was found between the control group and the laser-welded alloys.
The comparison between the alloys in the control group showed that the flexural strength of Wisil M (55.2 MPa) is significantly lower than the flexural strength of VI-COMP (70.6 MPa) and Wirobond C (79.7 MPa). There is no statistically significant difference between the other pairs.
For the laser-welded alloys, the flexural strength for I-BOND NF (62.4 MPa) is significantly higher than the flexural strength of all other alloys. There is no difference in flexural strength between VI-COMP, Wirobond C and I-MG, but it is significantly higher for these three alloys than for Wisil M and Brealloy F 400. Finally, no difference in flexural strength was found between Wisil M and Brealloy F 400.
The analysis of the effect of welding type and alloy on deflection showed that the effects of welding type and alloy are significant (p < 0.0001 and p = 0.00012 ANOVA test; Table 9), while the interaction of welding type and alloy is not significant (p = 0.32; ANOVA test).

Table 9.
ANOVA table for deflection.
The influence of the welding type on the deflection is shown in Table 10. In the control group, the deflection is significantly higher than in the laser-welded alloys (5.5 mm on average compared to 1.7 mm).

Table 10.
Comparison of the deflection (mm) depending on the type of weld and the type of alloy.
A comparison of the deflections for the different alloys is shown in Table 10 Although the ANOVA test showed that there was a difference between the alloys, the Tukey test did not show which alloys differed from each other.
3.4. Dynamic Testing
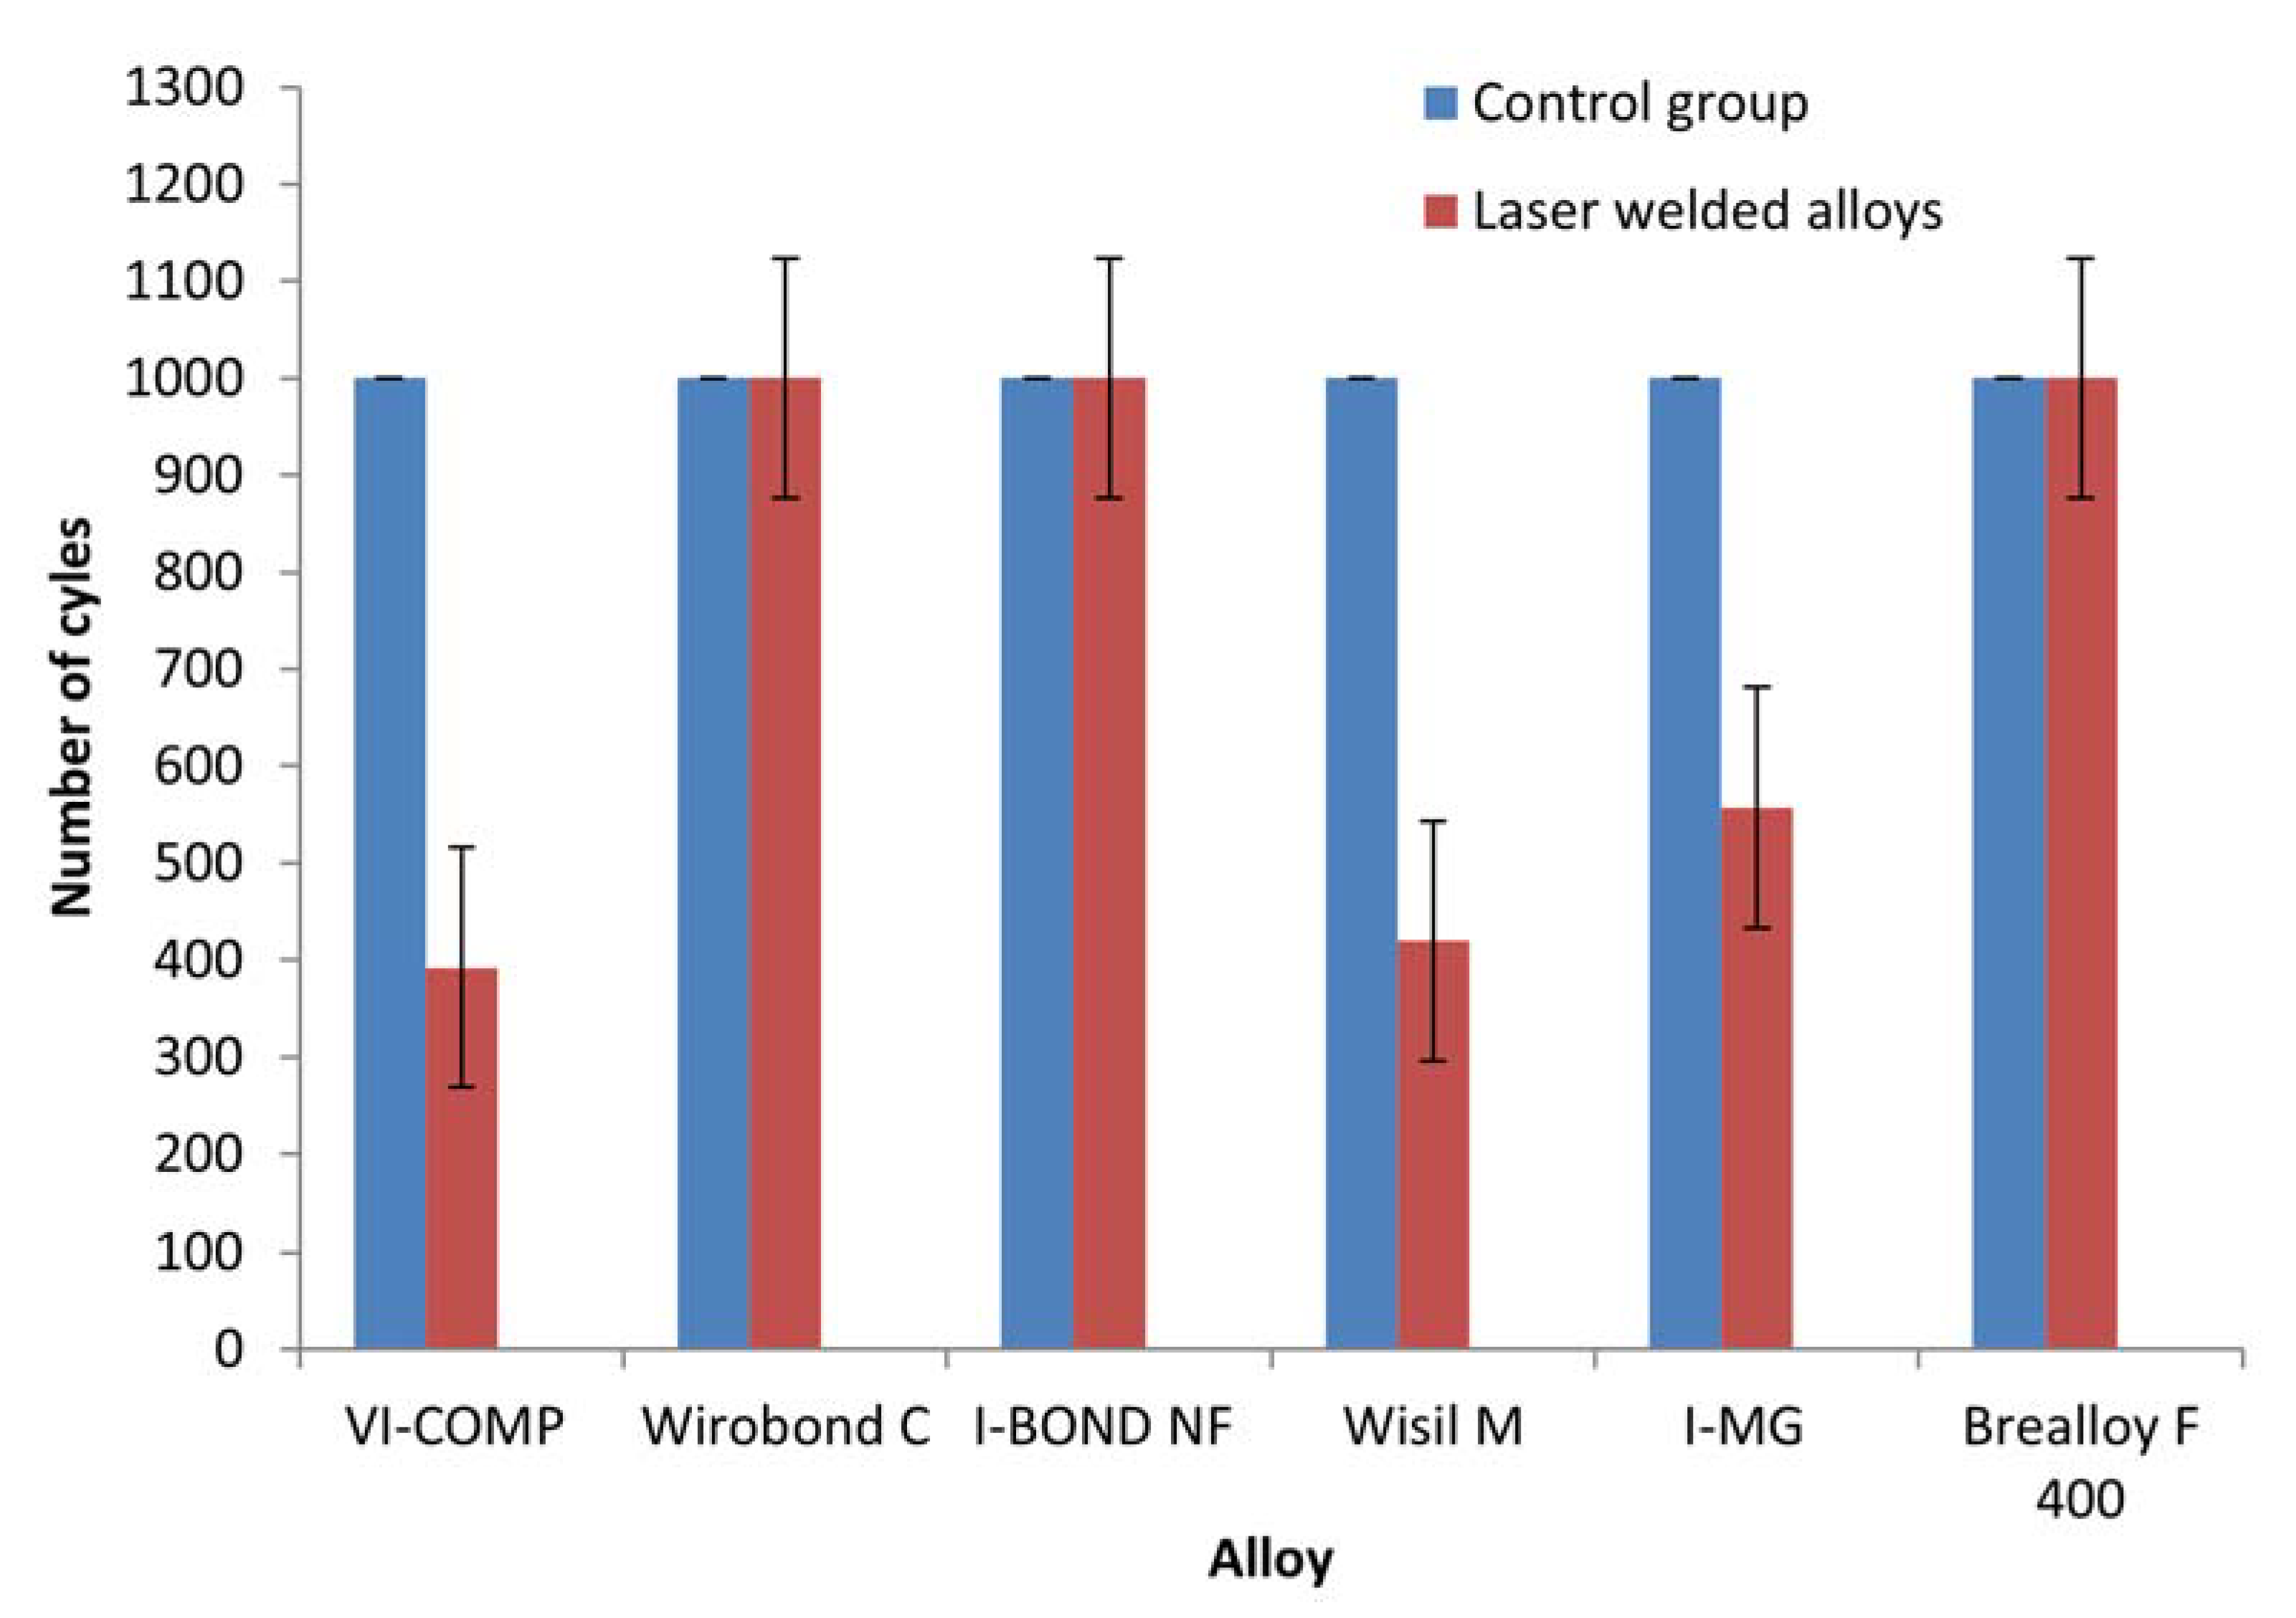
The resistance of the laser-welded specimens was also tested against dynamic loads. The tests were carried out on a dynamic mechanical machine. Table 11 shows the influence of laser welding on the resistance of the welds to dynamic loads. The presented results of the dynamic tests show that the non-welded specimens (control groups of all alloys) withstood a maximum of 1000 cycles, while the laser-welded specimens withstood an average of 728.1 cycles.

Table 11.
Comparison of weld resistance to dynamic loading (number of cycles) depending on the type of weld.
A comparison of the number of cycles the welded and unwelded specimens underwent under dynamic loading is shown graphically in Figure 6. This plot shows that the welded specimens of alloys Wirobond C, I-BOND NF and Brealloy F 400 withstood a maximum of 1000 cycles. The ANOVA test showed that the mean values are not significantly different at the 0.05 level.
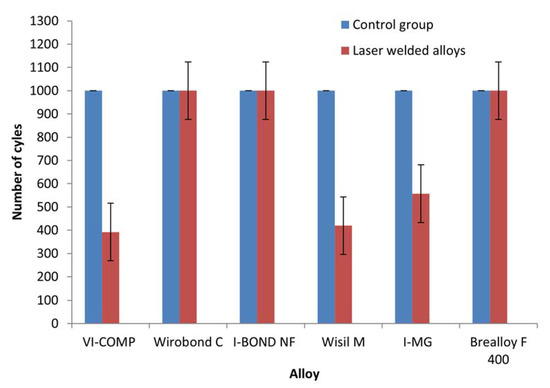
Figure 6.
Number of cycles (weld resistance to dynamic load) depending on the welding type.
4. Discussion
In the world of dentistry, restoration failure and fractures are very common in prosthetic work, especially metal-ceramic works or denture frameworks. Since failure requires replacement, repairing is more favourable. The repair of fractures on alloys depends largely on the skill, dexterity and knowledge of the technician, which affects the final prosthetic work and its durability [30,31,32]. To test the functional durability of the joined prosthetic design, in this work specimens of six Co-Cr alloys were laser welded. During welding, the specimens were held in the technician’s hands, which includes the possibility of human error, hand movements and twitching, resulting in uneven weld spots. Today, a “jig” or “joker” is used to better stabilise the specimens. This produces a much better joint with fewer cracks and optimum overlap [33]. A study by Watanabe et al. [34] points out the importance of fixing with a “jig” to avoid dimensional changes and to achieve high-quality joints. This is important for laser welded joints as high temperatures during welding increases dimensional changes as stresses, i.e., internal stresses, increase.
In this study, approximately equal microhardness values were measured for alloys for metal-ceramic work. Significantly higher values for the microhardness of the welds were obtained with laser welding than with TIG. For VI-COMP and I-BOND NF, the microhardness values of the weld material are significantly higher than those of the base material, while the Wirobond C weld has approximately the same hardness as the base material. Alloys for dental frameworks also have approximately the same microhardness. In laser welding, the hardness of the weld increases significantly and is higher than the microhardness of the base material. The laser generally results in higher microhardness values of the weld than of the base material. For I-BOND NF laser-joined specimens, the highest values of microhardness were measured in the base material, while for TIG-joined alloys, the highest values were measured in the HAZ. For VI-COMP TIG joints the highest values are in the HAZ, for laser joints in the weld [33]. The differences in the microhardness values are the result of the chemical composition of the samples, the structural changes that occur during welding, as well as the different grain sizes and the precipitation.
The dynamic tests gave different results depending on the type of alloy. All samples in the control group withstood all 1000 cycles. When comparing the results of the dynamic tests of alloys for metal-ceramic work, VI-COMP laser welds showed significant differences. One sample survived all cycles, the second broke on the 175th cycle and the third broke on the first cycle, probably as a result of improper or insufficient welding. Samples VI-COMP and I-BOND NF showed excellent results and withstood all 1000 cycles. Of the alloys for dental frameworks, the laser-welded Brealloy F 400 showed the best results, followed by I-MG, and Wisil M performed the worst, as only one sample withstood the entire load. In contrast, the TIG weld of the Wisil M alloy withstood all loads [33].
Rocha et al. [19] came to different results. Their investigations showed higher bending strength values for Co-Cr alloys welded with TIG than for those welded with lasers. This is one of the few authors who obtained better results for TIG. Watanabe et al. [34] have also shown that subsequent heat treatment in the form of precipitation increases the strength of the weld as it also increases the hardness. Bertrand et al. [32] came to similar results as in this study. Microstructurally, the welded material has a higher microhardness compared to the base material, which is consistent with our results. Before welding, the material is sandblasted with Al2O3 particles to prevent reflection of the laser beam and improve penetration during welding. The process was carried out under argon protection to prevent oxidation during joining. The maximum thickness of the welded specimen may be 2 mm, which is the usual thickness of prosthetic work. According to the measurements, the central part of the weld had higher microhardness values than the base material.
When comparing soldering and welding in dental prosthodontics, a greater advantage because the heat input is limited to the specific weld spot, which allows us to work close to the ceramic or acrylic part of the prosthesis. In addition, welding takes less time compared to soldering [33]. Wiskott et al. compared brazed and laser-welded joints of Co-Cr alloys and concluded that the mechanical stability of the laser joint was equivalent to that of the furnace-made solder [35]. Staffanou et al. state that brazing of metal-ceramic alloys is difficult because the alloys have high melting intervals [36], and Kulik et al. agree [37]. Furthermore, they note that the time after brazing is the most critical phase for the quality of the brazing alloy because the working stress increases during crystallisation. Dielert and Kassenbacher conclude in their work that laser welding is superior to soldering [38]. In the research of Ardelean et al., laser-welded CoCr alloys were studied and the results showed that the microhardness of the welded joints is slightly higher than that of the base material or that there is no change in microhardness [16].
Important factors in laser welding are the wavelength, the power of the laser beam and the laser pulse, the output energy, the duration and speed of the pulse, the diameter of the welding spot and the chemical composition of the sample to be welded. For laser welders, the output energy (voltage and current), the spot diameter and the pulse duration (3–18 ms) can be changed. The combination of these factors can influence the results and the penetration depth of the beam into the metal.
Baba et al. [39] investigated the influence of initial energy on the strength of laser-welded joints of Co-Cr alloys. The specimens were of different thicknesses (0.5 and 1 mm) and had a current strength of 270 or 300 A. Thin specimens were welded on one side, thicker ones on both one and both sides. The results showed that the tensile strength of the 0.5 mm thick specimens, regardless of whether they were connected to 270 or 300 A, showed no difference from the control groups. For the 1 mm thick specimens, a higher force was required to break at 270 A than at 300 A, and the strength was lower for all laser-welded 1 mm thick specimens compared to the control specimens. The force required to break the 0.5 mm unilaterally welded specimens was higher than the force required to break the 1 mm thick specimen. The conclusion is that laser welding gives excellent strength to Co-Cr alloy specimens when performed with appropriate parameters and that 1 mm specimens must be welded on both sides.
Also in the study by Baba et al. [40] the influence of the voltage (V) and the diameter of the laser welding spot (mm) on the penetration depth into the casting was investigated. The parameters used are a voltage of 160 to 340 V and a spot weld diameter of 0.4 to 1.6 mm. After welding, the joints were separated and the penetration depth was measured. The results showed that as the voltage increases and the diameter of the spot weld decreases, the penetration depth increases for each material. Therefore, a good selection of welding parameters with the optimum thickness of the specimen is important.
In this study, the thickness of the specimens was 1 mm and a current of 290 A was used. In the bending strength test, higher values were obtained for unwelded joints than for welded ones. According to the manufacturer’s instructions, the diameter of the laser pulse was 0.7 mm.
In his investigations, Mosch [33] proved the connection between the duration of the welding impulse and the formation of cracks when welding Co-Cr alloys. If the pulse lasts only a short time, e.g., 3 ms, there is a higher probability of microcracks, because the alloy cools much faster around the welding spot than in the rest of the material. During cooling, strong contractions occur, causing cracks to form. If welding continues, cracks appear in the welded material. Our results prove that the welding time is not the only factor in the occurrence of cracks, because in the study laser welding lasted 11 ms, which is longer than the initial 3 ms in Mosche’s test. These results are evidence of the influence of other parameters. Matsuda [41] proved that the occurrence of a crack depends on whether or not stresses are present in the base material, and that the crack is longer when internal stresses are present. In general, the mechanism of crack and fracture formation is extremely complex and depends on various physicochemical properties of the alloy, different loading directions and magnitudes, thermal changes and humidity conditions in the oral cavity, and the patient’s health condition. Generally, cracks can occur during manufacture (casting) or when the residual stresses caused by the reduction in volume during the transition from the liquid to the solid state are greater than the strength of the material [16,42]. Despite the intended rapid cooling, hot cracks form due to the rapid and localised heat development. This causes the material to shrink, and tensile stresses and cracks appear in the melt zone during cooling. Hot cracks affect the durability of the joint and occur as a localised area within the weld zone or between the HAZ and the weld zone. The heat-affected zone is very sensitive to heat fluctuations after welding, such as sudden cooling of the material, which can lead to cracks forming. Incomplete welding or poor damping of parts joined at low temperatures will lead to cold cracks. However, the formation of cracks can be prevented, e.g., by adding fillers or prior heat treatment [26,43].
The mechanical properties of laser-welded joints depend on the welding techniques (single-layer/multi-layer, single-sided/multi-layer). It is also important to monitor the weld at macroscopic and microscopic levels [39]. Longitudinal cracks can usually be seen on the specimens, which are caused by the bending of the parts during joining, while radial cracks are due to internal stresses. When testing the flexural strength, a greater force was applied to the VI-COMP, Wirobond C and I-BOND NF specimens for the same deflection. The forces for the laser welded I-MG and Brealloy F 400 were lower compared to TIG welded specimens in [44]. The highest stress was calculated for the I-BOND NF laser joint because the directional joining and the overlap of the weld spots were optimally executed. The widest range of deflection and stress values was calculated for Wirobond C.
Research by NaBadalung and Nicholls [45] has shown that laser welding of Co-Cr alloys is much stronger than TIG welding but weaker than the control group. Topham et al. [46] have confirmed with their results that a double-sided welded joint is stronger, regardless of how many spot welds are present. They measured a 50% lower strength of laser-welded Co-Cr samples compared to uncut specimens, regardless of whether they were welded on one or both sides. It was concluded that the percentage of elongation is proportional to the force applied to the specimen. In this study, due to the dynamic load, some joints broke. At the same time, it was demonstrated that these specimens were not sufficiently welded, which is certainly one of the factors for the lower load-bearing capacity of the broken specimens. The average depth of the weld spots was 0.3 mm.
Research by Watanabe et al. [47] concludes that a lower force value is required for cracking and elongation of laser welded specimens in joints welded under argon protection. It was also found that argon is required for laser welding of titanium but not Co-Cr alloys. Argon is a gas that forms a protective atmosphere around the weld and protects it from unwanted reactions with oxygen, nitrogen and other gases released during welding. Without argon, discolouration of the metal and increased brittleness of the structure would occur. Baba et al. [48] proved the opposite in their study. In their case, it was shown that laser welding under argon protection does not affect the bending strength and fracture strength when joining Co-Cr alloys. In our investigations, all samples were welded under argon shielding gas. The argon pressure during laser welding was 2–3 bar.
In our work, the mechanical properties of the laser specimens tested with continuous dynamic loading were more favourable than those of the TIG specimens. When flexural strength was tested, the welded specimens for metal-ceramics showed greater deflection than the specimens for denture frameworks, indicating their higher strength. In general, deflections are lower for laser-welded alloys than for TIG-welded specimens. NaBadalung and Nicholls show excellent results in laser welding Co-Cr alloys with small defects compared to the base material [45]. The advantages of LBW are controllability, reliable and high-quality welding and minimal welding distortions. Geng et al. found that the advantages of laser welding are controllability, reliable and high-quality welding and the lowest welding distortions [49]. Zupančić [50] proved that laser weld of a Co-Cr alloy is corrosion resistant, but the weld strength is weaker due to the low weld penetrations.
5. Conclusions
Based on the results of this study, the following conclusions can be drawn about the six tested Co-Cr dental alloys that were manually laser welded:
- The technician plays an important role in joining the specimens and the whole process depends on his expertise and skills, which affects the results obtained. This is evidenced by the microscopic analysis of the welds, which shows imperfections such as cracks or insufficient overlap,
- Due to differences in the shape, dimensions and appearance of the welds, different values were measured for the mechanical properties of the joints, which consequently affects the quality of the prosthetic work itself,
- The microhardness of the laser-welded alloys is in the range of 282–465 MPa in the weld zone and between 283 and 435 MPa in the heat-affected zone. Only the laser-welded Wirobond C had lower microhardness values than the control group,
- The flexural strength of the laser-welded alloy ranged from 8.8 to 62.4 MPa, which is lower than the control groups (55.2–79.7 MPa)
- Laser-welded alloys showed lower deflection values (0.9–3.2 mm) compared to the control groups (3.7–7.2 mm),
- The laser-welded alloys withstood an average of 728 cycles, while the samples in all control groups withstood a maximum of 1000 cycles. However, the results of the dynamic load tests do not differ significantly.
In the analysis of the whole study, the laser method for joining the specimens and consequently their properties show the importance of fixing the specimens during the joining process and ensuring parameters that allow for a good weld to avoid irregularities during the welding process itself, which would negatively affect the quality of the dental work. All the alloys studied showed good mechanical properties without significant differences, indicating that laser welding could be used for their joining.
Author Contributions
Conceptualisation, A.C. and L.S.B.; methodology, A.C. and L.S.B.; software, D.B.; validation, A.C., L.S.B. and D.B.; formal analysis, A.C. and M.Š.; investigation, A.C. and L.S.B.; resources, A.C.; writing—original draft preparation, L.S.B. and M.Š.; writing—review and editing, A.C. and L.S.B.; visualisation, L.S.B.; supervision, A.C.; project administration, A.C.; funding acquisition, A.C., L.S.B., D.B. and M.Š. All authors have read and agreed to the published version of the manuscript.
Funding
This research was funded by University of Zagreb by the Aesthetic analysis of intraoral and extraoral photographs in adolescents project from the Republic of Croatia (0106) and Investigation of innovative metallic micro-/nanomaterials (FPI-124-LJSB).
Institutional Review Board Statement
Not applicable.
Informed Consent Statement
Not applicable.
Data Availability Statement
Not applicable.
Conflicts of Interest
The authors declare no conflict of interest.
References
- Bandyopadhyay, A.; Mitra, I.; Goodman, S.B.; Kumar, M.; Bose, S. Improving biocompatibility for next generation of metallic implants. Prog. Mater. Sci. 2023, 133, 101053. [Google Scholar] [CrossRef] [PubMed]
- Slokar, L.J.; Pranjić, J.; Carek, A. Metallic Materials for Use in Dentistry. Holist. Approach Environ. 2017, 7, 39–58. [Google Scholar]
- Grosgogeat, B.; Vaicelyte, A.; Gauthier, R.; Janssen, C.; Le Borgne, M. Toxicological Risks of the Cobalt–Chromium Alloys in Dentistry: A Systematic Review. Materials 2022, 17, 5801. [Google Scholar] [CrossRef] [PubMed]
- Ghadhban, A.H.; Hasan, I.H. Transverse Strength and Microstructure of Cobalt-Chromium Alloy Produced by Selective Laser Melting and Casting Techniques (An in vitro Study). J. Res. Med. Dent. Sci. 2023, 11, 176–182. [Google Scholar]
- Nowak, J.; Steinberg, K.; Sokołowski, J.; Bociong, K. nfluence of various class cleaning agents for prosthesis on Co-Cr alloy surface. Open Chem. 2022, 20, 958–969. [Google Scholar] [CrossRef]
- Herranz, G.; Berges, C.; Naranjo, J.A.; García, C.; Garrido, I. Mechanical performance, corrosion and tribological evaluation of a Co–Cr–Mo alloy processed by MIM for biomedical applications. J. Mech. Behav. Biomed. Mater. 2019, 105, 103706. [Google Scholar] [CrossRef]
- Jamal Al Deen, H.H.J. Using of CoCr alloys in biomedical applications (review). Iraqi J. Mech. Mater. Eng. 2021, 21, 320–328. [Google Scholar] [CrossRef]
- Powers, J.M.; Wataha, J.C. Dental Materials Foundations and Applications, 11th ed; Elsevier: St. Louis, MO, USA, 2017. [Google Scholar] [CrossRef]
- Konieczny, B.; Szczesio-Wlodarczyk, A.; Sokolowski, J.; Bociong, K. Challenges of Co–Cr Alloy Additive Manufacturing Methods in Dentistry—The Current State of Knowledge (Systematic Review). Materials 2020, 13, 3524. [Google Scholar] [CrossRef]
- Wulfes, H. Precision Milling and Partial Denture Constructions-Modern Design and Efficient Production; BEGO Bremer Goldschlaegerei Wilhelm Herbst GmbH & Co. KG: Bremen, Germany, 2012. [Google Scholar]
- Shetty, S.H.; Sushma, R.; Sanyal, P. Effects of Electric Arc Welding and Laser Welding Under Argon Gas Shield on the Tensile Strength of Ni-Cr Alloys: An In vitro Study. J. Datta Meghe Inst. Med. Sci. Univ. 2022, 16, 637–641. [Google Scholar] [CrossRef]
- Duhan, T.; Malhotra, P.; Yadav, A.; Bhargava, B.; Sangwan, R. Evaluation of Marginal Fit and Flexural Strength of Screw-retained Casted One-piece Metal Framework Postsectioning and Welding: An In Vitro Study. World J. Dent. 2023, 14, 9–15. [Google Scholar] [CrossRef]
- Fornaini, C.; Vescovi, P.; Merigo, E.; Rocca, J.-P.; Mahler, P.; Bertrand, C.; Nammour, S. Intraoral metal laser welding: A case report. Lasers Med. Sci. 2010, 25, 303–307. [Google Scholar] [CrossRef] [PubMed]
- Shenoy, A.A.; Ahmed, N.; Rajaraman, V.; Maiti, S.; Ganapathy, D.M. Comparative analysis of weld strength of nickel-chromium and cobalt-chromium base metal alloys when submitted to tungsten inert gas welding. J. Adv. Pharm. Technol. Res. 2022, 13, 442–446. [Google Scholar]
- Perveen, A.; Molardi, C.; Fornaini, C. Applications of laser welding in dentistry: A state-of-the-art review. Micromachines 2018, 9, 209. [Google Scholar] [CrossRef] [PubMed]
- Ardelean, L.C.; Reclaru, L.; Bortun, C.M.; Ghiban, B. Laser Welding of Different Dental Alloys. In Superalloys for Industry Applications; Cevik, S., Ed.; InTech: London, UK, 2018. [Google Scholar] [CrossRef]
- Jain, S.; Vibhute, P.K.; Patil, C.; Umale, V.; Kulshrestha, R.; Chandurkar, K. Laser Welding in Orthodontics: A Review Study. J. Dent. Health Oral Res. 2020, 1, 1–14. [Google Scholar] [CrossRef]
- Carek, A.; Zivko Babic, J.; Schauperl, Z.; Badel, T. Mechanical Properties of Co-Cr Alloys for Metal Base Framework. Int. J. Prosthodont. Restor. Dent. 2011, 1, 13–19. [Google Scholar] [CrossRef]
- Rocha, R.; Pinheiro, A.L.B.; Villaverde, A.B. Flexural strength of pure Ti, Ni-Cr and Co-Cr alloys submitted to Nd:YAG laser or TIG welding. Braz. Dent. J. 2006, 17, 20–23. [Google Scholar] [CrossRef]
- Carek, A.; Zivko Babic, J.; Schauperl, Z.; Jakovac, M. Corrosion stability of Co-Cr Welded Alloy. J. Dent. Res. 2011, 90, 3309. [Google Scholar]
- Dolgov, N.A.; Dikova, T.; Dzhendov, D.; Pavlova, D.; Simov, M. Mechanical properties of dental Co-Cr alloys fabricated via casting and selective laser melting. In Proceedings of the II International Scientific-Technical Conference “Innovations in Engineering” 2016, Varna, Bulgaria, 20–23 June 2016. [Google Scholar]
- Carek, A.; Schauperl, Z.; Jakovac, M. Macroscopic Analysis of Co-Cr Base Alloys Joints. Acta Stomatol. Croat. 2007, 41, 216–224. [Google Scholar]
- Zupančič, R.; Legat, A.; Funduk, N. Electrochemical and mechanical properties of cobalt-chromium dental alloy joints. Mater. Tehnol. 2007, 41, 295–300. [Google Scholar]
- da Silveira-Júnior, C.D.; de Castro, M.G.; Davi, L.R.; das Neves, F.D. Welding Techniques in Dentistry. In Welding Processes; Kovacevic, R., Ed.; IntechOpen: London, UK, 2012. [Google Scholar] [CrossRef]
- de Castro, G.C.; de Araújo, C.A.; Mesquita, M.F.; Consani, R.L.X.; Nóbilo, M.A.D.A. Stress distribution in Co-Cr implant frameworks after laser or TIG welding. Braz. Dent. J. 2013, 24, 147–151. [Google Scholar] [CrossRef]
- Varghese, S.; Bhat, V.; Joseph, S. Laser Welding of Dental Alloys: A Systematic Overview. Libyan Dent. J. 2014, 4, 1–7. [Google Scholar] [CrossRef]
- ISO 16744:2003; Dentistry—Base Metal Materials for Fixed Dental Restorations. International Organization for Standardization: Geneva, Switzerland, 2003; p. 24.
- ISO 5173:2009; Destructive Tests on Welds in Metallic Materials—Bend Tests. International Organization for Standardization: Geneva, Switzerland, 2009; p. 18.
- Available online: https://web.wpi.edu/Pubs/E-project/Available/E-project-042612-121524/unrestricted/Mastication_Fixture_Final.pdf (accessed on 14 July 2023).
- Ispas, A.; Iosif, L.; Popa, D.; Negucioiu, M.; Constantiniuc, M.; Bacali, C.; Buduru, S. Comparative Assessment of the Functional Parameters for Metal-Ceramic and All-Ceramic Teeth Restorations in Prosthetic Dentistry—A Literature Review. Biology 2022, 11, 556. [Google Scholar] [CrossRef] [PubMed]
- Sklavou, E.; Poulis, N.; Prombonas, A.; Karampotsos, A.H. The Effect of Argon Inert Gas on the Laser Welding Quality of Co-Cr and Ni-Cr Base Metal Alloys. J. Biomed. Sci. Eng. 2021, 14, 442–451. [Google Scholar] [CrossRef]
- Bertrand, C.; Le Petitcorps, Y.; Albingre, L.; Dupuis, V. The laser welding technique applied to the non precious dental alloys procedure and results. Br. Dent. J. 2001, 190, 255–257. [Google Scholar] [CrossRef] [PubMed]
- Mosch, J.; Hoffmann, A.; Hopp, M. Lightning in a Bottle. Dent. Dialogue 2004, 4, 37–51. [Google Scholar] [CrossRef]
- Watanabe, I.; Chang, J.; Chiu, Y. Dimensional change of laser-welded gold alloy induced by heat treatment. J. Prosthodont. 2007, 16, 365–369. [Google Scholar] [CrossRef]
- Wiskott, H.W.A.; Macheret, F.; Bussy, F.; Belser, U.C. Mechanical and elemental characterization of solder joints and welds using a gold-palladium alloy. J. Prosthet. Dent. 1997, 77, 607–616. [Google Scholar] [CrossRef]
- Staffanou, R.S.; Radke, R.A.; Jendresen, M.D. Strength properties of soldered joints from various ceramic-metal combinations. J. Prosthet. Dent. 1980, 43, 31–39. [Google Scholar] [CrossRef]
- Kulik, V.I.; Nilov, A.S.; Bogachev, E.A.; Larionov, N.V. Soldering Methods for Preparing Permanent Joints of Ceramic Composite Materials with Metals (Review Article). Refract. Ind. Ceram. 2021, 62, 216–225. [Google Scholar] [CrossRef]
- Dielert, E.; Kassenbacher, A. Soldering, microplasma and laser welding of dental alloys. Dtsch. Zahnärztl. Z. 1987, 42, 647–653. [Google Scholar]
- Baba, N.; Watanabe, I.; Liu, J.; Atsuta, M. Mechanical Strength of Laser-Welded Cobalt-Chromium Alloy. J. Biomed. Mater. Res. Part B Appl. Biomater. 2004, 69, 121–124. [Google Scholar] [CrossRef]
- Baba, N.; Watanabe, I. Penetration depth into dental casting alloys by Nd:YAG laser. J. Biomed. Mater. Res. B Appl. Biomater. 2005, 72, 64–68. [Google Scholar] [CrossRef] [PubMed]
- Matsuda, F.; Ueyama, T. Solidification crack susceptibility of laser weld metal in 0.2C-Ni-Cr-Mo steels: Effects of bead configuration and s and p contents. Weld. Int. 1993, 7, 686–692. [Google Scholar] [CrossRef]
- Padrós, R.; Punset, M.; Molmeneu, M.; Velasco, A.B.; Herrero-Climent, M.; Rupérez, E.; Gil, F.J. Mechanical Properties of CoCr Dental-Prosthesis Restorations Made by Three Manufacturing Processes. Influence of the Microstructure and Topography. Metals 2020, 10, 788. [Google Scholar] [CrossRef]
- Bertrand, C.; Poulon-Quintin, A. Proposals for optimization of laser welding in prosthetic dentistry. J. Prosthodont. 2010, 19, 69–76. [Google Scholar] [CrossRef] [PubMed]
- Carek, A.; Slokar Benić, L.; Bubalo, V.; Kosović, N. Microscopic and Mechanical Characterization of Co-Cr Dental Alloys Joined by the TIG Welding Process. Materials 2023, 16, 3890. [Google Scholar] [CrossRef]
- NaBadalung, D.P.; Nicholls, J.I. Laser welding of a cobalt-chromium removable partial denture alloy. J. Prosthet. Dent. 1998, 79, 285–290. [Google Scholar] [CrossRef]
- Topham, T.; Scott, D.; Watanabe, I.; Baba, N.; Okabe, T. Mechanical Properties of Laser-welded Dental Casting Alloys. In Proceedings of the 2003 AADR/CADR Annual Meeting, San Antonio, TX, USA, 13 March 2003. [Google Scholar]
- Watanabe, I.; Topham, D.S. Laser welding of cast titanium and dental alloys using argon shielding. J. Prosthodont. 2006, 15, 102–107. [Google Scholar] [CrossRef]
- Baba, N.; Watanabe, I.; Tanaka, Y.; Hisatsune, K.; Atsuta, M. Joint Properties of Cast Fe-Pt Magnetic AlloycLaser-welded to Co-Cr Alloy. Dent. Mater. J. 2005, 24, 550–554. [Google Scholar] [CrossRef]
- Geng, Y.; Akbari, M.; Karimipour, A.; Karimi, A.; Soleimani, A.; Afrand, M. Effects of the laser parameters on the mechanical properties and microstructure of weld joint in dissimilar pulsed laser welding of AISI 304 and AISI 420. Infrared Phys. Technol. 2019, 103, 103081. [Google Scholar] [CrossRef]
- Zupancic, R.; Legat, A.; Funduk, N. Tensile strength and corrosion resistance of brazed and laser-welded cobalt-chromium alloy joints. J. Prosthet. Dent. 2006, 96, 273–282. [Google Scholar] [CrossRef] [PubMed]
Disclaimer/Publisher’s Note: The statements, opinions and data contained in all publications are solely those of the individual author(s) and contributor(s) and not of MDPI and/or the editor(s). MDPI and/or the editor(s) disclaim responsibility for any injury to people or property resulting from any ideas, methods, instructions or products referred to in the content. |
© 2023 by the authors. Licensee MDPI, Basel, Switzerland. This article is an open access article distributed under the terms and conditions of the Creative Commons Attribution (CC BY) license (https://creativecommons.org/licenses/by/4.0/).

